Downloaded 1,448 times

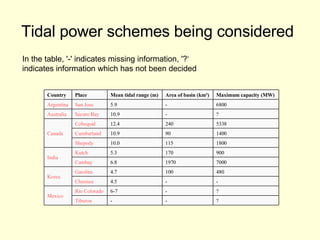
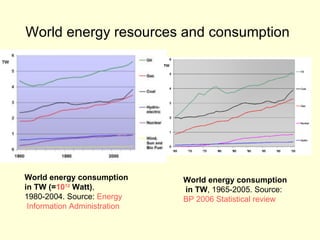
![Tidal power schemes being considered ? ? ? Mozambique Channel South Africa 87000 - 6.0 Penzhinskaya Bay 8000 - - Tugur 19200 2300 9.1 Mezen Russia [7] 6501 - 7.5 Turnagain Arm 2900 - 7.5 Knik Arm ? - 5.5 Passamaquoddy Bay United States 33 5.5 5.2 Conwy - - - Strangford Lough 700 61 6.5 Mersey 8640 450 7.8 Severn United Kingdom Maximum capacity (MW) Area of basin (km²) Mean tidal range (m) Place Country](https://image.slidesharecdn.com/tides-waves-2188/85/Tides-Waves-24-320.jpg)
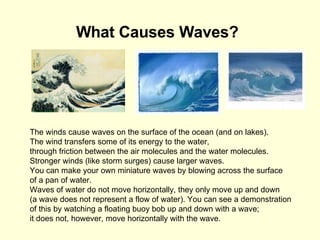
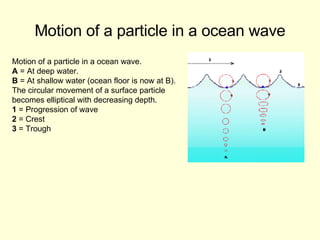
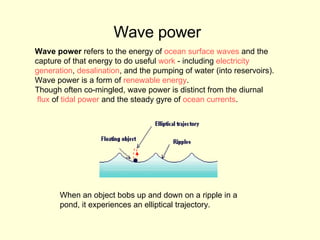


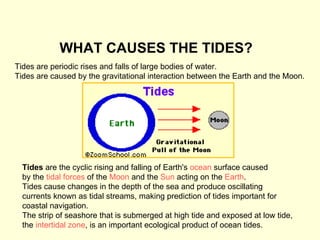
The document discusses what causes tides and waves. Tides are caused by the gravitational interaction between the Earth, Moon, and Sun, while waves are caused by wind transferring energy to water. Tides and waves can be harnessed to generate renewable tidal power through tidal barrages and tidal stream turbines. However, tides and waves can also cause harmful environmental and ecological impacts if not properly managed.