SlideShare a Scribd company logo
ThompsonEtal2013.pdf
Accurate localization of incidental findings on the computed
tomography attenuation correction image: the influence
of tube current variation
John Thompsona,c, Peter Hogga, Samantha Highamb and David
Manninga,d
This observer performance study assessed lesion
detection in the computed tomography attenuation
correction image, as would be produced for myocardial
perfusion imaging over a tube current (mA) range. A static
anthropomorphic chest phantom containing simulated
pulmonary lesions was scanned using the four available
mA values (1, 1.5, 2 and 2.5) on a GE Infinia Hawkeye 4.
All other computed tomography acquisition parameters
remained constant throughout. Twenty-seven cases
showing zero to four lesions were produced for a
free-response receiver-operating characteristic method.
Image observations were completed using our novel
web-based ROCView software under controlled conditions.
The Jackknife alternative free-response receiver-operating
characteristic (JAFROC) figure of merit was used for
significance testing, wherein a difference in lesion
detection performance was considered significant
at P values less than 0.05. Twenty readers with varying
computed tomography experience (0–24 years) evaluated
108 images using an ordinal scale to score confidence.
The JAFROC analysis showed that there was no
statistically significant difference in performance between
mA values (P = 0.439) for this sample of observers.
In conclusion, no significant difference in lesion detection
performance was seen between the mA values. This
suggests that there is no value in using anything other
than the lowest mA value for the investigation of incidental
extracardiac findings. Nucl Med Commun 34:180–184 �c
2013 Wolters Kluwer Health | Lippincott Williams & Wilkins.
Nuclear Medicine Communications 2013, 34:180–184
Keywords: computed tomography acquisition parameters,
dose optimization, free-response receiver-operating
characteristic,
tube current
aUniversity of Salford, bPennine Acute Hospitals NHS Trust,
Greater
Manchester, cUniversity Hospitals of Morecambe Bay NHS
Foundation Trust,
Barrow-in-Furness and dLancaster University, Lancaster, UK
Correspondence to John Thompson, BSc (Hons), MSc, Nuclear
Medicine
Department, Furness General Hospital, Dalton Lane, Barrow-in-
Furness,
Cumbria LA14 4LF, UK
Tel: + 44 1229 870870 x54388; fax: + 44 1229 491036;
e-mail: [email protected]
Received 31 July 2012 Revised 28 September 2012
Accepted 29 October 2012
Introduction
Computed tomography (CT) has improved the sensitivity
and specificity of many nuclear medicine techniques
through the provision of additional anatomic information or
by providing a high-quality attenuation correction (AC)
map [1,2]. The use of AC is strongly recommended in some
patients undergoing certain procedures, most notably in
those undergoing myocardial perfusion imaging [3,4]. Within
this patient group there is also potential for the discovery of
extracardiac pathology by examining the coincidentally
produced computed tomography attenuation correction
(CTAC) image [4,5]. The ethical and legal considerations
of reviewing the CTAC image have been discussed
previously [6] and it is known that some nuclear medicine
centres routinely review these images to determine whether
incidental chest pathology is present. To a similar end, it has
also been suggested that the raw projection data from the
single-photon emission computed tomography (SPECT)
acquisition should be assessed for incidental cardiac and
extracardiac findings as part of the clinical routine [7,8].
Variation in tube current has no impact on tissue
attenuation values and Hounsfield units (HU) – the re-
sultant attenuation maps are therefore largely independent
of tube current (mA) [9–12]. However, the impact of
varying mA on lesion detection is less clear and this
deserves investigation because of the potential dose saving
at lower mA values. A suitable approach to investigating
this would be through visual performance assessment;
previous visual performance phantom simulations have
shown that lesion detection rates can be maintained at
reduced tube currents [13]. This paper describes a free-
response receiver-operating characteristic (FROC) investi-
gation of the full clinical mA range available on the GE
Infinia Hawkeye 4 SPECT/CT (GEH4) to establish the
impact on lesion detection performance within an anthro-
pomorphic chest phantom.
Materials and methods
Computed tomography attenuation correction
acquisitions/anthropomorphic phantom
The four mA values available for clinical use (1.0, 1.5, 2.0
and 2.5) on the GEH4 (General Electric Medical Systems,
Wisconsin, USA) were used to image a static anthropo-
morphic chest phantom, which contained simulated
pulmonary lesions [14] (Fig. 1). All other CT acquisition
parameters remained constant (Table 1).The lesions
simulated intrapulmonary pathology with diameters of 3,
5, 8, 10 and 12 mm at 630 – 800 and + 100 HU values. This
gave good representation of described density ranges for
Technical note
0143-3636 �c 2013 Wolters Kluwer Health | Lippincott
Williams & Wilkins DOI: 10.1097/MNM.0b013e32835c0984
Copyright © Lippincott Williams & Wilkins. Unauthorized
reproduction of this article is prohibited.
mailto:[email protected]
solid lesions (20–60 HU) [15–18] and ground-glass opacity
lesions (– 850 to – 450 HU) [19,20]. The phantom and
simulated lesion positions remained constant for the four
mA image acquisitions, ensuring the production of a case-
matched series of images suitable for FROC analysis.
A prestudy and poststudy diagnostic-quality CT scan was
acquired to ensure that no movement of simulated lesions
had occurred. These diagnostic-quality images also acted as
the FROC truth (gold standard/true lesion positions) to aid
accurate localization on the CTAC images. Observers were
blinded to these data.
Free-response receiver-operating characteristic
analysis
The FROC methodology is a significant improvement over
conventional receiver operating characteristic (ROC) tech-
niques. ROC investigations simply demand an observer to
determine whether an image contains lesions and assign
a confidence (rating) score to the image. FROC methods
allow observers to accurately localize multiple lesions
within a single image, with all localizations individually
scored. A proximity criterion, surrounding a lesion, is
applied to resolve ambiguities in lesion detection (lesion or
lesion mimic). This prevents nonlesion localizations (NL)
from being classified as successful lesion localizations
(LL) [21]; the methodology also allows multiple NL
marks to be made on an image. Image display and response
capture (IDRC) software, ROCView (Bury St Edmunds,
UK) [22], was applied in this observer performance study
to collect localization and confidence score (mark-rating
pairs) data. Data were analysed using a Jackknife
alternative free-response receiver-operating characteristic
(JAFROC) analysis [23] using the JAFROC figure of merit
(FOM) for optimal statistical power. A difference in lesion
detection performance would be considered significant at
P values less than 0.05.
Twenty observers with varying CT experience (0–24 years,
mean 4.25±6.78 years) performed the ROCview lesion
detection study. They assessed case-matched images [15
normal and 12 abnormal cases for each mA value (FROC
modality); 108 images in total] showing 17 simulated
pulmonary lesions. Observers were aware of the case mix
and the range of simulated pulmonary lesions per image
(0–4). Observers were able to make up to six localizations
per image, allowing opportunity for both LL and NL in all
images. Observers were instructed to locate only the
simulated pulmonary lesions and to ignore all other
coincidental mimics of pathology that the phantom may
produce.
Viewing conditions and study controls
The TG-18 test card (American Association of Physicists
in Medicine, College Park, Maryland, USA) [24,25] was
used to ensure the quality of the reporting standard
monitor used for displaying the images on ROCView. The
monitor was calibrated according to local clinical speci-
fications with ambient lighting dimmed and constant for
all observers. The influence of observer familiarity with
CT image adjustment (zooming/windowing) was negated,
as image adjustment was not permitted in this FROC
study. Consequently, the only variable was the mA value
used. ROCview automatically randomized and displayed
images on a CT lung window (width 1500, level – 500).
Dose recordings
The GEH4 provides the computed tomography dose
index (CTDIvol) as an indication of the dose received.
The effective mAs was calculated and the effective dose
(E) estimated using a chest-specific conversion factor
(0.014 mSv/mGy/cm) following a previously described
method [26].
Quality control – Hounsfield unit accuracy
Conventional CT indicates that HU variation is in the
magnitude of less than 1 HU for a variation in mA [9].
This was assessed on the GEH4 using the American
College of Radiologists CT Accreditation Phantom [27].
Fig. 1
A high-resolution computed tomography image of the phantom
showing
a + 100 HU simulated lesion (white arrow) in the right lung
field to
demonstrate the clinical value of the images used in this study.
Table 1 GE Infinia Hawkeye 4 SPECT/CT acquisition
parameters
(controls)
140 kVp,1.9 pitch, acquired slice thickness 4�5 mm, slice
reconstruction
6.1 mm, slice interval 3.4 mm, scan length 394.4 mm, scan FOV
565.65 mm,
display FOV 435 mm, pixel size 2.89 mm2, 2.0 rpm (L-mode),
matrix size
256�256
FOV, field of view; SPECT/CT, single-photon emission
computed tomography/
computed tomography.
Lesion localisation: influence of mA Thompson et al. 181
Copyright © Lippincott Williams & Wilkins. Unauthorized
reproduction of this article is prohibited.
The average pixel value of a 200 mm
2
region of interest
was recorded for five modules of known density. HU
value accuracy is required for AC as they are converted to
attenuation coefficients at the energy of the SPECT
radionuclide [2].
Results
The JAFROC FOM revealed no significant difference in
lesion detection performance for any of the mA values
used (P = 0.826). Observer-averaged JAFROC FOM
values can be found in Table 2 alongside the dose
recordings and calculated E for each mA value. Individual
observer performance was consistent between variations
of mA with an intraobserver SD range of 0.01–0.11.
Interobserver variation was also low for each mA setting
(1 mA, SD = 0.08; 1.5 mA, SD = 0.09; 2.0 mA, SD = 0.10;
2.5 mA, SD = 0.13). E was calculated for full field of view
(40 cm) CTAC acquisitions at each mA setting, estimat-
ing a dose saving of 60% if using 1 mA instead of 2.5 mA.
CT HU values measured in a DICOM viewer [28]
showed negligible variation as a result of changing mA
(Table 3). The greatest deviation was observed within
the low-density regions of the phantom (Poly and Air),
although this was still small in magnitude (change of
3 HU). The variation in image quality at the four mA
values can be seen in Fig. 2.
Discussion
For the static anthropomorphic chest phantom represen-
tative of a man weighing 70 kg there was no statistically
significant difference in lesion detection for the four mA
values. Although our experiment did not simulate
respiratory motion, there is evidence to suggest that
incidental extracardiac lesions could be detected equally
well on images acquired at 1 mA as those acquired at
2.5 mA. This finding concurs with a previous patient-
based study, in which a 1 mA attenuation map was
acquired at rest and a 2.5 mA attenuation map was
acquired at stress; both image sets revealed abnormal
findings at a rate of 9.7% [12]. The patient-based study
and our work both describe potential dose saving in the
region of 60%.
We have shown, through the acquisition of QC data, that
HU accuracy is unaffected by mA in this SPECT/CT
system (Table 3); therefore, the linear attenuation
coefficients that make up the attenuation map must also
be unaffected. This is suggestive of the quality of AC
being maintained despite a reduced mA. Combining this
information with the results of our JAFROC analysis
suggests a potential for dose saving without any detri-
mental effect on the primary outcome (good-quality AC)
with respect to the CTAC acquisitions for this system or
secondary outcome (detection of incidental chest pathol-
ogy). The GEH4 offers image reconstruction filters that
are optimized for low-dose operation, and this system can
outperform diagnostic systems in terms of contrast-to-
noise ratio, in the low-dose range, because of the filters in
operation [29]. Consequently, it is possible that not all
systems will respond to using a very low-dose regime.
Our data provide insight into the potential for dose saving
in patients undergoing myocardial perfusion SPECT/CT.
However, some caution must be applied to the results
because our work only considers a phantom representing
‘Standard Man’; there is an acknowledged gap between
phantom studies and clinical work. In our (static) phantom
study we did not set out to determine the effect of
respiratory motion on lesion detection. Variation in
respiratory motion can be significant, both within subjects
and between them [30,31], but previous work comparing
2.5 mA attenuation maps at stress and 1 mA attenuation
maps at rest saw equal detection rates (9.7%) of abnormal
findings [12]. In this work the authors comment that the
attenuation map, with a rotation time of 14 s, was sampled
over approximately three respiratory cycles.
Respiratory motion has been a persistent problem in
hybrid imaging, affecting both emission and transmission
acquisitions with errors of misregistration known to
contribute to errors in AC [30,31]. Methods of correction,
including respiratory gating, deep inspiration breath-hold,
motion correction and postprocessing methods, have
been discussed to correct for these errors [30]. Further,
the phase of breathing (inspiration, midbreath, expira-
tions) also has been found to have a significant bearing on
AC [30,32].
Table 2 Dose recordings, calculations and free-response
receiver-operating characteristic results for all variations of mA
mA Effective mAs CTDI Estimated E (mSv) at 40 cm FOV
JAFROC FOM (95% CI)
1.0 15.789 1.587 0.89 0.568 (0.507–0.630)
1.5 23.684 2.380 1.33 0.590 (0.538–0.642)
2.0 31.579 3.173 1.78 0.585 (0.528–0.641)
2.5 39.474 3.967 2.22 0.591 (0.523–0.659)
CI, confidence interval; CTDI, computed tomography dose
index; FOM, figure of merit; FOV, field of view; JAFROC,
Jackknife alternative free-response receiver-operating
characteristic.
Table 3 Hounsfield unit accuracy at each mA value
Water Poly Acrylic Bone Air
True value (HU) 0 – 95 120 955 – 1000
mA
1.0 – 1 – 84 125 816 – 970
1.5 0 – 81 125 816 – 972
2.0 0 – 84 126 816 – 972
2.5 0 – 84 126 816 – 973
182 Nuclear Medicine Communications 2013, Vol 34 No 2
Copyright © Lippincott Williams & Wilkins. Unauthorized
reproduction of this article is prohibited.
Further phantom work should attempt to simulate motion
over a range of respiratory amplitudes, with a previous
patient study suggesting that lesion position and size can
contribute to errors caused by respiratory motion [30].
Investigating the effect of patient size might prove
beneficial too.
Conclusion
Using a static anthropomorphic chest phantom with
simulated lesions, the GEH4 can be used with equal
confidence at each of its 4 mA settings for accurate LL on
the CTAC image. Before conducting a human study,
further phantom work should be carried out to consider
the effect of respiratory motion and patient size on lesion
detection.
Acknowledgements
The authors are grateful to Richard Lawson, Medical
Physicist at Central Manchester University Hospitals NHS
Foundation Trust, for clarification regarding CT acquisition
parameters of hybrid systems. The authors thank Katy
Szczepura, Medical Physicist and Senior Lecturer at The
University of Salford, for discussion around CT scanner
capability. The University of Cumbria kindly loaned the
Lungman phantom.
Conflicts of interest
There are no conflicts of interest.
References
1 Buck A, Nekolla S, Ziegler S, Beer A, Krause B, Herrmann K,
et al. SPECT/
CT. J Nucl Med 2008; 49:1305–1319.
2 O’Connor M, Kemp B. Single-photon emission computed
tomography/
computed tomography: basic instrumentation and innovations.
Semin Nucl
Med 2006; 36:258–266.
3 Heller G, Links J, Bateman T, Ziffer J, Ficaro E, Cohen M,
Hendel R.
American society of cardiology and society of nuclear medicine
joint
position: attenuation correction of myocardial perfusion SPECT
scintigraphy.
J Nucl Cardiol 2004; 11:229–230.
4 Flotats A, Knuuti J, Gutberlet M, Marcassa C, Bengel F,
Kaufmann P, et al.
Hybrid cardiac imaging: SPECT/CT and PET/CT. A joint
position statement
by the European Association of Nuclear Medicine (EANM), the
European
Society of Cardiac Radiology (ESCR) and the European Council
of Nuclear
Cardiology (ECNC) . Eur J Nucl Med Mol Imaging 2011;
38:201–212.
5 Goetze S, Pannu H, Wahl R. Clinically significant abnormal
findings on the
‘nondiagnostic’ CT portion of low-amperage-CT attenuation-
corrected
myocardial perfusion SPECT/CT studies. J Nucl Med 2006;
47:1312–1318.
Fig. 2
The anthropomorphic phantom scanned at each mA value,
showing low-density spherical simulated lesions (white arrows)
in the right lung (close
to vertebra) and left lung (posteriorly). Clockwise from top left:
1, 1.5, 2 and 2.5 mA.
Lesion localisation: influence of mA Thompson et al. 183
Copyright © Lippincott Williams & Wilkins. Unauthorized
reproduction of this article is prohibited.
6 Tootell A, Vinjamuri S, Elias M, Hogg P. Clinical evaluation
of the computed
tomography attenuation correction map for myocardial
perfusion imaging:
the potential for incidental pathology detection. Nucl Med
Commun 2012;
33:1122–1126.
7 Chamarthy M, Travin M. Altered biodistribution and
incidental findings on
myocardial perfusion imaging. Semin Nucl Med 2010; 40:257–
270.
8 Gedik G, Ergün E, Aslam M, Caner B. Unusual extracardiac
findings
detected on myocardial perfusion single photon emission
computed
tomography studies with Tc-99m sestamibi. Clin Nucl Med
2007;
32:920–926.
9 Birnbaum B, Hindman N, Lee J, Babb J. Multi-detector row
CT attenuation
measurements: assessment of intra- and interscanner variability
with an
anthropomorphic body CT phantom. Radiology 2007; 242:109–
119.
10 Reza Ay M, Zaidi H. Computed tomography-based
attenuation correction in
neurological positron emission tomography: evaluation of the
effect of the
X-ray tube voltage on quantitative analysis. Nucl Med Commun
2006;
27:339–346.
11 Kamel E, Hany T, Burger C, Treyer V, Lonn A, von
Schulthess G, Buck A.
CT vs 68Ge attenuation correction in a combined PET/CT
system: evaluation
of the effect of lowering the CT tube current. Eur J Nucl Med
Mol Imaging
2002; 29:346–350.
12 Preuss R, Weiss R, Lindner O, Fricke E, Fricke H, Burchert
W. Optimisation
of protocol for low dose CT-derived attenuation correction in
myocardial
perfusion SPECT imaging. Eur J Nucl Med Mol Imaging 2008;
35:1133–1141.
13 Thompson J, Hogg P, Szczepura K, Manning D. Analysis of
CT acquisition
parameters suitable for use in SPECT/CT: a free-response
receiver
operating characteristic study. Radiography 2012; 18:238–243.
14 KyotoKagaku.com. Multipurpose Chest Phantom N1. Japan;
2011. Available
at: http://www.kyotokagaku.com/products/detail03/pdf/ph-
1_catalog.pdf
[Accessed 4 July 2012].
15 Das M, Mühlenbruch G, Katoh M, Bakai A, Salganicoff M,
Stanzel S, et al.
Automated volumetry of solid pulmonary nodules in a phantom:
accuracy
across different CT scanner technologies. Invest Radiol 2007;
42:297–302.
16 Ko J, Rusinek H, Jacobs E, Babb J, Betke M, McGuinness G,
Naidich D.
Small pulmonary nodules: volume measurement at chest CT –
phantom study. Radiology 2003; 228:864–870.
17 Marten K, Grabbe E. The challenge of the solitary pulmonary
nodule: diagnostic
assessment with multislice spiral CT. Clin Imaging 2003;
27:156–161.
18 Wormanns D, Kohl G, Klotz E, Marheine A, Beyer F,
Heindel W, Diederich S.
Volumetric measurements of pulmonary nodules at multi-row
detector CT:
in vivo reproducibility. Eur Radiol 2004; 14:86–92.
19 Oda S, Awai K, Murao K, Ozawa A, Yanaga Y, Kawanaka K,
Yamashita Y.
Computer-aided volumetry of pulmonary nodules exhibiting
ground-glass
opacity at MDCT. Am J Roentgenol 2010; 194:398–406.
20 Funama Y, Awai K, Liu D, Oda S, Yanaga Y, Nakaura T, et
al. Detection of
nodules showing ground-glass opacity in the lungs at low-dose
multidetector computed tomography: phantom and clinical
study. J Comput
Assist Tomogr 2009; 33:49–53.
21 Devchakraborty.com. Philadelphia; 2011. Available at:
http://
www.devchakraborty.com/Historical%20Background.html
[Accessed 4
July 2012].
22 Thompson J, Hogg P, Thompson S, Manning D, Szczepura K.
ROCView:
prototype software for data collection in Jackknife alternative
free-response
receiver operating characteristic analysis. Br J Radiol 2012;
85:1320–1326.
23 Devechakraborty.com. JAFROC 4.0.1. Philadelphia; 2012.
Available at:
http://www.devchakraborty.com/downloads [Accessed 4 July
2012].
24 Samei E, Badano A, Chakraborty D, Compton K, Cornelius
C, Corrigan K,
et al. Assessment of display performance for medical imaging
systems:
report of the American Association of Physicists in Medicine
(AAPM) Task
Group 18. AAPM On-Line Report No. 3. Madison, WI: Medical
Physics
Publishing; 2005.
25 Deckard.mc.duke.edu. Assessment of Display Performance
for Medical
Imaging Systems (American Association of Physicists in
Medicine (AAPM)
Task Group 18); 10 January 2010. Available at:
http://deckard.mc.duke.edu/
˜samei/tg18 [Accessed 31 January 2012].
26 Jessen K, Shrimpton P, Geleijns J, Panzer W, Tosi G.
Dosimetry for
optimisation of patient protection in computed tomography.
Appl Radiat Isot
1999; 50:165–172.
27 Gammex.com. CT Accreditation Phantom Instructions
(American College of
Radiologists). Wisconsin; 2011. Available at:
http://www.gammex.com/
acefiles/manuals/ACR_CT_Phantom.pdf [Accessed 11 July
2012].
28 Rosset A, Spadola L, Ratib O. OsiriX: an open-source
software for
navigating in multidimensional DICOM images. J Digit Imaging
2004;
17:205–216.
29 Hamann M, Aldridge M, Dickson J, Endozo R, Lozhkin K,
Hutton B.
Evaluation of a low-dose/slow-rotating SPECT-CT system. Phys
Med Biol
2008; 53:2495–2508.
30 Liu C, Pierce LA, Alessio AM, Kinahan PE. The impact of
respiratory motion
on tumor quantification and delineation in static PET/CT
imaging. Phys Med
Biol 2009; 54:7345–7362.
31 Dey J, Segars WP, Pretorius H, Walvick RP, Bruyant PP,
Dahlberg S, King
MA. Estimation and correction of cardiac respiratory motion in
SPECT in the
presence of limited-angle effects due to irregular respiration.
Med Phys
2010; 37:6453–6465.
32 Koshino K, Fukushima K, Fukumoto M, Sasaki K, Moriguchi
T, Hori Y, et al.
Attenuation correction for quantitative cardiac SPECT. Eur J
Nuc Med Mol
Imaging Res 2012; 2:33.
184 Nuclear Medicine Communications 2013, Vol 34 No 2
Copyright © Lippincott Williams & Wilkins. Unauthorized
reproduction of this article is prohibited.
http://www.kyotokagaku.com/products/detail03/pdf/ph-
1_catalog.pdf
http://www.devchakraborty.com/Historical%20Background.html
http://www.devchakraborty.com/downloads
http://deckard.mc.duke.edu/˜samei/tg18
http://www.gammex.com/acefiles/manuals/ACR_CT_Phantom.p
df
http://www.gammex.com/acefiles/manuals/ACR_CT_Phantom.p
df
PediatricDoseLimitationDuringCTscan.docx
DOSE LIMITATION FOR PEDIATRIC DURING CT SCAN
Dear
This is my professor feedback, So I want to edit proposal as
professor requests.
Using patients would be an insurmountable barrier to ethical
approval of the research.
We would like you to consider a phantom based study.
need to be more than a dose measuring exercise, you could look
at using exposure.
parameters that are outside the normal range (for example low
kV), or mA modulation
You could also consider image quality to see if the resulting
image is still of diagnostic quality.
Dose measurements/estimations could be used to establish the
risk of cancer induction.
We have attached several research articles published by our
Research group that will help you to re-develop your proposal.
And here my proposal
A research proposal
DOSE LIMITATION FOR PEDIATRIC DURING CT SCAN
Introduction
CT scan is an imaging modality which is being used widely in
the field of medicine. It is mostly employed for the diagnostic
purposes owing to the fact that it gives a detailed view of the
different structures of the body. It divides the body into
different cross sections, providing a detailed view of the
internal structures and organs. Apart from diagnostic purposes,
it is also being used for therapeutic purposes for therapeutic
taps and drainage of accumulated fluid etc. in the body cavities.
The basis of CT scan is the use of X-rays which form an image
of the body using the computerized program to contrast a three
dimensional image of the structures of the body based on the
passage of x-rays through them.
With the advances in the field of medicine and science, CT scan
has secured the position of being an important diagnostic
modality owing to the fact that it is a comparatively cheaper
investigation, yielding a detailed view of the internal structures
of the body, helping in the diagnosis and treatment of the
patient and having wide range of applications. It is thus the
most commonly advised investigation in cases where a
diagnosis is difficult to be established. It is being used in the
adult as well as the pediatric population. Due to the fact that the
CT scan employs use of computed X-rays to construct the three
dimensional images of the human body, the dose of the X-rays
is a growing concern. The radiations an individual is exposed to
during a single CT scan ranged from 10-20 mGy and can go up
to 80 mGy if a specialized CT image is required. This amount of
radiation is far greater than a routine X-ray. Exposing the
pediatric population to such high doses of radiations is the
concern behind this study.
Literature review
The basis of the CT scan and the method through which an
image of the various structures of the body are obtained is
through the use of X-rays which are used at different angles to
obtain a three dimensional image. If the dose of the radiation is
decreased to an absolutely a safe range for the pediatric
population, the purpose of the CT scan won’t be fulfilled. The
quality of the image would suffer tremendously and so the child
would be subjected to the radiations for no good outcome. Thus
a careful balance is required to be established between the
comparatively safe dose of radiation and the dose which is
required for optimal image production. This is how the dose
limitation can be achieved in children (Zacharias et al., 2013).
A study carried out to estimate the incidence of cancer among
the individuals who were exposed to the ionizing radiation
during a CT scan as children. They were assessed at later ages
and it was seem that the children who were exposed to increased
doses of radiations during CT scans, developed increased risk of
developing cancer later in life. The children who were exposed
to CT scans suffered from changes in their cells, leading to
mutations which caused cancers. These changes were more
dangerous among the pediatric age group because the cells were
dividing at a higher pace as compared to the cellular division in
older age groups (Miglioretti et al., 2013).
The dose which is used in the CT scans also varies among the
different CT machines. The latest equipment allows the
technician to adjust the dose of the radiation before exposing an
individual to unnecessary radiations. These devices are
extremely beneficial in adjusting the pediatric dose of radiation
according to the age of the patient because as the age of a child
increases, the harmful effects of the radiations decrease. But
this facility is not available in the old machines, most of which
are used in the community hospitals and imaging centers. These
facilities still use the same amount of radiations for every
individual which is contributing to the increase in the incidence
of increased pediatric cancers (Little, Grattan-Smith, &
Johnson, 2016).
The most beneficial method to decrease the exposure of high
dose of ionizing radiations during a CT scan in a child is by the
method called as “dose auditing”. This newly developed method
is based on the principle of audit and requires that each dose of
radiation which a person is exposed to should be audited against
the benefits of that exposure. The benefits which are achieved
from the exposure must outweigh the harmful effects of the dose
of radiation which the child is exposed to.
Aims/ hypothesis:
The aim of this study is to assess the safe reduced dose of the
radiation that a pediatric patient can be exposed to during a CT
scan. This safe dose should decrease the harmful effects of X-
rays exposure but still manage to provide the benefits of this
diagnostic modality. Another aim of this study is to assess the
detrimental effects which high dose radiations during CT scans
have already caused in the pediatric population.
Hypothesis:
To assess the reduction in the dose of radiation in pediatric
population and to assess the detrimental effects of high dose
radiation CT scan in pediatric population
Methods
The study will be carried out as a randomized controlled study.
The subjects selected for the study will be children from ages
between 1-5 and another group form 6-10. The study will be
carried out in two parts. The first part will require selection of
children from the two groups of ages as mentioned above whose
CT scan is planned. They will be divided in two groups,
randomly. The group A will have low dose of radiation
exposure and group B will have the standard pediatric dose
exposure. The results of the CT scan films will be compared.
As part two of the study, those people will be selected,
randomly form the community who have been exposed to the
radiations of CT scan as children. They will be categorized by
the age at which they were exposed to radiations and their graph
will also be plotted of the age at which they were exposed and
the dose of radiation which was given to them. These
individuals will also be questioned regarding any cancers they
suffered from. The data will give the idea of the risk of
development of cancer in individuals exposed to radiation as
children.
References
Duong, P. & Little, B. (2014). Dose Tracking and Dose
Auditing in a Comprehensive Computed Tomography Dose-
Reduction Program. Seminars In Ultrasound, CT And MRI,
35(4), 322-330. http://dx.doi.org/10.1053/j.sult.2014.05.004
Little, S., Grattan-Smith, D., & Johnson, B. (2016). CT
Radiation Dose Delivered by Community Hospitals and Imaging
Centers. Children's Healthcare Of Atlanta. Retrieved from
http://www.choa.org/Childrens-Hospital-
Services/Radiology/~/media/CHOA/Documents/Services/Radiol
ogy/Little-CT-dose-study.pdf
Miglioretti, D., Johnson, E., Williams, A., Greenlee, R.,
Weinmann, S., & Solberg, L. et al. (2013). The Use of
Computed Tomography in Pediatrics and the Associated
Radiation Exposure and Estimated Cancer Risk. JAMA
Pediatrics, 167(8), 700.
http://dx.doi.org/10.1001/jamapediatrics.2013.311
Zacharias, C., Alessio, A., Otto, R., Iyer, R., Philips, G.,
Swanson, J., &Thapa, M. (2013). Pediatric CT: Strategies to
Lower Radiation Dose. American Journal OfRoentgenology,
200(5), 950-956. http://dx.doi.org/10.2214/ajr.12.9026
ThompsonEtal2012bjr.pdf
SHORT COMMUNICATION
ROCView: prototype software for data collection in jackknife
alternative free-response receiver operating characteristic
analysis
1,2J THOMPSON, MSc, BSc(Hons), 2P HOGG, MPhil, FCR, 3S
THOMPSON, MEng, 2,4D MANNING, PhD, DSc and
2K SZCZEPURA, MSc, DipIPEM
1Department of Nuclear Medicine, Furness General Hospital,
Barrow-in-Furness, UK, 2Directorate of Radiography,
University of Salford, Salford, UK, 3Independent Software
Developer, and 4Division of Medicine, School of Health &
Medicine, Lancaster University, Lancaster, UK
ABSTRACT. ROCView has been developed as an image display
and response capture
(IDRC) solution to image display and consistent recording of
reader responses in
relation to the free-response receiver operating characteristic
paradigm. A web-based
solution to IDRC for observer response studies allows
observations to be completed
from any location, assuming that display performance and
viewing conditions are
consistent with the study being completed. The simplistic
functionality of the software
allows observations to be completed without supervision.
ROCView can display images
from multiple modalities, in a randomised order if required.
Following registration,
observers are prompted to begin their image evaluation. All data
are recorded via
mouse clicks, one to localise (mark) and one to score
confidence (rate) using either an
ordinal or continuous rating scale. Up to nine ‘‘mark-rating’’
pairs can be made per
image. Unmarked images are given a default score of zero.
Upon completion of the
study, both true-positive and false-positive reports can be
downloaded and adapted for
analysis. ROCView has the potential to be a useful tool in the
assessment of modality
performance difference for a range of imaging methods.
Received 11 September
2011
Revised 23 November 2011
Accepted 14 December
2011
DOI: 10.1259/bjr/99497945
’ 2012 The British Institute of
Radiology
The success of an imaging technique should not be judged
by physical measures, such as signal-to-noise ratio or contrast
resolution, alone. Human observations must be considered
because the reader is an integral part of the diagnostic
process. For the latter, receiver operating characteristic (ROC)
methods successfully quantify the combined performance of
imaging techniques and readers [1].
Traditional ROC analysis simply required readers to state
whether they thought a case was normal or abnormal, using
a rating scale to indicate decision confidence [2]. A notable
development in ROC methodology has been the free-
response ROC (FROC) method. Unlike ROC methods,
FROC uses location information to resolve ambiguities in
detection (lesion or lesion mimic) to prevent false identifica-
tion of pathology, resulting in a true-positive result [3].
Jackknife alternative free-response ROC (JAFROC)
methods [4] are the latest evolution of FROC methods
in which multiple readers and modalities are compared
with greater sensitivity to differences in performance
from other ROC methods [5]. Table 1 lists the terms
associated with JAFROC analysis. JAFROC methods
demand a precise response from the reader, in which
location and confidence information must be supplied
for each lesion within a case [6]. This identification and
scoring is typically referred to as a ‘‘mark-rating’’ pair [7].
Those setting up JAFROC studies are encouraged to
allow mouse clicks to record reader responses and an
acceptance radius around each area of pathology to
classify each response as either a lesion localisation/true
positive (LL/TP) or a non-lesion localisation/false
positive (NL/FP) [8].
JAFROC methods can be valuable in the evaluation of
different techniques in radiology. Like all observer
performance studies, achieving optimal statistical power
can require a large number of readers and cases [9, 10],
and a 50:50 ratio of normal and abnormal cases [11].
However, JAFROC methods achieve greater statistical
power than ROC for the same combination of readers
and cases [7]. This in turn requires a reliable method of
image display and response capture (IDRC). All ROC
methods require accurate data recording; ROCView is
proposed as a computer-based solution to accurate IDRC
in JAFROC analysis—the current end point of the free-
response paradigm.
Why develop ROCView?
A recent study of dose optimisation in CT [12]
prompted investigation into a reliable solution for
Address correspondence to: Mr John Thompson, Nuclear
Medicine
Department, Furness General Hospital, Dalton Lane, Barrow-in-
Furness LA14 4LF, UK. E-mail: [email protected]
The British Journal of Radiology, 85 (2012), 1320–1326
1320 The British Journal of Radiology, September 2012
IDRC suited to JAFROC methodology. Although other
software exists [13, 14], the authors took the opportunity
to develop ROCView to suit the needs of their current
research. As a web-based service ROCView would have
excellent availability with no software download or
installation required. A requirement of ROCView would
be to produce data suitable for analysis via JAFROC [15]
and Dorfman–Berbaum–Metz Multi-reader Multi-case
(DBM-MRMC) software [16] for direct comparison of the
performance of multiple readers and modalities.
Gathering suitable readers in a single centre for an
observer study also presented itself as a boundary to
conducting JAFROC research. Consequently, a geogra-
phically independent method of IDRC was required
to allow readers to complete the observation—this
prompted the development of a web-based solution.
ROCView meets the demands of geographical indepen-
dence and IDRC with the option to store resultant data in
a form suitable for DBM-MRMC analysis. The nature of
the software solution required a simplistic method to
maintain the integrity of the data, as there would be no on-
site support. Figure 1 describes the process of perception
that readers will use when assessing studies on ROCView.
Design and development of ROCView
ROCView is implemented as a web application, with
reader evaluations performed in a front-end display
system (browser/client), with a web server supplying
image data and recording reader responses into a
database. A second web interface provides administra-
tion facilities: user management, modality and case
management, creation of the ‘‘truth’’ and report genera-
tion. Guidance provided by Chakraborty [17] in relation
to conducting a JAFROC study aided the design of
ROCView. The development of a successful IDRC
system required an understanding of the following key
principles:
N image display
N comparing modalities
N setting the ‘‘truth’’
N acceptance radius criterion
N scoring confidence
N data recording.
The following description and the flow diagram
shown in Figure 2 explain the process for setting up
and running a JAFROC study on ROCView.
Table 1. The terminology associated with jackknife alternative
free-response receiver operating characteristic analysis
Term Alternative meaning/comment
Reader Observer, participant
Case Image
Lesion Pathology
Modality Variable
Case matched Same image displayed
Lesion localisation (LL) Successful identification of pathology
(TP)
Non-lesion localisation (NL) Unsuccessful identification of
pathology (FP)
Truth The true site of pathology in a case
Signal A stimulus within background noise stimulating a
localisation
Case memory The likelihood of a reader remembering the
appearance of cases shown in sequential order
Figure 1. The process used by readers attempting a study on
ROCView.
Short communication: ROCView: prototype software for data
collection in JAFROC analysis
The British Journal of Radiology, September 2012 1321
Image display
Image display is fairly straightforward for a JAFROC
study. Cases from multiple modalities are displayed, with
quick progression between them. ROCView automatically
randomises the images from all modalities in order to
reduce case memory. As a web-based application it is
important to ensure that the viewing conditions are
consistent and to a certain standard. A variety of monitor
test patterns can be used to ensure monitor performance
[18], in which it is also important to ensure a consistent
display response to allow a consistent response by the
observer. Methods to assess the adequacy of display
performance in accordance with the digital imaging and
communication in medicine (DICOM) greyscale standard
display function (GSDF) are available [19].
Comparing modalities
To allow direct comparison of two modalities, such as
a variation in image acquisition parameters, ROCView
allows the upload of a large number of image data sets
via file transfer protocol (FTP) [20]. All uploaded
modalities should be named or numbered appropriately
and all cases should be numbered and case-matched
across all modalities. When assigned to the appropriate
study, cases are automatically randomised. From this
point the study is ready for the ‘‘truth’’ to be set.
Setting the ‘‘truth’’
A suitably trained person should access the study as an
administrator and create the ‘‘truth’’, which is stored in a
database on ROCView to act as a standard with which all
further reader responses are compared, via the imple-
mentation of a pre-defined acceptance radius arising from
the pixel that is marked on the image. When performing
this task the administrator is able to view the modality
and case identifier alongside the image, together with the
localisation marker showing the acceptance radius, in
order to minimise error in lesion localisation. This is
particularly useful for phantom studies in which the
lesion sites are known. All readers are blinded to modality
and case identifiers. The administrator can make up to
nine lesion localisations per case.
Acceptance radius criterion
An acceptance radius is a region surrounding a lesion
that allows slight error in localisation. ROCView allows
adjustment of the acceptance radius in the source code. The
acceptance radius for current studies, determined by lesion
size, is nine pixels’ radial distance from the centre of the
localisation made by the administrator creating the ‘‘truth’’.
All marks within this radius are classified as LLs. All other
marks are NLs, penalising the reader for inaccuracies and
false localisations. This is, however, dependent on the
resolution of the monitor and the image size. Currently, the
largest size of image used has been 5126512 pixels, which
allows for a 1.8% error with an acceptance of 9 pixels in all
directions from the point of localisation. If monitor
resolution does not allow the maximum image size then
it will be scaled, with a 100% viewing window, and centred
over the cursor, available in the top right of the screen.
Figure 3 explains the implication of acceptance radius size;
a clinical example would equate to a vessel (lesion mimic)
next to a lesion in the thorax being incorrectly localised but
being classified as LL owing to it falling within the
acceptance radius of the lesion. Different values of radii
clearly affect reader performance [21], where a relaxed
criterion (20–40 pixels) improved apparent reader perfor-
mance. Localisation accuracy is an important distinction
between conventional ROC and free-response methods;
consequently, this criterion, at the discretion of the
researcher, must be controlled to ensure that JAFROC
maintains precision. When a reader clicks on the image in
ROCView a 19-pixel-diameter marker appears to aid the
reader’s judgement of accuracy (Figure 4). Existing phan-
tom-based ROCView studies have not used simulated
lesions that are .19 pixels in diameter. Therefore, localisa-
tion of the centre of the lesions would always result in a
TP/LL result.
Scoring confidence
Many variations of confidence scales are described
[22–24] and one must be mindful that one scale may not
Figure 2. The administration process used to create a study
on ROCView.
J Thompson, P Hogg, S Thompson et al
1322 The British Journal of Radiology, September 2012
be suited to all investigations. To address this, ROCView
offers two types of scale: continuous and discrete
(Figure 5). When creating a study the administrator can
choose which type of scale will be presented to the
reader following a mark made on an image. The discrete
scale appears as a pop-up box showing a series of ranked
radio buttons (1–5, low to high confidence) from which
readers can make their selection. The continuous scale
presents as a slider bar that can function as a 101-point
scale similar to those in use [24]. The data can be
resampled to an 11-point discrete rating scale if there is
not a good distribution of responses—a problem con-
sistent with this type of scale arising from the inability to
estimate within a few percentage points [23].
Data recording
Once confidence has been scored, mark-rating pairs
are stored in a database (TP or FP) in the format shown
in Tables 2 and 3, which can then be downloaded and
analysed via JAFROC methods.
Figure 3. The implication of accep-
tance radius. A larger acceptance
radius could result in a greater
number of incorrect true-positive
results owing to the marking of a
lesion mimic that falls within the
acceptance radius. A small accep-
tance radius can reduce this risk and
would increase the number of false-
positive results owing to lesion
mimics and reader inaccuracies.
Figure 4. Screenshot of ROCView.
The main image (scaled) shows a
reader mark that prompted the
confidence scale to appear. Note
the option to remove unwanted
clicks. The image in the top right
of the screen shows the main image
at 100% size, without reader marks
for re-evaluation of uncertain areas.
Progress through the observation
challenge is also displayed.
Figure 5. Screenshot of ROCView showing the continuous-
style confidence scale variant. A mouse click prompts the
slider bar to appear. The slider starts at the left side of the
bar (score 1.0/low confidence) and can be moved to any
point along it to a maximum of 10.0 (high confidence).
Short communication: ROCView: prototype software for data
collection in JAFROC analysis
The British Journal of Radiology, September 2012 1323
For each successful localisation five integer values are
recorded in the TP sheet. Four integers are recorded for
each incorrect localisation in the FP sheet. The following
data need to be recorded as identifiable integers:
N reader ID
N case ID
N modality ID
N lesion ID (1, 2, 3 etc.)—not used in the FP worksheet
N confidence scale rating (TP or FP).
When no mark-rating pairs are made, a default score of
zero is stored for each case and lesion. These results are not
required for JAFROC analysis but have been included in
the reports to validate the results recorded by ROCView.
Currently the reader ID is recorded as the login details
(email address) of the reader. Once the data have been
downloaded, this can easily be converted to an integer in
Microsoft ExcelH (Microsoft Excel, Redmond, WA). Once
downloaded, TP and FP results need correlating with a
‘‘truth’’ sheet in a single Excel file as described by
Chakraborty and Yoon [25]. This data file can then be
analysed using JAFROC v. 4.0 [15] to transform the
FROC data to inferred ROC data (*.lrc file), which can be
analysed using DBM-MRMC software [16].
Software development
When the application starts, it makes an asynchronous
request to the web server to retrieve the modalities to be
evaluated by the user. This is dictated by the activation
key used when registering as a user, since ROCView
runs multiple studies concurrently. Cases are displayed
in turn, and, as the user creates mark–rating pairs, each
response is sent asynchronously to the server and is
stored immediately in the appropriate database (TP or
FP). The software has been made functional for general
purpose personal computers, in terms of the processing
power and memory required, as a result of the tools used
to develop the software (Table 4). As with all FROC
studies, monitor performance and viewing conditions
remain a concern and these should meet the required
standards consistent with the study objectives.
The client has been designed to use the native HTML
and JavaScript capabilities of browsers. Consequently,
browser plugins are not necessary and the hardware
requirements of the client remain low. The native solution
is at risk of manipulation by the user; for example, by
manipulation of the page uniform resource locators or by
reloading the evaluation page in unsupervised studies.
Therefore, a function is applied to the evaluation data to
maintain integrity between server requests. This prevents
the user from reloading the evaluation page and returning
to evaluate previous images while ensuring that evalua-
tions resume at the last stored point if they are not
completed in one attempt (due to loss of internet
connection or computer hardware failure).
Future application, flexibility and
development
ROCView has the potential to deal with any images
acquired in a manner suitable for FROC analysis. With
the capability to display images from a wide range of
acquisition methods (CT, ultrasound, MRI, nuclear
medicine, mammography and computed/digital radio-
graphy) there is a relatively unlimited application for
lesion detection-based studies. A phantom-based lesion
detection study of CT acquisition parameters highlighted
the type of research study for which this software is
suitable [12]. Producing case-matched images is a
significant challenge for MRMC studies, but if this can
be achieved ROCView can be a powerful tool for the
display of images and the accurate recording of reader
responses.
A significant development to the software would see
the creation of an acceptance volume, to allow classifica-
tion of LLs and NLs, for lesions that cross multiple cross-
sectional images. Software to allow this is available [14]
and has been used in a FROC study of mammography
techniques [34]. A further development would allow
hybrid images to be displayed in their component parts
Table 3. False-positive database format as recorded by
ROCView
Reader ID Modality ID Case ID Reader mark (x, y) FP rating
Name Variable Value Value Confidence
Example
[email protected] Low resolution 39 236 129 3
FP, false positive; ID, identity.
HTML format, all fields; CSV format, exclude italic fields.
Table 2. True-positive database format as recorded by
ROCView
Reader ID Modality ID Case ID Lesion ID Reader mark (x, y)
Truth (x, y)
Proximity
(pixels) TP rating
Name Variable Value Value Value Value Value Confidence
Example
[email protected] High resolution 4 1 121 293 120 294 1.4 4
ID, identity; TP, true positive.
HTML format, all fields; CSV format, exclude italic fields.
J Thompson, P Hogg, S Thompson et al
1324 The British Journal of Radiology, September 2012
(emission, transmission and fused) to allow novel FROC
studies of diagnostic performance in single photon
emission CT and positron emission tomography/CT.
There is also scope for the development of a region-of-
interest style acceptance criterion to enable a form of
JAFROC analysis suited to fracture detection in which
the over-riding outcome would be a study in a similar
vein to mammography PERFORMS [35] to quantify
trainee performance in fracture detection. ROCView, as a
web-based service, requires no download of software.
ROCView is currently being used in a research pro-
gramme but may become available commercially to
other researchers in the future.
References
1. Gur D, Rockette H, Bandos A. ‘Binary’ and ‘non-binary’
detection tasks: are current performance measures optimal?
Acad Radiol 2007;14:871–6.
2. Manning D. Evaluation of diagnostic performance in
radiography. Radiography 1998;4:49–60.
3. devchakraborty.com [homepage on the internet].
Philadelphia: Dev Chakraborty; 2011 [updated 2011; cited
4 November 2011]. Available from: http://www.
devchakraborty.com/Historical%20Background.html
4. Chakraborty D. Analysis of location specific observer perfor-
mance data: validated extensions of the jackknife free-
response (JAFROC) method. Acad Radiol 2006;13:1187–93.
5. devchakraborty.com [homepage on the internet]. Phila-
delphia: Dev Chakraborty and Hong-Jun Yoon; 2011.
JAFROC 4.0 user manual [updated 2010; cited 10 August
2011]. Available from: http://www.devchakraborty.com/
Receiver%20operating%20characteristic.pdf
6. Zarb F, Rainford L, McEntree M. Image quality assessment
tools for optimisation of CT images. Radiography 2010;16:
147–53.
7. Chakraborty D. Validation and statistical power compar-
ison of methods for analysing free-response observer
performance studies. Acad Radiol 2008;15:1554–66.
8. Chakraborty D, Hong-Jun Y, Mello-Thomas C. Spatial
localization accuracy of radiologists in free-response stu-
dies: inferring perceptual FROC curves from mark–rating
data. Acad Radiol 2007;14:4–18.
9. Obuchowski N. Reducing the number of reader interpreta-
tions in MRMC studies. Acad Radiol 2009;16:209–17.
10. Chakraborty D. How many readers and cases does one
need to conduct an ROC study? Acad Radiol 2011;18:127–8.
11. Manning D, Leach J, Bunting S. A comparison of expert and
novice performance in the detection of simulated pulmon-
ary nodules. Radiography 2000;6:111–16.
12. Thompson J, Hogg P, Szczepura K, Tootell A, Sil J,
Manning
D. Determination of optimal CT exposure factors for lung
lesions using an anthropomorphic chest phantom for SPECT-
CT. Eur J Nucl Med Mol Imaging 2010;37(Suppl. 2):S494.
13. Jacobs F, Zanca R, Oyen H, Bosmans J. Sara, an advanced
software platform for human observer performance ex-
periments. In: Proceedings of the XIVth Medical Image
Perception Conference; 9–12 August 2011; Dublin, Ireland.
Available from: http://home.comcast.net/,eakmips/
update.htm (software available from: http://www.
kuleuven.be/radiology/lucmfr/sara/index.html)
14. Håkansson M, Svensson S, Zachrisson S, Svalkvist A, Båth
M, Månsson L. ViewDEX: an efficient and easy-to-use
software for observer performance studies. Radiat Prot
Dosim 2010;139:42–51. Software available from: http://
helios.ifss.gu.se/viewdex/index_v3_slide0001.htm
15. devchakraborty.com [homepage on the internet].
Philadelphia: Dev Chakraborty; 2011. JAFROC 4.0.1 analy-
sis software [updated 2011; cited 10 August 2011]. Available
from http://www.devchakraborty.com/downloads.html
16. perception.radiology.uiowa.edu [homepage on the internet].
Iowa City, IA: The Medical Image Perception Laboratory;
2011. DBM-MRMC v. 2.3 [updated 2011; cited 10 August
2011]. Available from: http://perception.radiology.uiowa.
edu/Software/ReceiverOperatingCharacteristicROC/
DBMMRMC/tabid/116/Default.aspx
17. devchakraborty.com [homepage on the internet].
Philadelphia:
Dev Chakraborty; 2011. How to conduct a free-response study
[updated 2011; cited 10 August 2011]. Available from: http://
www.devchakraborty.com/HowToConduct.html
18. Deckard.mc.duke.edu [homepage on the internet]. Durham,
NC: American Association of Physicists in Medicine; 2011.
Online report no. 3: assessment of display performance for
medical imaging systems [updated 2005; cited 10 August
2011]. Available from: http://deckard.mc.duke.edu/
,samei/tg18_files/tg18.pdf
19. Fetterly K, Blume H, Flynn M, Samei E. Introduction to
grayscale calibration and related aspects of medical
imaging grade liquid crystal displays. J Digit Imaging
2008;21:193–207.
20. filezilla-project.org [homepage on the internet]. Aachen,
Germany. Filezilla; 2011. Filezilla 3.5.0: The free FTP
solution [updated 2011 May 22; cited 10 August 2011].
Available from: http://filezilla-project.org/
21. Gur D, Bandos A, Klym A, Cohen C, Hakim C, Hardesty L,
et al. Agreement of the order of overall performance levels
under
different reading paradigms. Acad Radiol 2008;15:1567–73.
22. Park S, Goo J, Jo C-H. Receiver operator characteristic
(ROC) curve: practical review for radiologists. Korean J
Radiol 2004;5:11–18.
23. Hadjiiski L, Chan H-P, Sahiner B, Helvie M, Roubidoux M.
Quasi-continuous and discrete confidence rating scales for
observer performance studies: effects on ROC analysis.
Acad Radiol 2007;14:38–48.
24. Rockette H, Gur D. Selection of a rating scale in receiver
operating characteristic studies: some remaining issues.
Acad Radiol 2008;15:245–8.
25. devchakraborty.com [homepage on the internet].
Philadelphia: Dev Chakraborty; 2011. JAFROC 4.0 user
manual [updated 2010; cited 10 August 2011]. Available
from: http://www.devchakraborty.com/downloads.html
26. apache.org [homepage on the internet]. Los Angeles, CA:
Apache Software Foundation; 2011. Apache HTTP server
[updated 22 May 2011; cited 10 August 2011]. Available
from: http://httpd.apache.org/
Table 4. Programming tools and applications used in the
development of ROCView (open source components)
Tool Function
Apache HTTP Server [26] + PHP module [27] Web server
MySQL [28] Server database
Flex 4 SDK [29] + jQuery [30] Client applications, JavaScript
library
Apache Ant [31] Source file deployment
JSLint [32] Code quality checking of JavaScript
JSMin [33] Compression of client-side JavaScript code
Short communication: ROCView: prototype software for data
collection in JAFROC analysis
The British Journal of Radiology, September 2012 1325
27. php.net [homepage on the internet]. Denmark: PHP; 2011.
PHP Scripting Language [updated 28 June 2011; cited 10
August 2011]. Available from: http://www.php.net/
28. mysql.com [homepage on the internet]. Redwood Shores,
CA: MySQL; 2011. Open source database [updated 25 July
2011; cited 10 August 2011]. Available from: http://www.
mysql.com/
29. adobe.com [homepage on the internet]. San Jose, CA:
Adobe;
2011. Flex 4 SDK [updated 20 June 2011; cited 10 August
2011]. Available from: http://opensource.adobe.com/wiki/
display/flexsdk/Flex+SDK
30. jquery.com [homepage on the internet]. Boston, MA:
jQuery; 2011. JavaScript Library [updated 23 March 2010;
cited 10 August 2011]. Available from: http://jquery.
com/
31. ant.apache.org [homepage on the internet]. Los Angeles,
CA: Apache; 2011. Apache Ant Java Library [updated 27
December 2010, cited 10 August 2011]. Available from:
http://ant.apache.org/
32. jslint.com [homepage on the internet]. USA: JSLint; 2011.
JavaScript Code Quality Tool [updated 26 August 2011, cited
10 August 2011]. Available from: http://www.jslint.com/
33. crockford.com [homepage on the internet]. USA: JSMin;
2011.
JavaScript Minifier [updated 2003 Dec 04, cited 10 August
2011]. Available from: http://www.crockford.com/javascript/
jsmin.html
34. Svahn T, Andersson I, Chakraborty D, Svensson S, Ikeda D,
Förnvik D, et al. The diagnostic accuracy of dual-view digital
mammography, single-view breast tomosynthesis and a
dual-view combination of breast tomosynthesis and digital
mammography in a free-response observer performance
study. Radiat Prot Dosim 2010;139:113–17.
35. Scott H, Gale A. Breast screening: PERFORMS identifies
key
mammographic training needs. Br J Radiol 2006;79:S127–33.
J Thompson, P Hogg, S Thompson et al
1326 The British Journal of Radiology, September 2012
TootellEtal2014Radiography.pdf
lable at ScienceDirect
Radiography 20 (2014) 323e332
Contents lists avai
Radiography
journal homepage: www.elsevier.com/locate/radi
An overview of measuring and modelling dose and risk from
ionising
radiation for medical exposures
Andrew Tootell*, Katy Szczepura, Peter Hogg
Directorate of Radiography, Salford University, Salford, M6
6PU, UK
a r t i c l e i n f o
Article history:
Received 24 February 2014
Received in revised form
2 May 2014
Accepted 5 May 2014
Available online 3 June 2014
Keywords:
Radiography
Dose
Risk
Thermoluminescent dosimetry
Monte Carlo method
* Corresponding author. Tel.: þ44 1612956414.
E-mail address: [email protected] (A. Tootel
http://dx.doi.org/10.1016/j.radi.2014.05.002
1078-8174/� 2014 The College of Radiographers. Pub
a b s t r a c t
Purpose: This paper gives an overview of the methods that are
used to calculate dose and risk from
exposure to ionizing radiation as a support to other papers in
this special issue.
Background: The optimization of radiation dose is a legal
requirement in medical exposures. This review
paper aims to provide the reader with knowledge of dose by
providing definitions and concepts of
absorbed, effective and equivalent dose. Criticisms of the use of
effective dose to infer the risk of an
exposure to an individual will be discussed and an alternative
approach considering the lifetime risks of
cancer incidence will be considered.
Prior to any dose or risk calculation, data concerning the dose
absorbed by the patient needs to be
collected. This paper will describe and discuss the main
concepts and methods that can be utilised by a
researcher in dose assessments. Concepts behind figures
generated by imaging equipment such as dose-
area-product, computed tomography dose index, dose length
product and their use in effective dose
calculations will be discussed. Processes, advantages and
disadvantages in the simulation of exposures
using the Monte Carlo method and direct measurement using
digital dosimeters or thermoluminescent
dosimeters will be considered.
Beyond this special issue, it is proposed that this paper could
serve as a teaching or CPD tool for
personnel working or studying medical imaging.
� 2014 The College of Radiographers. Published by Elsevier
Ltd. All rights reserved.
Introduction
Within this special issue of radiography, several articles use
Monte Carlo mathematical methods to estimate radiation dose to
humans. It is appreciated that readers may have a limited
knowl-
edge of these methods, or indeed measurement methods which
are
used to estimate dose. For readers with limited knowledge in
dose
estimation this article explains a range of approaches which
might
be used. This article also outlines concepts and defines terms
associated with dose and it discusses how data can be used to
provide an indication of risk to an individual.
Ionising radiation is made up of sub-atomic particles or, in the
case of X-rays and gamma rays, it comprises electromagnetic
waves
from the high energy part of the electromagnetic spectrum. At
energies associated with medical imaging, these particles and
waves have sufficient energy to ionise an atom and liberate an
electron. This process may lead to tissue damage which can
result
in cell mutation or apoptosis. The higher the dose of radiation,
the
l).
lished by Elsevier Ltd. All rights re
greater chance that tissue damage will occur.1 This probability
model of biological damage is referred to as the stochastic
effect. It
suggests that no dose of radiation is safe. It is this worst case
sce-
nario that radiation protection is based on, in that operators
should
aim to minimise the probability of tissue damage by using the
least
practicable amount of ionising radiation.2
In medical imaging a range of professionals are responsible for
ensuring doses are as low as reasonably practicable (ALARP).
The
operator performing the exposure is required to have an under-
standing of the steps that they can take to optimise dose thus
minimising the chance of stochastic affects.
Absorbed dose
Interactions of ionising radiation with matter can result in a
proportion of radiation energy being deposited. The amount of
energy deposited per unit mass is the absorbed dose
(represented
by the letter D) and is defined as joules per kilogram (J kg�1).
The SI
unit of absorbed is the Gray (Gy). Quantities of absorbed dose
are
usually quoted as milli-Gray (mGy, 1/1000 of a Gray) or a
micro-
Gray (mGy, 1/1,000,000 of a Gray).
served.
mailto:[email protected]
http://crossmark.crossref.org/dialog/?doi=10.1016/j.radi.2014.0
5.002&domain=pdf
www.sciencedirect.com/science/journal/10788174
http://www.elsevier.com/locate/radi
http://dx.doi.org/10.1016/j.radi.2014.05.002
Table 1
Recommended radiation weighting factors from ICRP 103.1
Radiation type Radiation weighting factor
Photons (X-ray and gamma ray) 1
Electrons 1
Alpha particles 20
Protons 2
Table 2
Tissue weighing factors from ICRP 103.1
Organ Tissue weighting factor
Gonads 0.08
Bone marrow 0.12
Colon 0.12
Lung 0.12
Stomach 0.12
Breast 0.12
Bladder 0.04
Liver 0.04
Oesophagus 0.04
Thyroid 0.04
Skin 0.01
Bone (surface) 0.01
Salivary glands 0.01
Brain 0.01
Remaindera 0.12
Total 1.00
a Remainder tissues: adrenals, extrathoracic (ET) region, gall
bladder,
heart, kidneys, lymphatic nodes, muscle, oral mucosa, pancreas,
pros-
tate (_), small intestine, spleen, thymus, uterus/cervix ().
A. Tootell et al. / Radiography 20 (2014) 323e332324
Equivalent dose
The chance of tissue damage occurring does not just depend on
the absorbed dose but also the type and energy of the radiation.
Equivalent dose (represented by the symbol H) takes these
factors
into consideration and is obtained by applying a radiation
weight-
ing factor (W) to the absorbed dose. Radiation weighting factors
are
published by The International Commission On Radiation
Protec-
tion (ICRP)1; they reflect the biological damage potential of
different
radiation types (Table 1). It can be considered a less
fundamental
quantity than absorbed dose but it is useful for indicating the
health
risk of radiation exposure. Equivalent dose is still defined as
joules
per kilogram, but is assigned the SI unit Sievert (Sv). Figures
are
often quoted as milli-Sieverts (mSv) or micro-Sieverts (mSv).
The equation for equivalent dose is defined in Fig. 1.
Ionising radiation that forms part of the electromagnetic spec-
trum (e.g. X-ray and gamma ray) ionise atoms through the
photo-
electric absorption and the Compton effect. Both these
interactions
will eject an electron from an atom; this electron may ionise
many
more atoms. Since most of the affected atoms are ionised
indirectly
by the secondary electrons, photons are considered to be
indirectly
ionising.
Using the data in Table 1, it can be seen that an absorbed dose
of
1 mGy of X-ray photons results in an equivalent dose of 1 mSv,
i.e.
1 mGy � 1 (radiation weighting factor for X-ray photons),
where
1 mGy of alpha particles results in an equivalent dose of 20
mSv, i.e.
1 mGy � 20 (radiation weighting factor for alpha particles). In
other
words alpha particles have a higher risk to biological tissue.
Effective dose
Effective dose (represented by the symbol E) takes into account
the type and amount of exposed tissue. Different tissues within
the
body have difference sensitivities to radiation meaning a dose
applied to one area of the body can carry a higher risk than the
same dose applied to another. Effective dose takes the
equivalent
doses of a number of organs and through the application of a
tissue
weighting factor, the sum of these aims to provide a single
number
that is proportional to the detriment from a particular exposure.
It
allows comparisons of the risks associated with different
imaging
techniques or modalities.
The tissue weighting factors (Table 2) represent the sensitivity
of
their respective tissue, for example bone marrow is highly
sensitive
to radiation and so has a weighting factor of 0.12 where the
brain is
less sensitive and so has a weighting factor of 0.01. The sum of
the
tissue weighting factors is 1 and so the sum of the weighted
equivalent doses would provide a whole body effective dose.
Per-
forming this process for different techniques allows for a
compar-
ison of doses and an indication of the detriment of these.
Figure 1. Equation for calculating equivalent dose from
absorbed dose.1
Effective dose is still defined as joules per kilogram and also
has
the same SI unit as equivalent dose, Sievert (Sv, with figures
quoted
as milli-Sieverts (mSv) or micro-Sieverts (mSv)). The equation
for
calculating effective dose is shown in Fig. 2.
Controversies with effective dose
Effective dose is commonly used in medical imaging to compare
the risks from different modalities (for example, CT of the
cervical
spine versus conventional radiographic imaging of the same
anatomical area) or examinations that have differing dose distri-
butions (for example, comparison of effective dose from an
antero-
posterior hip to that from an antero-posterior shoulder). The
application of the tissue weighting factors to the equivalent
doses
of the organs provides the whole body effective dose from that
exposure. The application of effective dose is useful in these
situ-
ations as it provides referrers, practitioners and operators with
data
that allows them to make decisions during the referral,
justification
and optimisation of medical imaging procedures.2,3 When used
for
this purpose effective dose is a useful figure to use, however a
number of publications use this figure to calculate the risk of
the
exposure to an individual. As noted by a number of authors, and
the
ICRP themselves, the effective dose concept is not intended to
be
used this way as a number of factors are not taken into
consider-
ation.3e8
The tissue weighting factors are averaged over all ages and both
genders in the general population and so it cannot be applied to
an
individual patient.9 For example a measurement of organ doses
and
effective dose calculations from a chest radiograph could be the
same in a 15-year-old and a 35-year-old female. Using data pub-
lished by Wall et al.9 the lifetime risk of cancer incidence for
breast
tissue in 10e19 year olds of 3.34% per Gray and 30e39 year olds
of
1.44% per Gray it can be seen that the risk to female breast in
10e19
Figure 2. Equation for the calculation of effective dose.1
Table 3
Comparison of the tissue weighting factors form ICRP
publications 26, 60 and
103.1,12,13
Organs Tissue weighting factors
ICRP 26
(1977)12
ICRP 60
(1990)13
ICRP 103
(2007)1
Gonads 0.25 0.20 0.08
Red bone marrow 0.12 0.12 0.12
Colon e 0.12 0.12
Lung 0.12 0.12 0.12
Stomach e 0.12 0.12
Breasts 0.15 0.05 0.12
Bladder e 0.05 0.04
Liver e 0.05 0.04
Thyroid 0.03 0.05 0.04
Skin e 0.01 0.01
Bone surface 0.03 0.01 0.01
Salivary glands e e 0.01
Brain e e 0.01
Remainder 0.03 0.05 0.12
Total 1.00 1.00 1.00
Table 4
Life time risks of cancer incidence for males and females by
organ and age for a Euro-
American population (% per Gy).
Organ (male) Age at exposure (y)
0e9 10e19 20e29 30e39 40e49 50e59 60e69
Lung 0.65 0.69 0.73 0.78 0.80 0.76 0.61
Stomach 0.93 0.73 0.57 0.43 0.31 0.20 0.12
Colon 1.49 1.22 0.98 0.79 0.60 0.43 0.25
Red bone marrow 1.06 1.05 0.77 0.76 0.78 0.65 0.49
Bladder 0.89 0.76 0.65 0.55 0.46 0.35 0.23
Liver 0.56 0.44 0.34 0.26 0.18 0.12 0.07
Thyroid 0.18 0.10 0.05 0.03 0.01 0.01 0.00
Oesophagus 0.12 0.11 0.11 0.11 0.12 0.14 0.15
Organ (female) Age at exposure (y)
0e9 10e19 20e29 30e39 40e49 50e59 60e69
Breast 4.92 3.34 2.21 1.44 0.84 0.45 0.21
Lung 1.36 1.46 1.58 1.70 1.78 1.72 1.39
Stomach 1.45 1.14 0.88 0.67 0.48 0.33 0.20
Colon 0.73 0.59 0.48 0.38 0.29 0.21 0.14
Red bone marrow 0.48 0.48 0.50 0.45 0.77 0.49 0.29
Bladder 0.70 0.61 0.52 0.45 0.39 0.32 0.24
Liver 0.24 0.19 0.15 0.11 0.08 0.06 0.03
Thyroid 0.92 0.52 0.26 0.13 0.06 0.02 0.01
Oesophagus 0.10 0.09 0.10 0.12 0.15 0.21 0.28
A. Tootell et al. / Radiography 20 (2014) 323e332 325
year old is higher. This difference in sensitivity due to age and
gender is not captured within conventional effective dose
calculations.
The tissue weighting factors published by the ICRP are derived
using data that is assessed and analysed by The United Nations
Scientific Committee on the Effects of Atomic Radiation
(UNSCEAR)
on cancer risks from follow-up studies of the Japanese atomic
bomb
survivors.10 As a result of these on going long-term studies the
tissue weighting factors have undergone a number of revisions
as
new data on cancer incidence has been collected.11 The effect
of
these revisions can be seen in Table 3.
From Table 3, it can be seen that weightings assigned to the
gonads have undergone significant changes over the three publi-
cations, from 0.25 in ICRP 26 to 0.08 in ICRP 103 that is a
reflection
of the understanding of heritable risk and the change in breast
tissue changed from 0.05 in 1990 to 0.12 in 2007 due to a
decision
by the ICRP committee to put more emphasis on cancer
incidence
rather than mortality.4e6 Brenner, in a number of publications,
suggests that these tissue weighting factors represent a
subjective
balance between the different stochastic endpoints of cancer
inci-
dence, cancer mortality, life shortening and hereditary risk. This
subjectivity is an example of the “flaws in the science” behind
the
derivation of these factors.4e6 However, Dietze11 argues that
this
revision was in response to the publication of more reliable
cancer
incidence data published by UNSCEAR10 rather than a change
in the
committee’s emphasis. Whatever the reason, it is clear that
these
revisions do have an impact on effective dose calculations
making
comparisons to older data difficult.
Lifetime risk of cancer induction
It is with these criticisms in mind that Brenner proposes an
alternative to effective dose that can be applied to individual
Figure 3. Equation for calculating effective risk.2e4
patients - this is referred to by Brenner as “effective risk”.
Effective
risk considers the life time risk of cancer induction from an
absorbed dose of radiation and the equation for this is shown in
Fig. 3.4
This equation is very similar to that used to calculate effective
dose. It is proposed that the tissue weighting factors are
replaced
with organ-specific radiation-induced cancer risk, such as those
published by The Nuclear and Radiation Studies Board14 or
more
recently by Wall et al.9 (a selection of data is shown in Table
4).
The lifetime risk figures (Table 4) are calculated from stronger
data as they are based directly on epidemiological studies and
not
decided by committee.10,14 The organ-specific radiation-
induced
risk data reflects current knowledge in the biological effects of
ra-
diation. The results would be easier to interpret (for example x
per
1,000,000) for medical imaging professionals and non-medical
imaging professionals too. The lifetime risk can be used to pro-
vide risk to different genders and age groups.
Conveying risk to patients is arguably one of the more chal-
lenging aspects the radiography profession has to contend with.
To
this end, Wall suggests using a category based approach to
convey
the risk from the radiological examination (Table 5).9
Prior to any analysis of risk, dose data has to be collected. Dose
data can be measured or estimated. In medical imaging either
method can be used to determine dose data in most situations,
although there could be occasions where only one method is
suitable.
Modelling dose
Mathematical modelling of dose using commercially available
software is relatively quick and easy. Software is available that
Table 5
Four broad risk bands for the typical total lifetime cancer risk
for patients.9
Category Total lifetime cancer risk
Negligible risk Less than 1 in a million
Minimal risk 1 in a million to 1 in 100,000
Very low risk 1 in 100,000 to 1 in 10,000
Low risk 1 in 10,000 to 1 in 1000
A. Tootell et al. / Radiography 20 (2014) 323e332326
allows for organ and effective dose values for conventional
radio-
graphic techniques and CT imaging to be estimated. The
software
employs Monte Carlo modelling which is a mathematical
technique
that simulates as closely as possible the real interactions
suffered by
photons.
The process involves the computer simulation of an anthropo-
morphic phantom being exposed to a large number of photons of
varying energies emitted from a point source. The path of each
photon is followed through a sequence of interaction points and
subsequent energy losses and outgoing directions (through
coherent scattering or Compton scattering). This chain of in-
teractions forms a so-called photon history. At each interaction
point the energy deposited to the organ is calculated and used in
the dose calculation. A large number of independent random
photon histories are generated and estimates of the mean values
of
the energy depositions in the various organs are used for calcu-
lating the dose in these organs Eventually, the photon loses
suffi-
cient energy to allow photoelectric absorption to occur.15,16
PCXMC (STUUK, Helsinki, Finland16,17) is one such
programme
that allows for organ and effective dose to be estimated in many
conventional radiographic techniques. Fig. 4 illustrates the
posi-
tioning of a PA chest with landscape orientation of the image
re-
ceptor. Other parameters can be manipulated in the software
including X-ray anode angle, tube filtration material and
thickness
to obtain final dose estimates.
Figure 4. Example of data entry page of PCXMC for the calculat
Dose modelling software is also available for CT dose estima-
tions. For example, ImPact’s CT Dosimetry Tool (ImPact, Lon-
don18,19) software simulation allows for quick and easy
calculation
of organ and effective dose through the use of Monte Carlo data
for
normalised organ doses. However, as can be seen in Fig. 5,
results
are dependent on selecting the imaging parameters and CT
model
as calculations take into account specific features of each CT
unit
(e.g. radiation quality and field geometry).20 Selection of the
correct
scanner may not always be possible as new technology and
systems
are constantly being introduced. These systems are currently not
included in dose simulation software meaning that dose
simulation
has to rely on “best fitting” the attributes of these scanners to
those
of a similar design. As noted by Groves et al.,21 this introduces
the
potential for significant error in the estimated doses. Automatic
mA
manipulation by the scanners can also lead to error as the
software
only allows a single value to be used.
Underestimation of CT doses using computer simulation is
frequently reported with magnitudes between 18 and
40%.5,12,13
Reasons for these underestimations have been explained by the
differences in the physical dosimetry phantoms and the virtual
phantoms used by dose modelling software. Close examination
of
this highlights the simplified geometric shapes of the organs.
Subsequently, as can be seen in Fig. 6, in CT examinations of
the
chest the CT virtual phantom suggests that the liver is not
exposed
to primary X-ray beam and thus the calculated liver dose would
be
ion of organ and effective dose from a PA chest radiograph.
Figure 5. Example of the dose report generated by ImPact CT
Dosimetry software.
A. Tootell et al. / Radiography 20 (2014) 323e332 327
low. In reality a significant volume of this organ is included in
the
scan and so will contribute to the effective dose calculations.
However, accuracy of CT dose modelling can be improved by
careful selection of the scan range to match the fractions of
organs
irradiated and to include overbeaming and overranging that is a
feature of helical scanning. The use of an average mAs for the
scan
parameters will further improve the accuracy of the dose
calculations.22
Figure 6. Comparison of the virtual phantom in ImPact CT
dosimetry software and ATOM dosimetry phantom.
Figure 7. Typical arrangement of the phantom and pencil beam
ionisation chamber
used to collect CTDI.
A. Tootell et al. / Radiography 20 (2014) 323e332328
Measuring dose
There are many tools which may be used to measure the dose
absorbed during a radiographic procedure that will allow dose
to be
calculated. The one that most operators will be familiar with is
the
dose area product (DAP) meter. DAP combines two quantities e
as
its name suggests absorbed dose in air and the field size giving
the
unit Gray centimetre squared Gycm2 (or cGycm2 or mGycm2)
(NB
not Gray per square centimetre). DAP meters are mounted onto
the
X-ray tube in front of the collimators making readings easy to
ac-
quire, however it is important to note that DAP is not patient
dose
per se.23 It is independent of the distance between the source
and
the patient meaning that if this figure is to be used to estimate
patient dose the source to patient distance, the field size and the
location of the area exposed are required.24
CT acquisitions have similar values that are often used as a
reference for patient dose; the computed tomography dose index
(CTDI) and dose length product (DLP). The CTDI measurement
was
based on an axial CT scanner and was defined as the dose from
the
primary beam plus scatter from surrounding slices from a single
slice in an acrylic phantom (Fig. 7). Phantoms come in two di-
ameters, 16 cm and 32 cm, to represent the head and body
respectively.25
Developments in technology and the advent of multislice CT
equipment lead to variations in CTDI. CTDI100 reflects the
dose
contribution from a 100 mm range (50 mm either side of the
reference slice). The weighted CTDI (CTDIw) reflects the
weighted
sum of two-thirds the peripheral dose and one-third the central
dose in a 100 mm range. The most commonly quoted CTDI
value in
modern CT technology is the volume CTDI (CTDIvol). This
value is
obtained by dividing CTDIw by the beam pitch factor.
22,26 As before
CTDI in any form is not patient dose but a quantification of the
radiation output of the CT system so does not take into account
differing patient sizes and area of the body that is being
imaged.27
A derivative of CTDI is dose length product (DLP). This figure
takes into account the length of the scan and is calculated by
multiplying the CTDIvol by the length of the scan. In a similar
way to
CTDI and CTDIvol, DLP is not patient dose as it does not take
into
account what part of the body is being exposed, the size of the
patient, or the patient’s age.
Conversion of DLP to patient dose is possible using a
conversion
coefficient (k) shown in (Table 6). This conversion factor is
defined
as the effective dose per dose-length product and has the unit
mSv/
mGy cm. Multiplying the DLP by the relevant conversion factor
gives a value for effective dose.
Criticisms of k state that the factors are based on old
technology
and old data; they are based on several scanners that were in use
circa 1990 and the tissue weighting factors used in their
calculation
are from ICRP 60.13,26,28 There are also a number of
assumptions
made that would increase the error in the calculated effective
dose.
For example, the patient is assumed to be standard, and as noted
by
McCollough et al.,27 this standard patient is a little thin by
today’s
Table 6
Normalised values of effective dose per dose-length product
(DLP) over various body
regions.
Region of the body Normalised effective dose
(E/DLP) (mSv/mGycm
Head 0.0023
Neck 0.0054
Chest 0.017
Abdomen 0.015
Pelvis 0.019
Figure 9. Lower thoracic slices of a paediatric phantom showing
different density
resin for the lung, soft tissue and bone with locations for
dosimeters. These dosimeters
can be electronic (shown here by the two wires inserted into the
phantom) or
analogue such as thermoluminescent dosimeters.29
A. Tootell et al. / Radiography 20 (2014) 323e332 329
standards (nominal body mass of 70 kg). Variation in the way
CT
scanners report CTDIvol for paediatric patients can make
compari-
son difficult. Some use the 16 cm phantom while others use the
32 cm phantom. For example Siemens, Philips dose reports are
based on a 32 cm phantom, Toshiba reports are based on 16 cm
phantom and GE reports use the 16 cm or 32 cm depending on
the
scan field of view. CTDIvol can differ by a factor of
approximately 2.5
between the two diameter phantoms.27
True measurement of dose using digital or analogue dosimeters
such as metal oxide semi-conductor field effect transistor
(MOS-
FET) or thermoluminescent dosimeters (TLDs) (described later)
can
be done in a number of ways. In the experimental setting it is
possible to measure organ dose by placing dosimeters in a
specially
designed anthropomorphic phantom. These phantoms are avail-
able in a range of patient types; male and female and paediatric,
adolescent and adult (Fig. 8). They are made up of contiguous
slices
with different tissues represented by different densities of
epoxy
resin. The resin has attenuation properties that are equivalent to
real tissue. Within the slices are locations for placing
dosimeters
that will provide data of organ dose (Fig. 9). Using these
phantoms
allows the researcher to carry out experimentation on different
techniques, exposure factors or positioning to optimise dose
without the involvement of real patients.
Figure 8. The CIRS ATOM dosimetry phantom fami
It is obviously impossible to directly measure organ dose in the
clinical setting, so the entrance surface dose (ESD) can be used.
ESD
is defined as the absorbed dose in the skin at a given location
on the
patient and also includes backscattered radiation from the
patient.
As a measurement it can be combined with DAP to allow
calcula-
tions of patient dose to be made.
Dosimeters
ESD and organ dose in the anthropomorphic phantom can be
measured using a digital dosimeter or using thermoluminescent
ly models 701e706 (CIRS, Norfolk, Virginia).29
A. Tootell et al. / Radiography 20 (2014) 323e332330
dosimeters (TLD). Most medical imaging personnel will be
familiar
with TLDs in the context of radiation protection as they are
frequently used in personal dosimeter badges. TLDs are
available in
a variety of forms, from powder to square or circular chips,
rods,
cubes and in a range of materials.
Thermoluminescence (illustrated in Fig. 10) uses the atomic
model of two energy bands; the valence band and conduction
band.
Within the valance band electrons are bound to individual atoms
as
opposed to the conduction band where electrons can move
freely
within the atomic lattice. Separating these two bands is an area
that
is referred to as the forbidden gap in which no electron state can
exist. The impurities mentioned above create electron traps
within
this gap. Exposure to ionising radiation excites electrons
allowing
them to move up to the conduction band leaving holes within
the
valence band. Electrons can travel amongst the crystal lattice
until
either the electron can cross back towards the valence band and
recombine with a hole or, if near a defect, it can fall into the
energy
trap. The electron is now prevented from filling a hole within
the
valance band until it can gain enough energy to once again
reach
the conduction band before moving back to the valance band.
This
stimulation is in this context accomplished by introducing
heat.30
The movement of the electron back to the valance band requires
the electron to lose energy. This energy is released in the form
of
visible light and this light is detected by a photomultiplier tube.
The
charge (measured in Coulombs [C]) generated from this
component
is measured.
Conduc on
Valance Band
TLD
TLD readout
Thermal s mula on
Conduc on
Valance BandTLD
Exposure to radia on
Conduc on
Valance Band
TLD
Storage
Emission of light
Figure 10. Illustration of the process involved in TLD
dosimetry.
The choice of material depends on the nature of radiation; in
diagnostic and therapeutic energies the chemical composition of
the dosimeters is either lithium fluoride with magnesium and ti-
tanium impurities added or lithium fluoride with magnesium,
copper and phosphorus impurities added.31 The difference in
the
materials affects their sensitivity and the measurement range the
TLD is capable of. For example TLDs made from Calcium
Fluoride
Dypromsium are suitable for environmental monitoring and as
capable of detecting doses of between 0.1 pGy and 1 Gy.32
Lithium
Fluoride with magnesium and titanium are suitable for medical
physics dosimetry applications and operate at doses between
10 pGy and 10 Gy.33
Conversion from charge to dose involves a calibration process.
The TLD or batches of TLDs plus scattering material and a
digital
dosimeter are exposed to a range of exposures at energy (kV)
consistent with the experiment that will be performed. The
charge
generated from the reading process and the doses recorded by
digital dosimeter are used to establish the calibration factor
through linear regression. An example of calibration data using
is
shown in Fig. 11.
General radiographic equipment can be used in this process
although some TLD readers will perform calibration using
sealed
sources of gamma emitting isotopes such as Strontium-90 or
Yttrium-90. Such systems will calibrate each TLD individually
rather than in batches increasing the accuracy of the final
readings.
The response of the TLDs is energy dependent therefore
calibration
should be performed at the energy that will be used in the
research
or measurements. If this cannot be done then energy conversion
factors can be used but this can introduce error.34
One of the disadvantages of the TLD is the time needed to pre-
pare and setup and process them. A typical whole body adult
phantom measurement for calculation of effective dose involves
the use of 268 individual TLDs. Reading this number using a
manual
Figure 11. Example of calibration data for TLDs at 80 kV.
Plotting data from table (a)
results in graph (b) and shows the linear relationship between
the charge generated
from reading the TLD to dose. The gradient of this line is the
calibration factor.
Figure 12. A MOSFET dosimeter with an array of five
dosimeters connected to the
module.36
A. Tootell et al. / Radiography 20 (2014) 323e332 331
TLD reader equates to approximately 6 h of work.35 Research
has
been undertaken to follow the dental radiography dosimetry pro-
cess to reduce the number of TLD required for effective dose
measurement however, if comparison of organ dose and risk is
to
be carried out it has been shown that a measurement organ dose
is
required for all critical organs.35
An alternative to TLDs is the digital dosimeter. An example of
this is the metal oxide semi-conductor field effect transistor
(MOSFET) (Best Medical Canada, Ontario, Canada) (Fig. 12).
Exposure of the digital dosimeter results in a voltage shift
between the components of the dosimeter. This difference is
measured and is proportional to the dose absorbed by the de-
tector. However, it is unlikely that the total number of digital
dosimeters would be available to allow measurement of all
critical
organs in one exposure due to expense of the dosimeters.
Therefore a number of repeated measurements with the dosim-
eter relocated between each would be required. As with TLDs,
MOSFET dosimeters require calibration and their response is
en-
ergy dependent meaning separate calibrations are required if a
significant difference in beam energies is to be used in any
research37
Measurements using TLD or digital dosimeters have their ad-
vantages and disadvantages relating to preparation time,
acquisi-
tion time processing following exposure, and cost. These have
to be
considered when planning research that involves the direct mea-
surement of dose form exposure to ionising radiation.21,35,38
Summary
This article has given insight into terms and concepts associated
with dose measurement and modelling, as well as risk
estimation.
Some limitations and values of dose estimation and
measurement
methods have been considered. As support for this special issue
the
reader should have gained enough background and insight into
Monte Carlo mathematical dose modelling to be able to
appreciate
some of the empirical articles. Beyond the special issue we
antici-
pate that the article could serve as a teaching or CPD aid for
personnel working in medical imaging.
Conflict of interest statement
None.
References
1. ICRP. The 2007 recommendations of the ICRP, in ICRP
publication 103. Ann
ICRP; 2007:2e4.
2. The ionising radiation (medical exposure) regulations, United
Kingdom; 2000.
3. Oritz P. The use of effective dose in medicine. In: The
second international
symposium on the system of radiological protection. United
Arab Emirates: ICRP;
2013.
4. Brenner DJ. Effective dose: a flawed concept that could and
should be replaced.
Br J Radiology 2008;81(967):521e3.
5. Brenner DJ. Effective dose e a flawed concept that could and
should be replaced.
Washington, DC: International Commission on Radiological
Protection; 2011.
6. Brenner DJ. We can do better than effective dose for
estimating or comparing
low-dose radiation risks. Ann ICRP 2012;41(3, 4):124e8.
7. Harrison J. The use of effective dose. In: The second
international symposium on
the system of radiological protection. United Arab Emirates:
ICRP; 2013.
8. Martin CJ. Effective dose: how should it be applied to
medical exposures? Br J
Radiology 2007;80(956):639e47.
9. Wall BF, Haylock R, Jansen JTM, Hillier MC, Hart D,
Shrimpton PC. Radiation
risks from medical X-ray examinations as a function of the age
and sex of the
patient. Rep HPA-CRCE-028. Chilton: Health Protection
Agency; 2011.
10. United Nations. Scientific committee on the effects of
atomic radiation, effects of
ionizing radiation: United Nations Scientific Committee on the
effects of atomic
radiation e UNSCEAR 2006 report, volume II e report to the
General Assembly,
with scientific Annexes C, D, and E. UN; 2009.
11. Dietze G, Harrison JD, Menzel HG. Effective dose: a flawed
concept that could
and should be replaced. Comments on a paper by D J Brenner
(Br J Radiol
2008;81:521e3). Br J Radiology 2009;82(976):348e51.
12. ICRP. Recommendations of the ICRP. ICRP Publication 26
Ann ICRP; 1977:3.
13. ICRP. 1990 Recommendations of the ICRP. ICRP
Publication 60 Ann ICRP; 1991:
1e3.
14. Committee to Assess Health Risks from Exposure to Low
Levels of Ionizing
Radiation, Nuclear and Radiation Studies Board Division on
Earth and Life
Studies, and National Research Council of the National
Academies, Health Risks
From Exposure to Low Levels of Ionizing Radiation: BEIR VII
Phase 2,Wash-
ington, DC; 2006.
15. Baker C. Physicist toolbox e basics of Monte Carlo
simulation of radiation trans-
port. Liverpool: United Kingdom Radiological Congress; 2013.
16. Tapiovaara M, Siiskonen T. In: PCXMC: a Monte Carlo
program for calculating pa-
tient doses in medical X-ray examinations. 2nd ed. Helsinki,
Finland: STUK; 2008.
17. Tapiovaara M, Lakkisto M, Servomaa A. PCXMC 2.0
rotation dose calculations.
Helsinki, Finland: STUK; 2012.
18. ImPACT. Imaging performance assessment of CT scanners.
Available from:
http://www.impactscan.org [cited 22.04.2012].
19. ImPACT. CT patient dosimetry calculator. London: Medical
Devices Agency;
2003.
20. Hashemi-Malayeri BJ, Williams JR. A practical approach
for the assessment of
patient doses from CT examinations; 2003. Available from:
www.dundee.ac.
uk/medphys/documents/hashemi.pdf [cited 10.01.2012].
21. Groves AM, Owen KE, Courtney HM, Yates SJ, Goldstone
KE, Blake GM, et al. 16-
Detector multislice CT: dosimetry estimation by TLD
measurement compared
with Monte Carlo simulation. Br J Radiol 2004;77(920):662e5.
22. Castellano E. CT dose calculations for individual patients e
what you should
know. In 12th CT users group, London; 2010.
23. Conference of radiation control program directors
committee on quality
assurance in diagnostic X-ray, dose-area product (DAP), in Q.A.
collectible,
Frankfort; 2001 [reviewed and republished 2008].
24. Moores BM. Radiation dose measurement and optimization.
Br J Radiology
2005;78(933):866e8.
25. Coursey C, Frush D. CT and radiation: what radiologists
should know. Appl
Radiol 2008;37(3):22e9.
26. McNitt-Gray M. Assessing radiation dose: how to do it
right, in 2011 AAPM CT
dose summit, Denver; 2011.
27. McCollough CH, Leng S, Yu L, Cody DD, Boone JM,
McNitt-Gray MF. CT dose
Index and patient dose: they are not the same thing. Radiology
2011;259(2):
311e6.
28. European Commission, EUR 16262 EN. European guidelines
for quality criteria
for computed tomography. Luxembourg: European Commission;
1999.
29. CIRS tissue simulation and phantom technology. Dosimetry
verification
phantoms model 701e706 data sheet; 2012. Available from:
http://www.
cirsinc.com/file/Products/701_706/701_706_DS.pdf [cited
19.01.2012].
30. Stabin MG. Radiation protection and dosimetry: an
introduction to health physics.
Springer; 2007.
31. Bilski P. Lithium fluoride: from LiF:Mg,Ti to LiF:Mg,Cu,P.
Radiat Prot Dosim
2002;100(1e4):199e205.
32. TLD-200� thermoluminescent dosimmeter.
ThermoScientific; 2014. Available from:
http://www.thermoscientific.com/en/product/tld-200-
thermoluminescent-
dosimetry-material.html [cited 29.04.2014].
33. TLD-100� thermoluminescent dosimetry material.
ThermoScientific;2014. Available
from: http://www.thermoscientific.com/en/product/tld-100-
thermoluminescent-
dosimetry-material.html [cited 29.04.2014].
34. Podgor�sak EB, International Atomic Energy Agency.
Radiation oncology physics:
a handbook for teachers and students. International Atomic
Energy Agency;
2005.
http://refhub.elsevier.com/S1078-8174(14)00056-X/sref1
http://refhub.elsevier.com/S1078-8174(14)00056-X/sref2
http://refhub.elsevier.com/S1078-8174(14)00056-X/sref3
http://refhub.elsevier.com/S1078-8174(14)00056-X/sref4
http://refhub.elsevier.com/S1078-8174(14)00056-X/sref5
http://refhub.elsevier.com/S1078-8174(14)00056-X/sref6
http://refhub.elsevier.com/S1078-8174(14)00056-X/sref7
http://refhub.elsevier.com/S1078-8174(14)00056-X/sref8
http://refhub.elsevier.com/S1078-8174(14)00056-X/sref9
http://refhub.elsevier.com/S1078-8174(14)00056-X/sref10
http://refhub.elsevier.com/S1078-8174(14)00056-X/sref11
http://refhub.elsevier.com/S1078-8174(14)00056-X/sref12
http://refhub.elsevier.com/S1078-8174(14)00056-X/sref13
http://refhub.elsevier.com/S1078-8174(14)00056-X/sref14
http://refhub.elsevier.com/S1078-8174(14)00056-X/sref15
http://www.impactscan.org
http://refhub.elsevier.com/S1078-8174(14)00056-X/sref16
http://www.dundee.ac.uk/medphys/documents/hashemi.pdf
http://refhub.elsevier.com/S1078-8174(14)00056-X/sref17
ThompsonEtal2013.pdfAccurate localization of incidental fi.docx

More Related Content

Similar to ThompsonEtal2013.pdfAccurate localization of incidental fi.docx

Austin Journal of Radiation Oncology and Cancer
Austin Journal of Radiation Oncology and CancerAustin Journal of Radiation Oncology and Cancer
Austin Journal of Radiation Oncology and CancerAustin Publishing Group
 
Topic -Analysis of Patients specific Quality Assurance of IMRT/VMAT
Topic -Analysis of Patients specific Quality Assurance of IMRT/VMATTopic -Analysis of Patients specific Quality Assurance of IMRT/VMAT
Topic -Analysis of Patients specific Quality Assurance of IMRT/VMATRajeev Kumar Pandit
 
Ecr2011 c 0603 (1)
Ecr2011 c 0603 (1)Ecr2011 c 0603 (1)
Ecr2011 c 0603 (1)Zain Abdeen
 
An Enhanced ILD Diagnosis Method using DWT
An Enhanced ILD Diagnosis Method using DWTAn Enhanced ILD Diagnosis Method using DWT
An Enhanced ILD Diagnosis Method using DWTIOSR Journals
 
i.a.Preoperative ovarian cancer diagnosis using neuro fuzzy approach
i.a.Preoperative ovarian cancer diagnosis using neuro fuzzy approachi.a.Preoperative ovarian cancer diagnosis using neuro fuzzy approach
i.a.Preoperative ovarian cancer diagnosis using neuro fuzzy approachJonathan Josue Cid Galiot
 
Comparative dosimetry of forward and inverse treatment planning for Intensity...
Comparative dosimetry of forward and inverse treatment planning for Intensity...Comparative dosimetry of forward and inverse treatment planning for Intensity...
Comparative dosimetry of forward and inverse treatment planning for Intensity...iosrjce
 
E-book Thesis Sara Carvalho
E-book Thesis  Sara CarvalhoE-book Thesis  Sara Carvalho
E-book Thesis Sara CarvalhoSara Carvalho
 
An approach for cross-modality guided quality enhancement of liver image
An approach for cross-modality guided quality enhancement of  liver imageAn approach for cross-modality guided quality enhancement of  liver image
An approach for cross-modality guided quality enhancement of liver imageIJECEIAES
 
Bartlett et al Radiother Oncol 2014
Bartlett et al Radiother Oncol 2014Bartlett et al Radiother Oncol 2014
Bartlett et al Radiother Oncol 2014Freddie Bartlett
 
Poster - STIR vs FAT SAT_1009_2015 (1) (1)
Poster - STIR vs  FAT SAT_1009_2015 (1) (1)Poster - STIR vs  FAT SAT_1009_2015 (1) (1)
Poster - STIR vs FAT SAT_1009_2015 (1) (1)Louise Meincke
 
Neutrosophic sets and fuzzy c means clustering for improving ct liver image s...
Neutrosophic sets and fuzzy c means clustering for improving ct liver image s...Neutrosophic sets and fuzzy c means clustering for improving ct liver image s...
Neutrosophic sets and fuzzy c means clustering for improving ct liver image s...Aboul Ella Hassanien
 
On Dose Reduction and View Number
On Dose Reduction and View NumberOn Dose Reduction and View Number
On Dose Reduction and View NumberKaijie Lu
 
The Advantages of Two Dimensional Techniques (2D) in Pituitary Adenoma Treatment
The Advantages of Two Dimensional Techniques (2D) in Pituitary Adenoma TreatmentThe Advantages of Two Dimensional Techniques (2D) in Pituitary Adenoma Treatment
The Advantages of Two Dimensional Techniques (2D) in Pituitary Adenoma TreatmentIOSR Journals
 
L'ecografia nella BPCO: l'effetto dell'ostruzione delle vie aeree sull'escurs...
L'ecografia nella BPCO: l'effetto dell'ostruzione delle vie aeree sull'escurs...L'ecografia nella BPCO: l'effetto dell'ostruzione delle vie aeree sull'escurs...
L'ecografia nella BPCO: l'effetto dell'ostruzione delle vie aeree sull'escurs...Paj Ero
 
DonatiF_PhDThesisPresentation
DonatiF_PhDThesisPresentationDonatiF_PhDThesisPresentation
DonatiF_PhDThesisPresentationFabrizio Donati
 
Individually Optimized Contrast-Enhanced 4D-CT for Radiotherapy Simulation in...
Individually Optimized Contrast-Enhanced 4D-CT for Radiotherapy Simulation in...Individually Optimized Contrast-Enhanced 4D-CT for Radiotherapy Simulation in...
Individually Optimized Contrast-Enhanced 4D-CT for Radiotherapy Simulation in...Wookjin Choi
 

Similar to ThompsonEtal2013.pdfAccurate localization of incidental fi.docx (20)

Austin Journal of Radiation Oncology and Cancer
Austin Journal of Radiation Oncology and CancerAustin Journal of Radiation Oncology and Cancer
Austin Journal of Radiation Oncology and Cancer
 
Topic -Analysis of Patients specific Quality Assurance of IMRT/VMAT
Topic -Analysis of Patients specific Quality Assurance of IMRT/VMATTopic -Analysis of Patients specific Quality Assurance of IMRT/VMAT
Topic -Analysis of Patients specific Quality Assurance of IMRT/VMAT
 
IGRT APP.pdf
IGRT APP.pdfIGRT APP.pdf
IGRT APP.pdf
 
Ecr2011 c 0603 (1)
Ecr2011 c 0603 (1)Ecr2011 c 0603 (1)
Ecr2011 c 0603 (1)
 
An Enhanced ILD Diagnosis Method using DWT
An Enhanced ILD Diagnosis Method using DWTAn Enhanced ILD Diagnosis Method using DWT
An Enhanced ILD Diagnosis Method using DWT
 
Tomo modulation
Tomo modulationTomo modulation
Tomo modulation
 
i.a.Preoperative ovarian cancer diagnosis using neuro fuzzy approach
i.a.Preoperative ovarian cancer diagnosis using neuro fuzzy approachi.a.Preoperative ovarian cancer diagnosis using neuro fuzzy approach
i.a.Preoperative ovarian cancer diagnosis using neuro fuzzy approach
 
Comparative dosimetry of forward and inverse treatment planning for Intensity...
Comparative dosimetry of forward and inverse treatment planning for Intensity...Comparative dosimetry of forward and inverse treatment planning for Intensity...
Comparative dosimetry of forward and inverse treatment planning for Intensity...
 
E-book Thesis Sara Carvalho
E-book Thesis  Sara CarvalhoE-book Thesis  Sara Carvalho
E-book Thesis Sara Carvalho
 
An approach for cross-modality guided quality enhancement of liver image
An approach for cross-modality guided quality enhancement of  liver imageAn approach for cross-modality guided quality enhancement of  liver image
An approach for cross-modality guided quality enhancement of liver image
 
Bartlett et al Radiother Oncol 2014
Bartlett et al Radiother Oncol 2014Bartlett et al Radiother Oncol 2014
Bartlett et al Radiother Oncol 2014
 
Poster - STIR vs FAT SAT_1009_2015 (1) (1)
Poster - STIR vs  FAT SAT_1009_2015 (1) (1)Poster - STIR vs  FAT SAT_1009_2015 (1) (1)
Poster - STIR vs FAT SAT_1009_2015 (1) (1)
 
Neutrosophic sets and fuzzy c means clustering for improving ct liver image s...
Neutrosophic sets and fuzzy c means clustering for improving ct liver image s...Neutrosophic sets and fuzzy c means clustering for improving ct liver image s...
Neutrosophic sets and fuzzy c means clustering for improving ct liver image s...
 
On Dose Reduction and View Number
On Dose Reduction and View NumberOn Dose Reduction and View Number
On Dose Reduction and View Number
 
reliablepaper.pdf
reliablepaper.pdfreliablepaper.pdf
reliablepaper.pdf
 
The Advantages of Two Dimensional Techniques (2D) in Pituitary Adenoma Treatment
The Advantages of Two Dimensional Techniques (2D) in Pituitary Adenoma TreatmentThe Advantages of Two Dimensional Techniques (2D) in Pituitary Adenoma Treatment
The Advantages of Two Dimensional Techniques (2D) in Pituitary Adenoma Treatment
 
Korte-PachymetryACT13
Korte-PachymetryACT13Korte-PachymetryACT13
Korte-PachymetryACT13
 
L'ecografia nella BPCO: l'effetto dell'ostruzione delle vie aeree sull'escurs...
L'ecografia nella BPCO: l'effetto dell'ostruzione delle vie aeree sull'escurs...L'ecografia nella BPCO: l'effetto dell'ostruzione delle vie aeree sull'escurs...
L'ecografia nella BPCO: l'effetto dell'ostruzione delle vie aeree sull'escurs...
 
DonatiF_PhDThesisPresentation
DonatiF_PhDThesisPresentationDonatiF_PhDThesisPresentation
DonatiF_PhDThesisPresentation
 
Individually Optimized Contrast-Enhanced 4D-CT for Radiotherapy Simulation in...
Individually Optimized Contrast-Enhanced 4D-CT for Radiotherapy Simulation in...Individually Optimized Contrast-Enhanced 4D-CT for Radiotherapy Simulation in...
Individually Optimized Contrast-Enhanced 4D-CT for Radiotherapy Simulation in...
 

More from herthalearmont

TNEEL-NE Theoretical Perspectives Learning Activ.docx
TNEEL-NE Theoretical Perspectives   Learning Activ.docxTNEEL-NE Theoretical Perspectives   Learning Activ.docx
TNEEL-NE Theoretical Perspectives Learning Activ.docxherthalearmont
 
To Board of Directors of Reed Elsevier Plc.From Report.docx
To       Board of Directors of Reed Elsevier Plc.From   Report.docxTo       Board of Directors of Reed Elsevier Plc.From   Report.docx
To Board of Directors of Reed Elsevier Plc.From Report.docxherthalearmont
 
TMGT 361Assignment VII A InstructionsLectureEssayControl Ch.docx
TMGT 361Assignment VII A InstructionsLectureEssayControl Ch.docxTMGT 361Assignment VII A InstructionsLectureEssayControl Ch.docx
TMGT 361Assignment VII A InstructionsLectureEssayControl Ch.docxherthalearmont
 
TitleHOW DIVERSITY WORKS. AuthorsPhillips, Katherine W.1.docx
TitleHOW DIVERSITY WORKS. AuthorsPhillips, Katherine W.1.docxTitleHOW DIVERSITY WORKS. AuthorsPhillips, Katherine W.1.docx
TitleHOW DIVERSITY WORKS. AuthorsPhillips, Katherine W.1.docxherthalearmont
 
TitleAuthorSetting.docx
TitleAuthorSetting.docxTitleAuthorSetting.docx
TitleAuthorSetting.docxherthalearmont
 
TitleAJS504 Week 1 AssignmentName of StudentI.docx
TitleAJS504 Week 1 AssignmentName of StudentI.docxTitleAJS504 Week 1 AssignmentName of StudentI.docx
TitleAJS504 Week 1 AssignmentName of StudentI.docxherthalearmont
 
TitleABC123 Version X1Working in Diverse GroupsPSY.docx
TitleABC123 Version X1Working in Diverse GroupsPSY.docxTitleABC123 Version X1Working in Diverse GroupsPSY.docx
TitleABC123 Version X1Working in Diverse GroupsPSY.docxherthalearmont
 
TitleBUS-FP3061 – Fundamentals of AccountingRatioYear .docx
TitleBUS-FP3061 – Fundamentals of AccountingRatioYear .docxTitleBUS-FP3061 – Fundamentals of AccountingRatioYear .docx
TitleBUS-FP3061 – Fundamentals of AccountingRatioYear .docxherthalearmont
 
TitleAuthorsSourceDocument TypeSubject Terms.docx
TitleAuthorsSourceDocument TypeSubject Terms.docxTitleAuthorsSourceDocument TypeSubject Terms.docx
TitleAuthorsSourceDocument TypeSubject Terms.docxherthalearmont
 
TitleABC123 Version X1Week Two Assignment Worksheet.docx
TitleABC123 Version X1Week Two Assignment Worksheet.docxTitleABC123 Version X1Week Two Assignment Worksheet.docx
TitleABC123 Version X1Week Two Assignment Worksheet.docxherthalearmont
 
TitleABC123 Version X1Weekly Overview Week FourHCS.docx
TitleABC123 Version X1Weekly Overview Week FourHCS.docxTitleABC123 Version X1Weekly Overview Week FourHCS.docx
TitleABC123 Version X1Weekly Overview Week FourHCS.docxherthalearmont
 
TitleABC123 Version X1Week One Assignment Worksheet.docx
TitleABC123 Version X1Week One Assignment Worksheet.docxTitleABC123 Version X1Week One Assignment Worksheet.docx
TitleABC123 Version X1Week One Assignment Worksheet.docxherthalearmont
 
TitleABC123 Version X1Week 4 Practice Worksheet.docx
TitleABC123 Version X1Week 4 Practice Worksheet.docxTitleABC123 Version X1Week 4 Practice Worksheet.docx
TitleABC123 Version X1Week 4 Practice Worksheet.docxherthalearmont
 
TitleABC123 Version X1Workplace Safety Plan Worksheet.docx
TitleABC123 Version X1Workplace Safety Plan Worksheet.docxTitleABC123 Version X1Workplace Safety Plan Worksheet.docx
TitleABC123 Version X1Workplace Safety Plan Worksheet.docxherthalearmont
 
TitleABC123 Version X1Week 4 Practice Worksheet PSY.docx
TitleABC123 Version X1Week 4 Practice Worksheet PSY.docxTitleABC123 Version X1Week 4 Practice Worksheet PSY.docx
TitleABC123 Version X1Week 4 Practice Worksheet PSY.docxherthalearmont
 
TMGT 361Assignment V InstructionsLectureEssayStatistics 001.docx
TMGT 361Assignment V InstructionsLectureEssayStatistics 001.docxTMGT 361Assignment V InstructionsLectureEssayStatistics 001.docx
TMGT 361Assignment V InstructionsLectureEssayStatistics 001.docxherthalearmont
 
TL3127 Creativity & Innovation in Organisations – 201718Assig.docx
TL3127 Creativity & Innovation in Organisations – 201718Assig.docxTL3127 Creativity & Innovation in Organisations – 201718Assig.docx
TL3127 Creativity & Innovation in Organisations – 201718Assig.docxherthalearmont
 
Title The Ship of LoveDate ca. 1500Period RenaissanceRela.docx
Title The Ship of LoveDate ca. 1500Period RenaissanceRela.docxTitle The Ship of LoveDate ca. 1500Period RenaissanceRela.docx
Title The Ship of LoveDate ca. 1500Period RenaissanceRela.docxherthalearmont
 
TitleABC123 Version X1Week 1 Practice WorksheetPSY.docx
TitleABC123 Version X1Week 1 Practice WorksheetPSY.docxTitleABC123 Version X1Week 1 Practice WorksheetPSY.docx
TitleABC123 Version X1Week 1 Practice WorksheetPSY.docxherthalearmont
 
TitleCollapseTop of FormTotal views 3 (Your views 1)Ar.docx
TitleCollapseTop of FormTotal views 3 (Your views 1)Ar.docxTitleCollapseTop of FormTotal views 3 (Your views 1)Ar.docx
TitleCollapseTop of FormTotal views 3 (Your views 1)Ar.docxherthalearmont
 

More from herthalearmont (20)

TNEEL-NE Theoretical Perspectives Learning Activ.docx
TNEEL-NE Theoretical Perspectives   Learning Activ.docxTNEEL-NE Theoretical Perspectives   Learning Activ.docx
TNEEL-NE Theoretical Perspectives Learning Activ.docx
 
To Board of Directors of Reed Elsevier Plc.From Report.docx
To       Board of Directors of Reed Elsevier Plc.From   Report.docxTo       Board of Directors of Reed Elsevier Plc.From   Report.docx
To Board of Directors of Reed Elsevier Plc.From Report.docx
 
TMGT 361Assignment VII A InstructionsLectureEssayControl Ch.docx
TMGT 361Assignment VII A InstructionsLectureEssayControl Ch.docxTMGT 361Assignment VII A InstructionsLectureEssayControl Ch.docx
TMGT 361Assignment VII A InstructionsLectureEssayControl Ch.docx
 
TitleHOW DIVERSITY WORKS. AuthorsPhillips, Katherine W.1.docx
TitleHOW DIVERSITY WORKS. AuthorsPhillips, Katherine W.1.docxTitleHOW DIVERSITY WORKS. AuthorsPhillips, Katherine W.1.docx
TitleHOW DIVERSITY WORKS. AuthorsPhillips, Katherine W.1.docx
 
TitleAuthorSetting.docx
TitleAuthorSetting.docxTitleAuthorSetting.docx
TitleAuthorSetting.docx
 
TitleAJS504 Week 1 AssignmentName of StudentI.docx
TitleAJS504 Week 1 AssignmentName of StudentI.docxTitleAJS504 Week 1 AssignmentName of StudentI.docx
TitleAJS504 Week 1 AssignmentName of StudentI.docx
 
TitleABC123 Version X1Working in Diverse GroupsPSY.docx
TitleABC123 Version X1Working in Diverse GroupsPSY.docxTitleABC123 Version X1Working in Diverse GroupsPSY.docx
TitleABC123 Version X1Working in Diverse GroupsPSY.docx
 
TitleBUS-FP3061 – Fundamentals of AccountingRatioYear .docx
TitleBUS-FP3061 – Fundamentals of AccountingRatioYear .docxTitleBUS-FP3061 – Fundamentals of AccountingRatioYear .docx
TitleBUS-FP3061 – Fundamentals of AccountingRatioYear .docx
 
TitleAuthorsSourceDocument TypeSubject Terms.docx
TitleAuthorsSourceDocument TypeSubject Terms.docxTitleAuthorsSourceDocument TypeSubject Terms.docx
TitleAuthorsSourceDocument TypeSubject Terms.docx
 
TitleABC123 Version X1Week Two Assignment Worksheet.docx
TitleABC123 Version X1Week Two Assignment Worksheet.docxTitleABC123 Version X1Week Two Assignment Worksheet.docx
TitleABC123 Version X1Week Two Assignment Worksheet.docx
 
TitleABC123 Version X1Weekly Overview Week FourHCS.docx
TitleABC123 Version X1Weekly Overview Week FourHCS.docxTitleABC123 Version X1Weekly Overview Week FourHCS.docx
TitleABC123 Version X1Weekly Overview Week FourHCS.docx
 
TitleABC123 Version X1Week One Assignment Worksheet.docx
TitleABC123 Version X1Week One Assignment Worksheet.docxTitleABC123 Version X1Week One Assignment Worksheet.docx
TitleABC123 Version X1Week One Assignment Worksheet.docx
 
TitleABC123 Version X1Week 4 Practice Worksheet.docx
TitleABC123 Version X1Week 4 Practice Worksheet.docxTitleABC123 Version X1Week 4 Practice Worksheet.docx
TitleABC123 Version X1Week 4 Practice Worksheet.docx
 
TitleABC123 Version X1Workplace Safety Plan Worksheet.docx
TitleABC123 Version X1Workplace Safety Plan Worksheet.docxTitleABC123 Version X1Workplace Safety Plan Worksheet.docx
TitleABC123 Version X1Workplace Safety Plan Worksheet.docx
 
TitleABC123 Version X1Week 4 Practice Worksheet PSY.docx
TitleABC123 Version X1Week 4 Practice Worksheet PSY.docxTitleABC123 Version X1Week 4 Practice Worksheet PSY.docx
TitleABC123 Version X1Week 4 Practice Worksheet PSY.docx
 
TMGT 361Assignment V InstructionsLectureEssayStatistics 001.docx
TMGT 361Assignment V InstructionsLectureEssayStatistics 001.docxTMGT 361Assignment V InstructionsLectureEssayStatistics 001.docx
TMGT 361Assignment V InstructionsLectureEssayStatistics 001.docx
 
TL3127 Creativity & Innovation in Organisations – 201718Assig.docx
TL3127 Creativity & Innovation in Organisations – 201718Assig.docxTL3127 Creativity & Innovation in Organisations – 201718Assig.docx
TL3127 Creativity & Innovation in Organisations – 201718Assig.docx
 
Title The Ship of LoveDate ca. 1500Period RenaissanceRela.docx
Title The Ship of LoveDate ca. 1500Period RenaissanceRela.docxTitle The Ship of LoveDate ca. 1500Period RenaissanceRela.docx
Title The Ship of LoveDate ca. 1500Period RenaissanceRela.docx
 
TitleABC123 Version X1Week 1 Practice WorksheetPSY.docx
TitleABC123 Version X1Week 1 Practice WorksheetPSY.docxTitleABC123 Version X1Week 1 Practice WorksheetPSY.docx
TitleABC123 Version X1Week 1 Practice WorksheetPSY.docx
 
TitleCollapseTop of FormTotal views 3 (Your views 1)Ar.docx
TitleCollapseTop of FormTotal views 3 (Your views 1)Ar.docxTitleCollapseTop of FormTotal views 3 (Your views 1)Ar.docx
TitleCollapseTop of FormTotal views 3 (Your views 1)Ar.docx
 

Recently uploaded

How to Create Map Views in the Odoo 17 ERP
How to Create Map Views in the Odoo 17 ERPHow to Create Map Views in the Odoo 17 ERP
How to Create Map Views in the Odoo 17 ERPCeline George
 
Basic_QTL_Marker-assisted_Selection_Sourabh.ppt
Basic_QTL_Marker-assisted_Selection_Sourabh.pptBasic_QTL_Marker-assisted_Selection_Sourabh.ppt
Basic_QTL_Marker-assisted_Selection_Sourabh.pptSourabh Kumar
 
Phrasal Verbs.XXXXXXXXXXXXXXXXXXXXXXXXXX
Phrasal Verbs.XXXXXXXXXXXXXXXXXXXXXXXXXXPhrasal Verbs.XXXXXXXXXXXXXXXXXXXXXXXXXX
Phrasal Verbs.XXXXXXXXXXXXXXXXXXXXXXXXXXMIRIAMSALINAS13
 
Synthetic Fiber Construction in lab .pptx
Synthetic Fiber Construction in lab .pptxSynthetic Fiber Construction in lab .pptx
Synthetic Fiber Construction in lab .pptxPavel ( NSTU)
 
Fish and Chips - have they had their chips
Fish and Chips - have they had their chipsFish and Chips - have they had their chips
Fish and Chips - have they had their chipsGeoBlogs
 
GIÁO ÁN DẠY THÊM (KẾ HOẠCH BÀI BUỔI 2) - TIẾNG ANH 8 GLOBAL SUCCESS (2 CỘT) N...
GIÁO ÁN DẠY THÊM (KẾ HOẠCH BÀI BUỔI 2) - TIẾNG ANH 8 GLOBAL SUCCESS (2 CỘT) N...GIÁO ÁN DẠY THÊM (KẾ HOẠCH BÀI BUỔI 2) - TIẾNG ANH 8 GLOBAL SUCCESS (2 CỘT) N...
GIÁO ÁN DẠY THÊM (KẾ HOẠCH BÀI BUỔI 2) - TIẾNG ANH 8 GLOBAL SUCCESS (2 CỘT) N...Nguyen Thanh Tu Collection
 
Industrial Training Report- AKTU Industrial Training Report
Industrial Training Report- AKTU Industrial Training ReportIndustrial Training Report- AKTU Industrial Training Report
Industrial Training Report- AKTU Industrial Training ReportAvinash Rai
 
The Art Pastor's Guide to Sabbath | Steve Thomason
The Art Pastor's Guide to Sabbath | Steve ThomasonThe Art Pastor's Guide to Sabbath | Steve Thomason
The Art Pastor's Guide to Sabbath | Steve ThomasonSteve Thomason
 
aaaaaaaaaaaaaaaaaaaaaaaaaaaaaaaaaaaaaaaaaaaaaaaaaaaaaaa
aaaaaaaaaaaaaaaaaaaaaaaaaaaaaaaaaaaaaaaaaaaaaaaaaaaaaaaaaaaaaaaaaaaaaaaaaaaaaaaaaaaaaaaaaaaaaaaaaaaaaaaaaaaaaa
aaaaaaaaaaaaaaaaaaaaaaaaaaaaaaaaaaaaaaaaaaaaaaaaaaaaaaasiemaillard
 
Palestine last event orientationfvgnh .pptx
Palestine last event orientationfvgnh .pptxPalestine last event orientationfvgnh .pptx
Palestine last event orientationfvgnh .pptxRaedMohamed3
 
How to Break the cycle of negative Thoughts
How to Break the cycle of negative ThoughtsHow to Break the cycle of negative Thoughts
How to Break the cycle of negative ThoughtsCol Mukteshwar Prasad
 
[GDSC YCCE] Build with AI Online Presentation
[GDSC YCCE] Build with AI Online Presentation[GDSC YCCE] Build with AI Online Presentation
[GDSC YCCE] Build with AI Online PresentationGDSCYCCE
 
INU_CAPSTONEDESIGN_비밀번호486_업로드용 발표자료.pdf
INU_CAPSTONEDESIGN_비밀번호486_업로드용 발표자료.pdfINU_CAPSTONEDESIGN_비밀번호486_업로드용 발표자료.pdf
INU_CAPSTONEDESIGN_비밀번호486_업로드용 발표자료.pdfbu07226
 
Basic Civil Engineering Notes of Chapter-6, Topic- Ecosystem, Biodiversity G...
Basic Civil Engineering Notes of Chapter-6,  Topic- Ecosystem, Biodiversity G...Basic Civil Engineering Notes of Chapter-6,  Topic- Ecosystem, Biodiversity G...
Basic Civil Engineering Notes of Chapter-6, Topic- Ecosystem, Biodiversity G...Denish Jangid
 
NLC-2024-Orientation-for-RO-SDO (1).pptx
NLC-2024-Orientation-for-RO-SDO (1).pptxNLC-2024-Orientation-for-RO-SDO (1).pptx
NLC-2024-Orientation-for-RO-SDO (1).pptxssuserbdd3e8
 
Gyanartha SciBizTech Quiz slideshare.pptx
Gyanartha SciBizTech Quiz slideshare.pptxGyanartha SciBizTech Quiz slideshare.pptx
Gyanartha SciBizTech Quiz slideshare.pptxShibin Azad
 
Benefits and Challenges of Using Open Educational Resources
Benefits and Challenges of Using Open Educational ResourcesBenefits and Challenges of Using Open Educational Resources
Benefits and Challenges of Using Open Educational Resourcesdimpy50
 
UNIT – IV_PCI Complaints: Complaints and evaluation of complaints, Handling o...
UNIT – IV_PCI Complaints: Complaints and evaluation of complaints, Handling o...UNIT – IV_PCI Complaints: Complaints and evaluation of complaints, Handling o...
UNIT – IV_PCI Complaints: Complaints and evaluation of complaints, Handling o...Sayali Powar
 
PART A. Introduction to Costumer Service
PART A. Introduction to Costumer ServicePART A. Introduction to Costumer Service
PART A. Introduction to Costumer ServicePedroFerreira53928
 

Recently uploaded (20)

How to Create Map Views in the Odoo 17 ERP
How to Create Map Views in the Odoo 17 ERPHow to Create Map Views in the Odoo 17 ERP
How to Create Map Views in the Odoo 17 ERP
 
Basic_QTL_Marker-assisted_Selection_Sourabh.ppt
Basic_QTL_Marker-assisted_Selection_Sourabh.pptBasic_QTL_Marker-assisted_Selection_Sourabh.ppt
Basic_QTL_Marker-assisted_Selection_Sourabh.ppt
 
Phrasal Verbs.XXXXXXXXXXXXXXXXXXXXXXXXXX
Phrasal Verbs.XXXXXXXXXXXXXXXXXXXXXXXXXXPhrasal Verbs.XXXXXXXXXXXXXXXXXXXXXXXXXX
Phrasal Verbs.XXXXXXXXXXXXXXXXXXXXXXXXXX
 
NCERT Solutions Power Sharing Class 10 Notes pdf
NCERT Solutions Power Sharing Class 10 Notes pdfNCERT Solutions Power Sharing Class 10 Notes pdf
NCERT Solutions Power Sharing Class 10 Notes pdf
 
Synthetic Fiber Construction in lab .pptx
Synthetic Fiber Construction in lab .pptxSynthetic Fiber Construction in lab .pptx
Synthetic Fiber Construction in lab .pptx
 
Fish and Chips - have they had their chips
Fish and Chips - have they had their chipsFish and Chips - have they had their chips
Fish and Chips - have they had their chips
 
GIÁO ÁN DẠY THÊM (KẾ HOẠCH BÀI BUỔI 2) - TIẾNG ANH 8 GLOBAL SUCCESS (2 CỘT) N...
GIÁO ÁN DẠY THÊM (KẾ HOẠCH BÀI BUỔI 2) - TIẾNG ANH 8 GLOBAL SUCCESS (2 CỘT) N...GIÁO ÁN DẠY THÊM (KẾ HOẠCH BÀI BUỔI 2) - TIẾNG ANH 8 GLOBAL SUCCESS (2 CỘT) N...
GIÁO ÁN DẠY THÊM (KẾ HOẠCH BÀI BUỔI 2) - TIẾNG ANH 8 GLOBAL SUCCESS (2 CỘT) N...
 
Industrial Training Report- AKTU Industrial Training Report
Industrial Training Report- AKTU Industrial Training ReportIndustrial Training Report- AKTU Industrial Training Report
Industrial Training Report- AKTU Industrial Training Report
 
The Art Pastor's Guide to Sabbath | Steve Thomason
The Art Pastor's Guide to Sabbath | Steve ThomasonThe Art Pastor's Guide to Sabbath | Steve Thomason
The Art Pastor's Guide to Sabbath | Steve Thomason
 
aaaaaaaaaaaaaaaaaaaaaaaaaaaaaaaaaaaaaaaaaaaaaaaaaaaaaaa
aaaaaaaaaaaaaaaaaaaaaaaaaaaaaaaaaaaaaaaaaaaaaaaaaaaaaaaaaaaaaaaaaaaaaaaaaaaaaaaaaaaaaaaaaaaaaaaaaaaaaaaaaaaaaa
aaaaaaaaaaaaaaaaaaaaaaaaaaaaaaaaaaaaaaaaaaaaaaaaaaaaaaa
 
Palestine last event orientationfvgnh .pptx
Palestine last event orientationfvgnh .pptxPalestine last event orientationfvgnh .pptx
Palestine last event orientationfvgnh .pptx
 
How to Break the cycle of negative Thoughts
How to Break the cycle of negative ThoughtsHow to Break the cycle of negative Thoughts
How to Break the cycle of negative Thoughts
 
[GDSC YCCE] Build with AI Online Presentation
[GDSC YCCE] Build with AI Online Presentation[GDSC YCCE] Build with AI Online Presentation
[GDSC YCCE] Build with AI Online Presentation
 
INU_CAPSTONEDESIGN_비밀번호486_업로드용 발표자료.pdf
INU_CAPSTONEDESIGN_비밀번호486_업로드용 발표자료.pdfINU_CAPSTONEDESIGN_비밀번호486_업로드용 발표자료.pdf
INU_CAPSTONEDESIGN_비밀번호486_업로드용 발표자료.pdf
 
Basic Civil Engineering Notes of Chapter-6, Topic- Ecosystem, Biodiversity G...
Basic Civil Engineering Notes of Chapter-6,  Topic- Ecosystem, Biodiversity G...Basic Civil Engineering Notes of Chapter-6,  Topic- Ecosystem, Biodiversity G...
Basic Civil Engineering Notes of Chapter-6, Topic- Ecosystem, Biodiversity G...
 
NLC-2024-Orientation-for-RO-SDO (1).pptx
NLC-2024-Orientation-for-RO-SDO (1).pptxNLC-2024-Orientation-for-RO-SDO (1).pptx
NLC-2024-Orientation-for-RO-SDO (1).pptx
 
Gyanartha SciBizTech Quiz slideshare.pptx
Gyanartha SciBizTech Quiz slideshare.pptxGyanartha SciBizTech Quiz slideshare.pptx
Gyanartha SciBizTech Quiz slideshare.pptx
 
Benefits and Challenges of Using Open Educational Resources
Benefits and Challenges of Using Open Educational ResourcesBenefits and Challenges of Using Open Educational Resources
Benefits and Challenges of Using Open Educational Resources
 
UNIT – IV_PCI Complaints: Complaints and evaluation of complaints, Handling o...
UNIT – IV_PCI Complaints: Complaints and evaluation of complaints, Handling o...UNIT – IV_PCI Complaints: Complaints and evaluation of complaints, Handling o...
UNIT – IV_PCI Complaints: Complaints and evaluation of complaints, Handling o...
 
PART A. Introduction to Costumer Service
PART A. Introduction to Costumer ServicePART A. Introduction to Costumer Service
PART A. Introduction to Costumer Service
 

ThompsonEtal2013.pdfAccurate localization of incidental fi.docx

  • 1. ThompsonEtal2013.pdf Accurate localization of incidental findings on the computed tomography attenuation correction image: the influence of tube current variation John Thompsona,c, Peter Hogga, Samantha Highamb and David Manninga,d This observer performance study assessed lesion detection in the computed tomography attenuation correction image, as would be produced for myocardial perfusion imaging over a tube current (mA) range. A static anthropomorphic chest phantom containing simulated pulmonary lesions was scanned using the four available mA values (1, 1.5, 2 and 2.5) on a GE Infinia Hawkeye 4. All other computed tomography acquisition parameters remained constant throughout. Twenty-seven cases showing zero to four lesions were produced for a free-response receiver-operating characteristic method. Image observations were completed using our novel
  • 2. web-based ROCView software under controlled conditions. The Jackknife alternative free-response receiver-operating characteristic (JAFROC) figure of merit was used for significance testing, wherein a difference in lesion detection performance was considered significant at P values less than 0.05. Twenty readers with varying computed tomography experience (0–24 years) evaluated 108 images using an ordinal scale to score confidence. The JAFROC analysis showed that there was no statistically significant difference in performance between mA values (P = 0.439) for this sample of observers. In conclusion, no significant difference in lesion detection performance was seen between the mA values. This suggests that there is no value in using anything other than the lowest mA value for the investigation of incidental extracardiac findings. Nucl Med Commun 34:180–184 �c 2013 Wolters Kluwer Health | Lippincott Williams & Wilkins. Nuclear Medicine Communications 2013, 34:180–184 Keywords: computed tomography acquisition parameters,
  • 3. dose optimization, free-response receiver-operating characteristic, tube current aUniversity of Salford, bPennine Acute Hospitals NHS Trust, Greater Manchester, cUniversity Hospitals of Morecambe Bay NHS Foundation Trust, Barrow-in-Furness and dLancaster University, Lancaster, UK Correspondence to John Thompson, BSc (Hons), MSc, Nuclear Medicine Department, Furness General Hospital, Dalton Lane, Barrow-in- Furness, Cumbria LA14 4LF, UK Tel: + 44 1229 870870 x54388; fax: + 44 1229 491036; e-mail: [email protected] Received 31 July 2012 Revised 28 September 2012 Accepted 29 October 2012 Introduction Computed tomography (CT) has improved the sensitivity and specificity of many nuclear medicine techniques through the provision of additional anatomic information or by providing a high-quality attenuation correction (AC) map [1,2]. The use of AC is strongly recommended in some patients undergoing certain procedures, most notably in those undergoing myocardial perfusion imaging [3,4]. Within this patient group there is also potential for the discovery of
  • 4. extracardiac pathology by examining the coincidentally produced computed tomography attenuation correction (CTAC) image [4,5]. The ethical and legal considerations of reviewing the CTAC image have been discussed previously [6] and it is known that some nuclear medicine centres routinely review these images to determine whether incidental chest pathology is present. To a similar end, it has also been suggested that the raw projection data from the single-photon emission computed tomography (SPECT) acquisition should be assessed for incidental cardiac and extracardiac findings as part of the clinical routine [7,8]. Variation in tube current has no impact on tissue attenuation values and Hounsfield units (HU) – the re- sultant attenuation maps are therefore largely independent of tube current (mA) [9–12]. However, the impact of varying mA on lesion detection is less clear and this deserves investigation because of the potential dose saving at lower mA values. A suitable approach to investigating
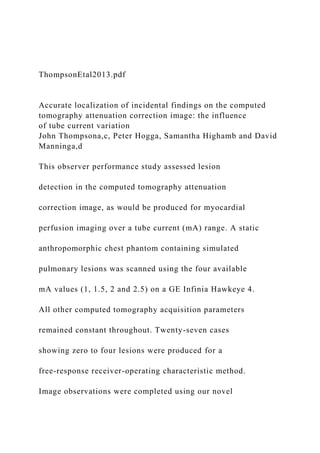
  • 5. this would be through visual performance assessment; previous visual performance phantom simulations have shown that lesion detection rates can be maintained at reduced tube currents [13]. This paper describes a free- response receiver-operating characteristic (FROC) investi- gation of the full clinical mA range available on the GE Infinia Hawkeye 4 SPECT/CT (GEH4) to establish the impact on lesion detection performance within an anthro- pomorphic chest phantom. Materials and methods Computed tomography attenuation correction acquisitions/anthropomorphic phantom The four mA values available for clinical use (1.0, 1.5, 2.0 and 2.5) on the GEH4 (General Electric Medical Systems, Wisconsin, USA) were used to image a static anthropo- morphic chest phantom, which contained simulated pulmonary lesions [14] (Fig. 1). All other CT acquisition parameters remained constant (Table 1).The lesions
  • 6. simulated intrapulmonary pathology with diameters of 3, 5, 8, 10 and 12 mm at 630 – 800 and + 100 HU values. This gave good representation of described density ranges for Technical note 0143-3636 �c 2013 Wolters Kluwer Health | Lippincott Williams & Wilkins DOI: 10.1097/MNM.0b013e32835c0984 Copyright © Lippincott Williams & Wilkins. Unauthorized reproduction of this article is prohibited. mailto:[email protected] solid lesions (20–60 HU) [15–18] and ground-glass opacity lesions (– 850 to – 450 HU) [19,20]. The phantom and simulated lesion positions remained constant for the four mA image acquisitions, ensuring the production of a case- matched series of images suitable for FROC analysis. A prestudy and poststudy diagnostic-quality CT scan was acquired to ensure that no movement of simulated lesions had occurred. These diagnostic-quality images also acted as the FROC truth (gold standard/true lesion positions) to aid accurate localization on the CTAC images. Observers were
  • 7. blinded to these data. Free-response receiver-operating characteristic analysis The FROC methodology is a significant improvement over conventional receiver operating characteristic (ROC) tech- niques. ROC investigations simply demand an observer to determine whether an image contains lesions and assign a confidence (rating) score to the image. FROC methods allow observers to accurately localize multiple lesions within a single image, with all localizations individually scored. A proximity criterion, surrounding a lesion, is applied to resolve ambiguities in lesion detection (lesion or lesion mimic). This prevents nonlesion localizations (NL) from being classified as successful lesion localizations (LL) [21]; the methodology also allows multiple NL marks to be made on an image. Image display and response capture (IDRC) software, ROCView (Bury St Edmunds, UK) [22], was applied in this observer performance study
  • 8. to collect localization and confidence score (mark-rating pairs) data. Data were analysed using a Jackknife alternative free-response receiver-operating characteristic (JAFROC) analysis [23] using the JAFROC figure of merit (FOM) for optimal statistical power. A difference in lesion detection performance would be considered significant at P values less than 0.05. Twenty observers with varying CT experience (0–24 years, mean 4.25±6.78 years) performed the ROCview lesion detection study. They assessed case-matched images [15 normal and 12 abnormal cases for each mA value (FROC modality); 108 images in total] showing 17 simulated pulmonary lesions. Observers were aware of the case mix and the range of simulated pulmonary lesions per image (0–4). Observers were able to make up to six localizations per image, allowing opportunity for both LL and NL in all images. Observers were instructed to locate only the simulated pulmonary lesions and to ignore all other
  • 9. coincidental mimics of pathology that the phantom may produce. Viewing conditions and study controls The TG-18 test card (American Association of Physicists in Medicine, College Park, Maryland, USA) [24,25] was used to ensure the quality of the reporting standard monitor used for displaying the images on ROCView. The monitor was calibrated according to local clinical speci- fications with ambient lighting dimmed and constant for all observers. The influence of observer familiarity with CT image adjustment (zooming/windowing) was negated, as image adjustment was not permitted in this FROC study. Consequently, the only variable was the mA value used. ROCview automatically randomized and displayed images on a CT lung window (width 1500, level – 500). Dose recordings The GEH4 provides the computed tomography dose index (CTDIvol) as an indication of the dose received.
  • 10. The effective mAs was calculated and the effective dose (E) estimated using a chest-specific conversion factor (0.014 mSv/mGy/cm) following a previously described method [26]. Quality control – Hounsfield unit accuracy Conventional CT indicates that HU variation is in the magnitude of less than 1 HU for a variation in mA [9]. This was assessed on the GEH4 using the American College of Radiologists CT Accreditation Phantom [27]. Fig. 1 A high-resolution computed tomography image of the phantom showing a + 100 HU simulated lesion (white arrow) in the right lung field to demonstrate the clinical value of the images used in this study. Table 1 GE Infinia Hawkeye 4 SPECT/CT acquisition parameters (controls) 140 kVp,1.9 pitch, acquired slice thickness 4�5 mm, slice reconstruction 6.1 mm, slice interval 3.4 mm, scan length 394.4 mm, scan FOV 565.65 mm, display FOV 435 mm, pixel size 2.89 mm2, 2.0 rpm (L-mode), matrix size
  • 11. 256�256 FOV, field of view; SPECT/CT, single-photon emission computed tomography/ computed tomography. Lesion localisation: influence of mA Thompson et al. 181 Copyright © Lippincott Williams & Wilkins. Unauthorized reproduction of this article is prohibited. The average pixel value of a 200 mm 2 region of interest was recorded for five modules of known density. HU value accuracy is required for AC as they are converted to attenuation coefficients at the energy of the SPECT radionuclide [2]. Results The JAFROC FOM revealed no significant difference in lesion detection performance for any of the mA values used (P = 0.826). Observer-averaged JAFROC FOM values can be found in Table 2 alongside the dose recordings and calculated E for each mA value. Individual observer performance was consistent between variations
  • 12. of mA with an intraobserver SD range of 0.01–0.11. Interobserver variation was also low for each mA setting (1 mA, SD = 0.08; 1.5 mA, SD = 0.09; 2.0 mA, SD = 0.10; 2.5 mA, SD = 0.13). E was calculated for full field of view (40 cm) CTAC acquisitions at each mA setting, estimat- ing a dose saving of 60% if using 1 mA instead of 2.5 mA. CT HU values measured in a DICOM viewer [28] showed negligible variation as a result of changing mA (Table 3). The greatest deviation was observed within the low-density regions of the phantom (Poly and Air), although this was still small in magnitude (change of 3 HU). The variation in image quality at the four mA values can be seen in Fig. 2. Discussion For the static anthropomorphic chest phantom represen- tative of a man weighing 70 kg there was no statistically significant difference in lesion detection for the four mA values. Although our experiment did not simulate respiratory motion, there is evidence to suggest that
  • 13. incidental extracardiac lesions could be detected equally well on images acquired at 1 mA as those acquired at 2.5 mA. This finding concurs with a previous patient- based study, in which a 1 mA attenuation map was acquired at rest and a 2.5 mA attenuation map was acquired at stress; both image sets revealed abnormal findings at a rate of 9.7% [12]. The patient-based study and our work both describe potential dose saving in the region of 60%. We have shown, through the acquisition of QC data, that HU accuracy is unaffected by mA in this SPECT/CT system (Table 3); therefore, the linear attenuation coefficients that make up the attenuation map must also be unaffected. This is suggestive of the quality of AC being maintained despite a reduced mA. Combining this information with the results of our JAFROC analysis suggests a potential for dose saving without any detri- mental effect on the primary outcome (good-quality AC)
  • 14. with respect to the CTAC acquisitions for this system or secondary outcome (detection of incidental chest pathol- ogy). The GEH4 offers image reconstruction filters that are optimized for low-dose operation, and this system can outperform diagnostic systems in terms of contrast-to- noise ratio, in the low-dose range, because of the filters in operation [29]. Consequently, it is possible that not all systems will respond to using a very low-dose regime. Our data provide insight into the potential for dose saving in patients undergoing myocardial perfusion SPECT/CT. However, some caution must be applied to the results because our work only considers a phantom representing ‘Standard Man’; there is an acknowledged gap between phantom studies and clinical work. In our (static) phantom study we did not set out to determine the effect of respiratory motion on lesion detection. Variation in respiratory motion can be significant, both within subjects and between them [30,31], but previous work comparing
  • 15. 2.5 mA attenuation maps at stress and 1 mA attenuation maps at rest saw equal detection rates (9.7%) of abnormal findings [12]. In this work the authors comment that the attenuation map, with a rotation time of 14 s, was sampled over approximately three respiratory cycles. Respiratory motion has been a persistent problem in hybrid imaging, affecting both emission and transmission acquisitions with errors of misregistration known to contribute to errors in AC [30,31]. Methods of correction, including respiratory gating, deep inspiration breath-hold, motion correction and postprocessing methods, have been discussed to correct for these errors [30]. Further, the phase of breathing (inspiration, midbreath, expira- tions) also has been found to have a significant bearing on AC [30,32]. Table 2 Dose recordings, calculations and free-response receiver-operating characteristic results for all variations of mA mA Effective mAs CTDI Estimated E (mSv) at 40 cm FOV JAFROC FOM (95% CI)
  • 16. 1.0 15.789 1.587 0.89 0.568 (0.507–0.630) 1.5 23.684 2.380 1.33 0.590 (0.538–0.642) 2.0 31.579 3.173 1.78 0.585 (0.528–0.641) 2.5 39.474 3.967 2.22 0.591 (0.523–0.659) CI, confidence interval; CTDI, computed tomography dose index; FOM, figure of merit; FOV, field of view; JAFROC, Jackknife alternative free-response receiver-operating characteristic. Table 3 Hounsfield unit accuracy at each mA value Water Poly Acrylic Bone Air True value (HU) 0 – 95 120 955 – 1000 mA 1.0 – 1 – 84 125 816 – 970 1.5 0 – 81 125 816 – 972 2.0 0 – 84 126 816 – 972 2.5 0 – 84 126 816 – 973 182 Nuclear Medicine Communications 2013, Vol 34 No 2 Copyright © Lippincott Williams & Wilkins. Unauthorized reproduction of this article is prohibited. Further phantom work should attempt to simulate motion over a range of respiratory amplitudes, with a previous patient study suggesting that lesion position and size can contribute to errors caused by respiratory motion [30].
  • 17. Investigating the effect of patient size might prove beneficial too. Conclusion Using a static anthropomorphic chest phantom with simulated lesions, the GEH4 can be used with equal confidence at each of its 4 mA settings for accurate LL on the CTAC image. Before conducting a human study, further phantom work should be carried out to consider the effect of respiratory motion and patient size on lesion detection. Acknowledgements The authors are grateful to Richard Lawson, Medical Physicist at Central Manchester University Hospitals NHS Foundation Trust, for clarification regarding CT acquisition parameters of hybrid systems. The authors thank Katy Szczepura, Medical Physicist and Senior Lecturer at The University of Salford, for discussion around CT scanner capability. The University of Cumbria kindly loaned the Lungman phantom.
  • 18. Conflicts of interest There are no conflicts of interest. References 1 Buck A, Nekolla S, Ziegler S, Beer A, Krause B, Herrmann K, et al. SPECT/ CT. J Nucl Med 2008; 49:1305–1319. 2 O’Connor M, Kemp B. Single-photon emission computed tomography/ computed tomography: basic instrumentation and innovations. Semin Nucl Med 2006; 36:258–266. 3 Heller G, Links J, Bateman T, Ziffer J, Ficaro E, Cohen M, Hendel R. American society of cardiology and society of nuclear medicine joint position: attenuation correction of myocardial perfusion SPECT scintigraphy. J Nucl Cardiol 2004; 11:229–230. 4 Flotats A, Knuuti J, Gutberlet M, Marcassa C, Bengel F, Kaufmann P, et al. Hybrid cardiac imaging: SPECT/CT and PET/CT. A joint position statement by the European Association of Nuclear Medicine (EANM), the European Society of Cardiac Radiology (ESCR) and the European Council of Nuclear Cardiology (ECNC) . Eur J Nucl Med Mol Imaging 2011; 38:201–212.
  • 19. 5 Goetze S, Pannu H, Wahl R. Clinically significant abnormal findings on the ‘nondiagnostic’ CT portion of low-amperage-CT attenuation- corrected myocardial perfusion SPECT/CT studies. J Nucl Med 2006; 47:1312–1318. Fig. 2 The anthropomorphic phantom scanned at each mA value, showing low-density spherical simulated lesions (white arrows) in the right lung (close to vertebra) and left lung (posteriorly). Clockwise from top left: 1, 1.5, 2 and 2.5 mA. Lesion localisation: influence of mA Thompson et al. 183 Copyright © Lippincott Williams & Wilkins. Unauthorized reproduction of this article is prohibited. 6 Tootell A, Vinjamuri S, Elias M, Hogg P. Clinical evaluation of the computed tomography attenuation correction map for myocardial perfusion imaging: the potential for incidental pathology detection. Nucl Med Commun 2012; 33:1122–1126. 7 Chamarthy M, Travin M. Altered biodistribution and incidental findings on myocardial perfusion imaging. Semin Nucl Med 2010; 40:257– 270. 8 Gedik G, Ergün E, Aslam M, Caner B. Unusual extracardiac
  • 20. findings detected on myocardial perfusion single photon emission computed tomography studies with Tc-99m sestamibi. Clin Nucl Med 2007; 32:920–926. 9 Birnbaum B, Hindman N, Lee J, Babb J. Multi-detector row CT attenuation measurements: assessment of intra- and interscanner variability with an anthropomorphic body CT phantom. Radiology 2007; 242:109– 119. 10 Reza Ay M, Zaidi H. Computed tomography-based attenuation correction in neurological positron emission tomography: evaluation of the effect of the X-ray tube voltage on quantitative analysis. Nucl Med Commun 2006; 27:339–346. 11 Kamel E, Hany T, Burger C, Treyer V, Lonn A, von Schulthess G, Buck A. CT vs 68Ge attenuation correction in a combined PET/CT system: evaluation of the effect of lowering the CT tube current. Eur J Nucl Med Mol Imaging 2002; 29:346–350. 12 Preuss R, Weiss R, Lindner O, Fricke E, Fricke H, Burchert W. Optimisation of protocol for low dose CT-derived attenuation correction in myocardial perfusion SPECT imaging. Eur J Nucl Med Mol Imaging 2008; 35:1133–1141.
  • 21. 13 Thompson J, Hogg P, Szczepura K, Manning D. Analysis of CT acquisition parameters suitable for use in SPECT/CT: a free-response receiver operating characteristic study. Radiography 2012; 18:238–243. 14 KyotoKagaku.com. Multipurpose Chest Phantom N1. Japan; 2011. Available at: http://www.kyotokagaku.com/products/detail03/pdf/ph- 1_catalog.pdf [Accessed 4 July 2012]. 15 Das M, Mühlenbruch G, Katoh M, Bakai A, Salganicoff M, Stanzel S, et al. Automated volumetry of solid pulmonary nodules in a phantom: accuracy across different CT scanner technologies. Invest Radiol 2007; 42:297–302. 16 Ko J, Rusinek H, Jacobs E, Babb J, Betke M, McGuinness G, Naidich D. Small pulmonary nodules: volume measurement at chest CT – phantom study. Radiology 2003; 228:864–870. 17 Marten K, Grabbe E. The challenge of the solitary pulmonary nodule: diagnostic assessment with multislice spiral CT. Clin Imaging 2003; 27:156–161. 18 Wormanns D, Kohl G, Klotz E, Marheine A, Beyer F, Heindel W, Diederich S. Volumetric measurements of pulmonary nodules at multi-row detector CT: in vivo reproducibility. Eur Radiol 2004; 14:86–92.
  • 22. 19 Oda S, Awai K, Murao K, Ozawa A, Yanaga Y, Kawanaka K, Yamashita Y. Computer-aided volumetry of pulmonary nodules exhibiting ground-glass opacity at MDCT. Am J Roentgenol 2010; 194:398–406. 20 Funama Y, Awai K, Liu D, Oda S, Yanaga Y, Nakaura T, et al. Detection of nodules showing ground-glass opacity in the lungs at low-dose multidetector computed tomography: phantom and clinical study. J Comput Assist Tomogr 2009; 33:49–53. 21 Devchakraborty.com. Philadelphia; 2011. Available at: http:// www.devchakraborty.com/Historical%20Background.html [Accessed 4 July 2012]. 22 Thompson J, Hogg P, Thompson S, Manning D, Szczepura K. ROCView: prototype software for data collection in Jackknife alternative free-response receiver operating characteristic analysis. Br J Radiol 2012; 85:1320–1326. 23 Devechakraborty.com. JAFROC 4.0.1. Philadelphia; 2012. Available at: http://www.devchakraborty.com/downloads [Accessed 4 July 2012]. 24 Samei E, Badano A, Chakraborty D, Compton K, Cornelius C, Corrigan K, et al. Assessment of display performance for medical imaging systems: report of the American Association of Physicists in Medicine
  • 23. (AAPM) Task Group 18. AAPM On-Line Report No. 3. Madison, WI: Medical Physics Publishing; 2005. 25 Deckard.mc.duke.edu. Assessment of Display Performance for Medical Imaging Systems (American Association of Physicists in Medicine (AAPM) Task Group 18); 10 January 2010. Available at: http://deckard.mc.duke.edu/ ˜samei/tg18 [Accessed 31 January 2012]. 26 Jessen K, Shrimpton P, Geleijns J, Panzer W, Tosi G. Dosimetry for optimisation of patient protection in computed tomography. Appl Radiat Isot 1999; 50:165–172. 27 Gammex.com. CT Accreditation Phantom Instructions (American College of Radiologists). Wisconsin; 2011. Available at: http://www.gammex.com/ acefiles/manuals/ACR_CT_Phantom.pdf [Accessed 11 July 2012]. 28 Rosset A, Spadola L, Ratib O. OsiriX: an open-source software for navigating in multidimensional DICOM images. J Digit Imaging 2004; 17:205–216. 29 Hamann M, Aldridge M, Dickson J, Endozo R, Lozhkin K, Hutton B. Evaluation of a low-dose/slow-rotating SPECT-CT system. Phys Med Biol
  • 24. 2008; 53:2495–2508. 30 Liu C, Pierce LA, Alessio AM, Kinahan PE. The impact of respiratory motion on tumor quantification and delineation in static PET/CT imaging. Phys Med Biol 2009; 54:7345–7362. 31 Dey J, Segars WP, Pretorius H, Walvick RP, Bruyant PP, Dahlberg S, King MA. Estimation and correction of cardiac respiratory motion in SPECT in the presence of limited-angle effects due to irregular respiration. Med Phys 2010; 37:6453–6465. 32 Koshino K, Fukushima K, Fukumoto M, Sasaki K, Moriguchi T, Hori Y, et al. Attenuation correction for quantitative cardiac SPECT. Eur J Nuc Med Mol Imaging Res 2012; 2:33. 184 Nuclear Medicine Communications 2013, Vol 34 No 2 Copyright © Lippincott Williams & Wilkins. Unauthorized reproduction of this article is prohibited. http://www.kyotokagaku.com/products/detail03/pdf/ph- 1_catalog.pdf http://www.devchakraborty.com/Historical%20Background.html http://www.devchakraborty.com/Historical%20Background.html http://www.devchakraborty.com/downloads http://deckard.mc.duke.edu/˜samei/tg18 http://deckard.mc.duke.edu/˜samei/tg18 http://www.gammex.com/acefiles/manuals/ACR_CT_Phantom.p df
  • 25. http://www.gammex.com/acefiles/manuals/ACR_CT_Phantom.p df PediatricDoseLimitationDuringCTscan.docx DOSE LIMITATION FOR PEDIATRIC DURING CT SCAN Dear This is my professor feedback, So I want to edit proposal as professor requests. Using patients would be an insurmountable barrier to ethical approval of the research. We would like you to consider a phantom based study. need to be more than a dose measuring exercise, you could look at using exposure. parameters that are outside the normal range (for example low kV), or mA modulation You could also consider image quality to see if the resulting image is still of diagnostic quality. Dose measurements/estimations could be used to establish the risk of cancer induction. We have attached several research articles published by our Research group that will help you to re-develop your proposal. And here my proposal A research proposal DOSE LIMITATION FOR PEDIATRIC DURING CT SCAN
  • 26. Introduction CT scan is an imaging modality which is being used widely in the field of medicine. It is mostly employed for the diagnostic purposes owing to the fact that it gives a detailed view of the different structures of the body. It divides the body into different cross sections, providing a detailed view of the internal structures and organs. Apart from diagnostic purposes, it is also being used for therapeutic purposes for therapeutic taps and drainage of accumulated fluid etc. in the body cavities. The basis of CT scan is the use of X-rays which form an image of the body using the computerized program to contrast a three dimensional image of the structures of the body based on the passage of x-rays through them. With the advances in the field of medicine and science, CT scan has secured the position of being an important diagnostic modality owing to the fact that it is a comparatively cheaper investigation, yielding a detailed view of the internal structures of the body, helping in the diagnosis and treatment of the patient and having wide range of applications. It is thus the most commonly advised investigation in cases where a diagnosis is difficult to be established. It is being used in the adult as well as the pediatric population. Due to the fact that the CT scan employs use of computed X-rays to construct the three dimensional images of the human body, the dose of the X-rays is a growing concern. The radiations an individual is exposed to during a single CT scan ranged from 10-20 mGy and can go up to 80 mGy if a specialized CT image is required. This amount of radiation is far greater than a routine X-ray. Exposing the pediatric population to such high doses of radiations is the concern behind this study.
  • 27. Literature review The basis of the CT scan and the method through which an image of the various structures of the body are obtained is through the use of X-rays which are used at different angles to obtain a three dimensional image. If the dose of the radiation is decreased to an absolutely a safe range for the pediatric population, the purpose of the CT scan won’t be fulfilled. The quality of the image would suffer tremendously and so the child would be subjected to the radiations for no good outcome. Thus a careful balance is required to be established between the comparatively safe dose of radiation and the dose which is required for optimal image production. This is how the dose limitation can be achieved in children (Zacharias et al., 2013). A study carried out to estimate the incidence of cancer among the individuals who were exposed to the ionizing radiation during a CT scan as children. They were assessed at later ages and it was seem that the children who were exposed to increased doses of radiations during CT scans, developed increased risk of developing cancer later in life. The children who were exposed to CT scans suffered from changes in their cells, leading to mutations which caused cancers. These changes were more dangerous among the pediatric age group because the cells were dividing at a higher pace as compared to the cellular division in older age groups (Miglioretti et al., 2013). The dose which is used in the CT scans also varies among the different CT machines. The latest equipment allows the technician to adjust the dose of the radiation before exposing an individual to unnecessary radiations. These devices are extremely beneficial in adjusting the pediatric dose of radiation according to the age of the patient because as the age of a child increases, the harmful effects of the radiations decrease. But this facility is not available in the old machines, most of which are used in the community hospitals and imaging centers. These facilities still use the same amount of radiations for every
  • 28. individual which is contributing to the increase in the incidence of increased pediatric cancers (Little, Grattan-Smith, & Johnson, 2016). The most beneficial method to decrease the exposure of high dose of ionizing radiations during a CT scan in a child is by the method called as “dose auditing”. This newly developed method is based on the principle of audit and requires that each dose of radiation which a person is exposed to should be audited against the benefits of that exposure. The benefits which are achieved from the exposure must outweigh the harmful effects of the dose of radiation which the child is exposed to. Aims/ hypothesis: The aim of this study is to assess the safe reduced dose of the radiation that a pediatric patient can be exposed to during a CT scan. This safe dose should decrease the harmful effects of X- rays exposure but still manage to provide the benefits of this diagnostic modality. Another aim of this study is to assess the detrimental effects which high dose radiations during CT scans have already caused in the pediatric population. Hypothesis: To assess the reduction in the dose of radiation in pediatric population and to assess the detrimental effects of high dose radiation CT scan in pediatric population Methods The study will be carried out as a randomized controlled study. The subjects selected for the study will be children from ages between 1-5 and another group form 6-10. The study will be carried out in two parts. The first part will require selection of children from the two groups of ages as mentioned above whose CT scan is planned. They will be divided in two groups, randomly. The group A will have low dose of radiation exposure and group B will have the standard pediatric dose exposure. The results of the CT scan films will be compared. As part two of the study, those people will be selected, randomly form the community who have been exposed to the radiations of CT scan as children. They will be categorized by
  • 29. the age at which they were exposed to radiations and their graph will also be plotted of the age at which they were exposed and the dose of radiation which was given to them. These individuals will also be questioned regarding any cancers they suffered from. The data will give the idea of the risk of development of cancer in individuals exposed to radiation as children. References Duong, P. & Little, B. (2014). Dose Tracking and Dose Auditing in a Comprehensive Computed Tomography Dose- Reduction Program. Seminars In Ultrasound, CT And MRI, 35(4), 322-330. http://dx.doi.org/10.1053/j.sult.2014.05.004 Little, S., Grattan-Smith, D., & Johnson, B. (2016). CT Radiation Dose Delivered by Community Hospitals and Imaging Centers. Children's Healthcare Of Atlanta. Retrieved from http://www.choa.org/Childrens-Hospital- Services/Radiology/~/media/CHOA/Documents/Services/Radiol ogy/Little-CT-dose-study.pdf Miglioretti, D., Johnson, E., Williams, A., Greenlee, R., Weinmann, S., & Solberg, L. et al. (2013). The Use of Computed Tomography in Pediatrics and the Associated Radiation Exposure and Estimated Cancer Risk. JAMA Pediatrics, 167(8), 700. http://dx.doi.org/10.1001/jamapediatrics.2013.311 Zacharias, C., Alessio, A., Otto, R., Iyer, R., Philips, G., Swanson, J., &Thapa, M. (2013). Pediatric CT: Strategies to Lower Radiation Dose. American Journal OfRoentgenology, 200(5), 950-956. http://dx.doi.org/10.2214/ajr.12.9026 ThompsonEtal2012bjr.pdf
  • 30. SHORT COMMUNICATION ROCView: prototype software for data collection in jackknife alternative free-response receiver operating characteristic analysis 1,2J THOMPSON, MSc, BSc(Hons), 2P HOGG, MPhil, FCR, 3S THOMPSON, MEng, 2,4D MANNING, PhD, DSc and 2K SZCZEPURA, MSc, DipIPEM 1Department of Nuclear Medicine, Furness General Hospital, Barrow-in-Furness, UK, 2Directorate of Radiography, University of Salford, Salford, UK, 3Independent Software Developer, and 4Division of Medicine, School of Health & Medicine, Lancaster University, Lancaster, UK ABSTRACT. ROCView has been developed as an image display and response capture (IDRC) solution to image display and consistent recording of reader responses in relation to the free-response receiver operating characteristic paradigm. A web-based solution to IDRC for observer response studies allows observations to be completed from any location, assuming that display performance and viewing conditions are consistent with the study being completed. The simplistic functionality of the software allows observations to be completed without supervision. ROCView can display images
  • 31. from multiple modalities, in a randomised order if required. Following registration, observers are prompted to begin their image evaluation. All data are recorded via mouse clicks, one to localise (mark) and one to score confidence (rate) using either an ordinal or continuous rating scale. Up to nine ‘‘mark-rating’’ pairs can be made per image. Unmarked images are given a default score of zero. Upon completion of the study, both true-positive and false-positive reports can be downloaded and adapted for analysis. ROCView has the potential to be a useful tool in the assessment of modality performance difference for a range of imaging methods. Received 11 September 2011 Revised 23 November 2011 Accepted 14 December 2011 DOI: 10.1259/bjr/99497945 ’ 2012 The British Institute of Radiology The success of an imaging technique should not be judged by physical measures, such as signal-to-noise ratio or contrast resolution, alone. Human observations must be considered because the reader is an integral part of the diagnostic process. For the latter, receiver operating characteristic (ROC) methods successfully quantify the combined performance of imaging techniques and readers [1].
  • 32. Traditional ROC analysis simply required readers to state whether they thought a case was normal or abnormal, using a rating scale to indicate decision confidence [2]. A notable development in ROC methodology has been the free- response ROC (FROC) method. Unlike ROC methods, FROC uses location information to resolve ambiguities in detection (lesion or lesion mimic) to prevent false identifica- tion of pathology, resulting in a true-positive result [3]. Jackknife alternative free-response ROC (JAFROC) methods [4] are the latest evolution of FROC methods in which multiple readers and modalities are compared with greater sensitivity to differences in performance from other ROC methods [5]. Table 1 lists the terms associated with JAFROC analysis. JAFROC methods demand a precise response from the reader, in which location and confidence information must be supplied for each lesion within a case [6]. This identification and scoring is typically referred to as a ‘‘mark-rating’’ pair [7]. Those setting up JAFROC studies are encouraged to allow mouse clicks to record reader responses and an acceptance radius around each area of pathology to classify each response as either a lesion localisation/true positive (LL/TP) or a non-lesion localisation/false positive (NL/FP) [8]. JAFROC methods can be valuable in the evaluation of different techniques in radiology. Like all observer performance studies, achieving optimal statistical power can require a large number of readers and cases [9, 10], and a 50:50 ratio of normal and abnormal cases [11]. However, JAFROC methods achieve greater statistical power than ROC for the same combination of readers and cases [7]. This in turn requires a reliable method of
  • 33. image display and response capture (IDRC). All ROC methods require accurate data recording; ROCView is proposed as a computer-based solution to accurate IDRC in JAFROC analysis—the current end point of the free- response paradigm. Why develop ROCView? A recent study of dose optimisation in CT [12] prompted investigation into a reliable solution for Address correspondence to: Mr John Thompson, Nuclear Medicine Department, Furness General Hospital, Dalton Lane, Barrow-in- Furness LA14 4LF, UK. E-mail: [email protected] The British Journal of Radiology, 85 (2012), 1320–1326 1320 The British Journal of Radiology, September 2012 IDRC suited to JAFROC methodology. Although other software exists [13, 14], the authors took the opportunity to develop ROCView to suit the needs of their current research. As a web-based service ROCView would have excellent availability with no software download or installation required. A requirement of ROCView would be to produce data suitable for analysis via JAFROC [15] and Dorfman–Berbaum–Metz Multi-reader Multi-case (DBM-MRMC) software [16] for direct comparison of the performance of multiple readers and modalities. Gathering suitable readers in a single centre for an observer study also presented itself as a boundary to conducting JAFROC research. Consequently, a geogra- phically independent method of IDRC was required
  • 34. to allow readers to complete the observation—this prompted the development of a web-based solution. ROCView meets the demands of geographical indepen- dence and IDRC with the option to store resultant data in a form suitable for DBM-MRMC analysis. The nature of the software solution required a simplistic method to maintain the integrity of the data, as there would be no on- site support. Figure 1 describes the process of perception that readers will use when assessing studies on ROCView. Design and development of ROCView ROCView is implemented as a web application, with reader evaluations performed in a front-end display system (browser/client), with a web server supplying image data and recording reader responses into a database. A second web interface provides administra- tion facilities: user management, modality and case management, creation of the ‘‘truth’’ and report genera- tion. Guidance provided by Chakraborty [17] in relation to conducting a JAFROC study aided the design of ROCView. The development of a successful IDRC system required an understanding of the following key principles: N image display N comparing modalities N setting the ‘‘truth’’ N acceptance radius criterion N scoring confidence N data recording. The following description and the flow diagram shown in Figure 2 explain the process for setting up and running a JAFROC study on ROCView.
  • 35. Table 1. The terminology associated with jackknife alternative free-response receiver operating characteristic analysis Term Alternative meaning/comment Reader Observer, participant Case Image Lesion Pathology Modality Variable Case matched Same image displayed Lesion localisation (LL) Successful identification of pathology (TP) Non-lesion localisation (NL) Unsuccessful identification of pathology (FP) Truth The true site of pathology in a case Signal A stimulus within background noise stimulating a localisation Case memory The likelihood of a reader remembering the appearance of cases shown in sequential order Figure 1. The process used by readers attempting a study on ROCView. Short communication: ROCView: prototype software for data collection in JAFROC analysis The British Journal of Radiology, September 2012 1321 Image display Image display is fairly straightforward for a JAFROC study. Cases from multiple modalities are displayed, with quick progression between them. ROCView automatically randomises the images from all modalities in order to
  • 36. reduce case memory. As a web-based application it is important to ensure that the viewing conditions are consistent and to a certain standard. A variety of monitor test patterns can be used to ensure monitor performance [18], in which it is also important to ensure a consistent display response to allow a consistent response by the observer. Methods to assess the adequacy of display performance in accordance with the digital imaging and communication in medicine (DICOM) greyscale standard display function (GSDF) are available [19]. Comparing modalities To allow direct comparison of two modalities, such as a variation in image acquisition parameters, ROCView allows the upload of a large number of image data sets via file transfer protocol (FTP) [20]. All uploaded modalities should be named or numbered appropriately and all cases should be numbered and case-matched across all modalities. When assigned to the appropriate study, cases are automatically randomised. From this point the study is ready for the ‘‘truth’’ to be set. Setting the ‘‘truth’’ A suitably trained person should access the study as an administrator and create the ‘‘truth’’, which is stored in a database on ROCView to act as a standard with which all further reader responses are compared, via the imple- mentation of a pre-defined acceptance radius arising from the pixel that is marked on the image. When performing this task the administrator is able to view the modality and case identifier alongside the image, together with the localisation marker showing the acceptance radius, in order to minimise error in lesion localisation. This is
  • 37. particularly useful for phantom studies in which the lesion sites are known. All readers are blinded to modality and case identifiers. The administrator can make up to nine lesion localisations per case. Acceptance radius criterion An acceptance radius is a region surrounding a lesion that allows slight error in localisation. ROCView allows adjustment of the acceptance radius in the source code. The acceptance radius for current studies, determined by lesion size, is nine pixels’ radial distance from the centre of the localisation made by the administrator creating the ‘‘truth’’. All marks within this radius are classified as LLs. All other marks are NLs, penalising the reader for inaccuracies and false localisations. This is, however, dependent on the resolution of the monitor and the image size. Currently, the largest size of image used has been 5126512 pixels, which allows for a 1.8% error with an acceptance of 9 pixels in all directions from the point of localisation. If monitor resolution does not allow the maximum image size then it will be scaled, with a 100% viewing window, and centred over the cursor, available in the top right of the screen. Figure 3 explains the implication of acceptance radius size; a clinical example would equate to a vessel (lesion mimic) next to a lesion in the thorax being incorrectly localised but being classified as LL owing to it falling within the acceptance radius of the lesion. Different values of radii clearly affect reader performance [21], where a relaxed criterion (20–40 pixels) improved apparent reader perfor- mance. Localisation accuracy is an important distinction between conventional ROC and free-response methods; consequently, this criterion, at the discretion of the researcher, must be controlled to ensure that JAFROC maintains precision. When a reader clicks on the image in ROCView a 19-pixel-diameter marker appears to aid the
  • 38. reader’s judgement of accuracy (Figure 4). Existing phan- tom-based ROCView studies have not used simulated lesions that are .19 pixels in diameter. Therefore, localisa- tion of the centre of the lesions would always result in a TP/LL result. Scoring confidence Many variations of confidence scales are described [22–24] and one must be mindful that one scale may not Figure 2. The administration process used to create a study on ROCView. J Thompson, P Hogg, S Thompson et al 1322 The British Journal of Radiology, September 2012 be suited to all investigations. To address this, ROCView offers two types of scale: continuous and discrete (Figure 5). When creating a study the administrator can choose which type of scale will be presented to the reader following a mark made on an image. The discrete scale appears as a pop-up box showing a series of ranked radio buttons (1–5, low to high confidence) from which readers can make their selection. The continuous scale presents as a slider bar that can function as a 101-point scale similar to those in use [24]. The data can be resampled to an 11-point discrete rating scale if there is not a good distribution of responses—a problem con- sistent with this type of scale arising from the inability to estimate within a few percentage points [23]. Data recording
  • 39. Once confidence has been scored, mark-rating pairs are stored in a database (TP or FP) in the format shown in Tables 2 and 3, which can then be downloaded and analysed via JAFROC methods. Figure 3. The implication of accep- tance radius. A larger acceptance radius could result in a greater number of incorrect true-positive results owing to the marking of a lesion mimic that falls within the acceptance radius. A small accep- tance radius can reduce this risk and would increase the number of false- positive results owing to lesion mimics and reader inaccuracies. Figure 4. Screenshot of ROCView. The main image (scaled) shows a reader mark that prompted the confidence scale to appear. Note the option to remove unwanted clicks. The image in the top right of the screen shows the main image at 100% size, without reader marks for re-evaluation of uncertain areas. Progress through the observation challenge is also displayed. Figure 5. Screenshot of ROCView showing the continuous- style confidence scale variant. A mouse click prompts the slider bar to appear. The slider starts at the left side of the bar (score 1.0/low confidence) and can be moved to any point along it to a maximum of 10.0 (high confidence).
  • 40. Short communication: ROCView: prototype software for data collection in JAFROC analysis The British Journal of Radiology, September 2012 1323 For each successful localisation five integer values are recorded in the TP sheet. Four integers are recorded for each incorrect localisation in the FP sheet. The following data need to be recorded as identifiable integers: N reader ID N case ID N modality ID N lesion ID (1, 2, 3 etc.)—not used in the FP worksheet N confidence scale rating (TP or FP). When no mark-rating pairs are made, a default score of zero is stored for each case and lesion. These results are not required for JAFROC analysis but have been included in the reports to validate the results recorded by ROCView. Currently the reader ID is recorded as the login details (email address) of the reader. Once the data have been downloaded, this can easily be converted to an integer in Microsoft ExcelH (Microsoft Excel, Redmond, WA). Once downloaded, TP and FP results need correlating with a ‘‘truth’’ sheet in a single Excel file as described by Chakraborty and Yoon [25]. This data file can then be analysed using JAFROC v. 4.0 [15] to transform the FROC data to inferred ROC data (*.lrc file), which can be analysed using DBM-MRMC software [16]. Software development
  • 41. When the application starts, it makes an asynchronous request to the web server to retrieve the modalities to be evaluated by the user. This is dictated by the activation key used when registering as a user, since ROCView runs multiple studies concurrently. Cases are displayed in turn, and, as the user creates mark–rating pairs, each response is sent asynchronously to the server and is stored immediately in the appropriate database (TP or FP). The software has been made functional for general purpose personal computers, in terms of the processing power and memory required, as a result of the tools used to develop the software (Table 4). As with all FROC studies, monitor performance and viewing conditions remain a concern and these should meet the required standards consistent with the study objectives. The client has been designed to use the native HTML and JavaScript capabilities of browsers. Consequently, browser plugins are not necessary and the hardware requirements of the client remain low. The native solution is at risk of manipulation by the user; for example, by manipulation of the page uniform resource locators or by reloading the evaluation page in unsupervised studies. Therefore, a function is applied to the evaluation data to maintain integrity between server requests. This prevents the user from reloading the evaluation page and returning to evaluate previous images while ensuring that evalua- tions resume at the last stored point if they are not completed in one attempt (due to loss of internet connection or computer hardware failure). Future application, flexibility and development ROCView has the potential to deal with any images
  • 42. acquired in a manner suitable for FROC analysis. With the capability to display images from a wide range of acquisition methods (CT, ultrasound, MRI, nuclear medicine, mammography and computed/digital radio- graphy) there is a relatively unlimited application for lesion detection-based studies. A phantom-based lesion detection study of CT acquisition parameters highlighted the type of research study for which this software is suitable [12]. Producing case-matched images is a significant challenge for MRMC studies, but if this can be achieved ROCView can be a powerful tool for the display of images and the accurate recording of reader responses. A significant development to the software would see the creation of an acceptance volume, to allow classifica- tion of LLs and NLs, for lesions that cross multiple cross- sectional images. Software to allow this is available [14] and has been used in a FROC study of mammography techniques [34]. A further development would allow hybrid images to be displayed in their component parts Table 3. False-positive database format as recorded by ROCView Reader ID Modality ID Case ID Reader mark (x, y) FP rating Name Variable Value Value Confidence Example [email protected] Low resolution 39 236 129 3 FP, false positive; ID, identity. HTML format, all fields; CSV format, exclude italic fields. Table 2. True-positive database format as recorded by ROCView
  • 43. Reader ID Modality ID Case ID Lesion ID Reader mark (x, y) Truth (x, y) Proximity (pixels) TP rating Name Variable Value Value Value Value Value Confidence Example [email protected] High resolution 4 1 121 293 120 294 1.4 4 ID, identity; TP, true positive. HTML format, all fields; CSV format, exclude italic fields. J Thompson, P Hogg, S Thompson et al 1324 The British Journal of Radiology, September 2012 (emission, transmission and fused) to allow novel FROC studies of diagnostic performance in single photon emission CT and positron emission tomography/CT. There is also scope for the development of a region-of- interest style acceptance criterion to enable a form of JAFROC analysis suited to fracture detection in which the over-riding outcome would be a study in a similar vein to mammography PERFORMS [35] to quantify trainee performance in fracture detection. ROCView, as a web-based service, requires no download of software. ROCView is currently being used in a research pro- gramme but may become available commercially to other researchers in the future. References
  • 44. 1. Gur D, Rockette H, Bandos A. ‘Binary’ and ‘non-binary’ detection tasks: are current performance measures optimal? Acad Radiol 2007;14:871–6. 2. Manning D. Evaluation of diagnostic performance in radiography. Radiography 1998;4:49–60. 3. devchakraborty.com [homepage on the internet]. Philadelphia: Dev Chakraborty; 2011 [updated 2011; cited 4 November 2011]. Available from: http://www. devchakraborty.com/Historical%20Background.html 4. Chakraborty D. Analysis of location specific observer perfor- mance data: validated extensions of the jackknife free- response (JAFROC) method. Acad Radiol 2006;13:1187–93. 5. devchakraborty.com [homepage on the internet]. Phila- delphia: Dev Chakraborty and Hong-Jun Yoon; 2011. JAFROC 4.0 user manual [updated 2010; cited 10 August 2011]. Available from: http://www.devchakraborty.com/ Receiver%20operating%20characteristic.pdf 6. Zarb F, Rainford L, McEntree M. Image quality assessment tools for optimisation of CT images. Radiography 2010;16: 147–53. 7. Chakraborty D. Validation and statistical power compar- ison of methods for analysing free-response observer performance studies. Acad Radiol 2008;15:1554–66. 8. Chakraborty D, Hong-Jun Y, Mello-Thomas C. Spatial localization accuracy of radiologists in free-response stu- dies: inferring perceptual FROC curves from mark–rating data. Acad Radiol 2007;14:4–18. 9. Obuchowski N. Reducing the number of reader interpreta-
  • 45. tions in MRMC studies. Acad Radiol 2009;16:209–17. 10. Chakraborty D. How many readers and cases does one need to conduct an ROC study? Acad Radiol 2011;18:127–8. 11. Manning D, Leach J, Bunting S. A comparison of expert and novice performance in the detection of simulated pulmon- ary nodules. Radiography 2000;6:111–16. 12. Thompson J, Hogg P, Szczepura K, Tootell A, Sil J, Manning D. Determination of optimal CT exposure factors for lung lesions using an anthropomorphic chest phantom for SPECT- CT. Eur J Nucl Med Mol Imaging 2010;37(Suppl. 2):S494. 13. Jacobs F, Zanca R, Oyen H, Bosmans J. Sara, an advanced software platform for human observer performance ex- periments. In: Proceedings of the XIVth Medical Image Perception Conference; 9–12 August 2011; Dublin, Ireland. Available from: http://home.comcast.net/,eakmips/ update.htm (software available from: http://www. kuleuven.be/radiology/lucmfr/sara/index.html) 14. Håkansson M, Svensson S, Zachrisson S, Svalkvist A, Båth M, Månsson L. ViewDEX: an efficient and easy-to-use software for observer performance studies. Radiat Prot Dosim 2010;139:42–51. Software available from: http:// helios.ifss.gu.se/viewdex/index_v3_slide0001.htm 15. devchakraborty.com [homepage on the internet]. Philadelphia: Dev Chakraborty; 2011. JAFROC 4.0.1 analy- sis software [updated 2011; cited 10 August 2011]. Available from http://www.devchakraborty.com/downloads.html 16. perception.radiology.uiowa.edu [homepage on the internet].
  • 46. Iowa City, IA: The Medical Image Perception Laboratory; 2011. DBM-MRMC v. 2.3 [updated 2011; cited 10 August 2011]. Available from: http://perception.radiology.uiowa. edu/Software/ReceiverOperatingCharacteristicROC/ DBMMRMC/tabid/116/Default.aspx 17. devchakraborty.com [homepage on the internet]. Philadelphia: Dev Chakraborty; 2011. How to conduct a free-response study [updated 2011; cited 10 August 2011]. Available from: http:// www.devchakraborty.com/HowToConduct.html 18. Deckard.mc.duke.edu [homepage on the internet]. Durham, NC: American Association of Physicists in Medicine; 2011. Online report no. 3: assessment of display performance for medical imaging systems [updated 2005; cited 10 August 2011]. Available from: http://deckard.mc.duke.edu/ ,samei/tg18_files/tg18.pdf 19. Fetterly K, Blume H, Flynn M, Samei E. Introduction to grayscale calibration and related aspects of medical imaging grade liquid crystal displays. J Digit Imaging 2008;21:193–207. 20. filezilla-project.org [homepage on the internet]. Aachen, Germany. Filezilla; 2011. Filezilla 3.5.0: The free FTP solution [updated 2011 May 22; cited 10 August 2011]. Available from: http://filezilla-project.org/ 21. Gur D, Bandos A, Klym A, Cohen C, Hakim C, Hardesty L, et al. Agreement of the order of overall performance levels under different reading paradigms. Acad Radiol 2008;15:1567–73. 22. Park S, Goo J, Jo C-H. Receiver operator characteristic (ROC) curve: practical review for radiologists. Korean J
  • 47. Radiol 2004;5:11–18. 23. Hadjiiski L, Chan H-P, Sahiner B, Helvie M, Roubidoux M. Quasi-continuous and discrete confidence rating scales for observer performance studies: effects on ROC analysis. Acad Radiol 2007;14:38–48. 24. Rockette H, Gur D. Selection of a rating scale in receiver operating characteristic studies: some remaining issues. Acad Radiol 2008;15:245–8. 25. devchakraborty.com [homepage on the internet]. Philadelphia: Dev Chakraborty; 2011. JAFROC 4.0 user manual [updated 2010; cited 10 August 2011]. Available from: http://www.devchakraborty.com/downloads.html 26. apache.org [homepage on the internet]. Los Angeles, CA: Apache Software Foundation; 2011. Apache HTTP server [updated 22 May 2011; cited 10 August 2011]. Available from: http://httpd.apache.org/ Table 4. Programming tools and applications used in the development of ROCView (open source components) Tool Function Apache HTTP Server [26] + PHP module [27] Web server MySQL [28] Server database Flex 4 SDK [29] + jQuery [30] Client applications, JavaScript library Apache Ant [31] Source file deployment JSLint [32] Code quality checking of JavaScript JSMin [33] Compression of client-side JavaScript code Short communication: ROCView: prototype software for data collection in JAFROC analysis
  • 48. The British Journal of Radiology, September 2012 1325 27. php.net [homepage on the internet]. Denmark: PHP; 2011. PHP Scripting Language [updated 28 June 2011; cited 10 August 2011]. Available from: http://www.php.net/ 28. mysql.com [homepage on the internet]. Redwood Shores, CA: MySQL; 2011. Open source database [updated 25 July 2011; cited 10 August 2011]. Available from: http://www. mysql.com/ 29. adobe.com [homepage on the internet]. San Jose, CA: Adobe; 2011. Flex 4 SDK [updated 20 June 2011; cited 10 August 2011]. Available from: http://opensource.adobe.com/wiki/ display/flexsdk/Flex+SDK 30. jquery.com [homepage on the internet]. Boston, MA: jQuery; 2011. JavaScript Library [updated 23 March 2010; cited 10 August 2011]. Available from: http://jquery. com/ 31. ant.apache.org [homepage on the internet]. Los Angeles, CA: Apache; 2011. Apache Ant Java Library [updated 27 December 2010, cited 10 August 2011]. Available from: http://ant.apache.org/ 32. jslint.com [homepage on the internet]. USA: JSLint; 2011. JavaScript Code Quality Tool [updated 26 August 2011, cited 10 August 2011]. Available from: http://www.jslint.com/ 33. crockford.com [homepage on the internet]. USA: JSMin;
  • 49. 2011. JavaScript Minifier [updated 2003 Dec 04, cited 10 August 2011]. Available from: http://www.crockford.com/javascript/ jsmin.html 34. Svahn T, Andersson I, Chakraborty D, Svensson S, Ikeda D, Förnvik D, et al. The diagnostic accuracy of dual-view digital mammography, single-view breast tomosynthesis and a dual-view combination of breast tomosynthesis and digital mammography in a free-response observer performance study. Radiat Prot Dosim 2010;139:113–17. 35. Scott H, Gale A. Breast screening: PERFORMS identifies key mammographic training needs. Br J Radiol 2006;79:S127–33. J Thompson, P Hogg, S Thompson et al 1326 The British Journal of Radiology, September 2012 TootellEtal2014Radiography.pdf lable at ScienceDirect Radiography 20 (2014) 323e332 Contents lists avai Radiography journal homepage: www.elsevier.com/locate/radi An overview of measuring and modelling dose and risk from ionising radiation for medical exposures Andrew Tootell*, Katy Szczepura, Peter Hogg
  • 50. Directorate of Radiography, Salford University, Salford, M6 6PU, UK a r t i c l e i n f o Article history: Received 24 February 2014 Received in revised form 2 May 2014 Accepted 5 May 2014 Available online 3 June 2014 Keywords: Radiography Dose Risk Thermoluminescent dosimetry Monte Carlo method * Corresponding author. Tel.: þ44 1612956414. E-mail address: [email protected] (A. Tootel http://dx.doi.org/10.1016/j.radi.2014.05.002 1078-8174/� 2014 The College of Radiographers. Pub a b s t r a c t Purpose: This paper gives an overview of the methods that are used to calculate dose and risk from exposure to ionizing radiation as a support to other papers in this special issue. Background: The optimization of radiation dose is a legal requirement in medical exposures. This review paper aims to provide the reader with knowledge of dose by providing definitions and concepts of absorbed, effective and equivalent dose. Criticisms of the use of effective dose to infer the risk of an exposure to an individual will be discussed and an alternative approach considering the lifetime risks of
  • 51. cancer incidence will be considered. Prior to any dose or risk calculation, data concerning the dose absorbed by the patient needs to be collected. This paper will describe and discuss the main concepts and methods that can be utilised by a researcher in dose assessments. Concepts behind figures generated by imaging equipment such as dose- area-product, computed tomography dose index, dose length product and their use in effective dose calculations will be discussed. Processes, advantages and disadvantages in the simulation of exposures using the Monte Carlo method and direct measurement using digital dosimeters or thermoluminescent dosimeters will be considered. Beyond this special issue, it is proposed that this paper could serve as a teaching or CPD tool for personnel working or studying medical imaging. � 2014 The College of Radiographers. Published by Elsevier Ltd. All rights reserved. Introduction Within this special issue of radiography, several articles use Monte Carlo mathematical methods to estimate radiation dose to humans. It is appreciated that readers may have a limited knowl- edge of these methods, or indeed measurement methods which are used to estimate dose. For readers with limited knowledge in dose estimation this article explains a range of approaches which might be used. This article also outlines concepts and defines terms associated with dose and it discusses how data can be used to provide an indication of risk to an individual.
  • 52. Ionising radiation is made up of sub-atomic particles or, in the case of X-rays and gamma rays, it comprises electromagnetic waves from the high energy part of the electromagnetic spectrum. At energies associated with medical imaging, these particles and waves have sufficient energy to ionise an atom and liberate an electron. This process may lead to tissue damage which can result in cell mutation or apoptosis. The higher the dose of radiation, the l). lished by Elsevier Ltd. All rights re greater chance that tissue damage will occur.1 This probability model of biological damage is referred to as the stochastic effect. It suggests that no dose of radiation is safe. It is this worst case sce- nario that radiation protection is based on, in that operators should aim to minimise the probability of tissue damage by using the least practicable amount of ionising radiation.2 In medical imaging a range of professionals are responsible for ensuring doses are as low as reasonably practicable (ALARP). The operator performing the exposure is required to have an under- standing of the steps that they can take to optimise dose thus minimising the chance of stochastic affects. Absorbed dose Interactions of ionising radiation with matter can result in a proportion of radiation energy being deposited. The amount of energy deposited per unit mass is the absorbed dose
  • 53. (represented by the letter D) and is defined as joules per kilogram (J kg�1). The SI unit of absorbed is the Gray (Gy). Quantities of absorbed dose are usually quoted as milli-Gray (mGy, 1/1000 of a Gray) or a micro- Gray (mGy, 1/1,000,000 of a Gray). served. mailto:[email protected] http://crossmark.crossref.org/dialog/?doi=10.1016/j.radi.2014.0 5.002&domain=pdf www.sciencedirect.com/science/journal/10788174 http://www.elsevier.com/locate/radi http://dx.doi.org/10.1016/j.radi.2014.05.002 http://dx.doi.org/10.1016/j.radi.2014.05.002 http://dx.doi.org/10.1016/j.radi.2014.05.002 Table 1 Recommended radiation weighting factors from ICRP 103.1 Radiation type Radiation weighting factor Photons (X-ray and gamma ray) 1 Electrons 1 Alpha particles 20 Protons 2 Table 2 Tissue weighing factors from ICRP 103.1 Organ Tissue weighting factor Gonads 0.08
  • 54. Bone marrow 0.12 Colon 0.12 Lung 0.12 Stomach 0.12 Breast 0.12 Bladder 0.04 Liver 0.04 Oesophagus 0.04 Thyroid 0.04 Skin 0.01 Bone (surface) 0.01 Salivary glands 0.01 Brain 0.01 Remaindera 0.12 Total 1.00 a Remainder tissues: adrenals, extrathoracic (ET) region, gall bladder, heart, kidneys, lymphatic nodes, muscle, oral mucosa, pancreas, pros- tate (_), small intestine, spleen, thymus, uterus/cervix (). A. Tootell et al. / Radiography 20 (2014) 323e332324 Equivalent dose The chance of tissue damage occurring does not just depend on the absorbed dose but also the type and energy of the radiation. Equivalent dose (represented by the symbol H) takes these factors into consideration and is obtained by applying a radiation weight- ing factor (W) to the absorbed dose. Radiation weighting factors are published by The International Commission On Radiation Protec-
  • 55. tion (ICRP)1; they reflect the biological damage potential of different radiation types (Table 1). It can be considered a less fundamental quantity than absorbed dose but it is useful for indicating the health risk of radiation exposure. Equivalent dose is still defined as joules per kilogram, but is assigned the SI unit Sievert (Sv). Figures are often quoted as milli-Sieverts (mSv) or micro-Sieverts (mSv). The equation for equivalent dose is defined in Fig. 1. Ionising radiation that forms part of the electromagnetic spec- trum (e.g. X-ray and gamma ray) ionise atoms through the photo- electric absorption and the Compton effect. Both these interactions will eject an electron from an atom; this electron may ionise many more atoms. Since most of the affected atoms are ionised indirectly by the secondary electrons, photons are considered to be indirectly ionising. Using the data in Table 1, it can be seen that an absorbed dose of 1 mGy of X-ray photons results in an equivalent dose of 1 mSv, i.e. 1 mGy � 1 (radiation weighting factor for X-ray photons), where 1 mGy of alpha particles results in an equivalent dose of 20 mSv, i.e. 1 mGy � 20 (radiation weighting factor for alpha particles). In
  • 56. other words alpha particles have a higher risk to biological tissue. Effective dose Effective dose (represented by the symbol E) takes into account the type and amount of exposed tissue. Different tissues within the body have difference sensitivities to radiation meaning a dose applied to one area of the body can carry a higher risk than the same dose applied to another. Effective dose takes the equivalent doses of a number of organs and through the application of a tissue weighting factor, the sum of these aims to provide a single number that is proportional to the detriment from a particular exposure. It allows comparisons of the risks associated with different imaging techniques or modalities. The tissue weighting factors (Table 2) represent the sensitivity of their respective tissue, for example bone marrow is highly sensitive to radiation and so has a weighting factor of 0.12 where the brain is less sensitive and so has a weighting factor of 0.01. The sum of the tissue weighting factors is 1 and so the sum of the weighted equivalent doses would provide a whole body effective dose. Per- forming this process for different techniques allows for a compar- ison of doses and an indication of the detriment of these.
  • 57. Figure 1. Equation for calculating equivalent dose from absorbed dose.1 Effective dose is still defined as joules per kilogram and also has the same SI unit as equivalent dose, Sievert (Sv, with figures quoted as milli-Sieverts (mSv) or micro-Sieverts (mSv)). The equation for calculating effective dose is shown in Fig. 2. Controversies with effective dose Effective dose is commonly used in medical imaging to compare the risks from different modalities (for example, CT of the cervical spine versus conventional radiographic imaging of the same anatomical area) or examinations that have differing dose distri- butions (for example, comparison of effective dose from an antero- posterior hip to that from an antero-posterior shoulder). The application of the tissue weighting factors to the equivalent doses of the organs provides the whole body effective dose from that exposure. The application of effective dose is useful in these situ- ations as it provides referrers, practitioners and operators with data that allows them to make decisions during the referral, justification and optimisation of medical imaging procedures.2,3 When used for this purpose effective dose is a useful figure to use, however a number of publications use this figure to calculate the risk of the exposure to an individual. As noted by a number of authors, and the
  • 58. ICRP themselves, the effective dose concept is not intended to be used this way as a number of factors are not taken into consider- ation.3e8 The tissue weighting factors are averaged over all ages and both genders in the general population and so it cannot be applied to an individual patient.9 For example a measurement of organ doses and effective dose calculations from a chest radiograph could be the same in a 15-year-old and a 35-year-old female. Using data pub- lished by Wall et al.9 the lifetime risk of cancer incidence for breast tissue in 10e19 year olds of 3.34% per Gray and 30e39 year olds of 1.44% per Gray it can be seen that the risk to female breast in 10e19 Figure 2. Equation for the calculation of effective dose.1 Table 3 Comparison of the tissue weighting factors form ICRP publications 26, 60 and 103.1,12,13 Organs Tissue weighting factors ICRP 26 (1977)12 ICRP 60 (1990)13
  • 59. ICRP 103 (2007)1 Gonads 0.25 0.20 0.08 Red bone marrow 0.12 0.12 0.12 Colon e 0.12 0.12 Lung 0.12 0.12 0.12 Stomach e 0.12 0.12 Breasts 0.15 0.05 0.12 Bladder e 0.05 0.04 Liver e 0.05 0.04 Thyroid 0.03 0.05 0.04 Skin e 0.01 0.01 Bone surface 0.03 0.01 0.01 Salivary glands e e 0.01 Brain e e 0.01 Remainder 0.03 0.05 0.12 Total 1.00 1.00 1.00 Table 4 Life time risks of cancer incidence for males and females by organ and age for a Euro- American population (% per Gy). Organ (male) Age at exposure (y) 0e9 10e19 20e29 30e39 40e49 50e59 60e69 Lung 0.65 0.69 0.73 0.78 0.80 0.76 0.61 Stomach 0.93 0.73 0.57 0.43 0.31 0.20 0.12 Colon 1.49 1.22 0.98 0.79 0.60 0.43 0.25 Red bone marrow 1.06 1.05 0.77 0.76 0.78 0.65 0.49 Bladder 0.89 0.76 0.65 0.55 0.46 0.35 0.23 Liver 0.56 0.44 0.34 0.26 0.18 0.12 0.07 Thyroid 0.18 0.10 0.05 0.03 0.01 0.01 0.00
  • 60. Oesophagus 0.12 0.11 0.11 0.11 0.12 0.14 0.15 Organ (female) Age at exposure (y) 0e9 10e19 20e29 30e39 40e49 50e59 60e69 Breast 4.92 3.34 2.21 1.44 0.84 0.45 0.21 Lung 1.36 1.46 1.58 1.70 1.78 1.72 1.39 Stomach 1.45 1.14 0.88 0.67 0.48 0.33 0.20 Colon 0.73 0.59 0.48 0.38 0.29 0.21 0.14 Red bone marrow 0.48 0.48 0.50 0.45 0.77 0.49 0.29 Bladder 0.70 0.61 0.52 0.45 0.39 0.32 0.24 Liver 0.24 0.19 0.15 0.11 0.08 0.06 0.03 Thyroid 0.92 0.52 0.26 0.13 0.06 0.02 0.01 Oesophagus 0.10 0.09 0.10 0.12 0.15 0.21 0.28 A. Tootell et al. / Radiography 20 (2014) 323e332 325 year old is higher. This difference in sensitivity due to age and gender is not captured within conventional effective dose calculations. The tissue weighting factors published by the ICRP are derived using data that is assessed and analysed by The United Nations Scientific Committee on the Effects of Atomic Radiation (UNSCEAR) on cancer risks from follow-up studies of the Japanese atomic bomb survivors.10 As a result of these on going long-term studies the tissue weighting factors have undergone a number of revisions as new data on cancer incidence has been collected.11 The effect of these revisions can be seen in Table 3. From Table 3, it can be seen that weightings assigned to the gonads have undergone significant changes over the three publi-
  • 61. cations, from 0.25 in ICRP 26 to 0.08 in ICRP 103 that is a reflection of the understanding of heritable risk and the change in breast tissue changed from 0.05 in 1990 to 0.12 in 2007 due to a decision by the ICRP committee to put more emphasis on cancer incidence rather than mortality.4e6 Brenner, in a number of publications, suggests that these tissue weighting factors represent a subjective balance between the different stochastic endpoints of cancer inci- dence, cancer mortality, life shortening and hereditary risk. This subjectivity is an example of the “flaws in the science” behind the derivation of these factors.4e6 However, Dietze11 argues that this revision was in response to the publication of more reliable cancer incidence data published by UNSCEAR10 rather than a change in the committee’s emphasis. Whatever the reason, it is clear that these revisions do have an impact on effective dose calculations making comparisons to older data difficult. Lifetime risk of cancer induction It is with these criticisms in mind that Brenner proposes an alternative to effective dose that can be applied to individual Figure 3. Equation for calculating effective risk.2e4 patients - this is referred to by Brenner as “effective risk”. Effective risk considers the life time risk of cancer induction from an absorbed dose of radiation and the equation for this is shown in
  • 62. Fig. 3.4 This equation is very similar to that used to calculate effective dose. It is proposed that the tissue weighting factors are replaced with organ-specific radiation-induced cancer risk, such as those published by The Nuclear and Radiation Studies Board14 or more recently by Wall et al.9 (a selection of data is shown in Table 4). The lifetime risk figures (Table 4) are calculated from stronger data as they are based directly on epidemiological studies and not decided by committee.10,14 The organ-specific radiation- induced risk data reflects current knowledge in the biological effects of ra- diation. The results would be easier to interpret (for example x per 1,000,000) for medical imaging professionals and non-medical imaging professionals too. The lifetime risk can be used to pro- vide risk to different genders and age groups. Conveying risk to patients is arguably one of the more chal- lenging aspects the radiography profession has to contend with. To this end, Wall suggests using a category based approach to convey the risk from the radiological examination (Table 5).9 Prior to any analysis of risk, dose data has to be collected. Dose data can be measured or estimated. In medical imaging either method can be used to determine dose data in most situations, although there could be occasions where only one method is suitable.
  • 63. Modelling dose Mathematical modelling of dose using commercially available software is relatively quick and easy. Software is available that Table 5 Four broad risk bands for the typical total lifetime cancer risk for patients.9 Category Total lifetime cancer risk Negligible risk Less than 1 in a million Minimal risk 1 in a million to 1 in 100,000 Very low risk 1 in 100,000 to 1 in 10,000 Low risk 1 in 10,000 to 1 in 1000 A. Tootell et al. / Radiography 20 (2014) 323e332326 allows for organ and effective dose values for conventional radio- graphic techniques and CT imaging to be estimated. The software employs Monte Carlo modelling which is a mathematical technique that simulates as closely as possible the real interactions suffered by photons. The process involves the computer simulation of an anthropo- morphic phantom being exposed to a large number of photons of varying energies emitted from a point source. The path of each photon is followed through a sequence of interaction points and subsequent energy losses and outgoing directions (through coherent scattering or Compton scattering). This chain of in- teractions forms a so-called photon history. At each interaction
  • 64. point the energy deposited to the organ is calculated and used in the dose calculation. A large number of independent random photon histories are generated and estimates of the mean values of the energy depositions in the various organs are used for calcu- lating the dose in these organs Eventually, the photon loses suffi- cient energy to allow photoelectric absorption to occur.15,16 PCXMC (STUUK, Helsinki, Finland16,17) is one such programme that allows for organ and effective dose to be estimated in many conventional radiographic techniques. Fig. 4 illustrates the posi- tioning of a PA chest with landscape orientation of the image re- ceptor. Other parameters can be manipulated in the software including X-ray anode angle, tube filtration material and thickness to obtain final dose estimates. Figure 4. Example of data entry page of PCXMC for the calculat Dose modelling software is also available for CT dose estima- tions. For example, ImPact’s CT Dosimetry Tool (ImPact, Lon- don18,19) software simulation allows for quick and easy calculation of organ and effective dose through the use of Monte Carlo data for normalised organ doses. However, as can be seen in Fig. 5, results are dependent on selecting the imaging parameters and CT model as calculations take into account specific features of each CT unit (e.g. radiation quality and field geometry).20 Selection of the correct scanner may not always be possible as new technology and
  • 65. systems are constantly being introduced. These systems are currently not included in dose simulation software meaning that dose simulation has to rely on “best fitting” the attributes of these scanners to those of a similar design. As noted by Groves et al.,21 this introduces the potential for significant error in the estimated doses. Automatic mA manipulation by the scanners can also lead to error as the software only allows a single value to be used. Underestimation of CT doses using computer simulation is frequently reported with magnitudes between 18 and 40%.5,12,13 Reasons for these underestimations have been explained by the differences in the physical dosimetry phantoms and the virtual phantoms used by dose modelling software. Close examination of this highlights the simplified geometric shapes of the organs. Subsequently, as can be seen in Fig. 6, in CT examinations of the chest the CT virtual phantom suggests that the liver is not exposed to primary X-ray beam and thus the calculated liver dose would be ion of organ and effective dose from a PA chest radiograph. Figure 5. Example of the dose report generated by ImPact CT Dosimetry software.
  • 66. A. Tootell et al. / Radiography 20 (2014) 323e332 327 low. In reality a significant volume of this organ is included in the scan and so will contribute to the effective dose calculations. However, accuracy of CT dose modelling can be improved by careful selection of the scan range to match the fractions of organs irradiated and to include overbeaming and overranging that is a feature of helical scanning. The use of an average mAs for the scan parameters will further improve the accuracy of the dose calculations.22 Figure 6. Comparison of the virtual phantom in ImPact CT dosimetry software and ATOM dosimetry phantom. Figure 7. Typical arrangement of the phantom and pencil beam ionisation chamber used to collect CTDI. A. Tootell et al. / Radiography 20 (2014) 323e332328 Measuring dose There are many tools which may be used to measure the dose absorbed during a radiographic procedure that will allow dose to be calculated. The one that most operators will be familiar with is the dose area product (DAP) meter. DAP combines two quantities e as its name suggests absorbed dose in air and the field size giving the unit Gray centimetre squared Gycm2 (or cGycm2 or mGycm2)
  • 67. (NB not Gray per square centimetre). DAP meters are mounted onto the X-ray tube in front of the collimators making readings easy to ac- quire, however it is important to note that DAP is not patient dose per se.23 It is independent of the distance between the source and the patient meaning that if this figure is to be used to estimate patient dose the source to patient distance, the field size and the location of the area exposed are required.24 CT acquisitions have similar values that are often used as a reference for patient dose; the computed tomography dose index (CTDI) and dose length product (DLP). The CTDI measurement was based on an axial CT scanner and was defined as the dose from the primary beam plus scatter from surrounding slices from a single slice in an acrylic phantom (Fig. 7). Phantoms come in two di- ameters, 16 cm and 32 cm, to represent the head and body respectively.25 Developments in technology and the advent of multislice CT equipment lead to variations in CTDI. CTDI100 reflects the dose contribution from a 100 mm range (50 mm either side of the reference slice). The weighted CTDI (CTDIw) reflects the weighted sum of two-thirds the peripheral dose and one-third the central dose in a 100 mm range. The most commonly quoted CTDI value in modern CT technology is the volume CTDI (CTDIvol). This value is obtained by dividing CTDIw by the beam pitch factor.
  • 68. 22,26 As before CTDI in any form is not patient dose but a quantification of the radiation output of the CT system so does not take into account differing patient sizes and area of the body that is being imaged.27 A derivative of CTDI is dose length product (DLP). This figure takes into account the length of the scan and is calculated by multiplying the CTDIvol by the length of the scan. In a similar way to CTDI and CTDIvol, DLP is not patient dose as it does not take into account what part of the body is being exposed, the size of the patient, or the patient’s age. Conversion of DLP to patient dose is possible using a conversion coefficient (k) shown in (Table 6). This conversion factor is defined as the effective dose per dose-length product and has the unit mSv/ mGy cm. Multiplying the DLP by the relevant conversion factor gives a value for effective dose. Criticisms of k state that the factors are based on old technology and old data; they are based on several scanners that were in use circa 1990 and the tissue weighting factors used in their calculation are from ICRP 60.13,26,28 There are also a number of assumptions made that would increase the error in the calculated effective dose. For example, the patient is assumed to be standard, and as noted by
  • 69. McCollough et al.,27 this standard patient is a little thin by today’s Table 6 Normalised values of effective dose per dose-length product (DLP) over various body regions. Region of the body Normalised effective dose (E/DLP) (mSv/mGycm Head 0.0023 Neck 0.0054 Chest 0.017 Abdomen 0.015 Pelvis 0.019 Figure 9. Lower thoracic slices of a paediatric phantom showing different density resin for the lung, soft tissue and bone with locations for dosimeters. These dosimeters can be electronic (shown here by the two wires inserted into the phantom) or analogue such as thermoluminescent dosimeters.29 A. Tootell et al. / Radiography 20 (2014) 323e332 329 standards (nominal body mass of 70 kg). Variation in the way CT scanners report CTDIvol for paediatric patients can make compari- son difficult. Some use the 16 cm phantom while others use the 32 cm phantom. For example Siemens, Philips dose reports are based on a 32 cm phantom, Toshiba reports are based on 16 cm phantom and GE reports use the 16 cm or 32 cm depending on
  • 70. the scan field of view. CTDIvol can differ by a factor of approximately 2.5 between the two diameter phantoms.27 True measurement of dose using digital or analogue dosimeters such as metal oxide semi-conductor field effect transistor (MOS- FET) or thermoluminescent dosimeters (TLDs) (described later) can be done in a number of ways. In the experimental setting it is possible to measure organ dose by placing dosimeters in a specially designed anthropomorphic phantom. These phantoms are avail- able in a range of patient types; male and female and paediatric, adolescent and adult (Fig. 8). They are made up of contiguous slices with different tissues represented by different densities of epoxy resin. The resin has attenuation properties that are equivalent to real tissue. Within the slices are locations for placing dosimeters that will provide data of organ dose (Fig. 9). Using these phantoms allows the researcher to carry out experimentation on different techniques, exposure factors or positioning to optimise dose without the involvement of real patients. Figure 8. The CIRS ATOM dosimetry phantom fami It is obviously impossible to directly measure organ dose in the clinical setting, so the entrance surface dose (ESD) can be used. ESD is defined as the absorbed dose in the skin at a given location on the patient and also includes backscattered radiation from the patient. As a measurement it can be combined with DAP to allow
  • 71. calcula- tions of patient dose to be made. Dosimeters ESD and organ dose in the anthropomorphic phantom can be measured using a digital dosimeter or using thermoluminescent ly models 701e706 (CIRS, Norfolk, Virginia).29 A. Tootell et al. / Radiography 20 (2014) 323e332330 dosimeters (TLD). Most medical imaging personnel will be familiar with TLDs in the context of radiation protection as they are frequently used in personal dosimeter badges. TLDs are available in a variety of forms, from powder to square or circular chips, rods, cubes and in a range of materials. Thermoluminescence (illustrated in Fig. 10) uses the atomic model of two energy bands; the valence band and conduction band. Within the valance band electrons are bound to individual atoms as opposed to the conduction band where electrons can move freely within the atomic lattice. Separating these two bands is an area that is referred to as the forbidden gap in which no electron state can exist. The impurities mentioned above create electron traps within this gap. Exposure to ionising radiation excites electrons allowing them to move up to the conduction band leaving holes within
  • 72. the valence band. Electrons can travel amongst the crystal lattice until either the electron can cross back towards the valence band and recombine with a hole or, if near a defect, it can fall into the energy trap. The electron is now prevented from filling a hole within the valance band until it can gain enough energy to once again reach the conduction band before moving back to the valance band. This stimulation is in this context accomplished by introducing heat.30 The movement of the electron back to the valance band requires the electron to lose energy. This energy is released in the form of visible light and this light is detected by a photomultiplier tube. The charge (measured in Coulombs [C]) generated from this component is measured. Conduc on Valance Band TLD TLD readout Thermal s mula on Conduc on Valance BandTLD
  • 73. Exposure to radia on Conduc on Valance Band TLD Storage Emission of light Figure 10. Illustration of the process involved in TLD dosimetry. The choice of material depends on the nature of radiation; in diagnostic and therapeutic energies the chemical composition of the dosimeters is either lithium fluoride with magnesium and ti- tanium impurities added or lithium fluoride with magnesium, copper and phosphorus impurities added.31 The difference in the materials affects their sensitivity and the measurement range the TLD is capable of. For example TLDs made from Calcium Fluoride Dypromsium are suitable for environmental monitoring and as capable of detecting doses of between 0.1 pGy and 1 Gy.32 Lithium Fluoride with magnesium and titanium are suitable for medical physics dosimetry applications and operate at doses between 10 pGy and 10 Gy.33 Conversion from charge to dose involves a calibration process. The TLD or batches of TLDs plus scattering material and a digital dosimeter are exposed to a range of exposures at energy (kV) consistent with the experiment that will be performed. The
  • 74. charge generated from the reading process and the doses recorded by digital dosimeter are used to establish the calibration factor through linear regression. An example of calibration data using is shown in Fig. 11. General radiographic equipment can be used in this process although some TLD readers will perform calibration using sealed sources of gamma emitting isotopes such as Strontium-90 or Yttrium-90. Such systems will calibrate each TLD individually rather than in batches increasing the accuracy of the final readings. The response of the TLDs is energy dependent therefore calibration should be performed at the energy that will be used in the research or measurements. If this cannot be done then energy conversion factors can be used but this can introduce error.34 One of the disadvantages of the TLD is the time needed to pre- pare and setup and process them. A typical whole body adult phantom measurement for calculation of effective dose involves the use of 268 individual TLDs. Reading this number using a manual Figure 11. Example of calibration data for TLDs at 80 kV. Plotting data from table (a) results in graph (b) and shows the linear relationship between the charge generated from reading the TLD to dose. The gradient of this line is the calibration factor. Figure 12. A MOSFET dosimeter with an array of five
  • 75. dosimeters connected to the module.36 A. Tootell et al. / Radiography 20 (2014) 323e332 331 TLD reader equates to approximately 6 h of work.35 Research has been undertaken to follow the dental radiography dosimetry pro- cess to reduce the number of TLD required for effective dose measurement however, if comparison of organ dose and risk is to be carried out it has been shown that a measurement organ dose is required for all critical organs.35 An alternative to TLDs is the digital dosimeter. An example of this is the metal oxide semi-conductor field effect transistor (MOSFET) (Best Medical Canada, Ontario, Canada) (Fig. 12). Exposure of the digital dosimeter results in a voltage shift between the components of the dosimeter. This difference is measured and is proportional to the dose absorbed by the de- tector. However, it is unlikely that the total number of digital dosimeters would be available to allow measurement of all critical organs in one exposure due to expense of the dosimeters. Therefore a number of repeated measurements with the dosim- eter relocated between each would be required. As with TLDs, MOSFET dosimeters require calibration and their response is en- ergy dependent meaning separate calibrations are required if a significant difference in beam energies is to be used in any research37 Measurements using TLD or digital dosimeters have their ad- vantages and disadvantages relating to preparation time, acquisi-
  • 76. tion time processing following exposure, and cost. These have to be considered when planning research that involves the direct mea- surement of dose form exposure to ionising radiation.21,35,38 Summary This article has given insight into terms and concepts associated with dose measurement and modelling, as well as risk estimation. Some limitations and values of dose estimation and measurement methods have been considered. As support for this special issue the reader should have gained enough background and insight into Monte Carlo mathematical dose modelling to be able to appreciate some of the empirical articles. Beyond the special issue we antici- pate that the article could serve as a teaching or CPD aid for personnel working in medical imaging. Conflict of interest statement None. References 1. ICRP. The 2007 recommendations of the ICRP, in ICRP publication 103. Ann ICRP; 2007:2e4. 2. The ionising radiation (medical exposure) regulations, United Kingdom; 2000. 3. Oritz P. The use of effective dose in medicine. In: The second international
  • 77. symposium on the system of radiological protection. United Arab Emirates: ICRP; 2013. 4. Brenner DJ. Effective dose: a flawed concept that could and should be replaced. Br J Radiology 2008;81(967):521e3. 5. Brenner DJ. Effective dose e a flawed concept that could and should be replaced. Washington, DC: International Commission on Radiological Protection; 2011. 6. Brenner DJ. We can do better than effective dose for estimating or comparing low-dose radiation risks. Ann ICRP 2012;41(3, 4):124e8. 7. Harrison J. The use of effective dose. In: The second international symposium on the system of radiological protection. United Arab Emirates: ICRP; 2013. 8. Martin CJ. Effective dose: how should it be applied to medical exposures? Br J Radiology 2007;80(956):639e47. 9. Wall BF, Haylock R, Jansen JTM, Hillier MC, Hart D, Shrimpton PC. Radiation risks from medical X-ray examinations as a function of the age and sex of the patient. Rep HPA-CRCE-028. Chilton: Health Protection Agency; 2011. 10. United Nations. Scientific committee on the effects of atomic radiation, effects of ionizing radiation: United Nations Scientific Committee on the
  • 78. effects of atomic radiation e UNSCEAR 2006 report, volume II e report to the General Assembly, with scientific Annexes C, D, and E. UN; 2009. 11. Dietze G, Harrison JD, Menzel HG. Effective dose: a flawed concept that could and should be replaced. Comments on a paper by D J Brenner (Br J Radiol 2008;81:521e3). Br J Radiology 2009;82(976):348e51. 12. ICRP. Recommendations of the ICRP. ICRP Publication 26 Ann ICRP; 1977:3. 13. ICRP. 1990 Recommendations of the ICRP. ICRP Publication 60 Ann ICRP; 1991: 1e3. 14. Committee to Assess Health Risks from Exposure to Low Levels of Ionizing Radiation, Nuclear and Radiation Studies Board Division on Earth and Life Studies, and National Research Council of the National Academies, Health Risks From Exposure to Low Levels of Ionizing Radiation: BEIR VII Phase 2,Wash- ington, DC; 2006. 15. Baker C. Physicist toolbox e basics of Monte Carlo simulation of radiation trans- port. Liverpool: United Kingdom Radiological Congress; 2013. 16. Tapiovaara M, Siiskonen T. In: PCXMC: a Monte Carlo program for calculating pa- tient doses in medical X-ray examinations. 2nd ed. Helsinki, Finland: STUK; 2008.
  • 79. 17. Tapiovaara M, Lakkisto M, Servomaa A. PCXMC 2.0 rotation dose calculations. Helsinki, Finland: STUK; 2012. 18. ImPACT. Imaging performance assessment of CT scanners. Available from: http://www.impactscan.org [cited 22.04.2012]. 19. ImPACT. CT patient dosimetry calculator. London: Medical Devices Agency; 2003. 20. Hashemi-Malayeri BJ, Williams JR. A practical approach for the assessment of patient doses from CT examinations; 2003. Available from: www.dundee.ac. uk/medphys/documents/hashemi.pdf [cited 10.01.2012]. 21. Groves AM, Owen KE, Courtney HM, Yates SJ, Goldstone KE, Blake GM, et al. 16- Detector multislice CT: dosimetry estimation by TLD measurement compared with Monte Carlo simulation. Br J Radiol 2004;77(920):662e5. 22. Castellano E. CT dose calculations for individual patients e what you should know. In 12th CT users group, London; 2010. 23. Conference of radiation control program directors committee on quality assurance in diagnostic X-ray, dose-area product (DAP), in Q.A. collectible, Frankfort; 2001 [reviewed and republished 2008]. 24. Moores BM. Radiation dose measurement and optimization.
  • 80. Br J Radiology 2005;78(933):866e8. 25. Coursey C, Frush D. CT and radiation: what radiologists should know. Appl Radiol 2008;37(3):22e9. 26. McNitt-Gray M. Assessing radiation dose: how to do it right, in 2011 AAPM CT dose summit, Denver; 2011. 27. McCollough CH, Leng S, Yu L, Cody DD, Boone JM, McNitt-Gray MF. CT dose Index and patient dose: they are not the same thing. Radiology 2011;259(2): 311e6. 28. European Commission, EUR 16262 EN. European guidelines for quality criteria for computed tomography. Luxembourg: European Commission; 1999. 29. CIRS tissue simulation and phantom technology. Dosimetry verification phantoms model 701e706 data sheet; 2012. Available from: http://www. cirsinc.com/file/Products/701_706/701_706_DS.pdf [cited 19.01.2012]. 30. Stabin MG. Radiation protection and dosimetry: an introduction to health physics. Springer; 2007. 31. Bilski P. Lithium fluoride: from LiF:Mg,Ti to LiF:Mg,Cu,P. Radiat Prot Dosim 2002;100(1e4):199e205.
  • 81. 32. TLD-200� thermoluminescent dosimmeter. ThermoScientific; 2014. Available from: http://www.thermoscientific.com/en/product/tld-200- thermoluminescent- dosimetry-material.html [cited 29.04.2014]. 33. TLD-100� thermoluminescent dosimetry material. ThermoScientific;2014. Available from: http://www.thermoscientific.com/en/product/tld-100- thermoluminescent- dosimetry-material.html [cited 29.04.2014]. 34. Podgor�sak EB, International Atomic Energy Agency. Radiation oncology physics: a handbook for teachers and students. International Atomic Energy Agency; 2005. http://refhub.elsevier.com/S1078-8174(14)00056-X/sref1 http://refhub.elsevier.com/S1078-8174(14)00056-X/sref1 http://refhub.elsevier.com/S1078-8174(14)00056-X/sref1 http://refhub.elsevier.com/S1078-8174(14)00056-X/sref2 http://refhub.elsevier.com/S1078-8174(14)00056-X/sref2 http://refhub.elsevier.com/S1078-8174(14)00056-X/sref2 http://refhub.elsevier.com/S1078-8174(14)00056-X/sref3 http://refhub.elsevier.com/S1078-8174(14)00056-X/sref3 http://refhub.elsevier.com/S1078-8174(14)00056-X/sref3 http://refhub.elsevier.com/S1078-8174(14)00056-X/sref4 http://refhub.elsevier.com/S1078-8174(14)00056-X/sref4 http://refhub.elsevier.com/S1078-8174(14)00056-X/sref4 http://refhub.elsevier.com/S1078-8174(14)00056-X/sref5 http://refhub.elsevier.com/S1078-8174(14)00056-X/sref5 http://refhub.elsevier.com/S1078-8174(14)00056-X/sref5 http://refhub.elsevier.com/S1078-8174(14)00056-X/sref6 http://refhub.elsevier.com/S1078-8174(14)00056-X/sref6
  • 82. http://refhub.elsevier.com/S1078-8174(14)00056-X/sref7 http://refhub.elsevier.com/S1078-8174(14)00056-X/sref7 http://refhub.elsevier.com/S1078-8174(14)00056-X/sref7 http://refhub.elsevier.com/S1078-8174(14)00056-X/sref8 http://refhub.elsevier.com/S1078-8174(14)00056-X/sref8 http://refhub.elsevier.com/S1078-8174(14)00056-X/sref8 http://refhub.elsevier.com/S1078-8174(14)00056-X/sref9 http://refhub.elsevier.com/S1078-8174(14)00056-X/sref9 http://refhub.elsevier.com/S1078-8174(14)00056-X/sref9 http://refhub.elsevier.com/S1078-8174(14)00056-X/sref9 http://refhub.elsevier.com/S1078-8174(14)00056-X/sref9 http://refhub.elsevier.com/S1078-8174(14)00056-X/sref9 http://refhub.elsevier.com/S1078-8174(14)00056-X/sref10 http://refhub.elsevier.com/S1078-8174(14)00056-X/sref10 http://refhub.elsevier.com/S1078-8174(14)00056-X/sref10 http://refhub.elsevier.com/S1078-8174(14)00056-X/sref10 http://refhub.elsevier.com/S1078-8174(14)00056-X/sref10 http://refhub.elsevier.com/S1078-8174(14)00056-X/sref11 http://refhub.elsevier.com/S1078-8174(14)00056-X/sref12 http://refhub.elsevier.com/S1078-8174(14)00056-X/sref12 http://refhub.elsevier.com/S1078-8174(14)00056-X/sref12 http://refhub.elsevier.com/S1078-8174(14)00056-X/sref13 http://refhub.elsevier.com/S1078-8174(14)00056-X/sref13 http://refhub.elsevier.com/S1078-8174(14)00056-X/sref13 http://refhub.elsevier.com/S1078-8174(14)00056-X/sref14 http://refhub.elsevier.com/S1078-8174(14)00056-X/sref14 http://refhub.elsevier.com/S1078-8174(14)00056-X/sref15 http://refhub.elsevier.com/S1078-8174(14)00056-X/sref15 http://www.impactscan.org http://refhub.elsevier.com/S1078-8174(14)00056-X/sref16 http://refhub.elsevier.com/S1078-8174(14)00056-X/sref16 http://www.dundee.ac.uk/medphys/documents/hashemi.pdf http://www.dundee.ac.uk/medphys/documents/hashemi.pdf http://refhub.elsevier.com/S1078-8174(14)00056-X/sref17 http://refhub.elsevier.com/S1078-8174(14)00056-X/sref17 http://refhub.elsevier.com/S1078-8174(14)00056-X/sref17