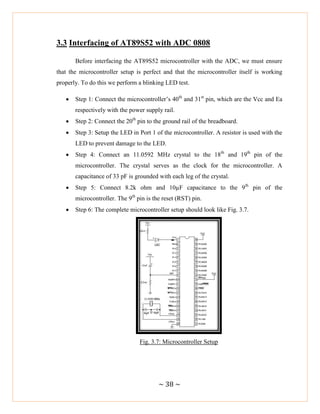
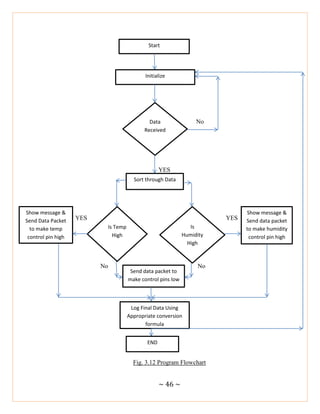
The document discusses designing a system to monitor and control the environment of a greenhouse using wireless technology. It involves using sensors like a temperature sensor and humidity sensor along with a microcontroller and XBee modules. Sensor data is wirelessly transmitted to a base station. If the temperature or humidity goes outside a predefined range, actions can be taken to control the greenhouse environment. The system aims to optimize plant growth conditions in the greenhouse remotely.

![~ 6 ~
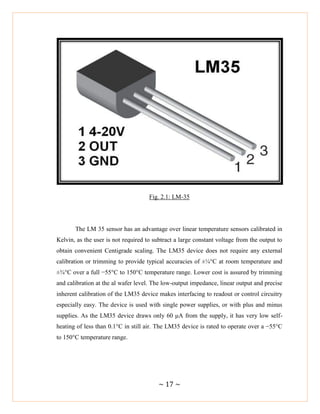
XBee Modules typically come with several antenna options, including U.FL, PCB
Embedded, Wire, and RPSMA.
The XBees can operate either in a transparent data mode or in a packet-
based application programming interface (API) mode.[8]
In the transparent mode, data
coming into the Data IN (DIN) pin is directly transmitted over-the-air to the intended
receiving radios without any modification. Incoming packets can either be directly
addressed to one target (point-to-point) or broadcast to multiple targets (star). This mode
is primarily used in instances where an existing protocol cannot tolerate changes to the
data format. AT commands are used to control the radio‘s settings. In API mode the data
is wrapped in a packet structure that allows for addressing, parameter setting and packet
delivery feedback, including remote sensing and control of digital I/O and analog input
pins.
XBee 802.15.4 – The initial point-to-point topology or star topology module
running the IEEE 802.15.4 protocol.
XBee-PRO 802.15.4 – A higher power, longer range version of the XBee
802.15.4
XBee DigiMesh 2.4 – A 2.4 GHz XBee module which uses DigiMesh, a
sleeping mesh networking protocol developed by Digi International.
XBee-PRO DigiMesh 2.4 – A higher power, longer range version of the XBee
DigiMesh 2.4.
XBee ZB – An XBee module that incorporates the ZigBee PRO mesh
networking protocol.
XBee-PRO ZB – A higher power, longer range version of the XBee ZB.
XBee ZB SMT – A surface mount XBee running the ZigBee protocol.
XBee-PRO ZB SMT – A higher power, longer range version of the XBee ZB
SMT.
XBee SE – An XBee ZB module that incorporates the security cluster for the
Zigbee Smart Energy public profile.
XBee-PRO SE – A higher power, longer range version of the XBee SE.](https://image.slidesharecdn.com/551e3c5b-7ced-4408-a7e9-f3aaa451b3c5-150927112847-lva1-app6891/85/Thesis-Main-17-320.jpg)
![~ 10 ~
1.6 Previous Research Work
A wireless sensor network (WSN) is a system consisting of a collection of nodes
and a base station. A node is composed by a processor, local memory, sensors, radio and
battery and a base station is responsible for receiving and processing data collected by the
nodes.[1] The technological development in Wireless Sensor Networks made it possible
to use in monitoring and control of greenhouse parameter in precision agriculture. In last
decades there have been tremendous advancements in technology for agriculture and
growth of final yield.[2] The use of computational systems and technology in agricultural
applications has become viable, since the associated costs are decreasing.[3] In
agricultural applications, monitoring and control are essential to support consumer
requirements and to get productivity improvements. Two important branches of
agriculture are precision agriculture and vegetable cultivation in greenhouses, in which
the production management has to be more controlled, so that the values of a set of
parameters have to be approximated to a value considered ideal.[2][4][19]
. Temperature, humidity and water, radiation and CO2 concentration are the major
features that are monitored in greenhouses. WSNs should be applied in greenhouse
control systems, providing a distributed and real time sensing, obtaining parameters
values differences inside the greenhouse.[6] A distributed greenhouse control system
based on LonWorks technology is presented in (Pereira and Cugnasca, 2005)[19], where
the processing and communication connections are distributed among the components of
the system, called nodes.
Many researchers observed that, the greenhouse technology is well accepted in
agriculture engineering. The integration of wireless sensor network in green house is the
recent concept which leads to precision agriculture. Blackmore et al. in 1994 [4],
explained that, the system can be designed to increase the quality agricultural yield by,
properly monitoring soil and environment. They also observed that, in early stage of
WSN, farmers were reluctant to deploy it, because of high cost. Technological
development has reduced the cost. In addition to MEMS technology for hardware, some
other technologies like, satellite sensing, Remote Sensing, Global Positioning System and](https://image.slidesharecdn.com/551e3c5b-7ced-4408-a7e9-f3aaa451b3c5-150927112847-lva1-app6891/85/Thesis-Main-21-320.jpg)
![~ 11 ~
Geographical Information System are also contributing in overall progress [5]. Beckwith
et al. had worked on WSN in large scale vineyard on very large scale design and
deployment [6]. They work on 65 motes, which have only eight hops, to collect the data
of pH values. Predesigned crop management in precision agriculture is studied in the
Lofar Agro project, in Europe. In this project, Proper application of pesticides and
fertiliser as per real time environmental changes is explored. For effective control of crop
diseases like phytophthora, the information collected from a weather station and the
wireless network is very much useful [7].
Wireless sensors and smart transducers are equipped with some micro-controllers
for providing processing and network management capability. Standard like IEEE 1451.5
is also suitable to integrate the wireless sensors with the special transducer to build
intelligent wireless sensors with sensing, computing and communication capabilities.
Intelligent sensors and actuators can be used to carry out various automatic functions.
Wireless communication protocols, such as 802.11, 802.15.4 and 802.15.5 [8][20] can
also combine. A requirement for design of wireless sensor communications, including
issues related to wireless sensor model, user requirements, data integrity, security and
bandwidth all are well defined in this Standards.[2]
The total number of sensor nodes and actuators are depends on the size of
greenhouse. About 200 nodes are sufficient if the size of green house is 35m x 200 m.
This is the physical size of the targeted area. It is under the range of sensing capacity of
the hardware. The sensor nodes can be classified as ‗A‘, ‗B‘ and ‗C‘. Where type ‗A‘ is
climate sensor for outside, and type ‗B‘ is climate sensor for the inside of the greenhouse.
Maximum two nodes are more than enough for outside. Type ‗B‘ sensors can be placed at
a distance of 10 to 15 meters of diameter, to capture precise environmental condition. The
type ‗C‘ sensors are soil sensors, which are recommended to use, as per the layout plan of
the crop plantation. They can also control water flow of irrigation system used in
Greenhouse. They are typically used after every two meters. The different controlling
parameter ranges in various modes for some typical crop is as shown in Table 1. This
information collected from the data sheet about the crop [2][12].](https://image.slidesharecdn.com/551e3c5b-7ced-4408-a7e9-f3aaa451b3c5-150927112847-lva1-app6891/85/Thesis-Main-22-320.jpg)
![~ 12 ~
As the climate and fertilization are independent issues, they have different control
problems. The exact need of nutrients and amount water for different crop species can be
very well controlled, by automated machine which works on collected data. The amount
of water and fertilizers require to the plant is a function of climate environmental
conditions on which growth of the crop is depended. So that greenhouse crop production
is a complex issue [13]. The Climatic Control Variables are the dynamic behavior of the
greenhouse. Microclimate is a combination of physical processes involving energy
transfer (which includes radiation and heat) and mass balance (which includes water
vapour fluxes and CO2 concentration). This system depends on the outlet environmental
conditions, architecture of the greenhouse, performance of the control actuators and
variety of crop. Proper ventilation and heating are the main way controlling greenhouse
climate. For controlling inside temperature, humidity and shading the artificial light is
used. CO2 injection is a control to influence photosynthesis and fogging [14].
Growth of Plants depends on the photosynthesis process which is a
measure of photosynthetically active radiation. It is observed that proper temperature
level influences the speed of sugar production by photosynthesis radiation. Temperature
has to be control properly since higher radiation level may give a higher temperature.
Hence, in the diurnal state, it is necessary to adjust the temperature at an optimal level for
the photosynthesis process. In nocturnal conditions, plants are not active therefore; it is
not necessary to maintain such a high temperature. For this reason, two temperature set-
points are usually considered are diurnal and nocturnal [15].
Water vapour inside the greenhouse is one of the most significant variables
affecting the crop growth. High humidity may increase the probability of diseases and
decrease transpiration. Low humidity may cause hydria stress, closing the stomata and
thus it may lower down the process of photosynthesis which depends on the CO2
assimilation. The humidity control is complex because if temperature changes then
relative humidity changes inversely. Temperature and humidity are controlled by the
same actuators. The main priority is for temperature control because it is the primary
factor in the crop growth. Based on the inside relative humidity value the temperature set-
point can be adjusted to control the humidity within a determined range. Hence to control](https://image.slidesharecdn.com/551e3c5b-7ced-4408-a7e9-f3aaa451b3c5-150927112847-lva1-app6891/85/Thesis-Main-23-320.jpg)
![~ 13 ~
the required humidity is very complex task. For proper control of humidity internal air
can be exchange with outside air by properly controlling ventilations of the green house
[16].
Soil water also affects the crop growth. Therefore, the monitor & control of soil
condition has a specific interest, because good condition of a soil may produce the proper
yield. The proper irrigations and fertilizations of the crops are varies as per the type, age,
phase and climate. The pH value, moisture contains, electric conductivity and the temp of
a soil are some key parameters. The pH valves and other parameters will help to monitor
the soil condition. The temperature and the moisture can be controlled by the irrigation
techniques like drift and sprinkles system in a greenhouse. The temperature of the soil
and the inside temperature of the green house are interrelated parameters, which can be,
control by proper setting of ventilation. Since the temperature control is depends on direct
sun radiation and the screen material used, the proper set point can adjust to control soil
temperature. The temperature set-point value depends on actual temperature of the inside
and outside of the greenhouse [17].
In green house technology, more number of the parameters is to be control
because, the varieties of the crop are large. They are increasing day by day because of the
development in agriculture technology. In this situation, the wireless sensor network with
additional hardware and software is an efficient solution for green house control.
Experimentally it is proved that the hardware develop by Cypress Inc. is the best solution
which works on low power with less complexity and high reliability for greenhouse
control. In the future, if parameter still increase, then for WSN technology with currently
available bandwidth, may not be sufficient. Then WSN with cognitive radio technology
may be the solution. This advancement in precision agriculture through Wireless Sensor
Network in green house control is extremely useful. This has scope in developing
countries in globe, where agriculture is the main business.[2]](https://image.slidesharecdn.com/551e3c5b-7ced-4408-a7e9-f3aaa451b3c5-150927112847-lva1-app6891/85/Thesis-Main-24-320.jpg)
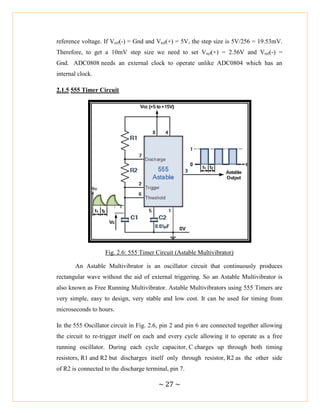
![~ 28 ~
Then the capacitor charges up to 2/3Vcc (the upper comparator limit) which is
determined by the 0.693(R1+R2)C combination and discharges itself down to 1/3Vcc
(the lower comparator limit) determined by the 0.693(R2.C) combination. This results in
an output waveform whose voltage level is approximately equal to Vcc – 1.5V and whose
output ―ON‖ and ―OFF‖ time periods are determined by the capacitor and resistors
combinations.
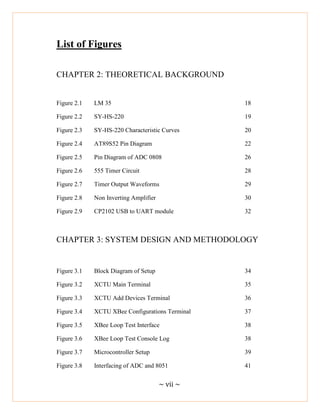
Fig. 2.7: Timer Output Waveforms
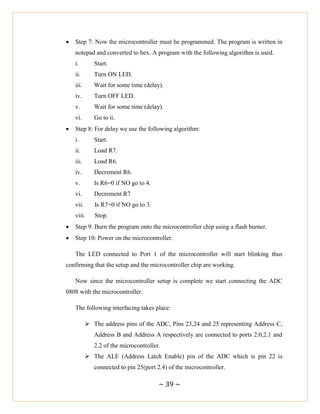
In the thesis project, a clock frequency of a 100 KHz is needed to run the ADC 0808.
This frequency is obtained by giving the following values:-
R1 = 100 ohm
R2 = 500 ohm
C1 = 0.01 µF
By giving the above values in the clock circuit we get an output frequency of 100 KHz
according the equation:
[( ) ]](https://image.slidesharecdn.com/551e3c5b-7ced-4408-a7e9-f3aaa451b3c5-150927112847-lva1-app6891/85/Thesis-Main-39-320.jpg)


![~ 53 ~
References
[1] Luciano Gonda, Carlos Eduardo Cugnasca Computers in Agriculture and Natural Resources,
A Proposal of Greenhouse Control Using Wireless Sensor Networks 4th World Congress
Conference, Proceedings of the 24-26 July 2006 (Orlando, Florida USA) Publication Date 24 July
2006 ASABE Publication Number 701P0606. Eds. F. Zazueta, J. Kin, S. Ninomiya and G.
Schiefer.
[2] D.D.Chaudhary , S.P.Nayse , L.M.Waghmare International Journal of Wireless & Mobile
Networks (IJWMN) 140 APPLICATION OF WIRELESS SENSOR NETWORKS FOR
GREENHOUSE PARAMETER CONTROL IN PRECISION AGRICULTURE Vol. 3, No. 1,
February 2011 DOI : 10.5121/ijwmn.2011.3113
[3] J. Burrell et al. Vineyard computing: sensor networks in agricultural production. IEEE
Pervasive Computing, 3(1):38–45, Jan-Mar 2004.
[4] Blackmore, S. (1994). ―Precision Farming: An Introduction. Outlook on Agriculture‖ 23(4)
4, 275-280.
[5] Ning Wang, Naiqian Zhang, Maohua Wang, ―Wireless sensors in agriculture and food
Industry —Recent development and future perspective, published in Computers and Electronics
in Agriculture 50 (2006) 1–14.
[7] A. Baggio, "Wireless Sensor Networks in Precision Agriculture," 2005
[8] I. F., Su, W., Sankarasubramaniam, Y., & Cayirci, E. (2002). ―Wireless sensor networks: a
survey on Computer Networks, 38, 393-422.
[9] Guide et al. Automatic data acquisition and control mobile laboratory network for crop
production systems data management and spatial variability studies in the Brazilian Centre-West
region. ASAE 2001 Annual International Meeting. Paper No. 01-1046, pp. 1-8.
[10] Lee et al. Silage yield monitoring system. ASAE 2002, Paper No.021165.
[11] Ning Wang, Naiqian Zhang, Maohua Wang,‖ Wireless sensors in agriculture and food
industry—Recent development and future perspective‘ http://www.ecaa.ntu.edu.tw
[12] Cugati et al. 2003. Automation concepts for the variable-rate fertilizer applicator tree
farming. The Proceedings of the 4th European Conference in Precision Agriculture, Berlin,
Germany.
[13] K. Mayer, K. Taylor, and K. Ellis. Cattle health monitoring using wireless sensor networks.
In Second IASTED International Conference on Communication and Computer
Networks,Cambridge, Massachusetts, USA, Nov. 2004.
[14] T. Schoellhammer, B. Greenstein, E. Osterweil, M. Wimbrow, and D. Estrin. Lightweight
Networked Sensors (EmNetS-I), Tampa, Florida, USA, Nov. 2004.
[15] J. Thelen et al. Radio wave propagation in potato fields. In First workshop on Wireless
Network Measurements (located with WiOpt 2005), Riva del Garda, Italy, Apr. 2005.](https://image.slidesharecdn.com/551e3c5b-7ced-4408-a7e9-f3aaa451b3c5-150927112847-lva1-app6891/85/Thesis-Main-64-320.jpg)
![~ 54 ~
[16] W. Zhang, G. Kantor, and S. Singh Integrated wireless sensor/actuator networks in
agricultural applications. In Second ACM International Conference on Embedded Networked
Sensor Systems (SenSys), page 317, Baltimore, Maryland, USA, Nov. 2004.
[17] Stipanicev D., Marasovic J.,‖ Network embedded greenhouse monitoring and control,
Proceedings of 2003 IEEE Conference on Control Applications, Vol.2, June, pp. 1350 - 1355,
2003
[18] Thomas D. Petite, Richard M. Huff, ―System and method for monitoring and controlling
remote devices ,‖ U.S. Patent 6437692 B1, Aug 20, 2002.
[19] NS-2. 2006. The Network Simulator - ns-2. http://www.isi.edu/nsnam/ns/, accessed in May,
2006. Pereira, G. A.; Cugnasca, C. E. 2005. Application of LonWorks Technology Distributed
Control in Greenhouses. In: Proceedings of 2005 EFITA/WCCA Joint Congress on IT in
Agriculture, 1:1349-1354, Vila Real, Portugal. R. Beckwith, D. Teibel, and P. Bowen, "Unwired
wine: sensor networks in vineyards," 2004, pp.561- 564](https://image.slidesharecdn.com/551e3c5b-7ced-4408-a7e9-f3aaa451b3c5-150927112847-lva1-app6891/85/Thesis-Main-65-320.jpg)