The ultraviolet and visible region of the electromagnetic spectrum
1.
Chapter 2
UV-Visible Spectroscopy
Theultraviolet and visible region of the electromagnetic spectrum
covers the wavelength range from about 100 nm to about 800 nm. The
vacuum ultraviolet region, which has the shortest wavelengths and
highest energies (100–200 nm), is difficult to make measurements in
and is little used in analytical procedures. The ultraviolet region of the
spectrum is generally considered to range from 200 to 400 nm and the
visible region from 400 to 800 nm.
1
2.
The corresponding energiesfor these regions are about 150 to 72
and 72 to 36 kcal/mole, respectively. Energy of this magnitude
often corresponds to the energy difference between electronic states
of many molecules which results in transitions between electronic
energy levels, particularly in the valence shell. The principle
involved in the electronic transitions as well as instruments used for
recording the spectra are common to both the ultraviolet and visible
regions, and hence, it is convenient to discuss UV-Visible
spectroscopy together.
2
3.
The electronic transitionsthat occur in molecules result in a more
complex spectra; electronic transition accompanied by the vibronic
and rovibronic transitions which can gives rise to bands in the
spectrum called the electronic band system which consist of the
vibrational coarse structure and the rotational fine structure, usually
observed in high-resolution spectra. In low resolution spectra and the
spectra of liquid phase samples the vibrational coarse structure may
not be resolved and appears as a single band.
3
4.
Gaseous molecules showvibrational coarse structure and rotational
fine structure. However, the fine structure is not observed in spectra
of solutions due to collisions between the solute and solvent
molecules resulting in overlapping of spectral lines into broad bands.
The resulting overlapping bands coalesce to give one or more broad
band envelopes each band characterized by the position of a
wavelength maximum (max); the wavelength at which maximum
absorbance observed. The intensity of the band corresponds to molar
absorptivity (ɛ). For polyatomic organic molecules and metal
complexes, the complete spectrum may contain several bands arising
from a number of electronic transitions and their associated
vibrational and rotational fine structures.
4
5.
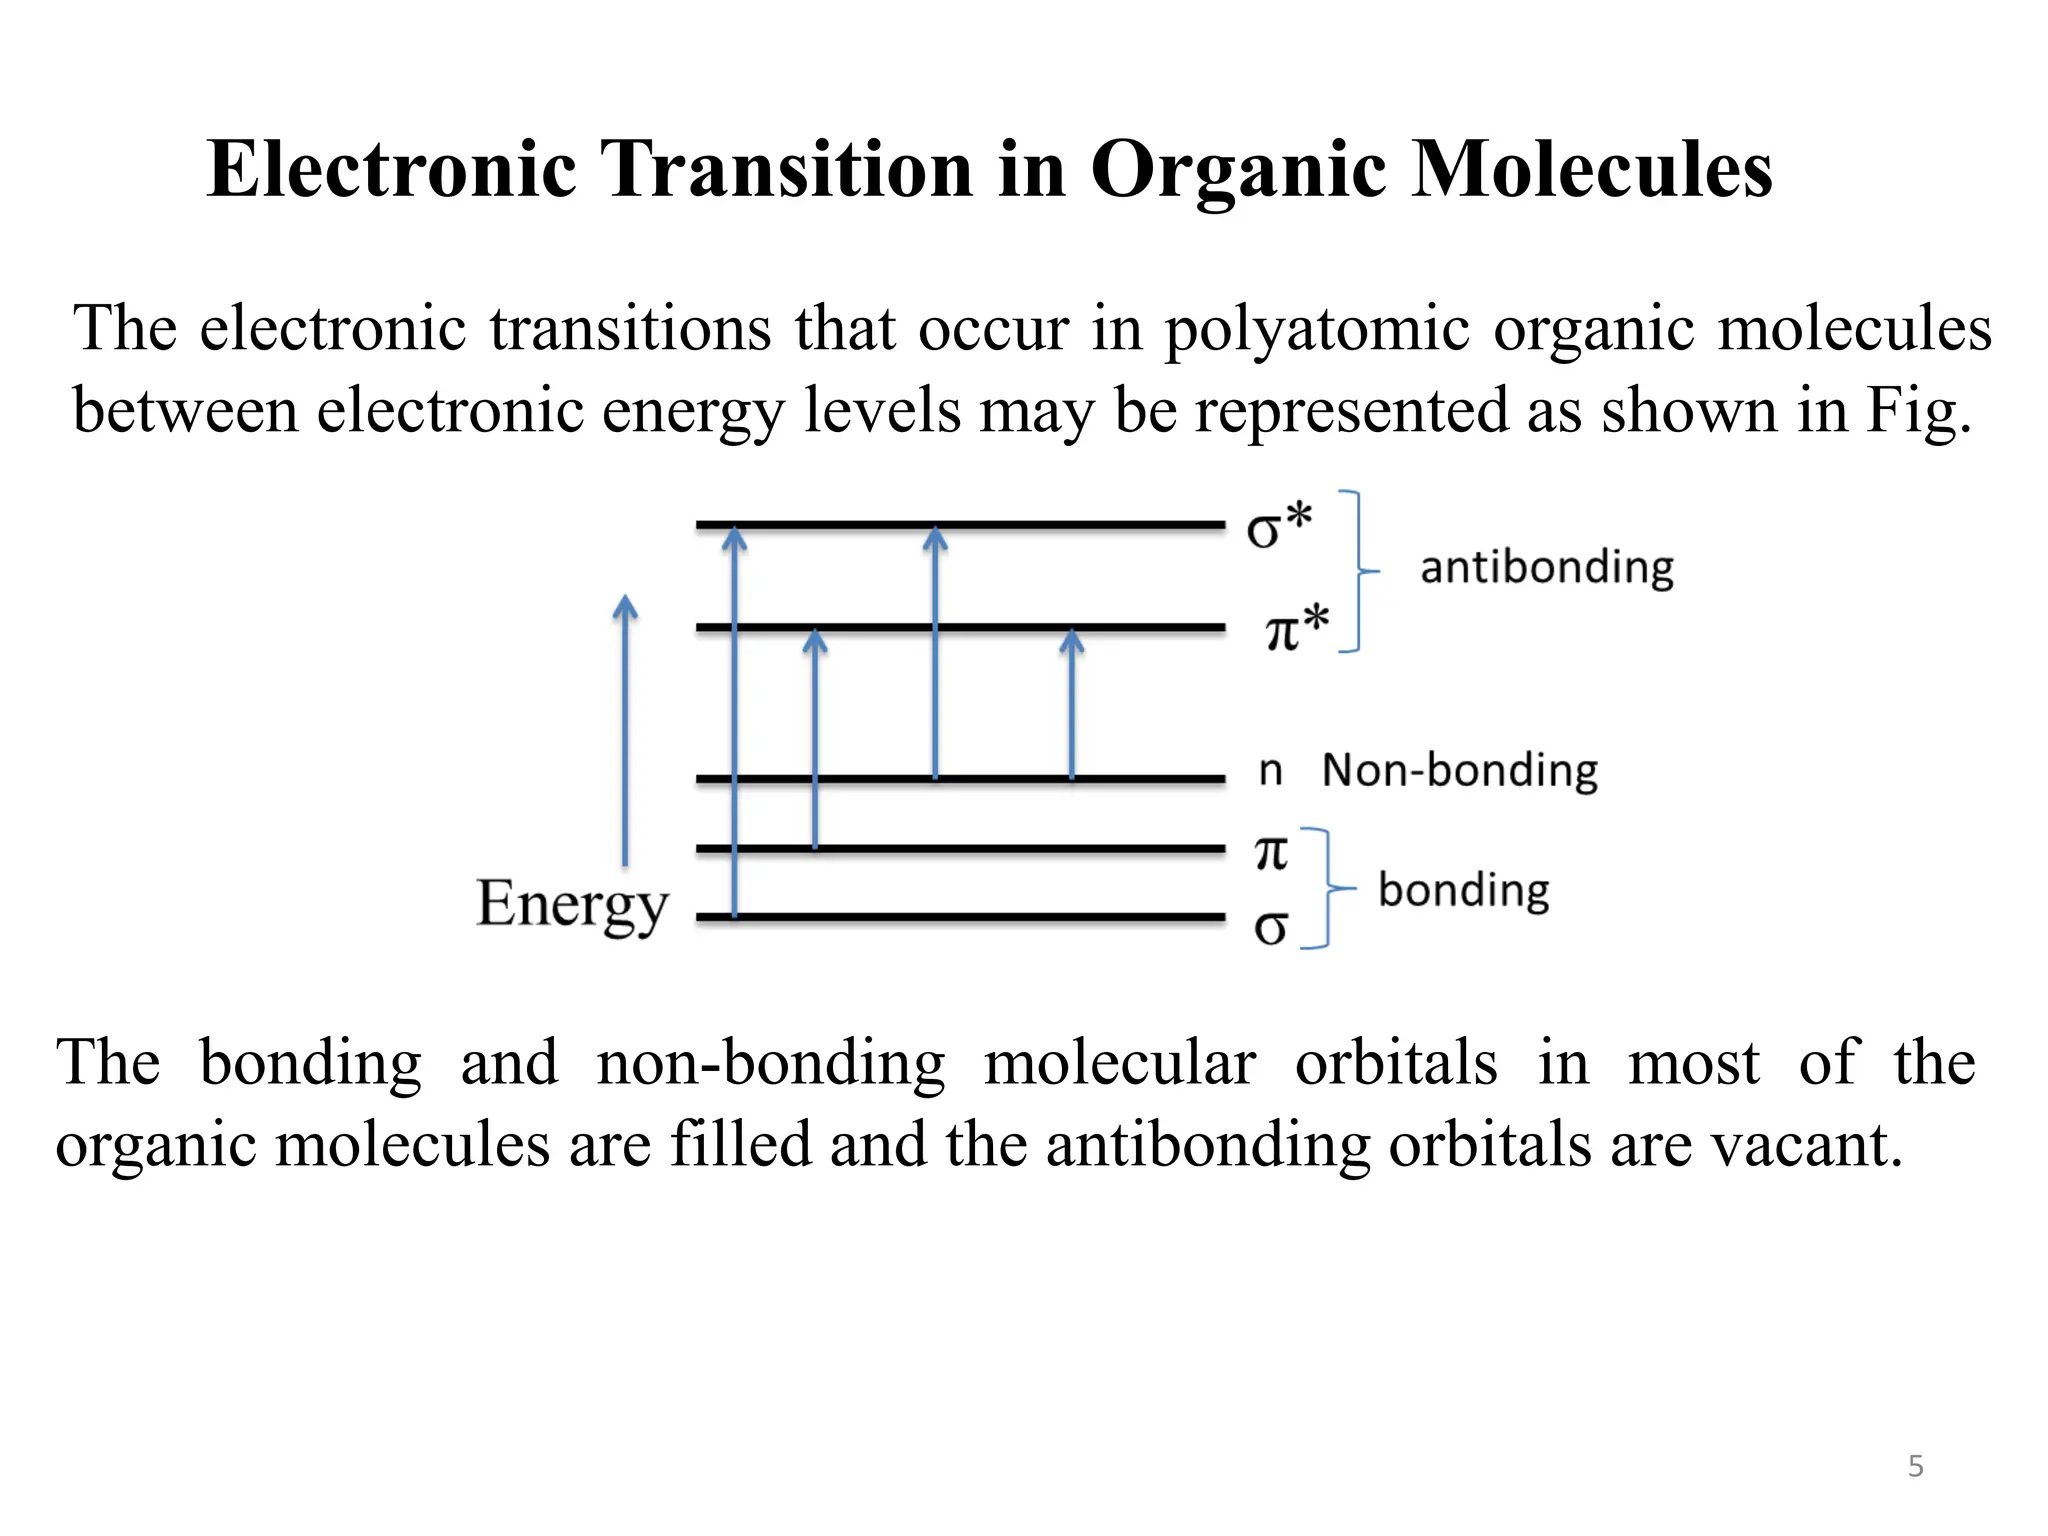
Electronic Transition inOrganic Molecules
The electronic transitions that occur in polyatomic organic molecules
between electronic energy levels may be represented as shown in Fig.
The bonding and non-bonding molecular orbitals in most of the
organic molecules are filled and the antibonding orbitals are vacant.
5
6.
The various electronictransitions that can take place may be
classified into (i) σ-σ*, (ii) n-σ*, (iii) π-π*, and (iv) n-π*. The
relative energy changes involved in these transitions are in the
increasing order
n-π* < π-π* < n-σ* < < σ-σ*
The intensities of the π-π* and σ-σ* transitions are quite large (ɛ is
large) while other two transitions are considerably weak due to
unfavourable selection rules.
6
7.
The σ-σ* transitionsof organic molecules involve a large change in
energy, and hence, take place in the far or vacuum ultraviolet region
(in the range of 120 – 200nm). Saturated hydrocarbons contain
molecular orbitals of σ and σ* type only and are transparent (do not
absorb radiation) to near UV and visible radiation. Alkanes, for
example, methane and ethane show max at 122 nm and 135 nm
respectively. Cycloalkanes, for example, cyclohexane absorbs at
wavelengths shorter than 150 nm.
The n-σ* transitions are observed in molecules containing
heteroatoms (N, O, S, or halogens) and involve excitation of an
electron in unshared pair on the heteroatom to the antibonding σ*
orbital. Examples of substances which show n-σ* transitions include
water (167 nm), methanol (183 nm), methyl chloride (173 nm),
methyl iodide (258 nm), trimethylamine (227 nm), and 1-iodobutane
(257 nm).
7
8.
The π-π* transitionsobserved in the UV region for organic compounds
containing double bonds involving heteroatoms, for example, C=C,
C=O, C=S, N=O, N=N, etc. These groups called chromophores absorb
intensely giving rise to strong absorption bands with very high molar
absorptivity of the order of 5000–10,000Lmol-1cm-1.
The n-π* transitions occur between the non-bonding and antibonding
orbitals. The absorption bands due to these transitions are less intense
because the non-bonding orbitals are situated in a plane perpendicular to
the π* orbitals and the transition probability is strictly zero according to
selection rules. However, these transitions are observed usually as weak
absorption bands in the longest wavelength regions of UV and visible
spectrum.
8
9.
Factors Affecting AbsorptionBands
Factors that affect the positions and the intensities of the absorption
bands of organic compounds include (i) presence of chromophores,
(ii) presence of auxochromes as substituent groups in the
chromophore, (iii) conjugation with other chromophores, and (iv)
solvent effects.
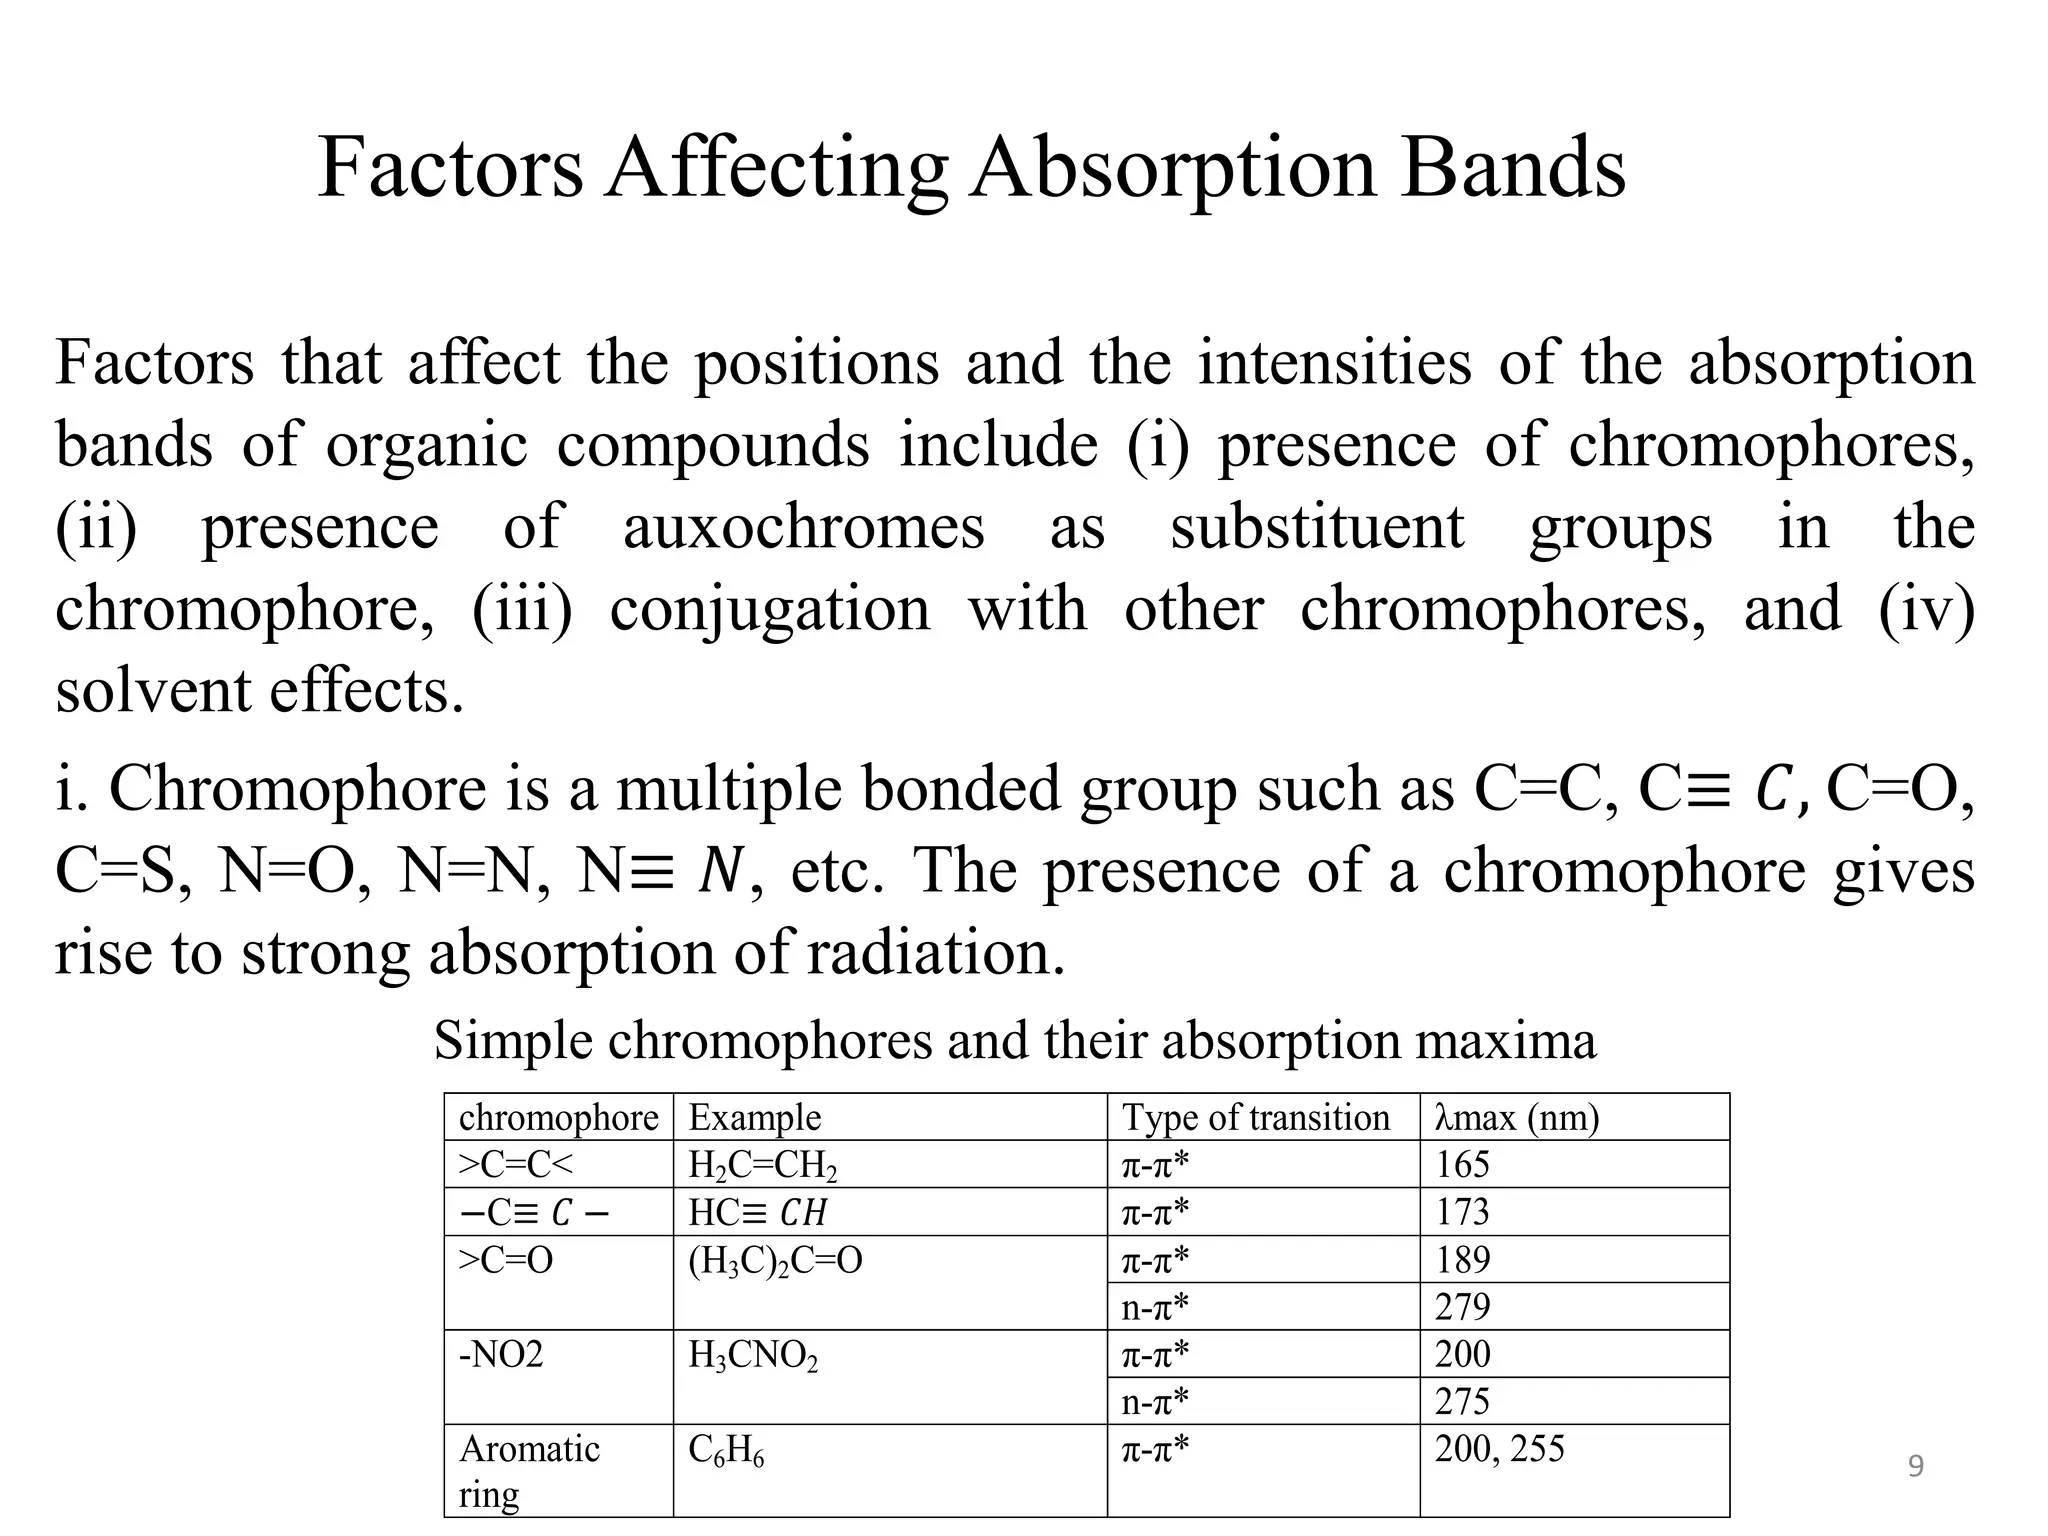
i. Chromophore is a multiple bonded group such as C=C, C≡ 𝐶, C=O,
C=S, N=O, N=N, N≡ 𝑁, etc. The presence of a chromophore gives
rise to strong absorption of radiation.
Simple chromophores and their absorption maxima
chromophore Example Type of transition λmax (nm)
>C=C< H2C=CH2 π-π* 165
−C≡ 𝐶 − HC≡ 𝐶𝐻 π-π* 173
>C=O (H3C)2C=O π-π* 189
n-π* 279
-NO2 H3CNO2 π-π* 200
n-π* 275
Aromatic
ring
C6H6 π-π* 200, 255 9
10.
ii. Auxochromes isa functional groups that does not by itself absorb in the
UV region but shifts the absorption peaks of chromophore groups to longer
wavelengths. An auxochrome is a saturated functional group containing
heteroatom (e.g., -OH, -Cl, -OR, -NR2, etc). The presence of an
auxochrome modifies the absorption characteristics of the chromophores,
deepening the colour in most cases.
Bathochromic shift or red shift refers to the shift of the absorption
maximum towards the longer wavelengths. Red shift occurs due to the
presence of an auxochromes attached to a chromophore and also by a
change in the solvent medium. Red shift of absorption bands of π-π*
transitions occurs in polar solvents. The excited π* state is more affected by
attractive dipole–dipole interactions and hydrogen-bonding than the unexcited π state.
Therefore, if a molecule is dissolved in a polar solvent, the energy level of the π*
antibonding orbital will decrease more than the energy level of the π bonding orbital.
10
11.
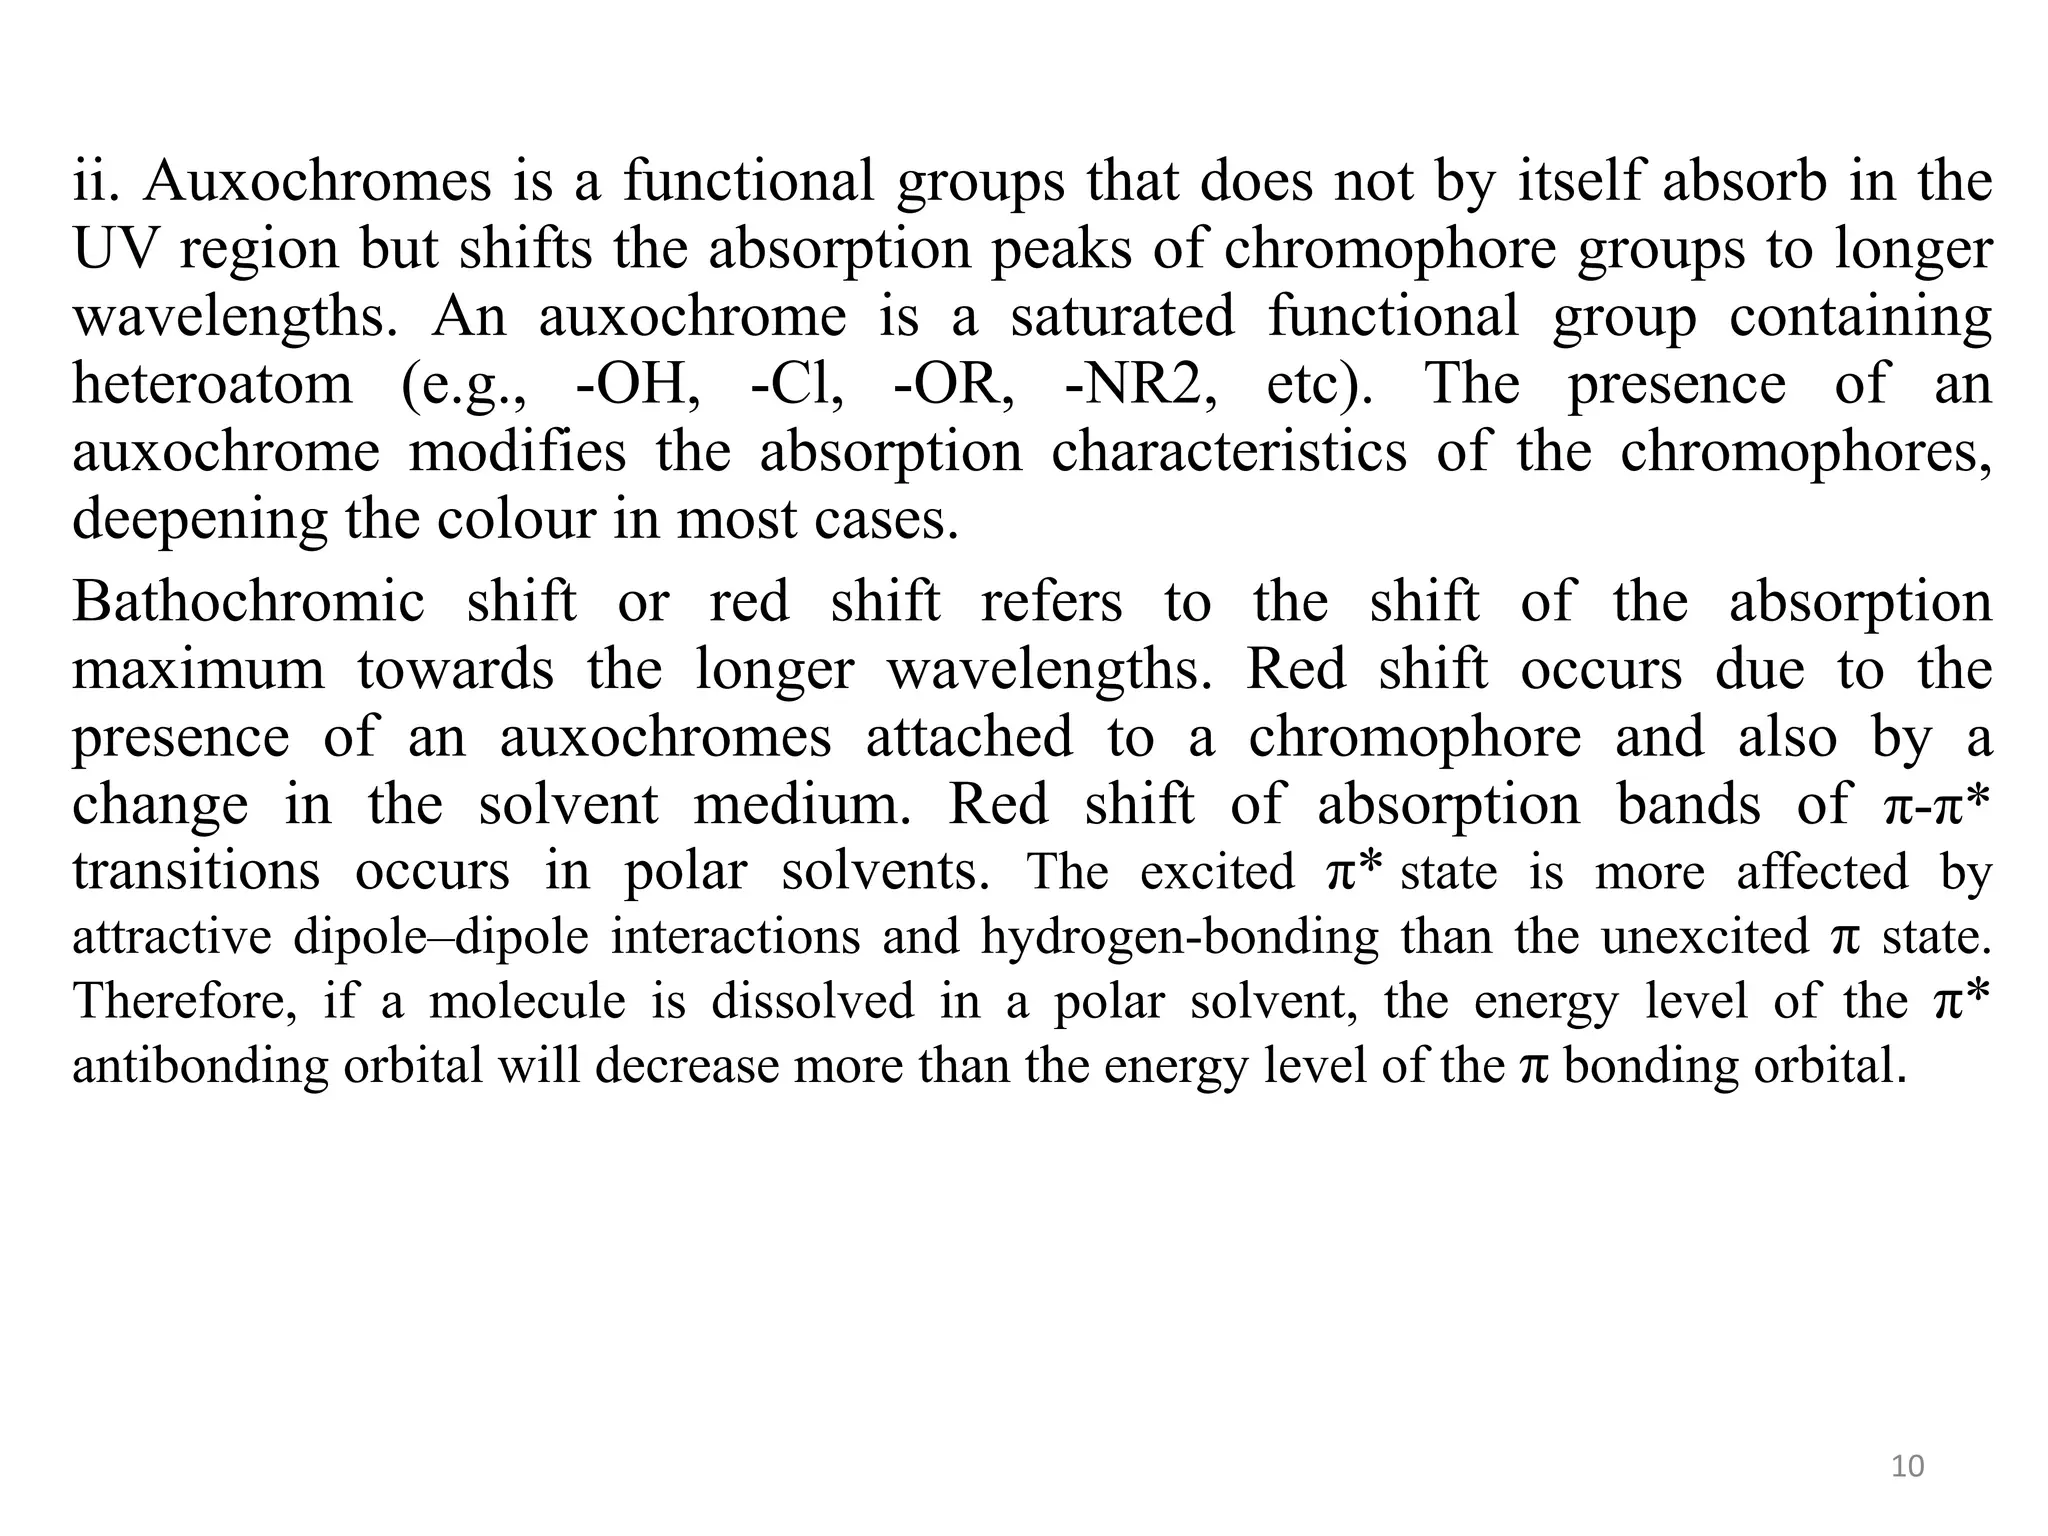
The energy differencein the polar solvent is less than the energy
difference when the molecule is in a nonpolar solvent. As a
consequence, the absorption maximum is changed to a longer
wavelength in a polar solvent.
If the π* energy level is decreased by attractive forces in polar
solvents, it should be expected that the n-π* transition will also show
a red shift in polar solvents.
The energy difference between the π
and π*levels is decreased in the polar
solvent. The absorption wavelength
therefore increases. This is a
bathochromic or red shift.
11
12.
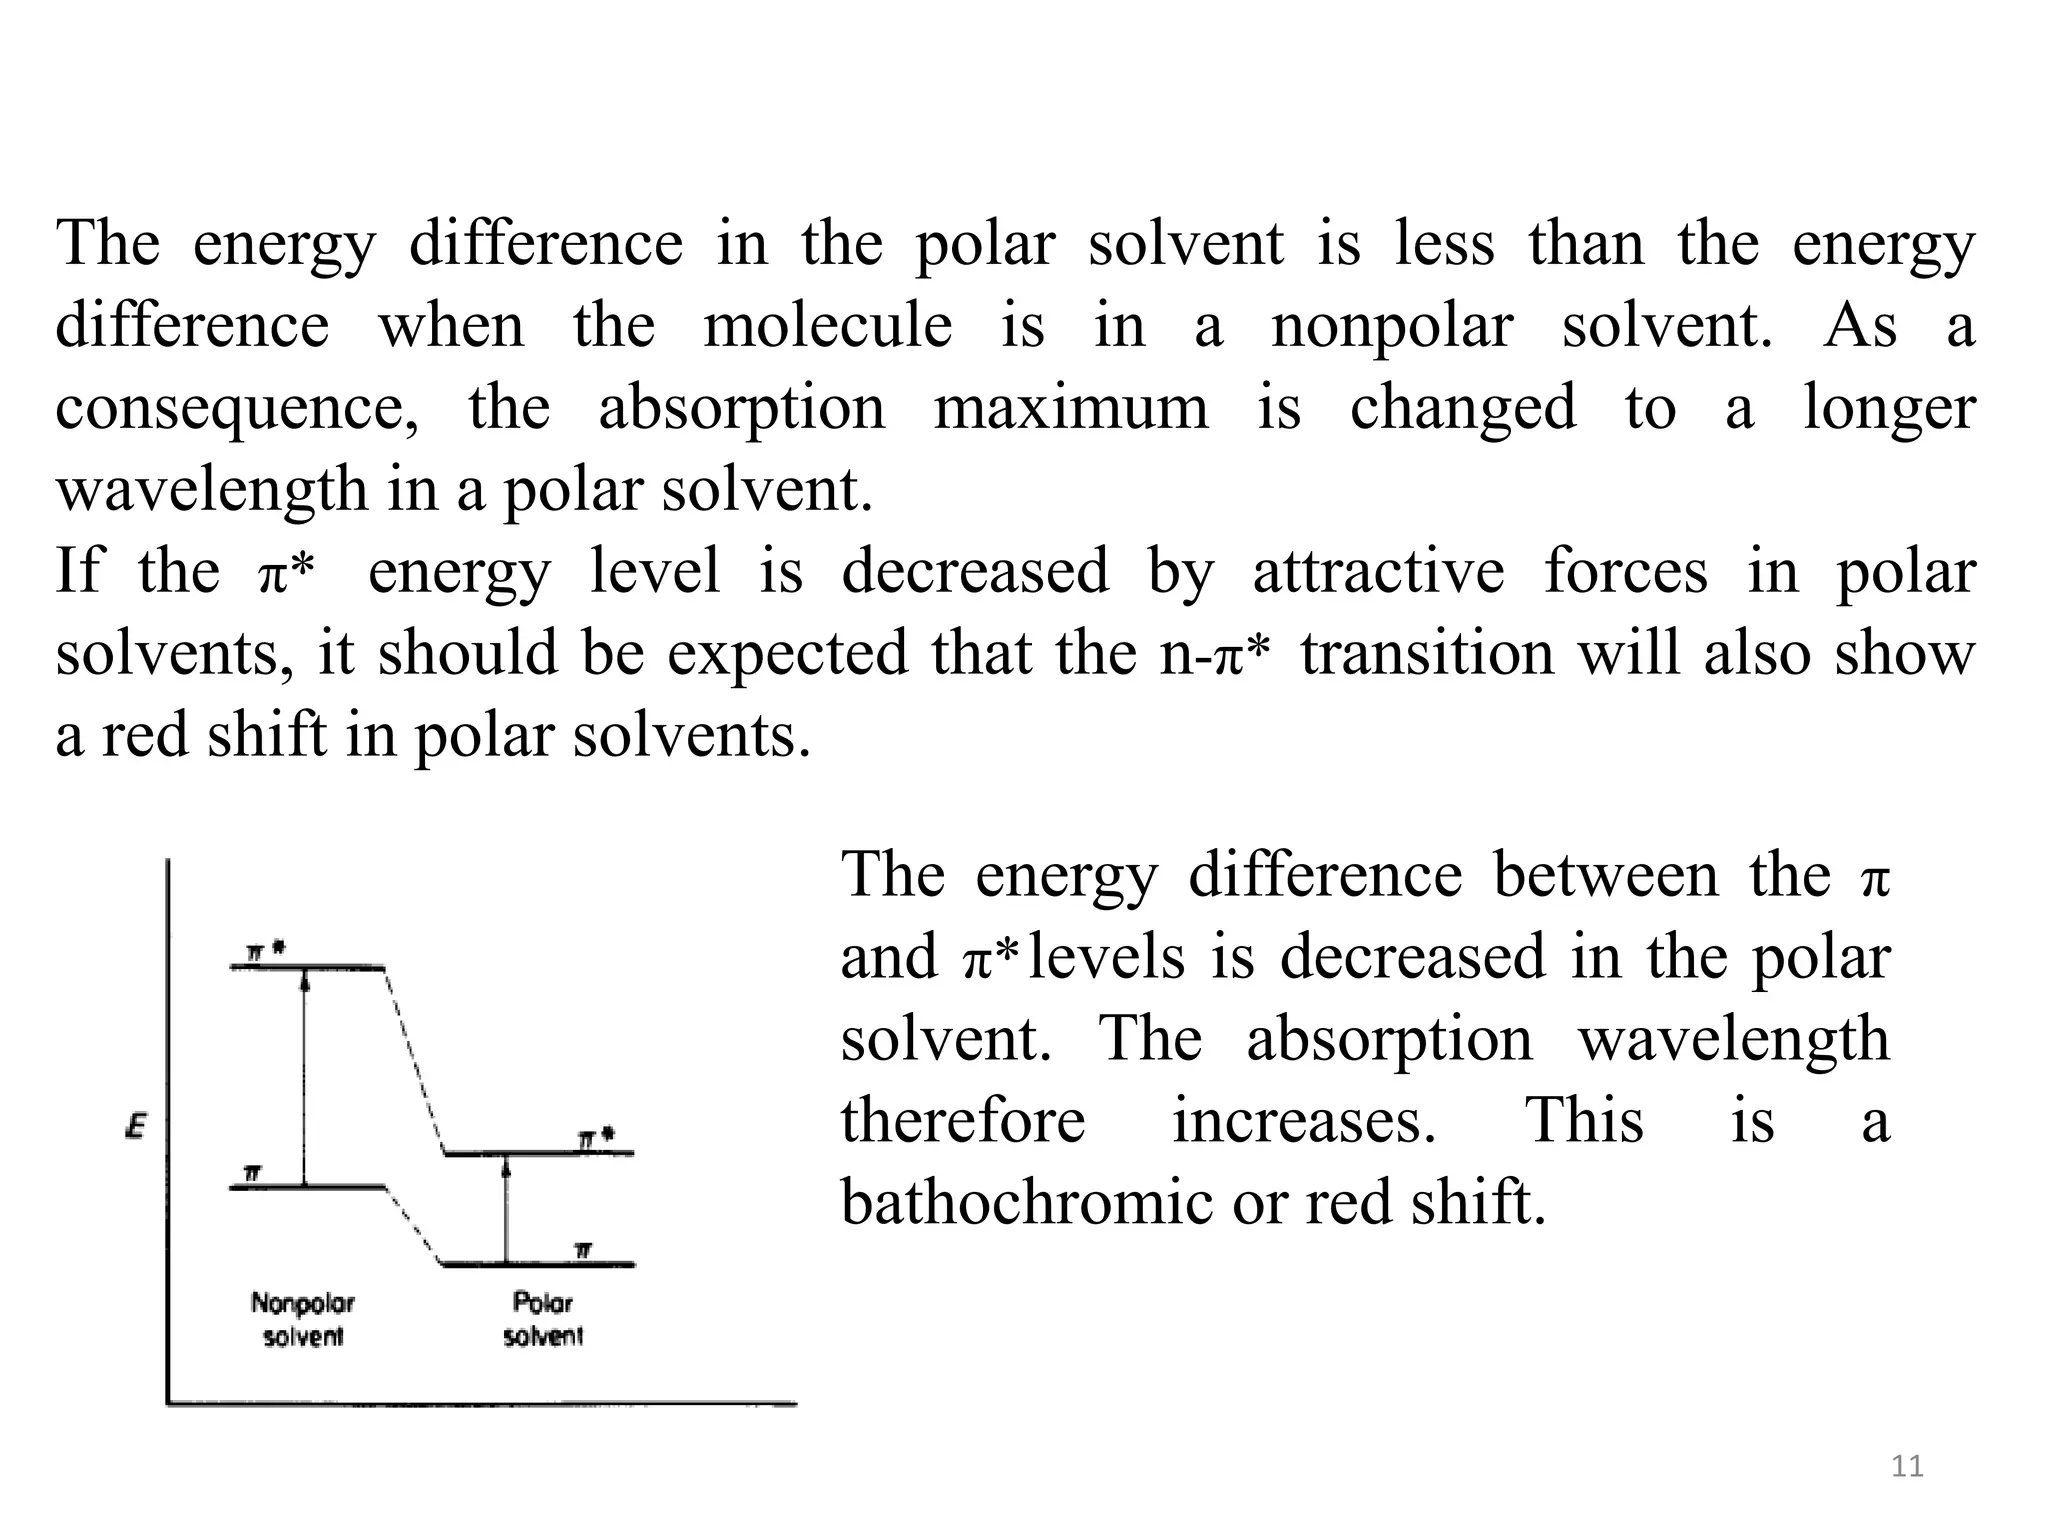
Expected absorption spectrumof a
molecule in a nonpolar solvent exhibiting
π-π* and n-π* transitions. Note the
difference in absorptivity of the two
transitions.
Expected absorption spectrum for the molecule
dissolved in a polar solvent such as ethanol.
There is a bathochromic (red) shift in the π-π*
transition and a hypsochromic (blue) shift in
the n-π* transition.
12
13.
Conjugated chromophores causered shift of absorption bands and
also enhance the intensity of the bands compared to isolated
chromophores. The red shift is attributed to delocalization of π
electrons and consequent lowering of the energy of the π* orbital and
give it less antibonding character. For example, the max of ethylene
shifts from 165 nm to longer wavelength of 217 nm in conjugated
butadiene. Similarly, the π-π* transition in acetone at 189 nm shifts to
219 nm in α, β-unsaturated ketone H2C=CH-CO-CH3 because of
conjugation of C=O with C=C.
13
14.
Red shift dueto alkyl substitution in conjugated dienes is additive,
and hence, it is possible to predict the position of absorption
maximum in open chain dienes and six-membered ring
compounds. Woodward put forward rules to predict the positions
of absorption maximum in these compounds which were later
modified by Fieser and Scott. These rules are known as
Woodward-Fieser rules and are applicable to dienes and trienes.
14
15.
There are essentiallyfour organic molecular systems of interest. The
principal parent chromophore systems are (1) conjugated dienes, (2)
monosubstituted benzene rings, (3) disubstituted benzene rings, and
(4) conjugated carbonyl systems. The method of calculation is to
identify a parent system and assign an absorption maximum. The
parent system is then modified by the presence of other systems
within the molecule. From these modifications, the absorption
maximum of a specific molecular structure can be calculated.
15
16.
Conjugated Diene Systems
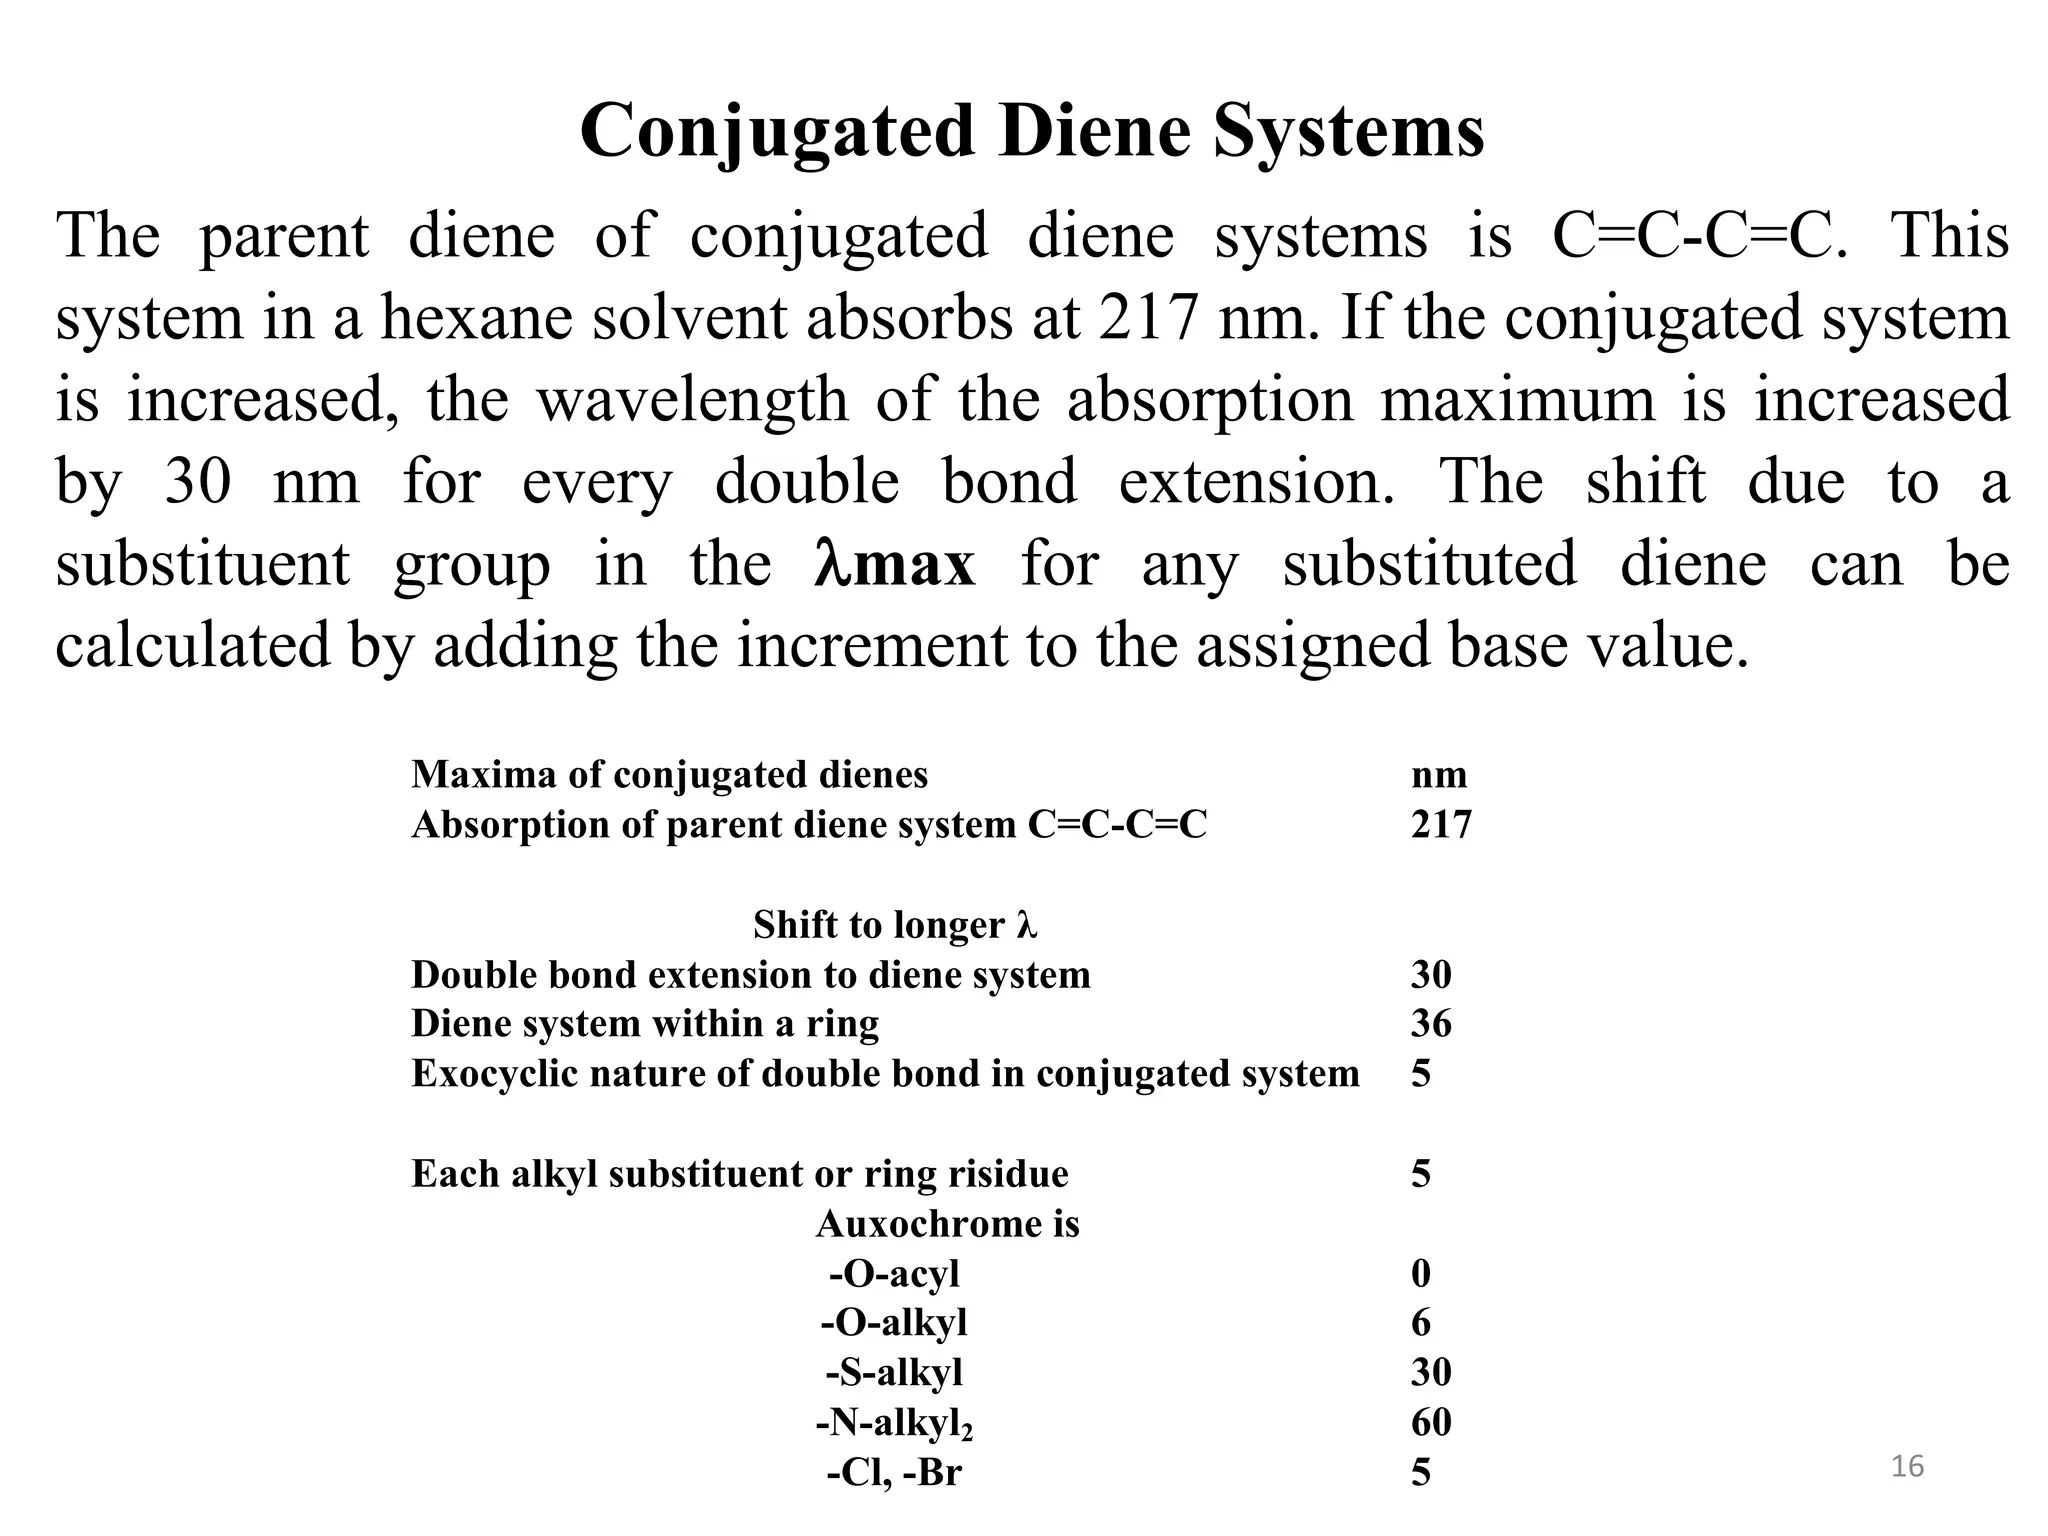
Theparent diene of conjugated diene systems is C=C-C=C. This
system in a hexane solvent absorbs at 217 nm. If the conjugated system
is increased, the wavelength of the absorption maximum is increased
by 30 nm for every double bond extension. The shift due to a
substituent group in the max for any substituted diene can be
calculated by adding the increment to the assigned base value.
Maxima of conjugated dienes nm
Absorption of parent diene system C=C-C=C 217
Shift to longer λ
Double bond extension to diene system 30
Diene system within a ring 36
Exocyclic nature of double bond in conjugated system 5
Each alkyl substituent or ring risidue 5
Auxochrome is
-O-acyl 0
-O-alkyl 6
-S-alkyl 30
-N-alkyl2 60
-Cl, -Br 5 16
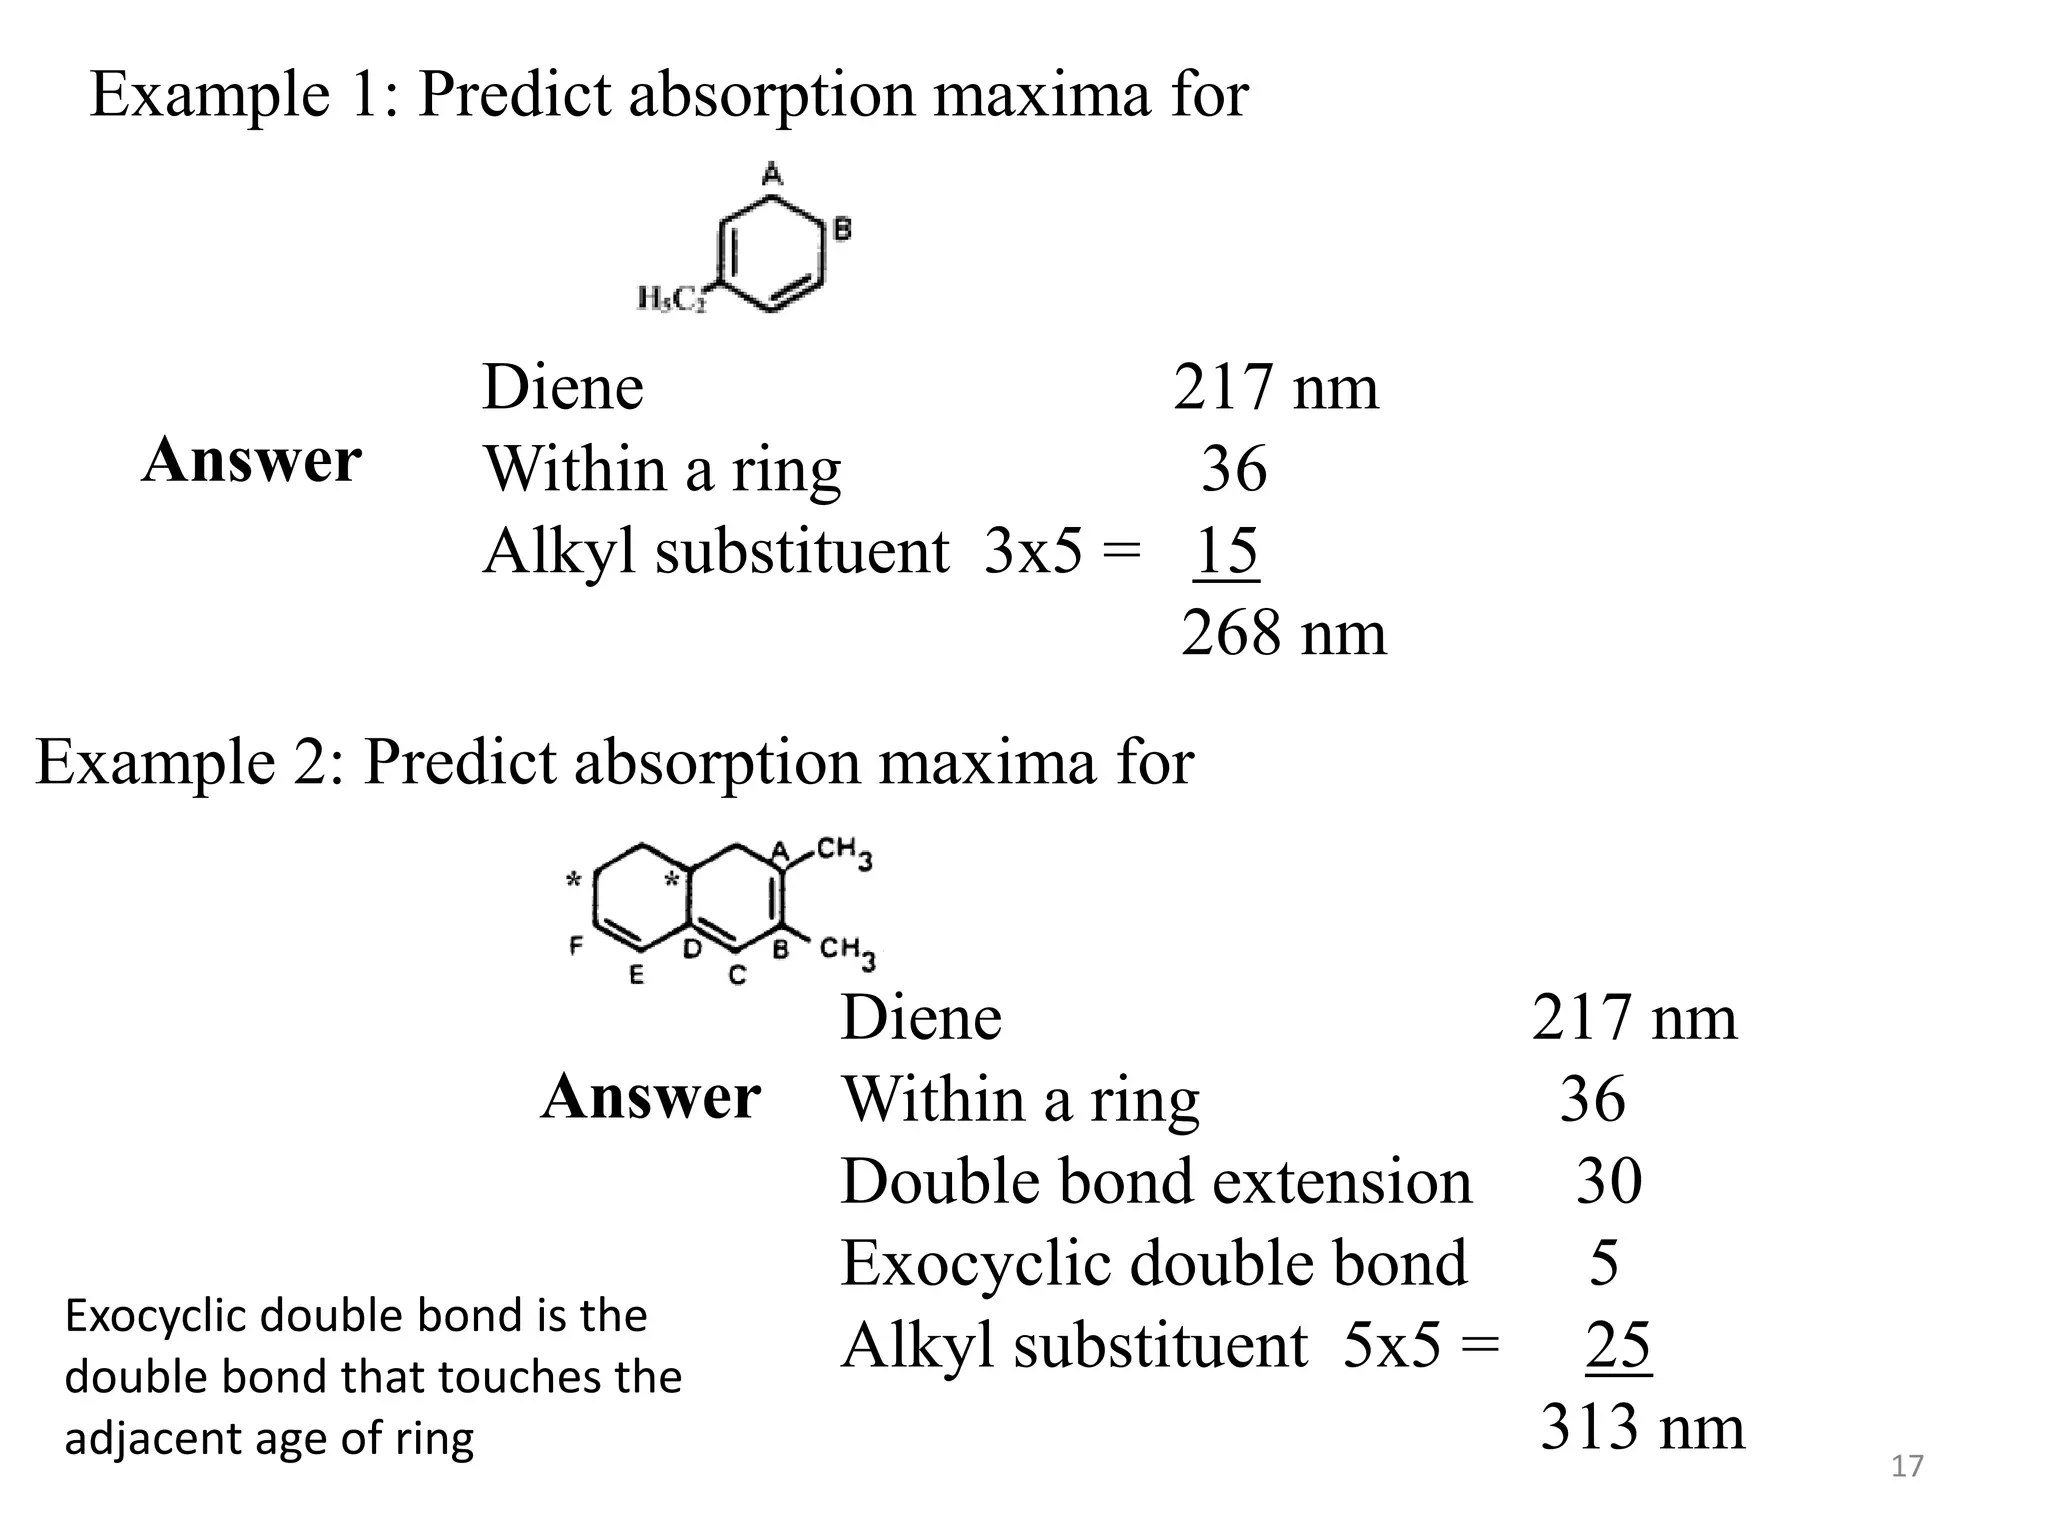
17.
Example 1: Predictabsorption maxima for
Answer
Diene 217 nm
Within a ring 36
Alkyl substituent 3x5 = 15
268 nm
Example 2: Predict absorption maxima for
Answer
Diene 217 nm
Within a ring 36
Double bond extension 30
Exocyclic double bond 5
Alkyl substituent 5x5 = 25
313 nm
Exocyclic double bond is the
double bond that touches the
adjacent age of ring 17
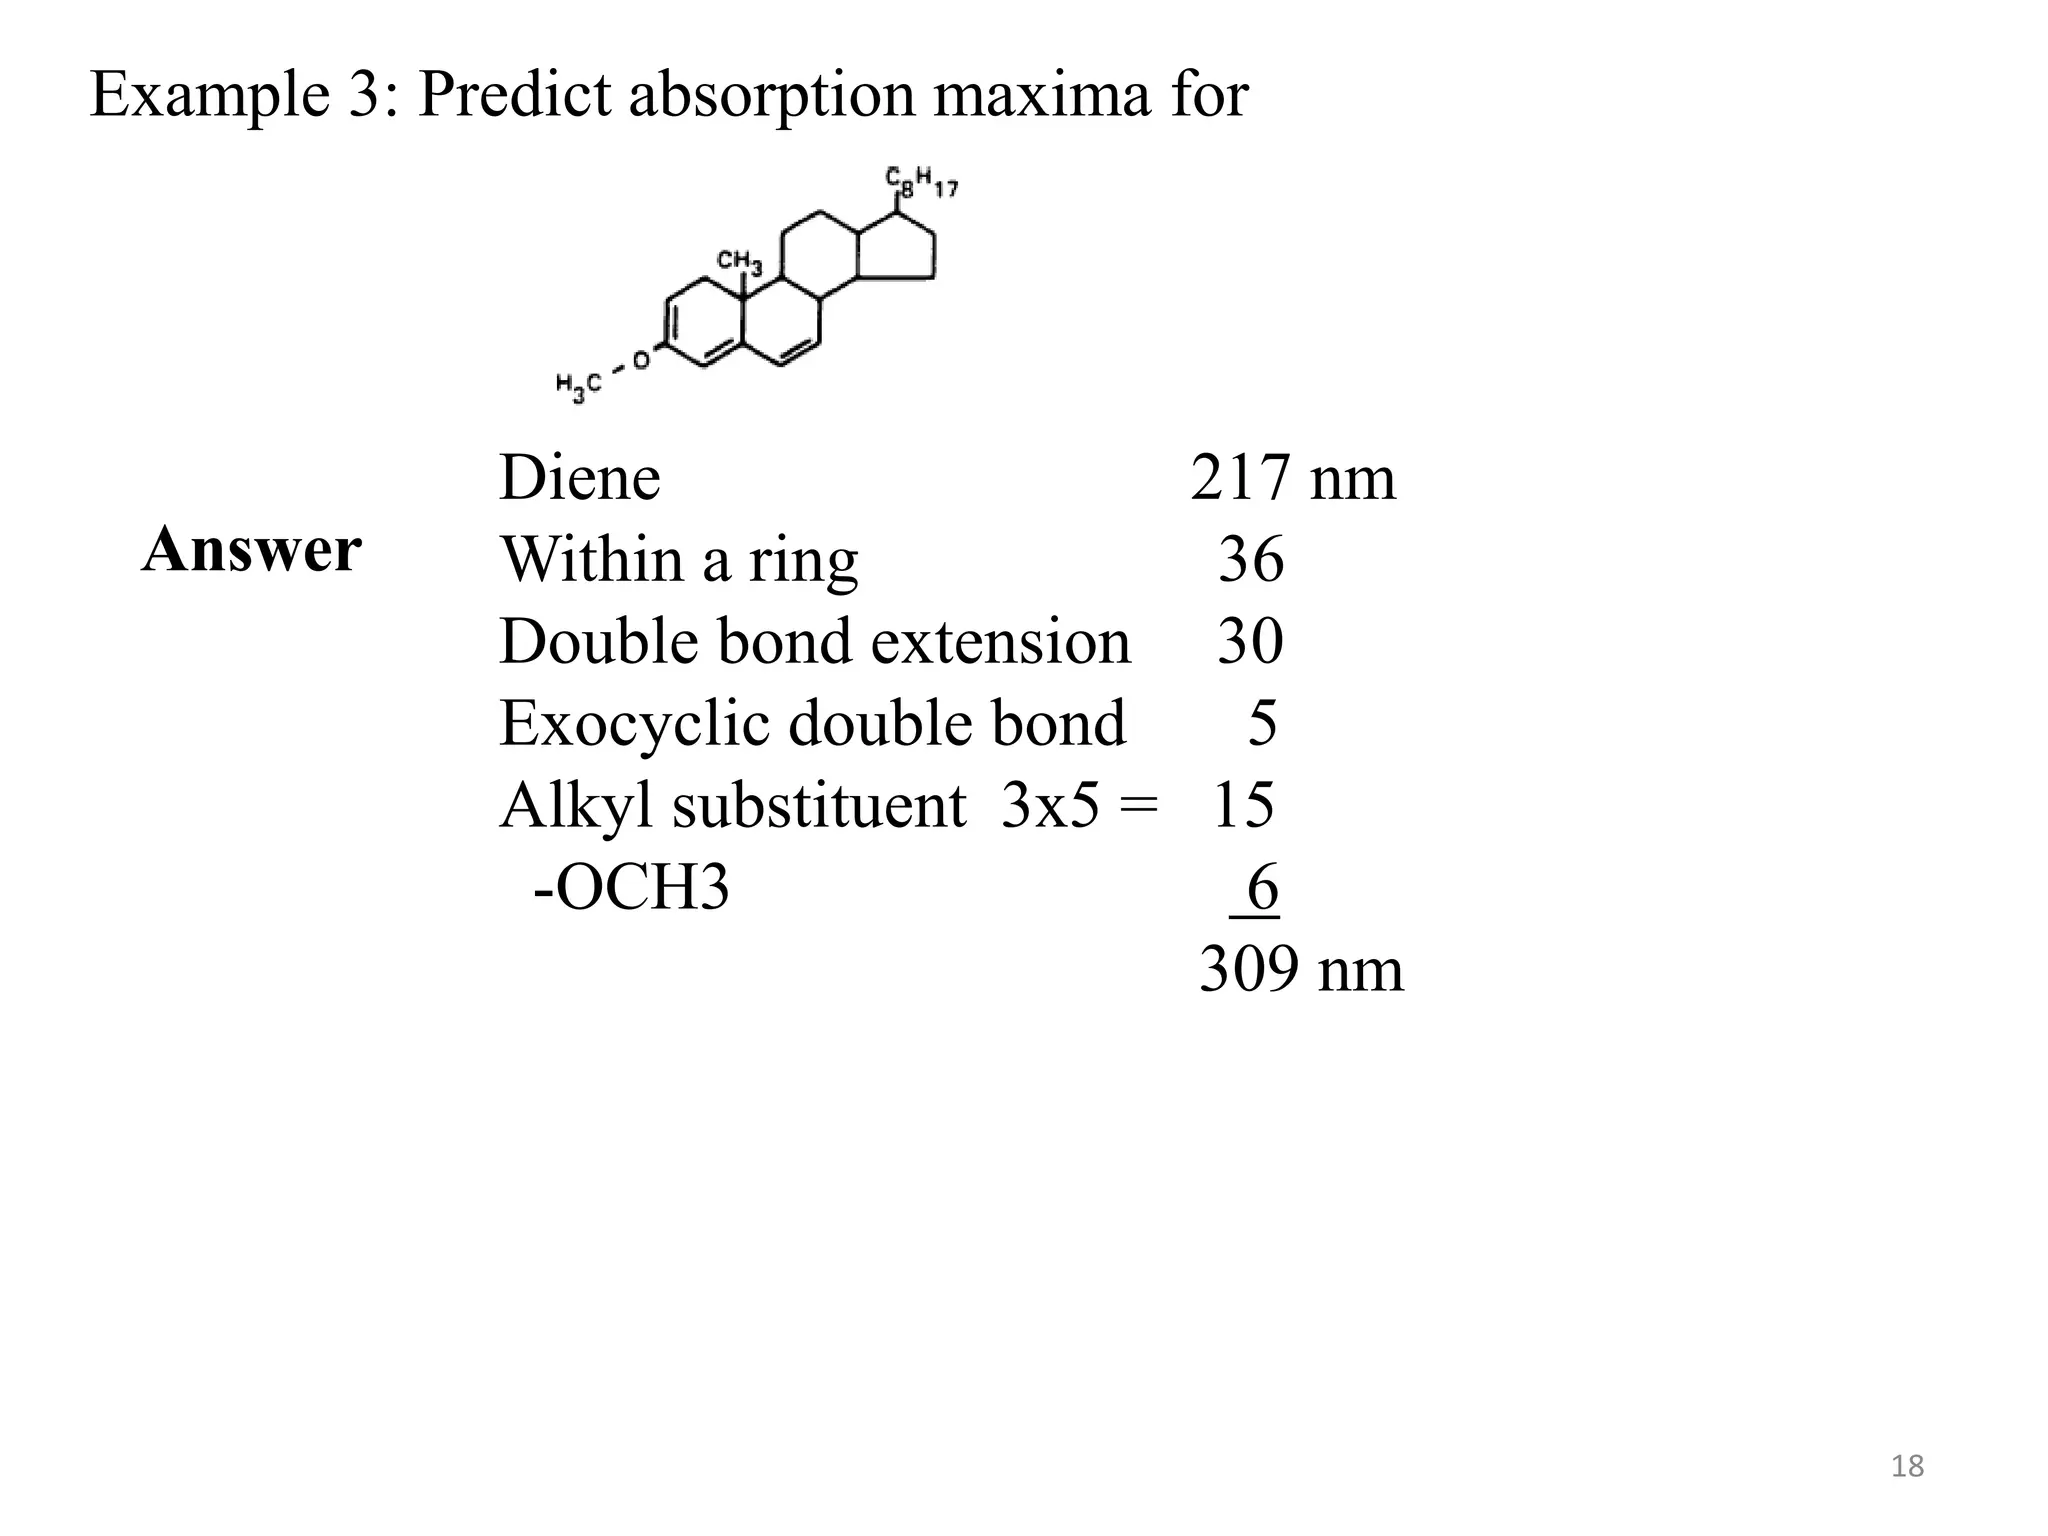
18.
Example 3: Predictabsorption maxima for
Diene 217 nm
Within a ring 36
Double bond extension 30
Exocyclic double bond 5
Alkyl substituent 3x5 = 15
-OCH3 6
309 nm
Answer
18
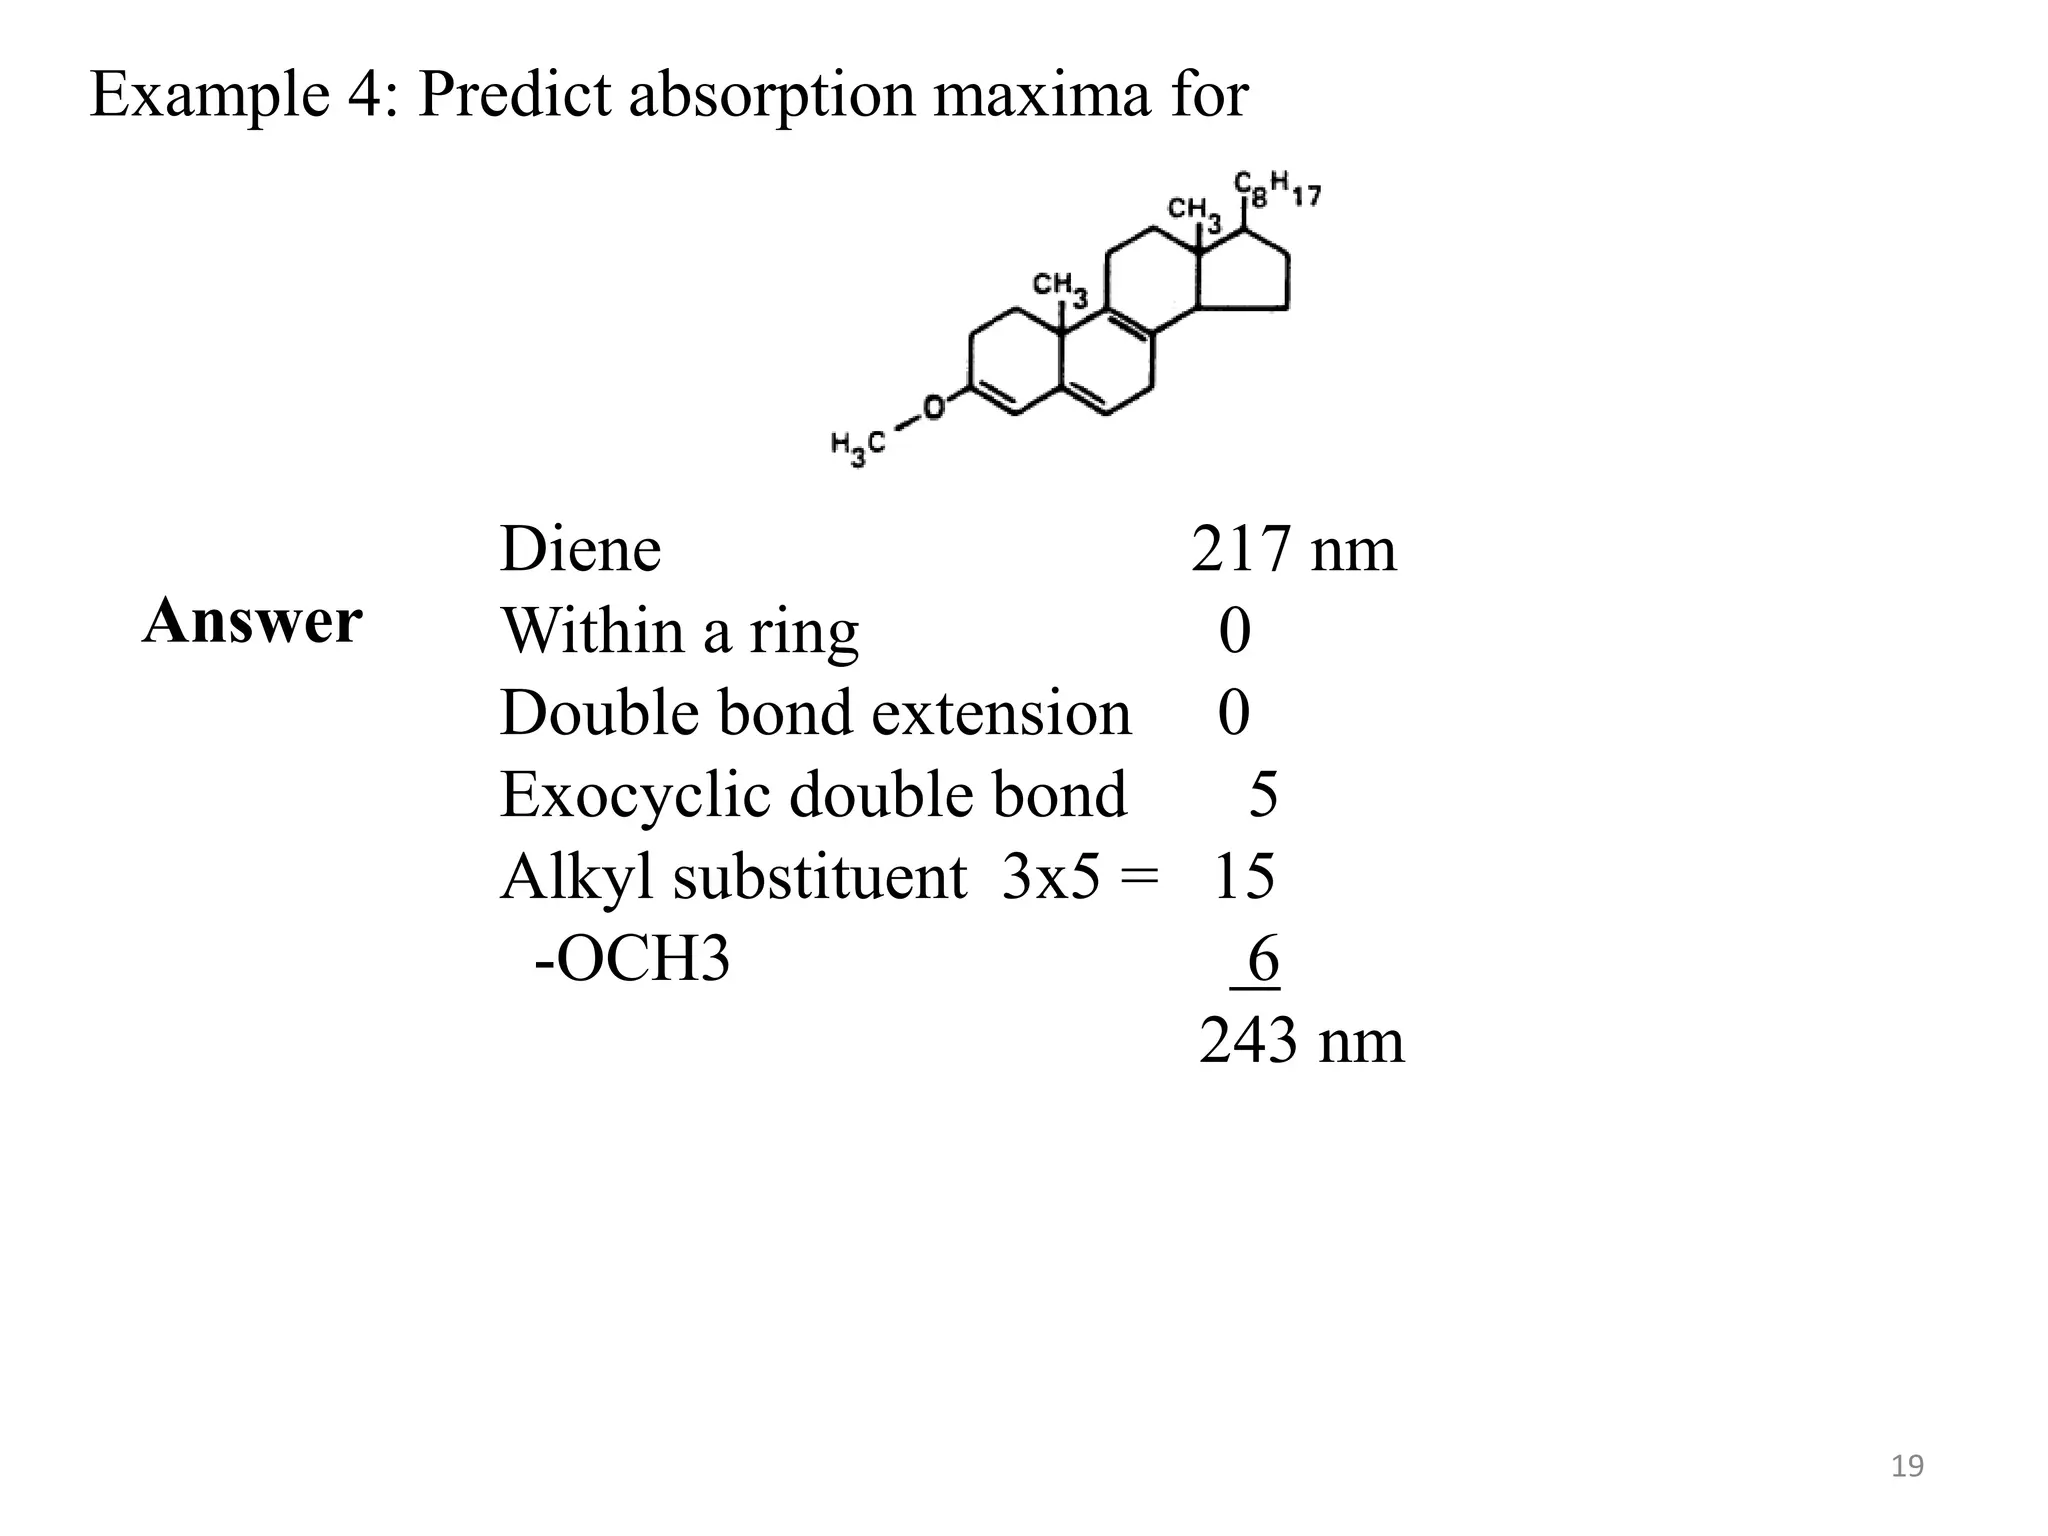
19.
Example 4: Predictabsorption maxima for
Diene 217 nm
Within a ring 0
Double bond extension 0
Exocyclic double bond 5
Alkyl substituent 3x5 = 15
-OCH3 6
243 nm
Answer
19
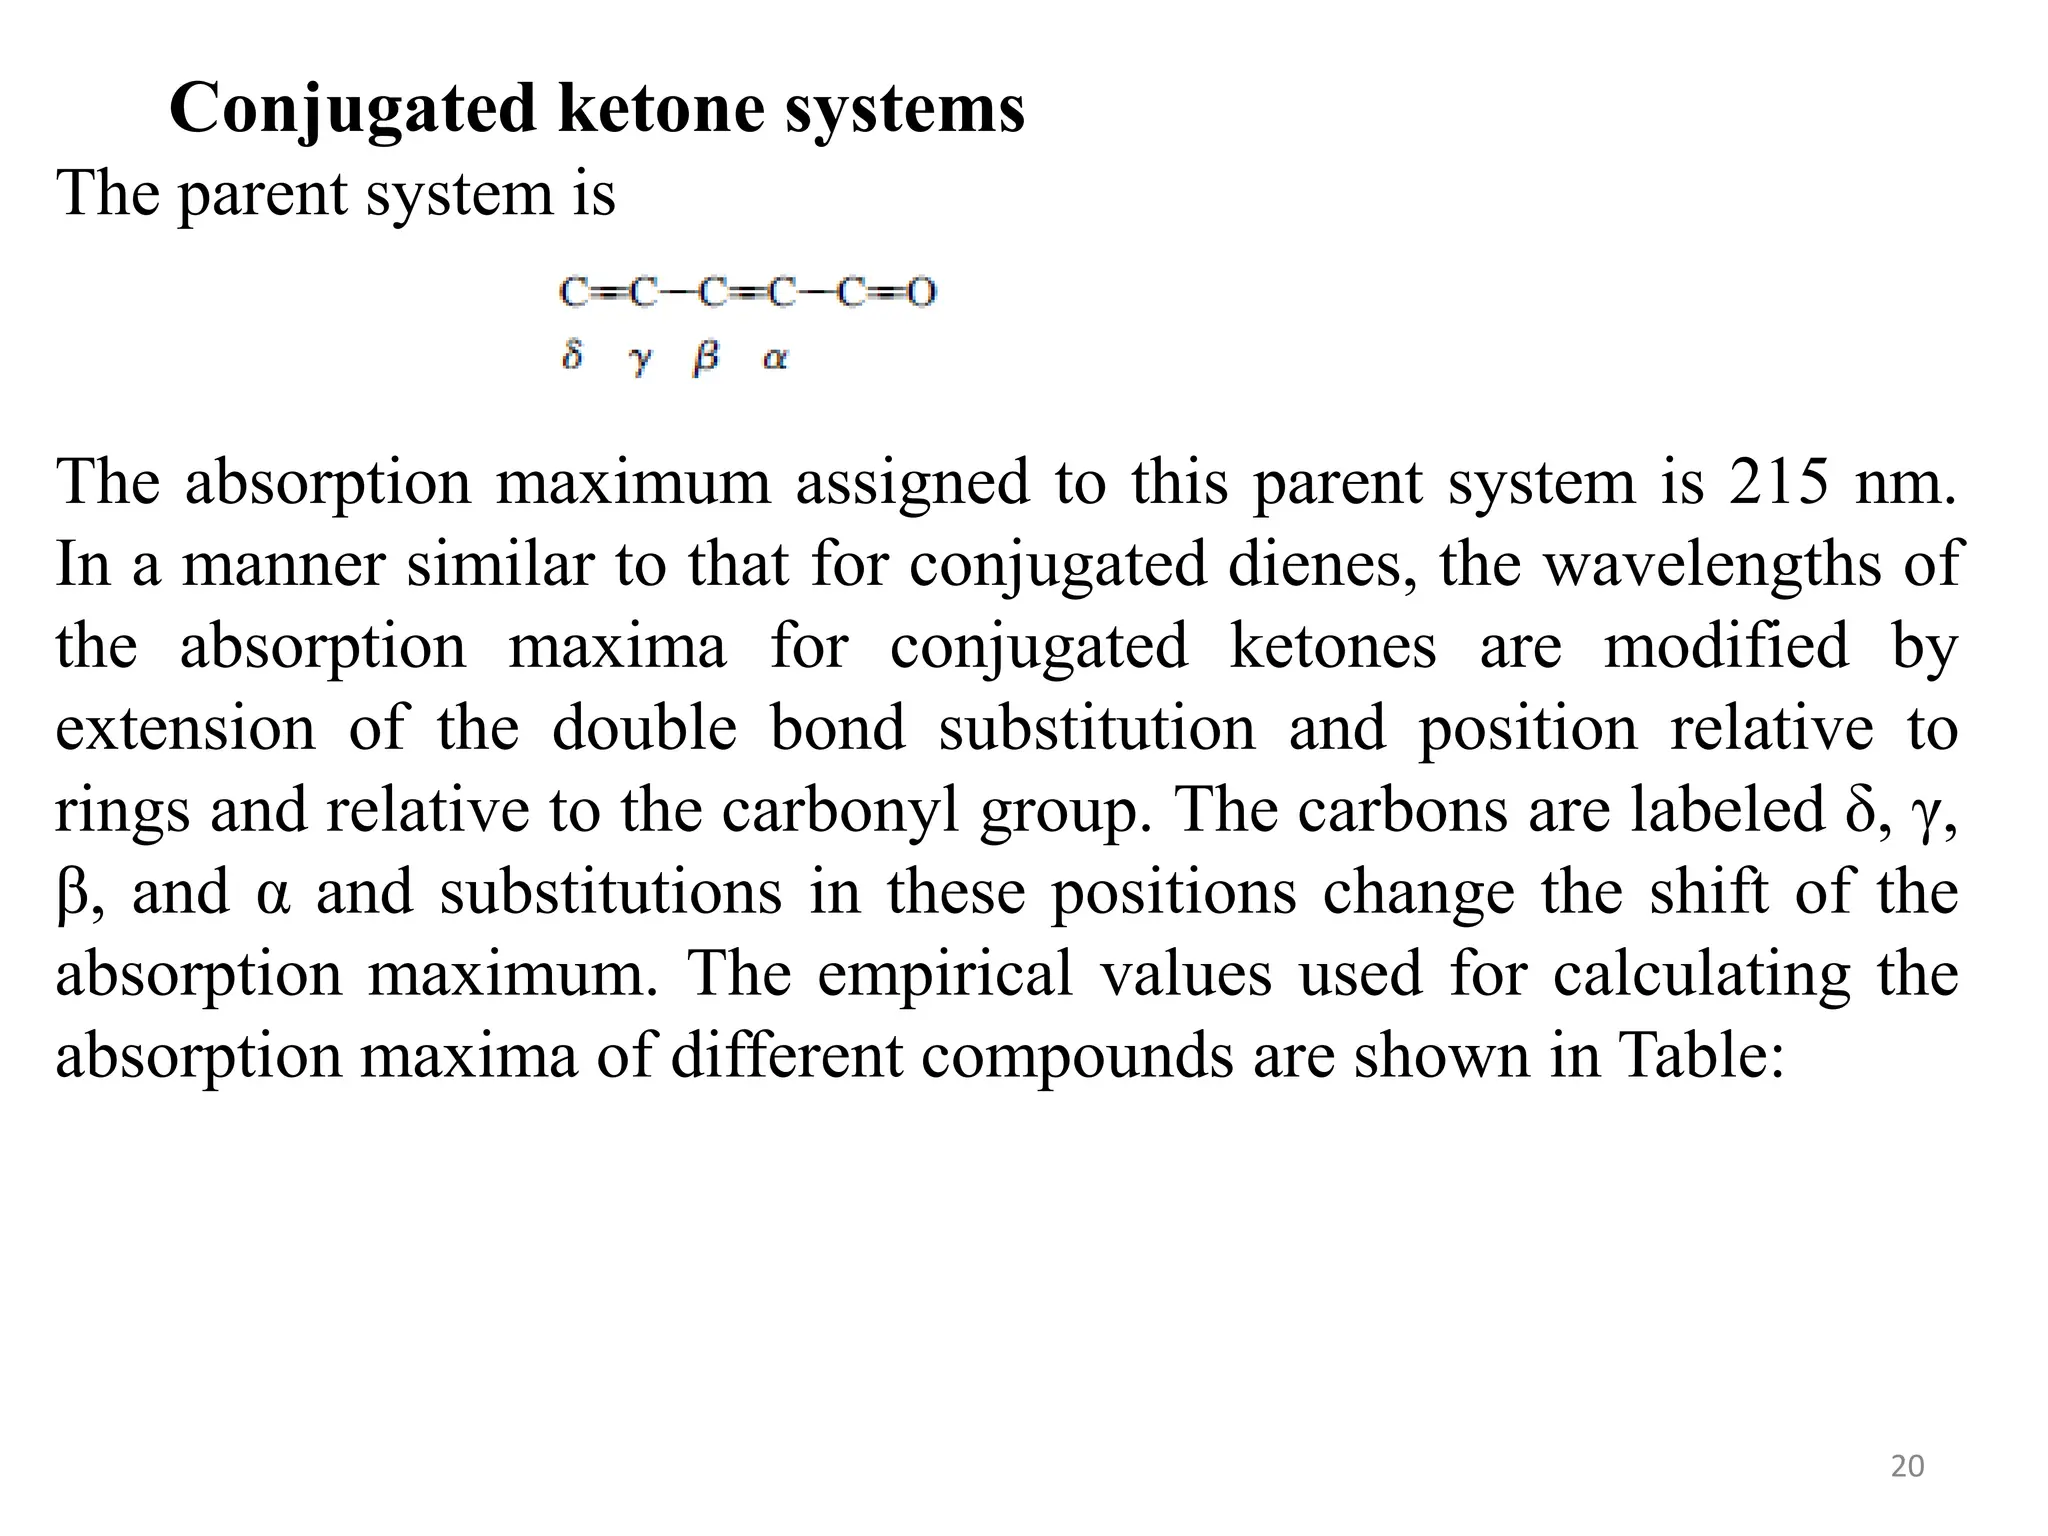
20.
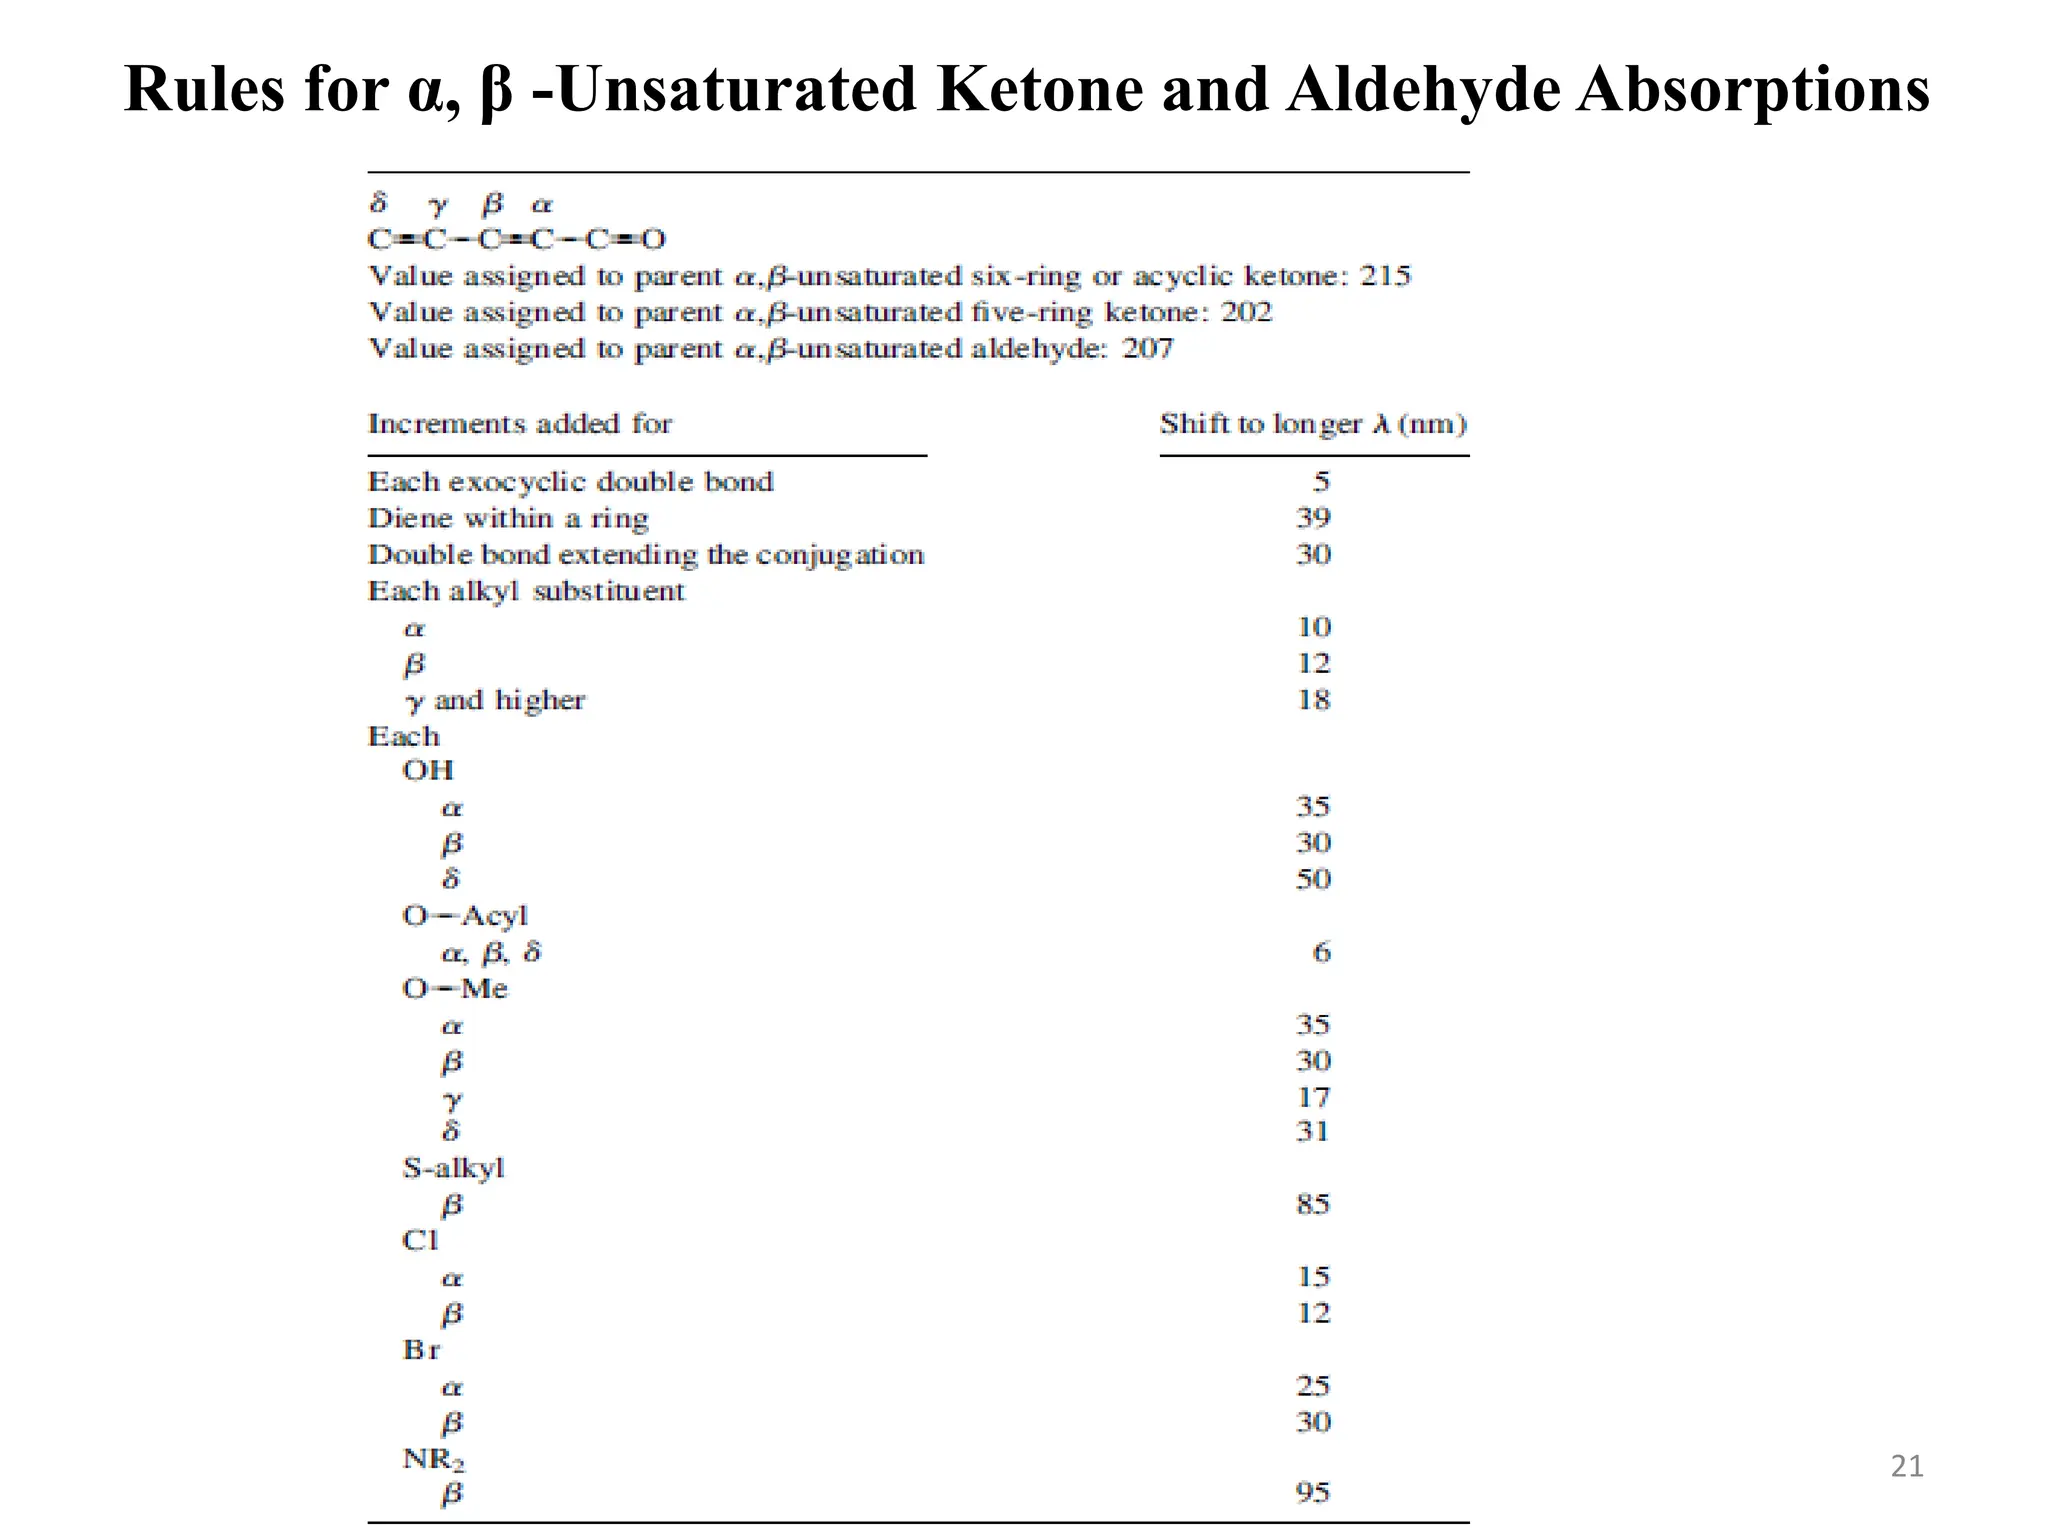
Conjugated ketone systems
Theparent system is
The absorption maximum assigned to this parent system is 215 nm.
In a manner similar to that for conjugated dienes, the wavelengths of
the absorption maxima for conjugated ketones are modified by
extension of the double bond substitution and position relative to
rings and relative to the carbonyl group. The carbons are labeled δ, γ,
β, and α and substitutions in these positions change the shift of the
absorption maximum. The empirical values used for calculating the
absorption maxima of different compounds are shown in Table:
20
21.
Rules for α,β -Unsaturated Ketone and Aldehyde Absorptions
21
22.
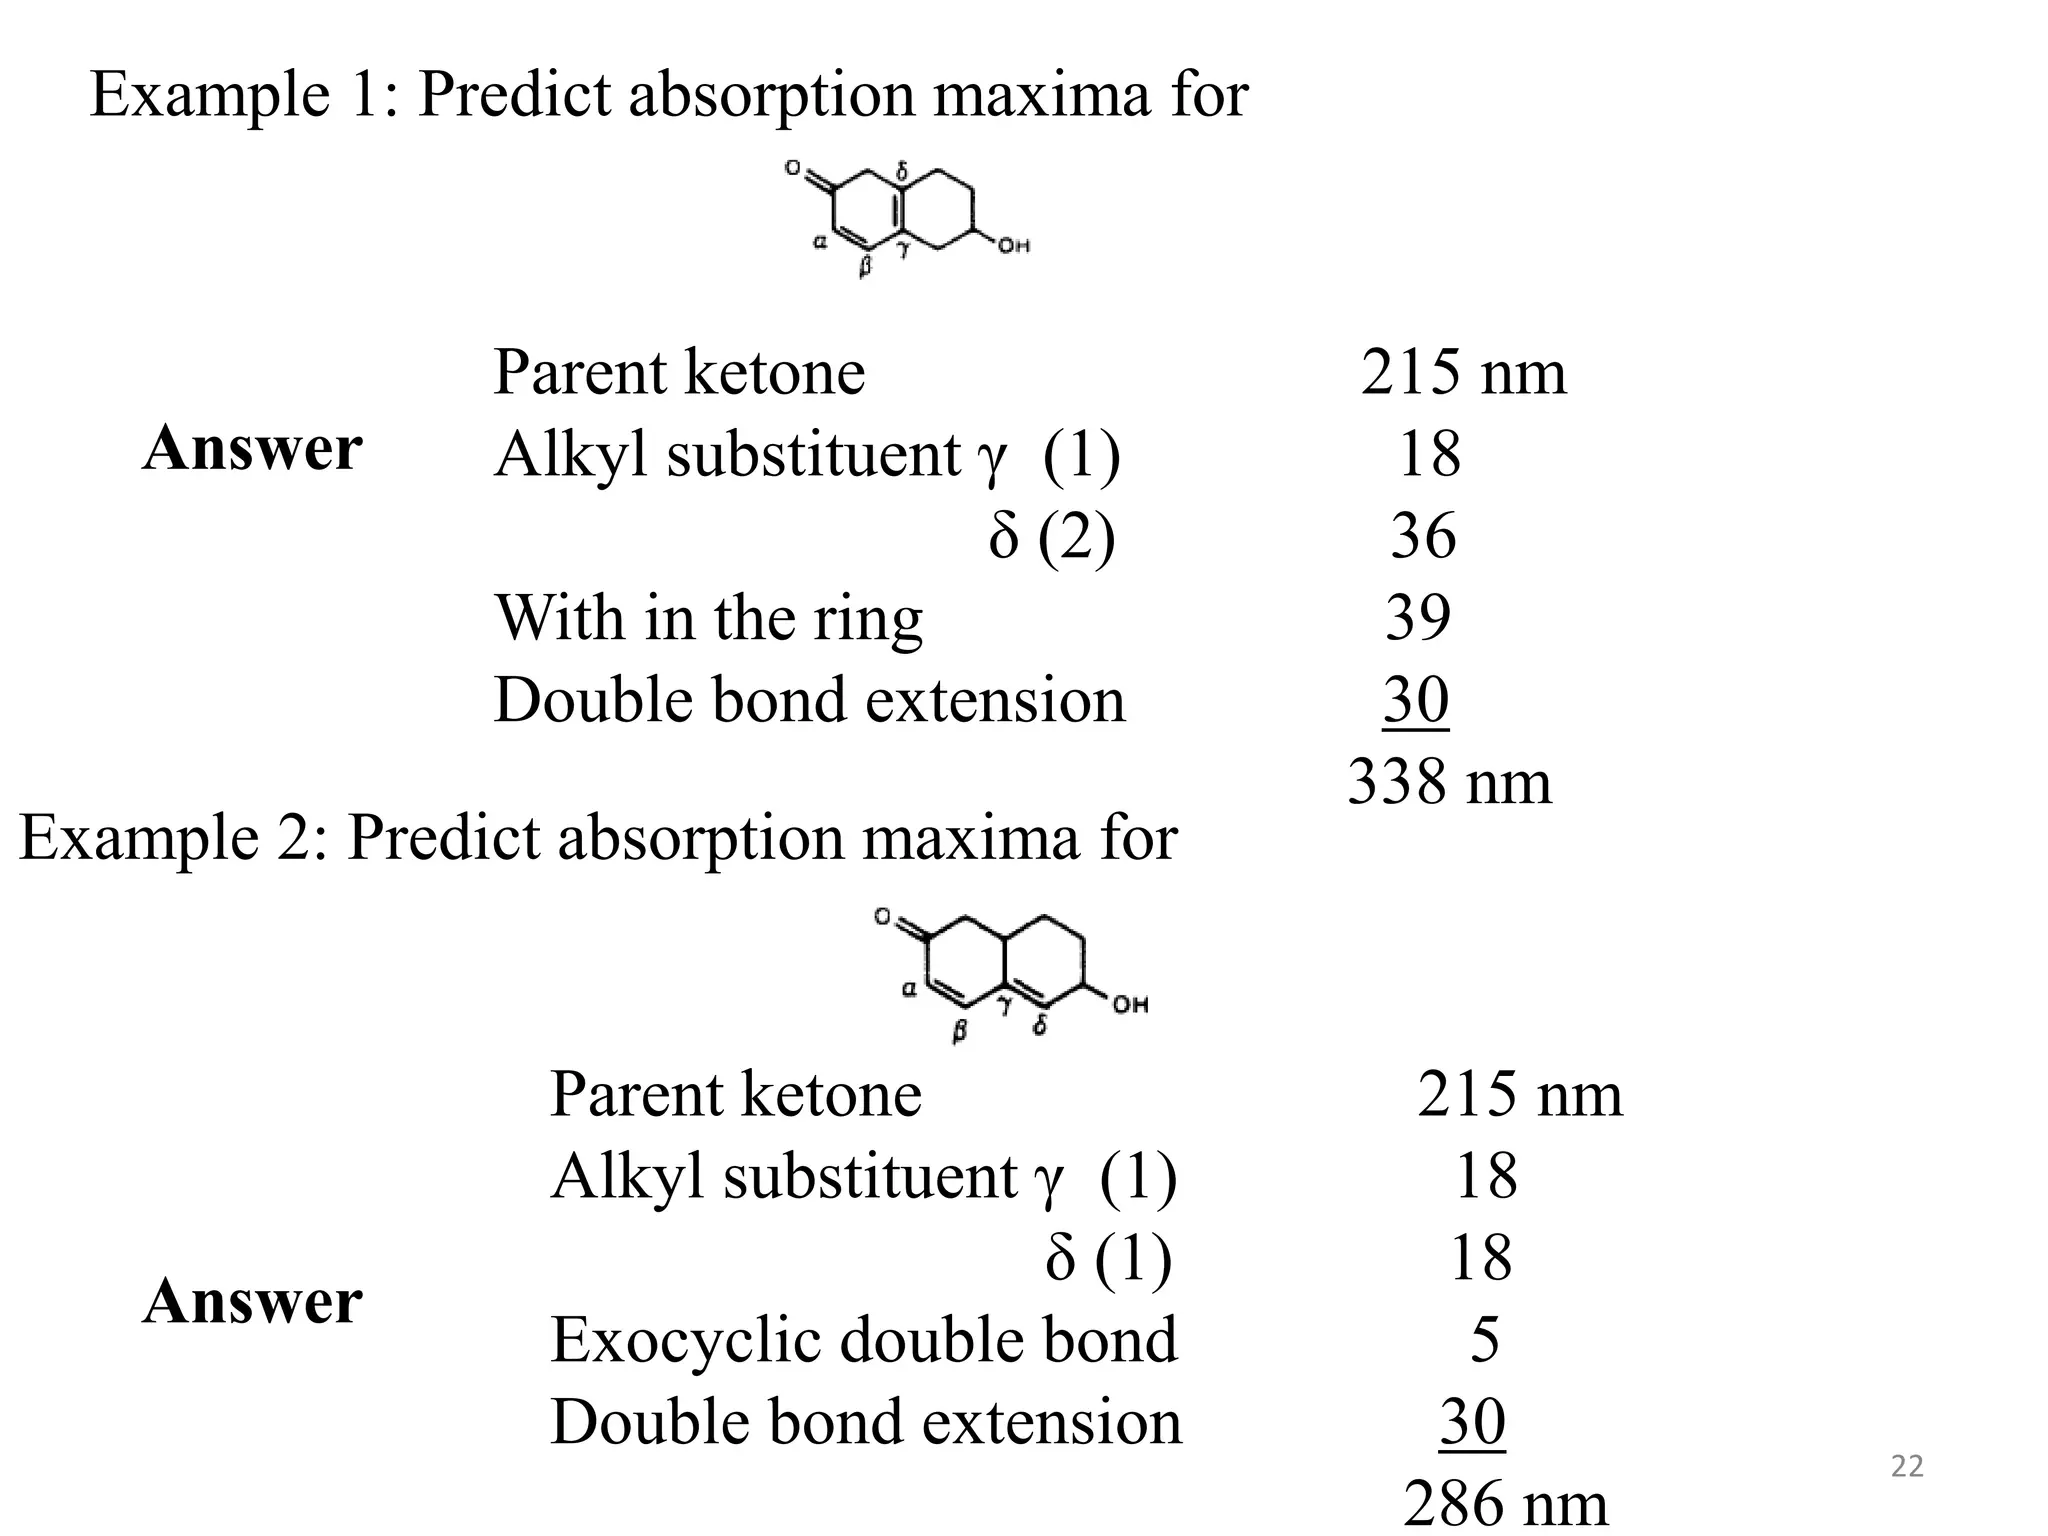
Example 1: Predictabsorption maxima for
Parent ketone 215 nm
Alkyl substituent γ (1) 18
δ (2) 36
With in the ring 39
Double bond extension 30
338 nm
Answer
Example 2: Predict absorption maxima for
Answer
Parent ketone 215 nm
Alkyl substituent γ (1) 18
δ (1) 18
Exocyclic double bond 5
Double bond extension 30
286 nm
22
23.
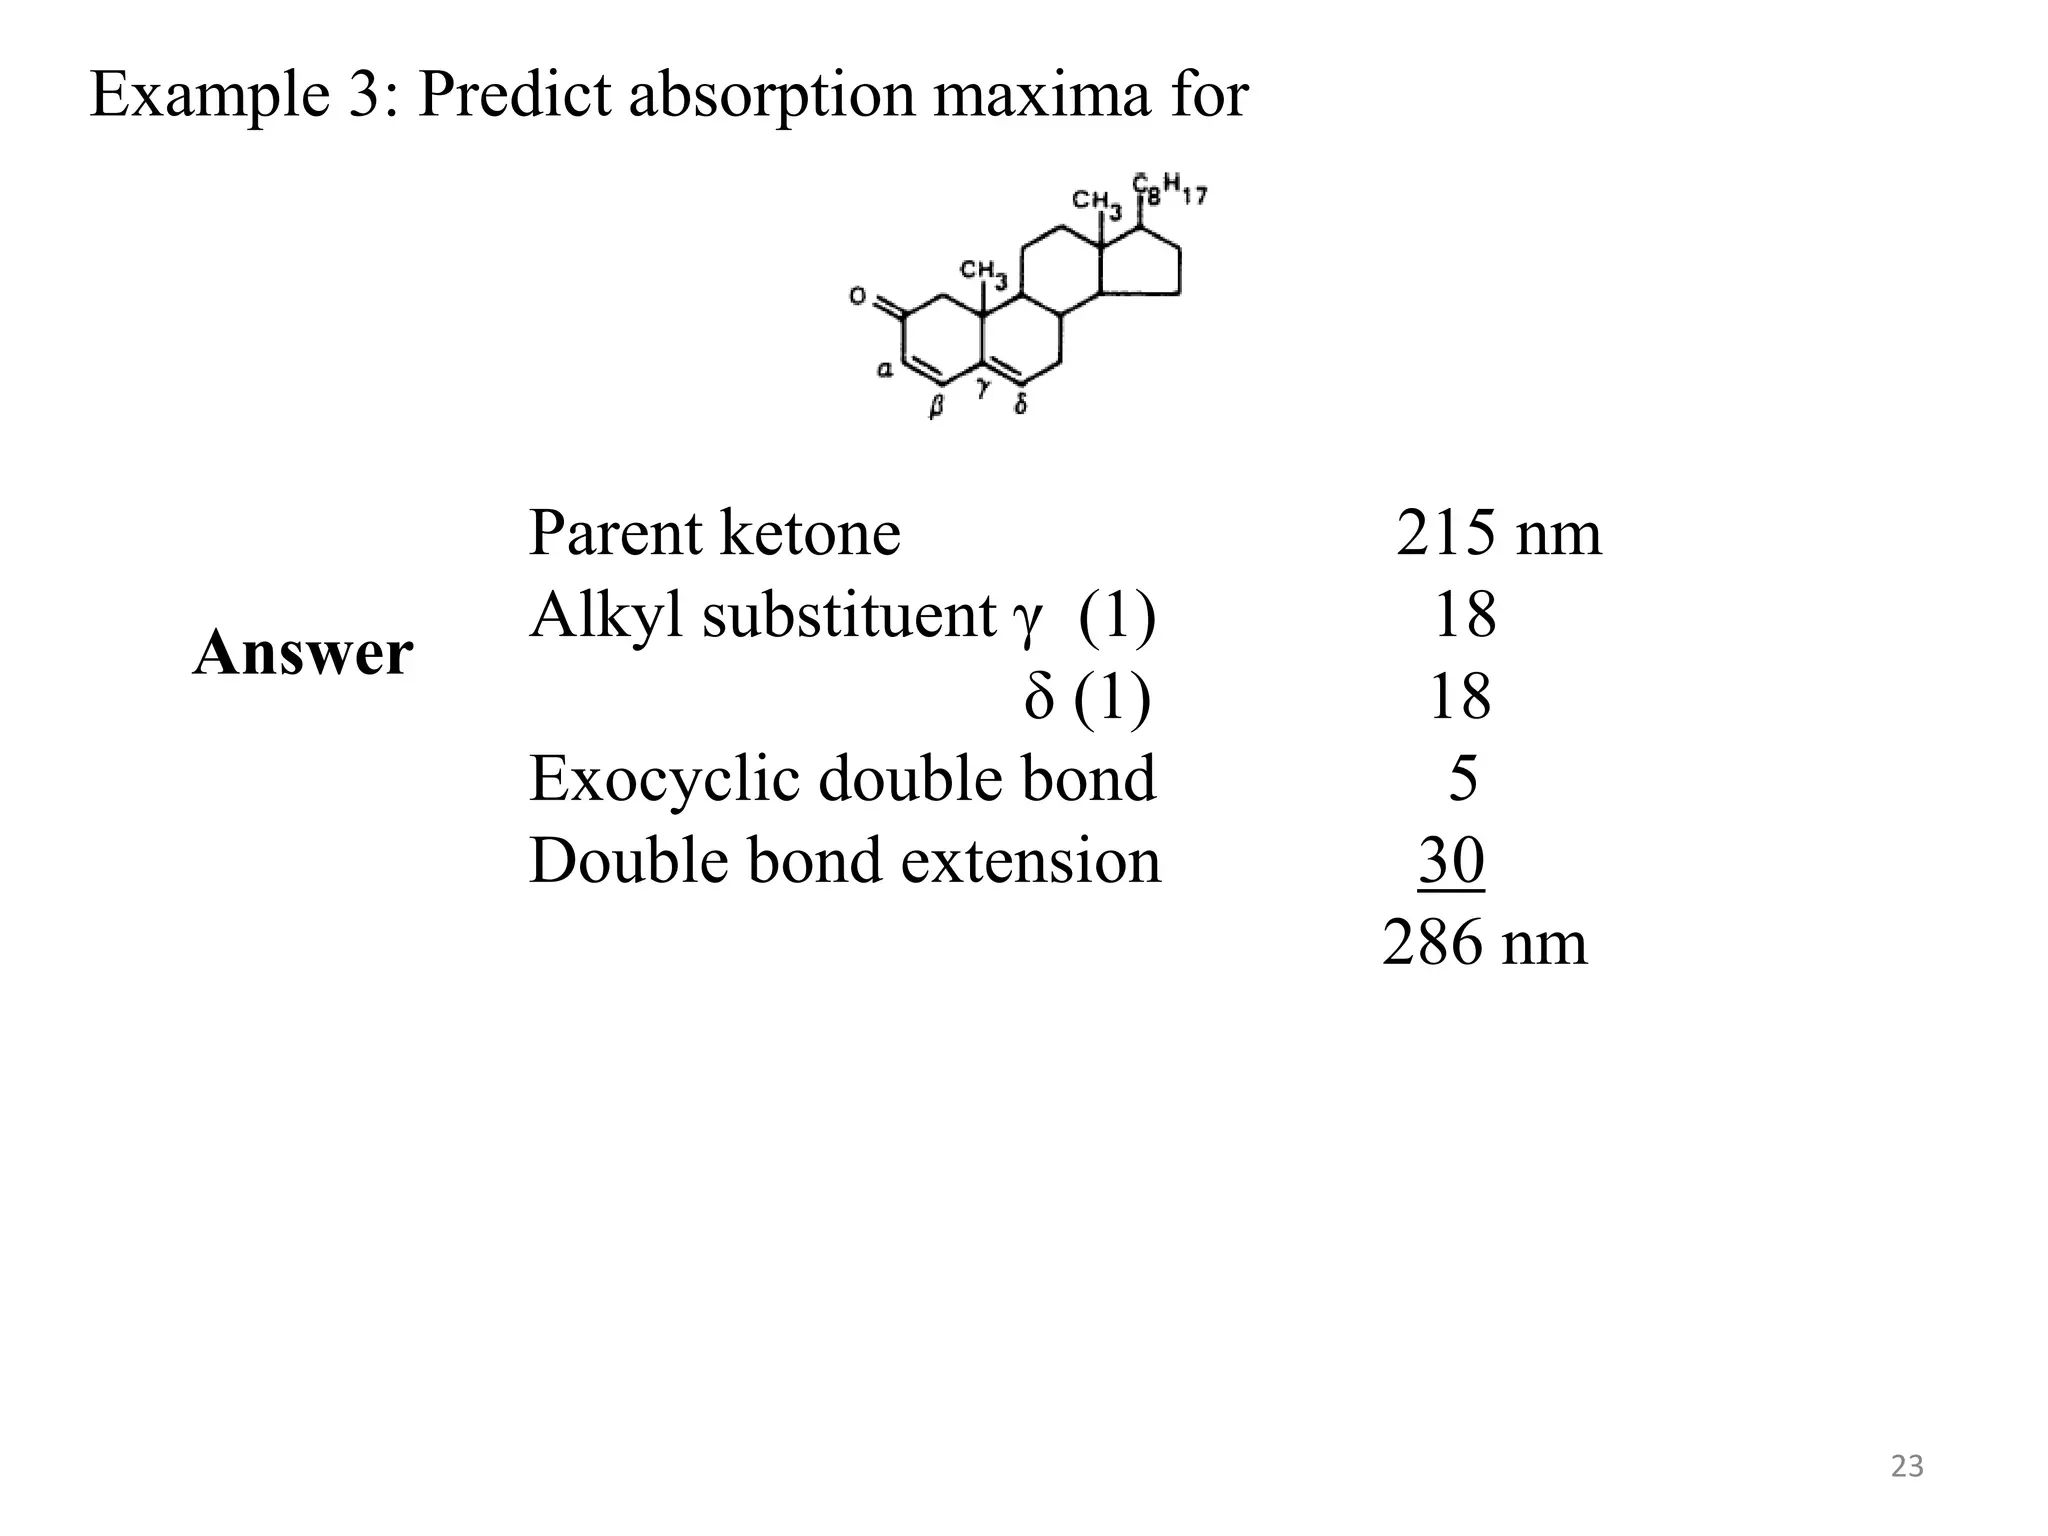
Example 3: Predictabsorption maxima for
Parent ketone 215 nm
Alkyl substituent γ (1) 18
δ (1) 18
Exocyclic double bond 5
Double bond extension 30
286 nm
Answer
23
24.
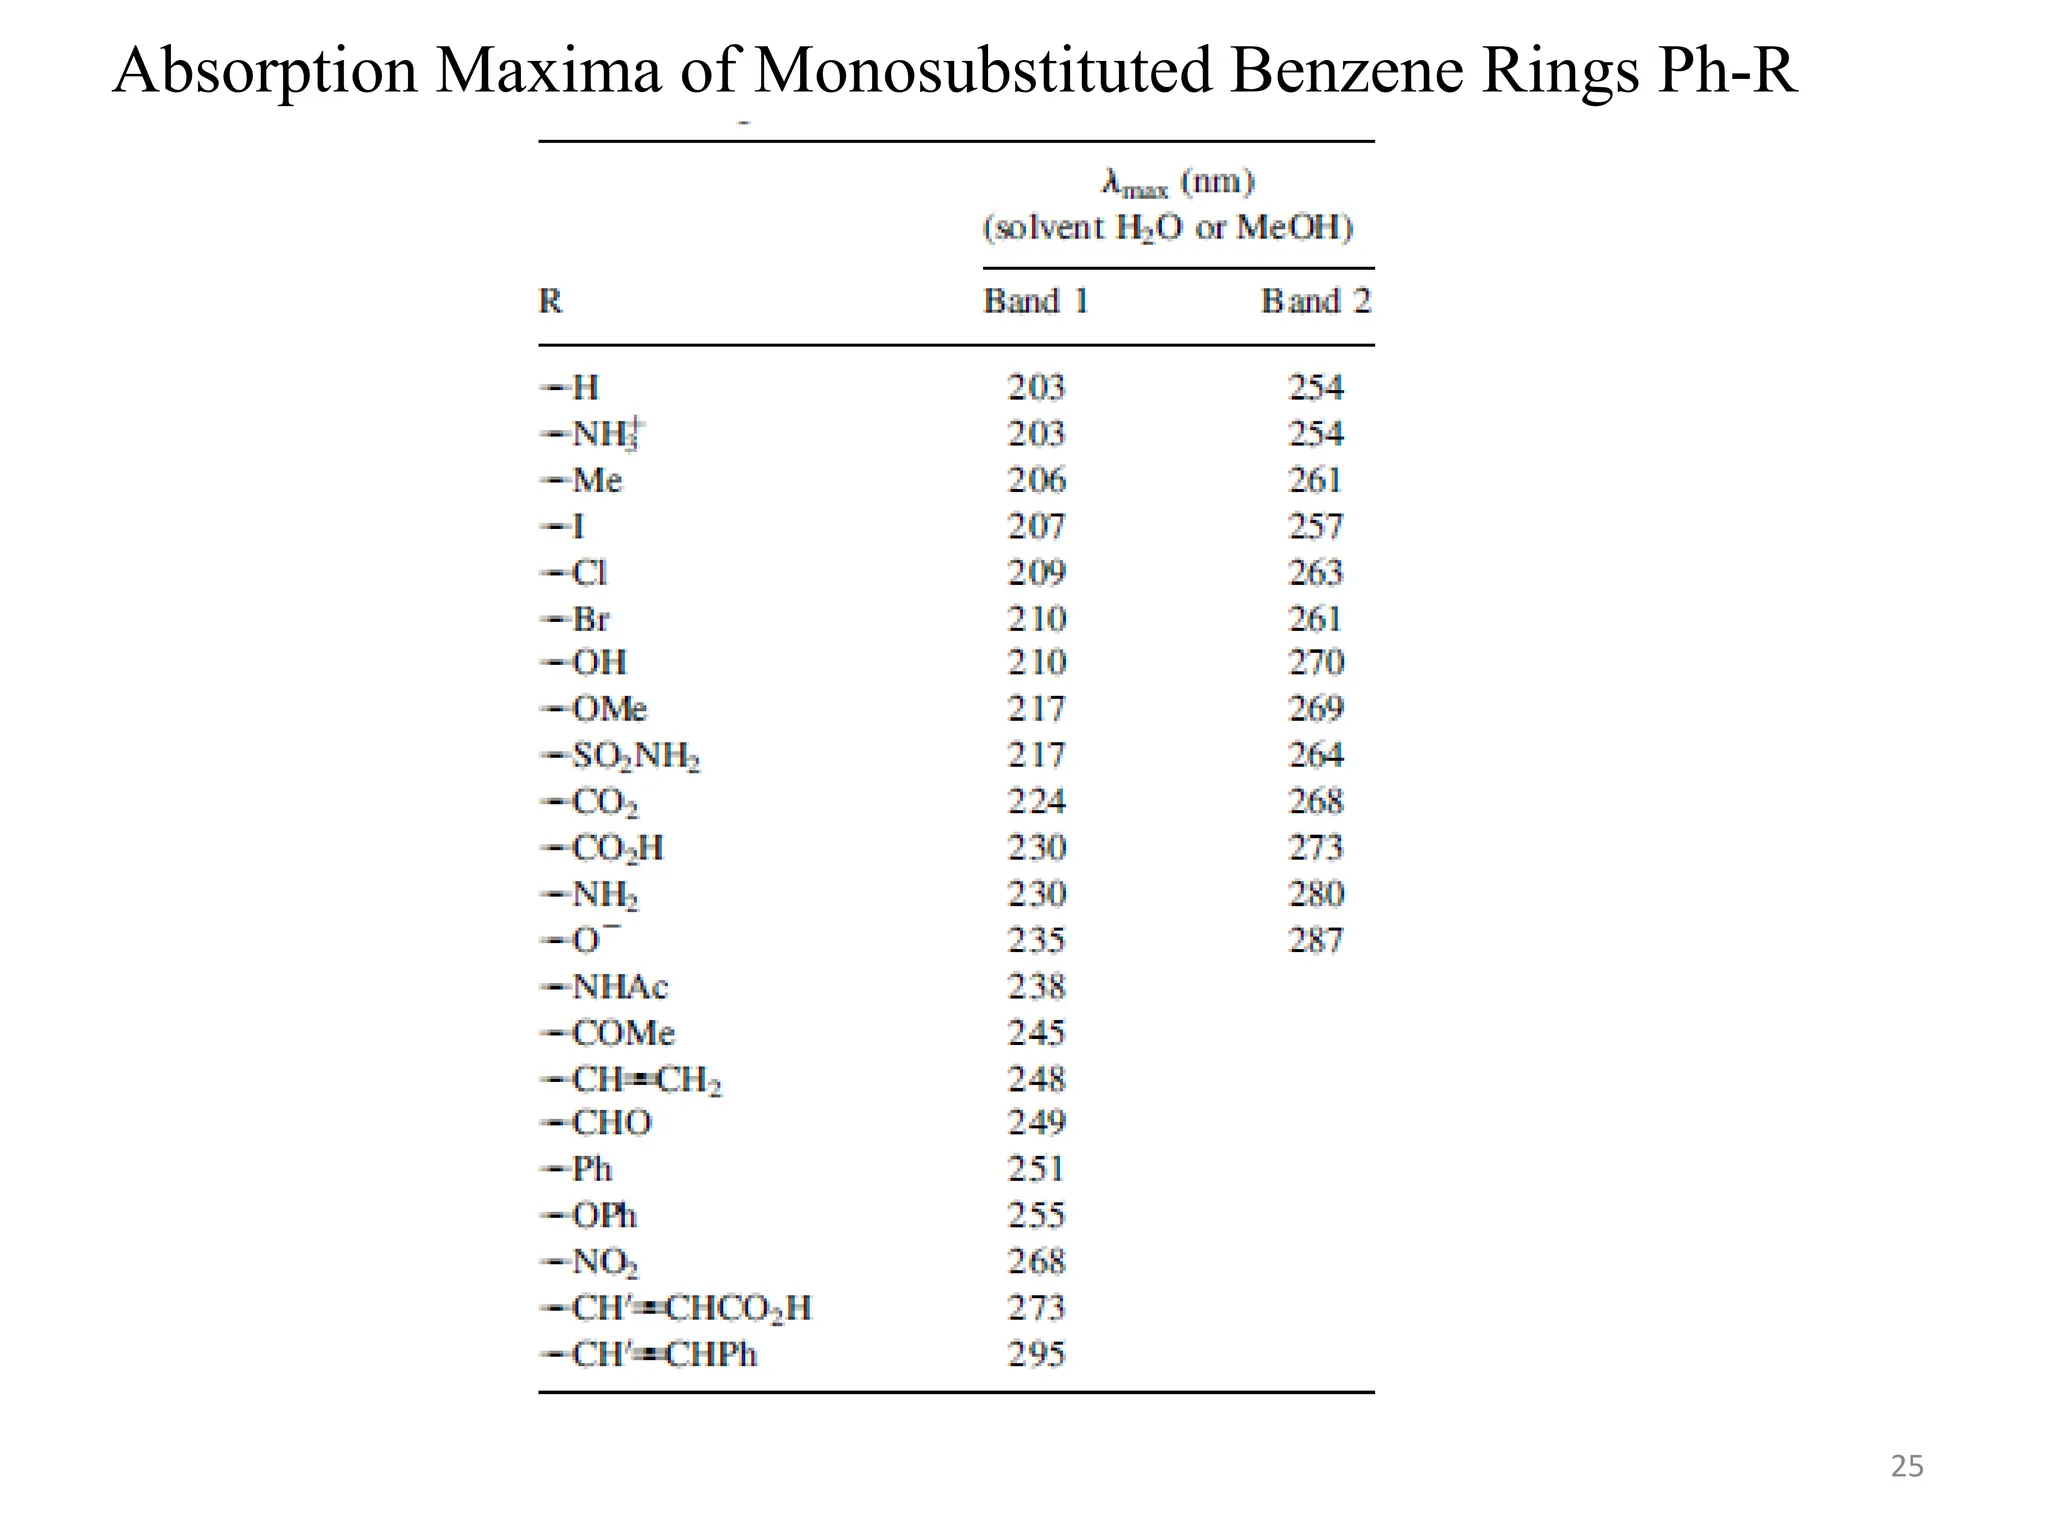
Substitution of BenzeneRings
Benzene is a strong absorber of UV radiation and particularly in the
gas phase shows considerable fine structure in its spectrum.
Substitution on the benzene ring causes a shift in the absorption
wavelengths. The observed wavelengths of the absorption maxima
of some substituted benzene rings are given in Table. These are
experimental data and may be insufficient to completely identify
unknown compounds.
24
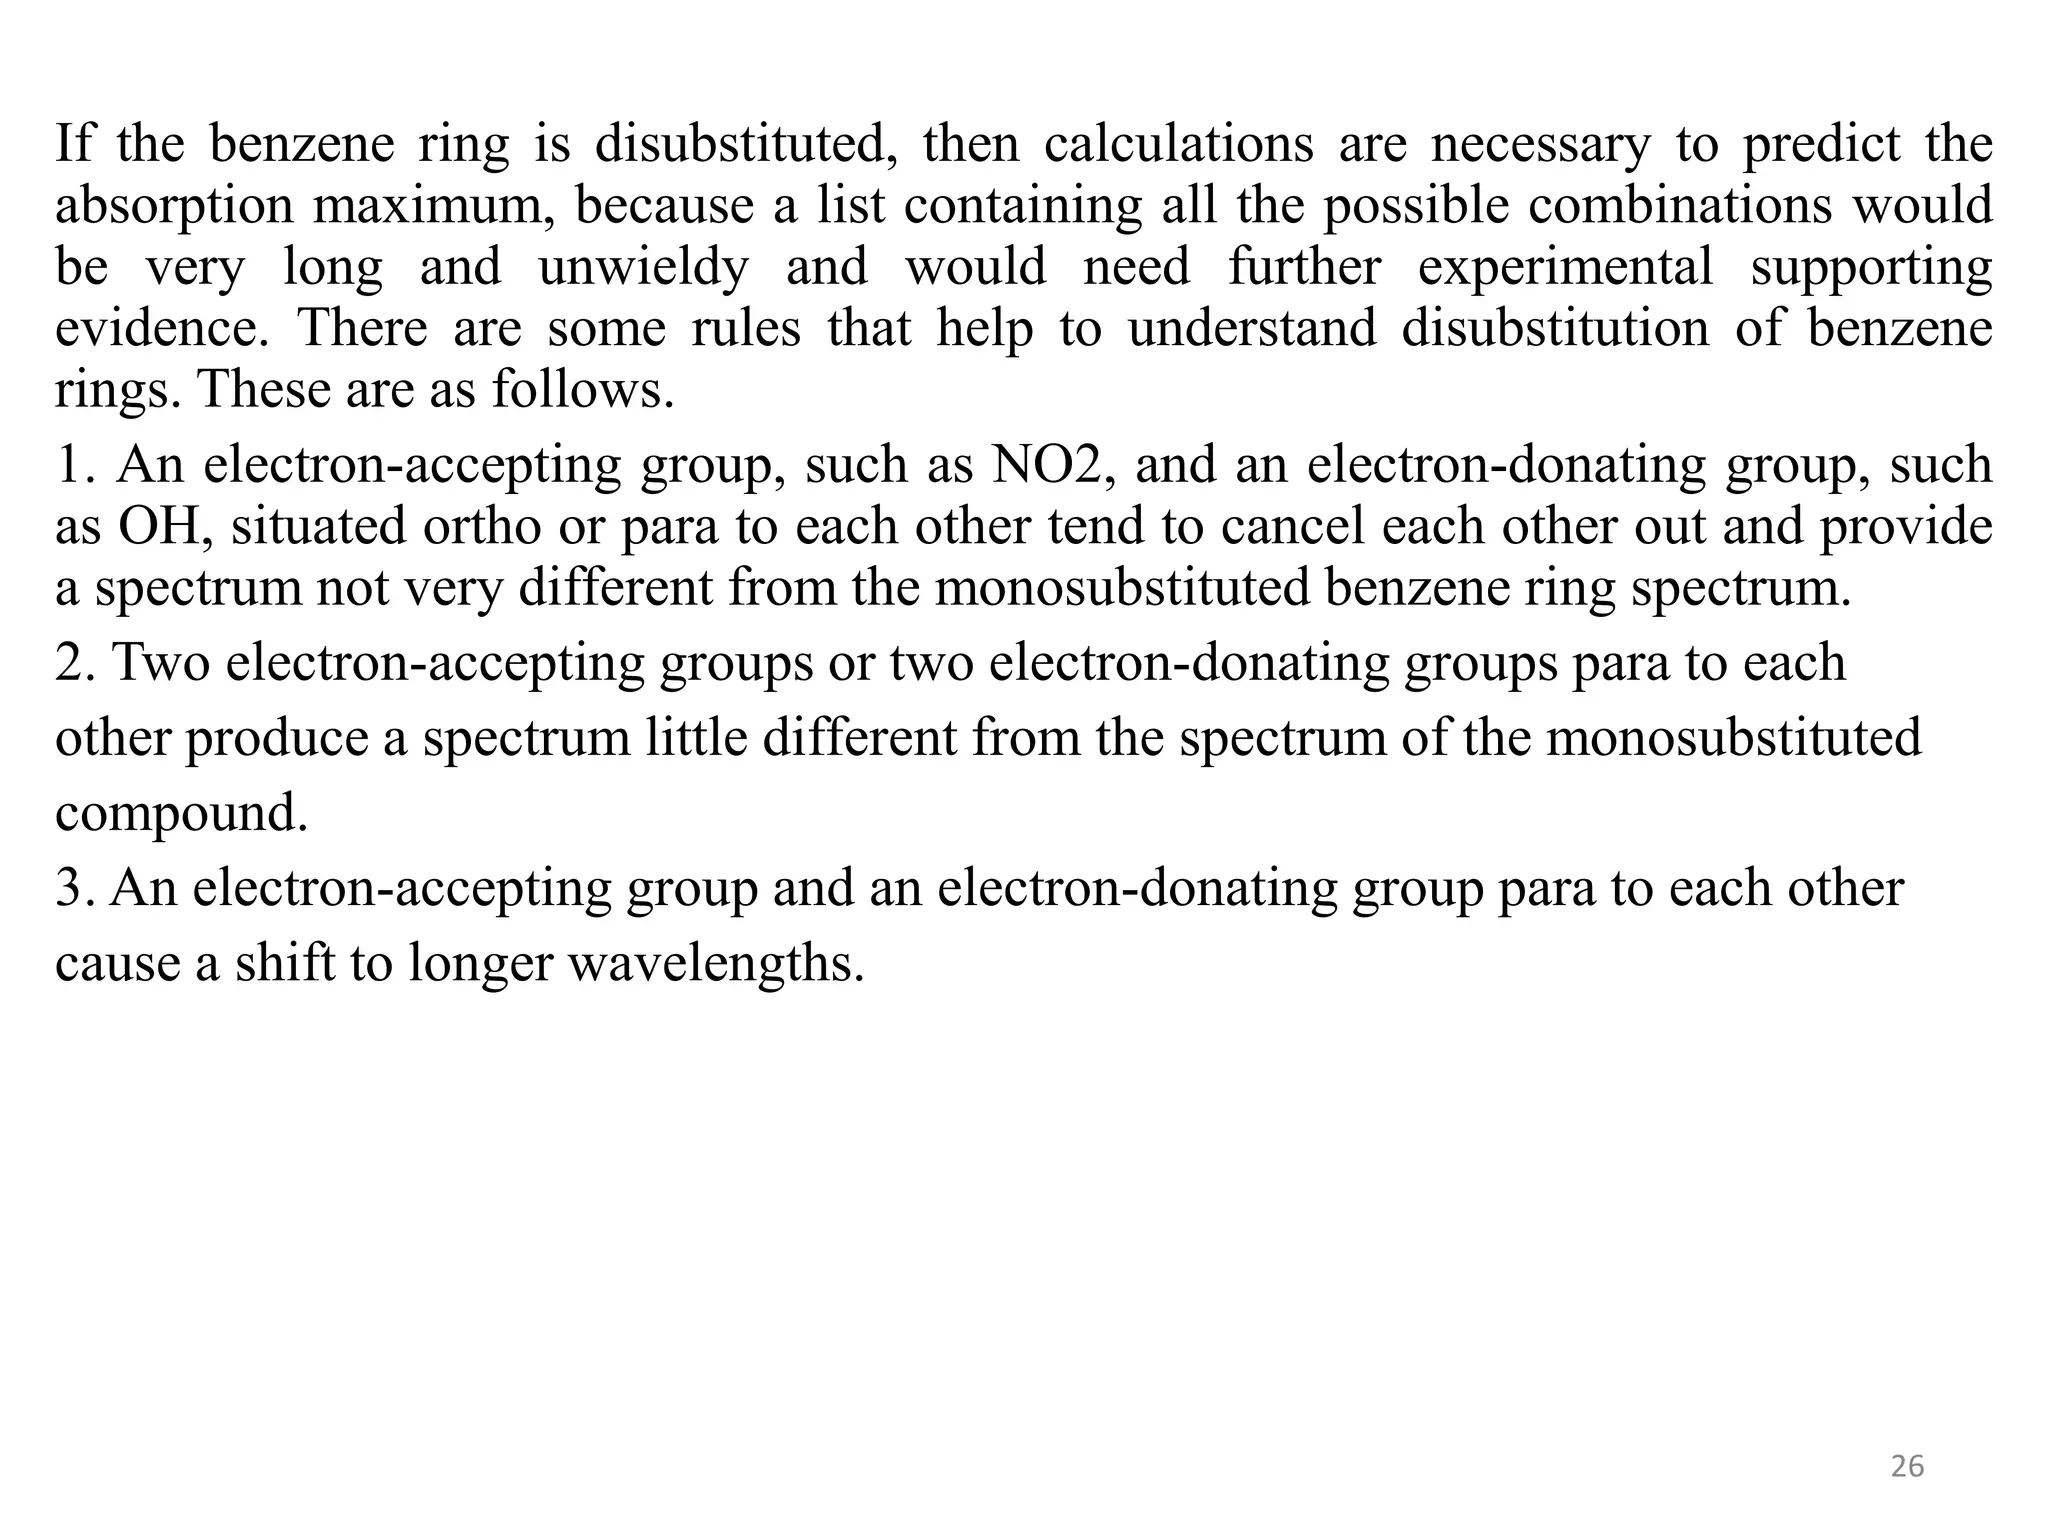
If the benzenering is disubstituted, then calculations are necessary to predict the
absorption maximum, because a list containing all the possible combinations would
be very long and unwieldy and would need further experimental supporting
evidence. There are some rules that help to understand disubstitution of benzene
rings. These are as follows.
1. An electron-accepting group, such as NO2, and an electron-donating group, such
as OH, situated ortho or para to each other tend to cancel each other out and provide
a spectrum not very different from the monosubstituted benzene ring spectrum.
2. Two electron-accepting groups or two electron-donating groups para to each
other produce a spectrum little different from the spectrum of the monosubstituted
compound.
3. An electron-accepting group and an electron-donating group para to each other
cause a shift to longer wavelengths.
26
Woodward – Fieserrules are applicable to unsaturated compounds
containing up to four double bonds. Fieser and Kuhn formula may be
used for calculating λmax and ɛmax of conjugated systems containing
more than four double bonds as given below:
λmax = 114+5M+n(48-1.7n)-16.5R endo-10R exo
Where M refers to the number of alkyl substituents or ring residues in
the conjugated molecule, n is the number of conjugated double bonds,
Rendo is the number of rings with endocyclic double bonds, and Rexo is
the number of rings with exocyclic double bonds.
28
29.
The value ofɛmax is given by the formula n(1.74x10⁴), where n is the
number of conjugated double bonds. The calculated λmax and ɛmax
values for β-carotene containing 10 alkyl substituents, 11 conjugated
double bonds Rendo = 2, respectively are 453.3 and 19.4x10⁴. The
observed values of λmax and ɛmax are 452 and 15.2x10⁴ respectively.
29
30.
Hypsochromic shift orblue shift refers to the shifts of absorption
maximum to shorter wavelengths. It is produced by the presence of
auxochromes in compounds exhibiting absorption bands due to n-π*
transitions. Polar solvents also cause a blue shift of absorption bands
due to n-π* transitions. For example, aniline absorbs at 230 nm but in
acid solutions the absorption maximum shifts to 203 nm. Similarly,
the n-π* transition in acetone gives rises to an absorption band at the
maximum of 279 nm in benzene while in water it is blue shifted to
264.5 nm.
30
31.
Hyperchromic and hypochromiceffects refer to changes in the intensity of
the absorption bands. Hyperchromic effect increases the intensity while
hypochromic effect brings a decrease in the intensity of the absorption
band. For example, phenol shows a bathochromic shift as well as a
hyperchromic effect as the primary band at 210 nm with a molar
absorptivity, ɛ of 6200 Lmol-1cm-1 shifts to 235 nm with increased intensity
(molar absorptivity 9400 Lmol-1cm-1) for the phenolate anion. In contrast,
benzoic acid shows hypsochromic shift and a hypochromic effect on
becoming benzoate anion, the band shifting from 230 nm (ɛ = 11,600 Lmol-
1cm-1) to 224 nm (ɛ = 8700 Lmol-1cm-1).
31
32.
Electronic transitions inInorganic Species
A number of inorganic anions exhibit absorption peaks in the UV region
attributed to n-π* transitions. Examples inlude nitrate (313 nm), nitrite (360
and 280 nm), carbonate (217 nm) and azido (230 nm).
Coordination compounds of transition metals containing organic and
inorganic ligands are mostly coloured and absorb in the UV and visible
region of EMR spectrum. The absorption peaks are mostly broad and less
intense. The electronic absorption spectra of coordination compounds are
useful for structure analysis as well as for quantitative analysis.
32
33.
Three types ofelectronic transitions are observed in the spectra of
transition metal compounds. These include (i) d-d transitions within
the transition metal ion of low intensity as they are Laporte forbidden,
(ii) excitation within the organic ligand typically π-π* and n-π*
transitions affected by the presence of the metal, and (iii) charge
transfer transitions involving transfer of electron from the metal orbital
to the ligand orbital (metal-to-ligand charge transfer or MLCT) or
from the ligand orbital to the metal orbital (ligand-to-metal charge
transfer or LMCT). The last two transitions give rise to intense bands,
and hence, useful for trace analysis.
33
34.
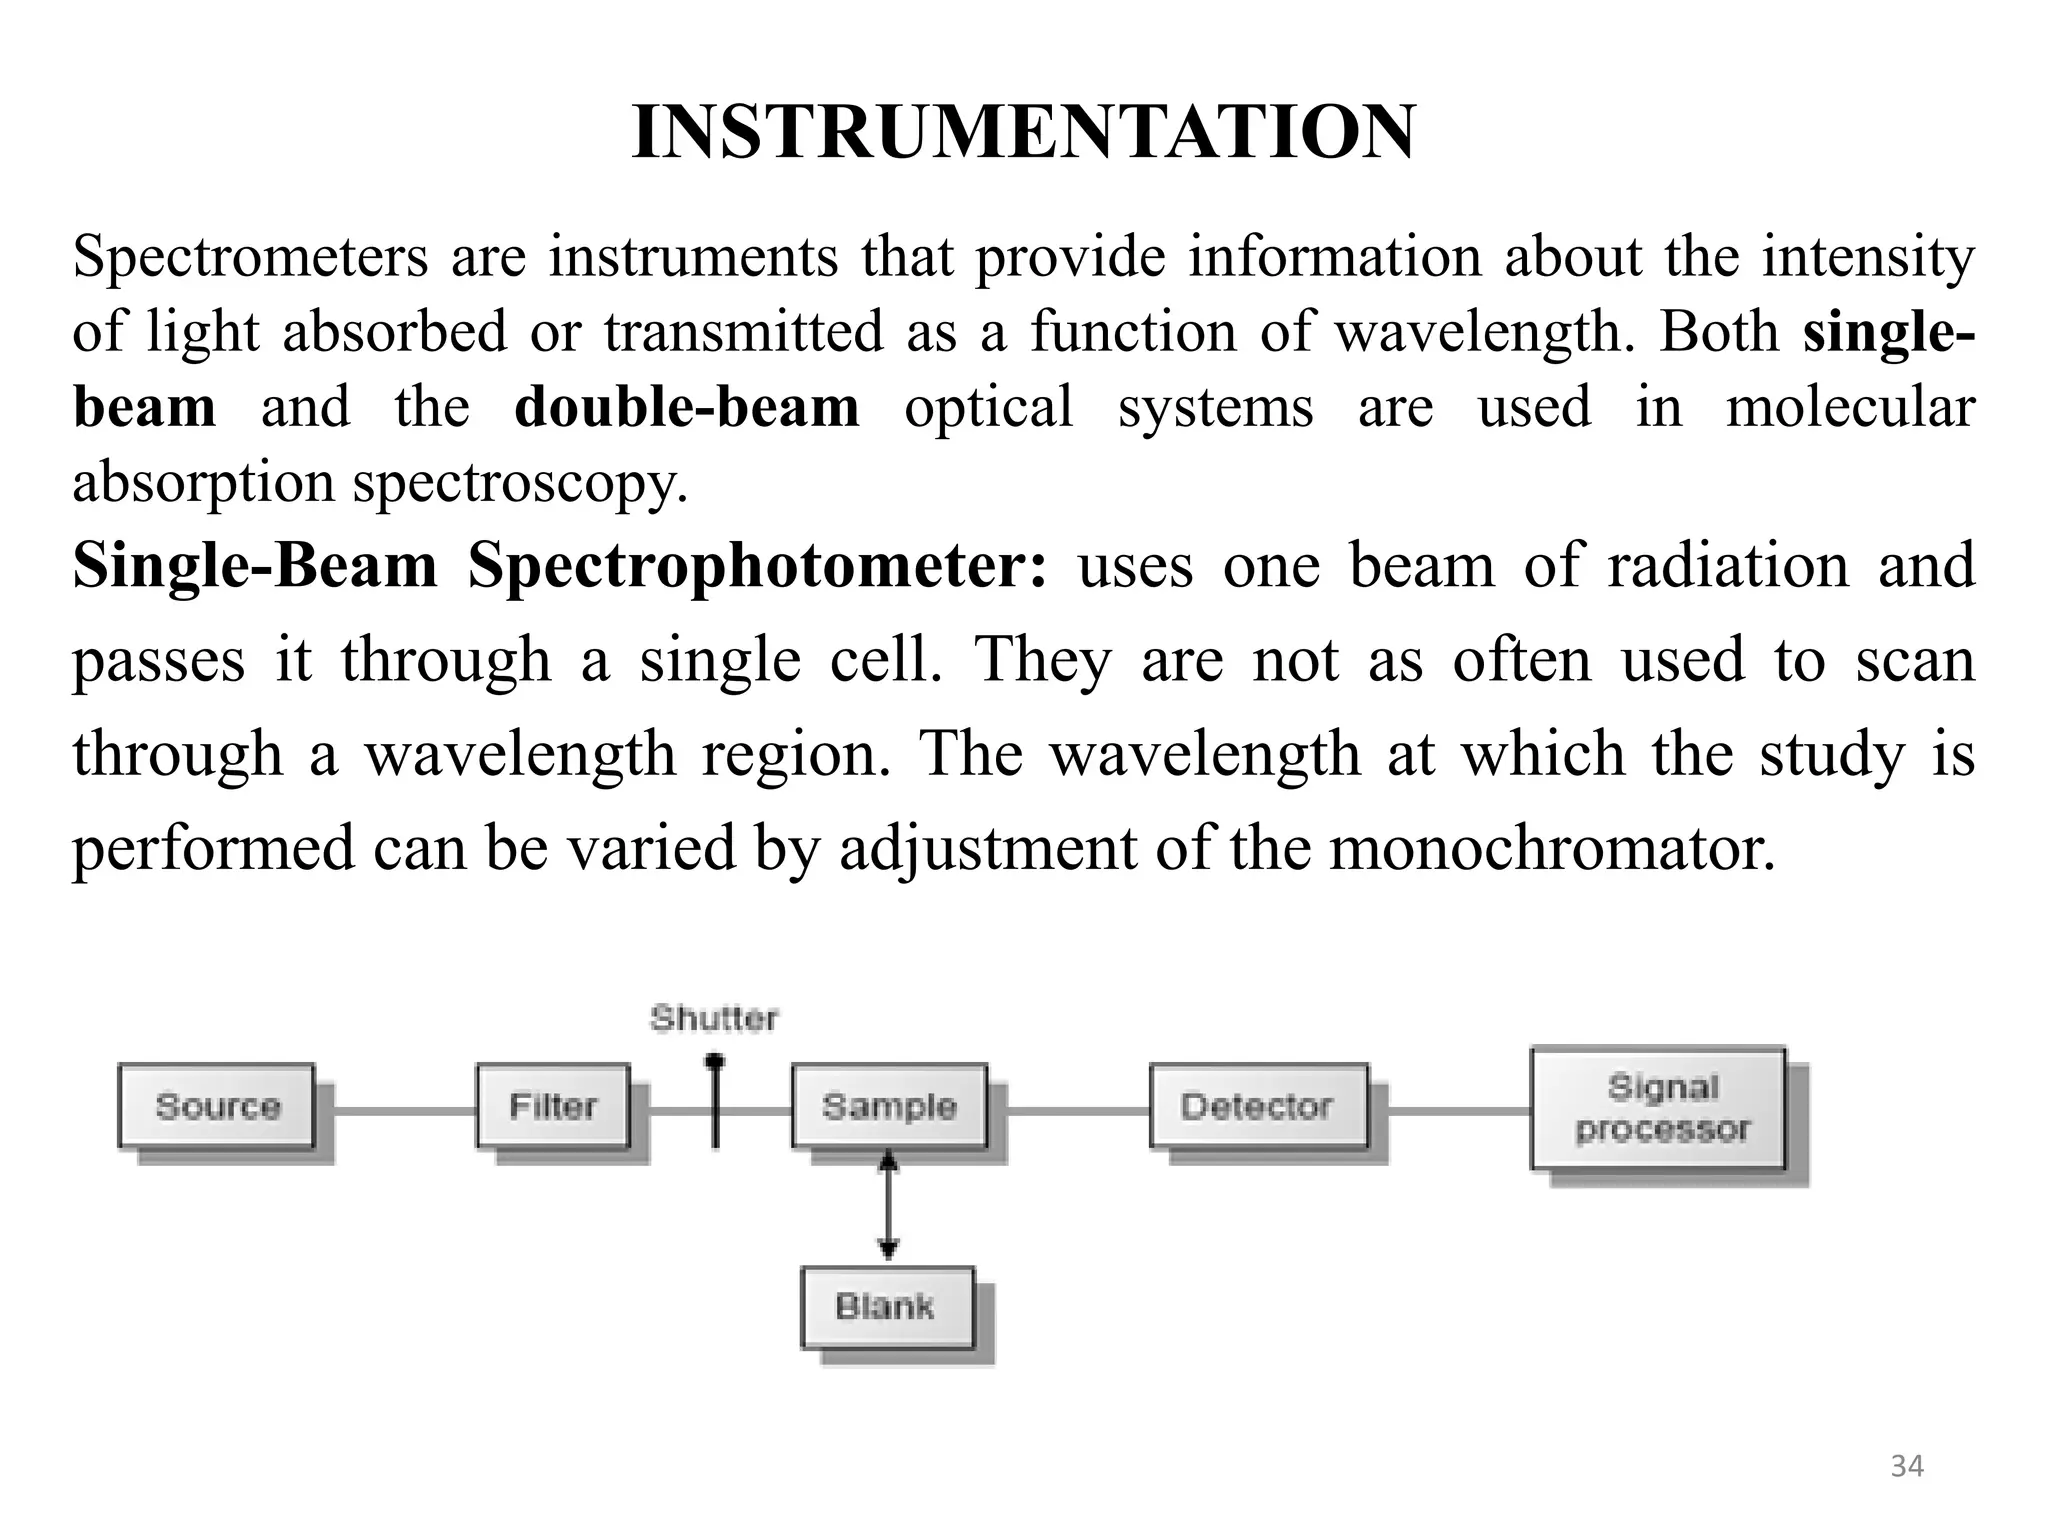
INSTRUMENTATION
Spectrometers are instrumentsthat provide information about the intensity
of light absorbed or transmitted as a function of wavelength. Both single-
beam and the double-beam optical systems are used in molecular
absorption spectroscopy.
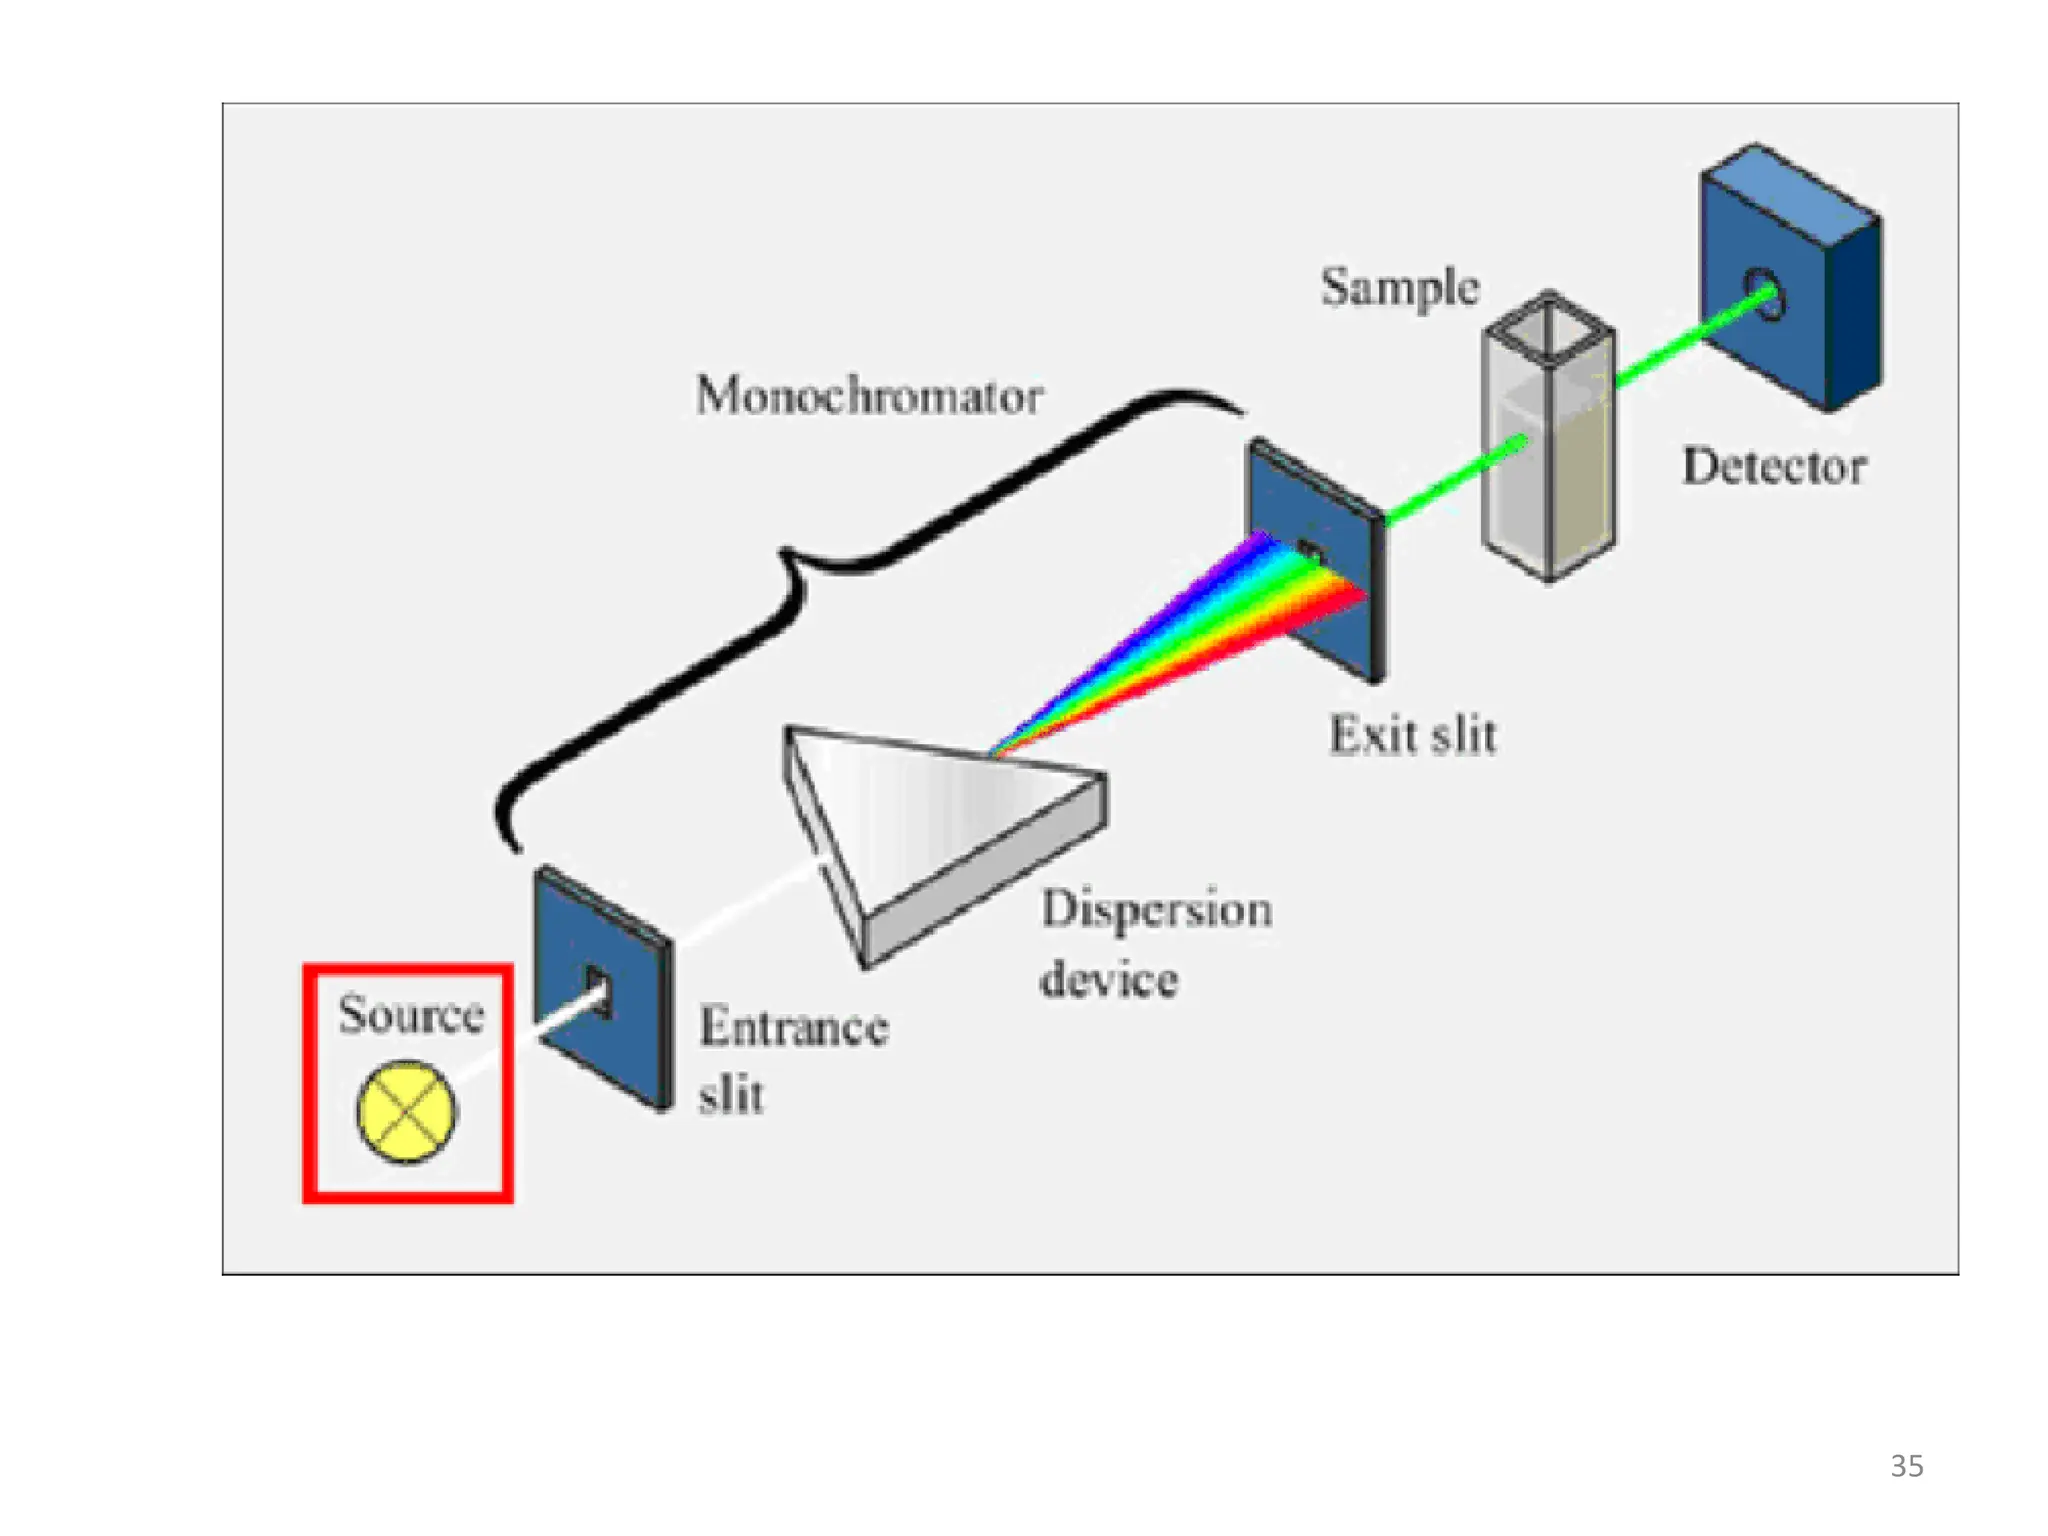
Single-Beam Spectrophotometer: uses one beam of radiation and
passes it through a single cell. They are not as often used to scan
through a wavelength region. The wavelength at which the study is
performed can be varied by adjustment of the monochromator.
34
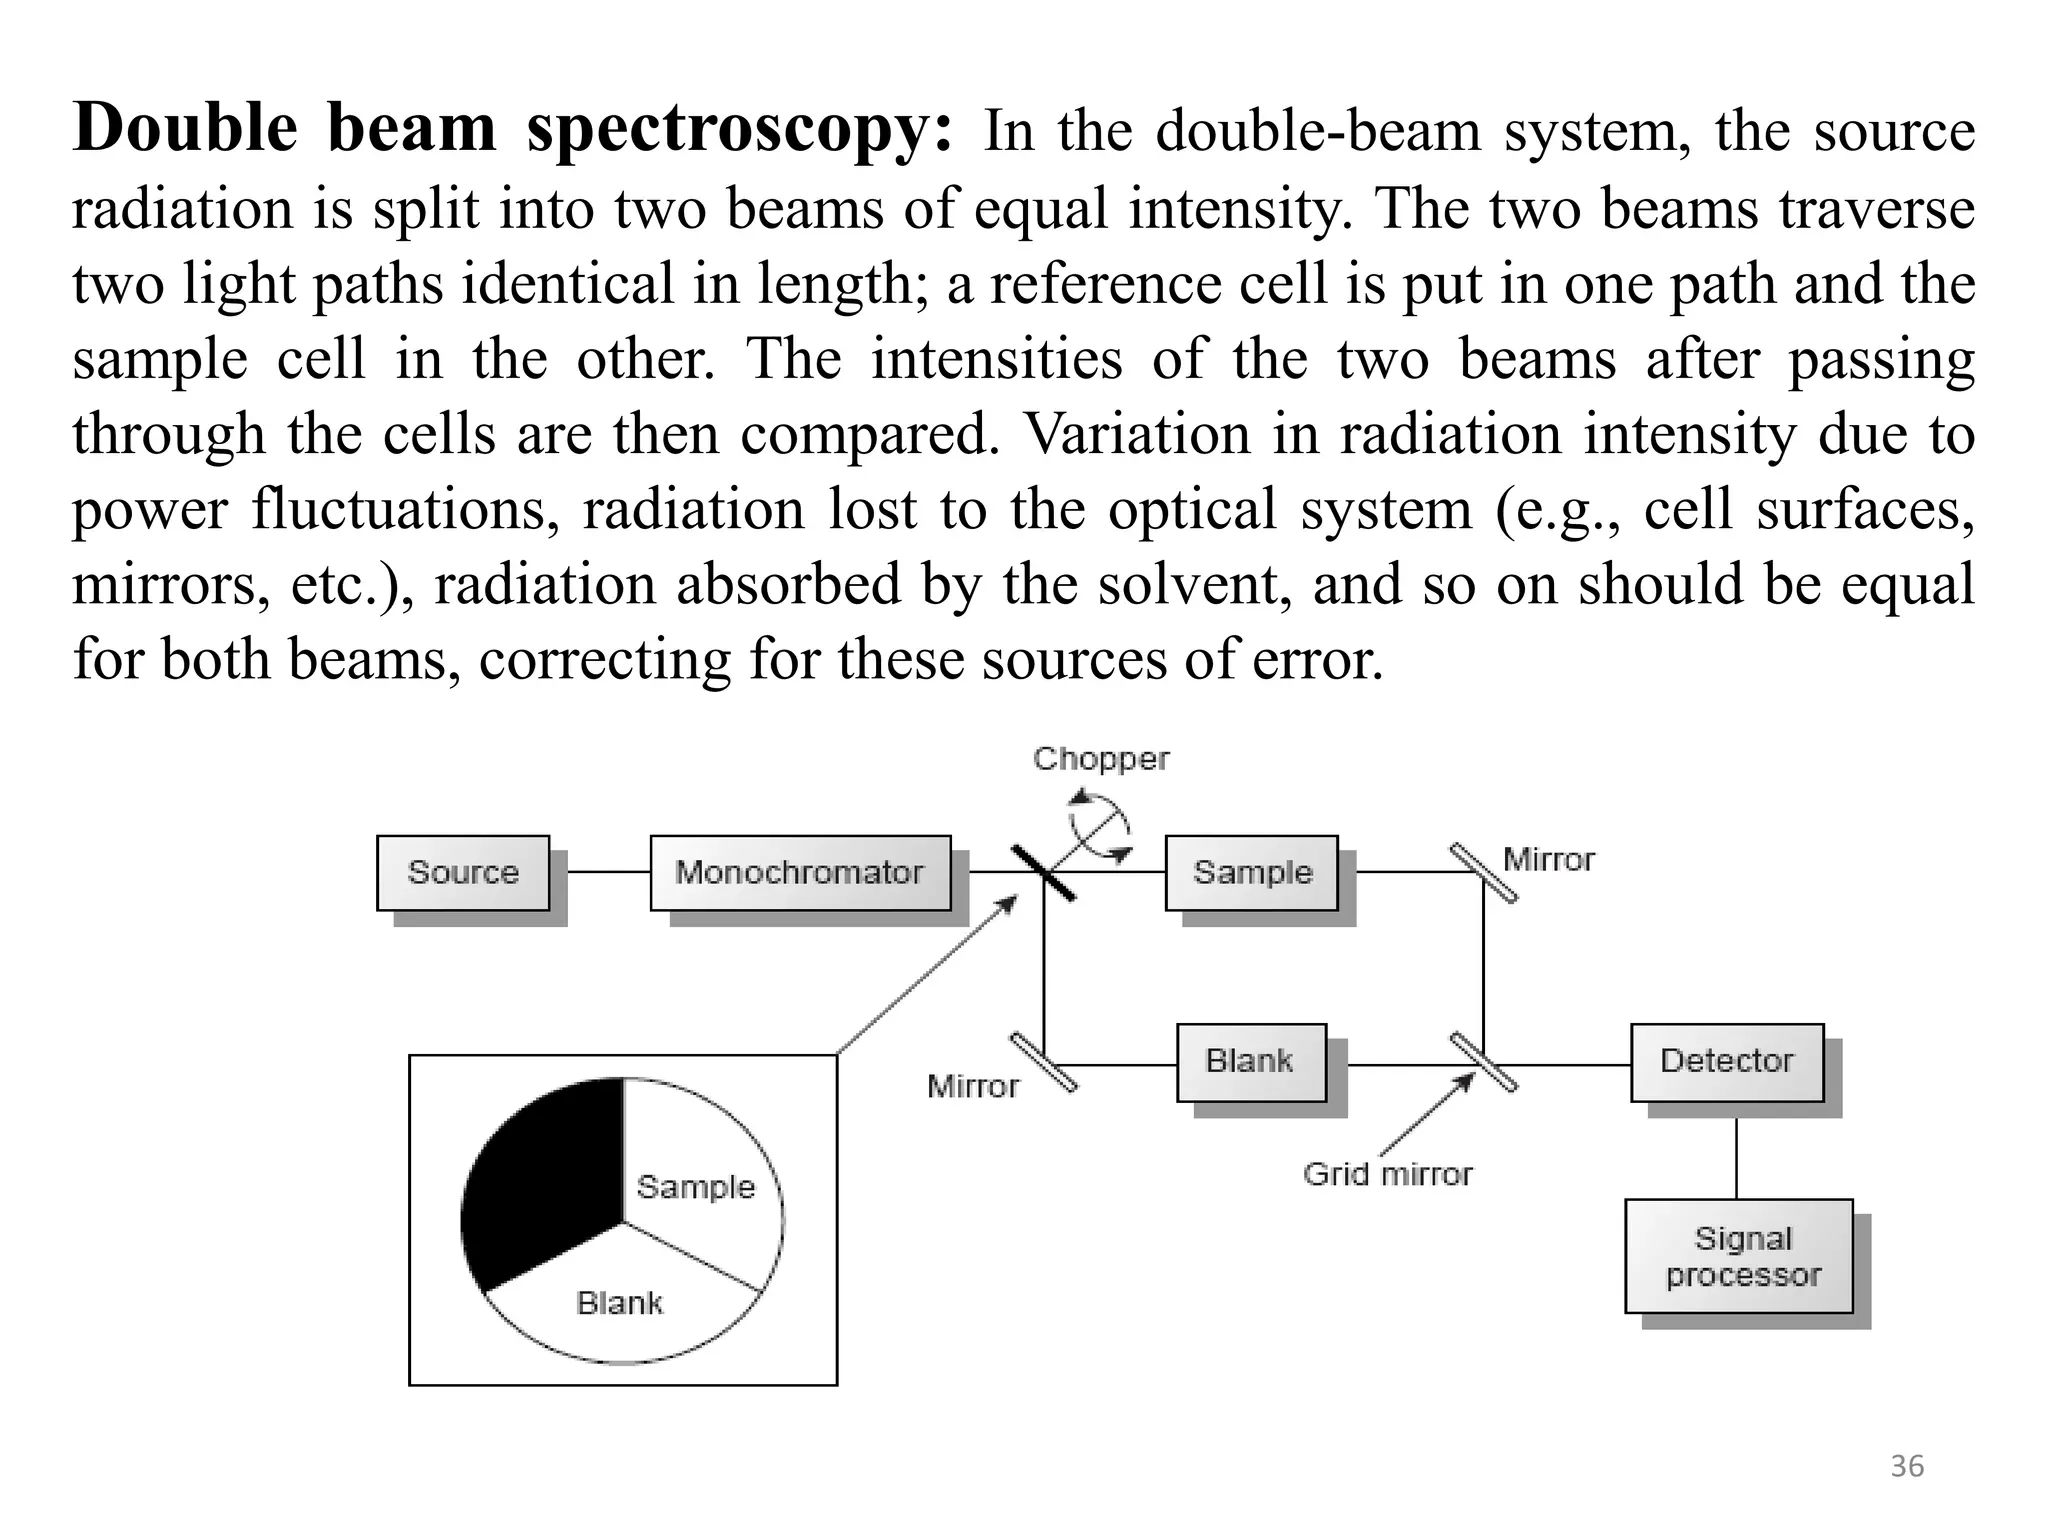
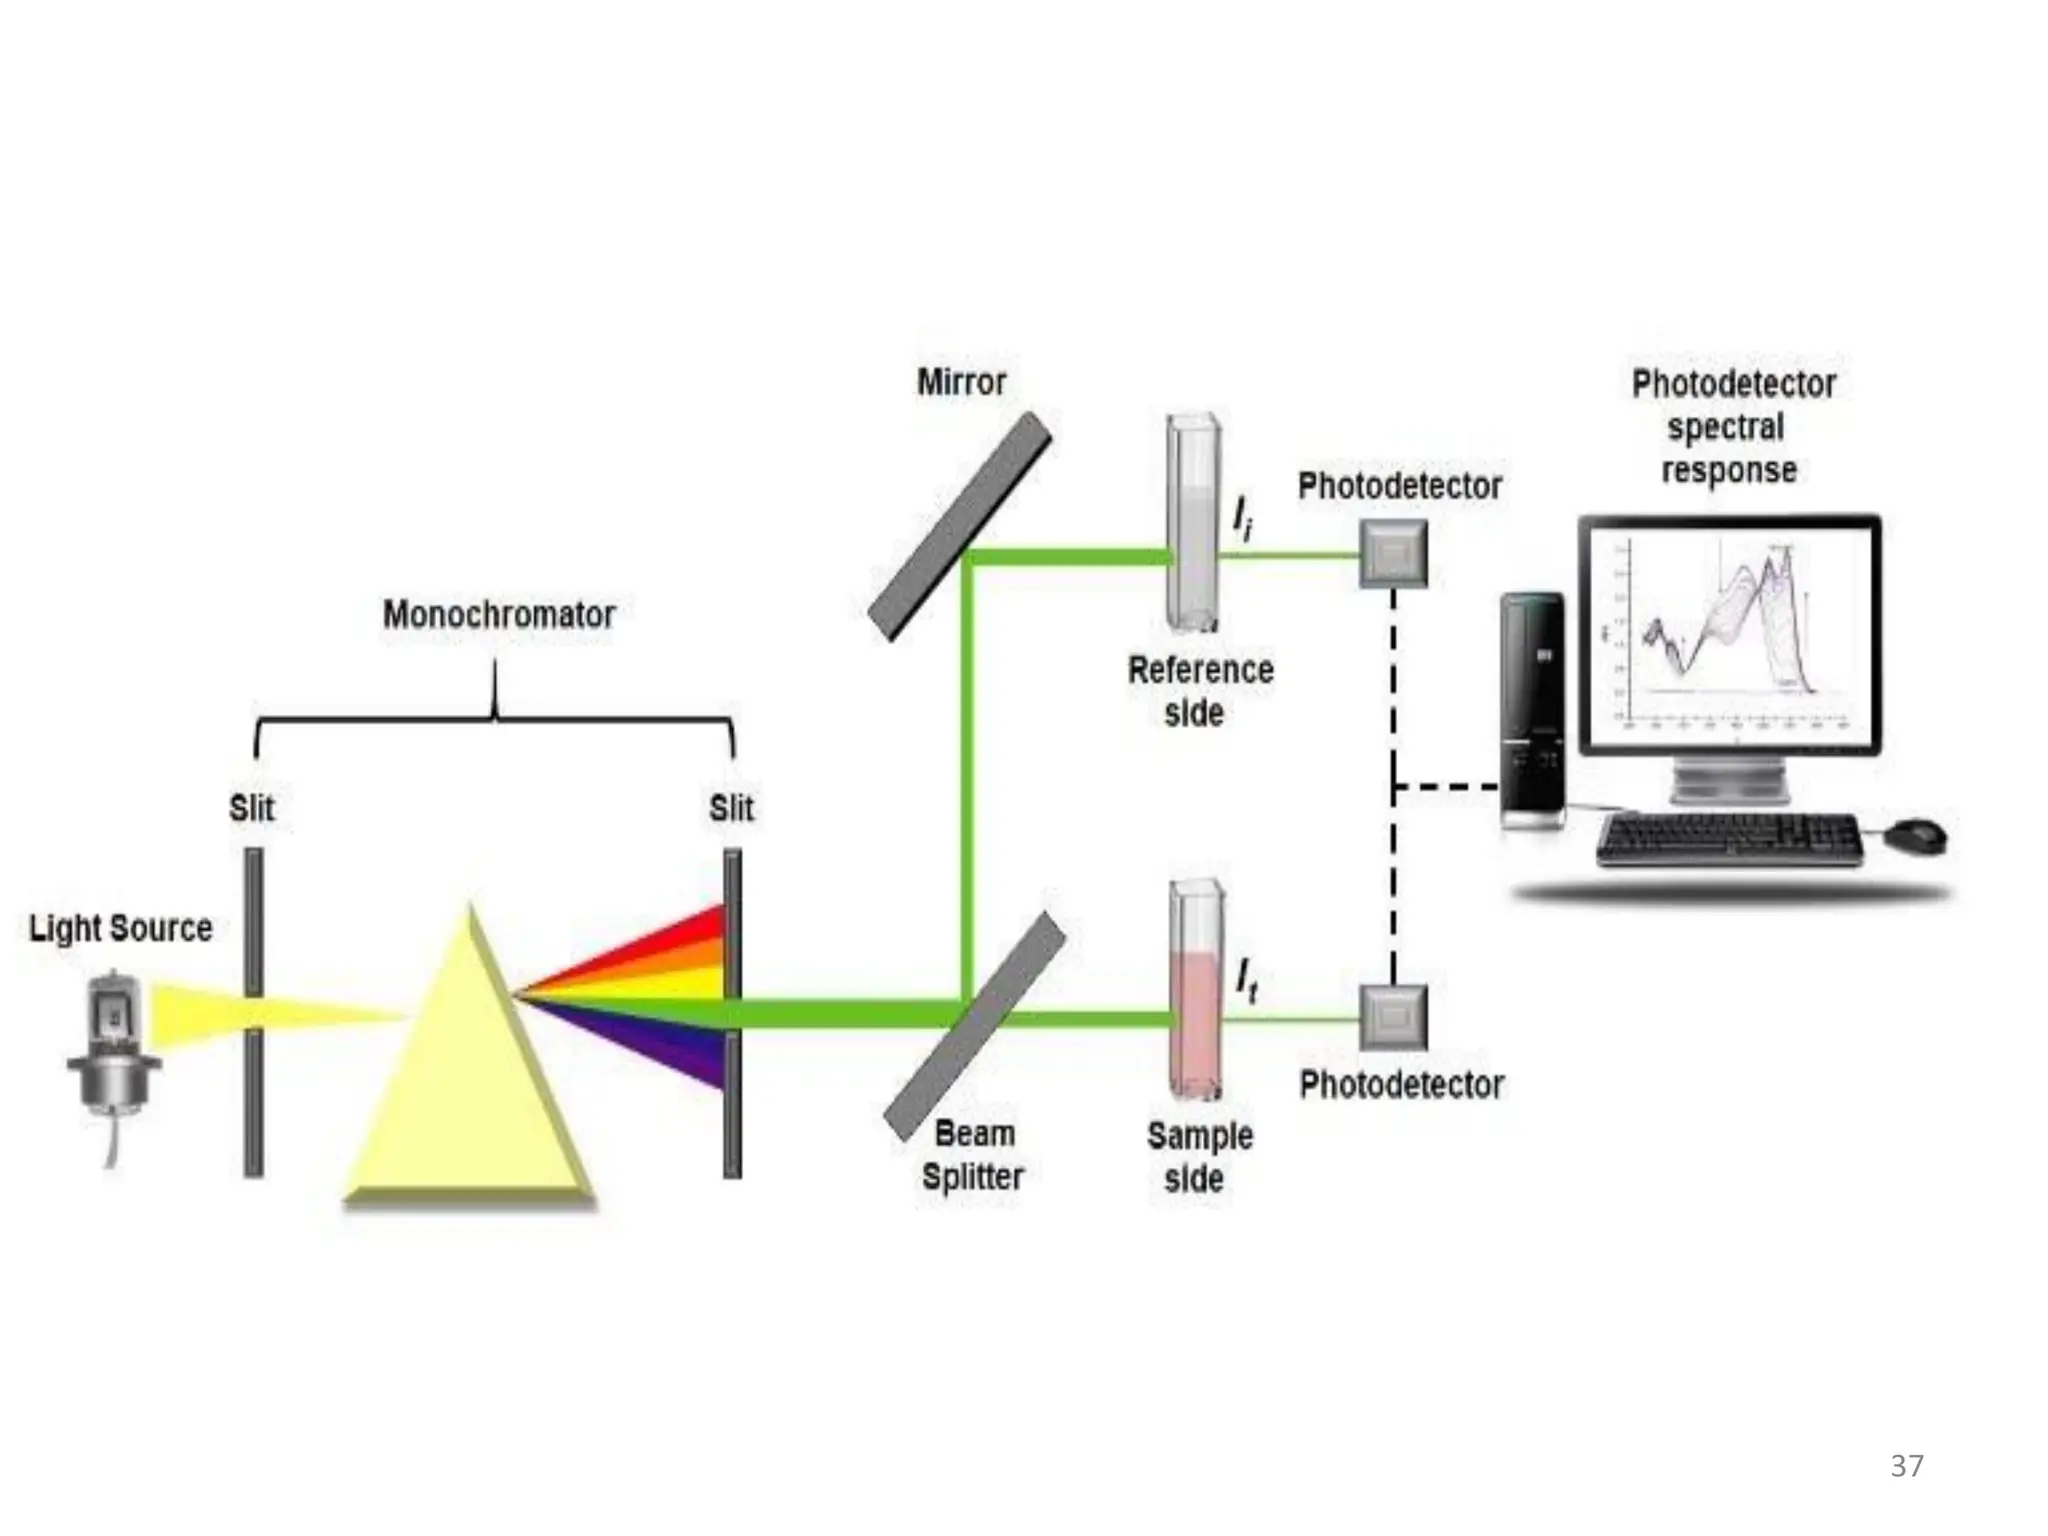
Double beam spectroscopy:In the double-beam system, the source
radiation is split into two beams of equal intensity. The two beams traverse
two light paths identical in length; a reference cell is put in one path and the
sample cell in the other. The intensities of the two beams after passing
through the cells are then compared. Variation in radiation intensity due to
power fluctuations, radiation lost to the optical system (e.g., cell surfaces,
mirrors, etc.), radiation absorbed by the solvent, and so on should be equal
for both beams, correcting for these sources of error.
36
All spectrometers forabsorption measurements require a light source,
a wavelength selection device, a sample holder, and a detector.
Radiation Sources
Radiation sources for molecular absorption measurements must
produce light over a continuum of wavelengths. Ideally, the intensity
of the source would be constant over all wavelengths emitted.
Traditionally, the two most common radiation sources for UV/VIS
spectroscopy were the tungsten lamp and the deuterium discharge
lamp. The tungsten lamp is similar in functioning to an ordinary
electric light bulb. It contains a tungsten filament heated electrically
to white heat, and generates a continuum spectrum. The tungsten
lamp is most useful over the visible range. Because it is used only in
the visible region, the bulb (i.e., the lamp envelope) can be made of
glass instead of quartz. Quartz is required for the transmission of UV
light.
38
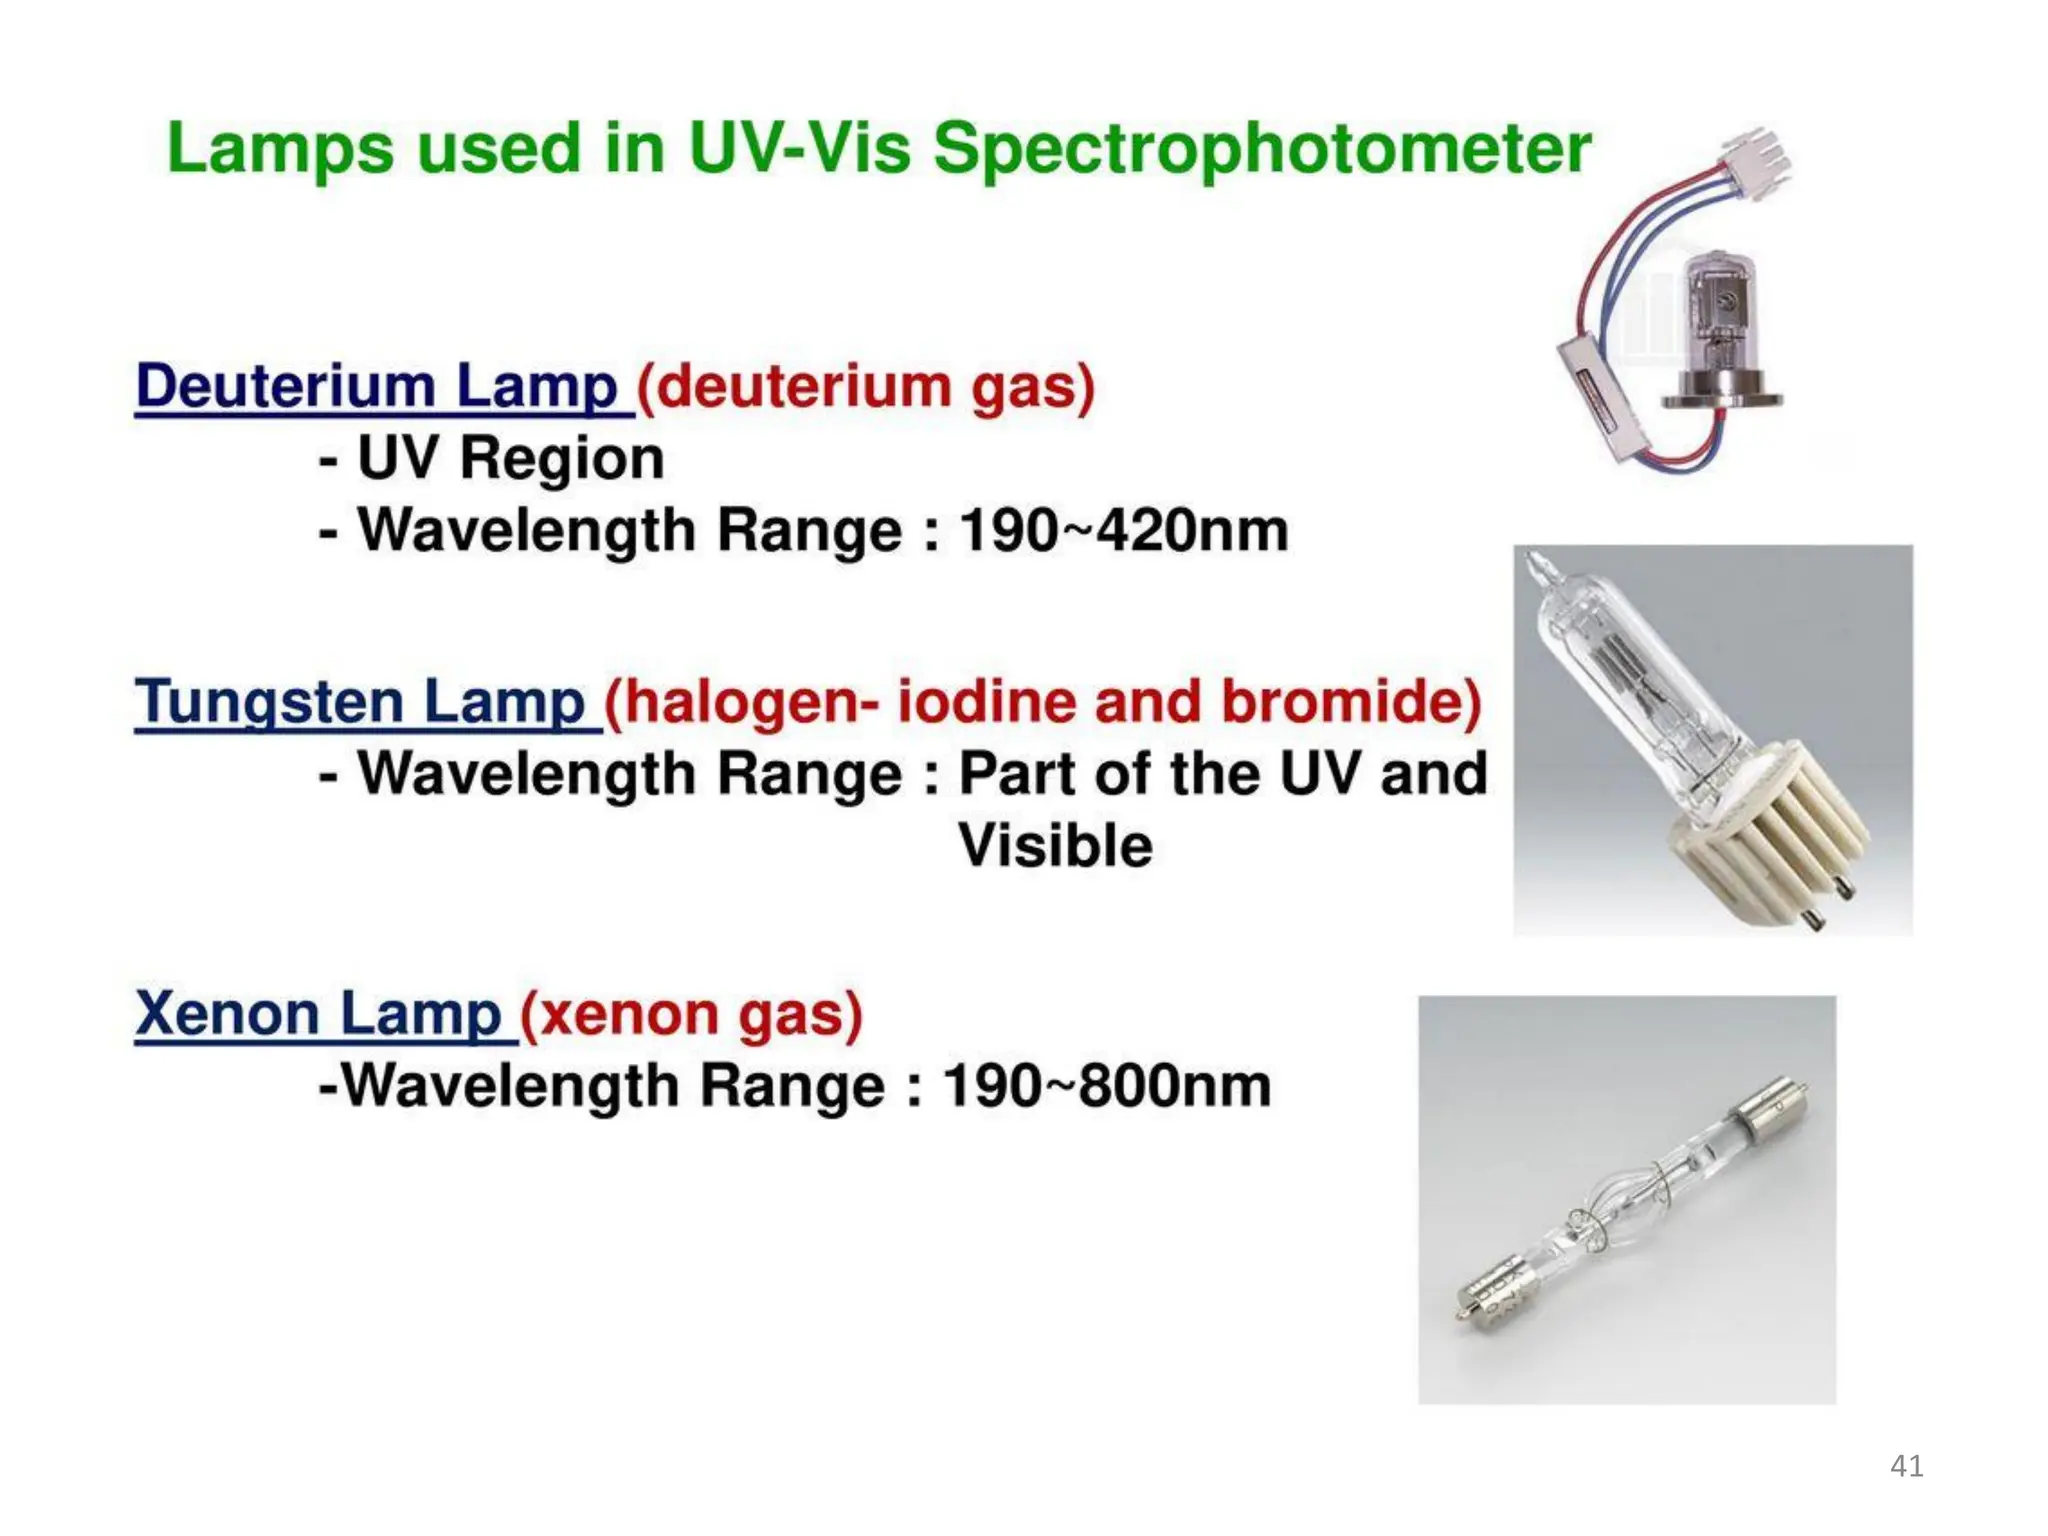
39.
The tungsten-halogen lamp,similar to the lamp in modern auto
headlights, has replaced the older tungsten lamp in modern
instruments. The tungsten-halogen lamp has a quartz bulb, primarily
to withstand the high operating temperatures of the lamp. This lamp
is much more efficient than a W lamp and has a significantly longer
lifetime.
The deuterium arc lamp consists of deuterium gas (D2) in a quartz
bulb through which there is an electrical discharge. The molecules
are excited electrically and the excited deuterium molecule
dissociates, emitting UV radiation. This causes the lamp to emit a
continuum (broadband) UV spectrum over the range of 160–400 nm
rather than a narrow line atomic emission spectrum. The lamps are
stable, robust, and widely used.
39
40.
Xenon arc lampsoperate in a manner similar to deuterium lamps. A
passage of current through xenon gas produces intense radiation
over the 200–1000 nm range. They provide very high radiation
intensity and are widely used in the visible region and long-
wavelength end of the UV range.
40
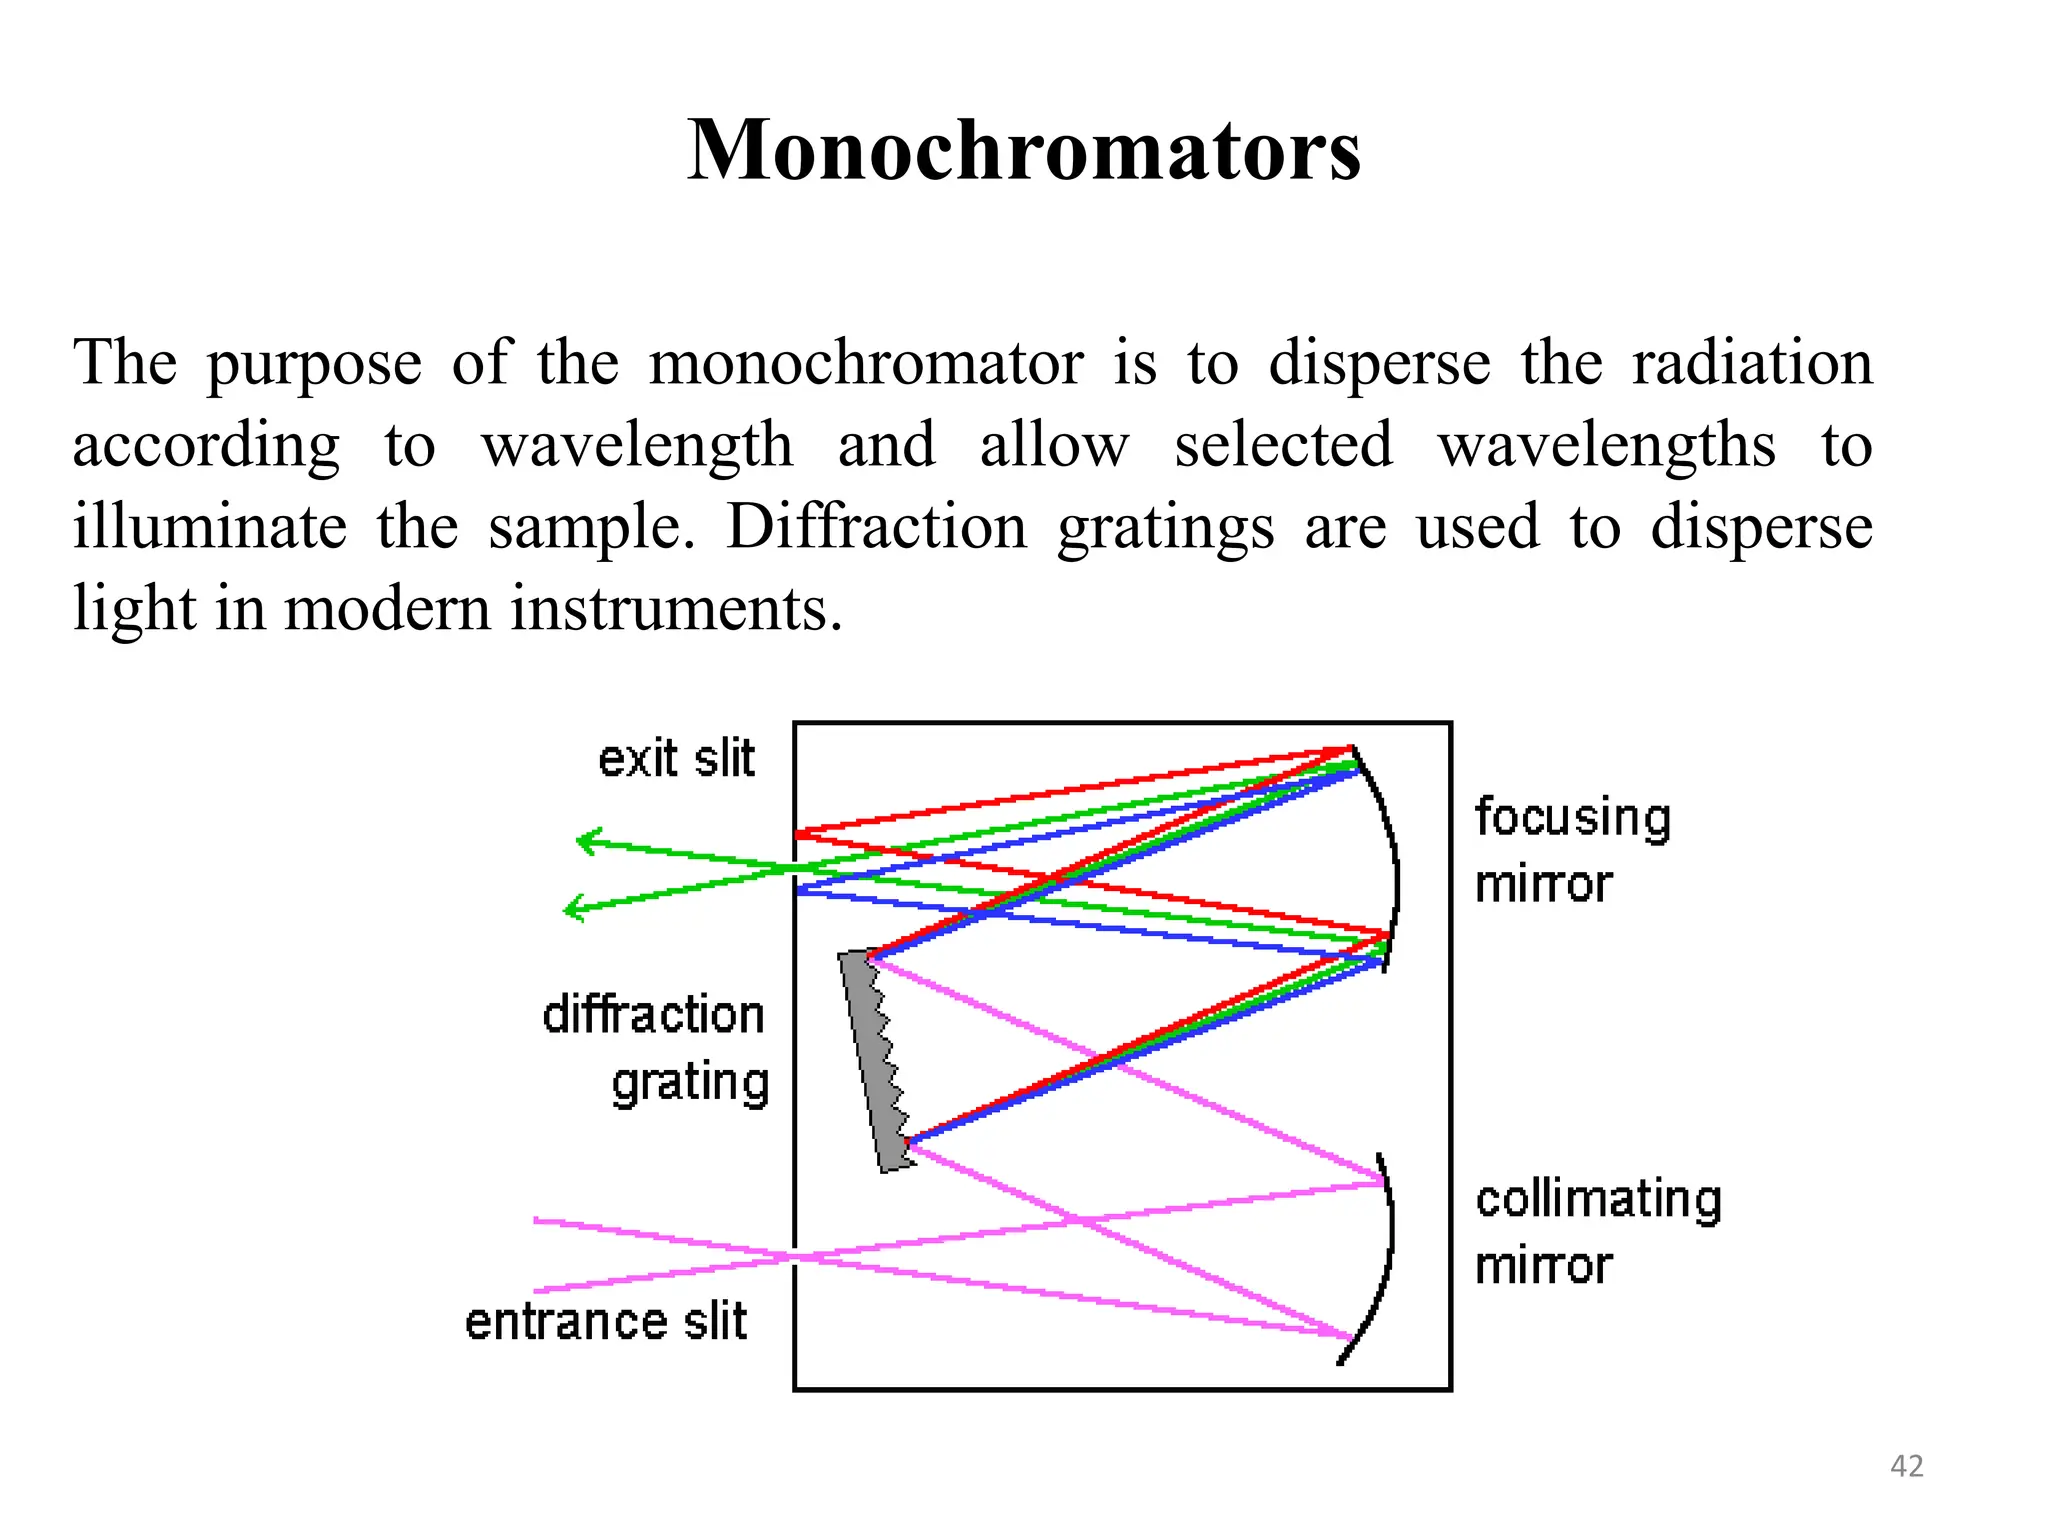
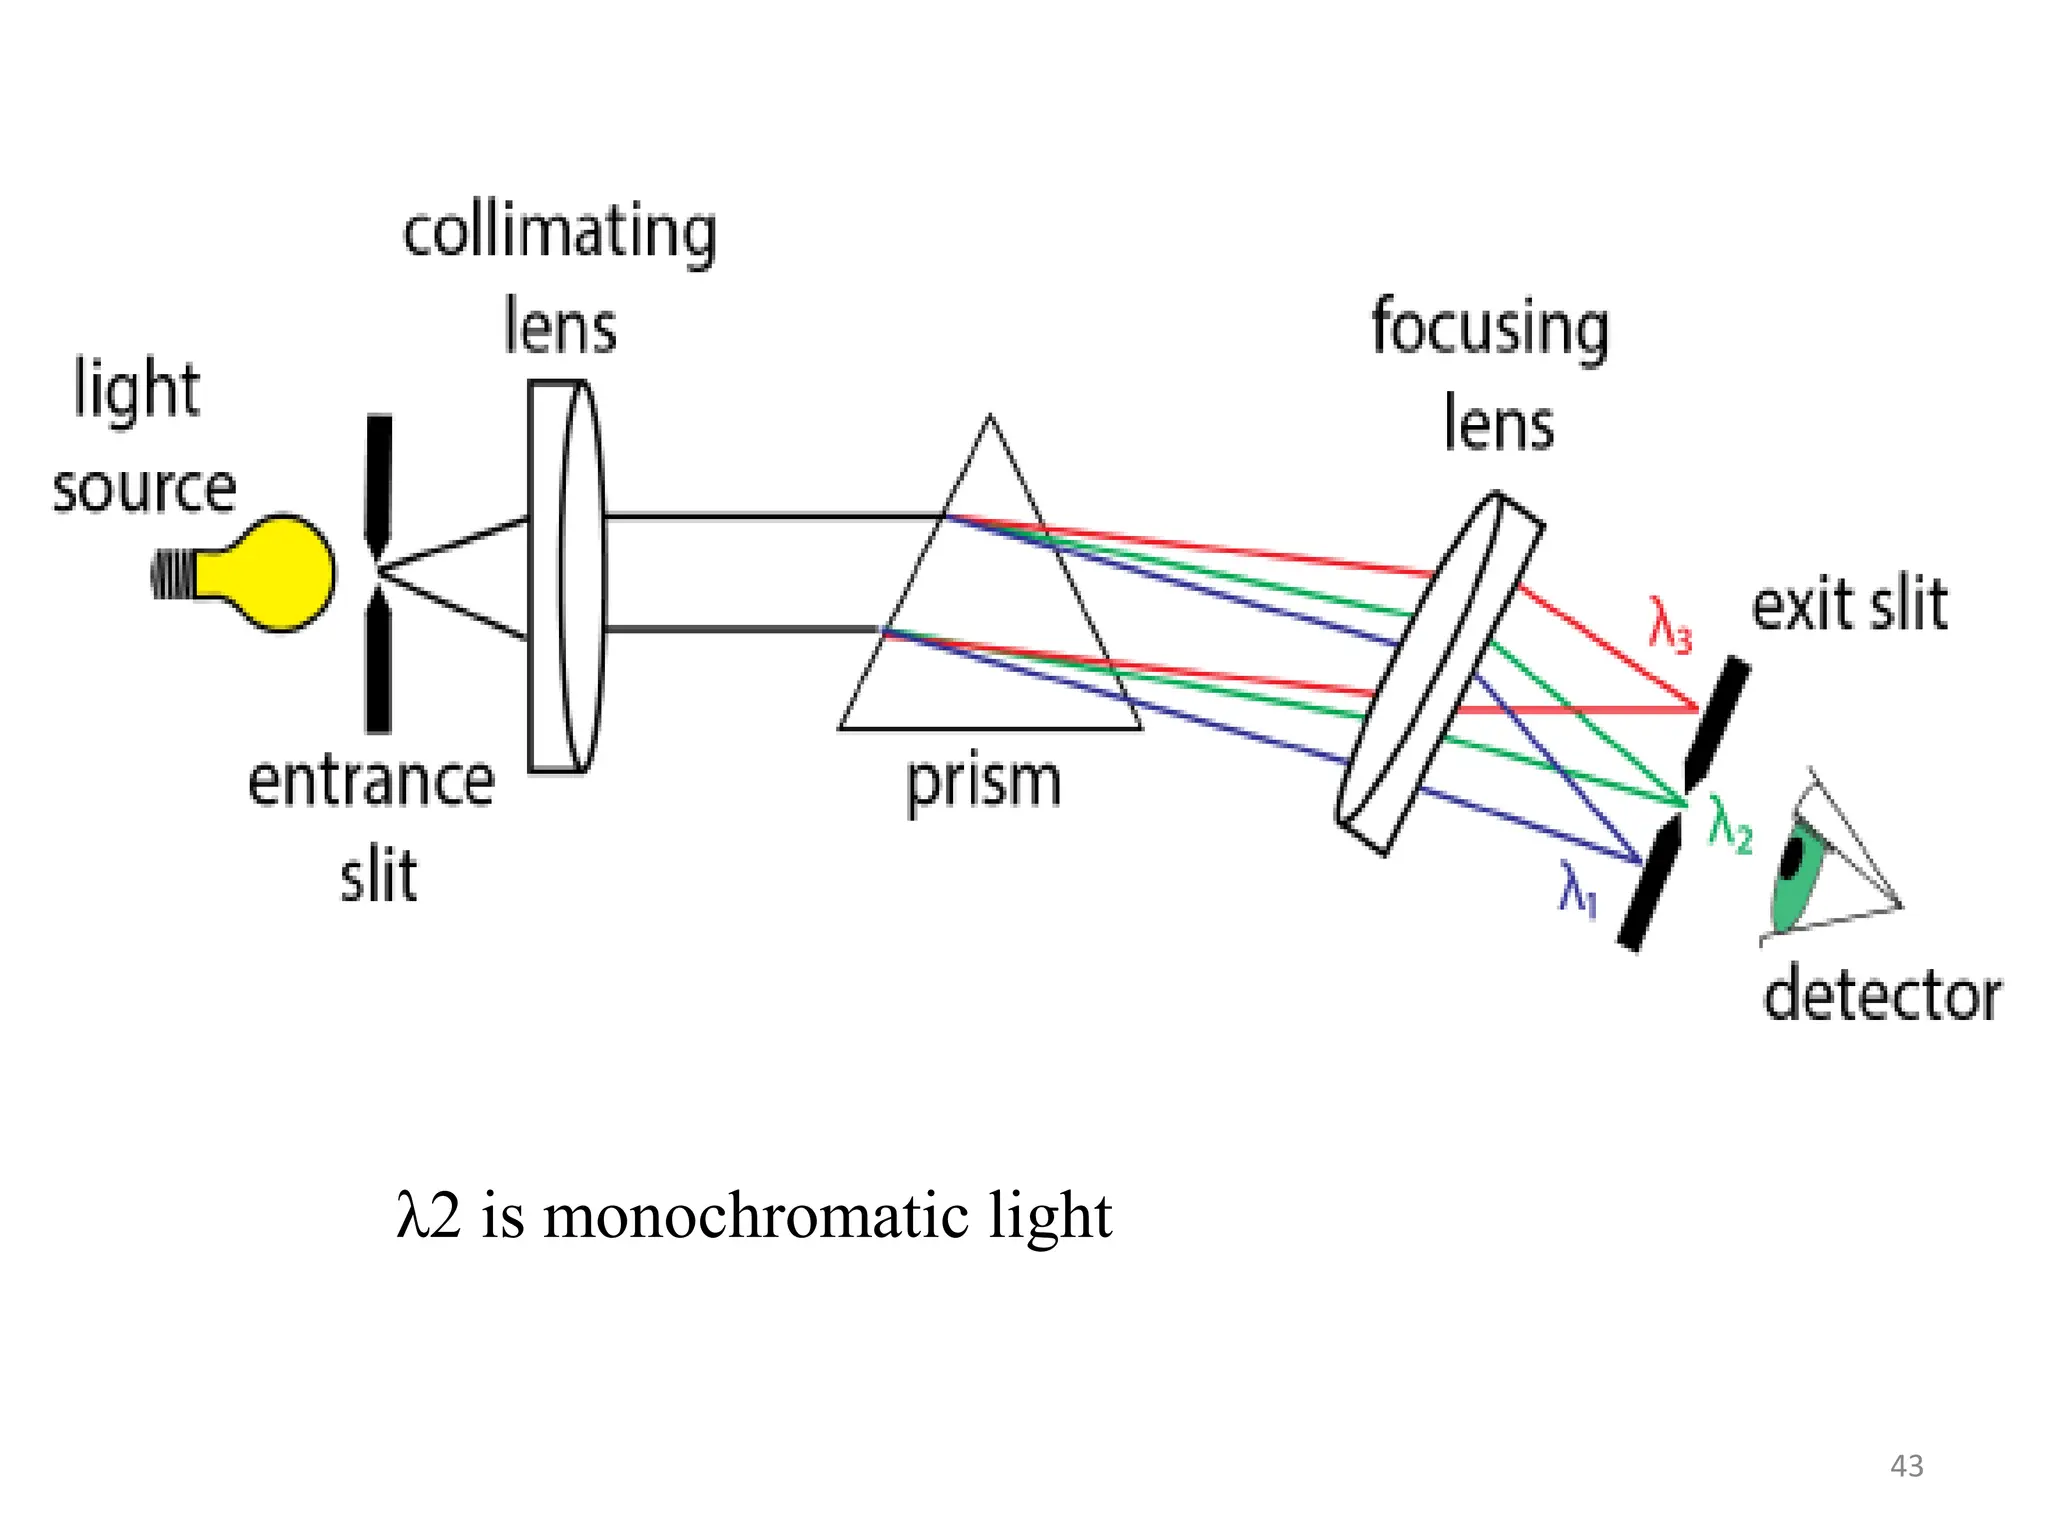
Monochromators
The purpose ofthe monochromator is to disperse the radiation
according to wavelength and allow selected wavelengths to
illuminate the sample. Diffraction gratings are used to disperse
light in modern instruments.
42
Detectors
Most modern instrumentsrely on photoelectric transducers,
detection devices that convert photons into an electrical signal.
Photoelectric transducers have a surface that can absorb radiant
energy. The absorbed energy either causes the emission of electrons,
resulting in a photocurrent or moves electrons into the conduction
band of a solid semiconductor, resulting in an increase in
conductivity. There are several common forms of these detectors
including barrier layer cells, photomultiplier tubes, and
semiconductor detectors.
44
45.
Barrier Layer Cell
Ina barrier layer cell, also called a photovoltaic cell, a current is
generated at the interface of a metal and a semiconductor when
radiation is absorbed. For example, silver is coated onto a
semiconductor such as selenium that is joined to a strong metal
base, such as iron. To manufacture these cells, the selenium is
placed in a container and the air pressure reduced to a vacuum.
Silver is heated electrically, and its surface becomes so hot that it
melts and vaporizes.
45
46.
The silver vaporcoats the selenium surface, forming a very thin
but evenly distributed layer of silver atoms. Any radiation falling
on the surface generates electrons and holes at the selenium–
silver interface. A barrier seems to exist between the selenium
and the iron that prevents electrons from flowing into the iron;
the electrons flow to the silver layer and the holes to the iron. The
electrons are collected by the silver. These collected electrons
migrate through an external circuit toward the holes. The
photocurrent generated in this manner is proportional to the
number of photons striking the cell.
46
47.
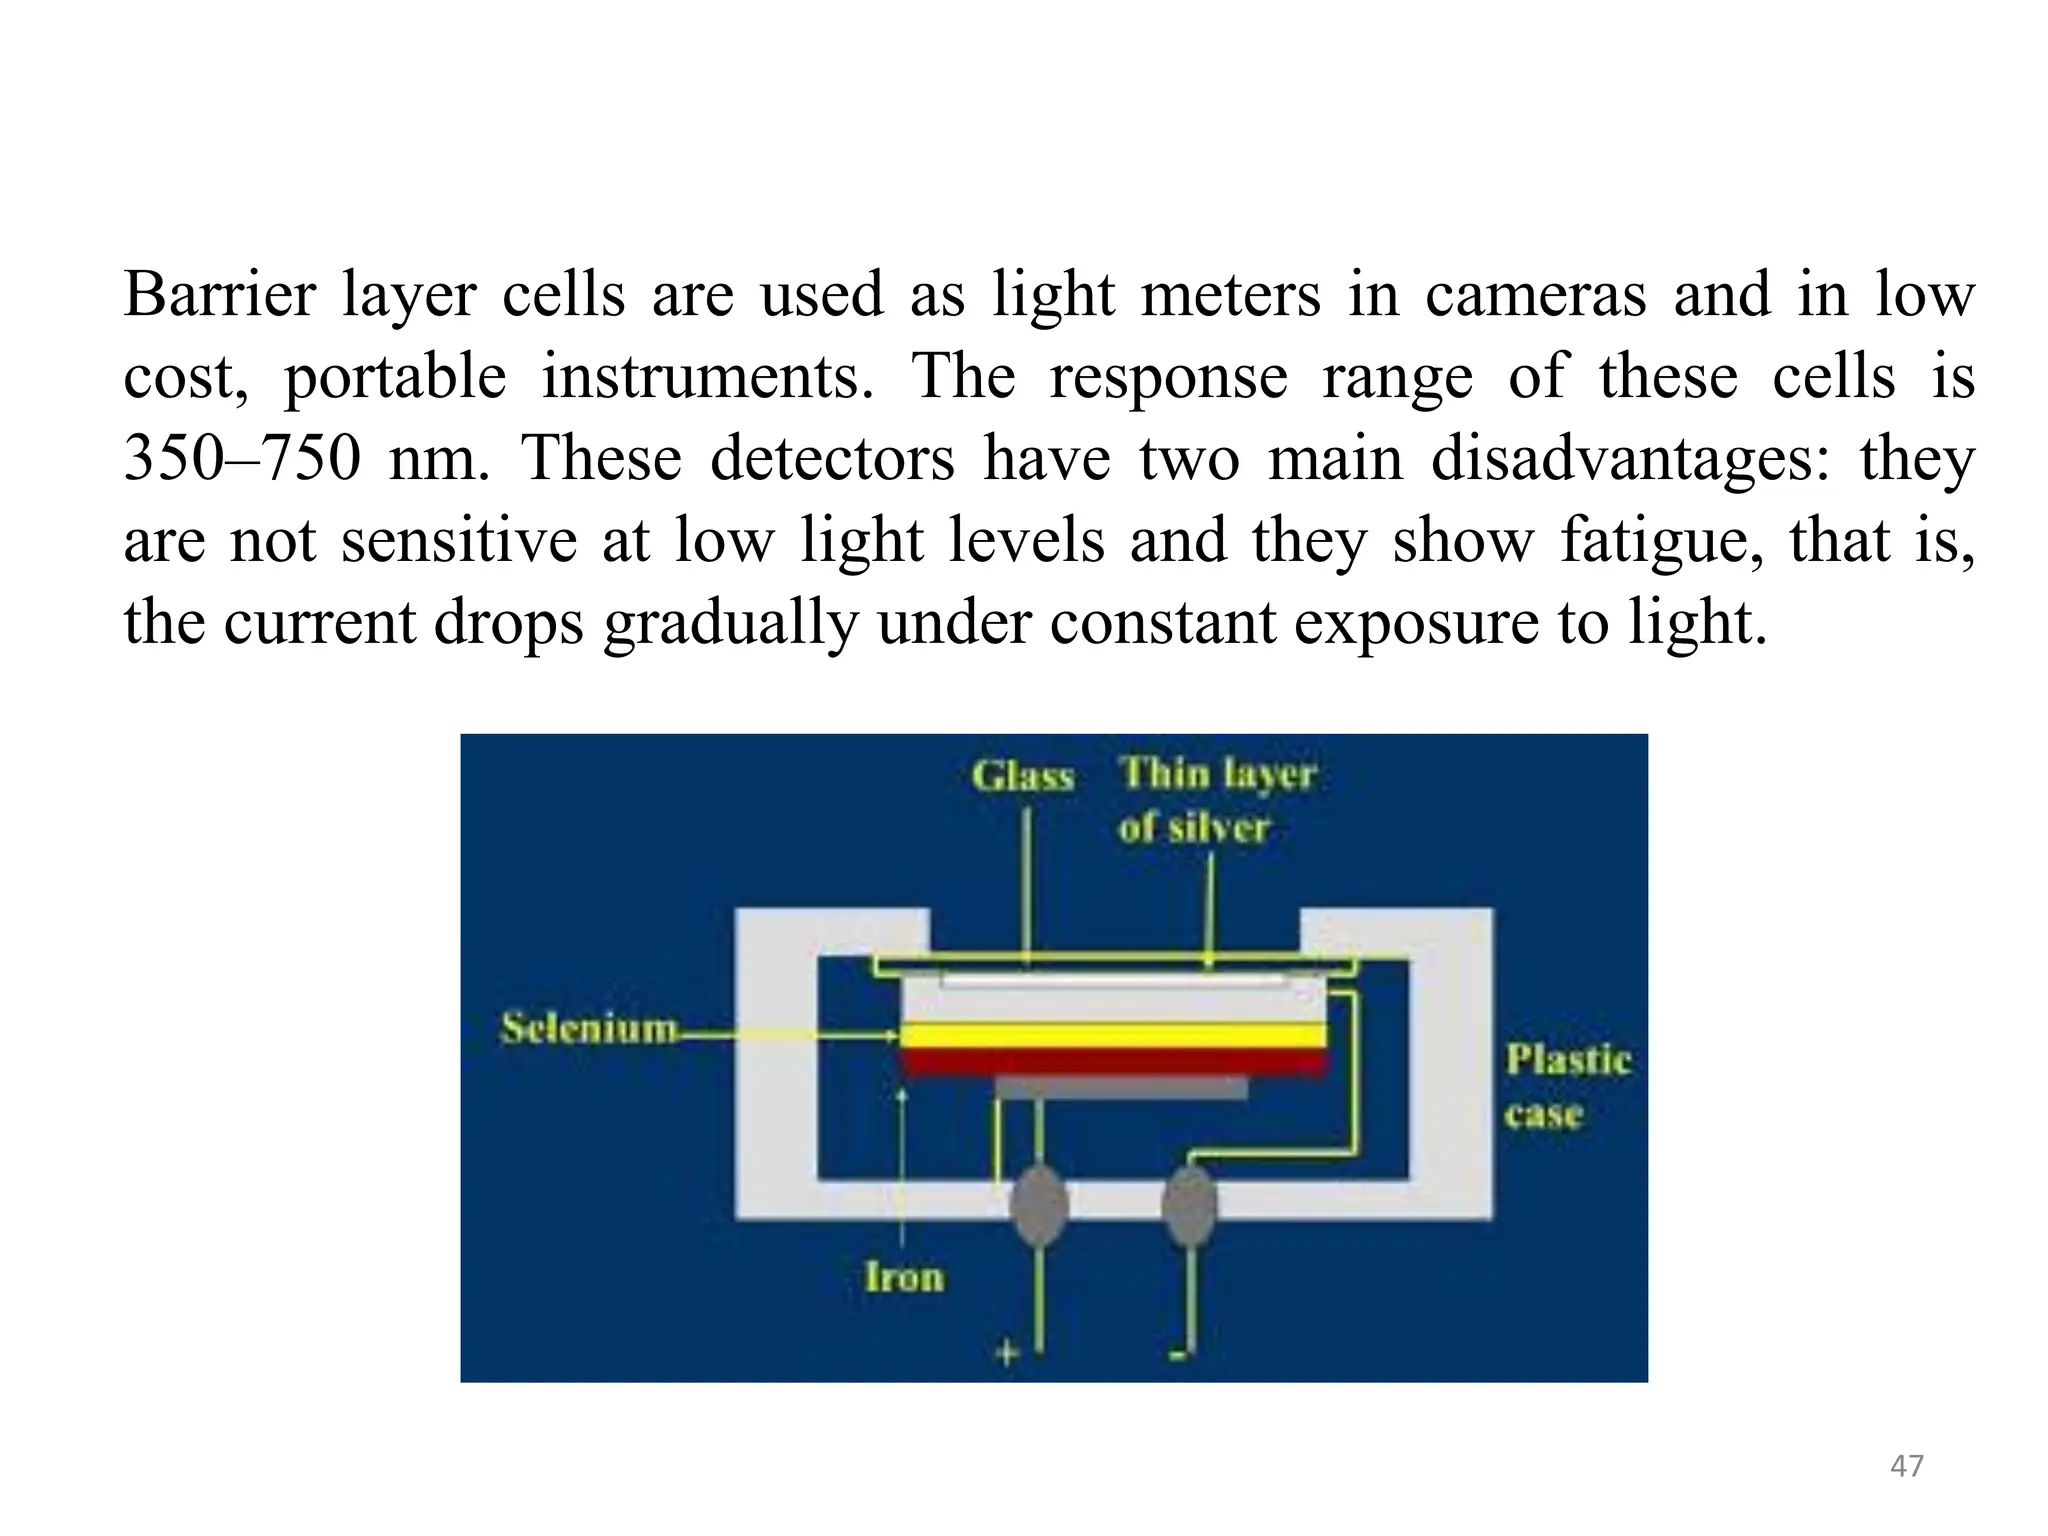
Barrier layer cellsare used as light meters in cameras and in low
cost, portable instruments. The response range of these cells is
350–750 nm. These detectors have two main disadvantages: they
are not sensitive at low light levels and they show fatigue, that is,
the current drops gradually under constant exposure to light.
47
48.
Photomultiplier Tube
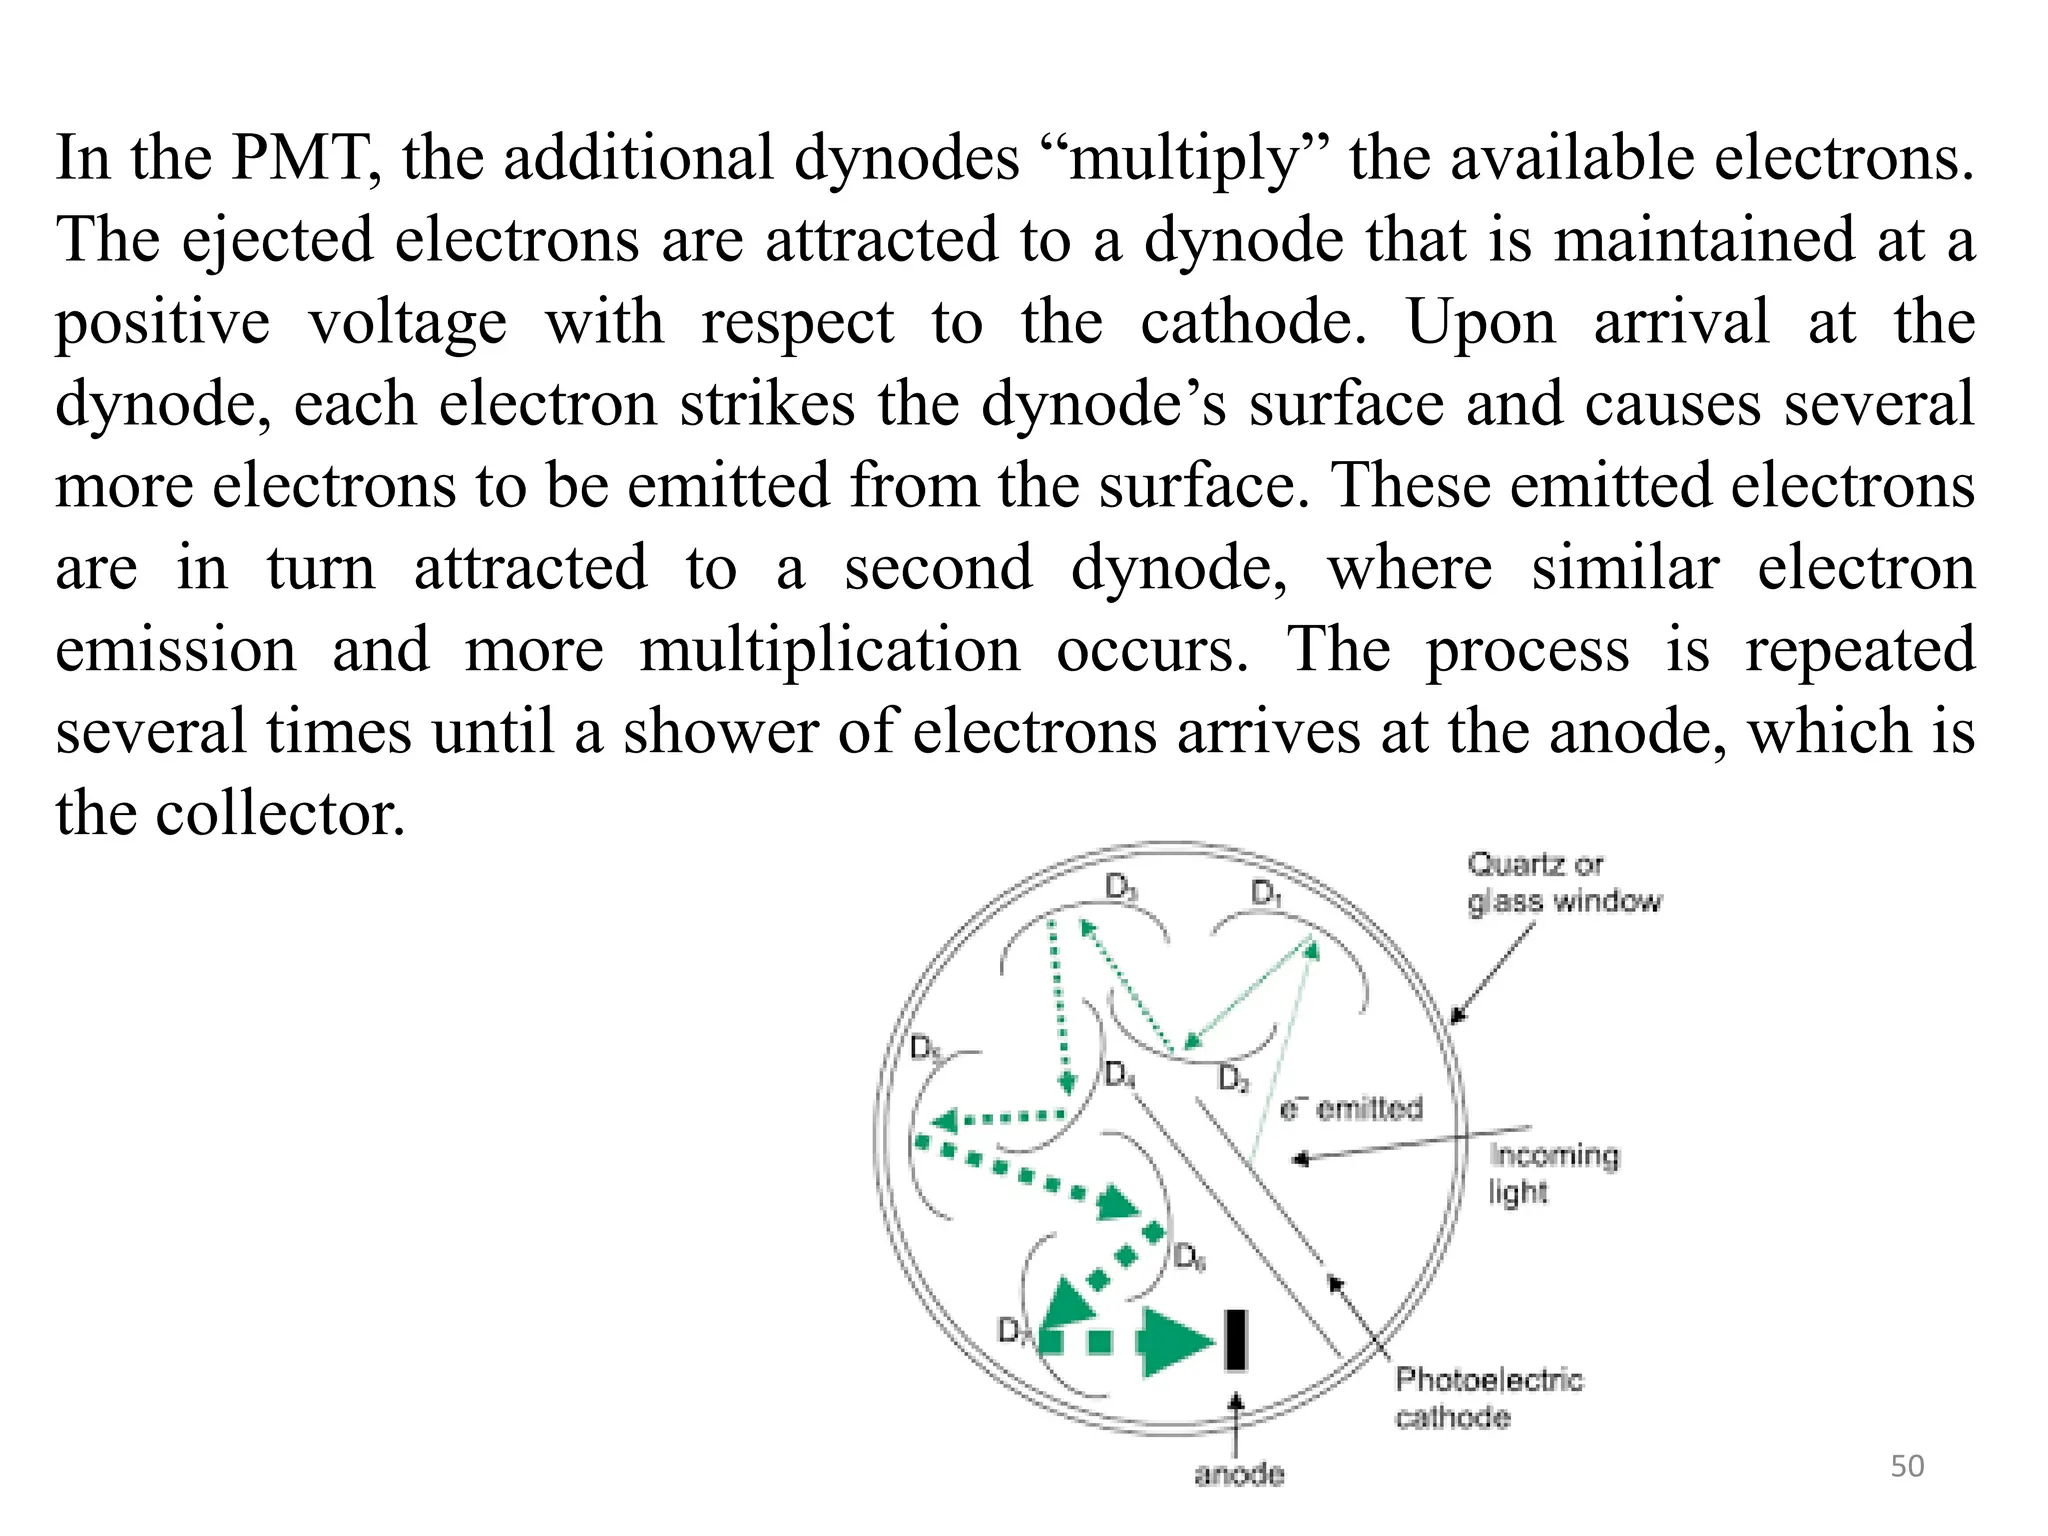
The mostcommon detector is the photomultiplier tube (PMT). A
PMT is a sealed, evacuated transparent envelope (quartz or glass)
containing a photoemissive cathode, an anode, and several additional
electrodes called dynodes. The photoemissive cathode is a metal
coated with an alkali metal or a mixture of elements (e.g.,
Na/K/Cs/Sb or Ga/As) that emits electrons when struck by photons.
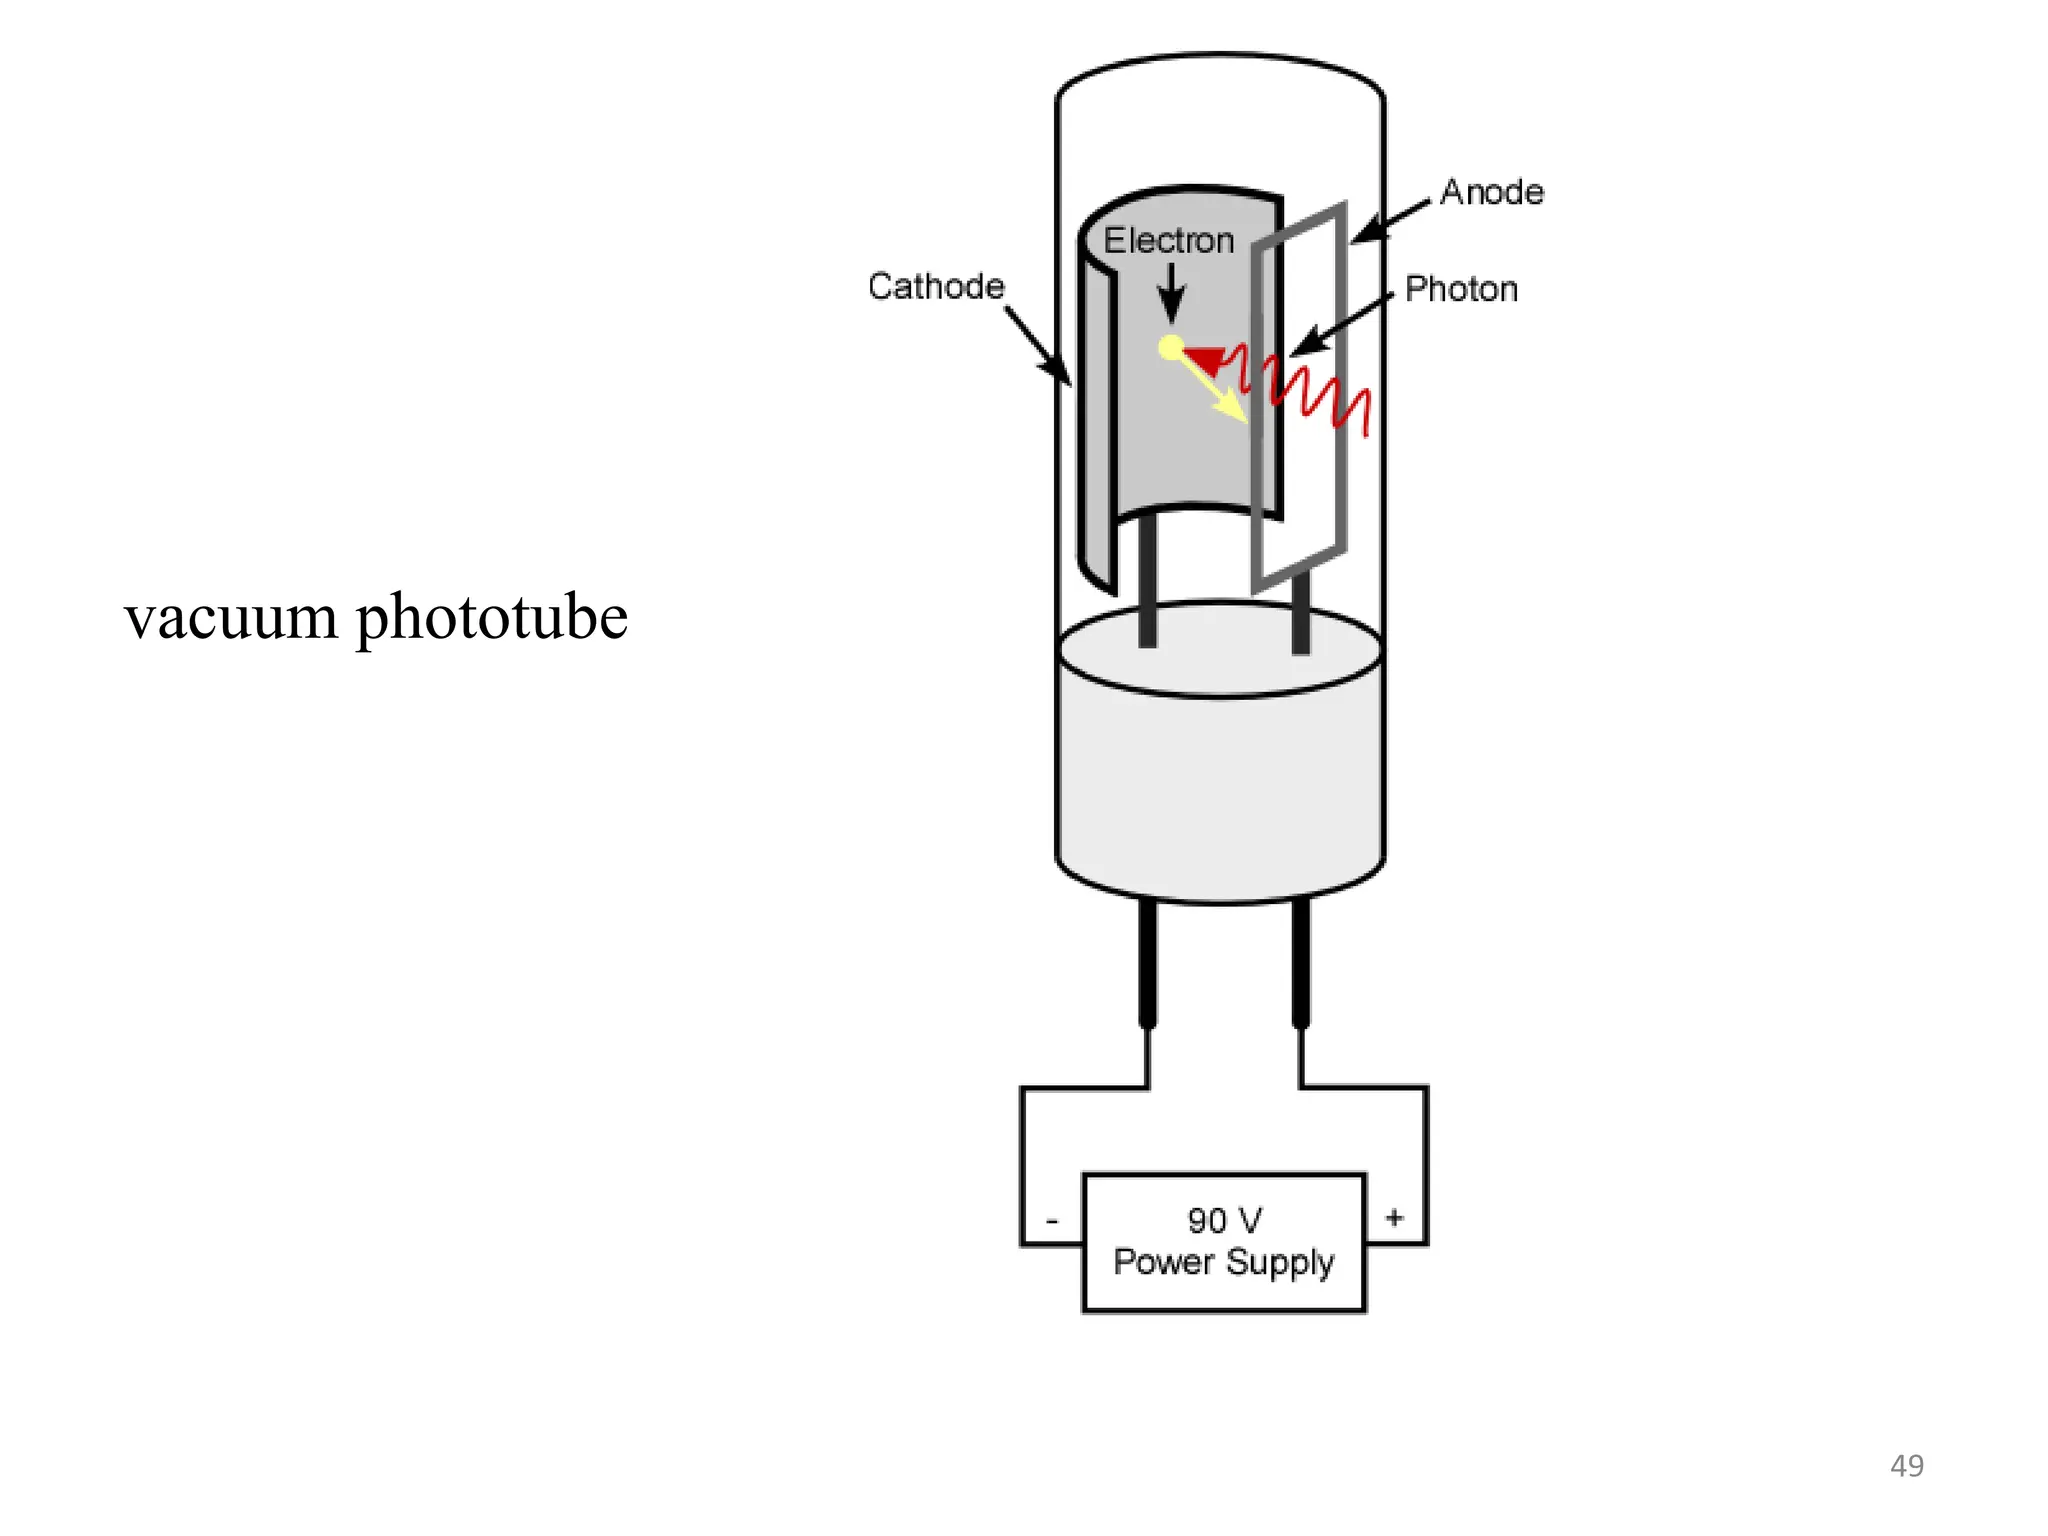
The PMT is a more sophisticated version of a vacuum phototube,
which contained only a photoemissive cathode and an anode; the
photocurrent was limited to the electrons ejected from the cathode.
48
In the PMT,the additional dynodes “multiply” the available electrons.
The ejected electrons are attracted to a dynode that is maintained at a
positive voltage with respect to the cathode. Upon arrival at the
dynode, each electron strikes the dynode’s surface and causes several
more electrons to be emitted from the surface. These emitted electrons
are in turn attracted to a second dynode, where similar electron
emission and more multiplication occurs. The process is repeated
several times until a shower of electrons arrives at the anode, which is
the collector.
50
51.
The number ofelectrons falling on the collector is a measure of the
intensity of light falling on the detector. In the process, a single
photon may generate many electrons and give a high signal. The
dynodes are therefore operated at an optimum voltage that gives a
steady signal. A commercial photomultiplier tube may have nine or
more dynodes. The gain may be as high as 109 electrons per photon.
The noise level of the detector system ultimately limits the gain. For
example, increasing the voltage between dynodes increases the signal,
but if the voltage is made too high, the signal from the detector
becomes erratic or noisy. In practice, lower gains and lower noise
levels may be preferable for accuracy. PMTs are extremely sensitive
to UV and visible radiation.
51
52.
Semiconductor Detectors
Solid semiconductingmaterials are extremely important in
electronics and instrumentation, including their use as radiation
detectors. To understand the behavior of a semiconductor, it is
necessary to briefly describe the bonding in these materials.
When a large number of atoms bond to form a solid, such as solid
silicon, the discrete energy levels that existed in the individual
atoms spread into energy bands in the solid. The valence
electrons are no longer localized in space at a given atom.
52
53.
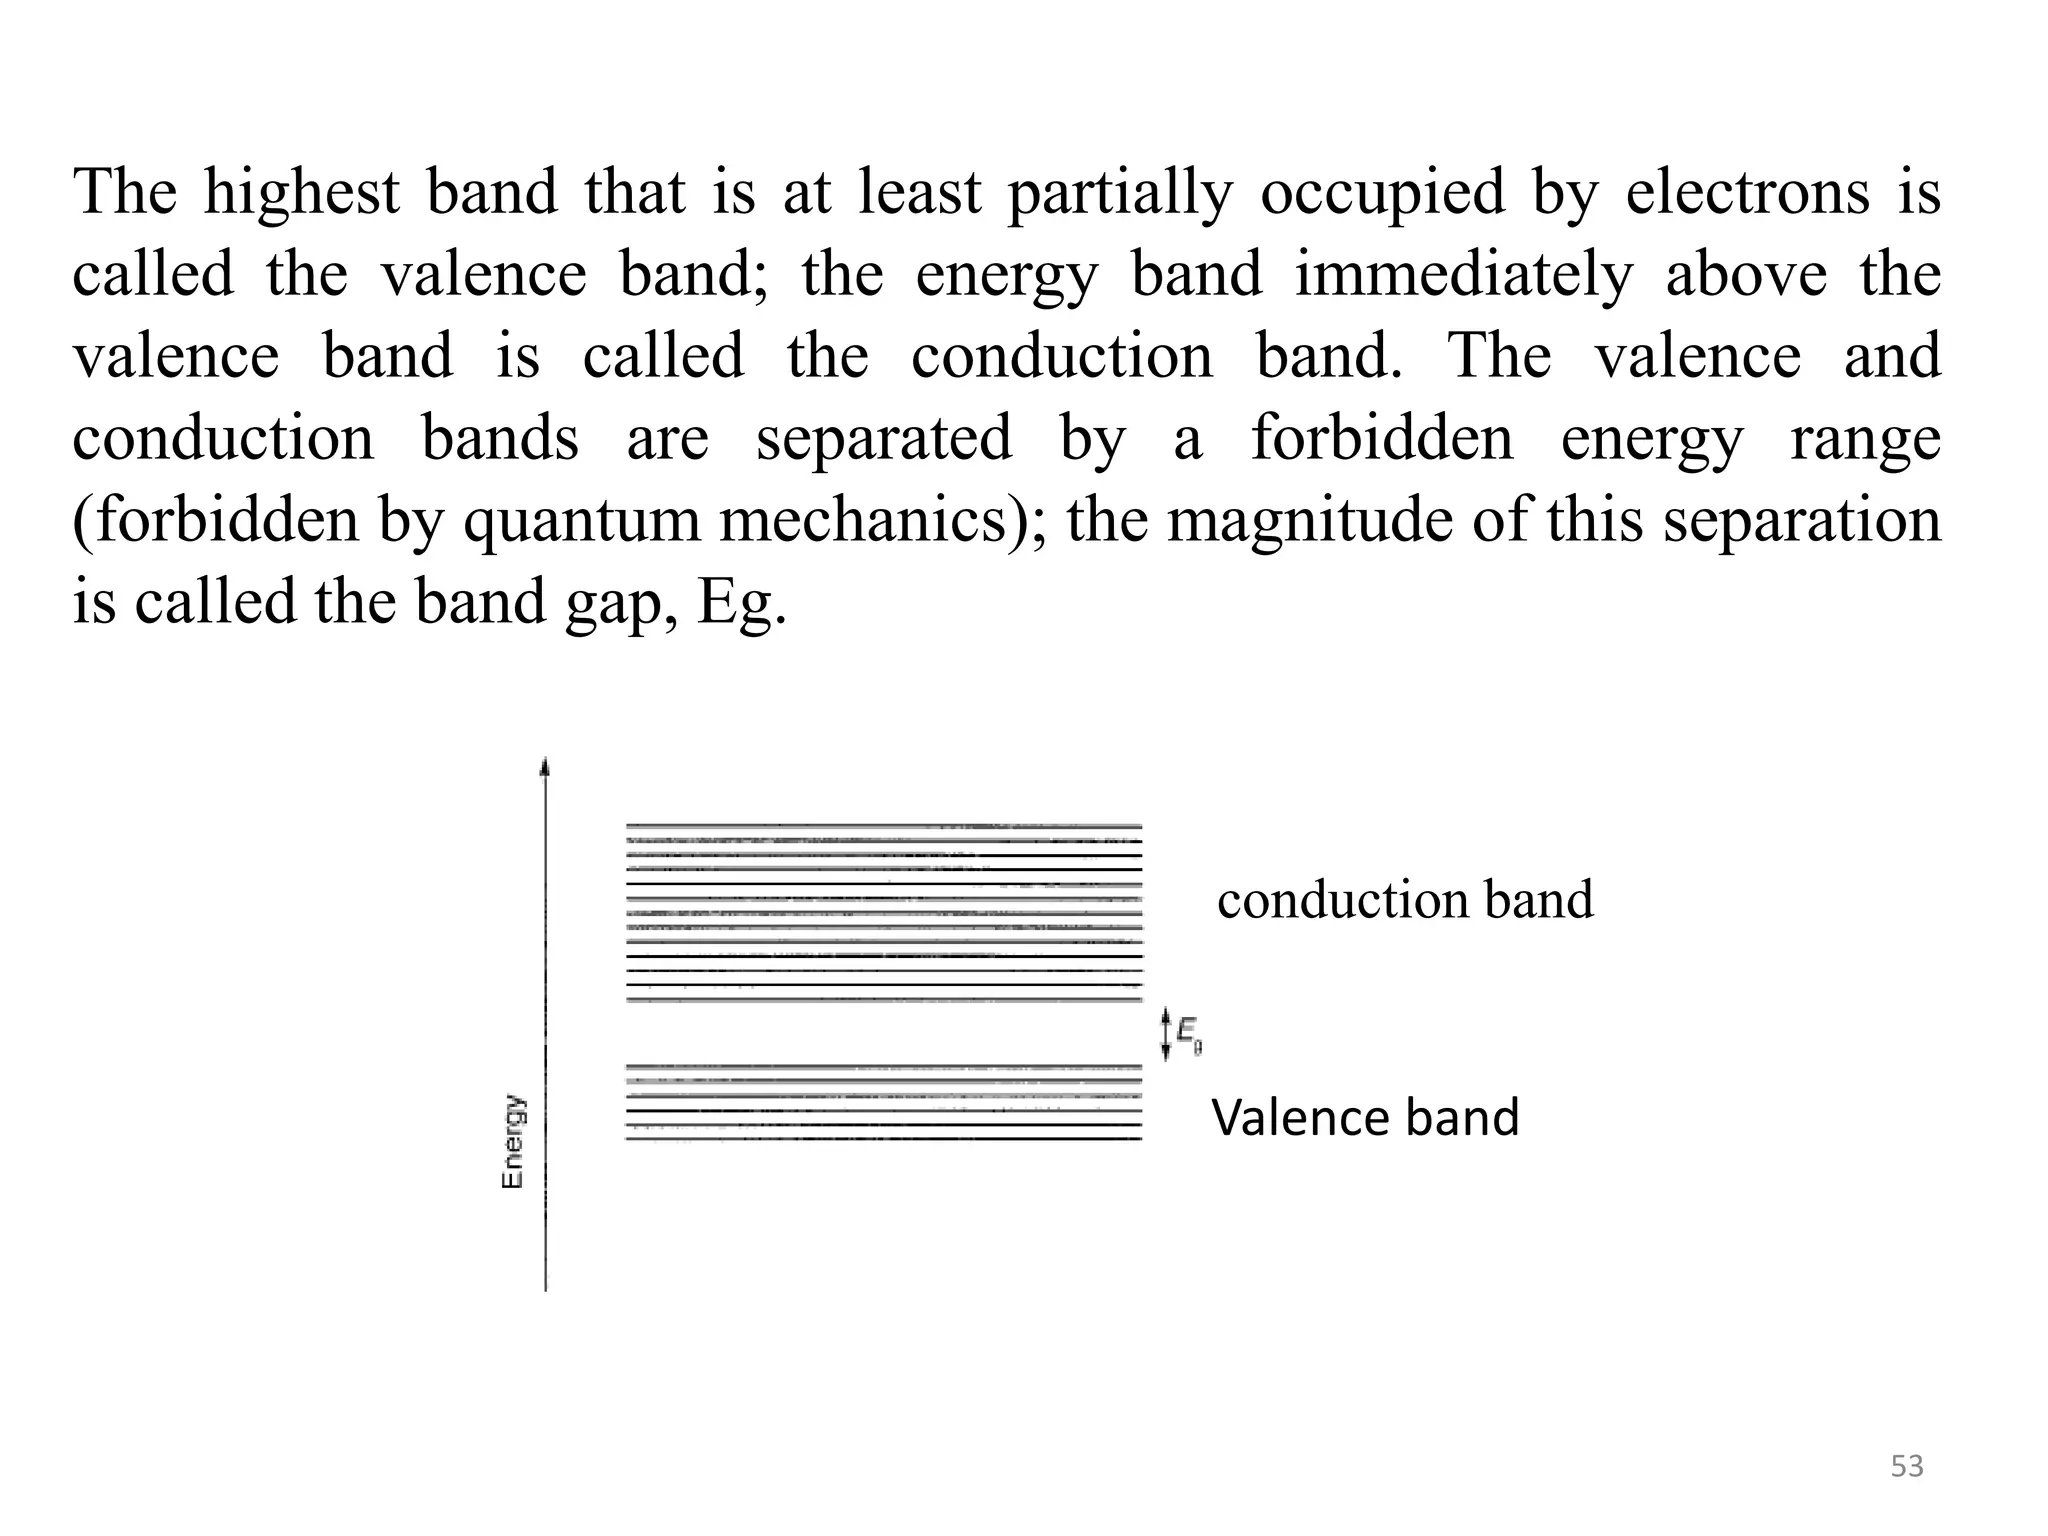
The highest bandthat is at least partially occupied by electrons is
called the valence band; the energy band immediately above the
valence band is called the conduction band. The valence and
conduction bands are separated by a forbidden energy range
(forbidden by quantum mechanics); the magnitude of this separation
is called the band gap, Eg.
53
Valence band
conduction band
54.
If the valenceband of a solid is completely filled at a temperature of
0 K, the material is a semiconductor or an insulator. The difference
between a semiconductor and an insulator is defined by the size of
the band gap. If Eg > 2.5 eV, the material is a semiconductor; if Eg
< 2.5 eV, the material is an insulator. The third type of material, a
conductor, has a partially filled valence band at 0 K.
The two elements most used for semiconductor devices are silicon
and germanium; both are covalently bonded in the solid state and
both belong to group 4A of the periodic table. Other semiconductors
include GaAs, CdTe, InP, and other inorganic and organic
compounds. Most semiconductors are covalently bonded solids.
54
55.
When an electronleaves the valence band, it leaves behind a positive
hole that is also mobile, thus producing an electron–hole pair. Both the
electron and the hole are charge carriers in a semiconductor.
Semiconductors such as Si and Ge are called intrinsic semiconductors;
their behavior is a result of the band gap and band structure of the pure
material.
Semiconductors can be used as detectors for electromagnetic radiation.
A photon of light with E > Eg is sufficient to create additional charge
carriers in a semiconductor. Additional charge carriers increase the
conductivity of the semiconductor. By measuring the conductivity, the
intensity of the light can be calculated. Selection of a material with the
appropriate band gap can produce light detectors in the UV, visible, and
IR regions of the spectrum.
55
56.
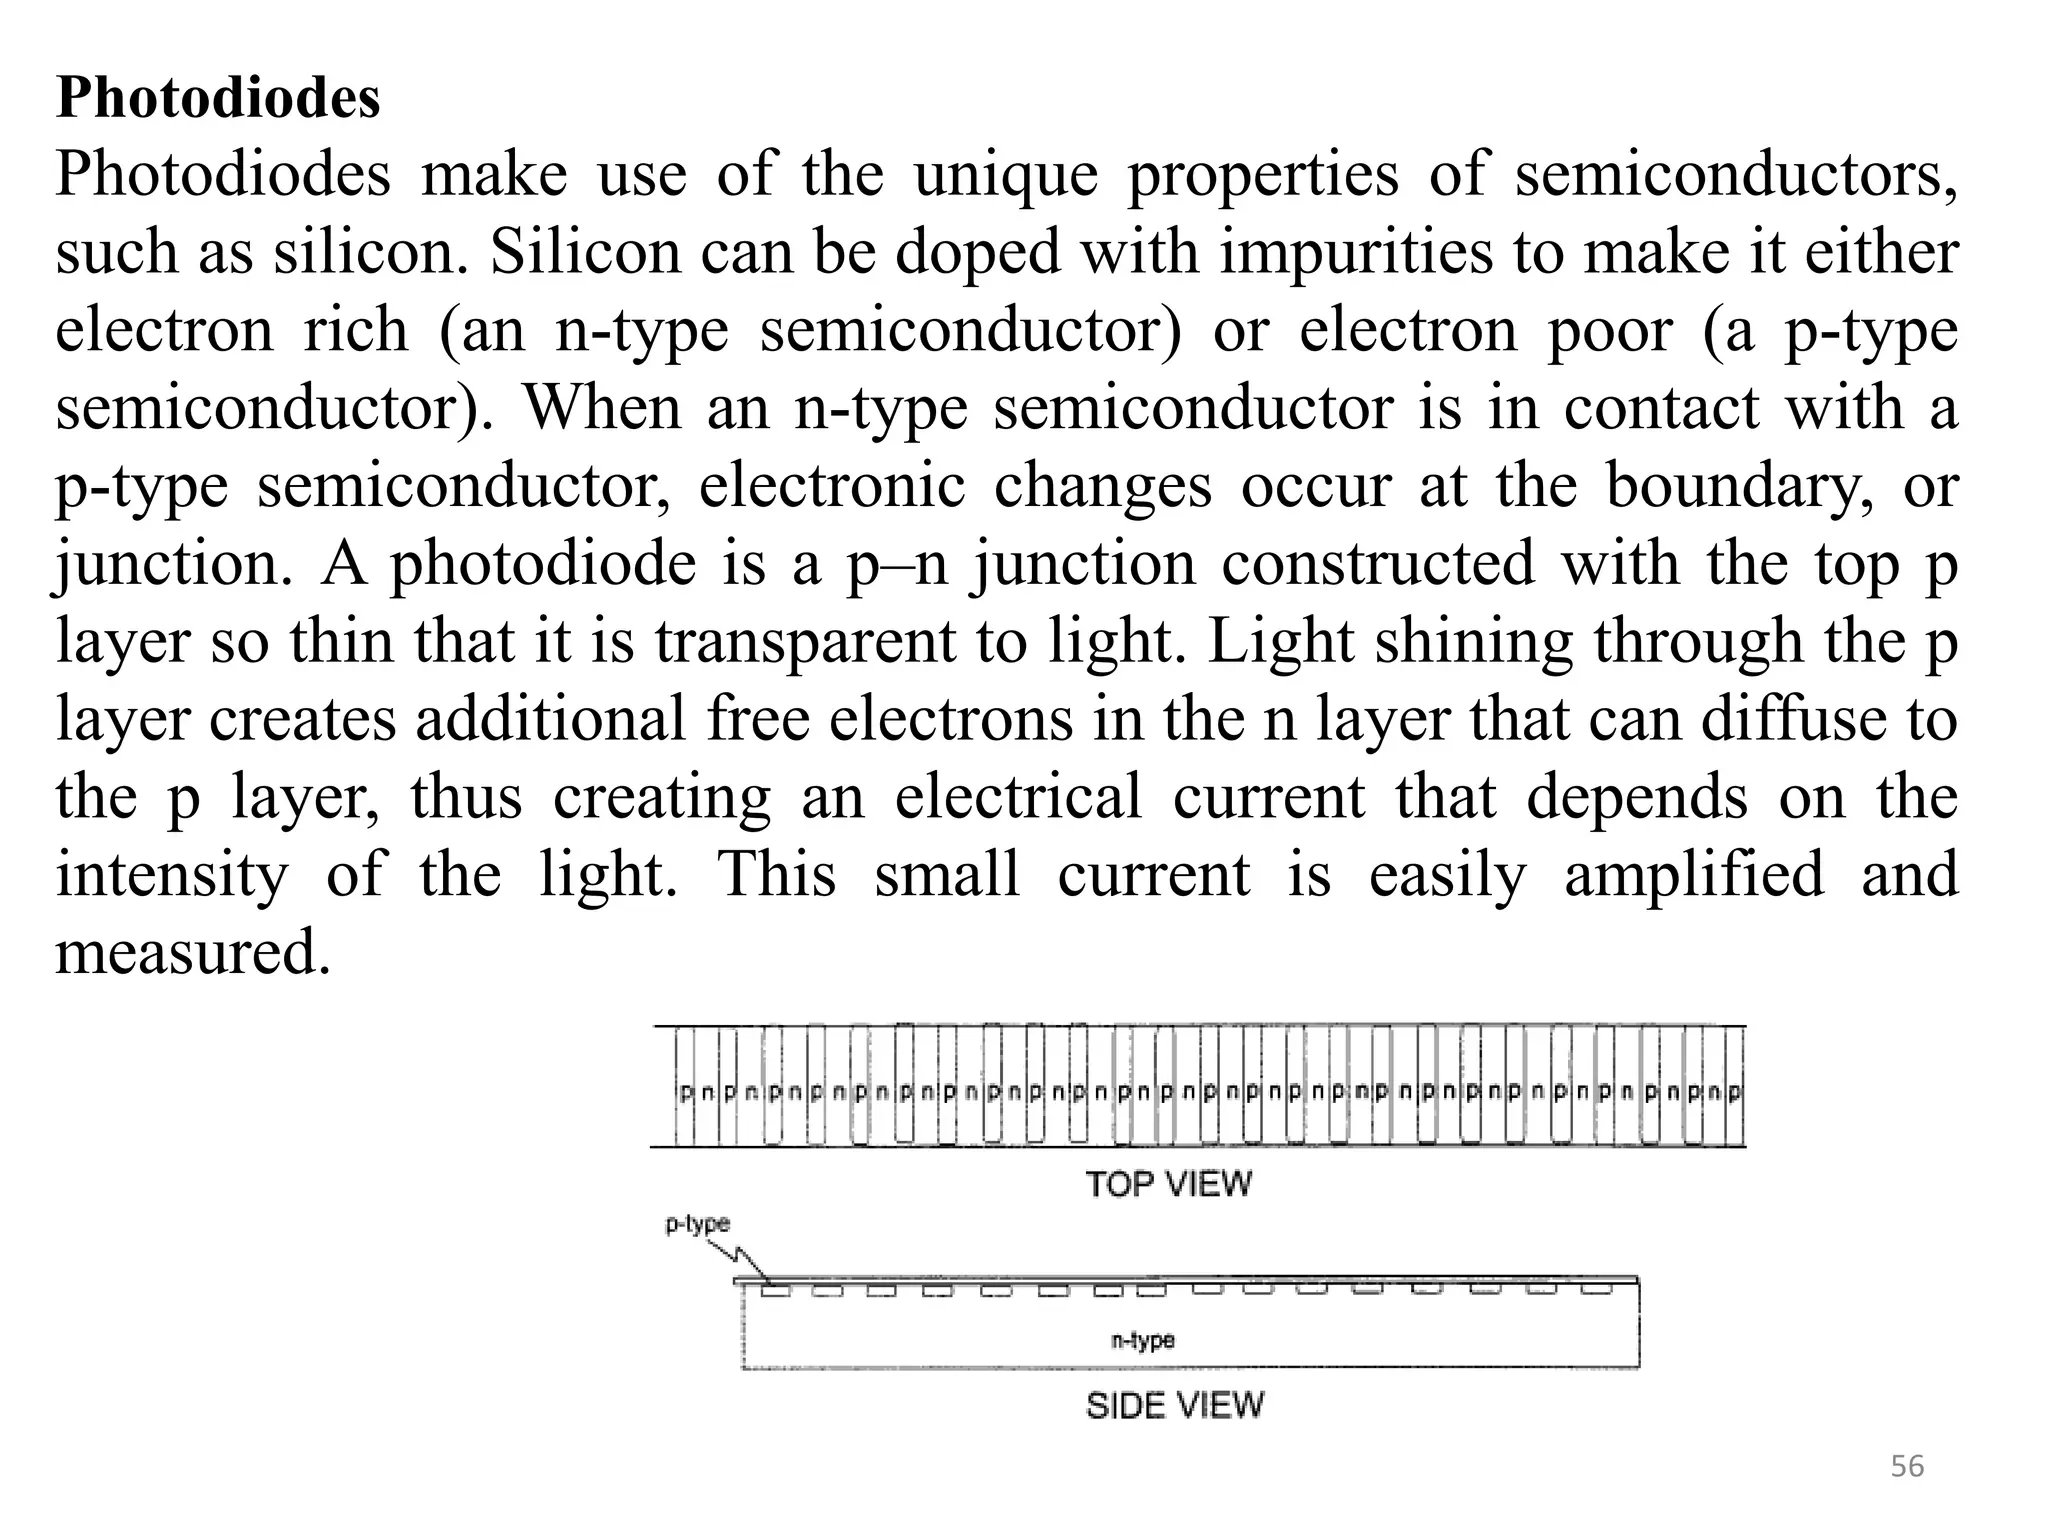
Photodiodes
Photodiodes make useof the unique properties of semiconductors,
such as silicon. Silicon can be doped with impurities to make it either
electron rich (an n-type semiconductor) or electron poor (a p-type
semiconductor). When an n-type semiconductor is in contact with a
p-type semiconductor, electronic changes occur at the boundary, or
junction. A photodiode is a p–n junction constructed with the top p
layer so thin that it is transparent to light. Light shining through the p
layer creates additional free electrons in the n layer that can diffuse to
the p layer, thus creating an electrical current that depends on the
intensity of the light. This small current is easily amplified and
measured.
56
57.
Sample Holders
Samples forUV/VIS spectroscopy can be solids, liquids, or gases.
Different types of holders have been designed for these sample
types. The cells or cuvettes (also spelled cuvets) used in UV
absorption or emission spectroscopy must be transparent to UV
radiation. The most common materials used are quartz and fused
silica. Quartz and fused silica are also chemically inert to most
solvents, which make them sturdy and dependable in use. Quartz
and fused silica cells are also transparent in the visible and into the
NIR region, so these could be used for all work in the UV and
visible regions. (Note: Solutions containing hydrofluoric acid or
very strong bases, such as concentrated NaOH should never be
used in these cells. Such solutions will etch the cell surfaces,
making them useless for quantitative work.)
57
58.
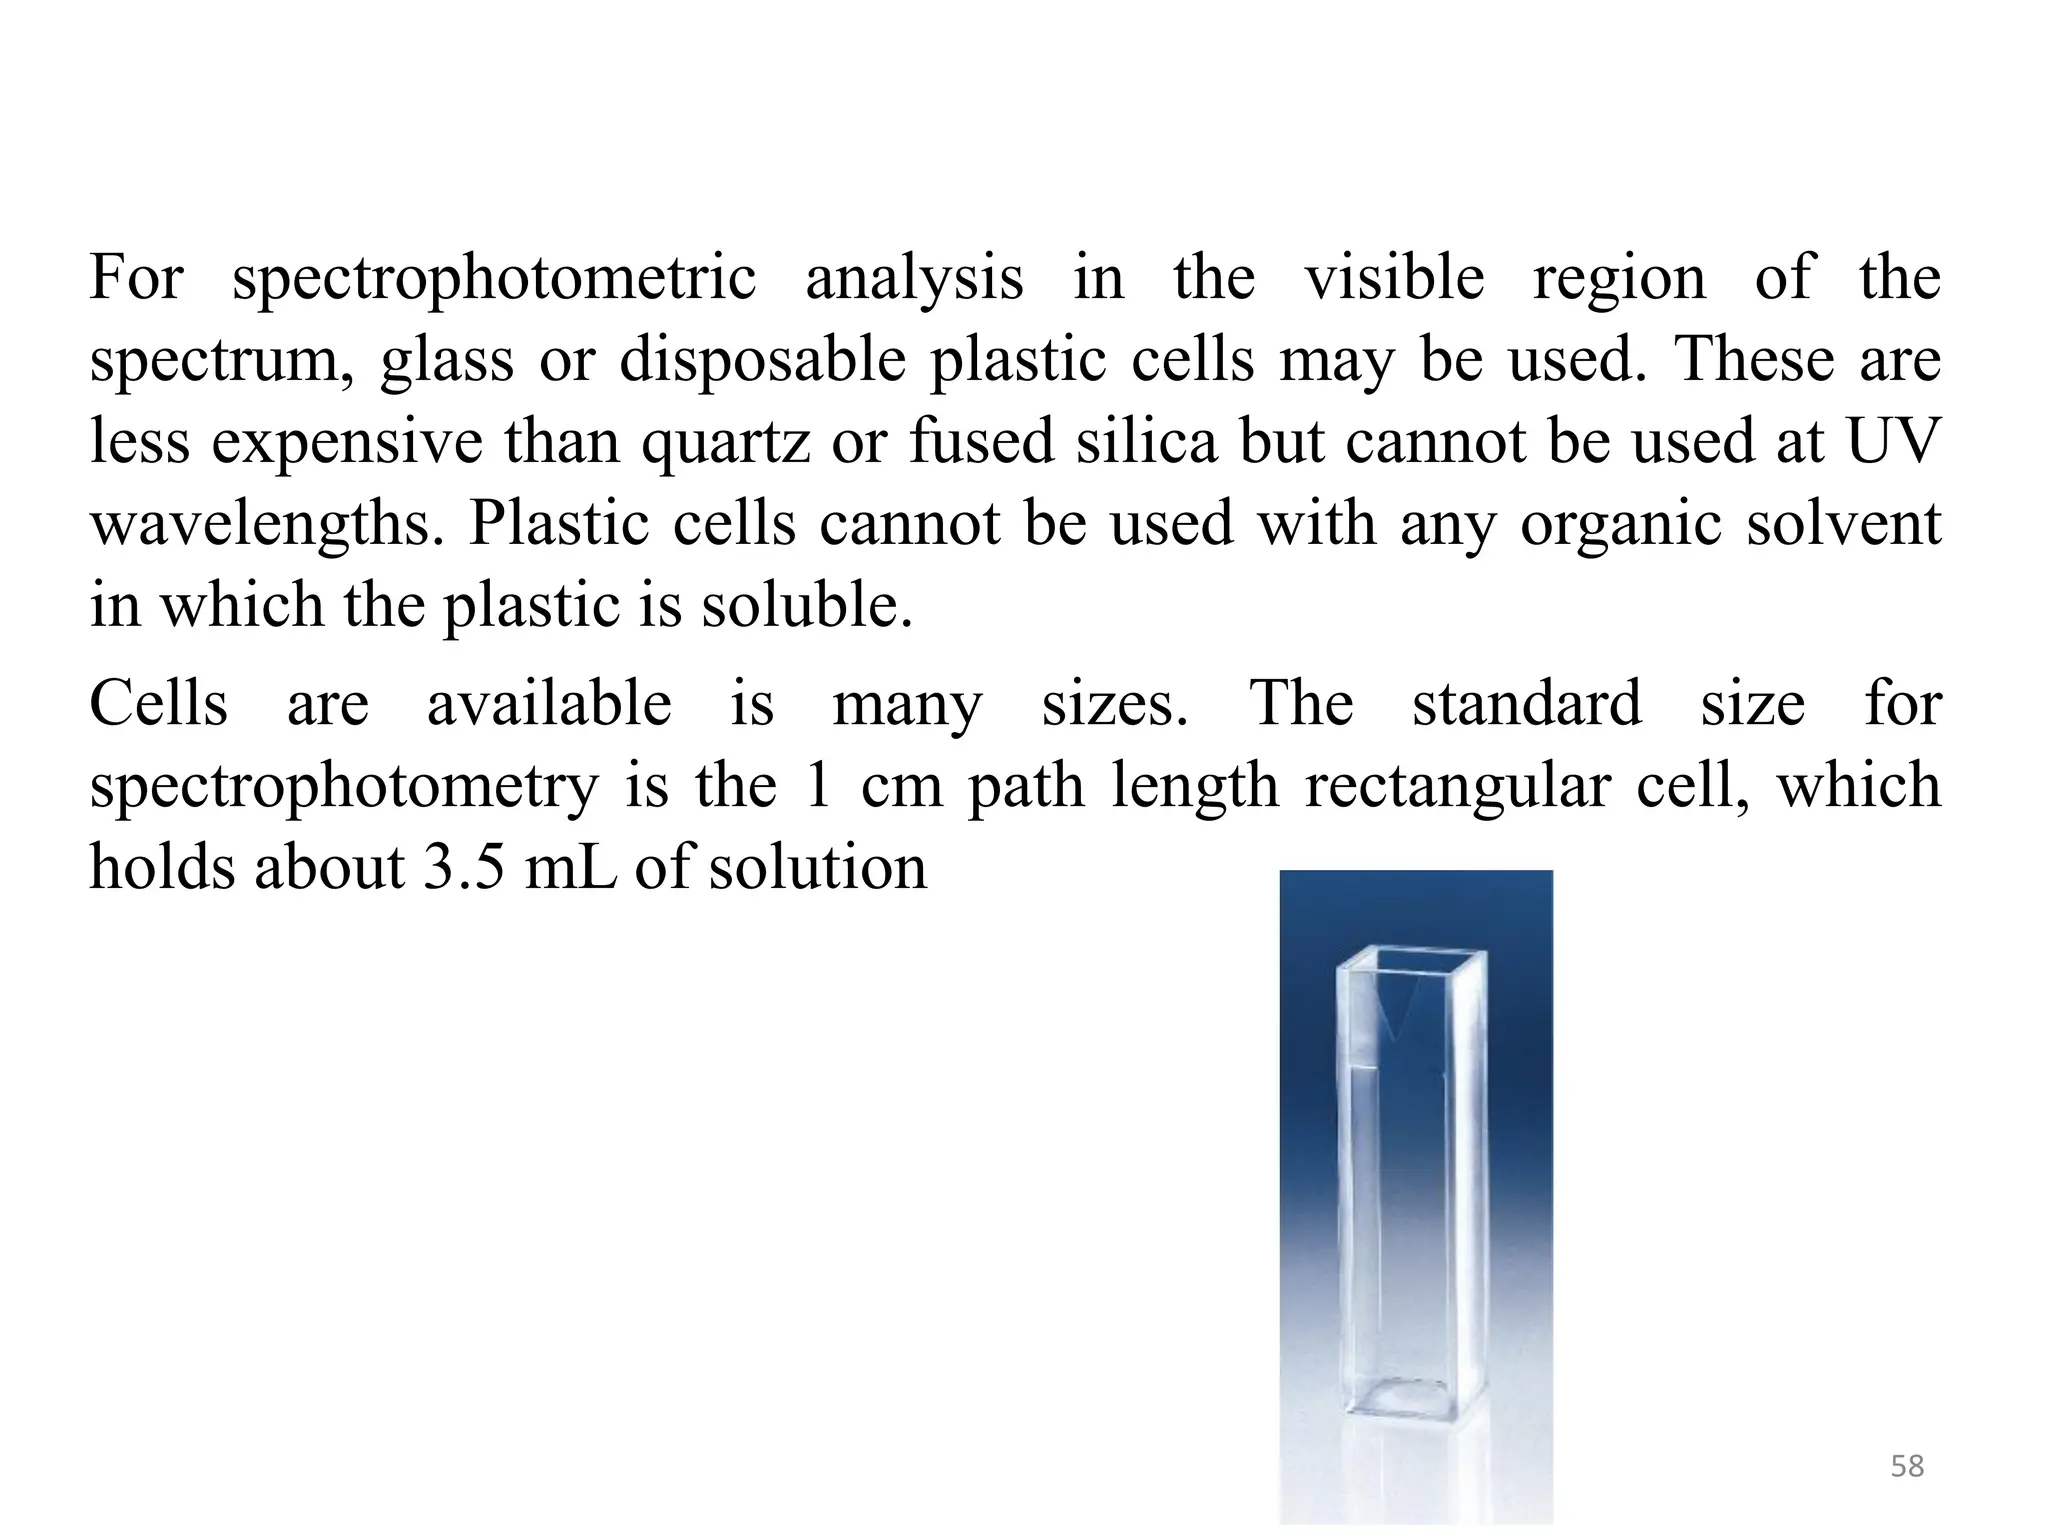
For spectrophotometric analysisin the visible region of the
spectrum, glass or disposable plastic cells may be used. These are
less expensive than quartz or fused silica but cannot be used at UV
wavelengths. Plastic cells cannot be used with any organic solvent
in which the plastic is soluble.
Cells are available is many sizes. The standard size for
spectrophotometry is the 1 cm path length rectangular cell, which
holds about 3.5 mL of solution
58
59.
It is importantthat cells be treated correctly in order to achieve best
results and to prolong their lifetime. To that end, the analyst should (1)
always choose the correct cell for the analysis; (2) keep the cell clean,
check for stains, etch marks, or scratches that change the transparency
of the cell; (3) hold cells on the nontransparent surfaces if provided; (4)
clean cells thoroughly before use and wash out the cell with a small
amount of the sample solution before filling and taking a measurement;
(5) not put strongly basic solutions or HF solutions into glass, quartz, or
fused silica cells; (6) check for solvent compatibility with disposable
plastic cells before putting them into the spectrometer; (7) for
nondisposable cells, always dry carefully and return to their proper
storage case; and (8) never wipe the optical surfaces with paper
products, only lens cleaning paper or cloth material recommended by
the manufacturer. At all times when not in use, cells should be kept
clean and dry, and stored so that the optical surfaces will not become
scratched.
59
60.
Analytical Applications ofUV-Vis
Spectrophotometer
Qualitative Structural Analysis
The types of compounds that absorb UV radiation are those with
nonbonded electrons (n electrons) and conjugated double bond
systems (π electrons) such as aromatic compounds and
conjugated olefins. Unfortunately, such compounds absorb over
similar wavelength ranges, and the absorption spectra overlap
considerably. As a first step in qualitative analysis, it is necessary
to purify the sample to eliminate absorption bands due to
impurities. Even when pure, however, the spectra are often broad
and frequently without fine structure. For these reasons, UV-Vis
absorption is much less useful for the qualitative identification of
functional groups or particular molecules than analytical methods
such as MS, IR, and NMR.
60
61.
61
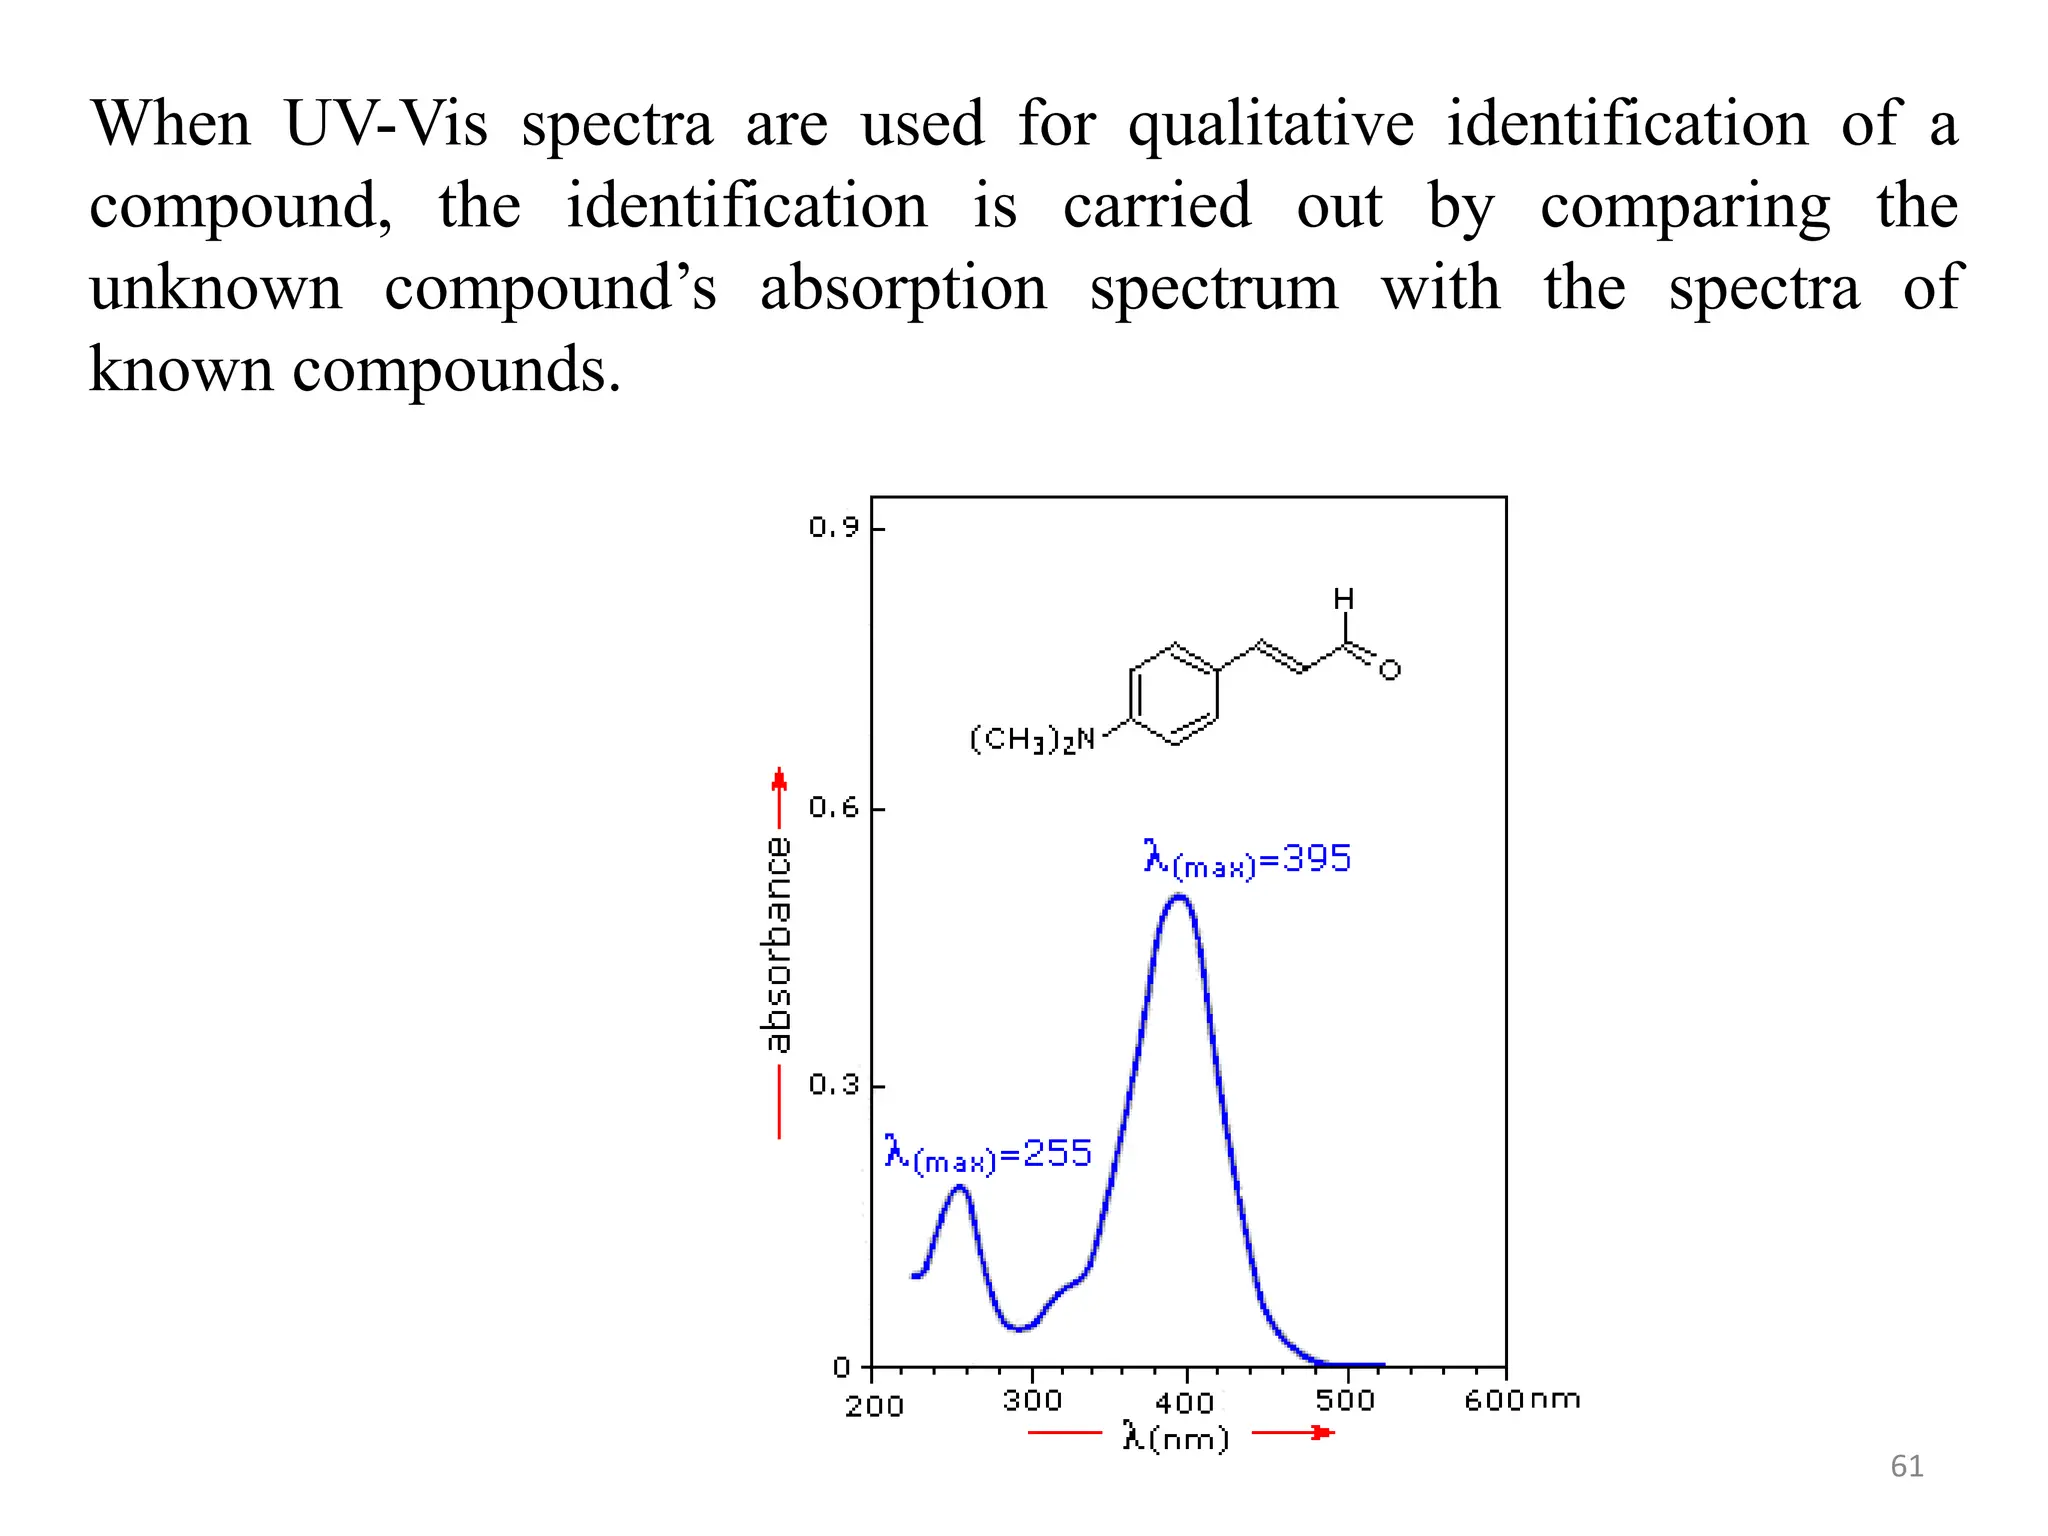
When UV-Vis spectraare used for qualitative identification of a
compound, the identification is carried out by comparing the
unknown compound’s absorption spectrum with the spectra of
known compounds.
62.
62
Quantitative Analysis
UV andvisible absorption spectrometry is a powerful tool for
quantitative analysis. It is used in chemical research, biochemistry,
chemical analysis, and industrial processing. Quantitative analysis is
based on the relationship between the degree of absorption and the
concentration of the absorbing material. Mathematically, it is
described for many chemical systems by Beer’s Law, A = abc.
Some typical applications of UV absorption spectroscopy include the
determination of (1) the concentrations of phenol, nonionic
surfactants, sulfate, sulfide, phosphates, fluoride, nitrate, a variety of
metal ions, and other chemicals in drinking water in environmental
testing; (2) natural products, such as steroids or chlorophyll; (3)
dyestuff materials; and (4) vitamins, proteins, DNA, and enzymes in
biochemistry.
63.
63
Quantitative analysis byabsorption spectrophotometry requires that
the samples be free from particulates, that is, free from turbidity. The
reason for this is that particles can scatter light. If light is scattered by
the sample away from the detector, it is interpreted as an absorbance.
The absorbance will be erroneously high if the sample is turbid.
Quantitative analysis by spectrophotometry generally requires the
preparation of a calibration curve, using the same conditions of pH,
reagents added, and so on for all of the standards, samples, and blanks.
It is critical to have a reagent blank that contains everything that has
been added to the samples (except the analyte). The absorbance is
measured for all blanks, standards, and samples. The absorbance of the
blank is subtracted from all other absorbances and a calibration curve
is constructed from the standards. The concentrations of analyte in the
samples are determined from the calibration curve.
64.
64
Other Applications
Reaction Kinetics
UVspectroscopy can be used to measure the kinetics of chemical
reactions, including biochemical reactions catalyzed by enzymes.
Suppose that two compounds A and B react to form a third
compound C. If the third compound absorbs UV radiation, its
concentration can be measured continuously. The original
concentrations of A and B can be measured at the start of the
experiment. By measuring the concentration of C at different time
intervals, the kinetics of the reaction A + B→C can be calculated.
65.
65
Spectrophotometric Titrations
Many titrationprocedures in volumetric analysis use an indicator that
changes color to signal the endpoint of the titration. Use of the
human eye to detect the color change at the end of a titration is
subject to the problems. Each analyst may “see” the endpoint slightly
differently from other analysts, leading to poor precision and possible
errors. The use of a spectrophotometer to detect the color change is
more accurate and reproducible.
66.
66
Use of thespectrophotometer also permits any change in absorbance
in the UV or visible region by the titrant, analyte, or product to be
used to determine the endpoint of the titration, so the method is not
limited to reactions that use a colored indicator. Spectrophotometric
titrations have been used for redox titrations, acid–base titrations, and
complexation titrations. The spectrophotometer can be used in a light
scattering mode to measure the endpoint for a precipitation titration
by turbidimetry.
67.
67
SPECTROPHOTOMETRIC ANALYSIS
A generalapproach for spectrophotometric analysis is that first
finding the absorption spectrum of “finger prints” of a substance and
then determining its concentration.
1. Plotting Absorption Spectra
Recall that the extinction coefficient for any given substance is a
constant only so long as the wavelength of light is constant. You will
see that the absorbance changes with wavelength. The plot of a
sample's absorbance of light at various wavelengths is called its
absorption spectrum. (The abscissa or horizontal axis may be
expressed in terms of wavelength and the ordinate or vertical axis in
terms of absorbancy.)
68.
68
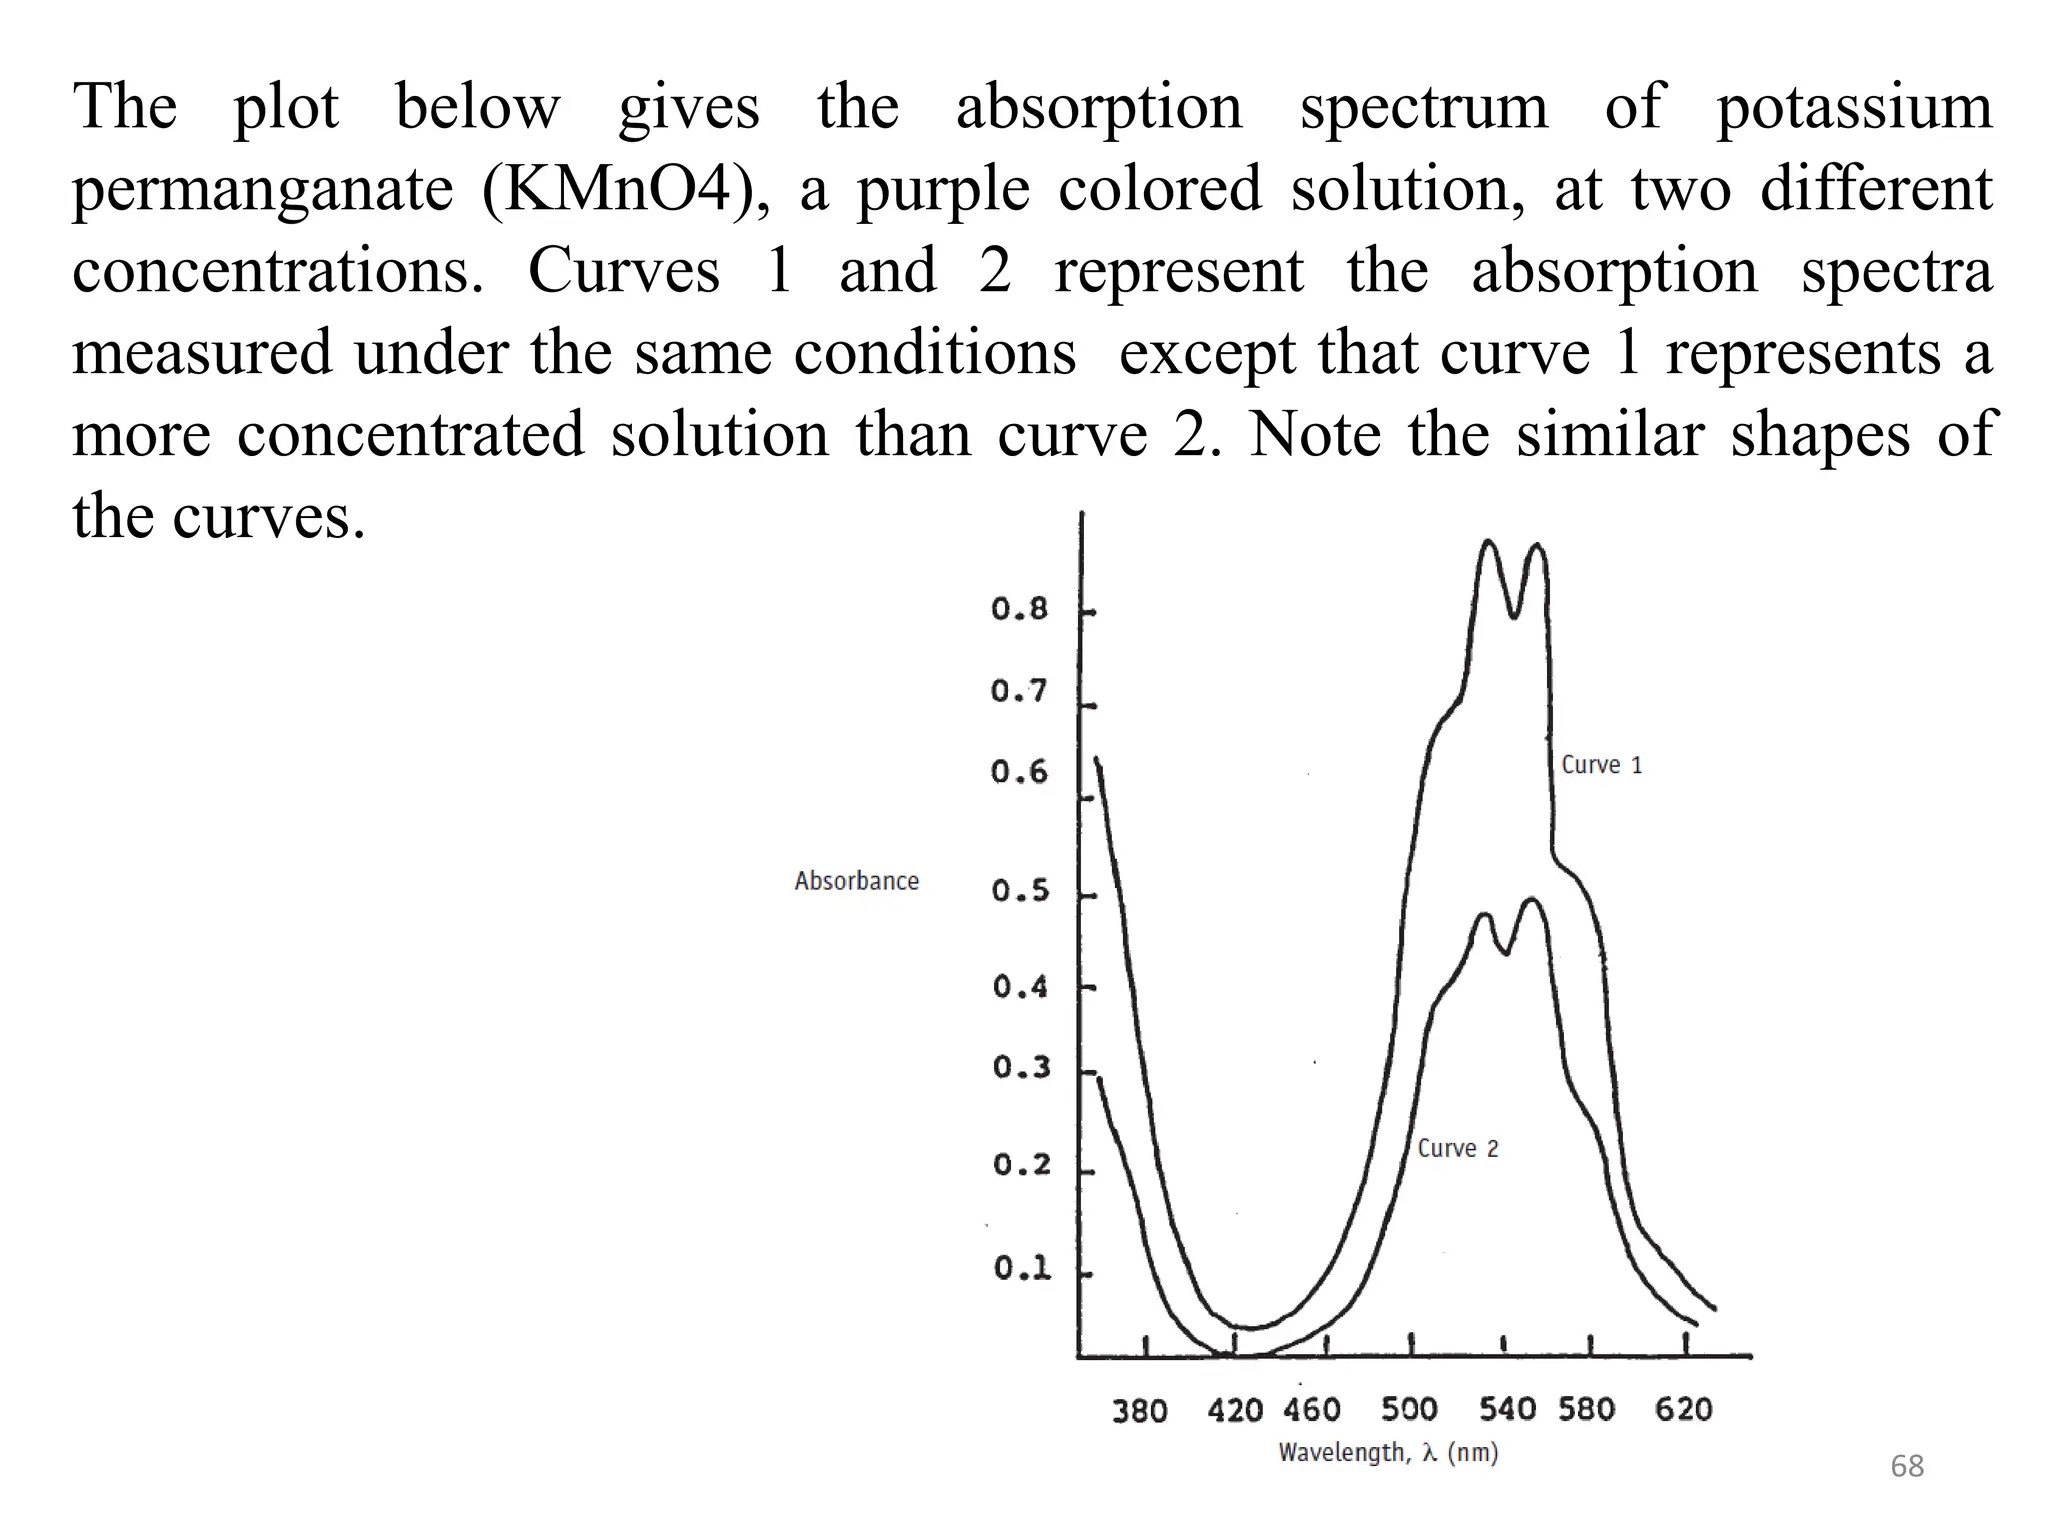
The plot belowgives the absorption spectrum of potassium
permanganate (KMnO4), a purple colored solution, at two different
concentrations. Curves 1 and 2 represent the absorption spectra
measured under the same conditions except that curve 1 represents a
more concentrated solution than curve 2. Note the similar shapes of
the curves.
69.
69
2. Choice ofWavelength
According to the Beer-Lambert Law absorbance is proportional to
concentration at each wavelength. Theoretically we could choose any
wavelength for quantitative estimations of concentration. However, the
magnitude of the absorbancy is important, especially when you are
trying to detect very small amounts of material. In the spectra above
note that the distance between curves 1 and 2 is at a maximum at 525
nm, and at this wavelength the change in absorbance is greatest for a
given change in concentration. That is, the measurement of
concentration as a function of concentration is most sensitive at this
wavelength. For this reason we generally select the wavelength of
maximum absorbance for a given sample and use it in our absorbance
measurements.
70.
70
3. Plotting CalibrationGraphs
Once we have chosen the correct wavelength, the next step is to
construct a calibration curve or calibration plot. This consists of a plot
of absorbance versus concentration for a series of standard solutions
whose concentrations are accurately known.
Because calibration curves are used in reading off the unknown
concentrations, their accuracy is of absolute importance. Therefore,
make the standard solutions as accurately as possible and measure
their absorbances carefully. Each standard solution should be prepared
in identically the same fashion, the only difference between them
being their concentrations.
72
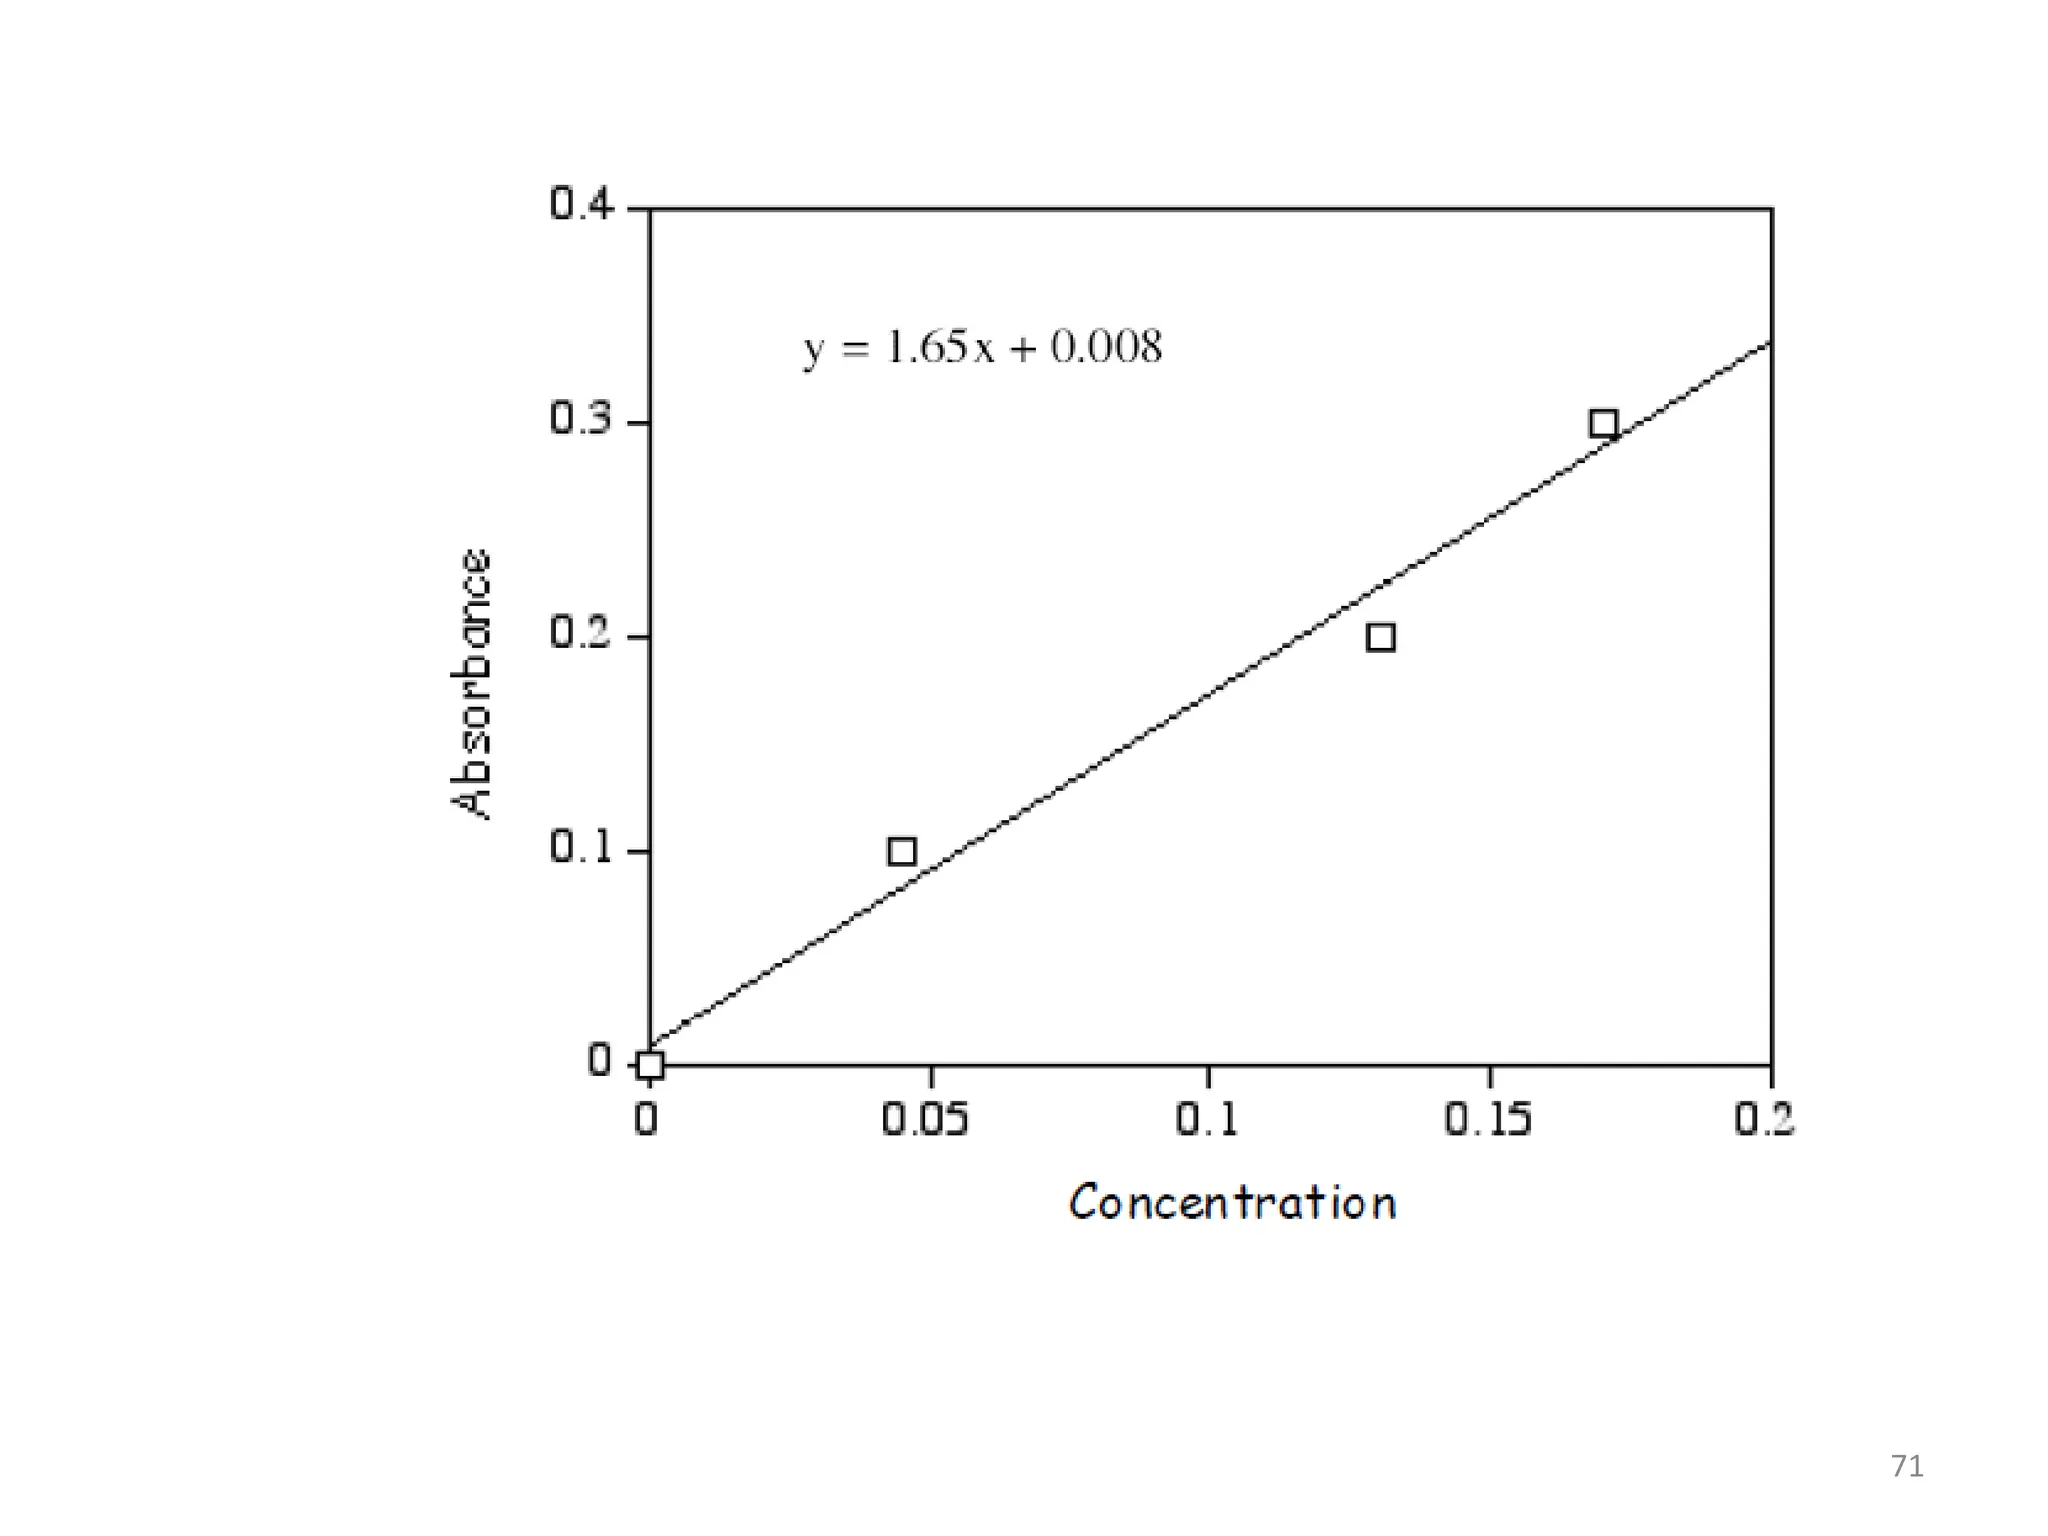
Slope of thebest straight line through the data points in the
calibration plot is 1.65. Plot intercept is 0.008.
Equation of straight line:
Absorbance = 1.65 (Concentration) + 0.008
To find an unknown concentration for a sample, subtract the
intercept from the absorbance reading and divide the result by the
slope. Here the equation would be


![UV SPECTROSCOPY [ULTRA-VIOLET SPECTROSCOPY]](https://cdn.slidesharecdn.com/ss_thumbnails/40-191218142647-thumbnail.jpg?width=640&height=640&fit=bounds)


