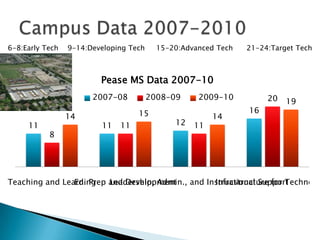
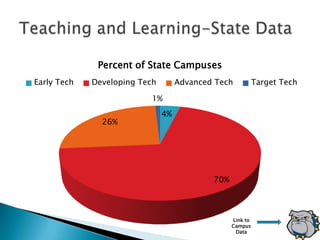
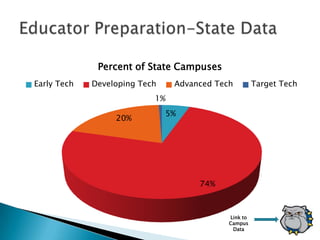
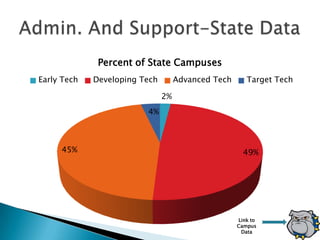
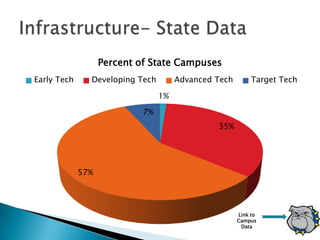
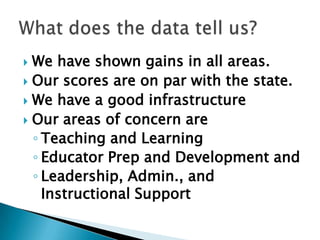
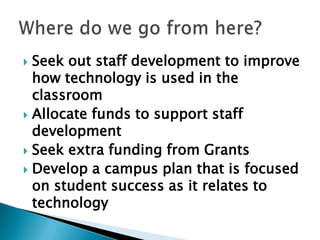
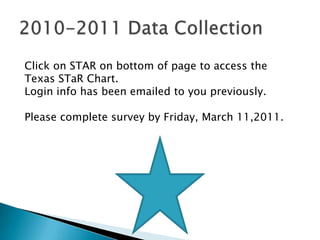
E.M. Pease Middle School
 What   is the Texas STaR Chart?
 What data is collected?
 State and Campus Data
 What does our campus data
  tell us?
 Where do we go from here?
 Current year data collection
 STaR-  School Technology and Readiness
 An online resource tool for self assessment
  of efforts to effectively integrate technology
  across the curriculum
 Aligned with the Texas Long Range Plan for
  Technology, 2006-2020
 Completion required by each teacher due to
  federal reporting requirement
 Data   is collected in 4 areas:
 1.   Teaching and Learning
 2.   Educator Preparation and
      Development
 3.   Leadership, Administration, &
      Instructional Support
 4.   Infrastructure for Technology
6-8:Early Tech   9-14:Developing Tech     15-20:Advanced Tech   21-24:Target Tech


                         Pease MS Data 2007-10
                       2007-08          2008-09     2009-10          20   19
                                   15                           16
                 14                                     14
     11                  11   11              12   11
           8


Teaching and Learning
                Ed. Prep and Development
                         Leadership, Admin., and Instructional Support
                                                   Infrastructure for Technolo
Percent of State Campuses
Early Tech   Developing Tech        Advanced Tech           Target Tech

                           1%
                               4%
               26%


                                            70%


                                                  Link to
                                                  Campus
                                                   Data
Percent of State Campuses
Early Tech   Developing Tech    Advanced Tech         Target Tech
                           1%
                               5%
                  20%


                                     74%


                                            Link to
                                            Campus
                                             Data
Percent of State Campuses
Early Tech   Developing Tech        Advanced Tech      Target Tech

                               2%
                         4%


     45%                                              49%


                                                    Link to
                                                    Campus
                                                     Data
Percent of State Campuses
Early Tech     Developing Tech        Advanced Tech        Target Tech

                                 1%

                            7%
                                               35%


             57%


                                                      Link to
                                                      Campus
                                                       Data
 We have shown gains in all areas.
 Our scores are on par with the state.
 We have a good infrastructure
 Our areas of concern are
  ◦ Teaching and Learning
  ◦ Educator Prep and Development and
  ◦ Leadership, Admin., and
    Instructional Support
 Seek out staff development to improve
  how technology is used in the
  classroom
 Allocate funds to support staff
  development
 Seek extra funding from Grants
 Develop a campus plan that is focused
  on student success as it relates to
  technology
Click on STAR on bottom of page to access the
Texas STaR Chart.
Login info has been emailed to you previously.

Please complete survey by Friday, March 11,2011.

The texas s ta r chart

  • 1.
  • 2.
     What is the Texas STaR Chart?  What data is collected?  State and Campus Data  What does our campus data tell us?  Where do we go from here?  Current year data collection
  • 3.
     STaR- School Technology and Readiness  An online resource tool for self assessment of efforts to effectively integrate technology across the curriculum  Aligned with the Texas Long Range Plan for Technology, 2006-2020  Completion required by each teacher due to federal reporting requirement
  • 4.
     Data is collected in 4 areas: 1. Teaching and Learning 2. Educator Preparation and Development 3. Leadership, Administration, & Instructional Support 4. Infrastructure for Technology
  • 5.
    6-8:Early Tech 9-14:Developing Tech 15-20:Advanced Tech 21-24:Target Tech Pease MS Data 2007-10 2007-08 2008-09 2009-10 20 19 15 16 14 14 11 11 11 12 11 8 Teaching and Learning Ed. Prep and Development Leadership, Admin., and Instructional Support Infrastructure for Technolo
  • 6.
    Percent of StateCampuses Early Tech Developing Tech Advanced Tech Target Tech 1% 4% 26% 70% Link to Campus Data
  • 7.
    Percent of StateCampuses Early Tech Developing Tech Advanced Tech Target Tech 1% 5% 20% 74% Link to Campus Data
  • 8.
    Percent of StateCampuses Early Tech Developing Tech Advanced Tech Target Tech 2% 4% 45% 49% Link to Campus Data
  • 9.
    Percent of StateCampuses Early Tech Developing Tech Advanced Tech Target Tech 1% 7% 35% 57% Link to Campus Data
  • 10.
     We haveshown gains in all areas.  Our scores are on par with the state.  We have a good infrastructure  Our areas of concern are ◦ Teaching and Learning ◦ Educator Prep and Development and ◦ Leadership, Admin., and Instructional Support
  • 11.
     Seek outstaff development to improve how technology is used in the classroom  Allocate funds to support staff development  Seek extra funding from Grants  Develop a campus plan that is focused on student success as it relates to technology
  • 12.
    Click on STARon bottom of page to access the Texas STaR Chart. Login info has been emailed to you previously. Please complete survey by Friday, March 11,2011.