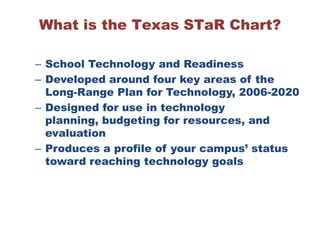
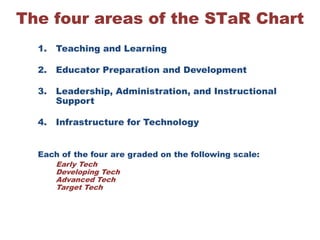
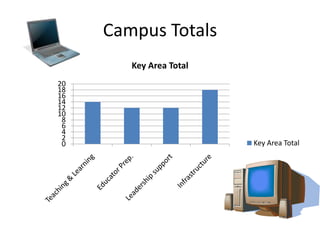
What it means to our campus!
AgendaWhat is the Texas STaR Chart? The four areas of the STaR Chart State Data & Local Trends Strengths and Weaknesses of our campus.
What is the Texas STaR Chart? School Technology and Readiness Developed around four key areas of the Long-Range Plan for Technology, 2006-2020 Designed for use in technology planning, budgeting for resources, and evaluation Produces a profile of your campus’ status toward reaching technology goals
The four areas of the STaR Chart Teaching and Learning Educator Preparation and Development Leadership, Administration, and Instructional Support Infrastructure for TechnologyEach of the four are graded on the following scale:Early TechDeveloping TechAdvanced TechTarget Tech
Teaching and LearningTechnology brings the world to the classroom and provides tools to see the world beyond current boundaries Teachers must be facilitators, mentors, and co-learners Students must have access to relevant technologies, tools, resources and services for individualized instruction 24 hours a day/7 days a week. Students communicate effectively in a variety of formats for diverse audiences. NCLB says 8th graders must be technology literate
Educator Preparation and DevelopmentOn-going professional development Securing time, resources, and models for teaching technology SBEC Technology Application Standards Met 30% of budget allocated for professional development
Leadership, Administration, and Instructional SupportTechnology plan is a large part of Campus Improvement Plan Use data effectively to make decisions Promote community awareness of learning opportunities through technology Technical support is available at campus and district level Acceptable Use Policies are board approved
Infrastructure for TechnologyEquitable access to all e-learning High-speed connectivity in all classrooms Technical assistance for teaching and learning Host large volumes of digital content through video, voice, and data
State Data & Local Trends 	According to the 2007-2008 Campus Statewide Summary by Key Area most campuses are their strongest in the area of Infrastructure with 57.2% of the campuses with an Advanced Tech rating. The greatest statewide weakness is in the area of Educator Preparation with 74.2% still Developing and 5.4% still in the Early Tech stage.	Locally our campus seems to be on target with the rest of the state.  	Key Area Summary for our campus:Teaching and Learning  - Developing TechEducator Preparation and Development – Developing TechLeadership, Administration, and Instructional Support – Developing TechInfrastructure for Technology – Advanced Tech
Campus Totals
So now what?Identify campus GOALS! Collaborate with team members to come up with long term and short term goals. What changes need to happen? Review Technology Applications TEKS. Use technology available to you! Attend Technology Professional Development workshops both within the district and those offered outside the district.
For more information:http://starchart.esc12.net/

Starinformation

  • 1.
    What it meansto our campus!
  • 2.
    AgendaWhat is theTexas STaR Chart? The four areas of the STaR Chart State Data & Local Trends Strengths and Weaknesses of our campus.
  • 3.
    What is theTexas STaR Chart? School Technology and Readiness Developed around four key areas of the Long-Range Plan for Technology, 2006-2020 Designed for use in technology planning, budgeting for resources, and evaluation Produces a profile of your campus’ status toward reaching technology goals
  • 4.
    The four areasof the STaR Chart Teaching and Learning Educator Preparation and Development Leadership, Administration, and Instructional Support Infrastructure for TechnologyEach of the four are graded on the following scale:Early TechDeveloping TechAdvanced TechTarget Tech
  • 5.
    Teaching and LearningTechnologybrings the world to the classroom and provides tools to see the world beyond current boundaries Teachers must be facilitators, mentors, and co-learners Students must have access to relevant technologies, tools, resources and services for individualized instruction 24 hours a day/7 days a week. Students communicate effectively in a variety of formats for diverse audiences. NCLB says 8th graders must be technology literate
  • 6.
    Educator Preparation andDevelopmentOn-going professional development Securing time, resources, and models for teaching technology SBEC Technology Application Standards Met 30% of budget allocated for professional development
  • 7.
    Leadership, Administration, andInstructional SupportTechnology plan is a large part of Campus Improvement Plan Use data effectively to make decisions Promote community awareness of learning opportunities through technology Technical support is available at campus and district level Acceptable Use Policies are board approved
  • 8.
    Infrastructure for TechnologyEquitableaccess to all e-learning High-speed connectivity in all classrooms Technical assistance for teaching and learning Host large volumes of digital content through video, voice, and data
  • 9.
    State Data &Local Trends According to the 2007-2008 Campus Statewide Summary by Key Area most campuses are their strongest in the area of Infrastructure with 57.2% of the campuses with an Advanced Tech rating. The greatest statewide weakness is in the area of Educator Preparation with 74.2% still Developing and 5.4% still in the Early Tech stage. Locally our campus seems to be on target with the rest of the state. Key Area Summary for our campus:Teaching and Learning - Developing TechEducator Preparation and Development – Developing TechLeadership, Administration, and Instructional Support – Developing TechInfrastructure for Technology – Advanced Tech
  • 10.
  • 11.
    So now what?Identifycampus GOALS! Collaborate with team members to come up with long term and short term goals. What changes need to happen? Review Technology Applications TEKS. Use technology available to you! Attend Technology Professional Development workshops both within the district and those offered outside the district.
  • 12.