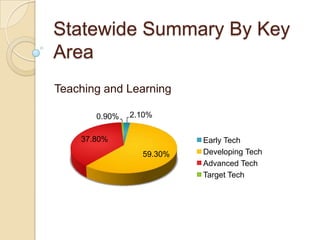
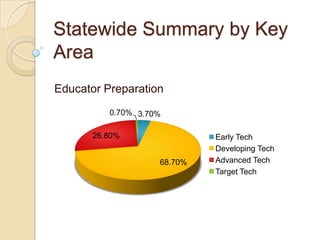
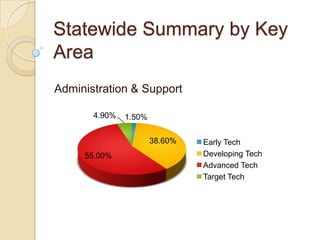
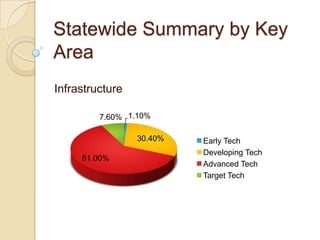
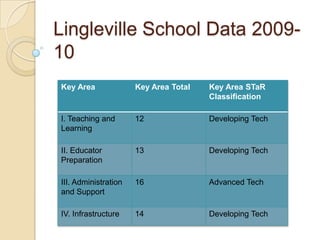
Lingleville School


STaR
Chart
Agenda
   Introduction

   Statewide Summary

   Lingleville School Data

   STaR Chart Link

   Conclusion
Introduction
       School Technology and
            Readiness

•   A Teacher Tool for Planning and Self-
    Assessment
•   Long-Range Plan for Technology, 2006-2020
Statewide Summary By Key
Area
Teaching and Learning

       0.90%   2.10%


    37.80%                Early Tech
                 59.30%   Developing Tech
                          Advanced Tech
                          Target Tech
Statewide Summary by Key
Area
Educator Preparation
          0.70% 3.70%

       26.80%                Early Tech
                             Developing Tech
                    68.70%   Advanced Tech
                             Target Tech
Statewide Summary by Key
Area
Administration & Support

       4.90%   1.50%

                       38.60%   Early Tech
     55.00%                     Developing Tech
                                Advanced Tech
                                Target Tech
Statewide Summary by Key
Area
Infrastructure

         7.60% 1.10%

                 30.40%   Early Tech
                          Developing Tech
     61.00%
                          Advanced Tech
                          Target Tech
Lingleville School Data 2009-
10
Key Area              Key Area Total   Key Area STaR
                                       Classification

I. Teaching and       12               Developing Tech
Learning

II. Educator          13               Developing Tech
Preparation

III. Administration   16               Advanced Tech
and Support

IV. Infrastructure    14               Developing Tech
Texas STaR Chart Link
        Texas STar Chart
Conclusion
The STaR Chart was designed as part of NCLB and
Long-Range Plan for technology, 2006-2020. The
campus and state-wide data shows room for
improvement. We must utilize data taken from the
STaR chart and improve as 21st century educators.

STaR Chart Presentation

  • 1.
  • 2.
    Agenda  Introduction  Statewide Summary  Lingleville School Data  STaR Chart Link  Conclusion
  • 3.
    Introduction School Technology and Readiness • A Teacher Tool for Planning and Self- Assessment • Long-Range Plan for Technology, 2006-2020
  • 4.
    Statewide Summary ByKey Area Teaching and Learning 0.90% 2.10% 37.80% Early Tech 59.30% Developing Tech Advanced Tech Target Tech
  • 5.
    Statewide Summary byKey Area Educator Preparation 0.70% 3.70% 26.80% Early Tech Developing Tech 68.70% Advanced Tech Target Tech
  • 6.
    Statewide Summary byKey Area Administration & Support 4.90% 1.50% 38.60% Early Tech 55.00% Developing Tech Advanced Tech Target Tech
  • 7.
    Statewide Summary byKey Area Infrastructure 7.60% 1.10% 30.40% Early Tech Developing Tech 61.00% Advanced Tech Target Tech
  • 8.
    Lingleville School Data2009- 10 Key Area Key Area Total Key Area STaR Classification I. Teaching and 12 Developing Tech Learning II. Educator 13 Developing Tech Preparation III. Administration 16 Advanced Tech and Support IV. Infrastructure 14 Developing Tech
  • 9.
    Texas STaR ChartLink Texas STar Chart
  • 10.
    Conclusion The STaR Chartwas designed as part of NCLB and Long-Range Plan for technology, 2006-2020. The campus and state-wide data shows room for improvement. We must utilize data taken from the STaR chart and improve as 21st century educators.