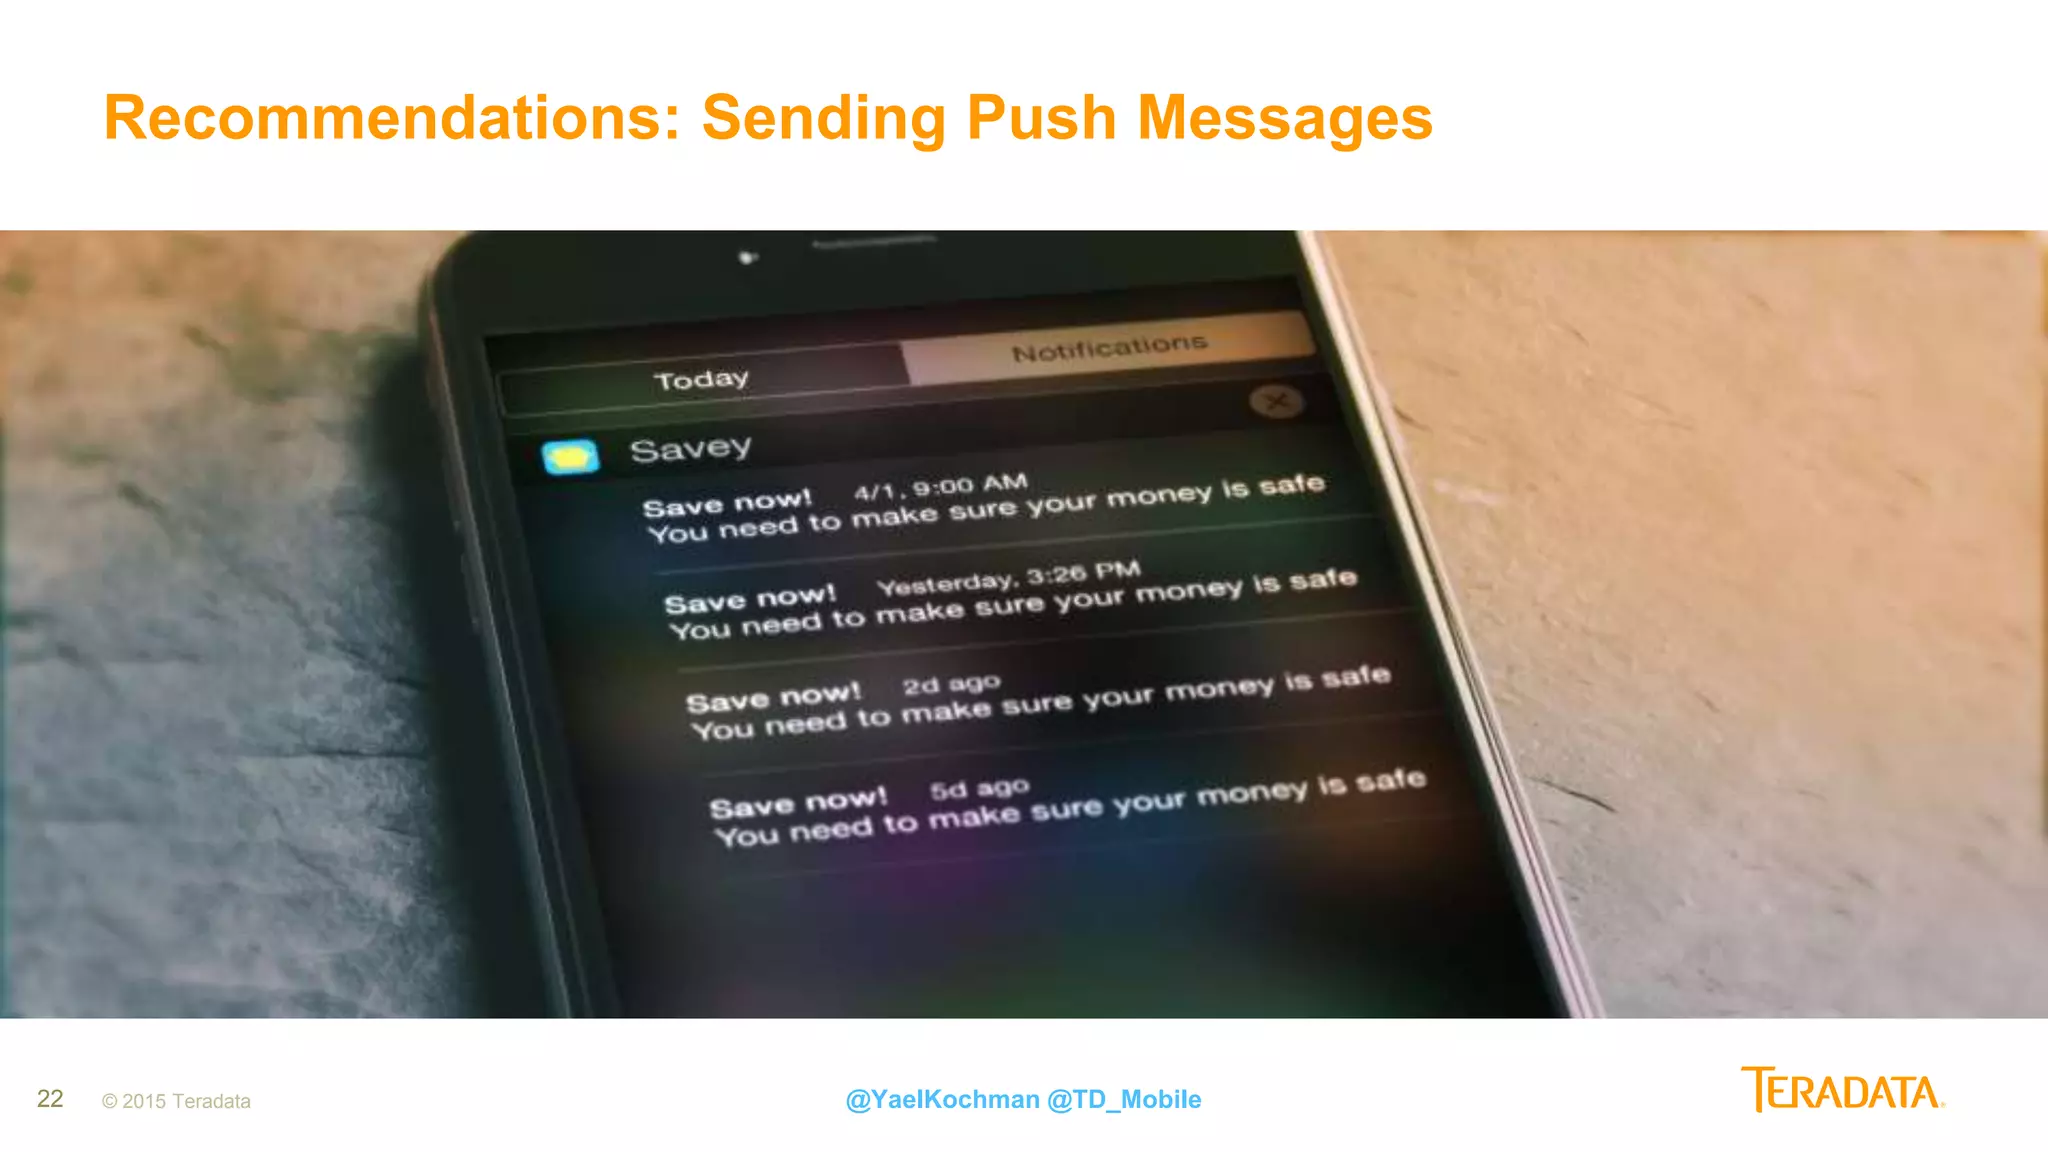
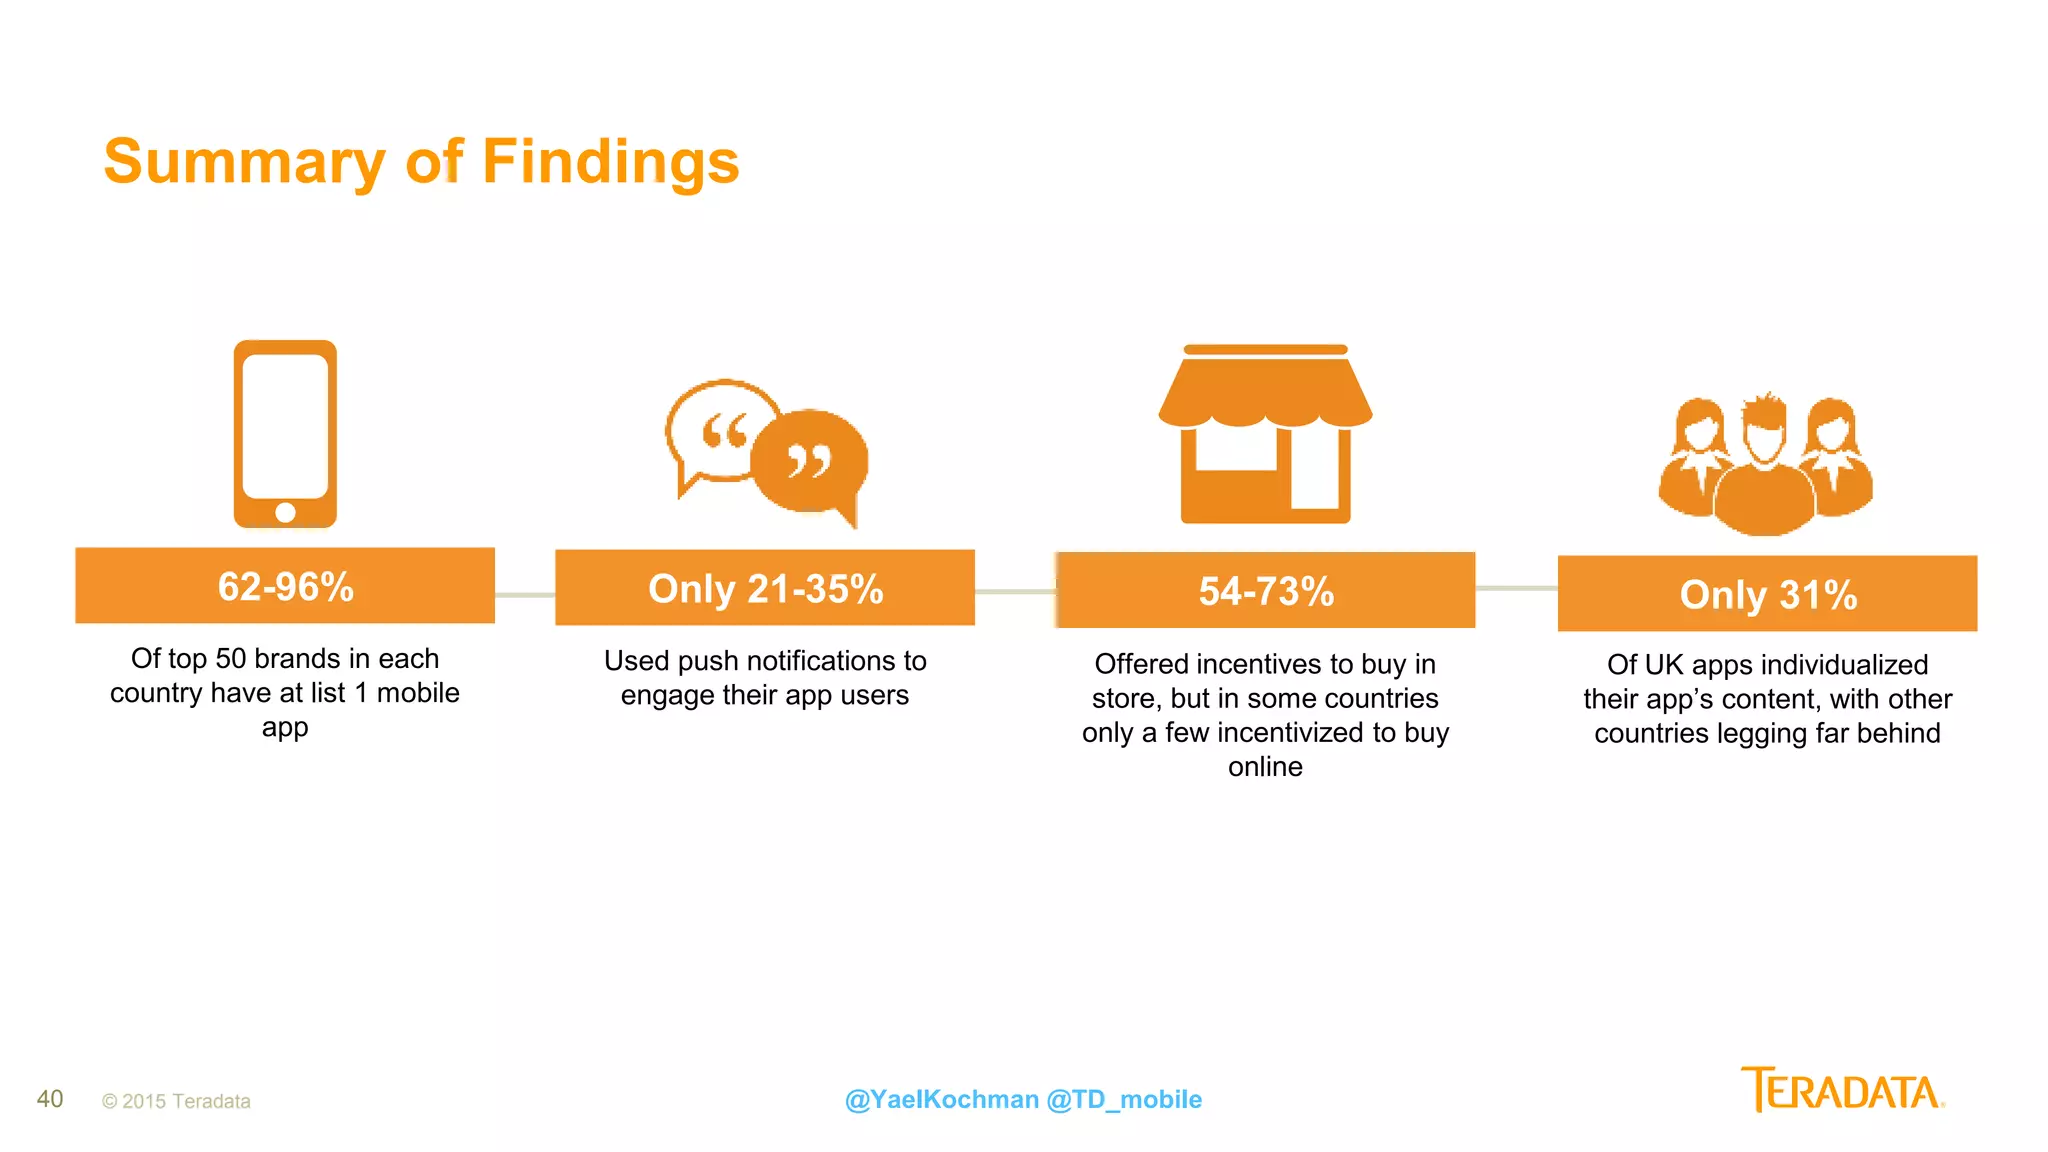
The State of Mobile Shopping Apps
2
Presenters:
• Sharon Magen, Director Mobile Solution Sales,
International, Teradata Marketing Applications
• Yael Kochman, Head of Content Marketing, International,
Teradata Marketing Applications
Follow us: @YaelKochman @SharonMagen
Webinar hashtag: #shoppingapps
3 © 2015 Teradata
Trusted by Industry Leaders
4
Question: Does
your company have
a mobile app?
5 @YaelKochman @TD_Mobile
Are Retailers Getting
Everything They Can From
Mobile Apps?
6
State of Mobile Shopping
7
Traffic Share: Mobile VS Desktop
2007 2008 2009 2010 2011 2012 2013 2014 2015
2,000
1,800
1,600
1,400
1,200
1,000
800
400
200
0
600
Number of Global Users (Millions)
Desktop
Mobile
Source: Comscore – Morgan Stanly Research
@YaelKochman @TD_Mobile© 2015 Teradata
8
Mobile Accounts For 62% of Digital Time Spent, with App
Activity Holding 54%
Source: comScore Media Metrix Multi-Platform & Mobile Metrix U.S.
@YaelKochman @TD_Mobile© 2015 Teradata
9
App vs. Mobile Browser Share of Mobile Transactions
© 2015 Teradata
Source: Criteo : State of Mobile Commerce
@YaelKochman @TD_Mobile
10
Mobile Browser vs. App Funnel Metrics
© 2015 Teradata
Source: Criteo : State of Mobile Commerce
@YaelKochman @TD_Mobile
11
Growth in Spend Per Device 2014 vs. 2013
© 2015 Teradata
Source: RetailMeNot
@YaelKochman @TD_Mobile
4.1%
14.4%
9.3%
117.2% 134.9%
117.4%
UK Germany France
PC Smartphones
12
UK Mobile Shopping Trends
Mobile Retail Conversion Rates, Q2 2015
Mobile
Overall
Android
Smartphone
iPhone Android
Tablet
iPad
4.2%
2.9%
3.4%
4.8%
6.0%
Share of eCommerce Transactions by Device
Android Smartphone iPhone Android tablet iPad Total Mobile
Q2 2015 6% 14% 4% 21% 46%
Q1 2015 6% 12% 4% 20% 43%
0%
6%
Smartphone vs. Tablet (% Mobile Transactions)
46% 44%
54% 56%
Q2 2015 Q1 2015
Tablets
Source: Criteo : State of Mobile Commerce
13
Overview of Research
14 © 2015 Teradata
About The Study
@YaelKochman @TD_mobile
The top 50 online retailers in each country were
identified
Apps from these retailers’ websites were downloaded
Push notifications were enabled and engaged user
activity was stimulated over a four-week period
15© 2015 Teradata
Participating Countries
@YaelKochman @TD_Mobile
16 © 2015 Teradata
Industries
@YaelKochman @TD_Mobile
Fashion
DIY Travel
Department
Stores
Communication Entertainment
I.T.
17
Key Findings
18 © 2015 Teradata
Out of The Top 50 Online Retailers, How Many Have Apps?
96%
70%
62%
94%
UK Germany France US
@YaelKochman @TD_Mobile
19 © 2014 Teradata
Apps Per Enterprise
@YaelKochman @TD_Mobile
4.14 3.9
1.98
5.76
3.94
UK Germany France US Total
20
Question: Are you
sending push
messages?
21 © 2015 Teradata
Out of The Ones Who Have Apps, How Many Sent Push
Notifications
@YaelKochman @TD_Mobile
21% 20%
29%
35%
UK Germany France US
22
Recommendations: Sending Push Messages
© 2015 Teradata @YaelKochman @TD_Mobile
23 © 2015 Teradata
How Many Used a Push Preference Center
56%
20% 19%
64%
UK Germany France US
@YaelKochman @TD_Mobile
24
Recommendations: Push Preference Center
© 2015 Teradata @YaelKochman @TD_Mobile
25 © 2015 Teradata @YaelKochman @TD_mobile
26 © 2015 Teradata
How Many Ask Users to Sign In
@YaelKochman @TD_mobile
23%
61%
16%
France
42%
8%
50%UK
14%
80%
6%
Germany
27
Recommendations:
Sign In
© 2014 Teradata
28 © 2015 Teradata
In Europe, None of The Apps Sent an Abandon Cart Campaign
@YaelKochman @TD_Mobile
29
Last Minute Travel Deals
Don’t wait in line book ahead!
Amazing Activities, Tours and
Attractions in London!
now
Slide to view
Company: Last Minute Travel
29
Problem
• Drive increased revenue usage with promotions and
special offers
Strategy & Tactics
• Offer to book activities in the last destination searched
Results
• 19% click through rate
• 6% conversion rate for purchase
Case Study: Abundant Cart Campaign Increases Revenue
30
How Many Individualized Their App’s Content
© 2015 Teradata @YaelKochman @TD_Mobile
31%
3% 0%
9%
UK Germany France US
31
How Many Individualized Push Messages
© 2015 Teradata
13%
3% 0%
UK Germany France
@YaelKochman @TD_Mobile
32
Recommendations:
Individualization
© 2015 Teradata
33
How Many Apps Incentivized Users to Buy
© 2015 Teradata @YaelKochman @TD_Mobile
54%
74.3%
67.7%
63%
6.4% 6.4%
UK Germany France
Incentive to buy in store Incentive to buy online
34
Recommendations:
Incentivizing Users to Buy
Online
© 2015 Teradata
35
In Europe, None Used a Push Message Call to Action!
© 2015 Teradata @YaelKochman @TD_Mobile
36 © 2015 Teradata
Recommendations:
Call to Action / Action
Buttons
37
How Many Asked For Location?
© 2015 Teradata
67%
29%
23%
Uk Germany France
@YaelKochman @TD_Mobile
38
Recommendations:
Location
© 2015 Teradata
39
Conclusions
40 © 2015 Teradata
Summary of Findings
@YaelKochman @TD_mobile
Only 21-35%
Offered incentives to buy in
store, but in some countries
only a few incentivized to buy
online
54-73%
Used push notifications to
engage their app users
Only 31%
Of UK apps individualized
their app’s content, with other
countries legging far behind
62-96%
Of top 50 brands in each
country have at list 1 mobile
app
41 © 2015 Teradata
Summary of Recommendations
@YaelKochman @TD_mobile
Communicate with your users across all available channelsOmni-Channel Strategy
It is …Proper Onboarding Process
Send push notifications
Don’t be afraid to engage your users!
Use insights
To individualize your mobile marketing
Let them choose
Use a push preference center to allow your users to
control the content they’d like to opt-in to
Enable email sign in
In order to integrate data. But make sure it’s not
mandatory
42
Thank You!
Q&A
www.marketing.teradata.com/mobile

The State of Mobile Shopping Apps

  • 1.
    The State ofMobile Shopping Apps
  • 2.
    2 Presenters: • Sharon Magen,Director Mobile Solution Sales, International, Teradata Marketing Applications • Yael Kochman, Head of Content Marketing, International, Teradata Marketing Applications Follow us: @YaelKochman @SharonMagen Webinar hashtag: #shoppingapps
  • 3.
    3 © 2015Teradata Trusted by Industry Leaders
  • 4.
  • 5.
    5 @YaelKochman @TD_Mobile AreRetailers Getting Everything They Can From Mobile Apps?
  • 6.
  • 7.
    7 Traffic Share: MobileVS Desktop 2007 2008 2009 2010 2011 2012 2013 2014 2015 2,000 1,800 1,600 1,400 1,200 1,000 800 400 200 0 600 Number of Global Users (Millions) Desktop Mobile Source: Comscore – Morgan Stanly Research @YaelKochman @TD_Mobile© 2015 Teradata
  • 8.
    8 Mobile Accounts For62% of Digital Time Spent, with App Activity Holding 54% Source: comScore Media Metrix Multi-Platform & Mobile Metrix U.S. @YaelKochman @TD_Mobile© 2015 Teradata
  • 9.
    9 App vs. MobileBrowser Share of Mobile Transactions © 2015 Teradata Source: Criteo : State of Mobile Commerce @YaelKochman @TD_Mobile
  • 10.
    10 Mobile Browser vs.App Funnel Metrics © 2015 Teradata Source: Criteo : State of Mobile Commerce @YaelKochman @TD_Mobile
  • 11.
    11 Growth in SpendPer Device 2014 vs. 2013 © 2015 Teradata Source: RetailMeNot @YaelKochman @TD_Mobile 4.1% 14.4% 9.3% 117.2% 134.9% 117.4% UK Germany France PC Smartphones
  • 12.
    12 UK Mobile ShoppingTrends Mobile Retail Conversion Rates, Q2 2015 Mobile Overall Android Smartphone iPhone Android Tablet iPad 4.2% 2.9% 3.4% 4.8% 6.0% Share of eCommerce Transactions by Device Android Smartphone iPhone Android tablet iPad Total Mobile Q2 2015 6% 14% 4% 21% 46% Q1 2015 6% 12% 4% 20% 43% 0% 6% Smartphone vs. Tablet (% Mobile Transactions) 46% 44% 54% 56% Q2 2015 Q1 2015 Tablets Source: Criteo : State of Mobile Commerce
  • 13.
  • 14.
    14 © 2015Teradata About The Study @YaelKochman @TD_mobile The top 50 online retailers in each country were identified Apps from these retailers’ websites were downloaded Push notifications were enabled and engaged user activity was stimulated over a four-week period
  • 15.
    15© 2015 Teradata ParticipatingCountries @YaelKochman @TD_Mobile
  • 16.
    16 © 2015Teradata Industries @YaelKochman @TD_Mobile Fashion DIY Travel Department Stores Communication Entertainment I.T.
  • 17.
  • 18.
    18 © 2015Teradata Out of The Top 50 Online Retailers, How Many Have Apps? 96% 70% 62% 94% UK Germany France US UK Germany France US @YaelKochman @TD_Mobile
  • 19.
    19 © 2014Teradata Apps Per Enterprise @YaelKochman @TD_Mobile 4.14 3.9 1.98 5.76 3.94 UK Germany France US Total
  • 20.
  • 21.
    21 © 2015Teradata Out of The Ones Who Have Apps, How Many Sent Push Notifications @YaelKochman @TD_Mobile 21% 20% 29% 35% UK Germany France US UK Germany France US
  • 22.
    22 Recommendations: Sending PushMessages © 2015 Teradata @YaelKochman @TD_Mobile
  • 23.
    23 © 2015Teradata How Many Used a Push Preference Center 56% 20% 19% 64% UK Germany France US UK Germany France US @YaelKochman @TD_Mobile
  • 24.
    24 Recommendations: Push PreferenceCenter © 2015 Teradata @YaelKochman @TD_Mobile
  • 25.
    25 © 2015Teradata @YaelKochman @TD_mobile
  • 26.
    26 © 2015Teradata How Many Ask Users to Sign In @YaelKochman @TD_mobile 23% 61% 16% France 42% 8% 50%UK 14% 80% 6% Germany
  • 27.
  • 28.
    28 © 2015Teradata In Europe, None of The Apps Sent an Abandon Cart Campaign @YaelKochman @TD_Mobile
  • 29.
    29 Last Minute TravelDeals Don’t wait in line book ahead! Amazing Activities, Tours and Attractions in London! now Slide to view Company: Last Minute Travel 29 Problem • Drive increased revenue usage with promotions and special offers Strategy & Tactics • Offer to book activities in the last destination searched Results • 19% click through rate • 6% conversion rate for purchase Case Study: Abundant Cart Campaign Increases Revenue
  • 30.
    30 How Many IndividualizedTheir App’s Content © 2015 Teradata @YaelKochman @TD_Mobile 31% 3% 0% 9% UK Germany France US
  • 31.
    31 How Many IndividualizedPush Messages © 2015 Teradata 13% 3% 0% UK Germany France @YaelKochman @TD_Mobile
  • 32.
  • 33.
    33 How Many AppsIncentivized Users to Buy © 2015 Teradata @YaelKochman @TD_Mobile 54% 74.3% 67.7% 63% 6.4% 6.4% UK Germany France Incentive to buy in store Incentive to buy online
  • 34.
    34 Recommendations: Incentivizing Users toBuy Online © 2015 Teradata
  • 35.
    35 In Europe, NoneUsed a Push Message Call to Action! © 2015 Teradata @YaelKochman @TD_Mobile
  • 36.
    36 © 2015Teradata Recommendations: Call to Action / Action Buttons
  • 37.
    37 How Many AskedFor Location? © 2015 Teradata 67% 29% 23% Uk Germany France @YaelKochman @TD_Mobile
  • 38.
  • 39.
  • 40.
    40 © 2015Teradata Summary of Findings @YaelKochman @TD_mobile Only 21-35% Offered incentives to buy in store, but in some countries only a few incentivized to buy online 54-73% Used push notifications to engage their app users Only 31% Of UK apps individualized their app’s content, with other countries legging far behind 62-96% Of top 50 brands in each country have at list 1 mobile app
  • 41.
    41 © 2015Teradata Summary of Recommendations @YaelKochman @TD_mobile Communicate with your users across all available channelsOmni-Channel Strategy It is …Proper Onboarding Process Send push notifications Don’t be afraid to engage your users! Use insights To individualize your mobile marketing Let them choose Use a push preference center to allow your users to control the content they’d like to opt-in to Enable email sign in In order to integrate data. But make sure it’s not mandatory
  • 42.

Editor's Notes

  • #3 A little bit about myself I co-founded IL Couture in 2011, which was an ecommerce website – therefore my background is very much relevant to what we are about to discuss today I then joined a startup called Roojoom as the Head of Marketing And in last July I joined Teradata as the Content Marketing Manager for the Mobile Center of Excellence Mobile is an important part of Teradata’s DMC and therefore following the acquisition of Appoxee earlier this year a Mobile Center of Excellence was founded where we continue developing the technology to help our customers engage their app users
  • #4 I’m not going to go into too many details about what we do, but these are some of the brands who are already working with our mobile push solution. If you’d like to learn more about what we do and how we can help you, stop by our booth after this session. We are at booth 407
  • #5 Before I start, I’d like to ask you: How many of you already have a mobile app for your brand? How many are currently working on one? So this will be very relevant to all of you.
  • #6 Mobile shopping is huge. We are only days away from the holidays’ season, and Google predicts that 82 percent of smartphone users will refer to their phone while in a store.  But Are Retailers Getting Everything They Can From Mobile Apps? To answer that question we conducted a study this last summer that looked into how the top online retailers in 4 countries are using mobile apps to engage their users. And I’m here today to show you the findings of that study and talk about what we can learn from it.
  • #7 Let’s start with some interesting data we gathered on the state of mobile shopping
  • #8 2014 was a great year for mobile when it passed desktop traffic for the first time. This was a huge millstone then, but today it’s already clear that mobile is king.
  • #9 If we go dipper into mobile, we see that mobile is all about apps. Out of total digital time spent in the US 62% comes from mobile, but 54% comes from apps = apps are bigger then mobile web and desktop combined.
  • #10 It is amazing to see that even though not all brands have apps and not all have both android and iphone ones - almost 50% of transactions in mobile in retail come from apps, In addition, not all users download apps – if I am currently in the store and need to search for a product, I will prob use web unless already have the app. If this is my first purchase with this brand I am also most likely to use mobile web and not the app.
  • #11 In apps since the UX is much better + users tend to be more loyal to the brand, conversion rate is 3 times higher than mobile web.
  • #12 Spend in mobile is expected to grow over 89% in 2015 in France, vs. only 7% growth in desktop. Mobile hasn’t said it’s final word in France and we expect it to grow even more and for France to catch up with the other countries in the next few years
  • #13 Mobile transactions in the UK in Q2 2015 accounted for 46% of online transactions, up from 43% in Q1 We can also see that there is a slight move from tablets to smartphones with 46% of mobile transactions occurring on a smartphone Av. Conversion rate on mobile is 4.2%
  • #14 Now that’s the truly fun part, let’s take a look at the study we did at Teradata
  • #18 And here is what we discovered
  • #19 We can see that the majority of the top 50 retailers in France already have mobile apps. UK is leading the list with 96% of the top brands already have at least 1 app, US not far behind with 94%. France and Germany are a little behind with 62% in France and 70% in Germany
  • #20 Even though in the UK more brands have apps than in the US, when it comes to number of apps per brand the US is definitely winning with almost 6 apps per brand. Some brands for example Tesco have different apps for different purposes, one for general users one for their reward club members, etc.
  • #21 Poll question – Does your company have a mobile app? Please write your answers in the chat box
  • #22 Push messages are a key tool for brands to communicate with their app users. Yet, our research shows that the majority of the top brands are not levering them. It’s not surprising to see that the US is leading the list with 35% of the apps recorded using push notifications during the term of our study. But to be honest we expected to see more. We also expected to see more in the UK and the rest of Europe. When we saw the data, we asked ourselves – why aren’t more companies using push notifications? And the simple answer is – they are afraid. They are afraid of annoying their users by sending them too many messages or irrelevant ones. But when we think about it, are inactive users worth more to your brand than users who uninstalled the app? While people download dozens of apps, they spend the majority of their time
  • #23 Don’t spam your users! Send them individualized messages that offer them value, such as information or incentives. Learn their behavior and send them messages at times when their attention is at its highest. Diverse your content and use advanced features, such as emoj’s , rich push for Android and push actions for iOS.
  • #24 Another important tool you should be using is a push preference center. How many of you are using a push preference center? A push preference center gives your users control on the kind of content they’d like to receive. Here we see some major differences between the countries, with 64% of the US apps and 56% of UK apps offering a preference center, vs. only 20% in Germany and 19% in France.
  • #25 Ensure that the push preference center always opens up on initial activation It should open before the operating system message pops up-this will increase push opt-in rate as people only opt-in to what’s relevant for them The preference center must be easily accessible from the settings of the app for ongoing usage It is best to let your user eliminate some of the communication or even all of it than completely un installing the app because they were getting content that was not relevant for them
  • #27 By asking your users to sign in to the app using their email, you are then able to connect the user profile with the information you have on this user on your CRM. This is extremely important as it allows you to send campaigns based on all the data available to you and not only the data gathered from the activity in the app. We encourage our customers to offer users to sign in and even to offer them an incentive for doing so.
  • #28 This step should be added during the onboarding process, when the customer’s attention is at its highest. It’s possible to send push notifications at a later stage to push users to sign in (offer value) It is important that the sign in will be optional and not mandatory, so that you will not lose the users who do not want to sign in. Value generated from signin Connect the user with other channels- Omni Channel, access data on user from the web Easier to then make transactions when needed
  • #29 This is surprising as we have seen this to be a very effective way to greatly increase conversions. The buying process takes time, there might be lots of interferences between and sometimes people just forget to complete the purchase. Reminding them that they left something in the cart is an effective way to encourage them to complete the purchase otherwise they might end up buying it elsewhere. Sometimes the sale is not completed because the client has doubts if the price is right for them. Sending a reminder along with a discount offer proves to be very effective. Don’t have findings for US yet.
  • #30 To demonstrate the effectoveness of abandond cart reminders, I‘ve brought a case tudy from one of our customers – Last minute travel launched an abondant cart push messages campaign and they were able to see a 300% increase on average conversion rate. We can see that the push messages is individualized as they were using the name of the location the customer was interested in into the message, this increased the push open rate to 19%.
  • #31 When it comes to individualization, UK is leading with 31% of the apps using individualized content in the app. France is far behind with 0%. This is very unfortunate as individualization is key to building the relationship with the customer
  • #32 Similarly, we also see that only a few of the apps used individualization in their push messages
  • #33 People want to treated as individuals and receive information that is relevant to them. Having somebody use your app allows you to collect a lot of data about their preferences, demographics, what their looking at or buying, location. Marketers should leverage on that data to engage customers and grow revenue. Individualization helps to build trust and a closer relationship with your user. - doesn’t happen enough because of marketers immaturity in this space (same as other features that are still not used enough like a/b testing, work flow, frequency capping, etc
  • #34 Across UK, Germany and France the majority of the apps offered incentives, such as discounts and coupons, for buying in store. Surprisingly, in Germany and France only a few of the apps offered incentives to buy in the app
  • #35 © 2014 Teradata
  • #36 Surprisingly, none of the push messages observed in Europe contained a call-to-action. It is extremely important to include a call to action in your message so that the user knows what they need to do next. With iPhone you can also use actions to make the call to action much more visible. For example, add a “shop now” action and direct them to the relevant page in the app using a deep link.
  • #37 Surprisingly, none of the push messages observed in Europe contained a call-to-action. It is extremely important to include a call to action in your message so that the user knows what they need to do next. With iPhone you can also use actions to make the call to action much more visible. For example, add a “shop now” action and direct them to the relevant page in the app using a deep link.
  • #38 Location technology is no longer a new thing, and is important for retailers who also have brick and mortar stores in order to combine the online experience with the in-store experience. Here we can see that France is also a little bit behind with only 23% of the apps asking for access to customer’s location.
  • #39 Knowing your customer’s location allows you to send him messages at the right time and place. Starting from a personal greeting when they arrive at your store, sending targeted offers based on past purchases, and even syncing your in-store technology such as a smart TV to change the content displayed in real time based on who’s currently in the room. Many retailers also make these insights available to their in-store associates, which now have the right information to truly assist their customers. * This is important for retailers who have a brick and morter shop. If the brand is online only there is not enough justification to ask for location