Download as PDF, PPTX


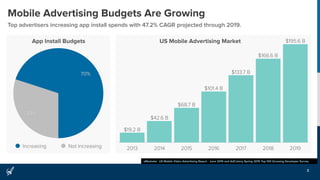
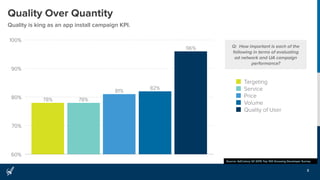
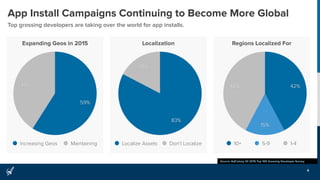
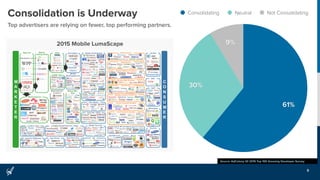
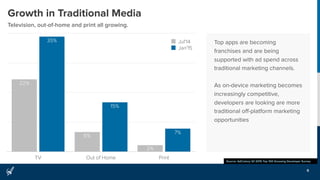
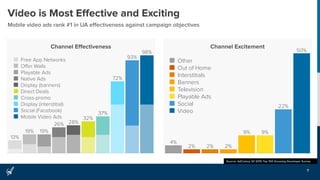
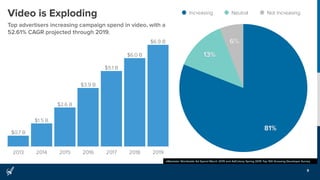
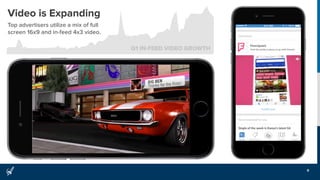


Mobile advertising budgets and app install campaigns are growing significantly, projected to increase from $195.6 billion in 2013 to $133.7 billion in 2015. Quality of users, not just quantity, is becoming a key performance indicator for app install campaigns. Top developers are also expanding their localization efforts and number of geographic regions targeted for app installs. Major advertisers are consolidating with fewer top-performing partners. Traditional advertising channels like television, out-of-home, and print are seeing increased investment from app developers. Within mobile channels, video advertising is considered the most effective and exciting format.


