Download to read offline


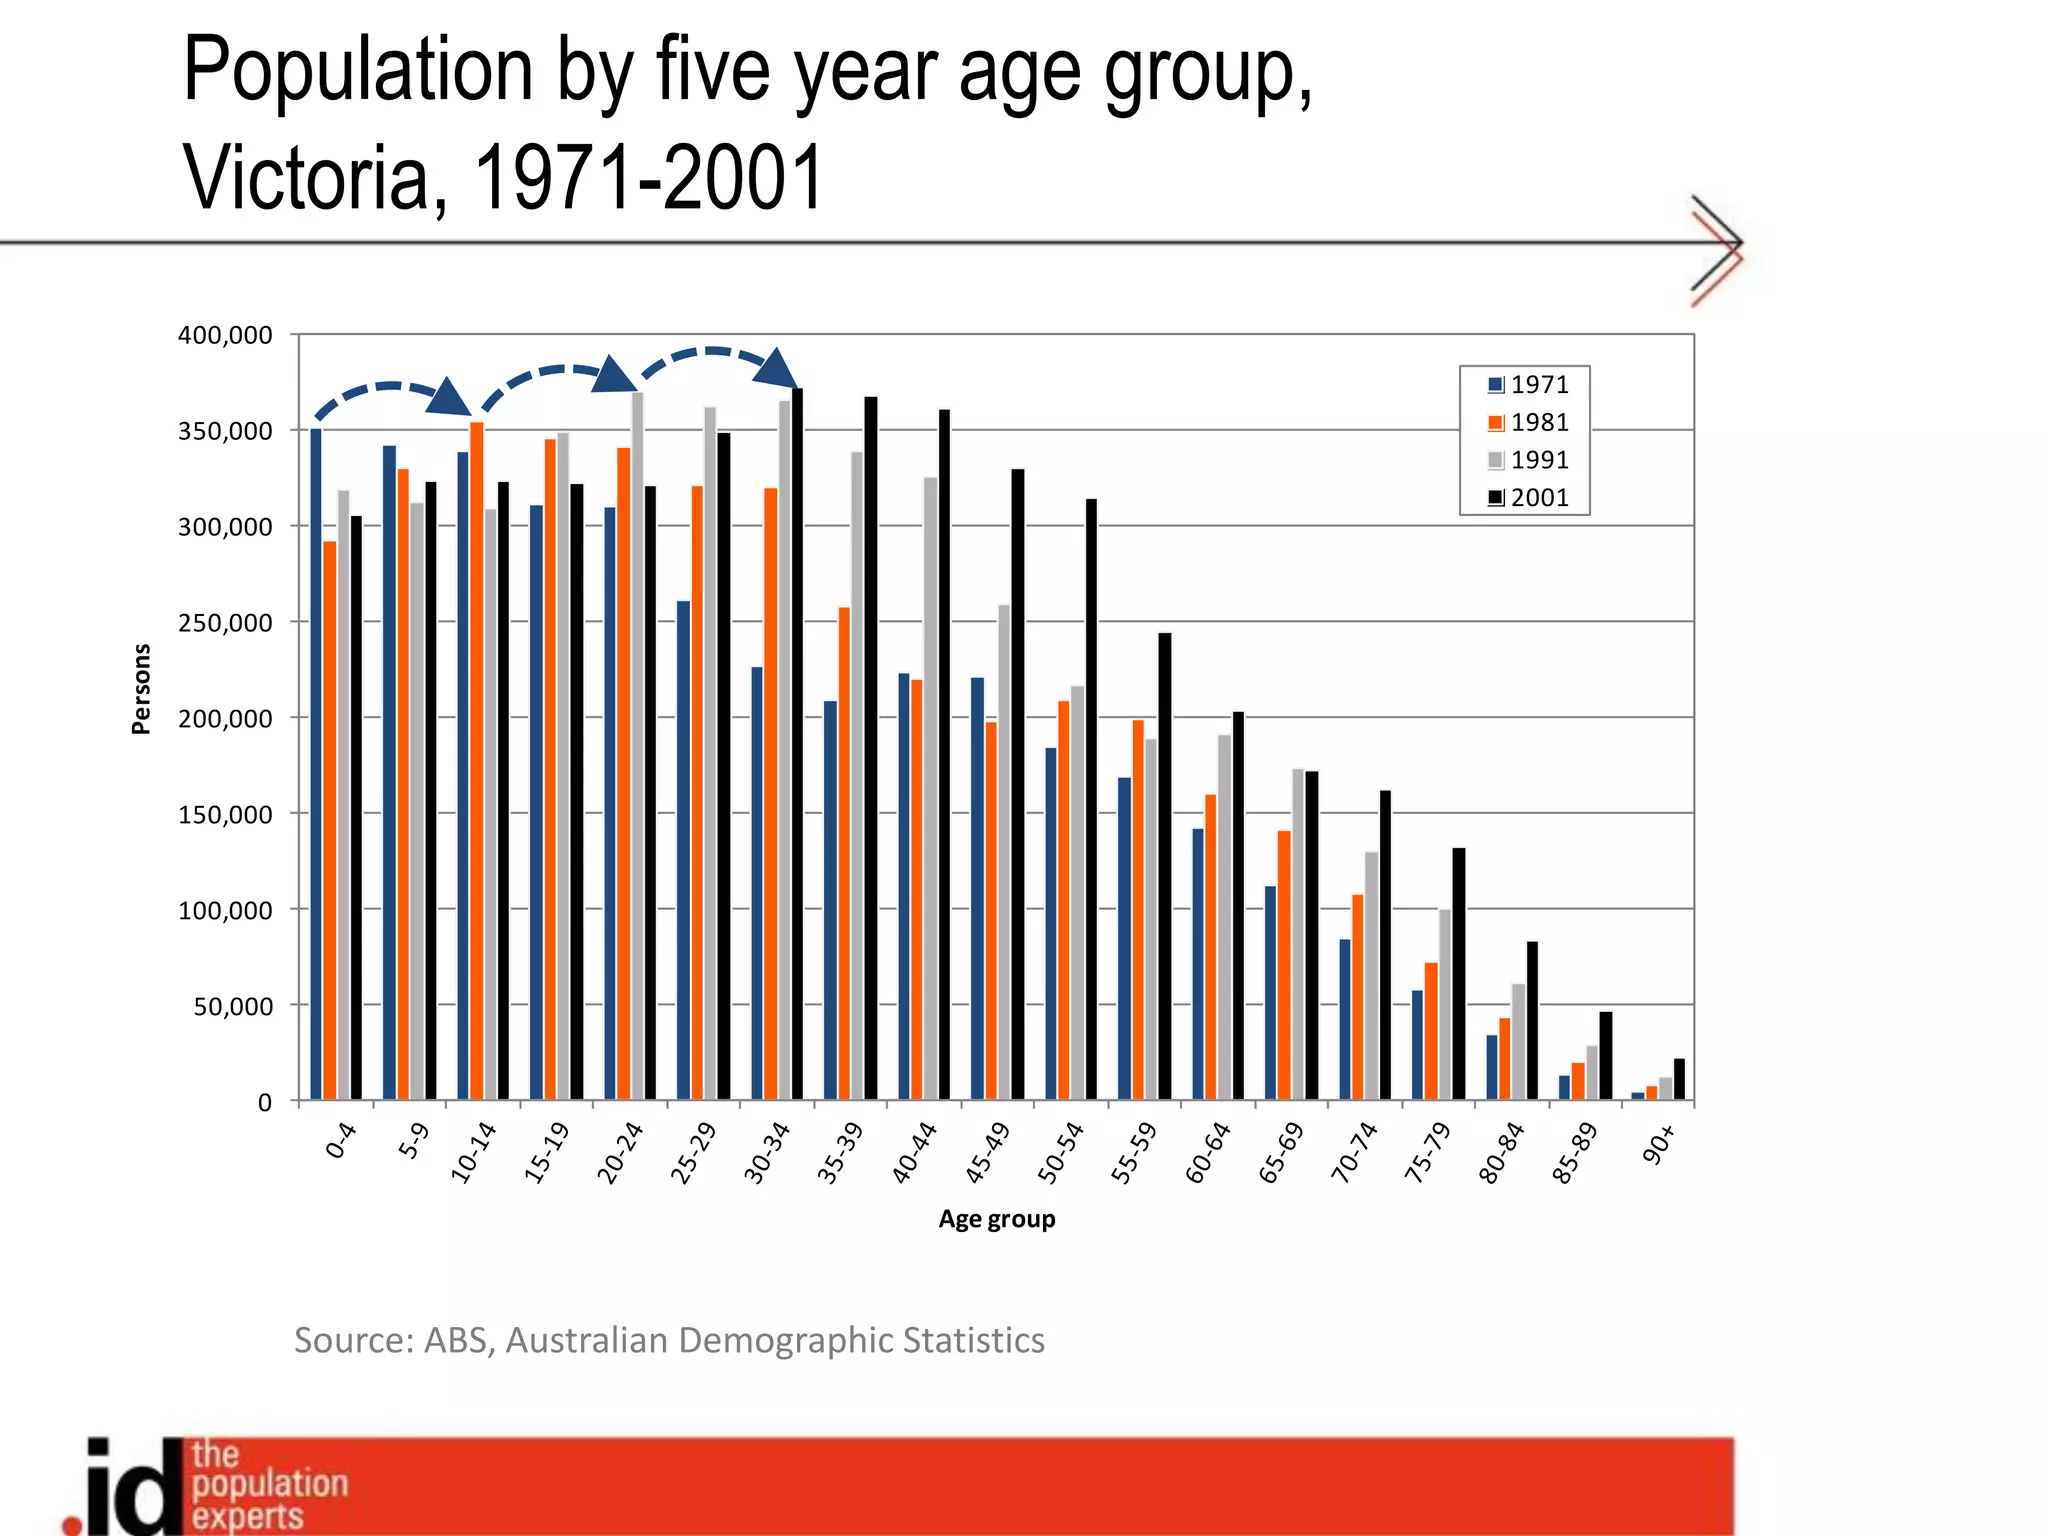


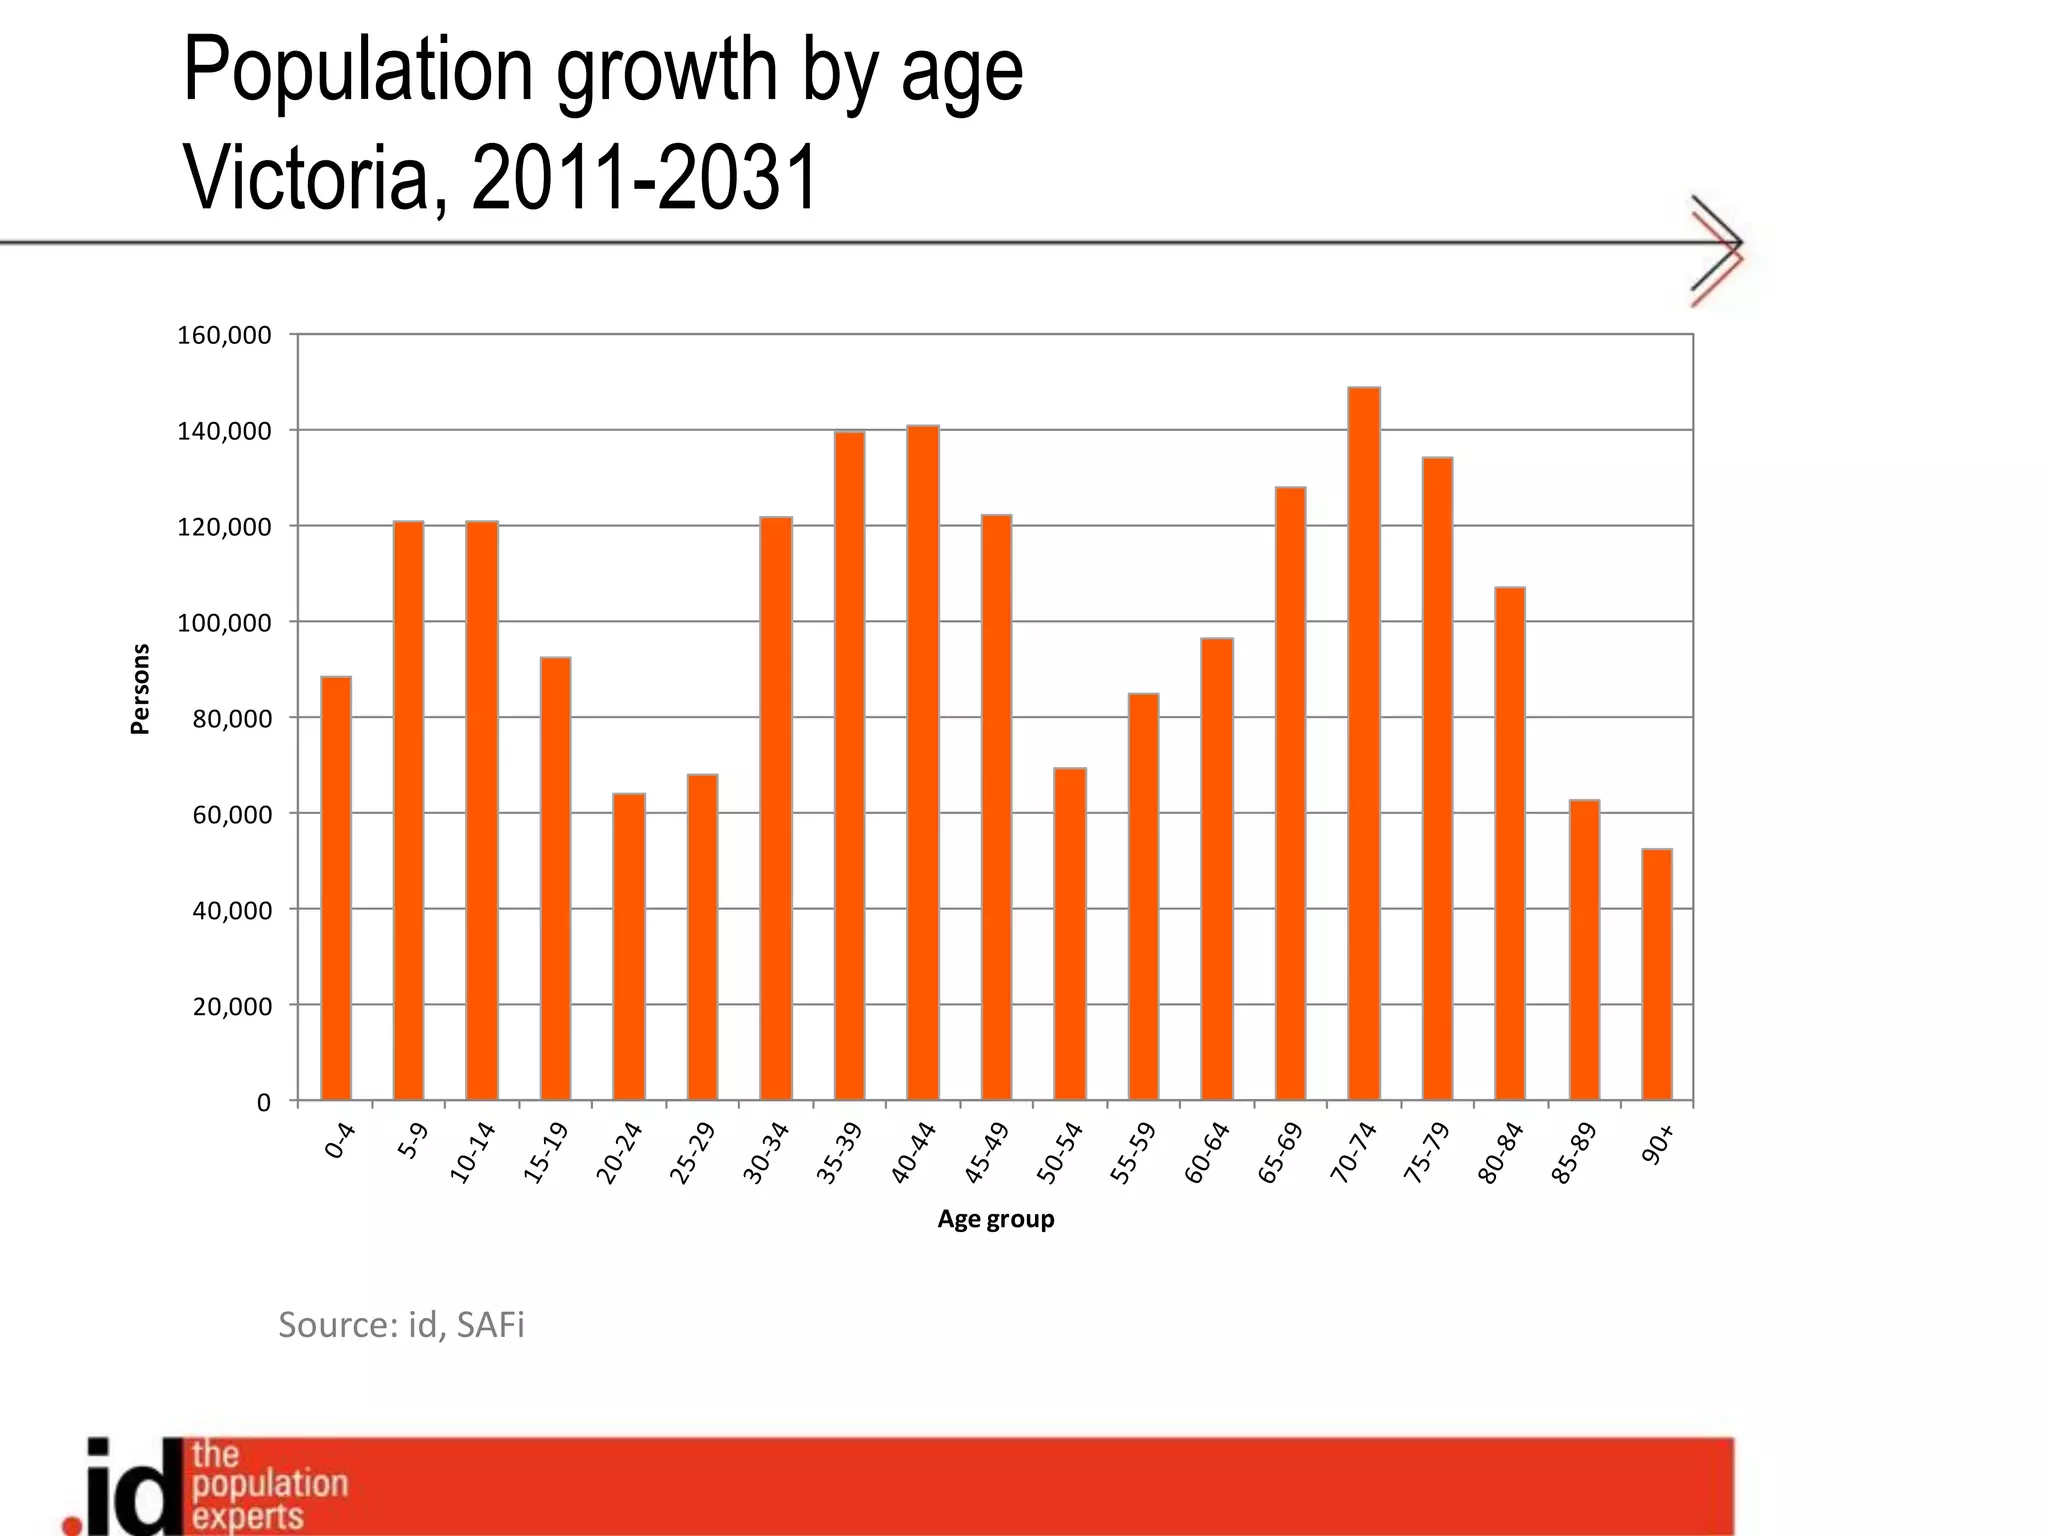


The document discusses the demographic changes and population growth in Victoria, Australia, using data from .id's Small Area Forecast Information. It highlights the factors driving growth, including overseas migration, fertility rates, and economic conditions, as well as potential impacts on planning and infrastructure. The analysis emphasizes the increasing youthfulness of the population and the importance of timely updates for accurate forecasting.


