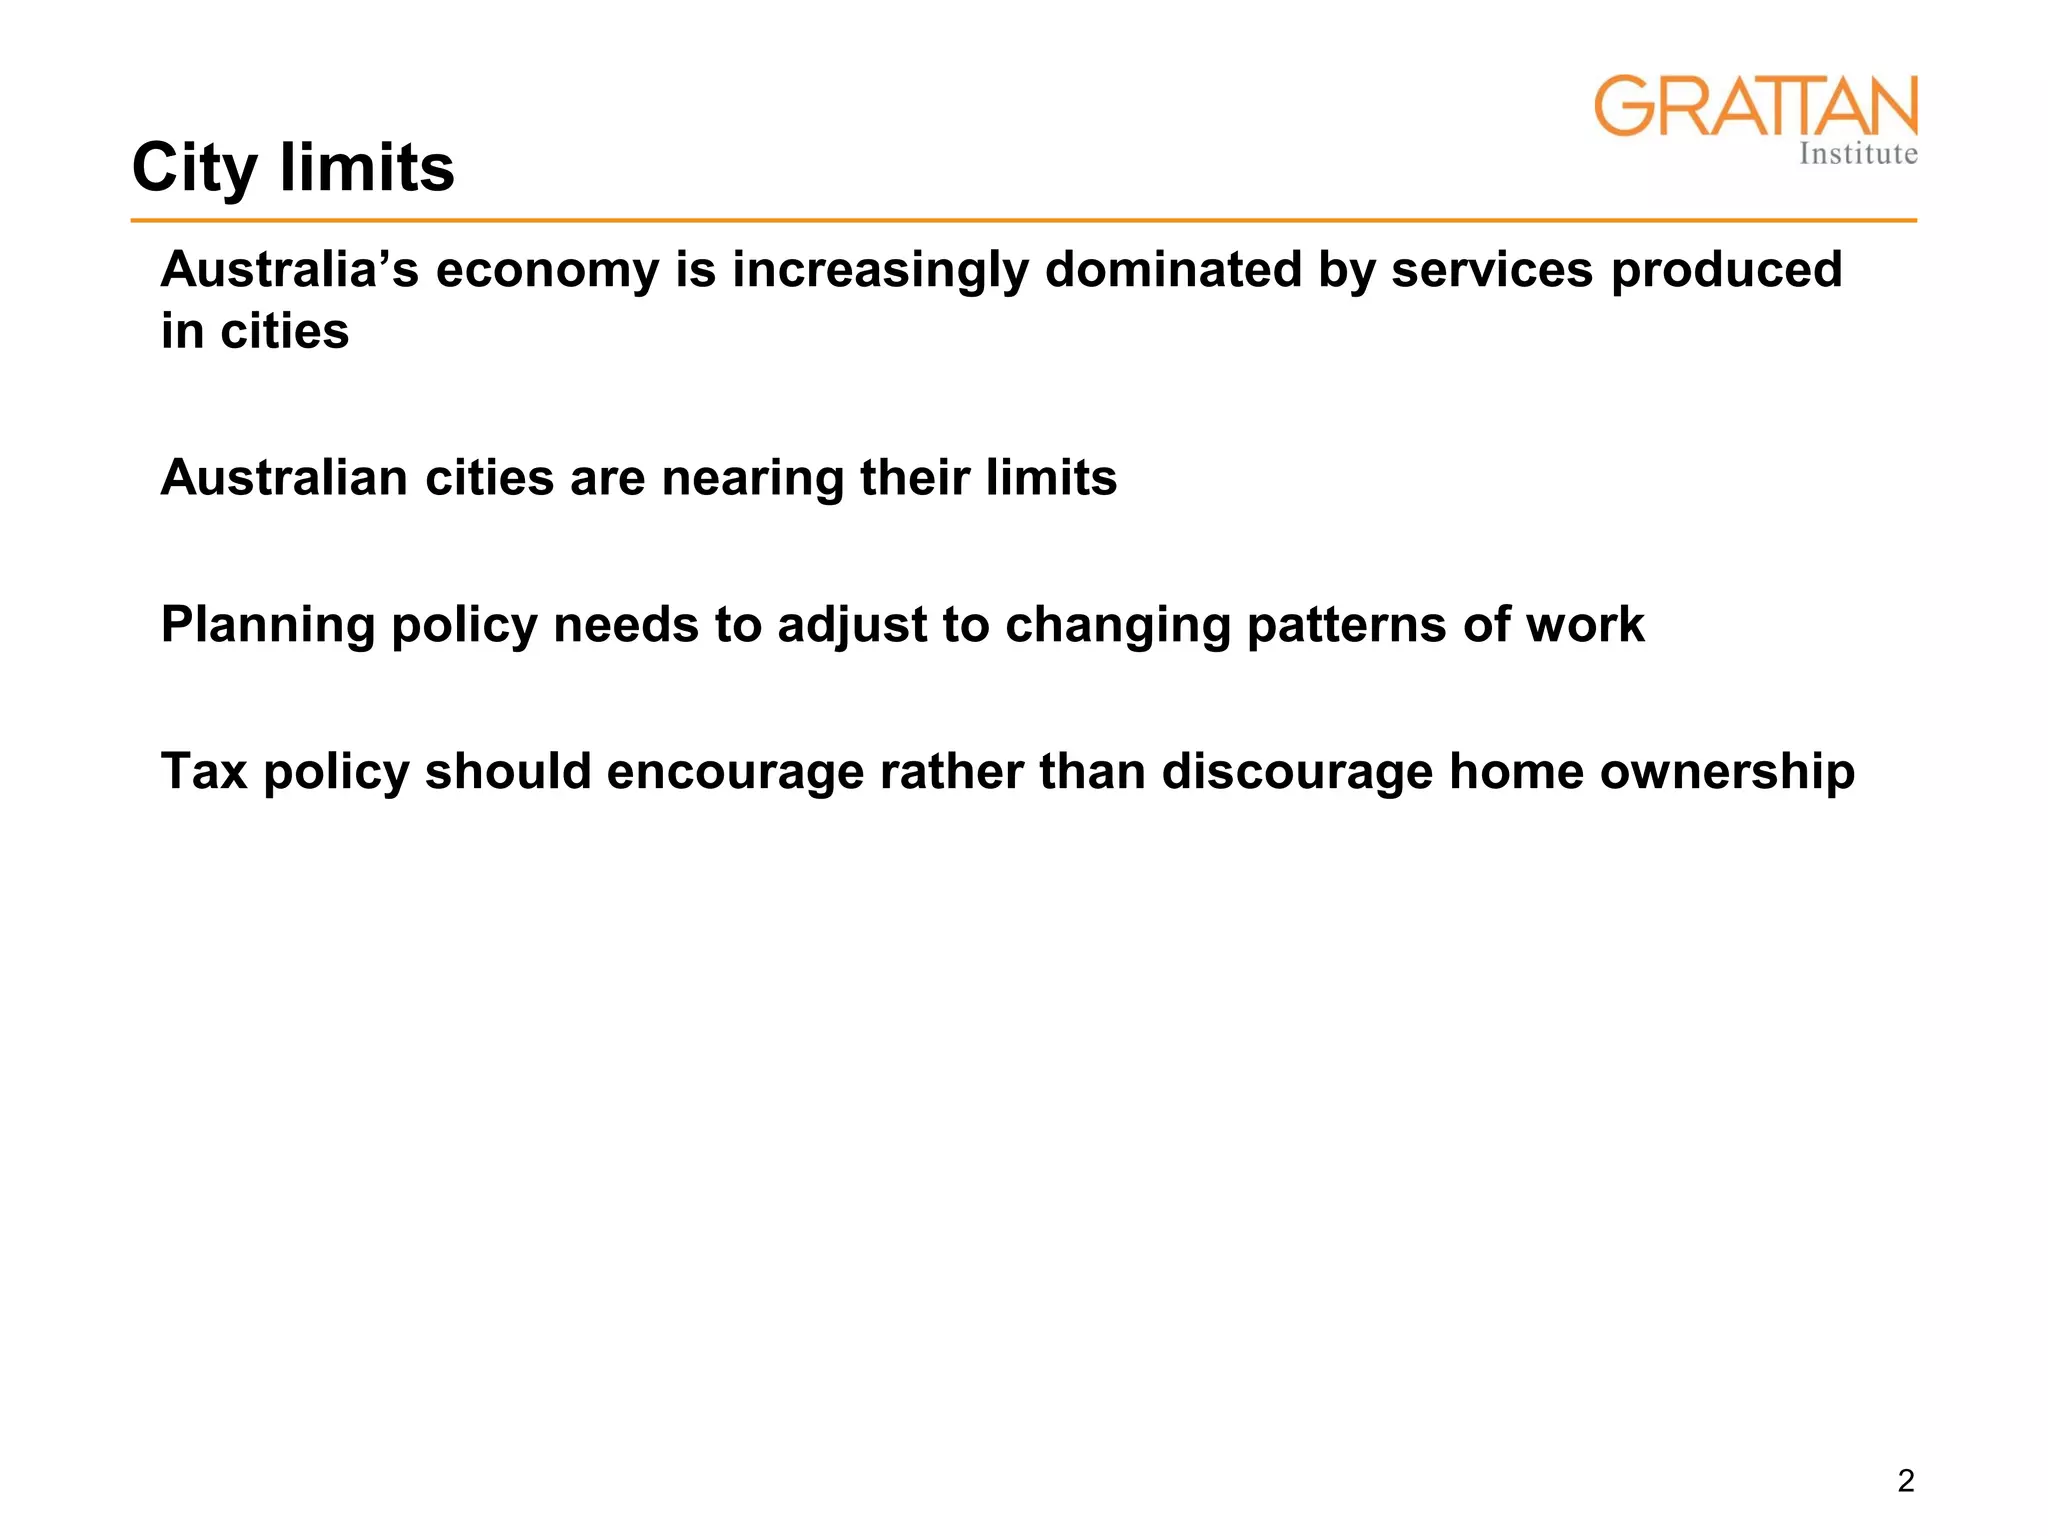
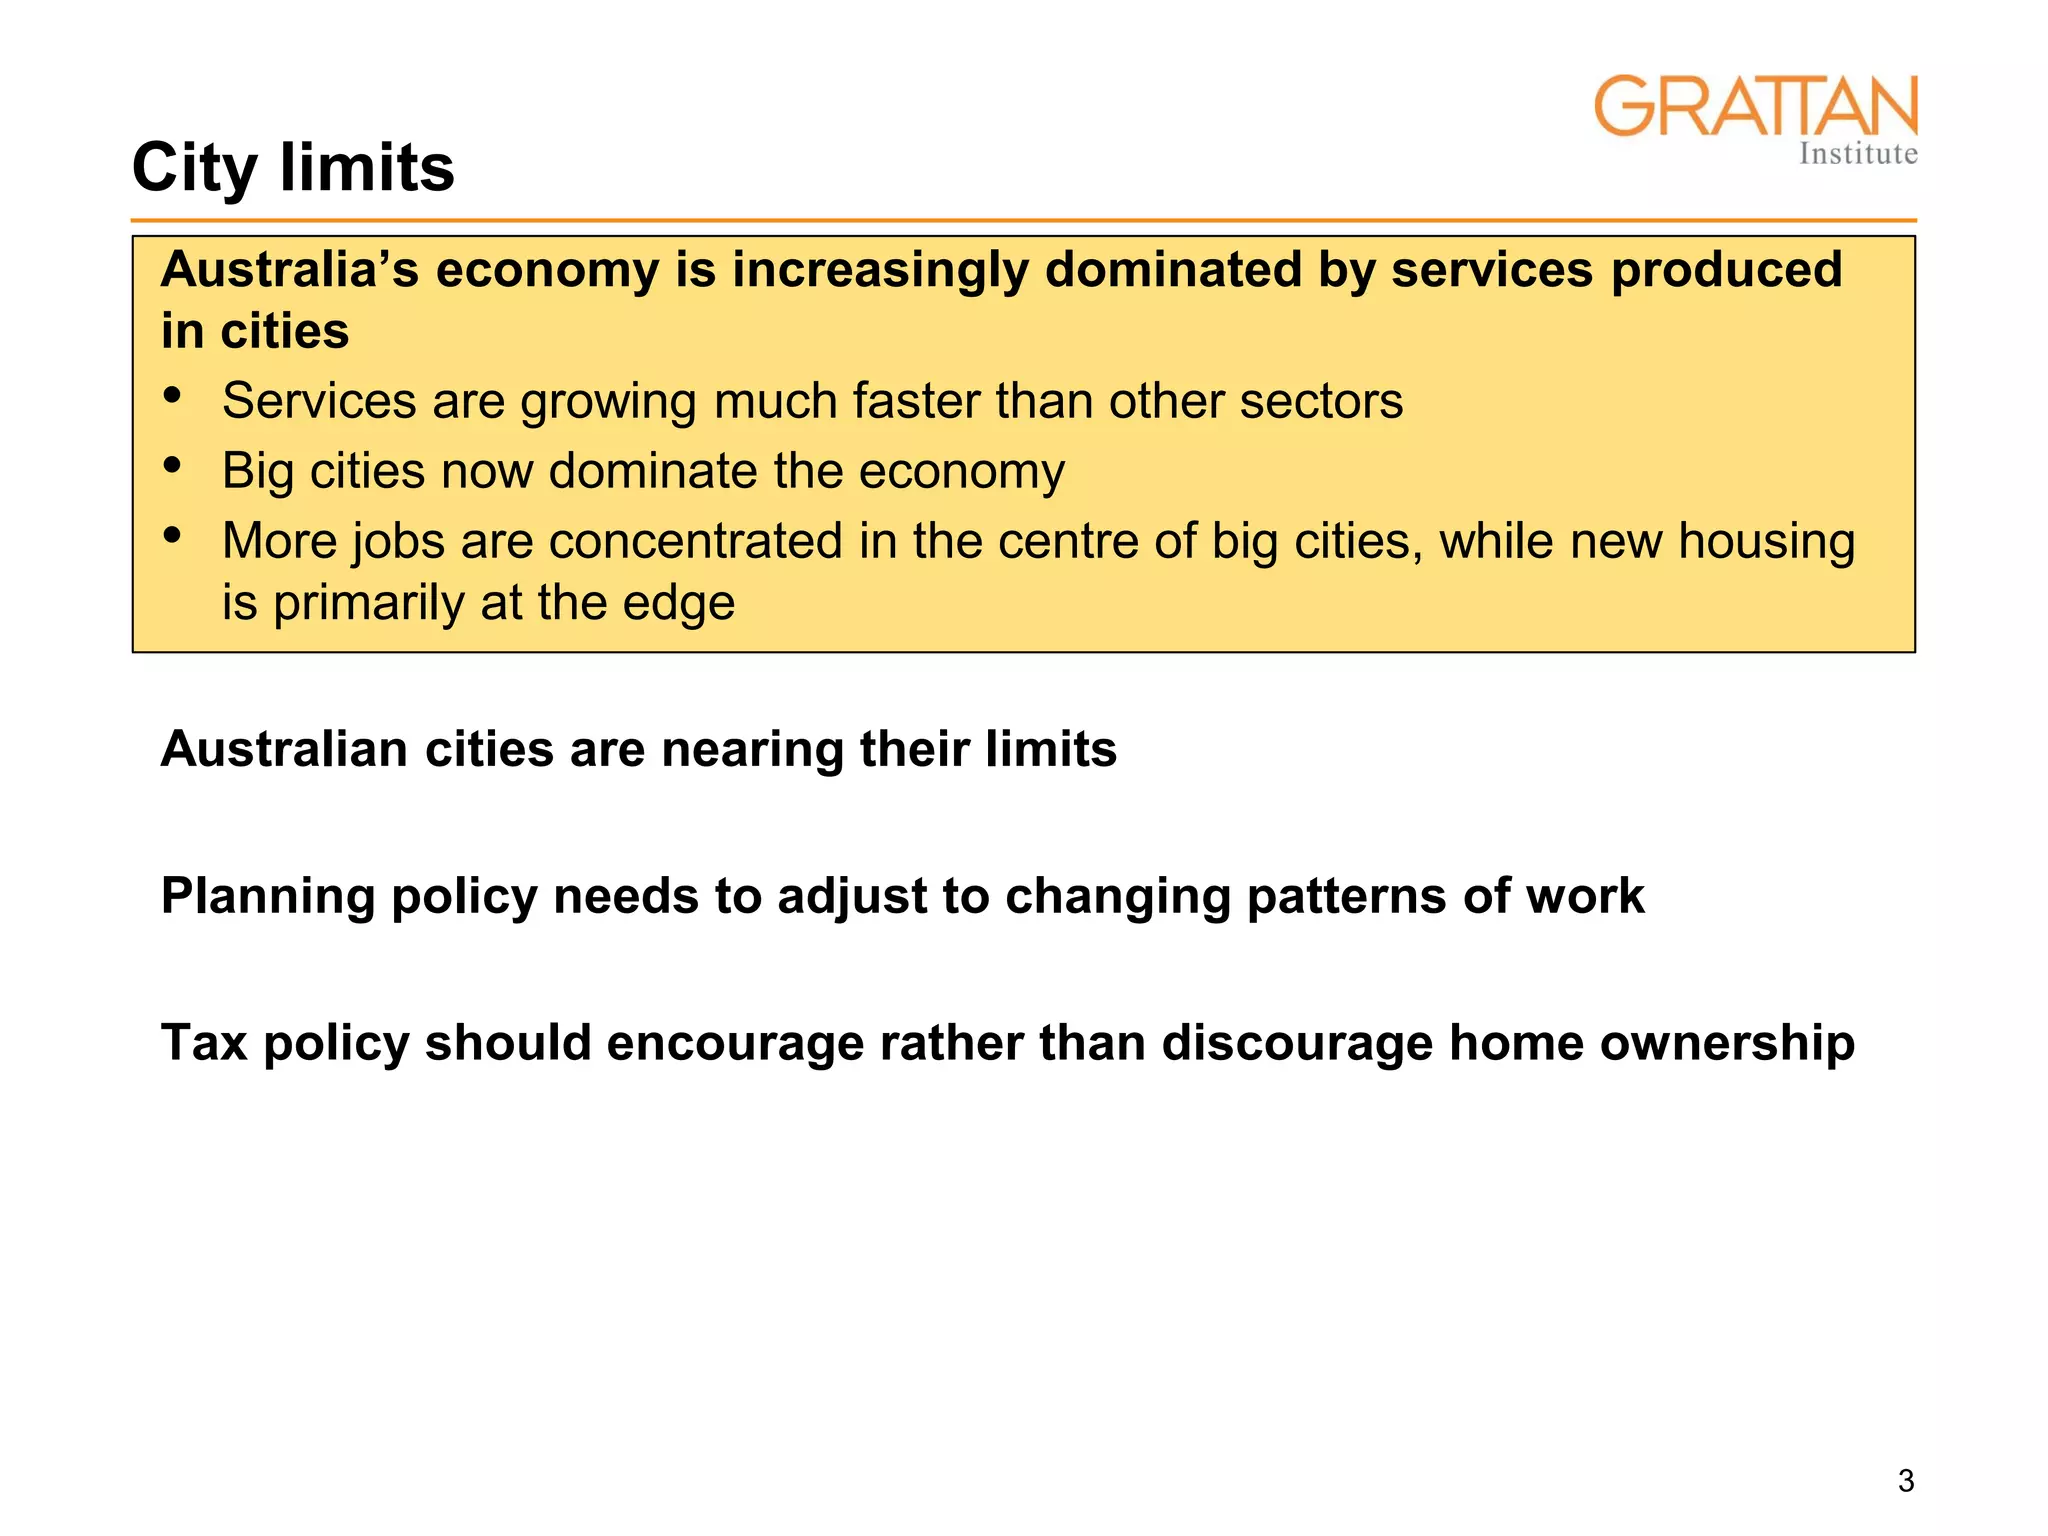
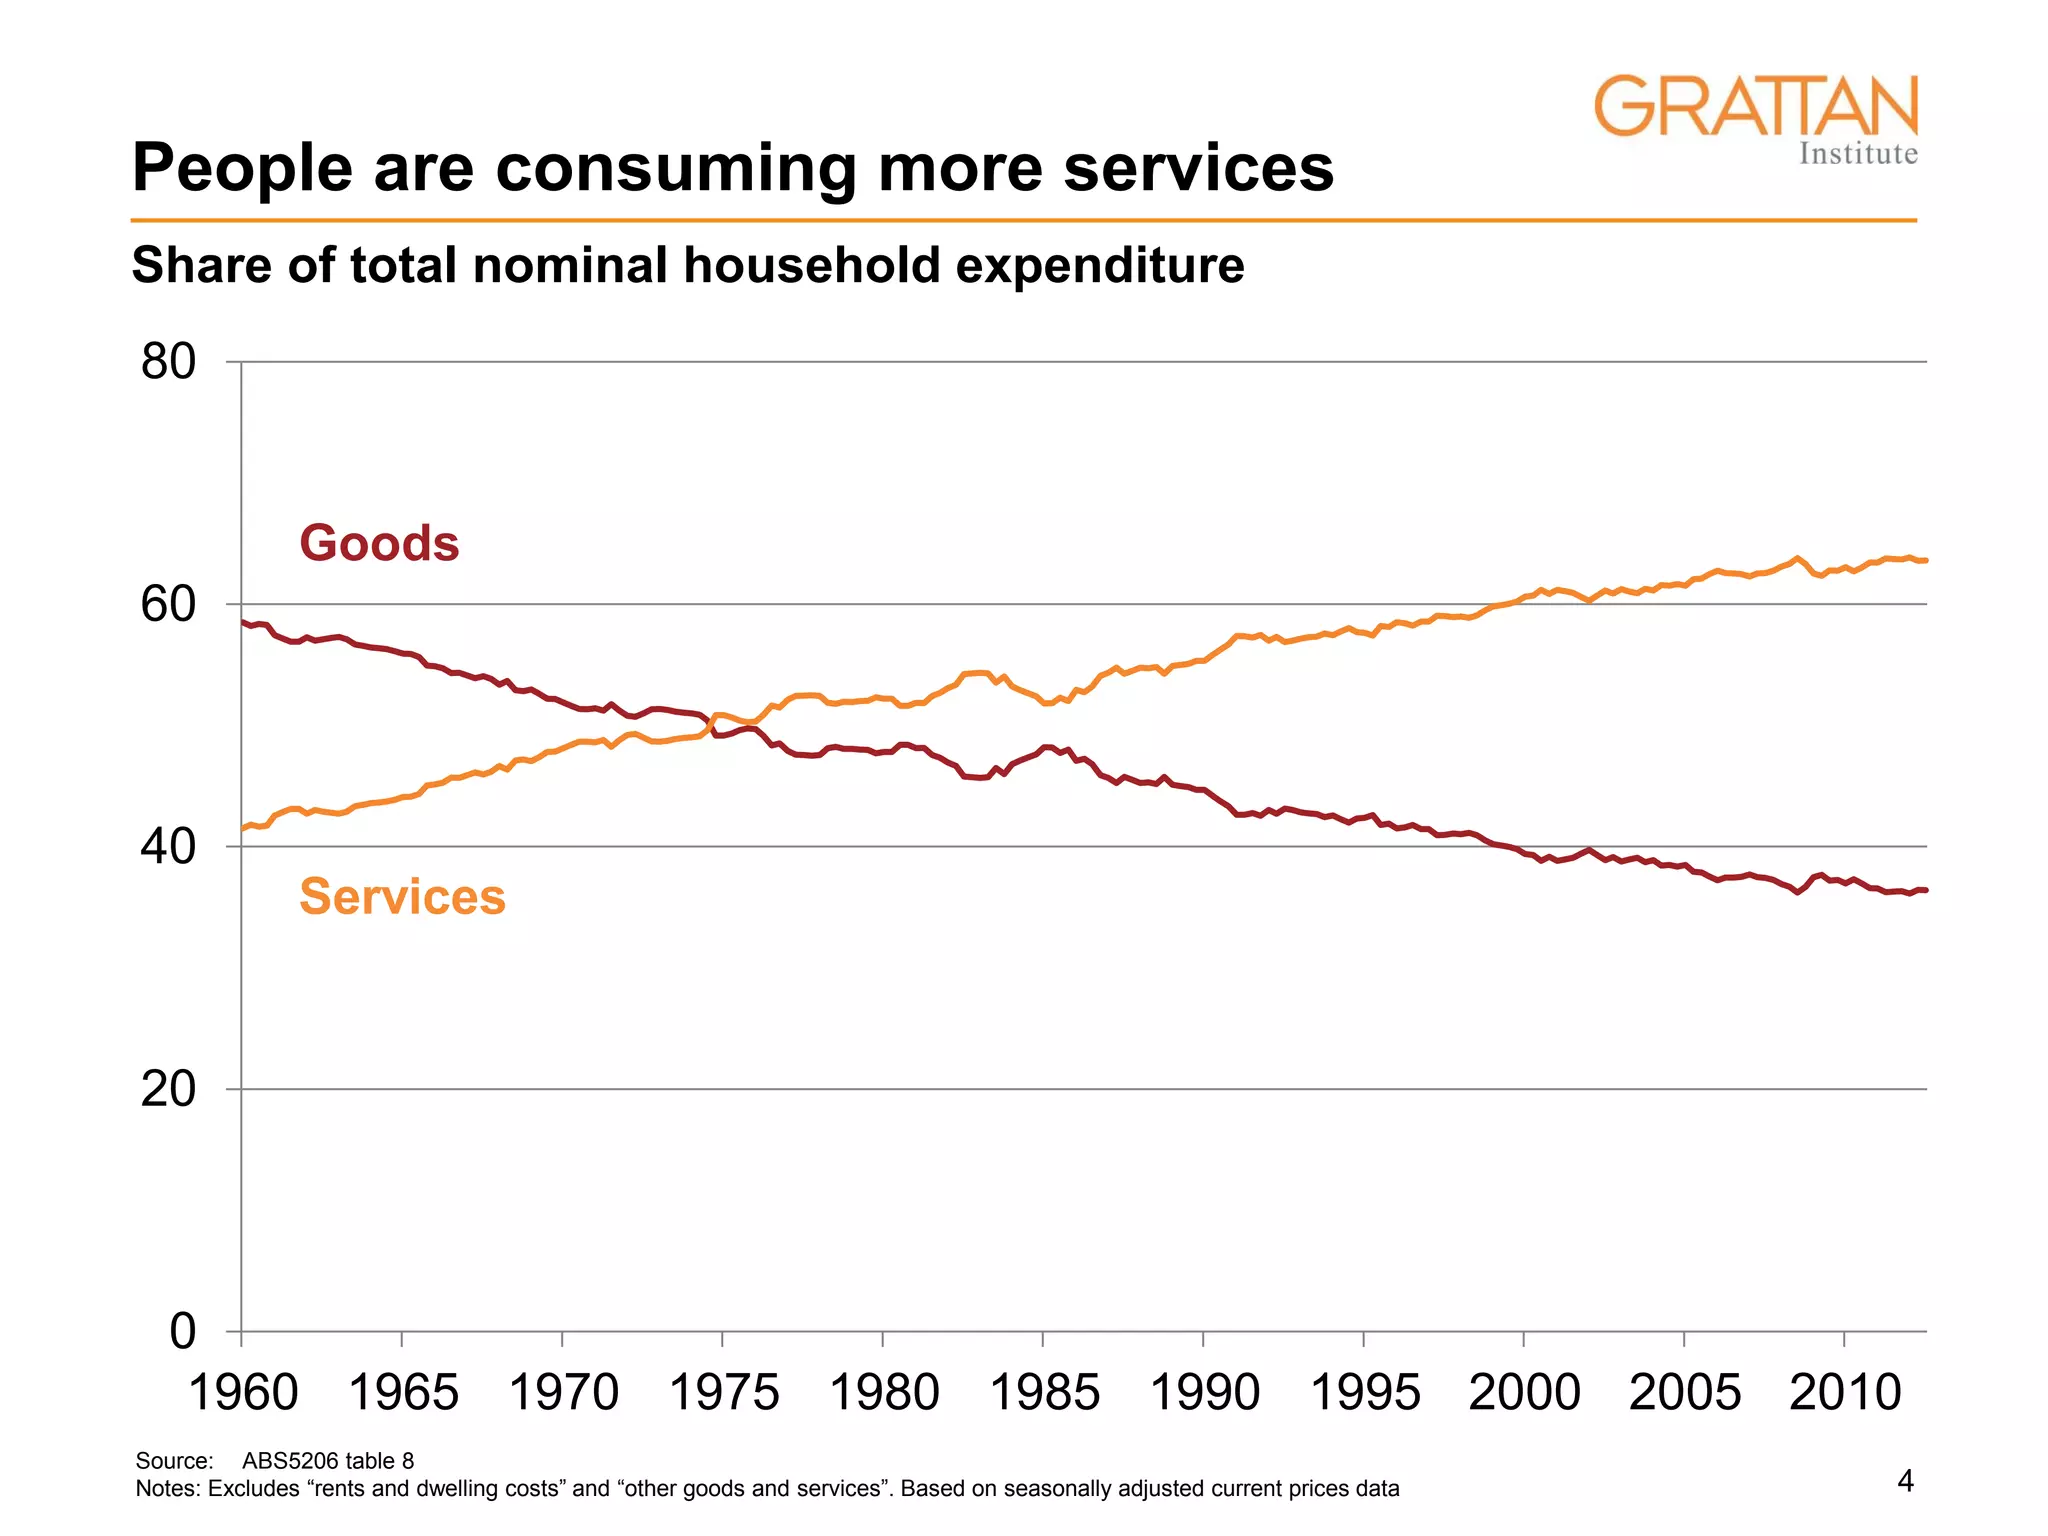
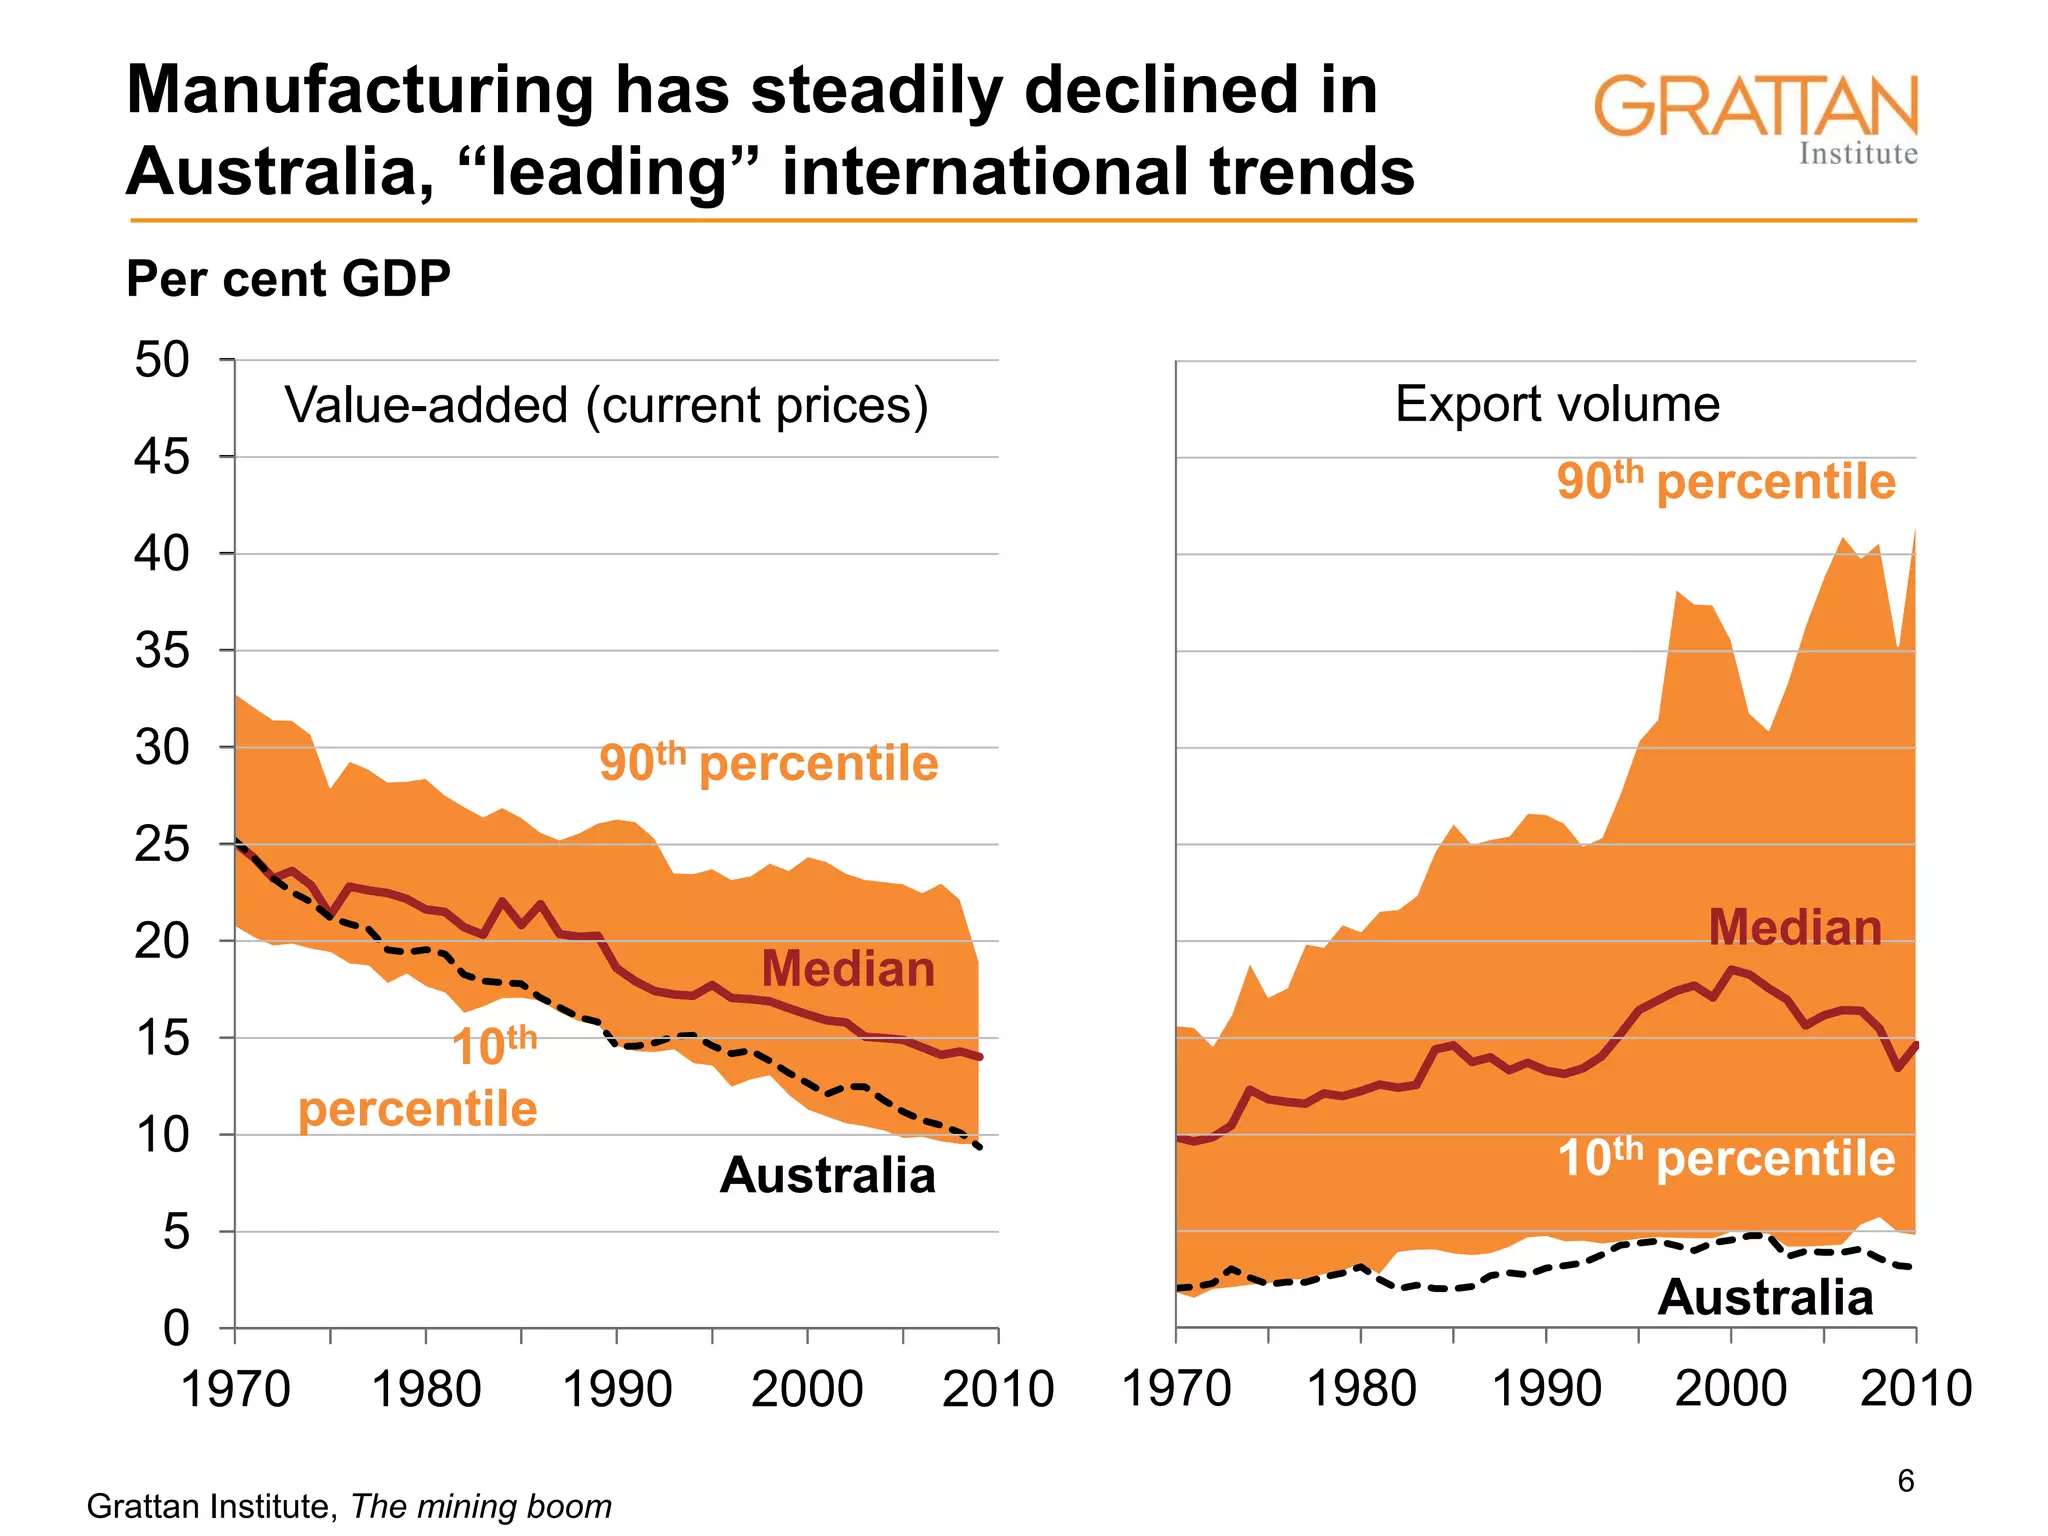
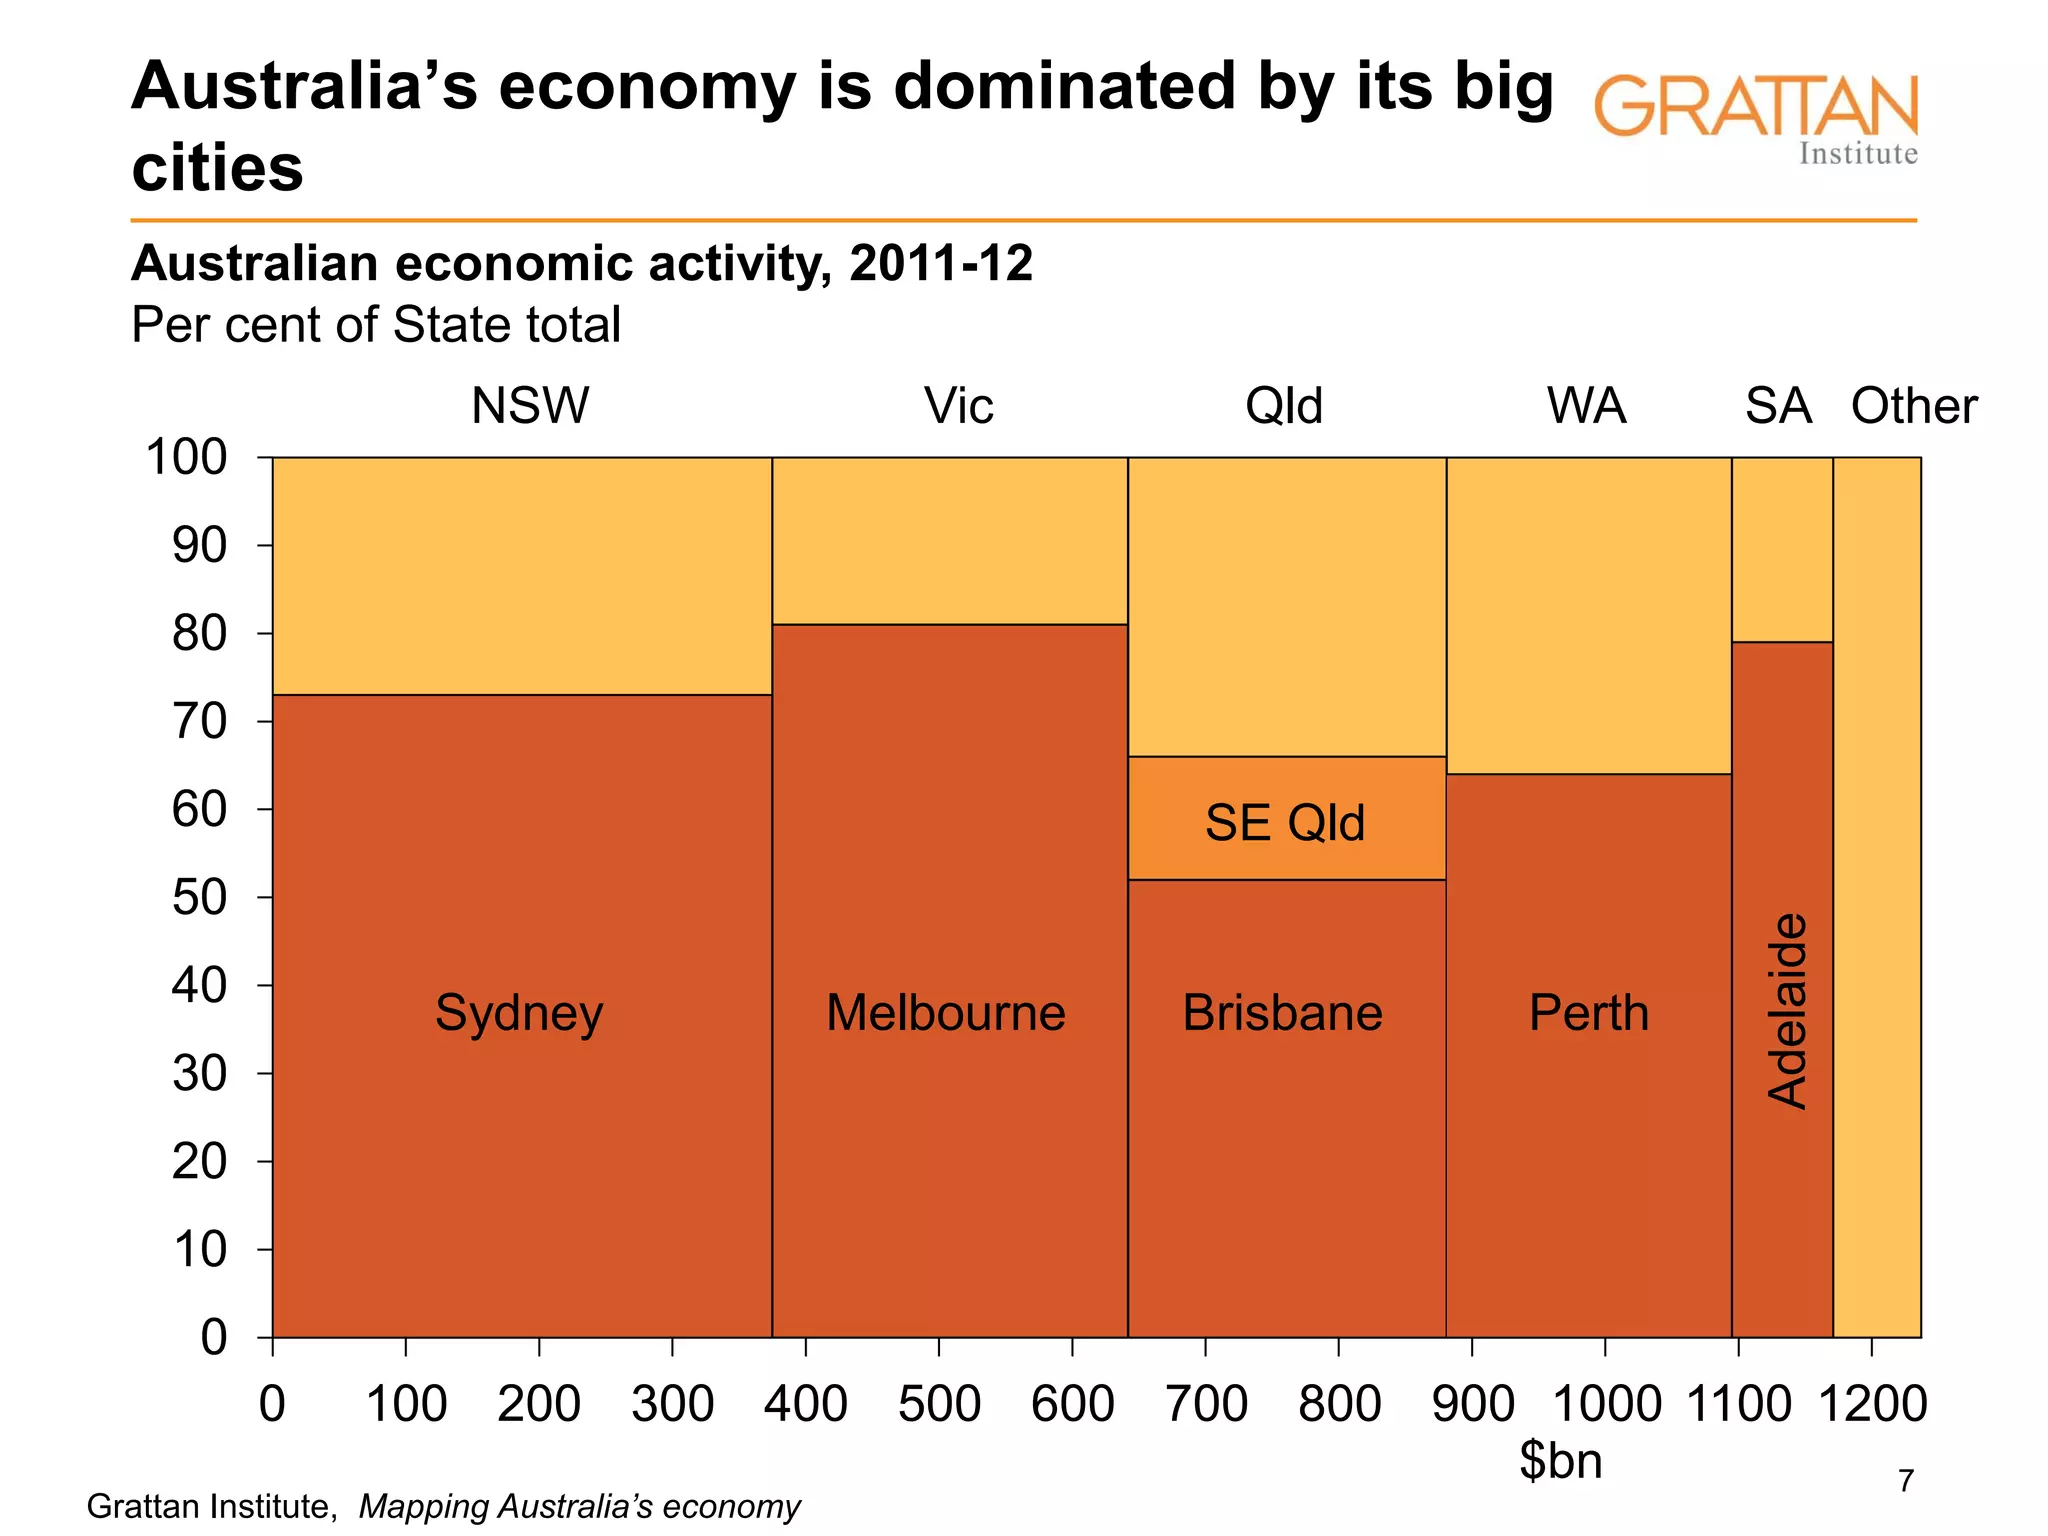
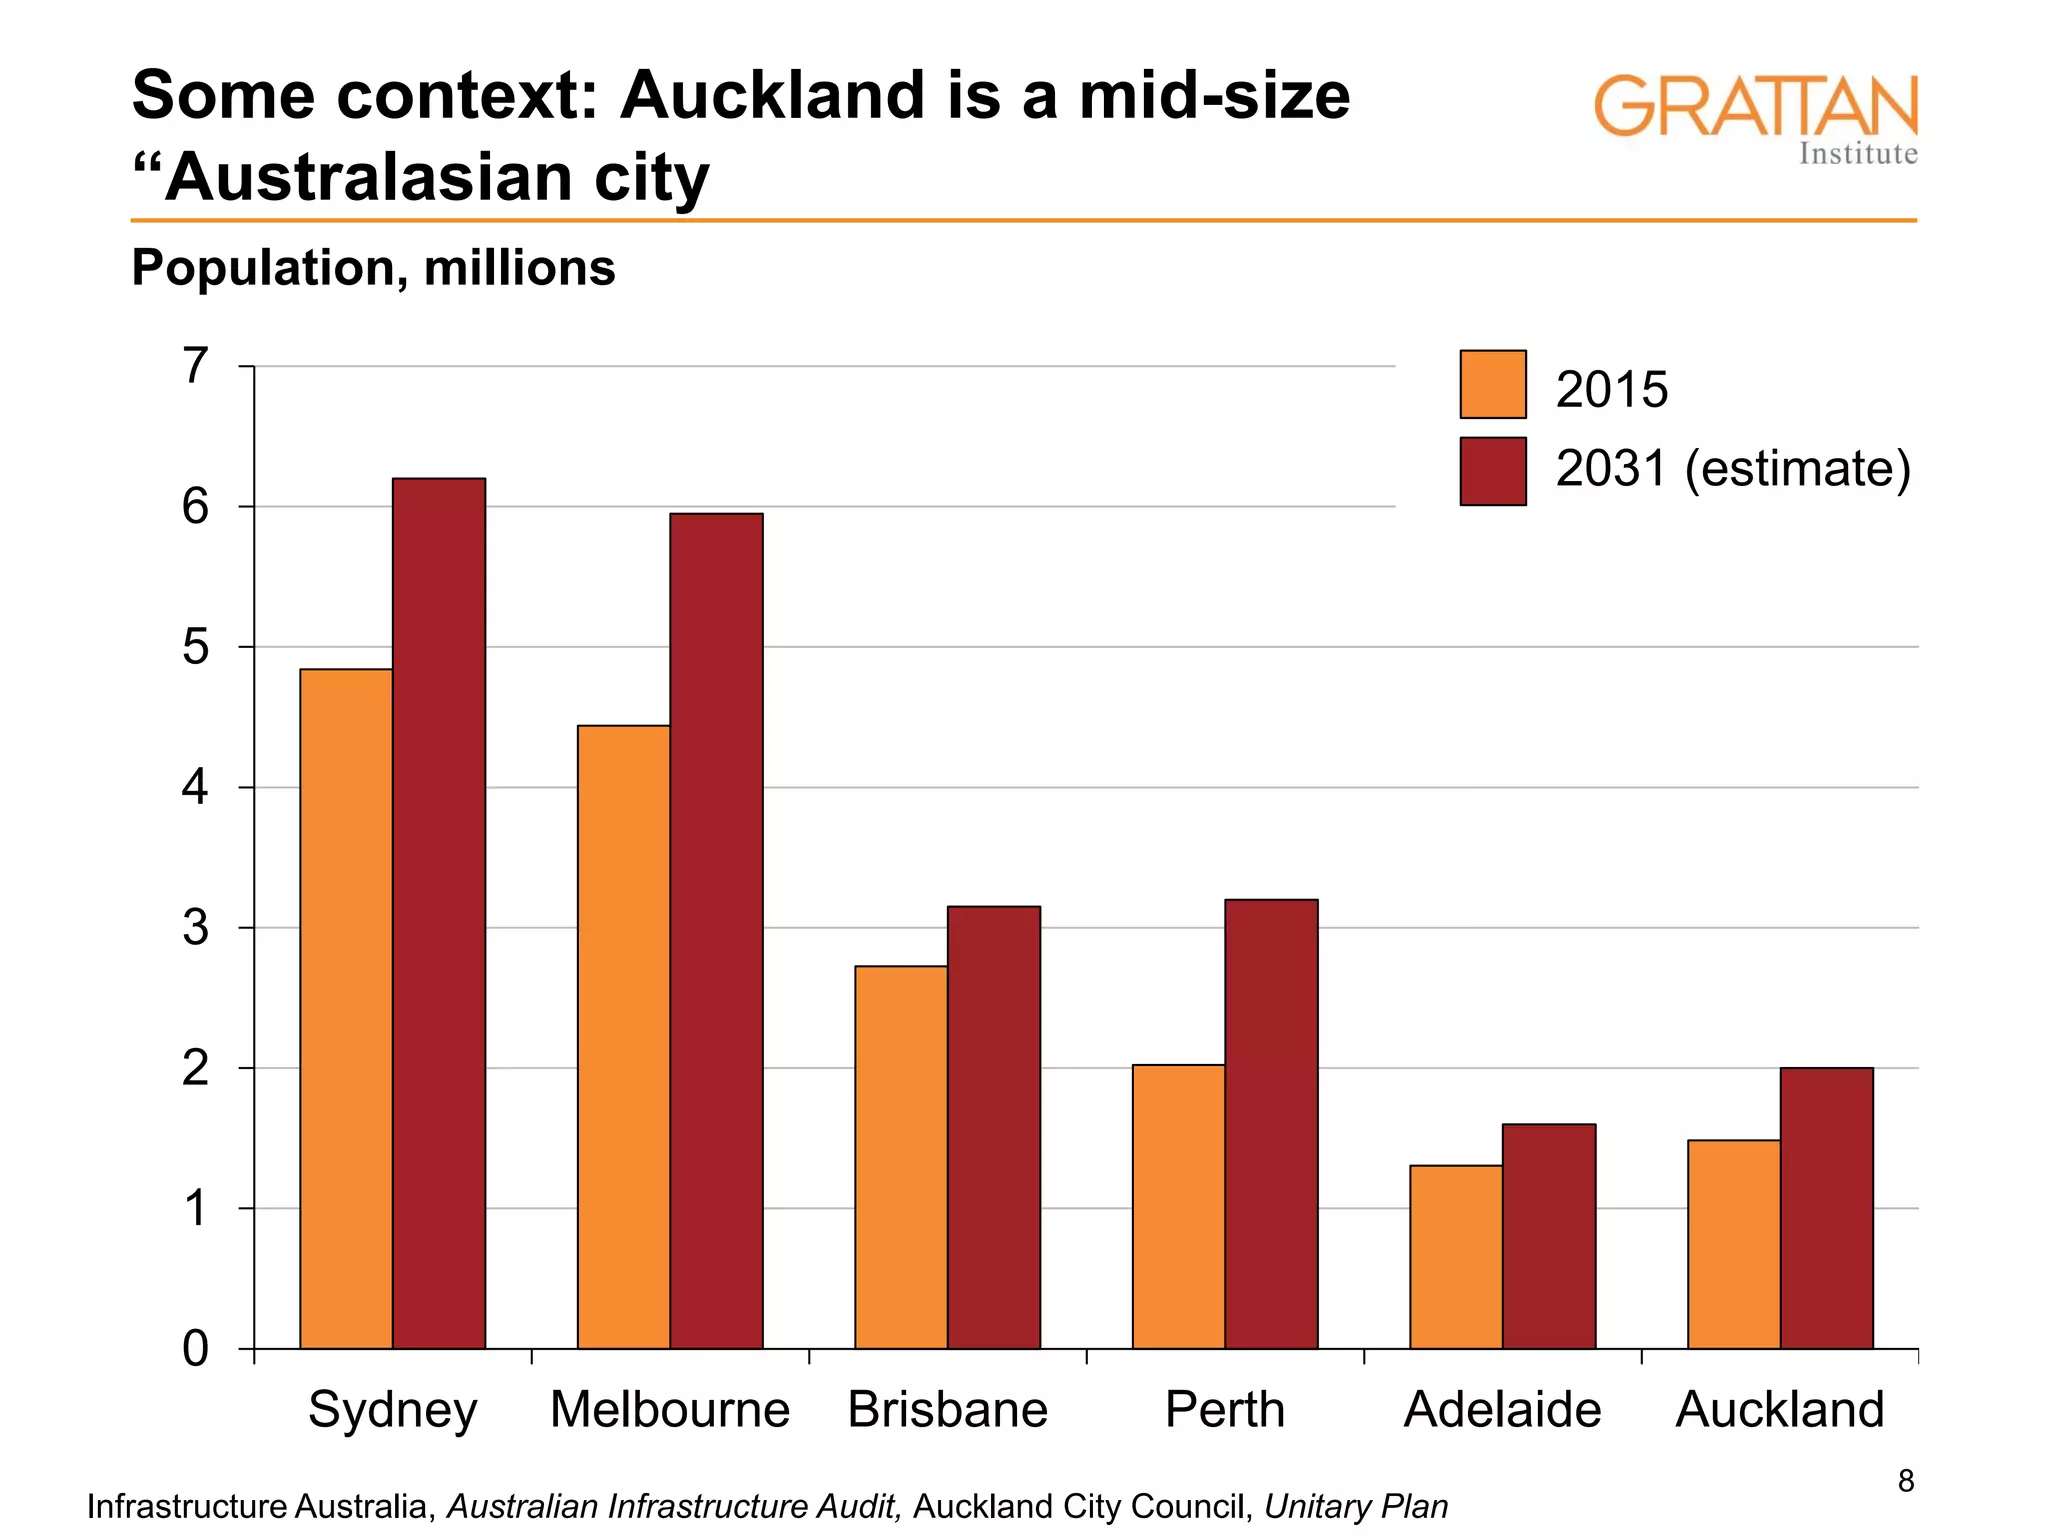
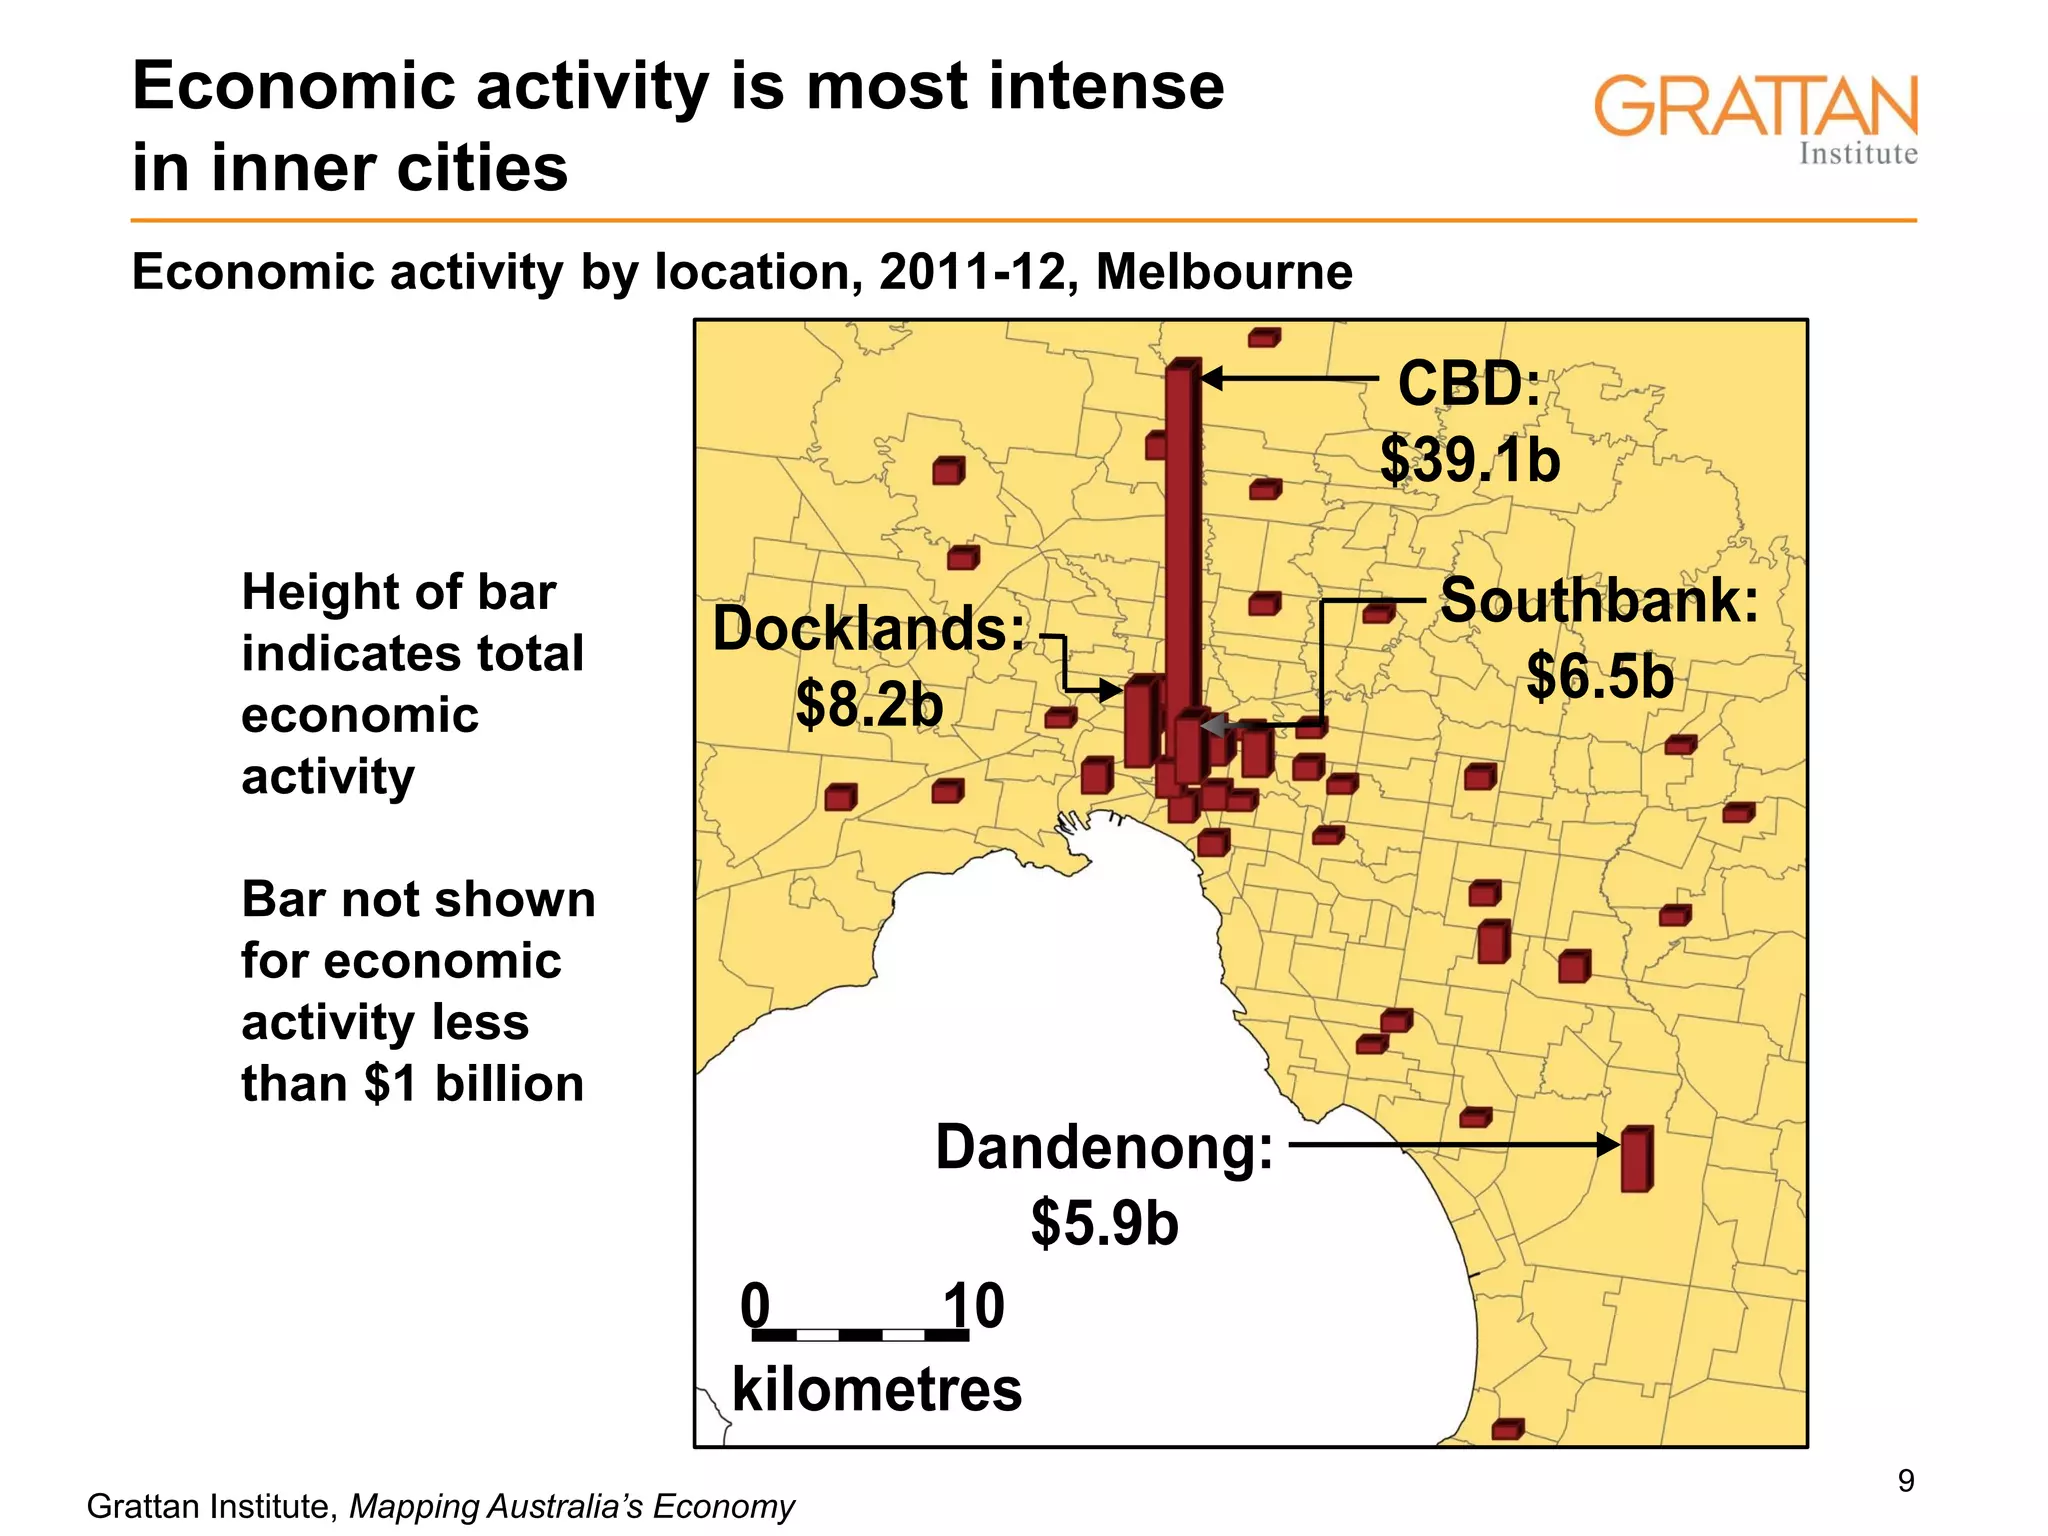
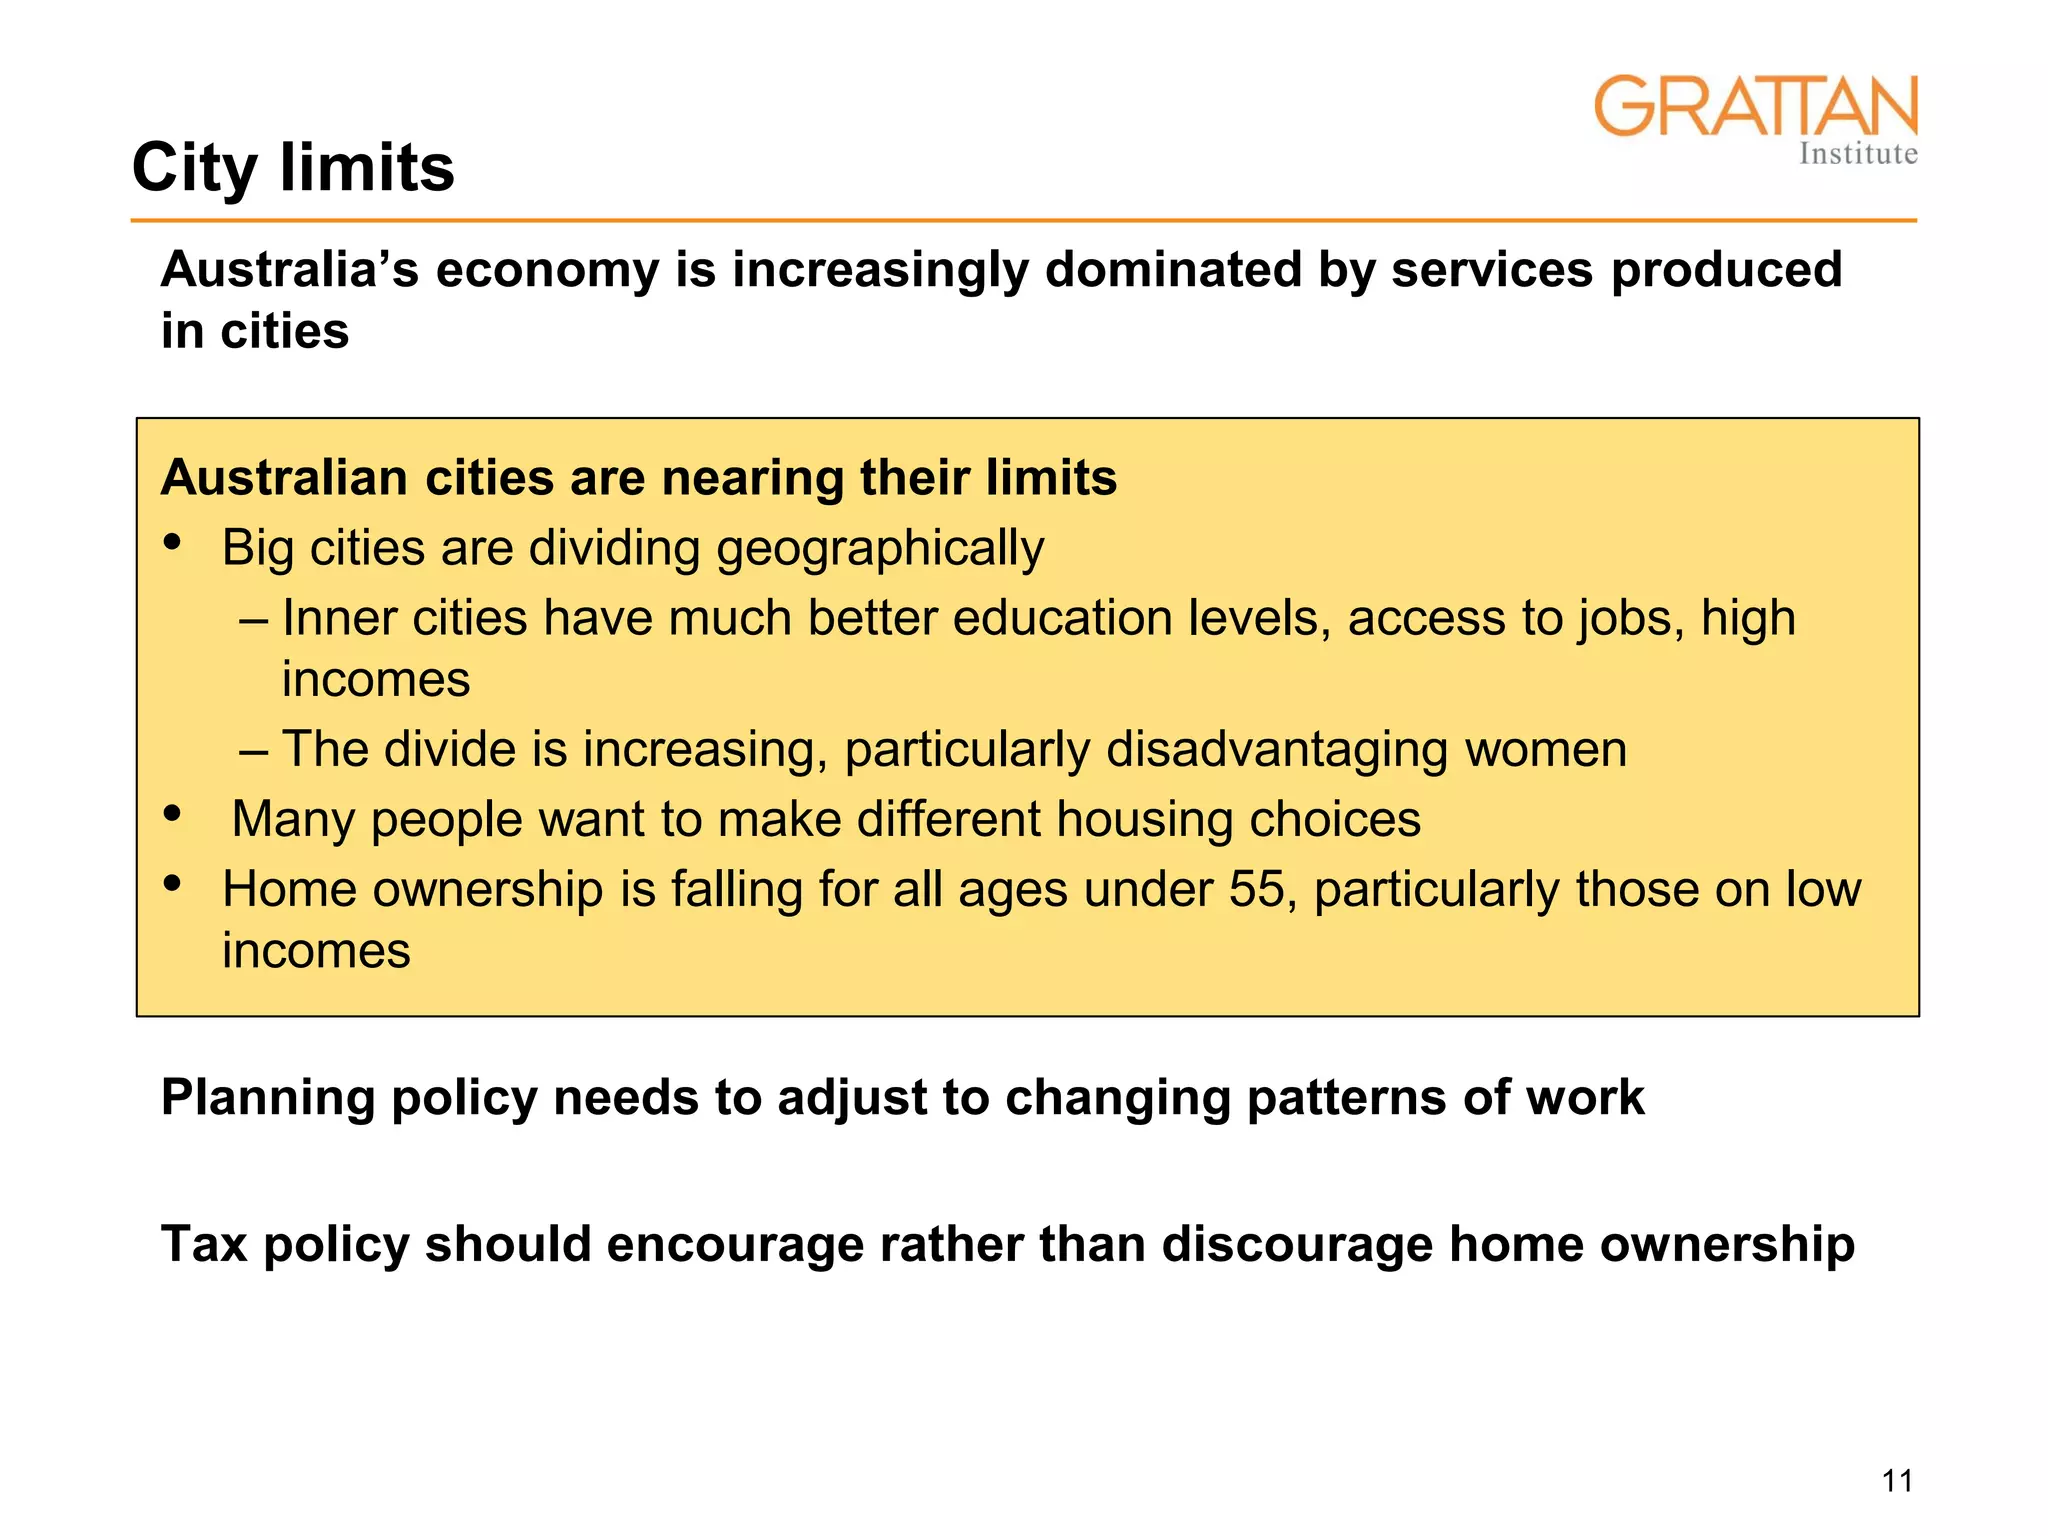
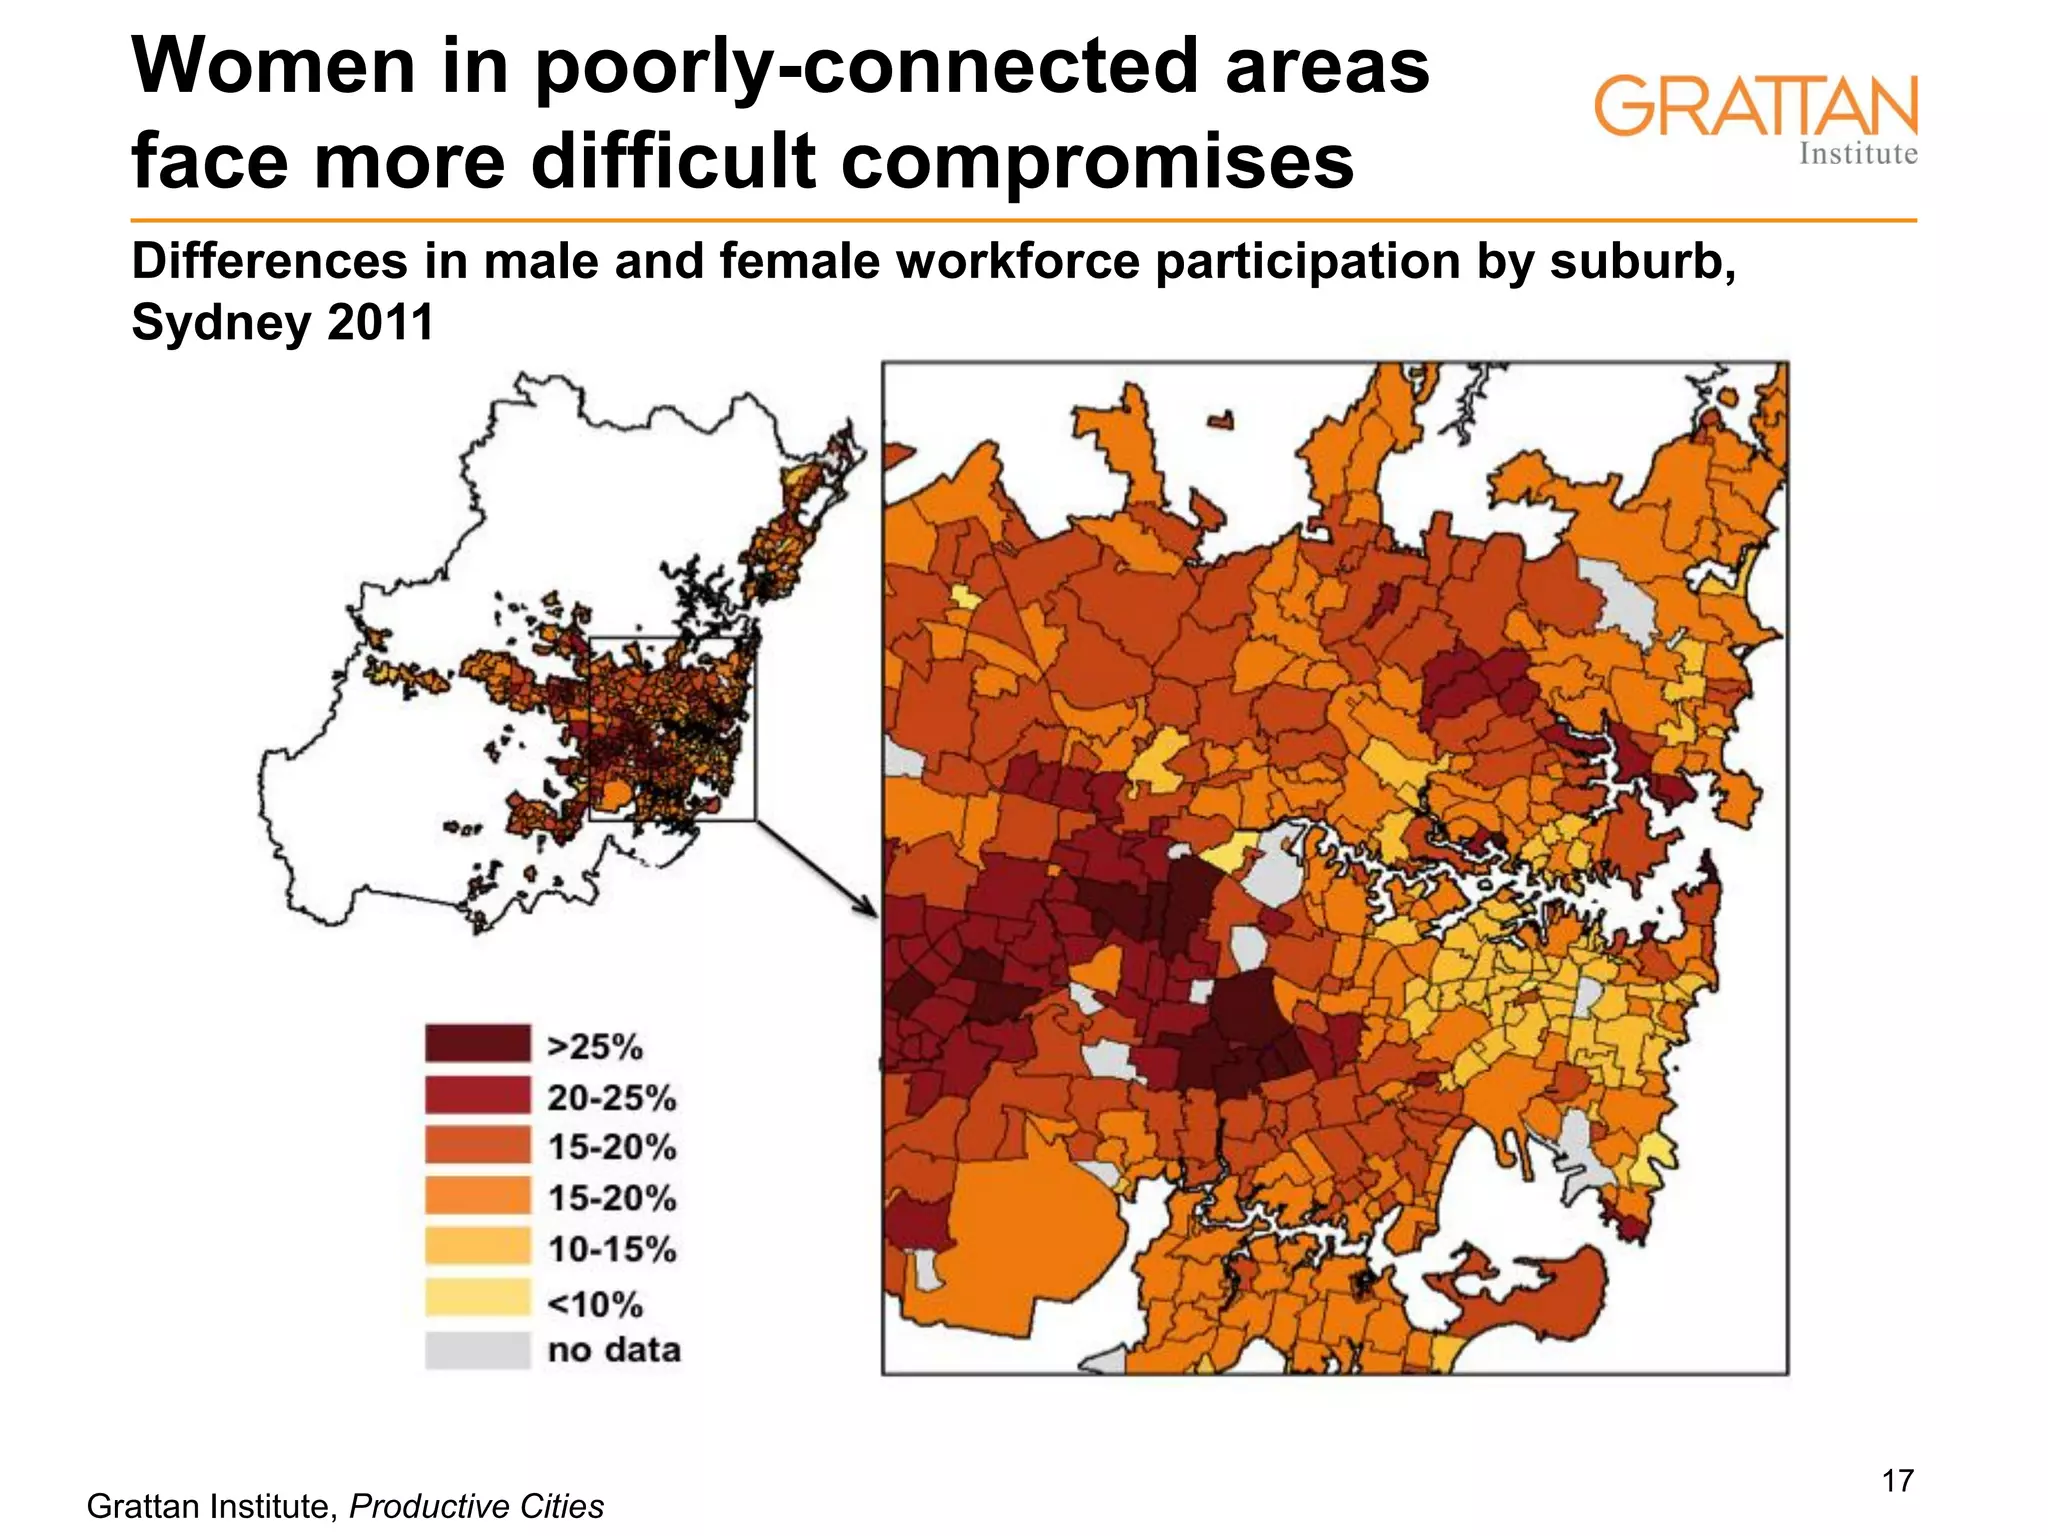
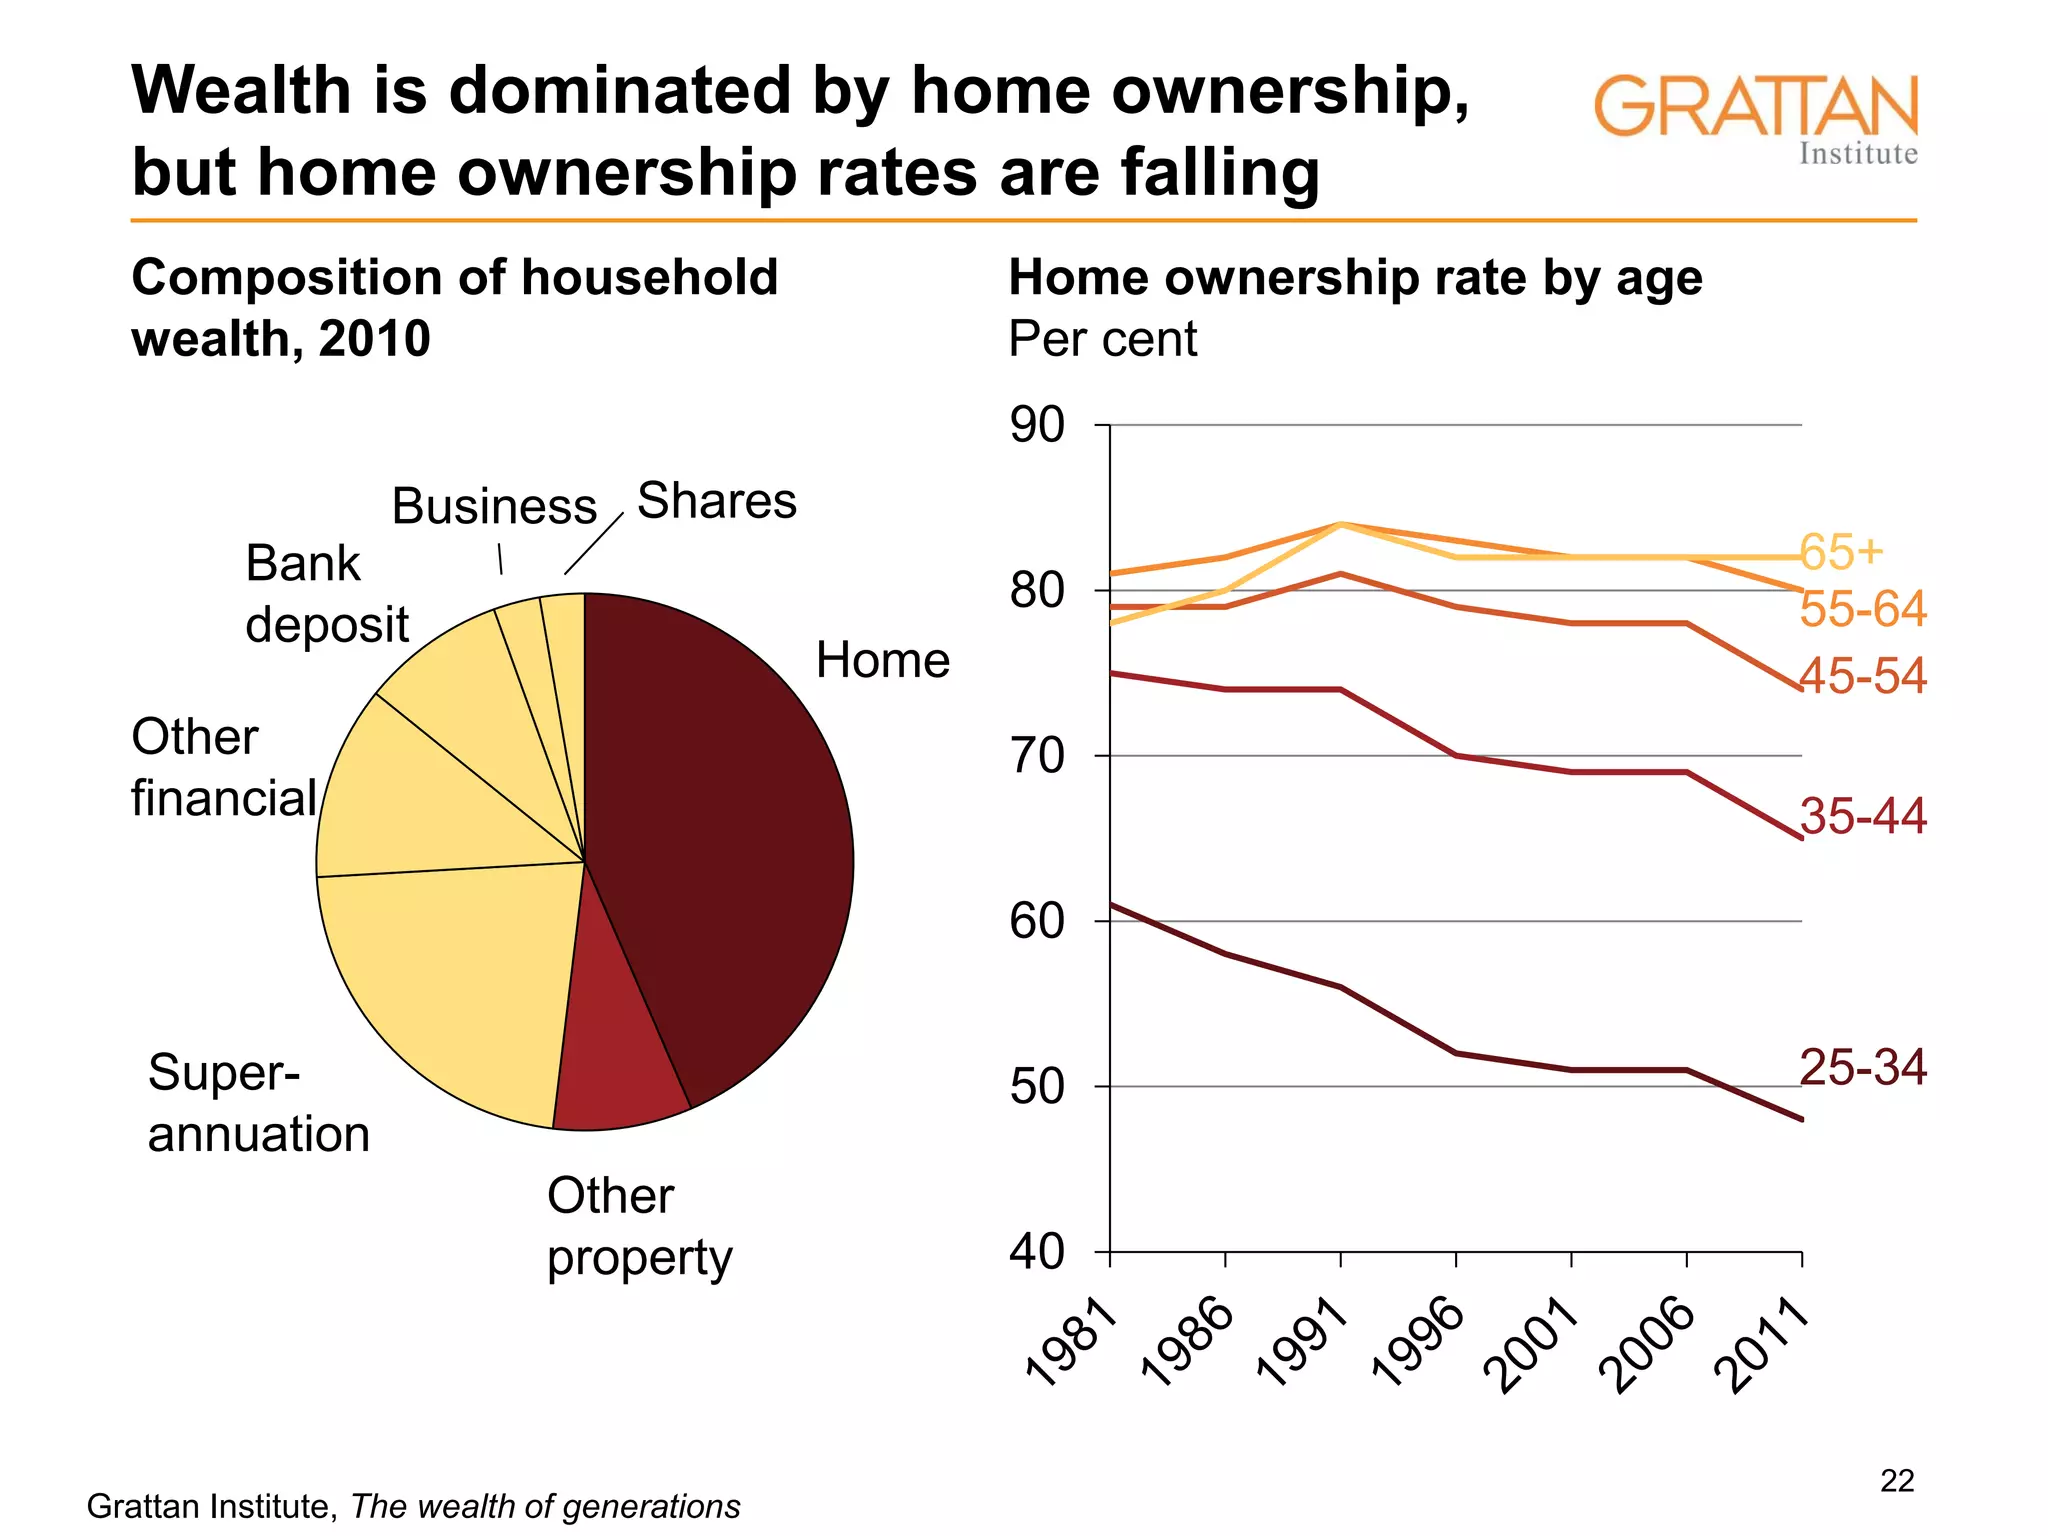
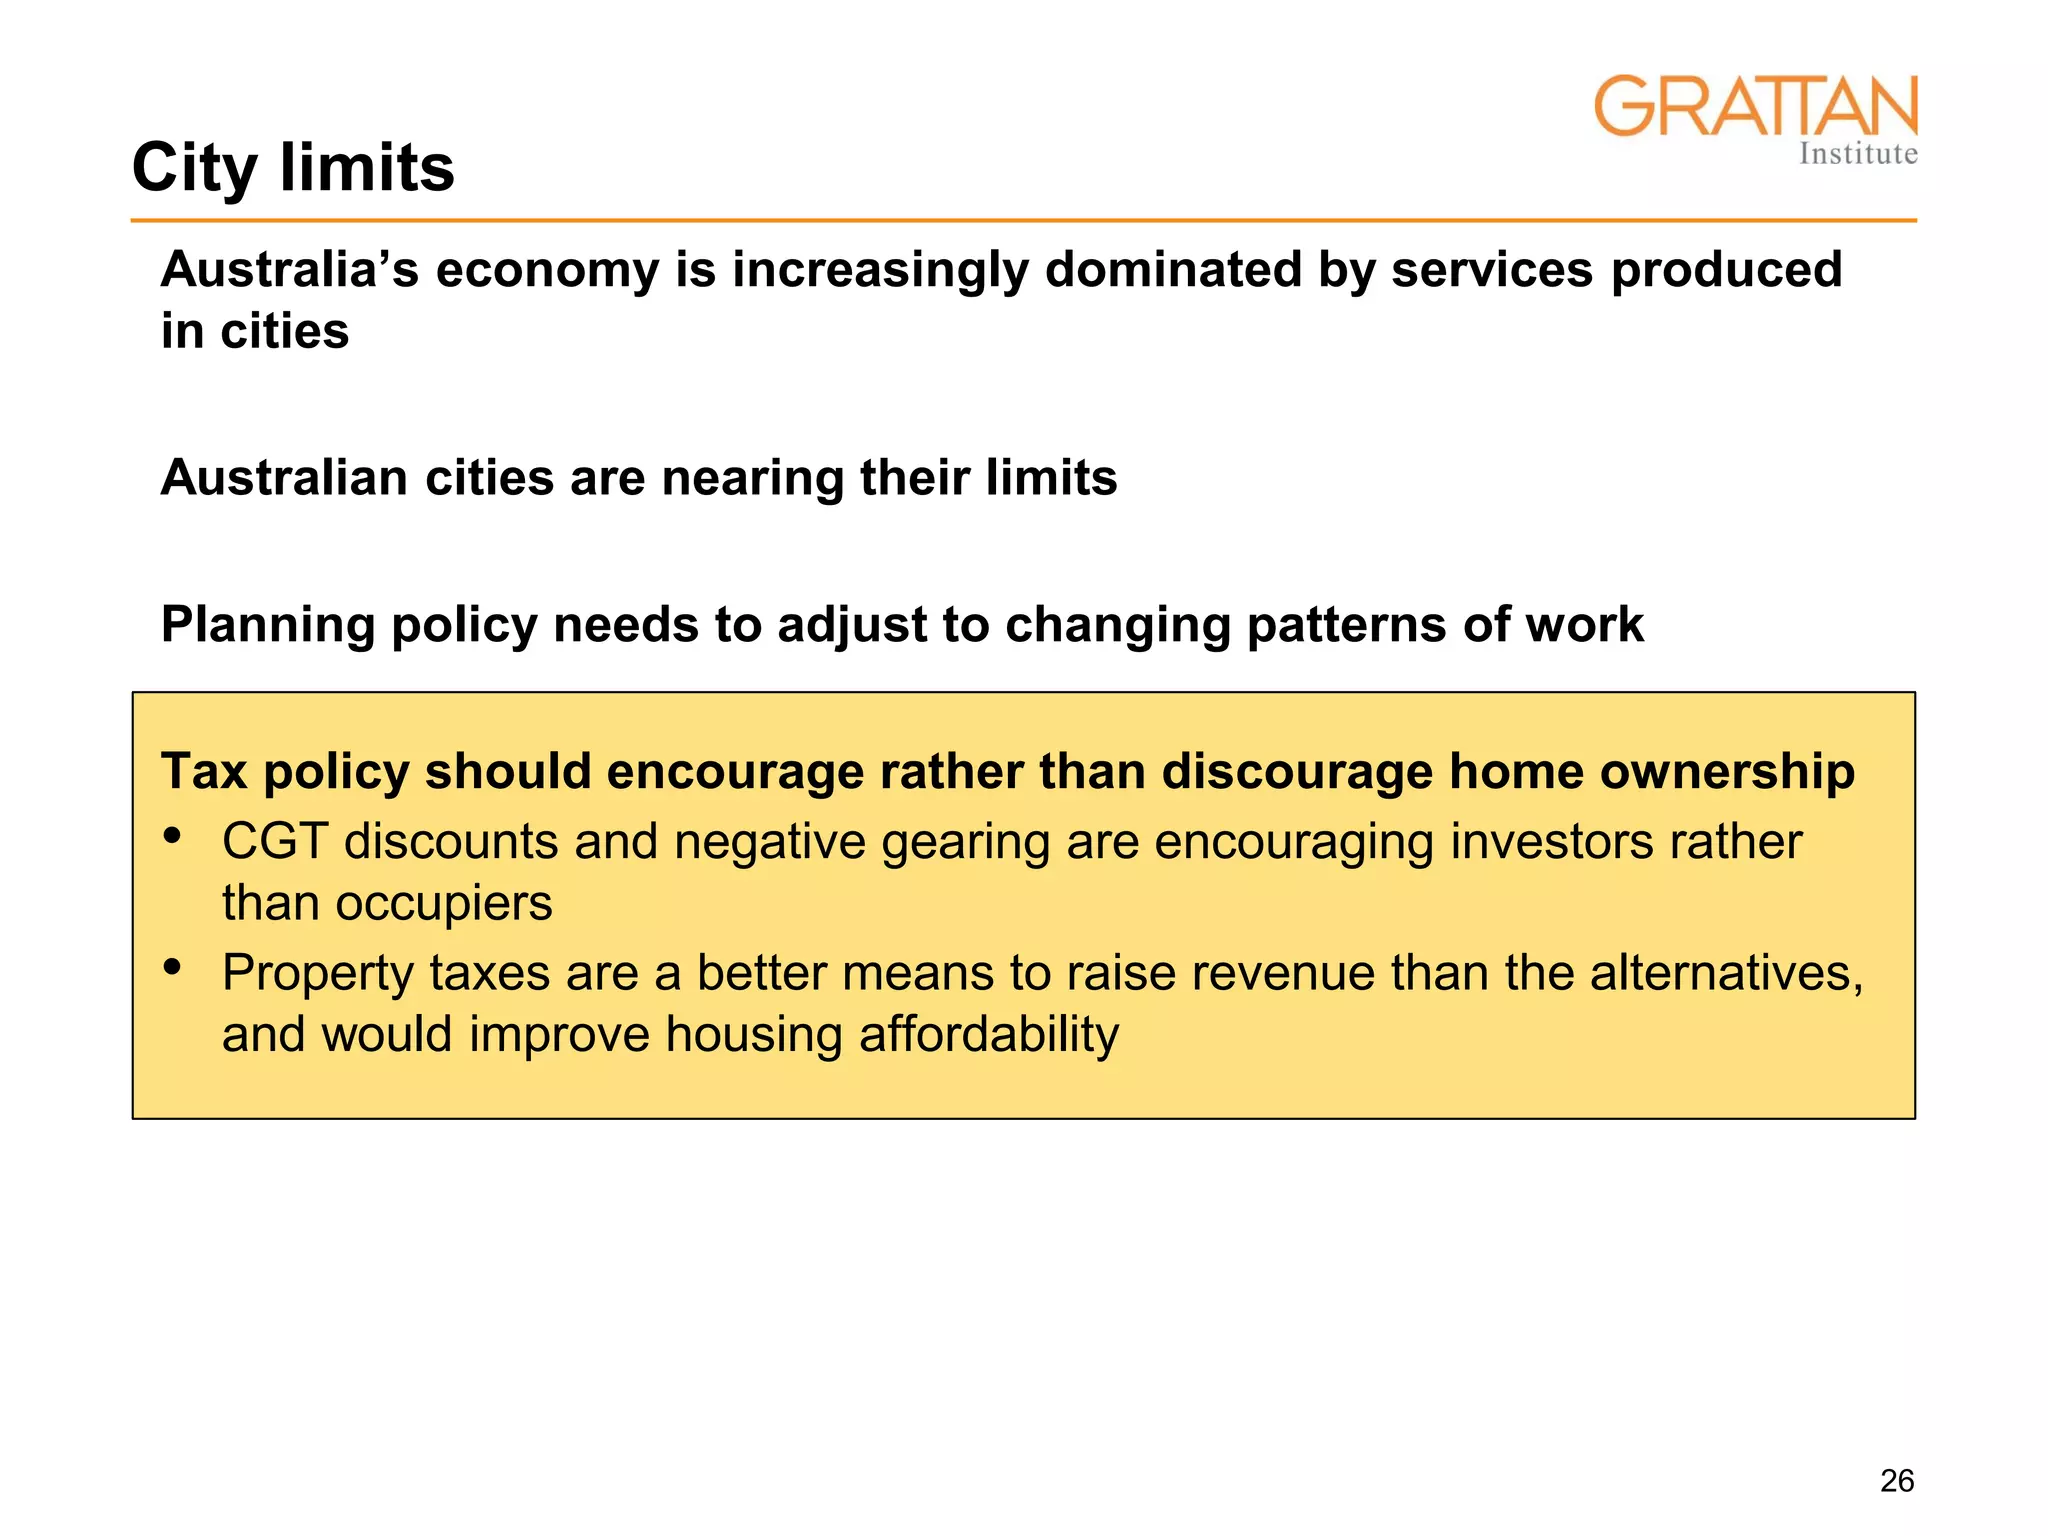
The document summarizes a presentation about challenges facing Australian cities. It notes that Australia's economy is increasingly dominated by services produced in major cities. While jobs are concentrating in city centers, new housing is primarily on the outskirts, leading cities to near their limits. Planning and tax policies need reforms to address changing work patterns and falling home ownership rates, especially among younger, lower income individuals.
Short-term economic effects of the Covid-19 outbreak. First insights on OECD ...OECD CFE
Presentation by Paolo Veneri, Head of Regional Analysis and Statistics UnitCFE, OECD at the 8th Spatial Productivity Lab meeting of the OECE Trento Centre, held in virtual format on 7 May 2020.
More info: https://oe.cd/SPL
Presentation to Auckland City Council on the living wage, Tuesday 25 July 2017.
See also video of interview with NewsHub (NZ Television) at https://studio.youtube.com/video/qQIbY920_aA/edit
Shout NFA Build To Save Report Launch 17 June 2015Tim Morton
Capital Economics presentation to launch Build To Save Report for SHOUT and National Federation of ALMOs.
The economic case for investing in social housing.
Build 100,000 social rent homes a year and reduce government deficit. Long Term Economic Plan.
ONS Regional Economic Forum presented the current state of the UK economy and presented data and analysis for your area at a local level.
We welcomed guest speakers from Teesside University, Darlington Economic Campus and Tees Valley Combined Authority.
Town Team Advisor North West for Portas Pilots and Association of Town & City Management, outline work to date and challenges facing many small towns in the North West.
Presentation to Commission for Territorial Cohesion Policy and EU Budget (COTER) Seminar "Overcoming Barriers to Economic Development - A Remote Island Perspective." Lerwick,, 9 September 2016
A presentation by Dave Hardy, Principal of Hardy Stevenson and Associates Limited at an event by Scarborough Business Association on February 8, 2017. It was about Scarborough's economy and how to build Scarborough into an economic powerhouse.
A recent presentation to the New South Wales Business Chamber by .id Economist Keenan Jackson, reviewing the region's recent economic performance and progress toward the regional plan.
South Australia currently is experiencing strong economic growth in mining, defence, industry sectors, construction, finance and insurance. This strong performance over the past eight years is due to employment being up by 14%, business investment up by 126% and retail sales up by 39%. Between 2001 and 2006, Adelaide lost 2900 professionals, which is double compared to 1996 – 2001. To keep Adelaide’s economy growing the government needs to create ways to attract the working age people and young people to stay and work in the city.
In the last decade, Australia's population has grown at almost unprecedented rates. While many of these people have settled in metropolitan areas, this growth has not filtered out into the cities of Regional New South Wales. In this presentation for the Evocities group, .id Economist Keenan Jackson looks at why 'access to Sydney' is still a big factor in where people choose to live, and the intervention required to attract people to these regional centres.
Mining’s legacy: thinking beyond the mine - Ian Satchwell, International Mini...Mining On Top
Mining’s legacy: thinking beyond the mine
Speaker: Ian Satchwell, Director, International Mining for Development Centre
Mining On Top: Africa - London Summit
24-26 June 2014 | London
The NSW Government is committed to maintaining a strong
economy, improving the quality of life for the people of NSW
and protecting the environment.
That’s why the NSW Government’s objective is to achieve net zero
emissions by 2050 by creating new jobs, cutting household costs and
attracting investment.
This Net Zero Plan Stage 1: 2020–2030 (Plan) sets out how the NSW
Government will deliver on these objectives over the next decade.
The Plan is focused on the next decade because rapid changes in
technology make identifying the lowest cost path to net zero difficult.
Plans for the second and third decades of the net zero path will be
developed in the lead-up to the 2030s and 2040s respectively.
The purpose of the Plan is to give NSW families and communities
confidence that the challenges posed by climate change can be
solved by improving – not eroding – their prosperity. It will also
send a clear message to local and international investors that New
South Wales is open for business when it comes to delivering on our
economic, social and environmental ambitions.
The Plan is financially supported by a Bilateral Memorandum of
Understanding on Energy and Emissions Reduction Policy between
the Commonwealth and NSW Governments (Bilateral).
The Plan is set out in four parts:
1. A global challenge with local opportunities – the trends and
opportunities arising from global climate change action
2. Progress and projections – progress within New South Wales
to date to reduce emissions and future projections
3. The net zero priorities – the NSW Government’s net zero
priorities
4. Keeping track – the Government’s approach to keeping track
of its progress.
These are the slides presented at the Economic Forum on 8 September 2022.
The ONS Regional Economic Forum will present the current state of the UK economy and present data and analysis for your area at a local level.
Presentations include:
Understanding the UK Economy.
Showcase exciting developments supporting the levelling up agenda and work on sub-national data.
Addressing the productivity puzzle: from ONS data to the Transformational Triangle.
Sustainability of Chinese cities: how does the urban growth model matter?Lynn Xu
It discusses the challenges of urban sustainable development in China through a deeper understanding of the prevalent property-led urban development pattern and the dynamic impacts of the real estate's sector on urban economic, environmental and social landscape in China. It also indicates the prospects of eco city campaign, which remains being largely affected/shaped by the property industry.
Big Issues In Australia's Property And Construction FutureMichael Skelton
Davis Langdon\'s - An AECOM Company - Australia and New Zealand Research Manager delivered the following presentation for the Property Council of Australia on the 15th October 2010, tackling the 'Big Issues in Australia's Property and Construction Future'
This deck supports the Auckland Conversation by Jeffrey Tumlin which is available to view online at: aucklandcouncil.govt.nz/conversations.
Jeff draws on his extensive experience in cities in North America and around the world with examples where communities have worked together to get the balance between movement and place right, delivering complete streets as parts of complete communities and drawing lessons for New Zealand along the way.
Richard and Simon discuss their experience of delivering innovative wayfinding projects, shedding light on how lessons learned can be applied to Auckland. They also apply some of their techniques to give a flavour of what a Walk Auckland project could and should achieve.
http://aucklandcouncil.govt.nz/conversations
Metro mag editor Simon Wilson and curator Mary Jane Jacob address the debate surrounding public art and what it means for becoming the world’s most liveable city. View the entire event online at aucklandcouncil.govt.nz/conversations
Mary Jane Jacob is a pioneer in the areas of public, site-specific and socially engaged art. A professor at the School of the Art Institute of Chicago, Mary Jane has held posts at Chief Curator at the Museum of Contemporary Art, Los Angeles and at the Museum of Contemporary Art, Chicago. In 2012 she was awarded the Curatorial Research Fellowship from the Andy Warhol Foundation, to support her investigation of the history of site-specific art from 1900’s to today. Through hundreds exhibitions, site-specific and community-based projects, and public programs, Mary Jane has worked with artists to expand the practice and public discourse on art as a shared process. Professor Jacob is also the author and editor of many key texts including Conversations at the Castle: Changing Audiences and Contemporary Art (1996) and Culture in Action: New Public Art in Chicago (1993).
Sharpen existing tools or get a new toolbox? Contemporary cluster initiatives...Orkestra
UIIN Conference, Madrid, 27-29 May 2024
James Wilson, Orkestra and Deusto Business School
Emily Wise, Lund University
Madeline Smith, The Glasgow School of Art
Have you ever wondered how search works while visiting an e-commerce site, internal website, or searching through other types of online resources? Look no further than this informative session on the ways that taxonomies help end-users navigate the internet! Hear from taxonomists and other information professionals who have first-hand experience creating and working with taxonomies that aid in navigation, search, and discovery across a range of disciplines.
Acorn Recovery: Restore IT infra within minutesIP ServerOne
Introducing Acorn Recovery as a Service, a simple, fast, and secure managed disaster recovery (DRaaS) by IP ServerOne. A DR solution that helps restore your IT infra within minutes.
This presentation by Morris Kleiner (University of Minnesota), was made during the discussion “Competition and Regulation in Professions and Occupations” held at the Working Party No. 2 on Competition and Regulation on 10 June 2024. More papers and presentations on the topic can be found out at oe.cd/crps.
This presentation was uploaded with the author’s consent.
0x01 - Newton's Third Law: Static vs. Dynamic AbusersOWASP Beja
f you offer a service on the web, odds are that someone will abuse it. Be it an API, a SaaS, a PaaS, or even a static website, someone somewhere will try to figure out a way to use it to their own needs. In this talk we'll compare measures that are effective against static attackers and how to battle a dynamic attacker who adapts to your counter-measures.
About the Speaker
===============
Diogo Sousa, Engineering Manager @ Canonical
An opinionated individual with an interest in cryptography and its intersection with secure software development.
Obesity causes and management and associated medical conditions
City Limits: The Urbanisation Challenge
1. City Limits:
Urban economic development
and its policy implications
John Daley, CEO, Grattan Institute
Presentation to Auckland Conversations
1 September 2015
2. 2
City limits
Australia’s economy is increasingly dominated by services produced
in cities
Australian cities are nearing their limits
Planning policy needs to adjust to changing patterns of work
Tax policy should encourage rather than discourage home ownership
3. 3
City limits
Australia’s economy is increasingly dominated by services produced
in cities
• Services are growing much faster than other sectors
• Big cities now dominate the economy
• More jobs are concentrated in the centre of big cities, while new housing
is primarily at the edge
Australian cities are nearing their limits
Planning policy needs to adjust to changing patterns of work
Tax policy should encourage rather than discourage home ownership
4. 4
0
20
40
60
80
1960 1965 1970 1975 1980 1985 1990 1995 2000 2005 2010
Goods
Services
Source: ABS5206 table 8
Notes: Excludes “rents and dwelling costs” and “other goods and services”. Based on seasonally adjusted current prices data
People are consuming more services
Share of total nominal household expenditure
5. 5
0
10
20
30
40
50
60
70
80
90
1890 1921 1934 1947 1960 1973 1986 1999 2012
Mining
Construction
Manufacturing
Services
Agriculture
Sources:
1. 1890-1980 Australian Historical Statistics: Labour Statistics, by G.Withers, T.Endes, L.Perry
2. 1984-2012: ABS6291.0.44.003, table 4
Note: 1981-1983 are interpolated using 1980 and 1984 data
Consequently, more people are working in
services
Per cent of workforce, Australia
6. 6
0
5
10
15
20
25
30
35
40
45
50
1970 1980 1990 2000 2010
0
5
10
15
20
25
30
35
40
45
50
1970 1980 1990 2000 2010 1970 1980 1990 2000 20101970 1980 1990 2000 2010
Manufacturing has steadily declined in
Australia, “leading” international trends
Per cent GDP
Median
90th percentile
Australia
10th
percentile
Median
90th percentile
Australia
10th percentile
Export volumeValue-added (current prices)
Grattan Institute, The mining boom
7. 7
0
10
20
30
40
50
60
70
80
90
100
$bn
Australia’s economy is dominated by its big
cities
Australian economic activity, 2011-12
Per cent of State total
NSW Vic Qld WA SA Other
Sydney Melbourne Brisbane Perth
Adelaide
0 100 200 300 400 500 600 700 800 900 1000 1100 1200
SE Qld
Grattan Institute, Mapping Australia’s economy
8. 8
Some context: Auckland is a mid-size
“Australasian city
Population, millions
Infrastructure Australia, Australian Infrastructure Audit, Auckland City Council, Unitary Plan
0
1
2
3
4
5
6
7
Sydney Melbourne Brisbane Perth Adelaide Auckland
2015
2031 (estimate)
9. 9
Economic activity is most intense
in inner cities
Economic activity by location, 2011-12, Melbourne
CBD:
$39.1b
Southbank:
$6.5b
Docklands:
$8.2b
Dandenong:
$5.9b
kilometres
0 10
Height of bar
indicates total
economic activity
Bar not shown for
economic activity
less than $1 billion
Grattan Institute, Mapping Australia’s Economy
Height of bar
indicates total
economic
activity
Bar not shown
for economic
activity less
than $1 billion
10. 10
Parramatta:
$68
Macquarie Park: $81
North Sydney:
$91
CBD: $100
Airport: $65
kilometres
0 10
>$90
$80-90
$70-80
$60-70
$50-60
$40-50
<$40
Insufficient data
Economic output per hour is highest
towards the centre
Economic activity per working hour, 2011-12, Sydney
Grattan Institute, Mapping Australia’s Economy
11. 11
City limits
Australia’s economy is increasingly dominated by services produced
in cities
Australian cities are nearing their limits
• Big cities are dividing geographically
– Inner cities have much better education levels, access to jobs, high
incomes
– The divide is increasing, particularly disadvantaging women
• Many people want to make different housing choices
• Home ownership is falling for all ages under 55, particularly those on low
incomes
Planning policy needs to adjust to changing patterns of work
Tax policy should encourage rather than discourage home ownership
12. 12
0
10
20
30
40
50
60
70
0-10 km from
CBDs
10-20 km
from CBDs
20+ km from
CBDs
Most new jobs are towards the centre, while
most new homes are on the edge
Jobs per resident, 5 largest Australian
cities, 2011
0.0
0.2
0.4
0.6
0.8
1.0
0-10km 10-20km 20+km
Employment and population growth,
5 largest Australian cities, 2006-11
Distance from CBD
Net employment growth
Net population growth
Distance from CBD
%
Grattan Institute, City Limits
13. 13
Inner suburbs have much high levels of
tertiary education
Tertiary education levels by suburb, Brisbane 2011
Grattan Institute, Productive Cities
14. 14
Most Brisbane residents have good access
to jobs by car …
Percentage of Brisbane jobs that can be reached in 45 minutes by car
Grattan Institute, Mapping Australia’s Economy
15. 15
… but Sydney shows how there can be real
problems
Percentage of jobs that can be reached in 45 minutes by car
Grattan Institute, Mapping Australia’s Economy
16. 16
… and public transport leaves many of
Melbourne’s outer suburbs under-served
Percentage of Melbourne jobs that can be reached in 60 minutes by
public transport
>50
40-50
30-40
20-30
10-20
<10
Airport
CBD
Dandenong
kilometres
0 10
Grattan Institute, Mapping Australia’s Economy
Residents living in
the darkest shaded
suburbs can reach
more than half the
jobs within a 60
minute public
transport trip. In
the lightest shaded
areas, residents
can access fewer
than one in ten of
those jobs
>50
40-50
30-40
20-30
10-20
<10
Airport
CBD
Dandenong
kilometres
0 10
17. 17
Differences in male and female workforce participation by suburb,
Sydney 2011
Grattan Institute, Productive Cities
Women in poorly-connected areas
face more difficult compromises
18. 18
Grattan Institute, Productive Cities
Poor access to job leads to poor
social outcomes
Percentage of disaffected youth, Perth, 2011
19. 19
The divide between people and jobs has big
consequences
In outer suburbs people earn lower incomes on average, and are more likely to
be employed on casual basis.
Harder for women caring for children in outer areas to participate in the
workforce.
Longer commutes result in:
• Higher living costs of thousands of dollars a year
• Pressure on family life
• Lower well-being
20. 20
1
2
3
4
Many people want to trade off location
against price and dwelling type
Inner
Inner-Middle
Outer-Middle
Outer
TOTAL
Detached
9%
9%
12%
10%
41%
Semi-
detached
4%
7%
7%
6%
25%
Up to 3
storeys
2%
4%
4%
5%
15%
4
storeys
& above
5%
5%
6%
4%
20%
TOTA
L
20%
26%
30%
25%
100%
Desired trade-offs between location and house type - Sydney
Grattan Institute, The housing we’d choose
21. 21
1
2
3
4
4 – ‘Outer’ Zone
Shortages of:
• c.60k semi-detached dwellings
• c.60k apartments in buildings up to 3 storeys
• c.60k apartments in 4 storey + buildings
2 – ‘Inner-Middle’ Zone
Shortages of:
• c.80k semi-detached dwellings
• c.80k apartments in 4 storey + buildings
3 – ‘Outer-Middle’ Zone
Shortages of:
• c.80k semi-detached dwellings
• c.80k apartments in 4 storey + buildings
The market is supplying less medium
density than people want
Comparison between preferences and availability - Sydney
Grattan Institute, The housing we’d choose
22. 22
Composition of household
wealth, 2010
40
50
60
70
80
90
Home ownership rate by age
Per cent
Home
Wealth is dominated by home ownership,
but home ownership rates are falling
Super-
annuation
Other
financial
Bank
deposit
Business Shares
Other
property
25-34
35-44
45-54
65+
55-64
Grattan Institute, The wealth of generations
24. 24
City limits
Australia’s economy is increasingly dominated by services produced
in cities
Australian cities are nearing their limits
Planning policy needs to adjust to changing patterns of work
• Planning policy results in developers failing to build people the housing
they want.
• Planning policy is economic policy: middle ring medium density
development is probably the largest single lever for both economic
growth and social equality
• Residential tenancy policy needs to adjust to lower rates of home
ownership
Tax policy should encourage rather than discourage home ownership
25. 25
Renting closer to jobs is a worse option
than owning in Australia
International comparison of rental conditions
Notice period for
landlords
Reasons lease
can be terminated
Typical lease term
Pet ownership
Minor alterations
(hanging pictures,
laying carpet, painting)
Indefinite 6-12 months2-3 years
Non-payment/misconduct only Any reason with noticeLandlord selling/moving in
Tenant entitlement Only with landlord’s
consent
Subject to restrictions
Permitted – considered normal use Only with landlord’s consent
3 months or more 30 days2 months
Grattan Institute, Renovating housing policy
26. 26
City limits
Australia’s economy is increasingly dominated by services produced
in cities
Australian cities are nearing their limits
Planning policy needs to adjust to changing patterns of work
Tax policy should encourage rather than discourage home ownership
• CGT discounts and negative gearing are encouraging investors rather
than occupiers
• Property taxes are a better means to raise revenue than the alternatives,
and would improve housing affordability
27. 27
-12
-10
-8
-6
-4
-2
0
2
1989 1991 1993 1995 1997 1999 2001 2003 2005 2007 2009 2011
Total net rent $ 2013-14 ($bn)
Source: Grattan Institute analysis of ATO Taxation Statistics 2012-13.
CGT discount
introduced
Collective losses became large after the
CGT discount was introduced
28. 28
Financial year ending
Source: Grattan Institute analysis of ATO Taxation Statistics 2012-13.
Number of people Average net rental loss $2014
Number of people
negatively gearing
residential property
(LHS)
Average loss
(RHS)
More landlords are negatively gearing and
average losses are growing
0
2000
4000
6000
8000
10000
12000
14000
0
200,000
400,000
600,000
800,000
1,000,000
1,200,000
1,400,000
1994
1996
1998
2000
2002
2004
2006
2008
2010
2012
29. 29
Limiting negative gearing in the 1980s did
not appear to increase rents outside Sydney
-6
-4
-2
0
2
4
6
8
10
1983 1984 1985 1986 1987 1988 1989
Sydney
Melbourne
Brisbane
Adelaide
Perth
No negative gearing
Source: ABS, Consumer price index, cat. no. 6401.0, table 12; see also Greg Jericho, Negative gearing: a legal tax rort for rich
investors that reduces housing affordability, The Guardian, 19 March 2015.
Real change in rents, percentage change from year earlier
30. 30
0%
1%
2%
3%
4%
Source: OECD (2014), Revenue statistics, updating Grattan Institute, Property taxes
Property
taxes
Taxes on property and transactions, per cent of GDP
Transactio
n taxes
Australia has lower property tax revenues
than some comparable countries
31. 31
• Australia’s economy is more knowledge-intensive than ever
• City centres are vital for knowledge-intensive activity and economic
growth
• Our cities have not adjusted well to these changes in the economy
• This is bad for the economy and bad for opportunity
• Housing, transport, and tax policies can support or hinder access to
jobs, and choice for both employers and employees
Conclusions
32. 32
City limits
Australia’s economy is increasingly dominated by services produced in cities
• Services are growing much faster than other sectors
• Big cities now dominate the economy
• More jobs are concentrated in the centre of big cities, while new housing is
primarily at the edge
Australian cities are nearing their limits
• Big cities are dividing geographically
– Inner cities have much better education levels, access to jobs, high incomes
– The divide is increasing, particularly disadvantaging women
• Many people want to make different housing choices
• Home ownership is falling for all ages under 55, particularly those on low incomes
Planning policy needs to adjust to changing patterns of work
• Planning policy results in developers failing to give people the housing they want.
• Planning policy is economic policy: middle ring medium density development is
probably the largest single lever for both economic growth and social equality
Tax policy should encourage rather than discourage home ownership
• CGT discounts and negative gearing are encouraging investors rather than
occupiers
• Property taxes are a better means to raise revenue than the alternatives