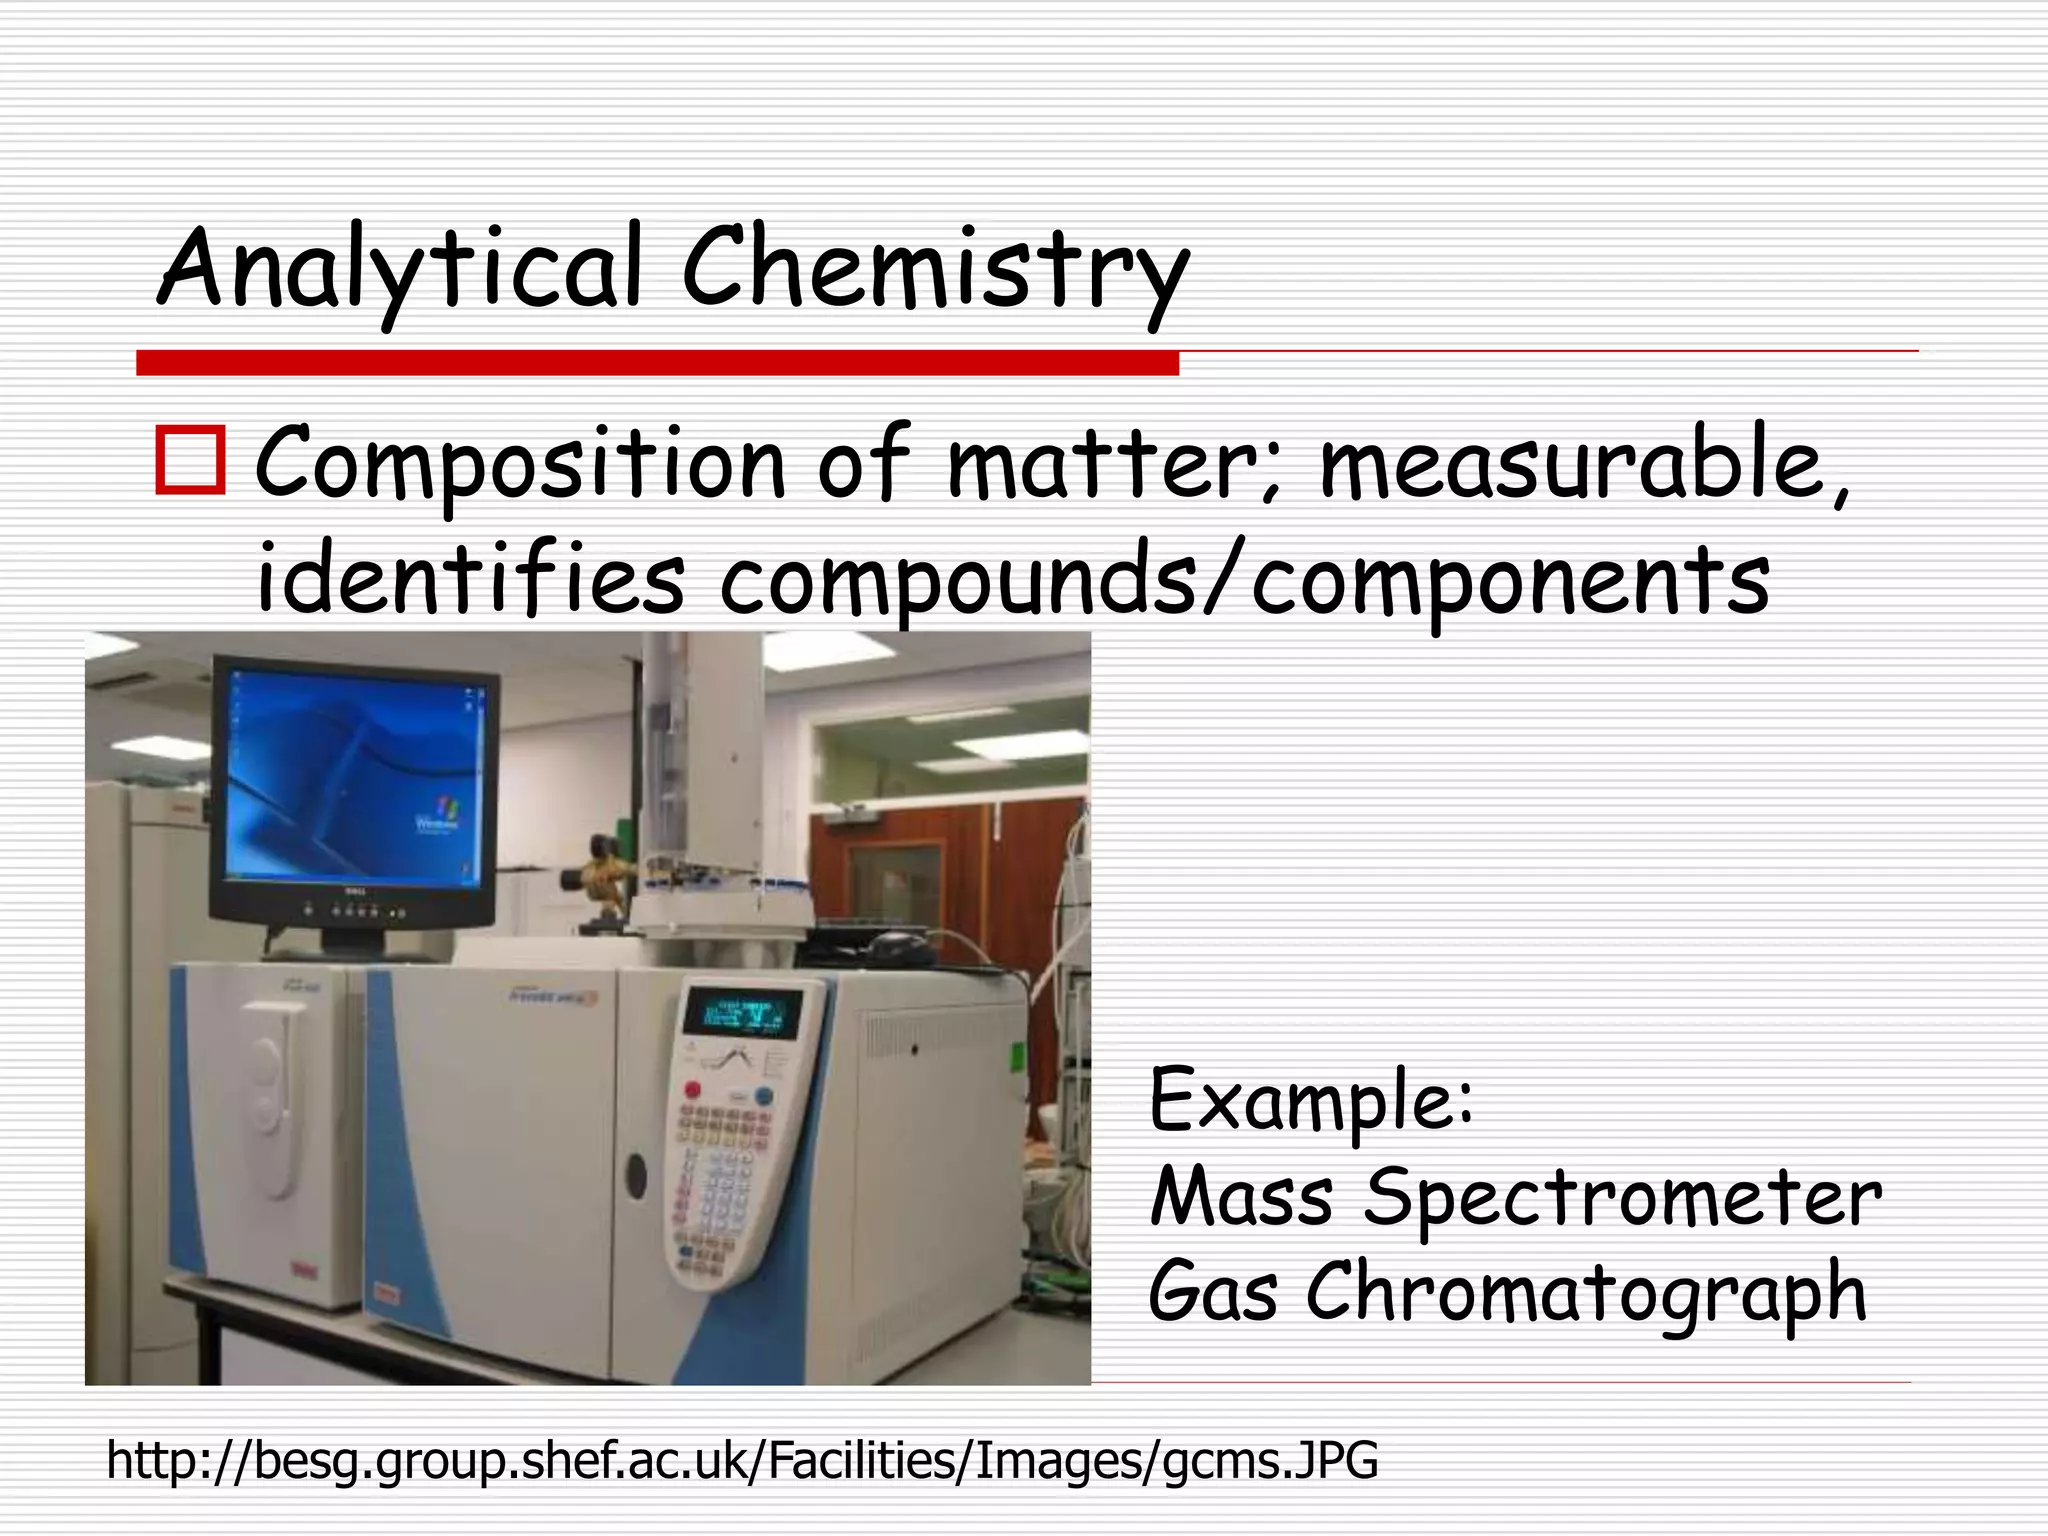
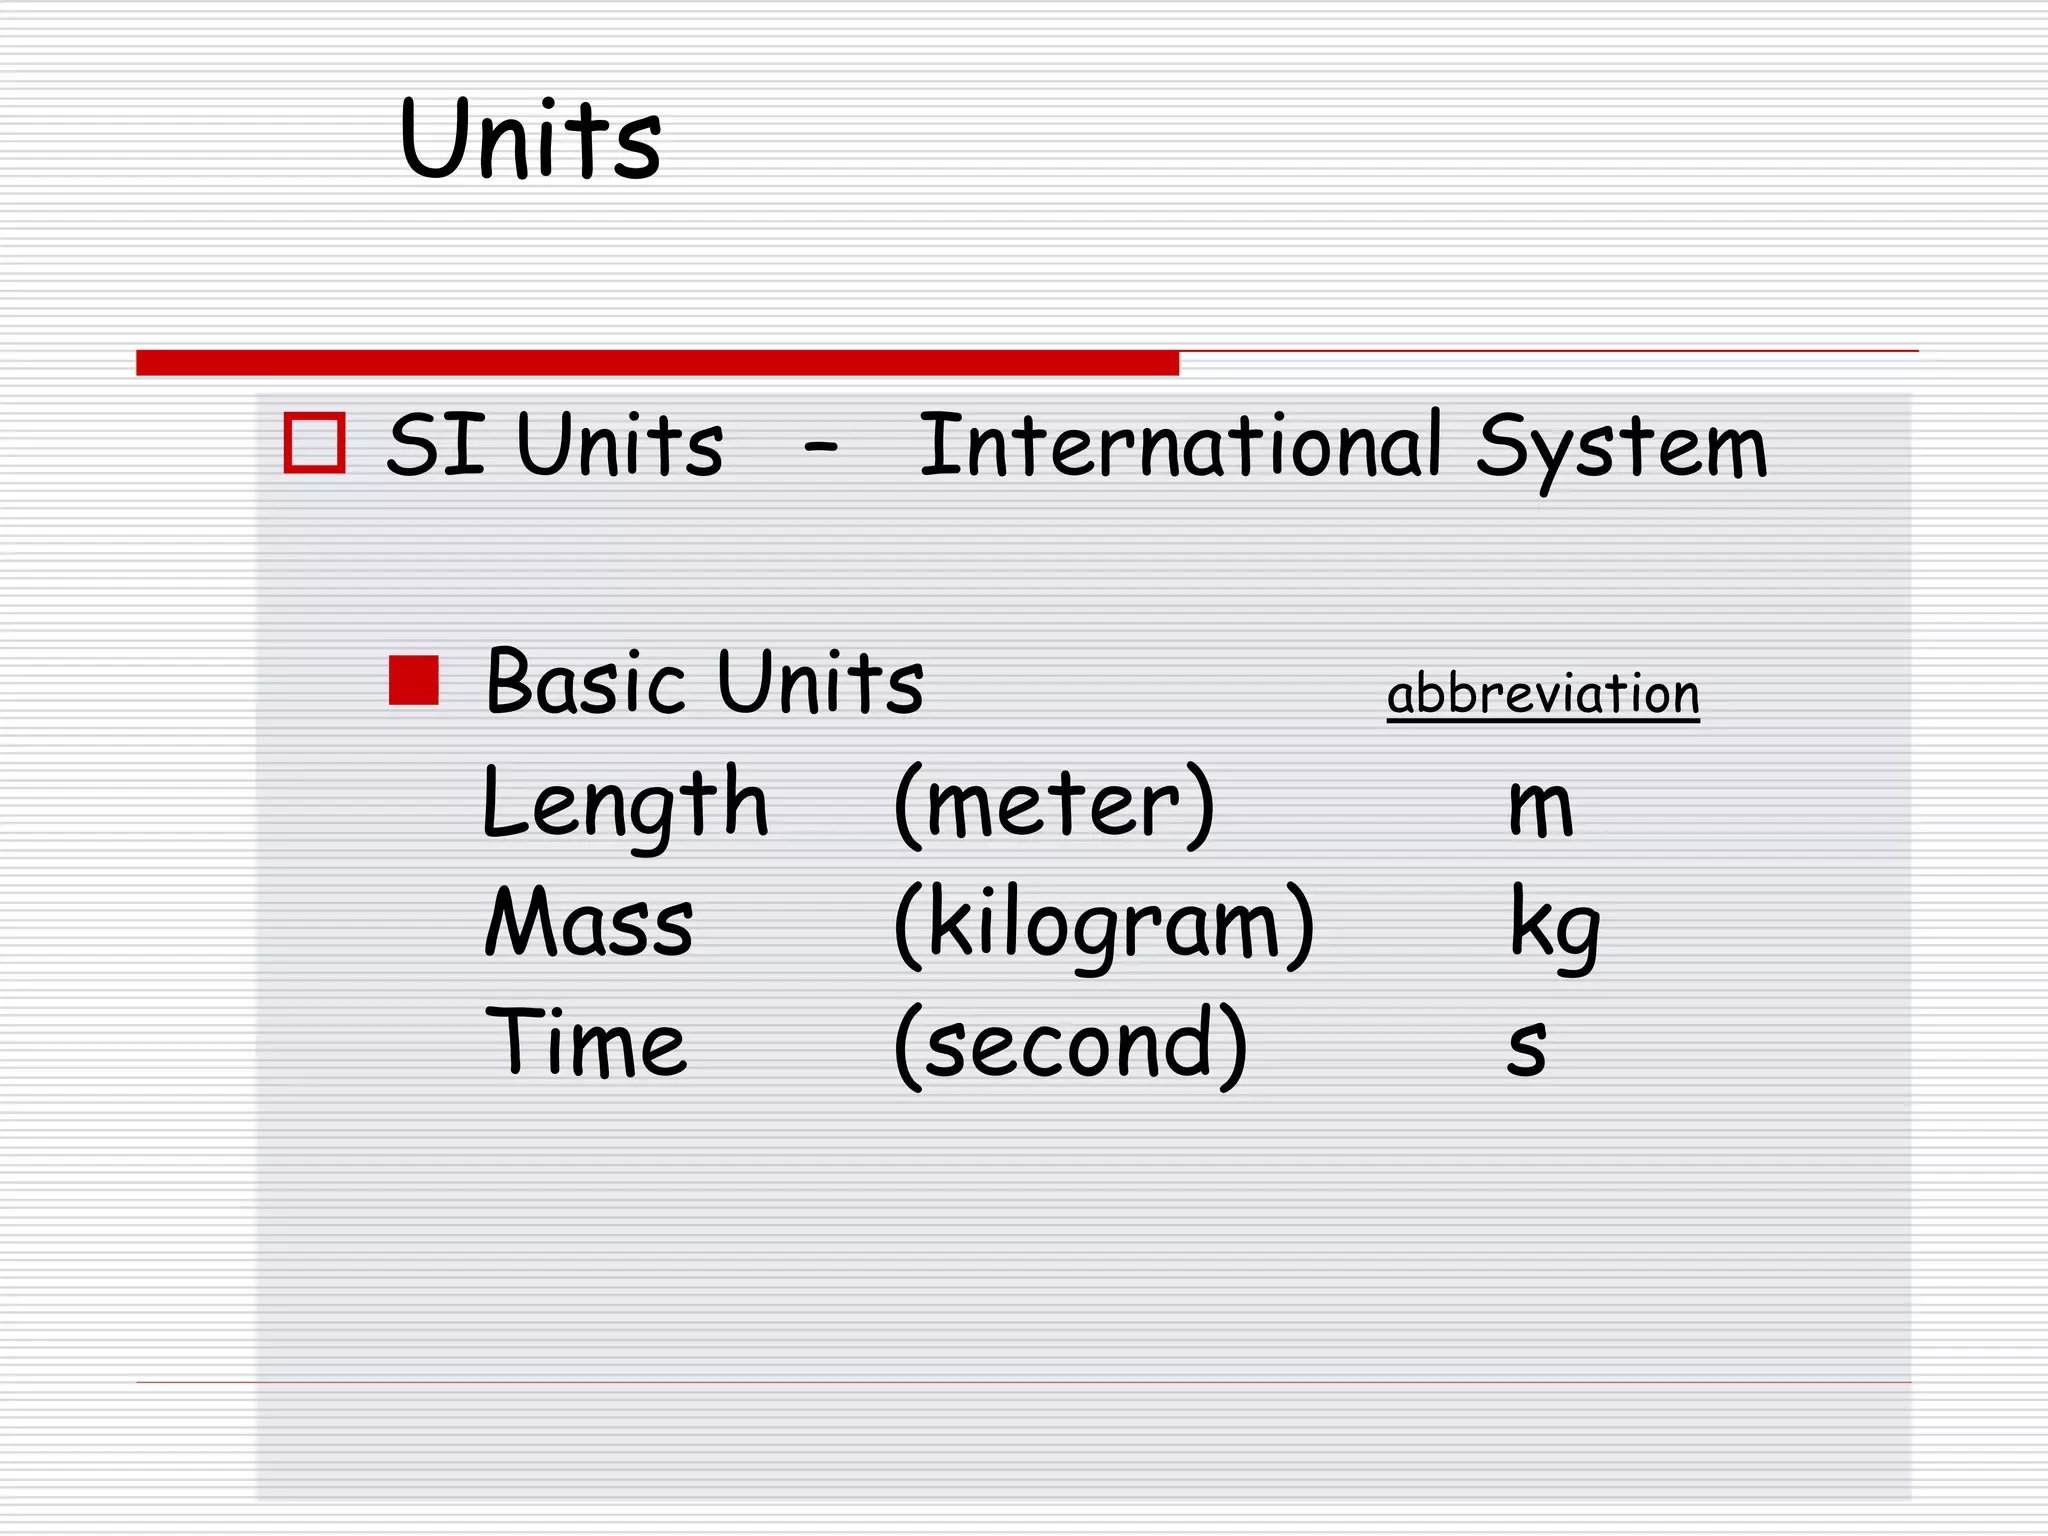
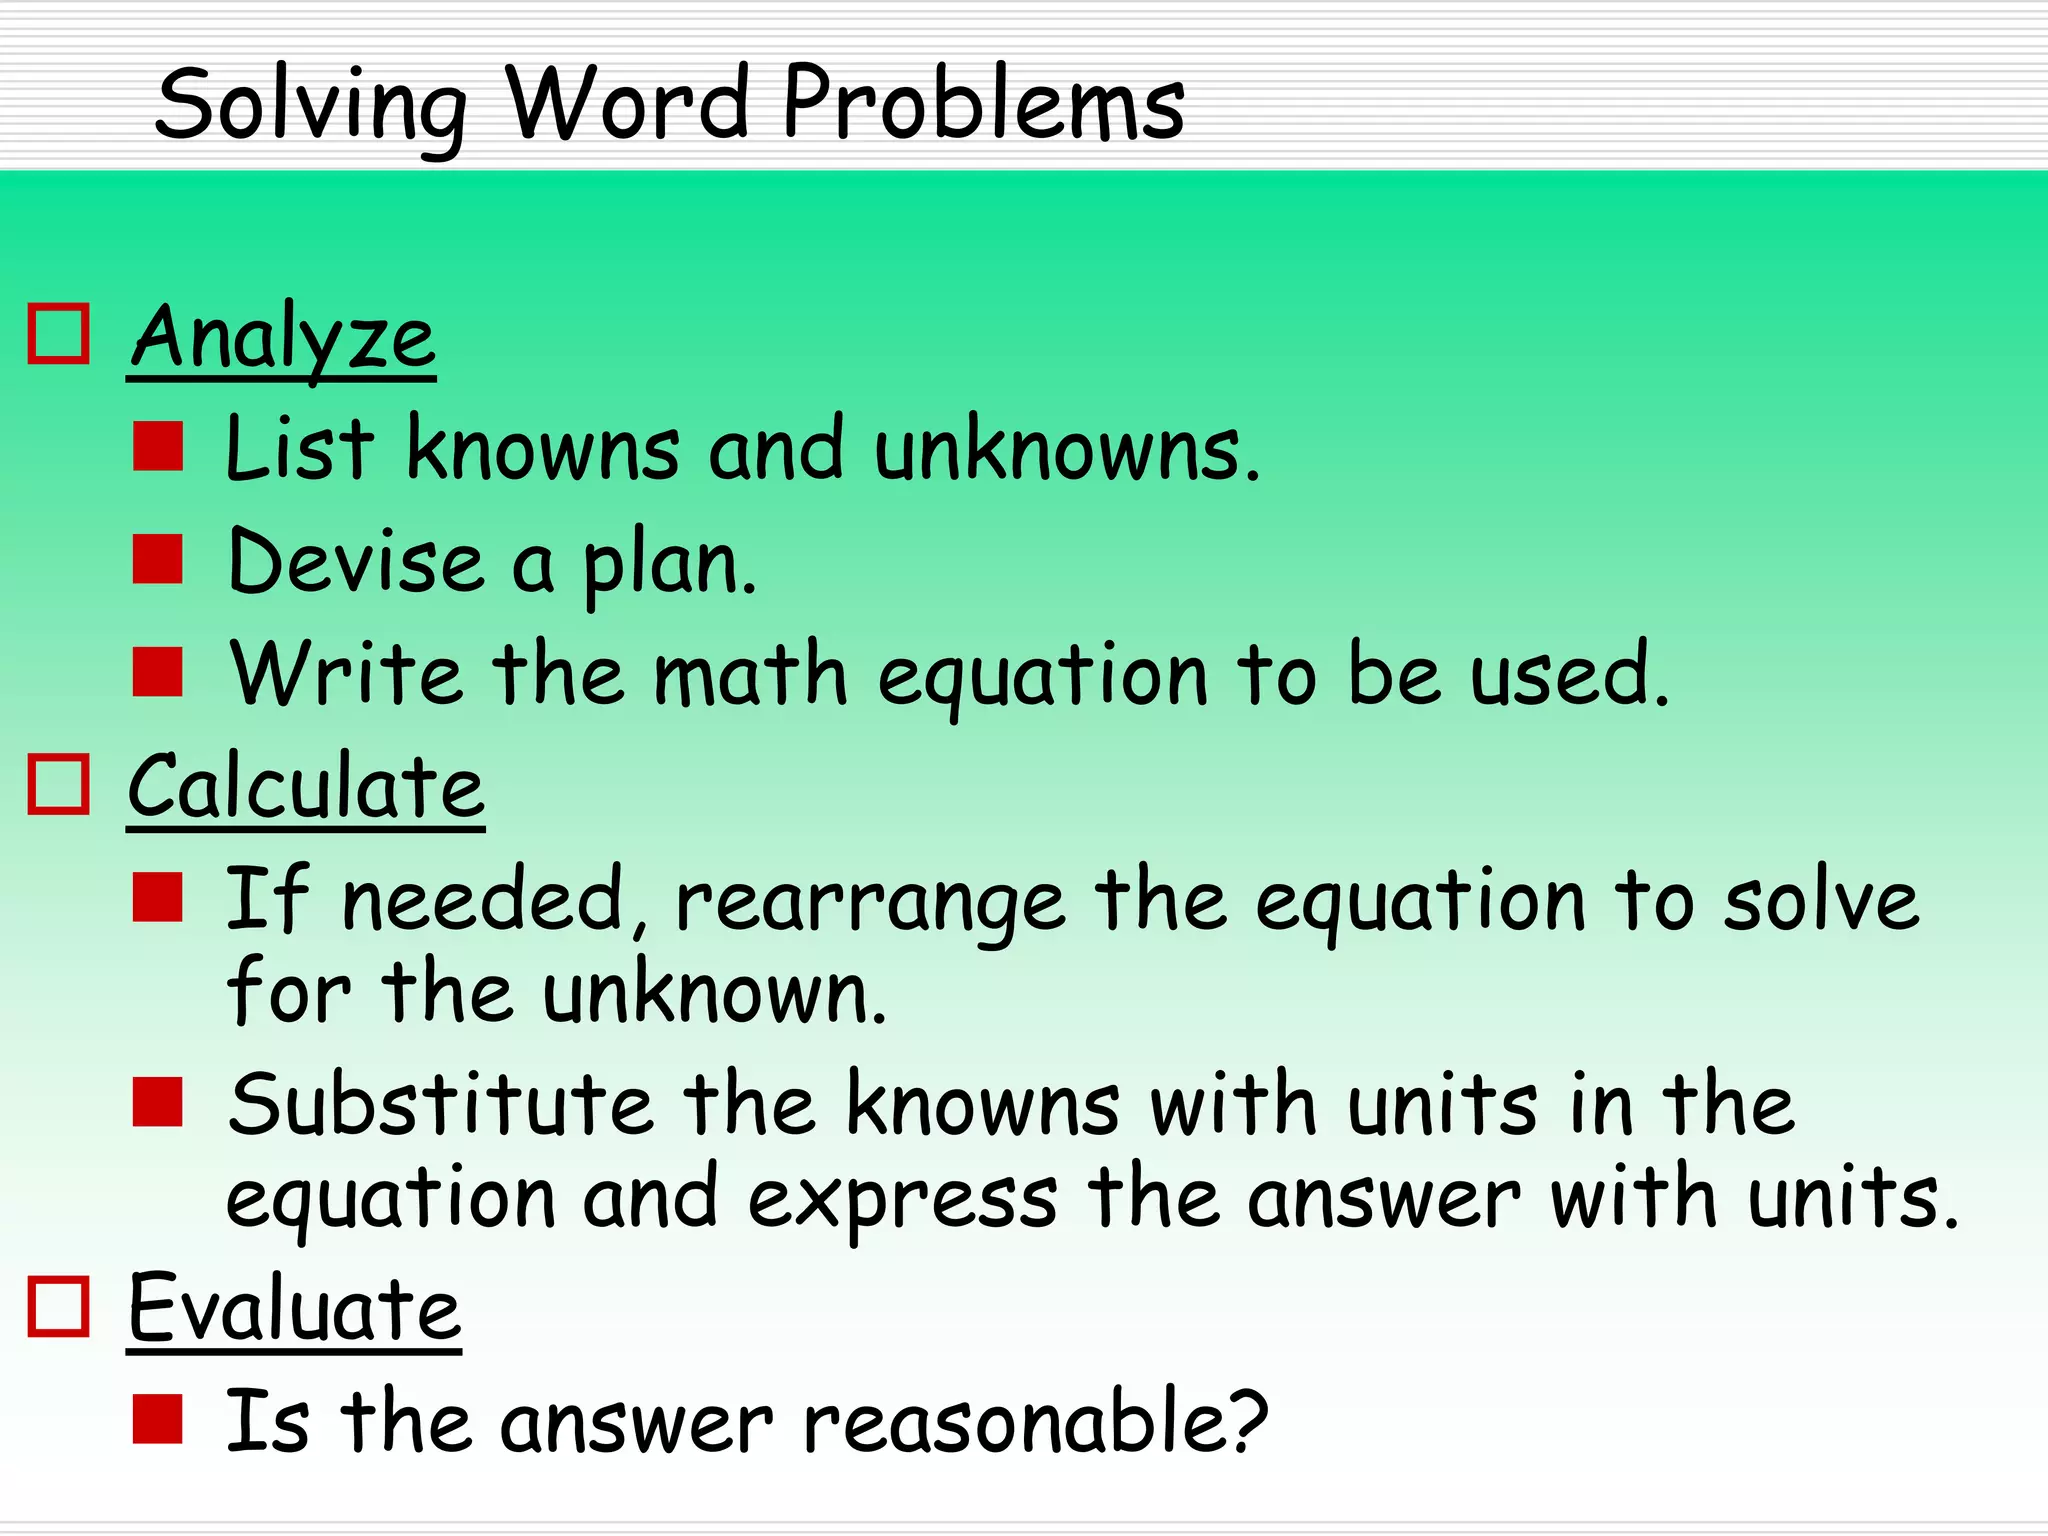
Introduction to Chemistry
Chemistry
The study of:
 the composition
(make-up) of
matter
 the changes that
matter
undergoes
The 5 Traditional Branches of Chemistry
Inorganic
Organic
Analytical
Physical
Biochemistry
Inorganic Chemistry
 The study of chemicals that do not
contain carbon.
Organic Chemistry
 The study of chemicals that contain
carbon.
 Origin: study of chemicals in living
organisms.
Analytical Chemistry
 Composition of matter; measurable,
identifies compounds/components
http://besg.group.shef.ac.uk/Facilities/Images/gcms.JPG
Example:
Mass Spectrometer
Gas Chromatograph
Physical Chemistry
 The study of :
 The mechanism
 The rate
 The energy transfer that happens when
matter undergoes change.
 Study of the interaction between two
elements
 Study of properties and changes of matter
and energy
Biochemistry
 Study of processes that take place
in organisms.
 Understand the structure of
matter found in the human body and
the chemical changes that occur in
cells
Science
What?
Why?
How?
When?
Science and Technology
 Theoretical Chemistry-Design of new
compound and new ideas; 2 categories:
pure and applied
 Science  Pure
 Does not necessarily have an application;
just knowing for knowledge’s sake; research
 Technology  Applied
 Has practical applications in society
 Directed toward a practical goal/application
 Engineering
Alchemists (~300BC-1650 AD)
China, India, Arabia, Europe, Egypt
•Aiming to:
Change common
metals to gold.
Develop
medicines.
•Developed lab
equipment.
•Mystical.
Antoine Lavoisier
(France 1743-1794)
 Regarded as the Father of Chemistry
 Designed equipment
 Used observations
and measurements.
 Discovered nitrogen
 Law of Conservation
of Mass
The Scientific Method
Steps followed during
scientific investigations
Logical, problem solving
technique
Fathers of the scientific
method is Galileo Galilei and
Francis Bacon
Scientific Method
 Observation- recognition of a problem
 Visible or provable fact
 From that a question arises (problem
statement)
 Problem statement is a question that compares
variables
 Example: Does the amount of salt in water affect
the boiling temperature of water?
Scientific Method
 Hypothesis- a proposed explanation of an
observation
 an educated guess
 must be testable
 Is a statement NOT a question that expresses the
expected answer to the problem statement (what
you think the results of the experiment will show)
 If you increase the amount of salt added to the
water, the boiling temperature will also increase
because
Scientific Method
 Experiment- an organized procedure used to
test a hypothesis (measurement, data
collection, manipulated and responding
variables)
 Planned way to test the hypothesis and find out the
answer to the problem posed
 Way to collect data and determine the value of the
dependent variable
 Compares independent variable to the dependent
variable
 Can only test one dependent variable at a time
Scientific Method
 3 parts to an experiment
 Control-standard for comparison
 Variables
 Independent Variable
 Dependent Variable
 Constants-parts of your experiment that do
not change
Scientific Method
 Independent Variable
 A variable that changes unrelated to other factors
 A variable we manipulate, change, on purpose
 A variable whose value we know before we start an
experiment
 Example: Does the amount of salt in water affect
the boiling temperature of water? We know how
much salt we add to each amount of water before
boiling so amount of salt is the independent variable
Scientific Method
 Dependent Variable
 A variable that changes depending on some other
factors
 The variable we are trying to find out
 Variable whose value we do not know before we start
the experiment
 Example: Does the amount of salt in water affect
the boiling temperature of water? We do not know
the boiling temperature to water once salt is added;
must test to find this out
Scientific Method
 Constants
 Does not change for the duration of the
experiment
 Remains the same
 Example: Does the amount of salt in water
affect the boiling temperature of water?
We would not change the brand of salt or
the amount of water (or type of water)
Scientific Method
 Analyze
 Look for patterns in experimental data
 2 types of data
 Quantitative = numbers
 Qualitative = observations
 Data presented via tables or graphs
 3 types of graphs: circle (pie), bar, line
Scientific Method
The cafeteria wanted
to collect data on
how much milk was
sold in 1 week. The
table shows the
results. We are
going to take this
data and display it in
3 different types of
graphs.
Day Chocolate Strawberry White
Monday 53 78 126
Tuesday 72 97 87
Wednesday 112 73 86
Thursday 33 78 143
Friday 76 47 162
Scientific Method
 Bar Graph
 A bar graph is used to
show relationships
between groups.
 The two items being
compared do not need
to affect each other.
 It's a fast way to show
big differences. Notice
how easy it is to read a
bar graph.
 Often used for
counting.
Chocolate Milk Sold
53
72
112
33
76
0
20
40
60
80
100
120
Monday Tuesday Wednesday Thursday Friday
Day
Amount
Sold
Monday Tuesday
Wednesday Thursday
Friday
Scientific Method
 Circle graph (a.k.a.
pie chart)
 Used to show how a
part of something
relates to the whole.
 This kind of graph is
needed to show
percentages
effectively.
 Sum of parts is 1 or
100%
Chocolate Milk Sold
Monday
Tuesday
Wednesday
Thursday
Friday
Scientific Method
 Line Graph
 A line graph is used
to show continuing
data; how one thing is
affected by another.
 It's clear to see how
things are going by
the rises and falls a
line graph shows.
 Equation of line
represents the data.
Chocolate MIlk Sold
0
20
40
60
80
100
120
Monday Tuesday Wednesday Thursday Friday
Day
Amount
Sold
Chocolate
Scientific Method
 Choosing the right graph for your data
 Use a bar graph if you are not looking for trends (or
patterns) over time; and the items (or categories)
are not parts of a whole.
 Use a pie chart if you need to compare different
parts of a whole, there is no time involved and there
are not too many items (or categories).
 Use a line graph if you need to see how a quantity
has changed over time. Line graphs enable us to find
trends (or patterns) over time.
Scientific Method
 Conclusion
 Presents the findings of the experiment,
what the data shows, the hypothesis and
whether or not it was correct (supported) or
incorrect (negated)
 Theorizes why the observed pattern is so
Scientific Method
 Communicate
 When scientists collaborate (work together)
and communicated, they increase the
likelihood of a successful outcome
 Journals
 Internet
 Presentations/Speeches
Observations vs. Inferences
 Observation
 Something you confirm, something you have
seen, a fact
 A piece of information about circumstances
that exists or events that have occurred
 Inference
 An abstract or general idea derived from
specific instances
 Idea, thought, concept, notion, opinion
Theory
 A well tested explanation for a broad set
of observations.
 May use models.
 May allow predictions.
 Theories may change to explain new
observations or experimental data.
Law
 A statement that summarizes results of
observations, but does not explain them.
 Concise statement that summarizes the
results of many observations and
experiments
 Changes or is abandoned when
contradicted by new experiments.
Note:
 The order of the steps can vary and
additional steps may be added.
“No number of
experiments can prove
me right;
a single experiment can
prove me wrong.”
Albert Einstein
Math and Chemistry
 Math- the language of Science
 SI System (Metric System)
 Factor Label Method (Dimensional Analysis)
 Significant Figures
 Scientific Notation
 Manipulating Formulas
Units
 SI Units – International System
 Basic Units abbreviation
Length (meter) m
Mass (kilogram) kg
Time (second) s
Solving Word Problems
 Analyze
 List knowns and unknowns.
 Devise a plan.
 Write the math equation to be used.
 Calculate
 If needed, rearrange the equation to solve
for the unknown.
 Substitute the knowns with units in the
equation and express the answer with units.
 Evaluate
 Is the answer reasonable?

Intro to Chem-Unit 1.ppt

  • 1.
  • 2.
    Chemistry The study of: the composition (make-up) of matter  the changes that matter undergoes
  • 3.
    The 5 TraditionalBranches of Chemistry Inorganic Organic Analytical Physical Biochemistry
  • 4.
    Inorganic Chemistry  Thestudy of chemicals that do not contain carbon.
  • 5.
    Organic Chemistry  Thestudy of chemicals that contain carbon.  Origin: study of chemicals in living organisms.
  • 6.
    Analytical Chemistry  Compositionof matter; measurable, identifies compounds/components http://besg.group.shef.ac.uk/Facilities/Images/gcms.JPG Example: Mass Spectrometer Gas Chromatograph
  • 7.
    Physical Chemistry  Thestudy of :  The mechanism  The rate  The energy transfer that happens when matter undergoes change.  Study of the interaction between two elements  Study of properties and changes of matter and energy
  • 8.
    Biochemistry  Study ofprocesses that take place in organisms.  Understand the structure of matter found in the human body and the chemical changes that occur in cells
  • 9.
  • 10.
    Science and Technology Theoretical Chemistry-Design of new compound and new ideas; 2 categories: pure and applied  Science  Pure  Does not necessarily have an application; just knowing for knowledge’s sake; research  Technology  Applied  Has practical applications in society  Directed toward a practical goal/application  Engineering
  • 11.
    Alchemists (~300BC-1650 AD) China,India, Arabia, Europe, Egypt •Aiming to: Change common metals to gold. Develop medicines. •Developed lab equipment. •Mystical.
  • 12.
    Antoine Lavoisier (France 1743-1794) Regarded as the Father of Chemistry  Designed equipment  Used observations and measurements.  Discovered nitrogen  Law of Conservation of Mass
  • 13.
    The Scientific Method Stepsfollowed during scientific investigations Logical, problem solving technique Fathers of the scientific method is Galileo Galilei and Francis Bacon
  • 14.
    Scientific Method  Observation-recognition of a problem  Visible or provable fact  From that a question arises (problem statement)  Problem statement is a question that compares variables  Example: Does the amount of salt in water affect the boiling temperature of water?
  • 15.
    Scientific Method  Hypothesis-a proposed explanation of an observation  an educated guess  must be testable  Is a statement NOT a question that expresses the expected answer to the problem statement (what you think the results of the experiment will show)  If you increase the amount of salt added to the water, the boiling temperature will also increase because
  • 16.
    Scientific Method  Experiment-an organized procedure used to test a hypothesis (measurement, data collection, manipulated and responding variables)  Planned way to test the hypothesis and find out the answer to the problem posed  Way to collect data and determine the value of the dependent variable  Compares independent variable to the dependent variable  Can only test one dependent variable at a time
  • 17.
    Scientific Method  3parts to an experiment  Control-standard for comparison  Variables  Independent Variable  Dependent Variable  Constants-parts of your experiment that do not change
  • 18.
    Scientific Method  IndependentVariable  A variable that changes unrelated to other factors  A variable we manipulate, change, on purpose  A variable whose value we know before we start an experiment  Example: Does the amount of salt in water affect the boiling temperature of water? We know how much salt we add to each amount of water before boiling so amount of salt is the independent variable
  • 19.
    Scientific Method  DependentVariable  A variable that changes depending on some other factors  The variable we are trying to find out  Variable whose value we do not know before we start the experiment  Example: Does the amount of salt in water affect the boiling temperature of water? We do not know the boiling temperature to water once salt is added; must test to find this out
  • 20.
    Scientific Method  Constants Does not change for the duration of the experiment  Remains the same  Example: Does the amount of salt in water affect the boiling temperature of water? We would not change the brand of salt or the amount of water (or type of water)
  • 21.
    Scientific Method  Analyze Look for patterns in experimental data  2 types of data  Quantitative = numbers  Qualitative = observations  Data presented via tables or graphs  3 types of graphs: circle (pie), bar, line
  • 22.
    Scientific Method The cafeteriawanted to collect data on how much milk was sold in 1 week. The table shows the results. We are going to take this data and display it in 3 different types of graphs. Day Chocolate Strawberry White Monday 53 78 126 Tuesday 72 97 87 Wednesday 112 73 86 Thursday 33 78 143 Friday 76 47 162
  • 23.
    Scientific Method  BarGraph  A bar graph is used to show relationships between groups.  The two items being compared do not need to affect each other.  It's a fast way to show big differences. Notice how easy it is to read a bar graph.  Often used for counting. Chocolate Milk Sold 53 72 112 33 76 0 20 40 60 80 100 120 Monday Tuesday Wednesday Thursday Friday Day Amount Sold Monday Tuesday Wednesday Thursday Friday
  • 24.
    Scientific Method  Circlegraph (a.k.a. pie chart)  Used to show how a part of something relates to the whole.  This kind of graph is needed to show percentages effectively.  Sum of parts is 1 or 100% Chocolate Milk Sold Monday Tuesday Wednesday Thursday Friday
  • 25.
    Scientific Method  LineGraph  A line graph is used to show continuing data; how one thing is affected by another.  It's clear to see how things are going by the rises and falls a line graph shows.  Equation of line represents the data. Chocolate MIlk Sold 0 20 40 60 80 100 120 Monday Tuesday Wednesday Thursday Friday Day Amount Sold Chocolate
  • 26.
    Scientific Method  Choosingthe right graph for your data  Use a bar graph if you are not looking for trends (or patterns) over time; and the items (or categories) are not parts of a whole.  Use a pie chart if you need to compare different parts of a whole, there is no time involved and there are not too many items (or categories).  Use a line graph if you need to see how a quantity has changed over time. Line graphs enable us to find trends (or patterns) over time.
  • 27.
    Scientific Method  Conclusion Presents the findings of the experiment, what the data shows, the hypothesis and whether or not it was correct (supported) or incorrect (negated)  Theorizes why the observed pattern is so
  • 28.
    Scientific Method  Communicate When scientists collaborate (work together) and communicated, they increase the likelihood of a successful outcome  Journals  Internet  Presentations/Speeches
  • 29.
    Observations vs. Inferences Observation  Something you confirm, something you have seen, a fact  A piece of information about circumstances that exists or events that have occurred  Inference  An abstract or general idea derived from specific instances  Idea, thought, concept, notion, opinion
  • 30.
    Theory  A welltested explanation for a broad set of observations.  May use models.  May allow predictions.  Theories may change to explain new observations or experimental data.
  • 31.
    Law  A statementthat summarizes results of observations, but does not explain them.  Concise statement that summarizes the results of many observations and experiments  Changes or is abandoned when contradicted by new experiments.
  • 32.
    Note:  The orderof the steps can vary and additional steps may be added.
  • 33.
    “No number of experimentscan prove me right; a single experiment can prove me wrong.” Albert Einstein
  • 34.
    Math and Chemistry Math- the language of Science  SI System (Metric System)  Factor Label Method (Dimensional Analysis)  Significant Figures  Scientific Notation  Manipulating Formulas
  • 35.
    Units  SI Units– International System  Basic Units abbreviation Length (meter) m Mass (kilogram) kg Time (second) s
  • 36.
    Solving Word Problems Analyze  List knowns and unknowns.  Devise a plan.  Write the math equation to be used.  Calculate  If needed, rearrange the equation to solve for the unknown.  Substitute the knowns with units in the equation and express the answer with units.  Evaluate  Is the answer reasonable?