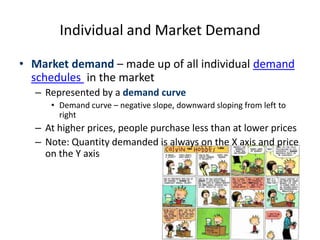
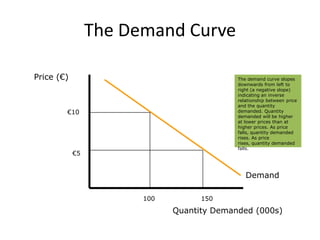
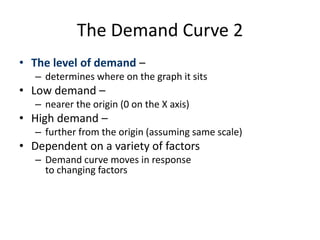
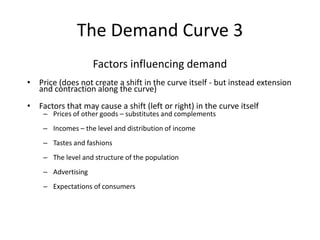
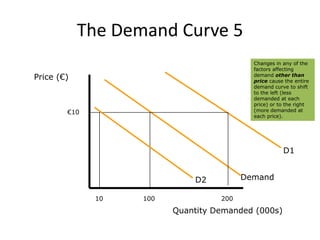
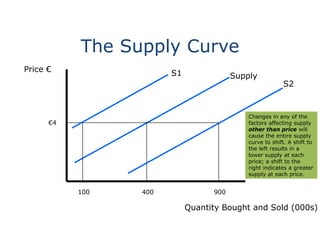
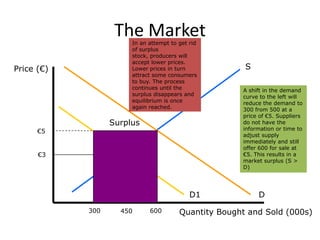
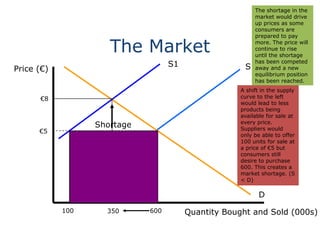
The Market System 
Demand, Supply and Price 
Determination 
Adapted from www.bized.co.uk
The Market System 
• Market consists (is made up) of: 
– Consumers (people that buy a product) - create a demand for a 
product 
– Businesses (sellers and creators of products) 
• Inputs and Outputs (Factors of Production and 
Products) 
• Factors of Production 
– Land 
– Labor 
– Capital 
– Entrepreneurship
What is Demand? 
• Demand 
– the amount consumers desire to purchase at various prices 
– Not what they will buy, but what they would like to buy! 
• Effective demand – must be willing AND able to pay 
Willing and able
What does a change in price do to 
quantity demanded?
Individual and Market Demand 
• Market demand – made up of all individual demand 
schedules in the market 
– Represented by a demand curve 
• Demand curve – negative slope, downward sloping from left to 
right 
– At higher prices, people purchase less than at lower prices 
– Note: Quantity demanded is always on the X axis and price 
on the Y axis
Shifters of Demand 
• Price of other goods 
• Income 
• Tastes 
• Expectations of the future 
• Other factors (e.g. size of population, changes 
in income distribution, seasonal changes, 
government policies
Types of Goods 
• Complementary goods 
• Substitute goods 
• Inferior Goods 
• Normal Goods
The Demand Curve 
Price (€) 
Demand 
Quantity Demanded (000s) 
€10 
€5 
100 150 
The demand curve slopes 
downwards from left to 
right (a negative slope) 
indicating an inverse 
relationship between price 
and the quantity 
demanded. Quantity 
demanded will be higher 
at lower prices than at 
higher prices. As price 
falls, quantity demanded 
rises. As price rises, 
quantity demanded falls.
The Demand Curve 2 
• The level of demand – 
– determines where on the graph it sits 
• Low demand – 
– nearer the origin (0 on the X axis) 
• High demand – 
– further from the origin (assuming same scale) 
• Dependent on a variety of factors 
– Demand curve moves in response 
to changing factors
The Demand Curve 3 
Factors influencing demand 
• Price (does not create a shift in the curve itself - but instead extension 
and contraction along the curve) 
• Factors that may cause a shift (left or right) in the curve itself 
– Prices of other goods – substitutes and complements 
– Incomes – the level and distribution of income 
– Tastes and fashions 
– The level and structure of the population 
– Advertising 
– Expectations of consumers
The Demand Curve 4 
Changes in any of the factors other than price causes 
the demand curve to shift either: 
• Left (decrease in demand) or 
• Right (increase in demand)
The Demand Curve 5 
Price (€) 
Demand 
Quantity Demanded (000s) 
€10 
100 
D1 
D2 
10 200 
Changes in any of the 
factors affecting 
demand other than 
price cause the entire 
demand curve to shift 
to the left (less 
demanded at each 
price) or to the right 
(more demanded at 
each price).
Demand 
Demand Video
Shifters of Supply 
• Changes in cost of factors of production (land, 
labour, capital, entrepreneurship) 
• Technology 
• Government intervention 
• Expectations of the future
The Supply Curve 
• Changes in any of the factors OTHER than price cause a shift 
in the supply curve 
• A shift in supply to the left – the amount producers offer for 
sale at every price will be less 
• A shift in supply to the right – the amount producers wish to 
sell at every price increases 
• HINT: Be careful not to confuse supply going ‘up’ and ‘down’ 
with the direction of the shift!
The Supply Curve 
Shifters of supply: 
• Profitability of other goods in production 
and prices of goods in joint supply 
• Technology 
• Natural shocks 
• Costs of production 
• Expectations of producers 
• Social factors
The Supply Curve 
Price € 
Supply 
Quantity Bought and Sold (000s) 
€3 
200 
€7 
800 
The supply curve 
slopes upwards from 
left to right indicating 
a positive relationship 
between supply and 
price. As price rises, it 
encourages producers 
to offer more for sale 
whereas a fall in price 
would lead to the 
quantity supplied to 
fall.
The Supply Curve 
Price € 
Supply 
Quantity Bought and Sold (000s) 
€4 
400 
S1 
100 
S2 
900 
Changes in any of the 
factors affecting supply 
other than price will 
cause the entire supply 
curve to shift. A shift to 
the left results in a 
lower supply at each 
price; a shift to the 
right indicates a greater 
supply at each price.
Supply 
Supply Video
The Market 
Price (€) 
S 
D 
Quantity Bought and Sold (000s) 
€5 
600 
D1 
300 
Surplus 
€3 
450 
A shift in the demand 
curve to the left will 
reduce the demand to 
300 from 500 at a 
price of €5. Suppliers 
do not have the 
information or time to 
adjust supply 
immediately and still 
offer 600 for sale at 
€5. This results in a 
market surplus (S > 
D) 
In an attempt to get rid 
of surplus stock, 
producers will accept 
lower prices. Lower 
prices in turn attract 
some consumers to 
buy. The process 
continues until the 
surplus disappears and 
equilibrium is once 
again reached.
The Market 
Price (€) 
S 
The shortage in the 
market would drive 
up prices as some 
consumers are 
prepared to pay 
more. The price will 
continue to rise 
until the shortage 
has been competed 
away and a new 
equilibrium position 
has been reached. 
D 
Quantity Bought and Sold (000s) 
€5 
600 
S1 
100 
Shortage 
€8 
350 
A shift in the supply 
curve to the left 
would lead to less 
products being 
available for sale at 
every price. 
Suppliers would 
only be able to offer 
100 units for sale at 
a price of €5 but 
consumers still 
desire to purchase 
600. This creates a 
market shortage. (S 
< D)
Market Equilibrium 
Market Equilibrium Video

The Market System

  • 1.
    The Market System Demand, Supply and Price Determination Adapted from www.bized.co.uk
  • 2.
    The Market System • Market consists (is made up) of: – Consumers (people that buy a product) - create a demand for a product – Businesses (sellers and creators of products) • Inputs and Outputs (Factors of Production and Products) • Factors of Production – Land – Labor – Capital – Entrepreneurship
  • 3.
    What is Demand? • Demand – the amount consumers desire to purchase at various prices – Not what they will buy, but what they would like to buy! • Effective demand – must be willing AND able to pay Willing and able
  • 4.
    What does achange in price do to quantity demanded?
  • 5.
    Individual and MarketDemand • Market demand – made up of all individual demand schedules in the market – Represented by a demand curve • Demand curve – negative slope, downward sloping from left to right – At higher prices, people purchase less than at lower prices – Note: Quantity demanded is always on the X axis and price on the Y axis
  • 7.
    Shifters of Demand • Price of other goods • Income • Tastes • Expectations of the future • Other factors (e.g. size of population, changes in income distribution, seasonal changes, government policies
  • 8.
    Types of Goods • Complementary goods • Substitute goods • Inferior Goods • Normal Goods
  • 9.
    The Demand Curve Price (€) Demand Quantity Demanded (000s) €10 €5 100 150 The demand curve slopes downwards from left to right (a negative slope) indicating an inverse relationship between price and the quantity demanded. Quantity demanded will be higher at lower prices than at higher prices. As price falls, quantity demanded rises. As price rises, quantity demanded falls.
  • 10.
    The Demand Curve2 • The level of demand – – determines where on the graph it sits • Low demand – – nearer the origin (0 on the X axis) • High demand – – further from the origin (assuming same scale) • Dependent on a variety of factors – Demand curve moves in response to changing factors
  • 11.
    The Demand Curve3 Factors influencing demand • Price (does not create a shift in the curve itself - but instead extension and contraction along the curve) • Factors that may cause a shift (left or right) in the curve itself – Prices of other goods – substitutes and complements – Incomes – the level and distribution of income – Tastes and fashions – The level and structure of the population – Advertising – Expectations of consumers
  • 12.
    The Demand Curve4 Changes in any of the factors other than price causes the demand curve to shift either: • Left (decrease in demand) or • Right (increase in demand)
  • 13.
    The Demand Curve5 Price (€) Demand Quantity Demanded (000s) €10 100 D1 D2 10 200 Changes in any of the factors affecting demand other than price cause the entire demand curve to shift to the left (less demanded at each price) or to the right (more demanded at each price).
  • 14.
  • 15.
    Shifters of Supply • Changes in cost of factors of production (land, labour, capital, entrepreneurship) • Technology • Government intervention • Expectations of the future
  • 16.
    The Supply Curve • Changes in any of the factors OTHER than price cause a shift in the supply curve • A shift in supply to the left – the amount producers offer for sale at every price will be less • A shift in supply to the right – the amount producers wish to sell at every price increases • HINT: Be careful not to confuse supply going ‘up’ and ‘down’ with the direction of the shift!
  • 17.
    The Supply Curve Shifters of supply: • Profitability of other goods in production and prices of goods in joint supply • Technology • Natural shocks • Costs of production • Expectations of producers • Social factors
  • 18.
    The Supply Curve Price € Supply Quantity Bought and Sold (000s) €3 200 €7 800 The supply curve slopes upwards from left to right indicating a positive relationship between supply and price. As price rises, it encourages producers to offer more for sale whereas a fall in price would lead to the quantity supplied to fall.
  • 19.
    The Supply Curve Price € Supply Quantity Bought and Sold (000s) €4 400 S1 100 S2 900 Changes in any of the factors affecting supply other than price will cause the entire supply curve to shift. A shift to the left results in a lower supply at each price; a shift to the right indicates a greater supply at each price.
  • 20.
  • 21.
    The Market Price(€) S D Quantity Bought and Sold (000s) €5 600 D1 300 Surplus €3 450 A shift in the demand curve to the left will reduce the demand to 300 from 500 at a price of €5. Suppliers do not have the information or time to adjust supply immediately and still offer 600 for sale at €5. This results in a market surplus (S > D) In an attempt to get rid of surplus stock, producers will accept lower prices. Lower prices in turn attract some consumers to buy. The process continues until the surplus disappears and equilibrium is once again reached.
  • 22.
    The Market Price(€) S The shortage in the market would drive up prices as some consumers are prepared to pay more. The price will continue to rise until the shortage has been competed away and a new equilibrium position has been reached. D Quantity Bought and Sold (000s) €5 600 S1 100 Shortage €8 350 A shift in the supply curve to the left would lead to less products being available for sale at every price. Suppliers would only be able to offer 100 units for sale at a price of €5 but consumers still desire to purchase 600. This creates a market shortage. (S < D)
  • 23.
    Market Equilibrium MarketEquilibrium Video