


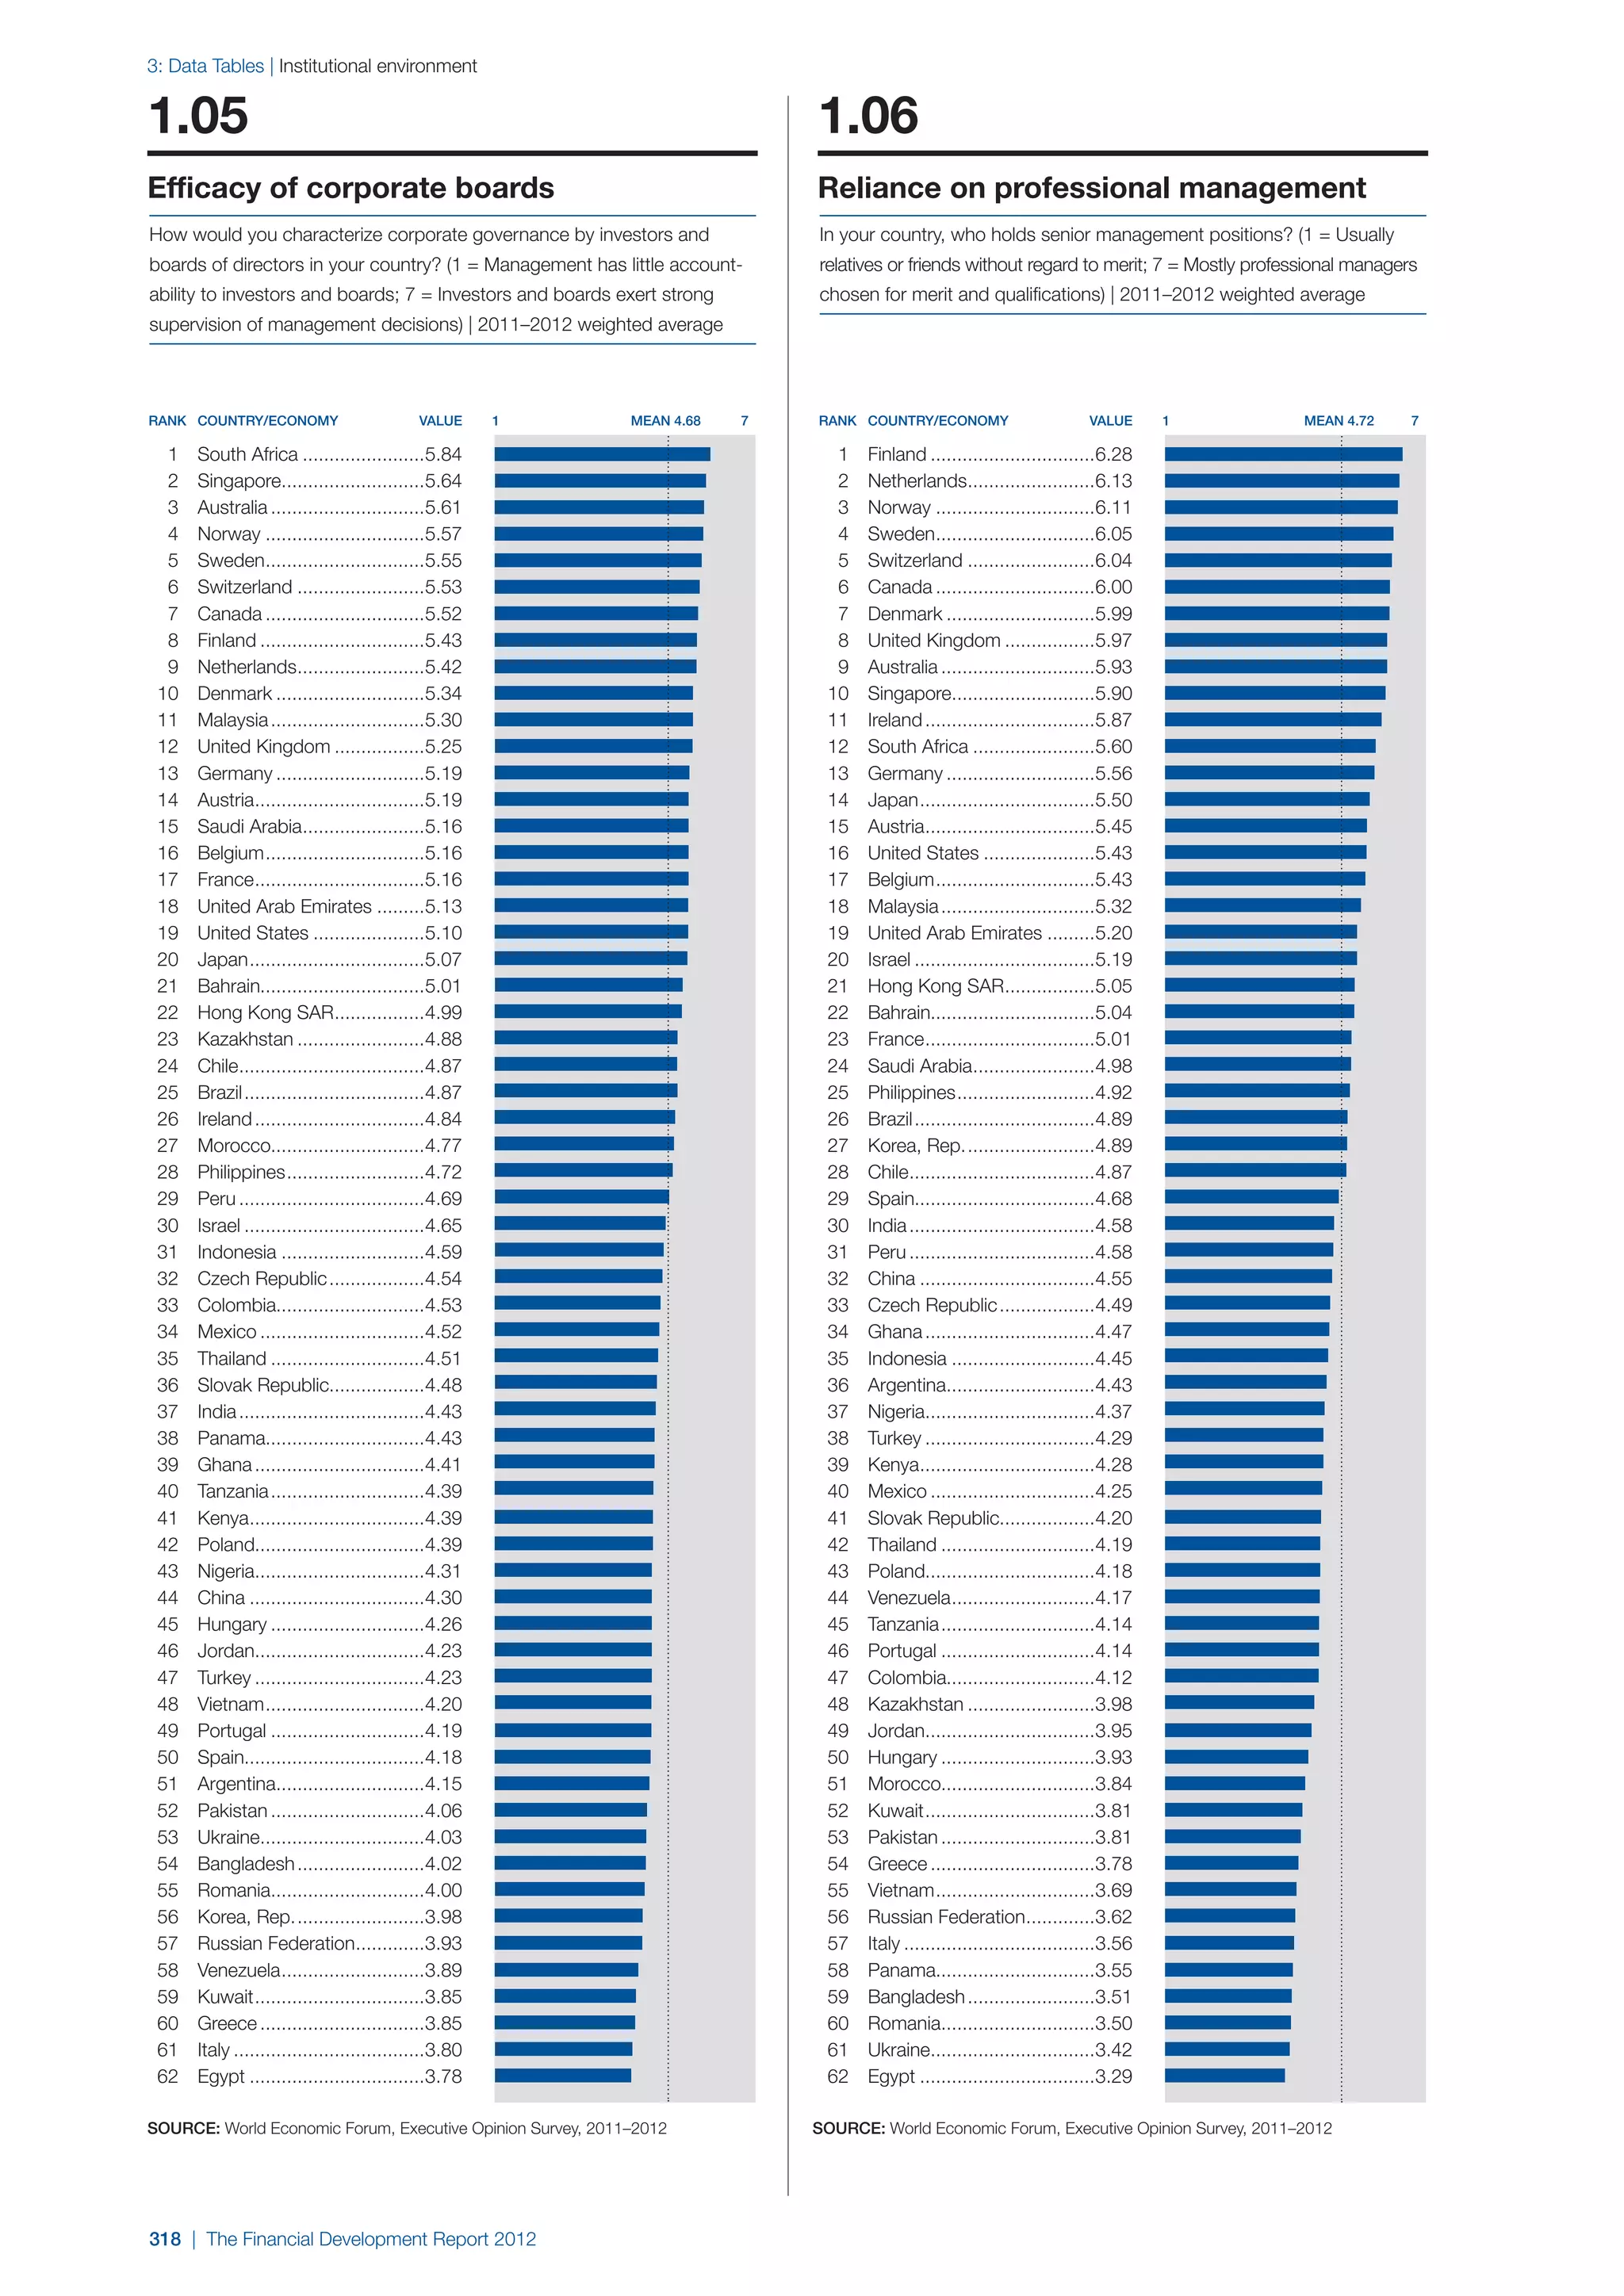
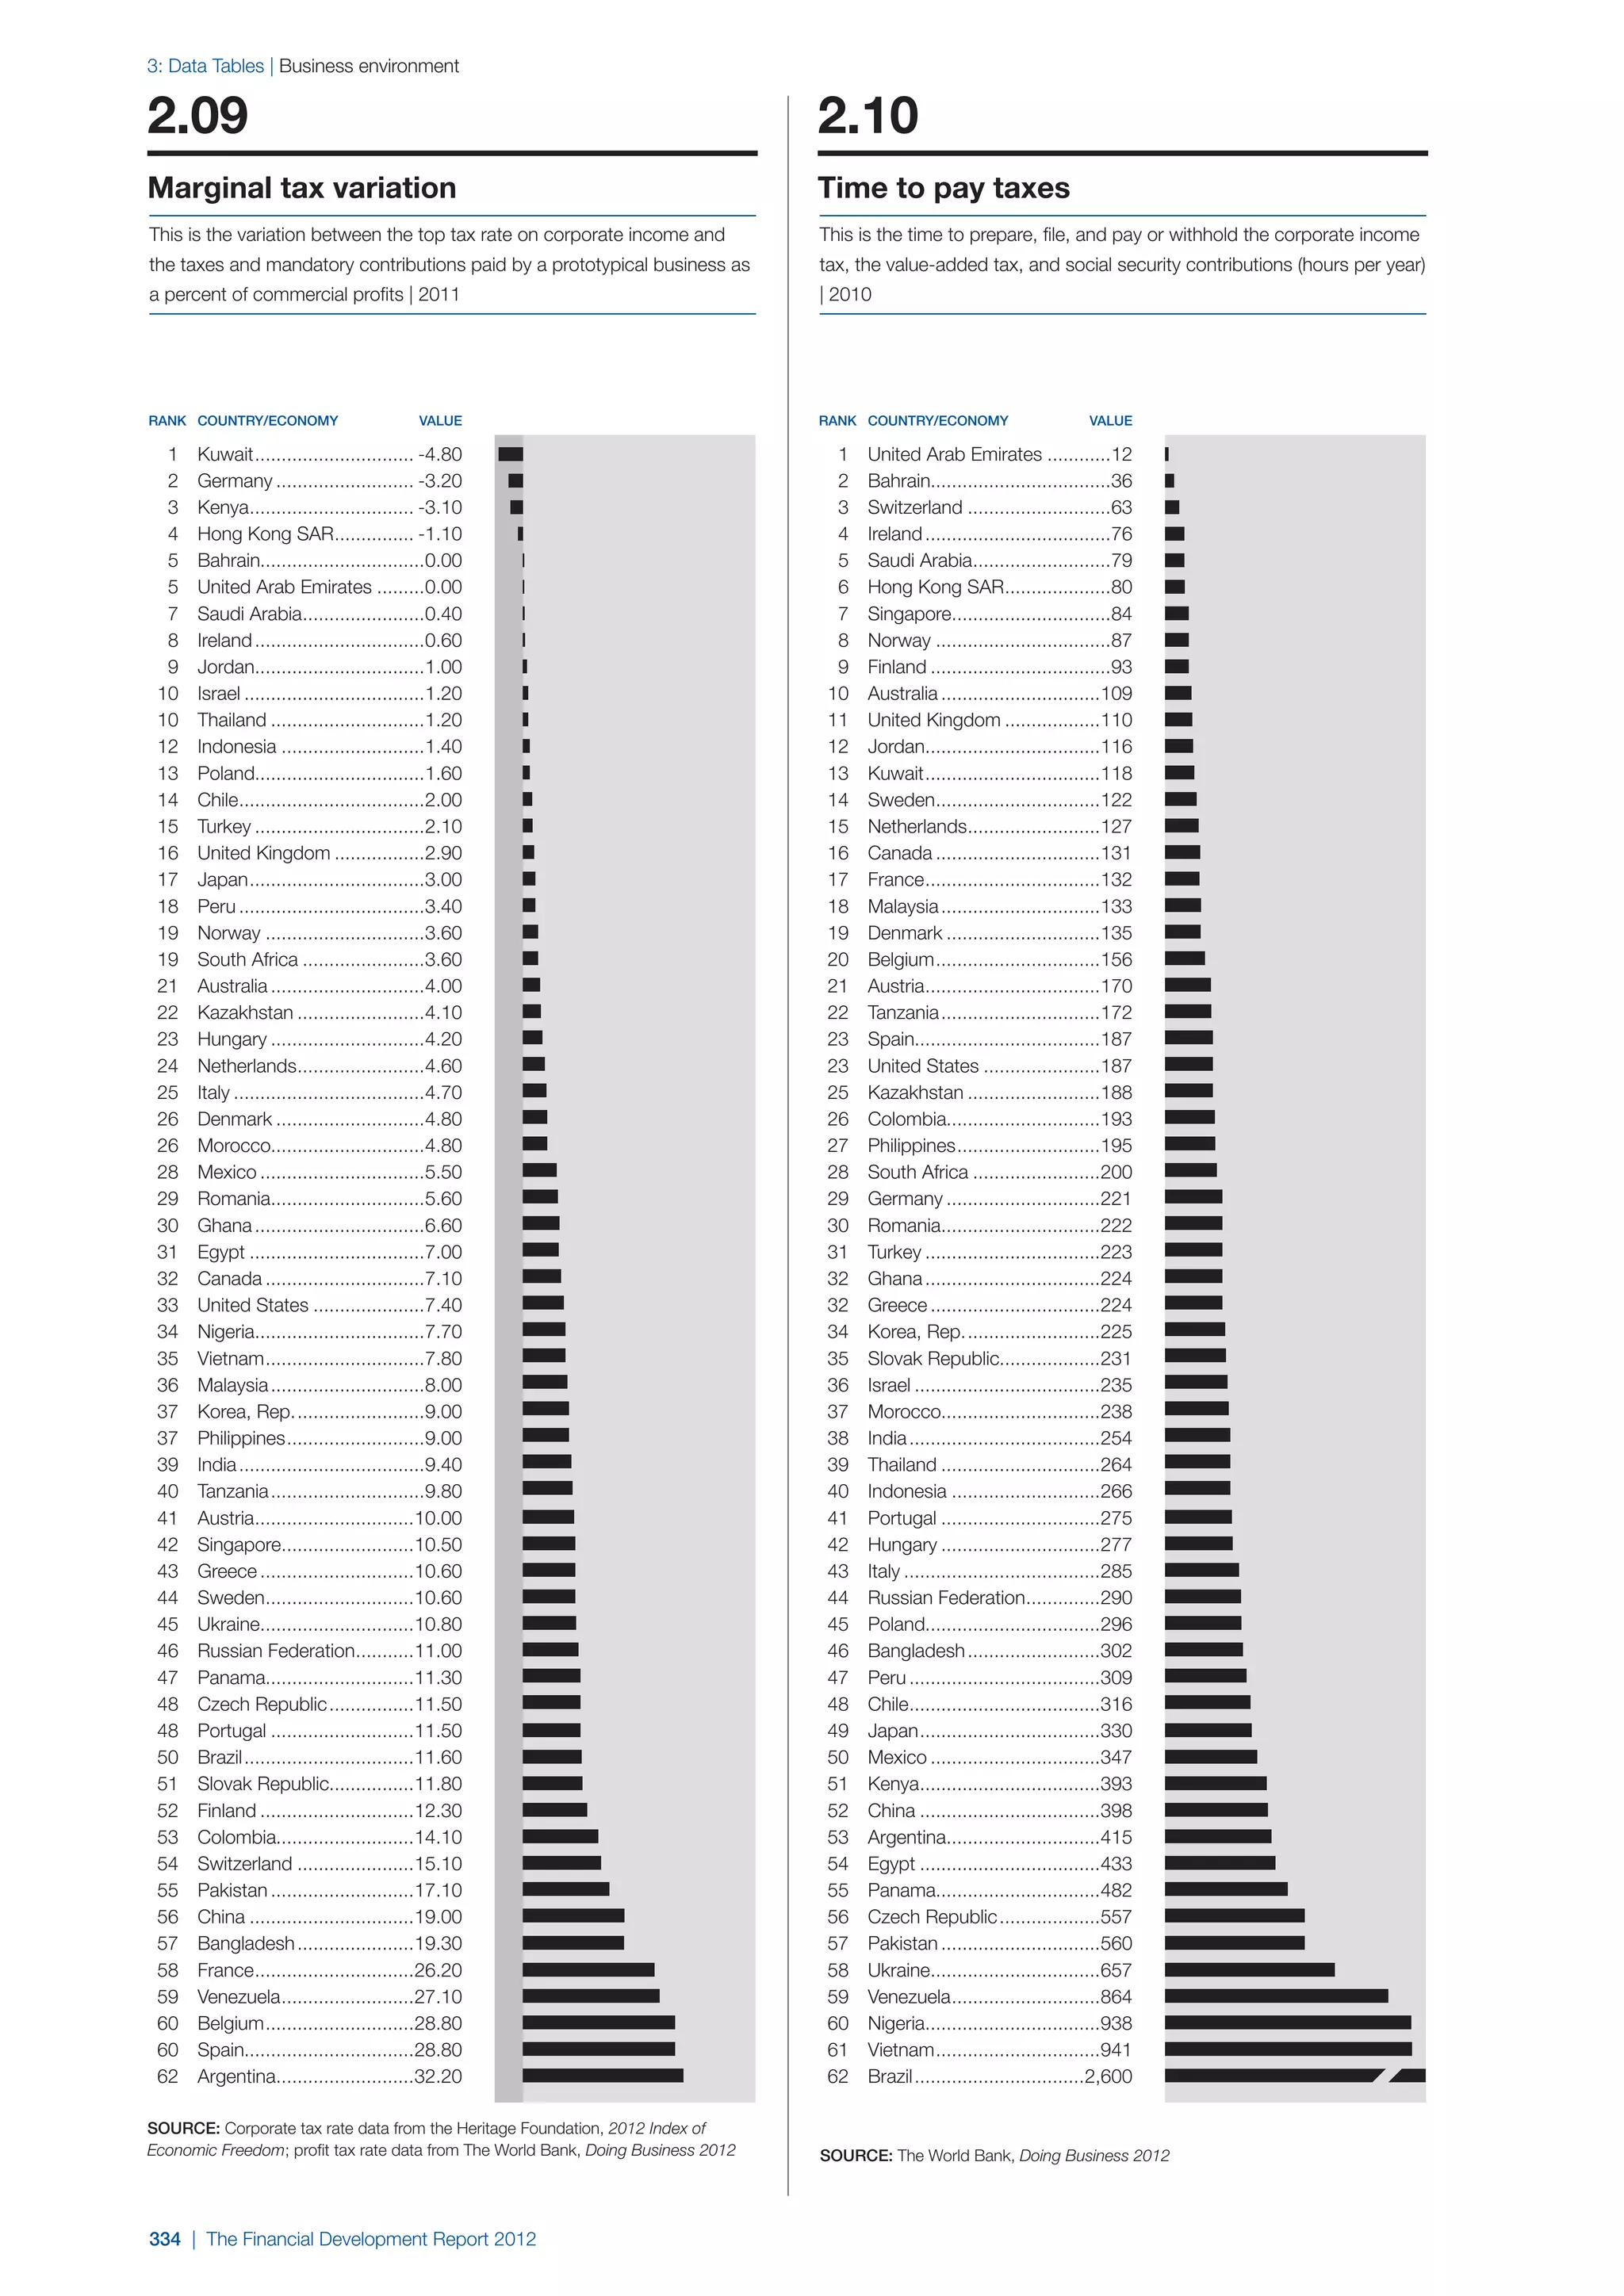
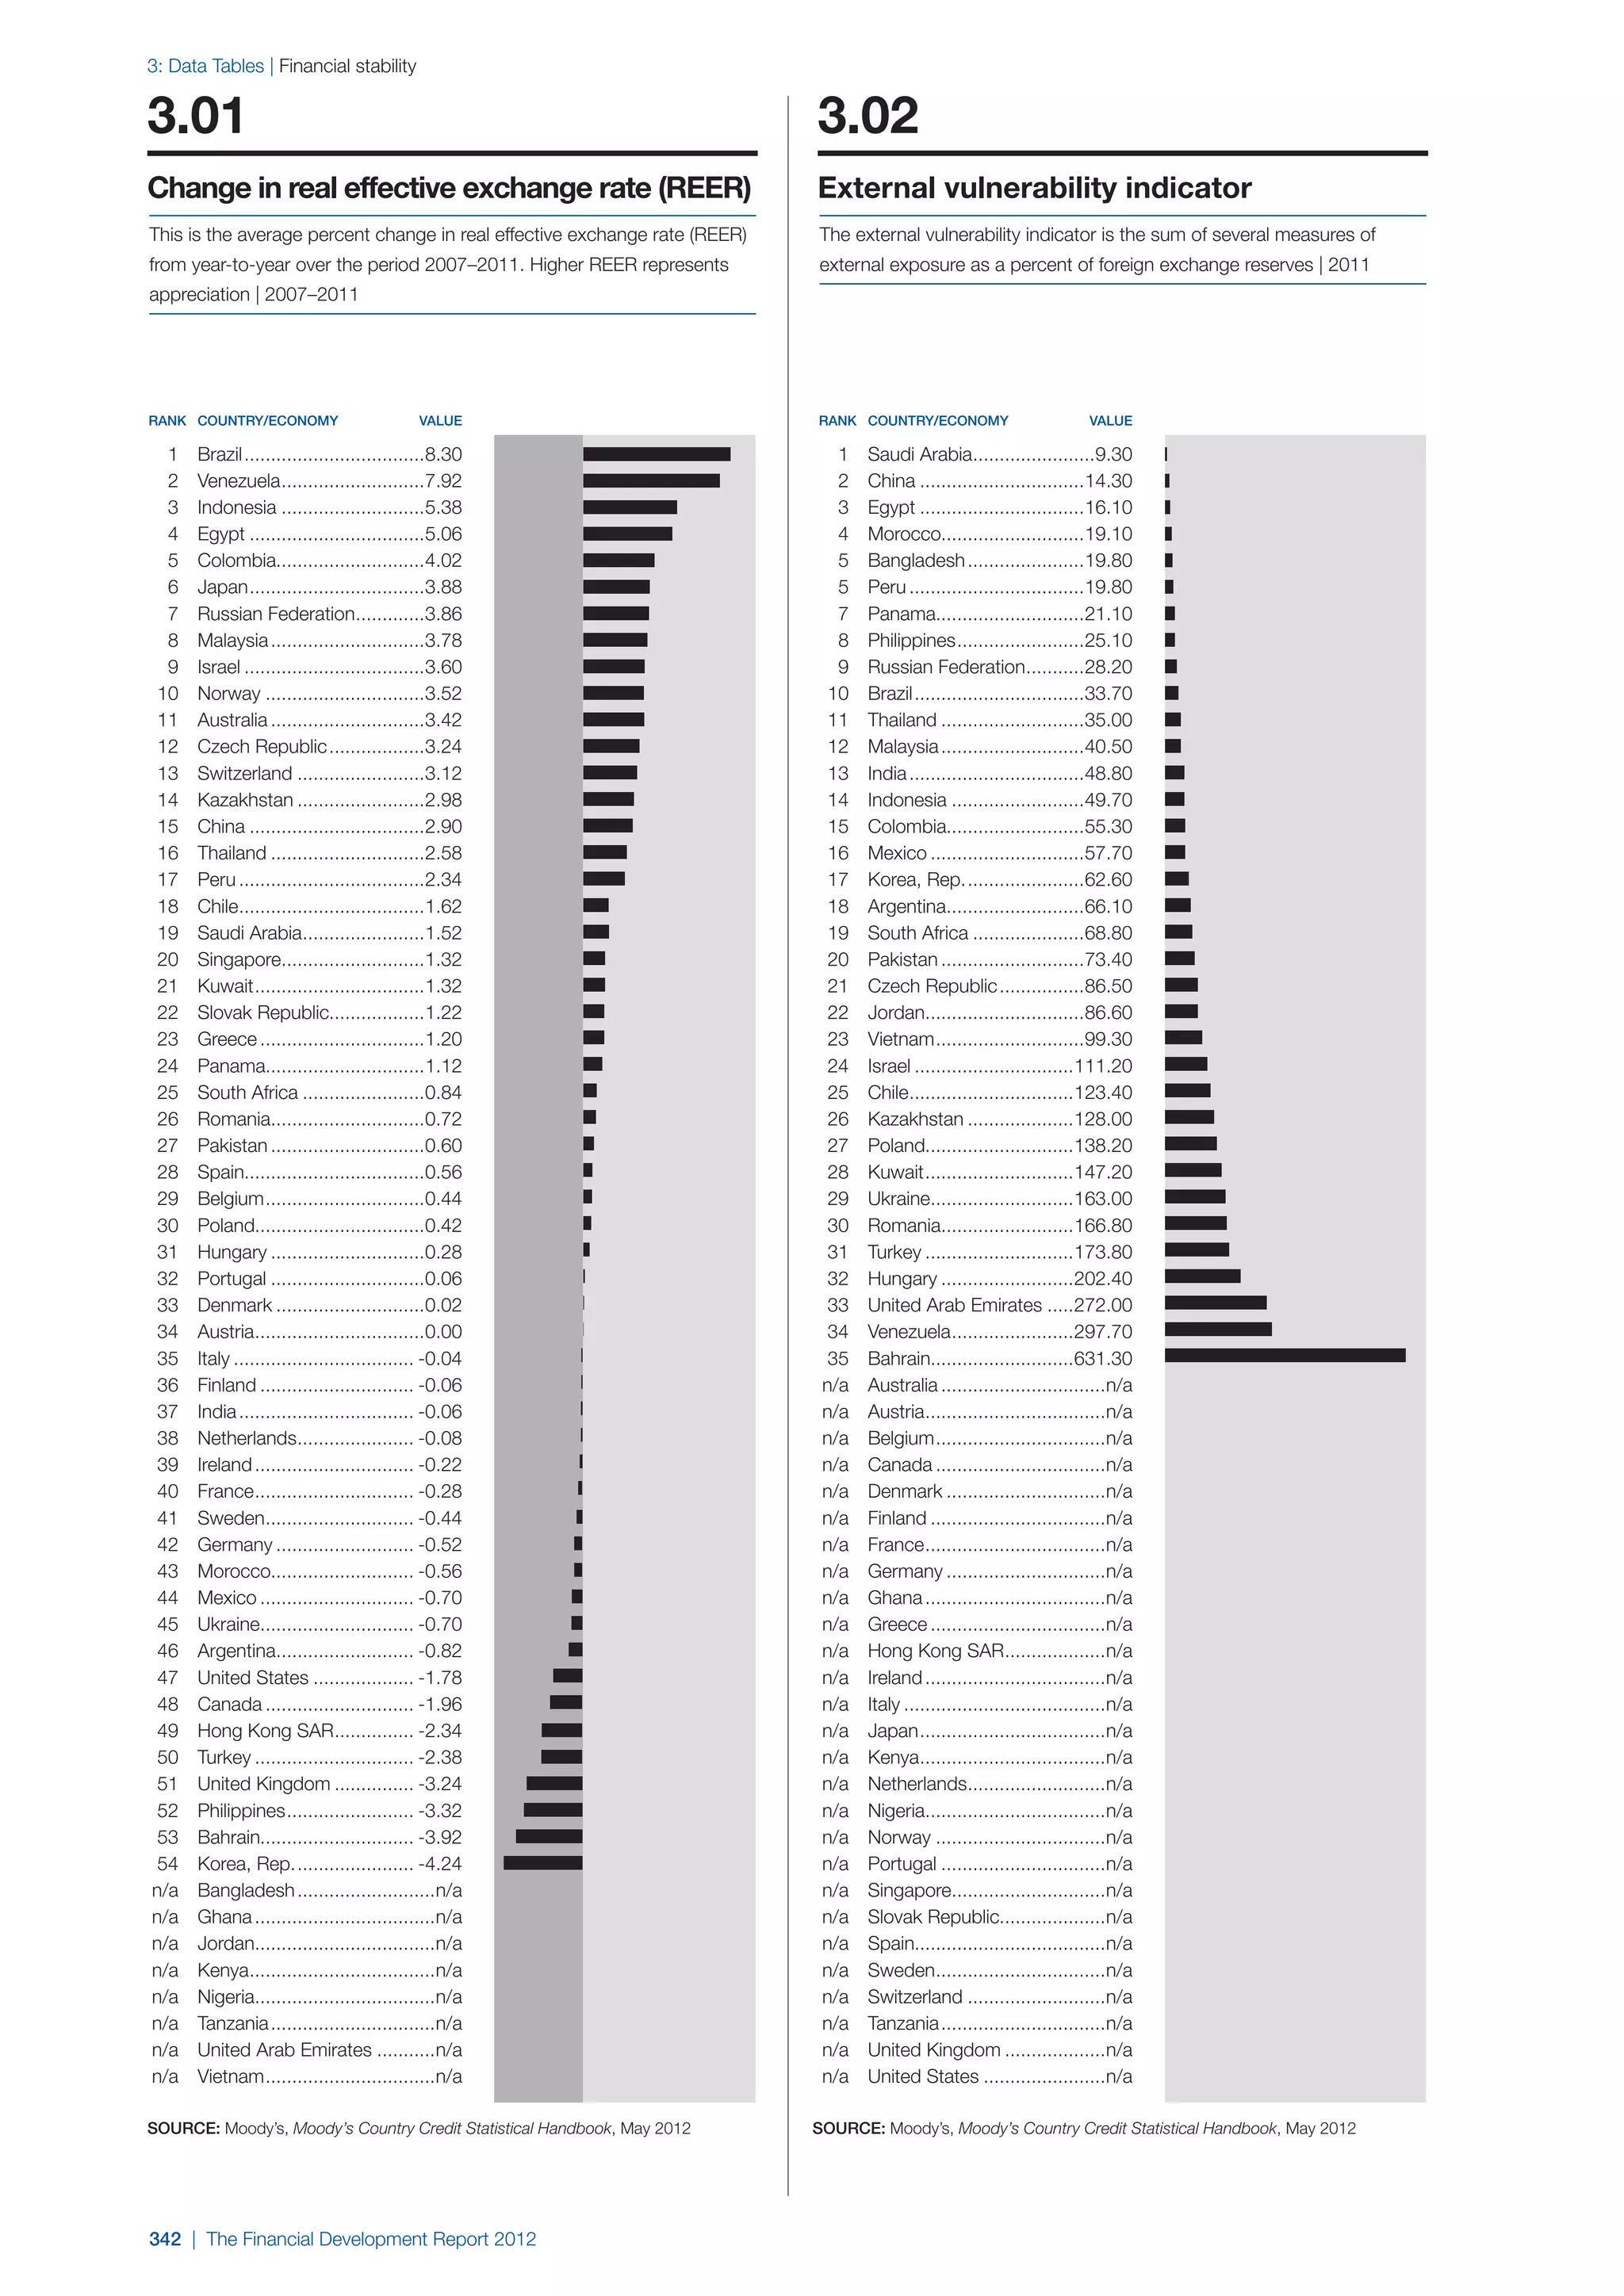
![1.2: Drawing Boundaries Around and Through the Banking System
under the supervision of bank regulators have a different and In some respects, ring-fencing is less severe than the Volcker
historically weaker regime of capital requirements than banks Rule, which precludes a significant amount of trading by a
and do not have direct access to the safety net. They could, bank holding company even when conducted by a broker-
then, pose risks to financial stability. This possibility amplifies dealer affiliate that does not in principle have access to the
the importance of regulatory supervision for systemically bank’s capital.24 In practice, it is not clear which of these
important financial institutions (SIFIs) that are not banks. two forms of separation between traditional banking and
In the United States, the Financial Stability Oversight Council “wholesale” trading activities will prove to be more effective
(FSOC), a committee of all major US financial regulatory at maintaining financial stability.
agencies, will designate and supervise SIFIs. One of the first
serious tests of the FSOC’s ability to control systemic risk Questions for regulators
outside the regulated banking system is likely to be over the Regulators face a complex array of options for how to draw
regulation of money market mutual funds. regulatory boundaries around and through their banking
systems, and how to promote financial stability outside the
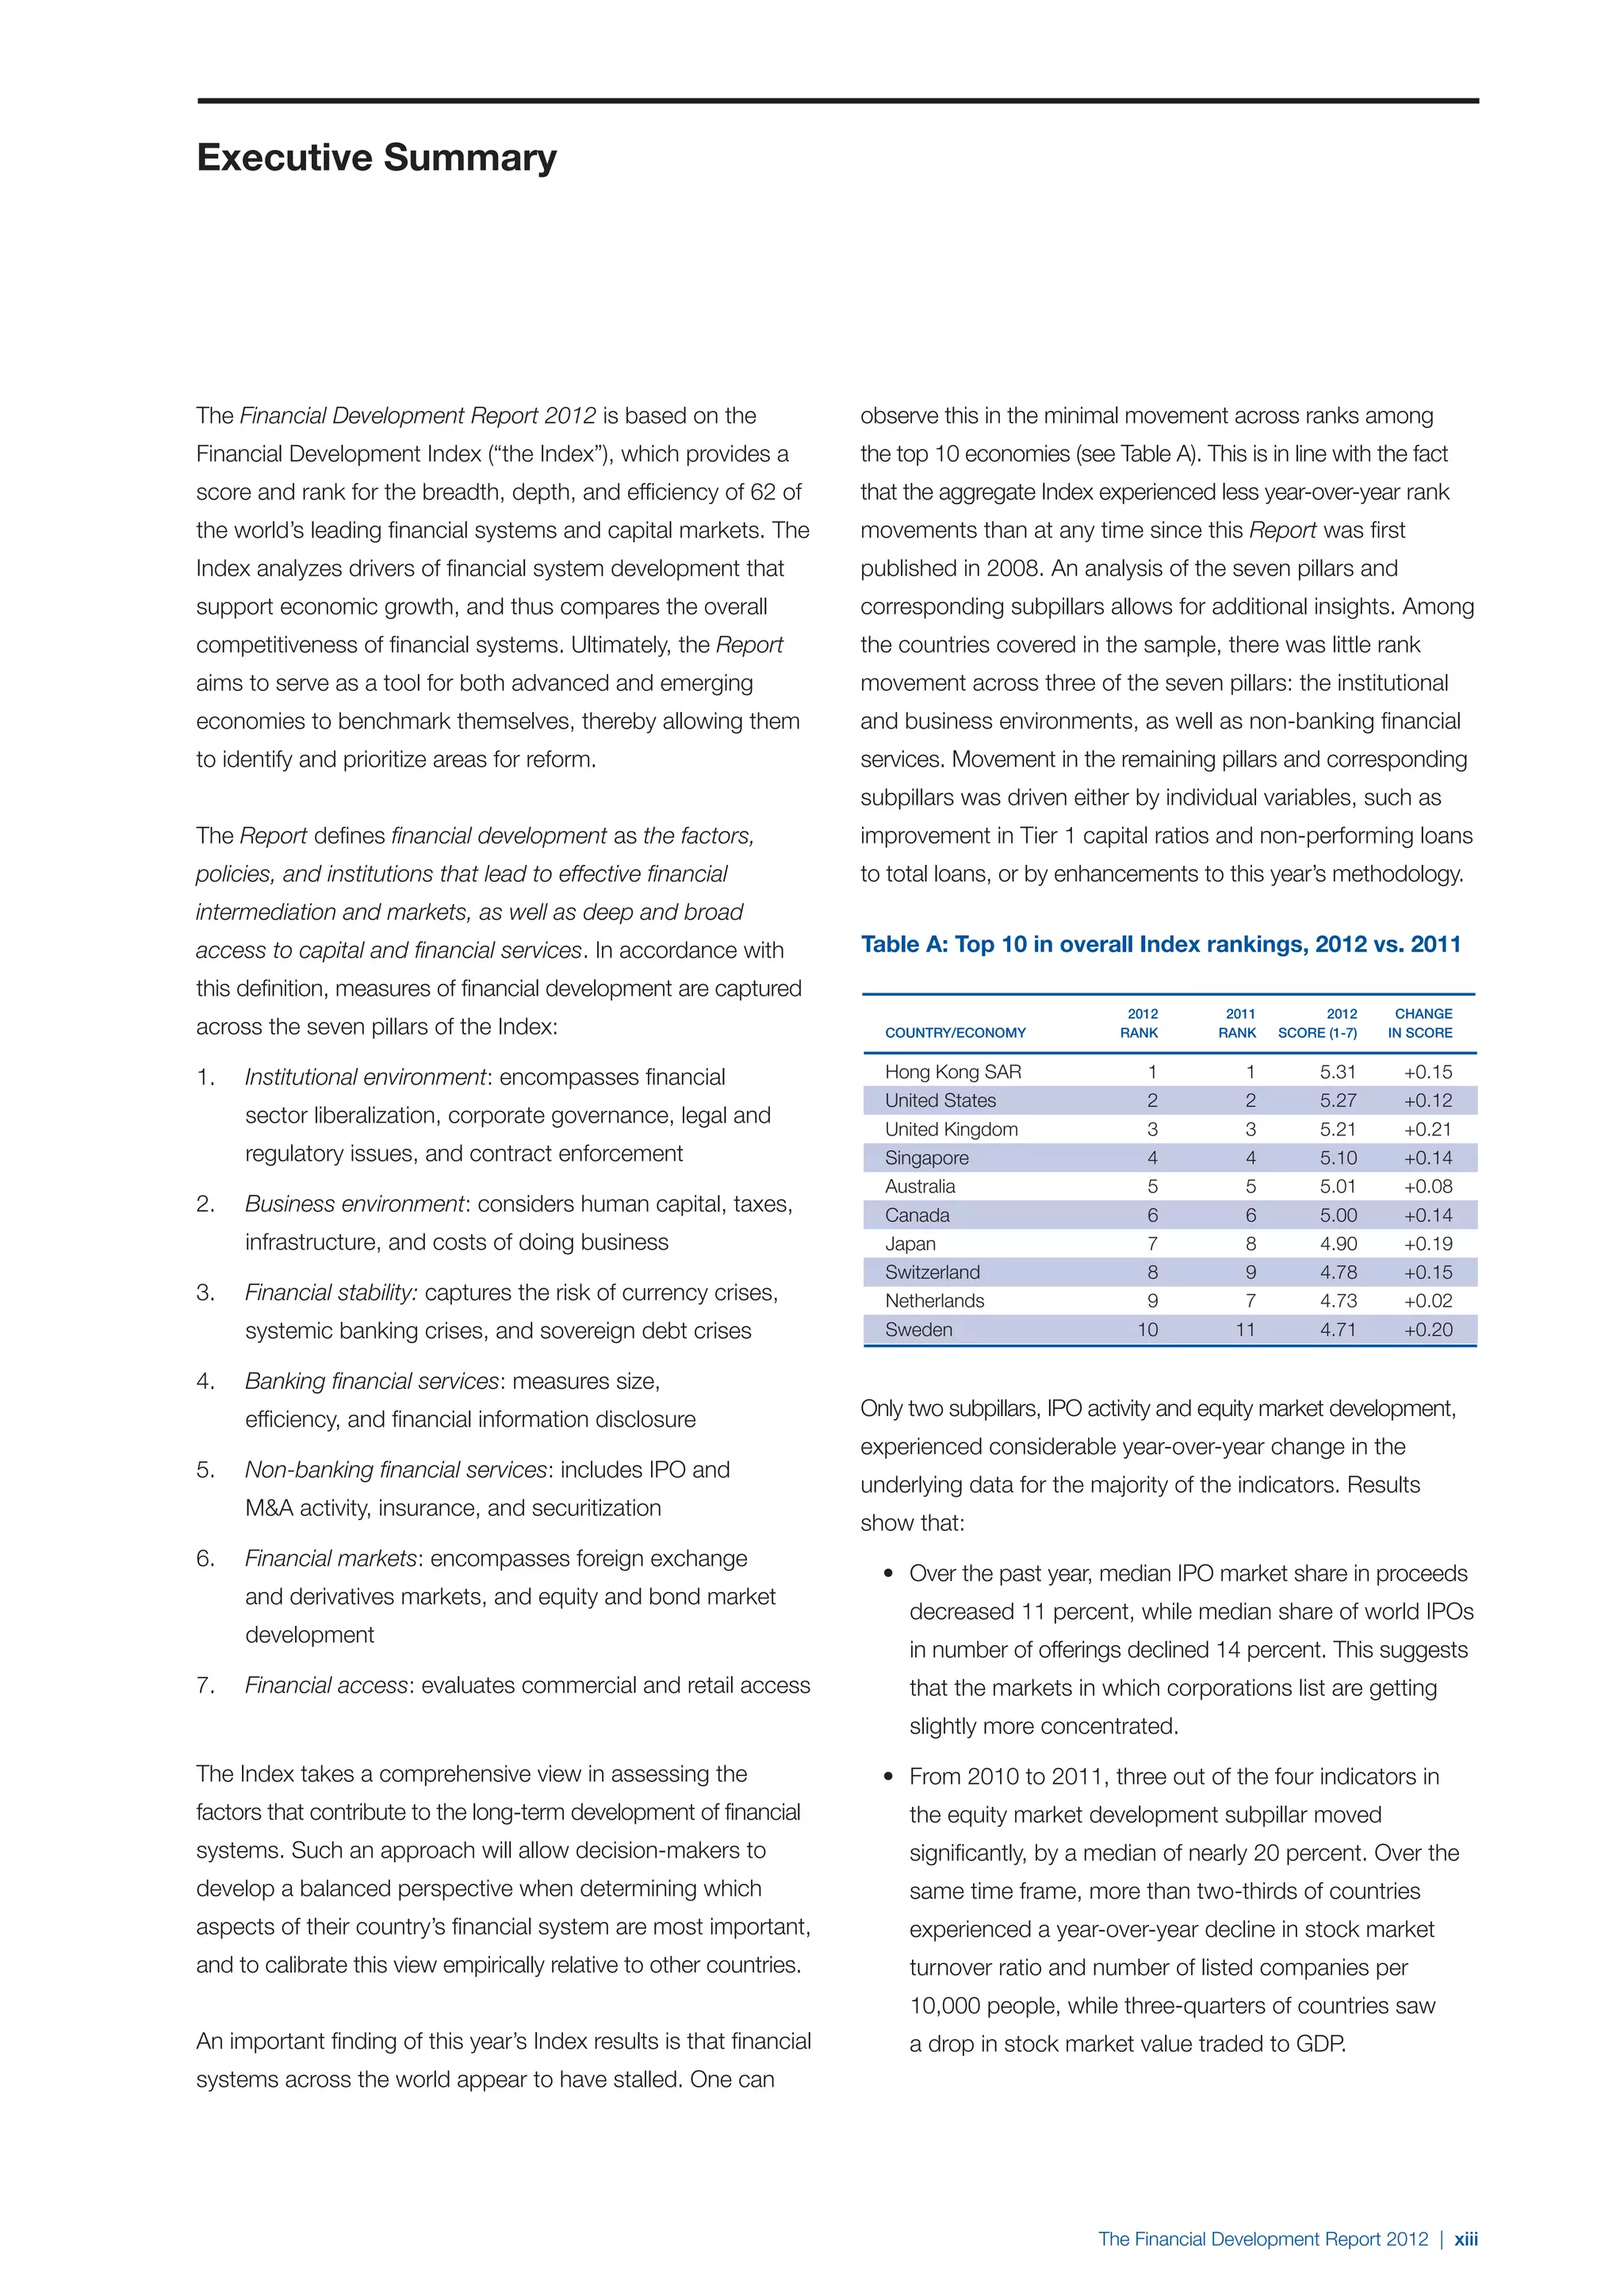
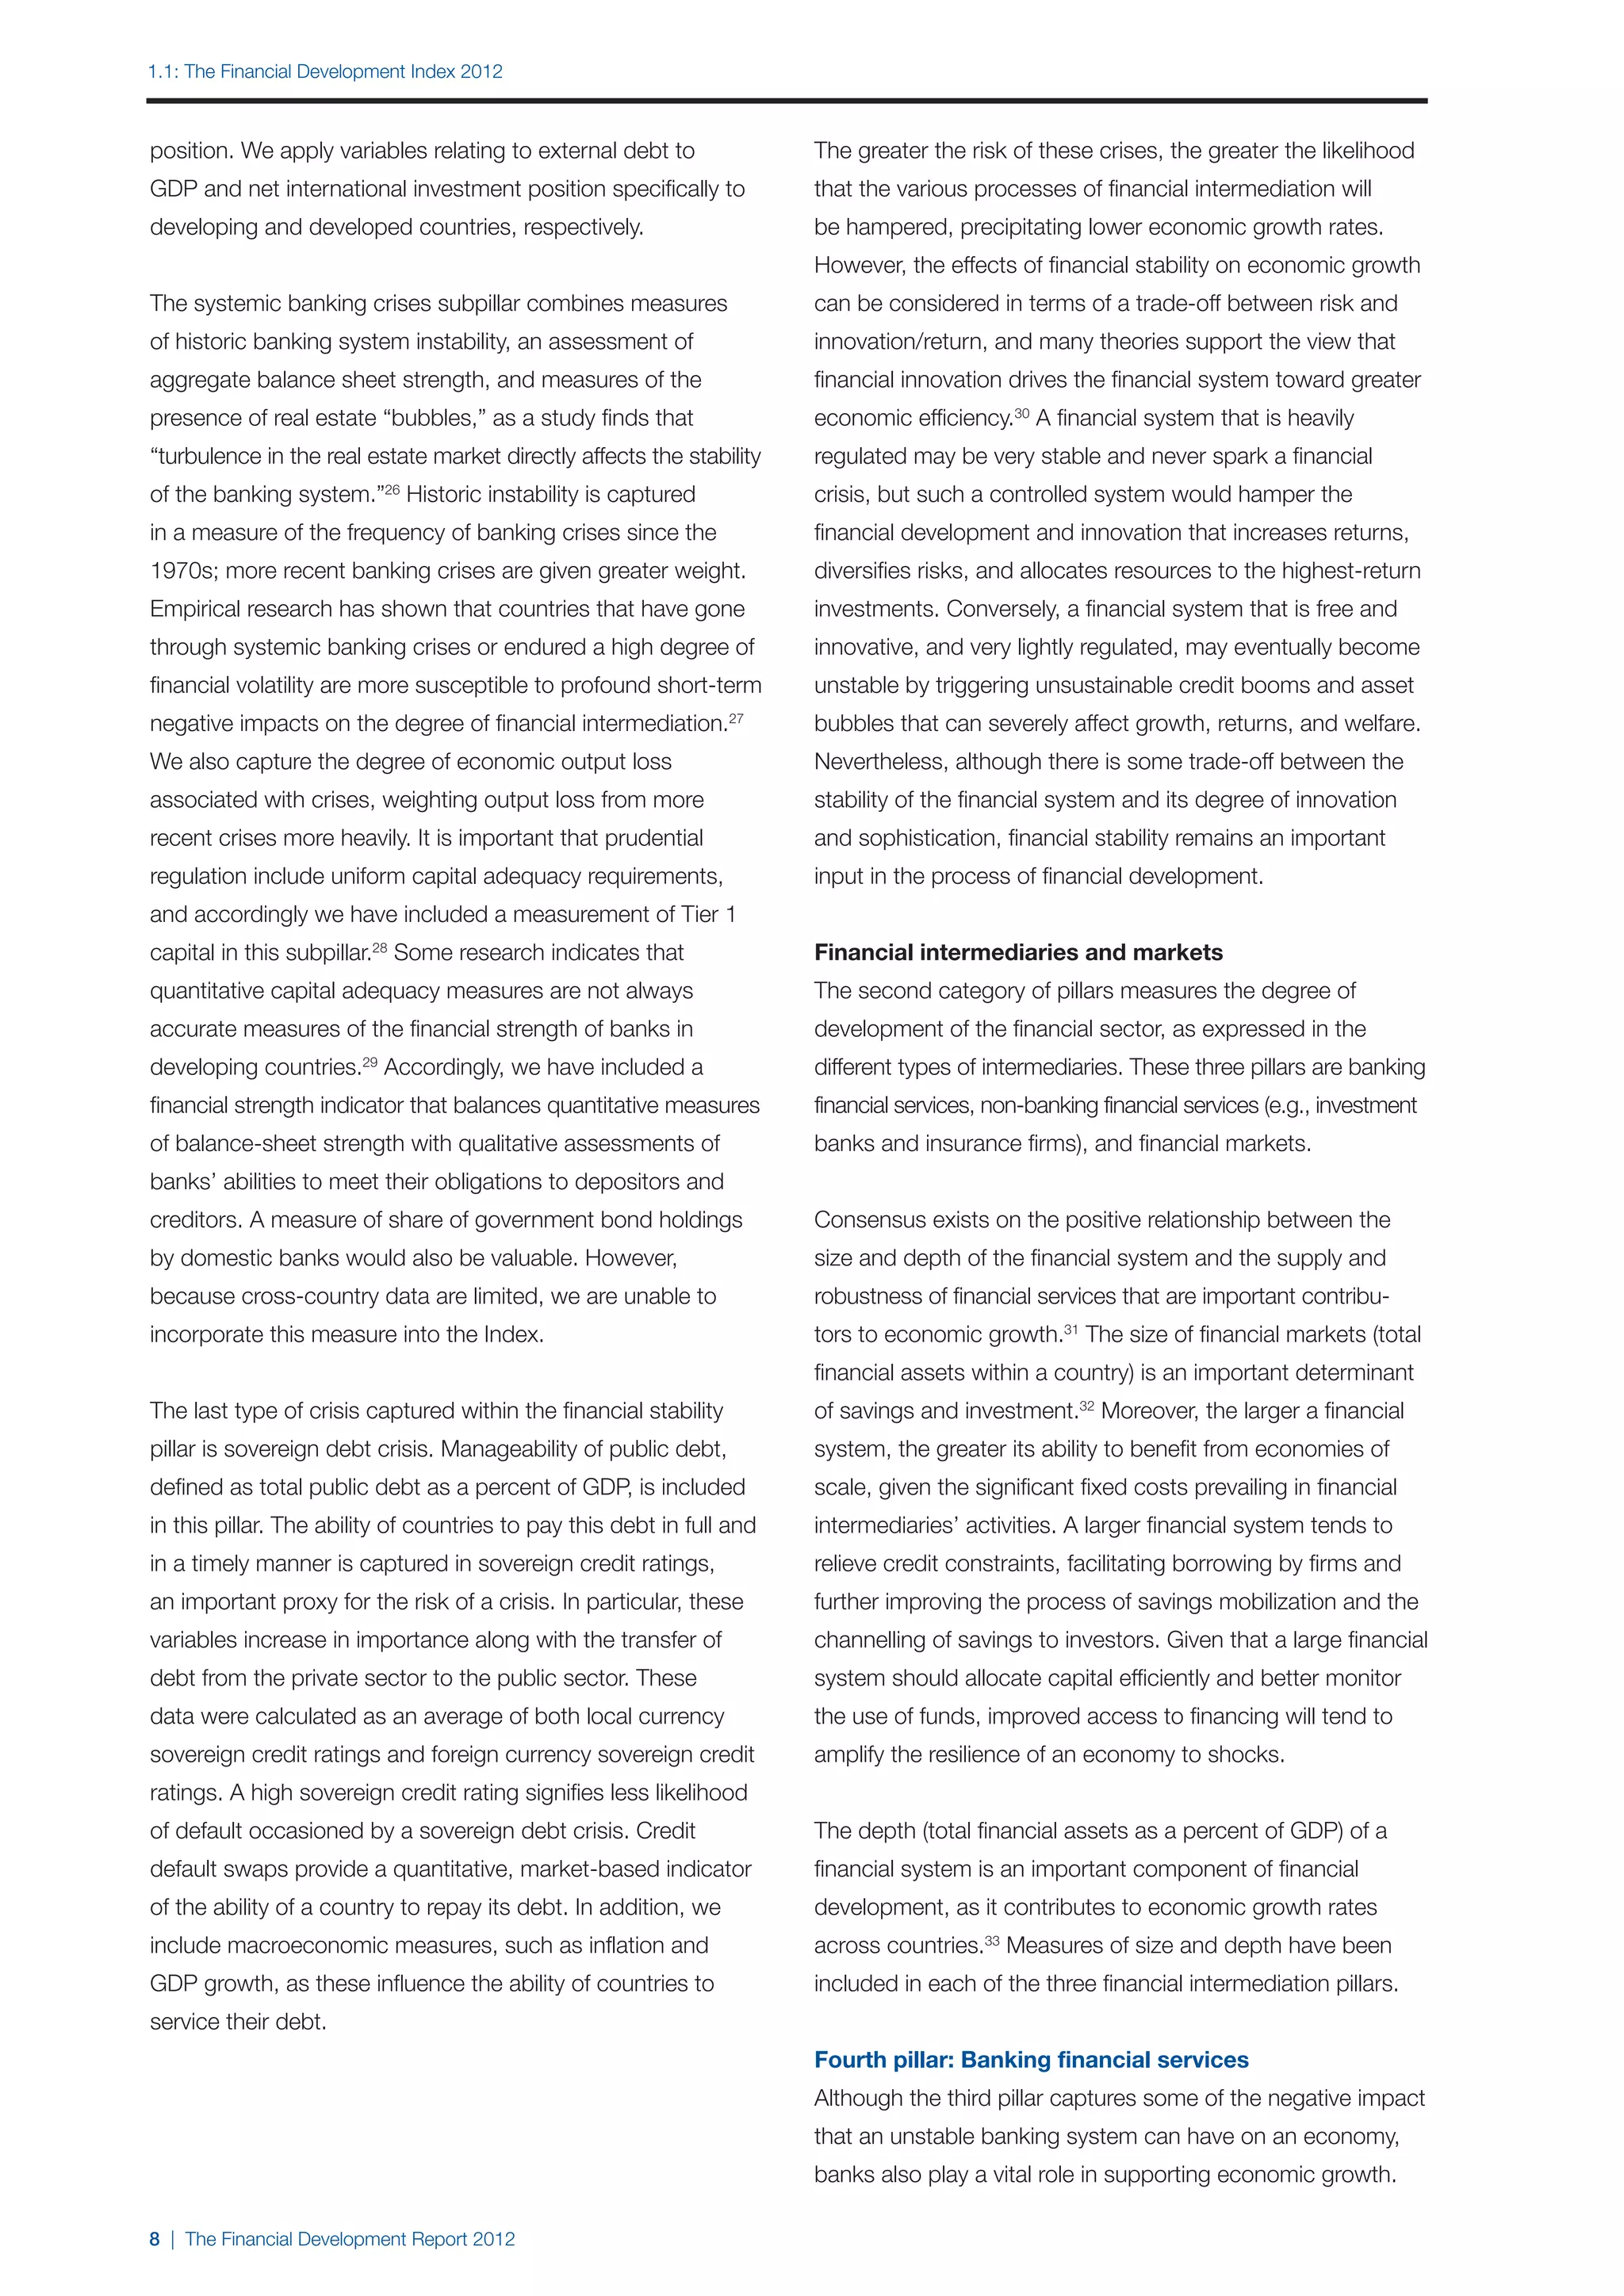
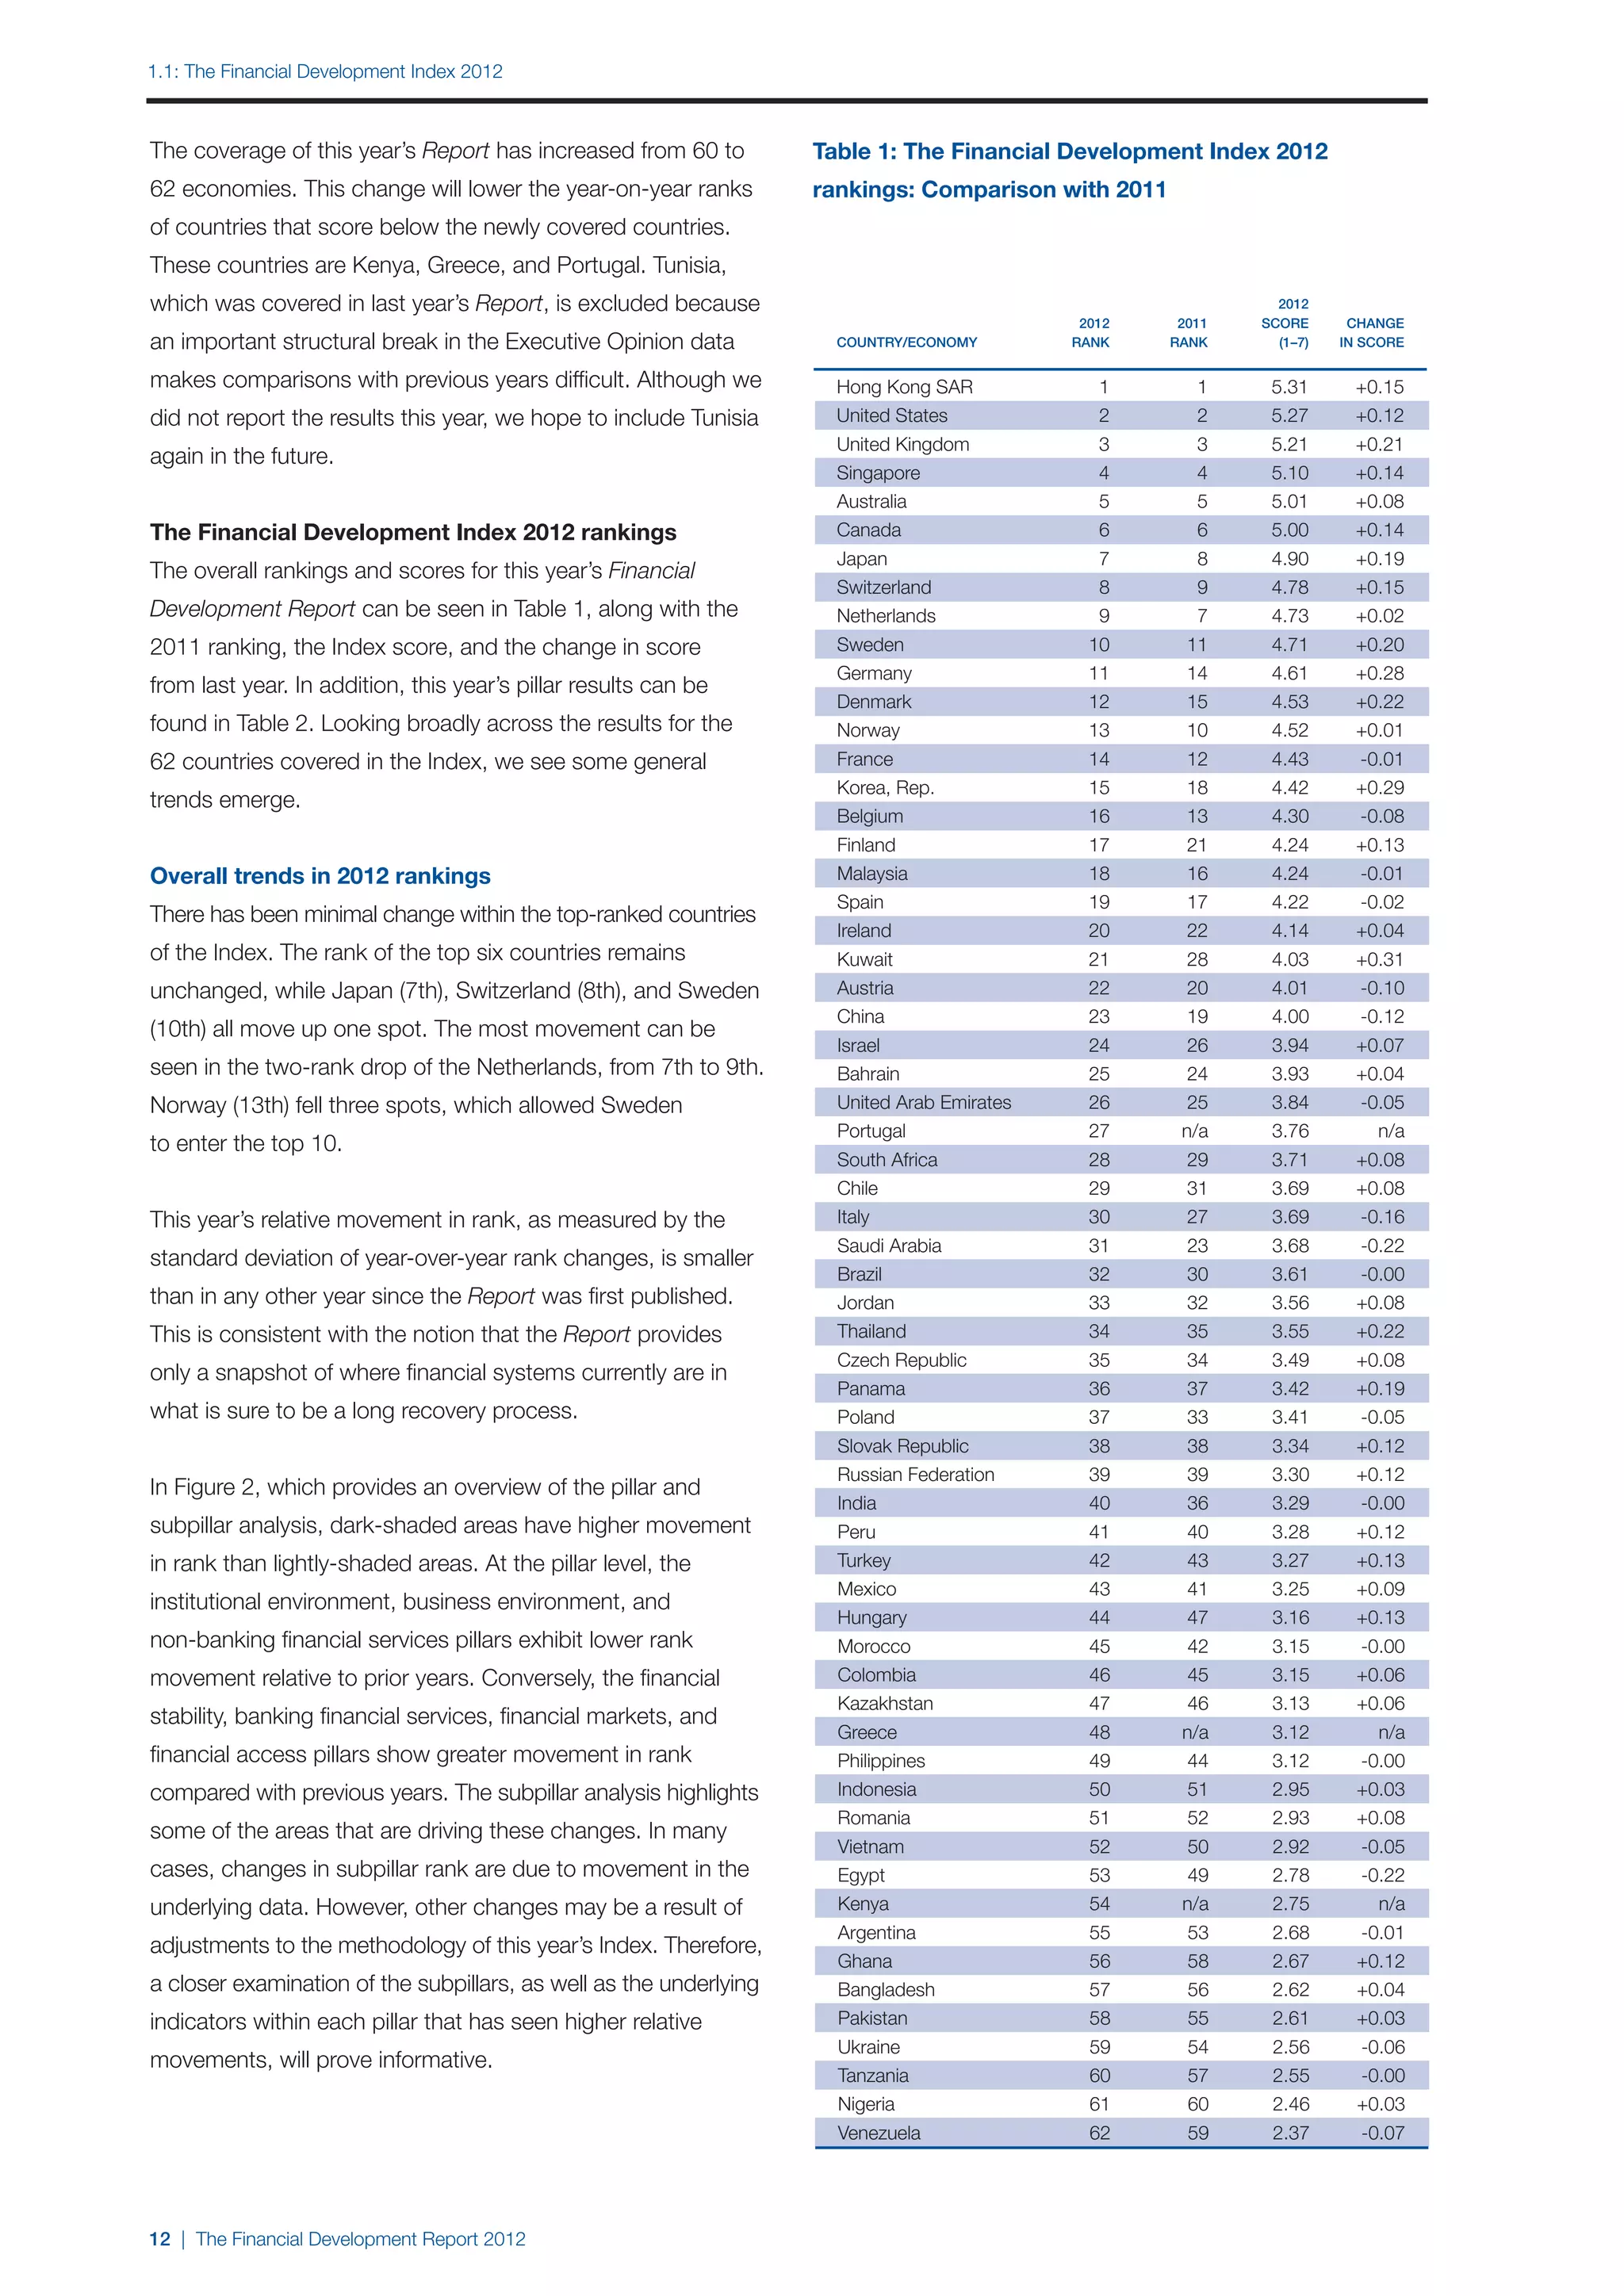
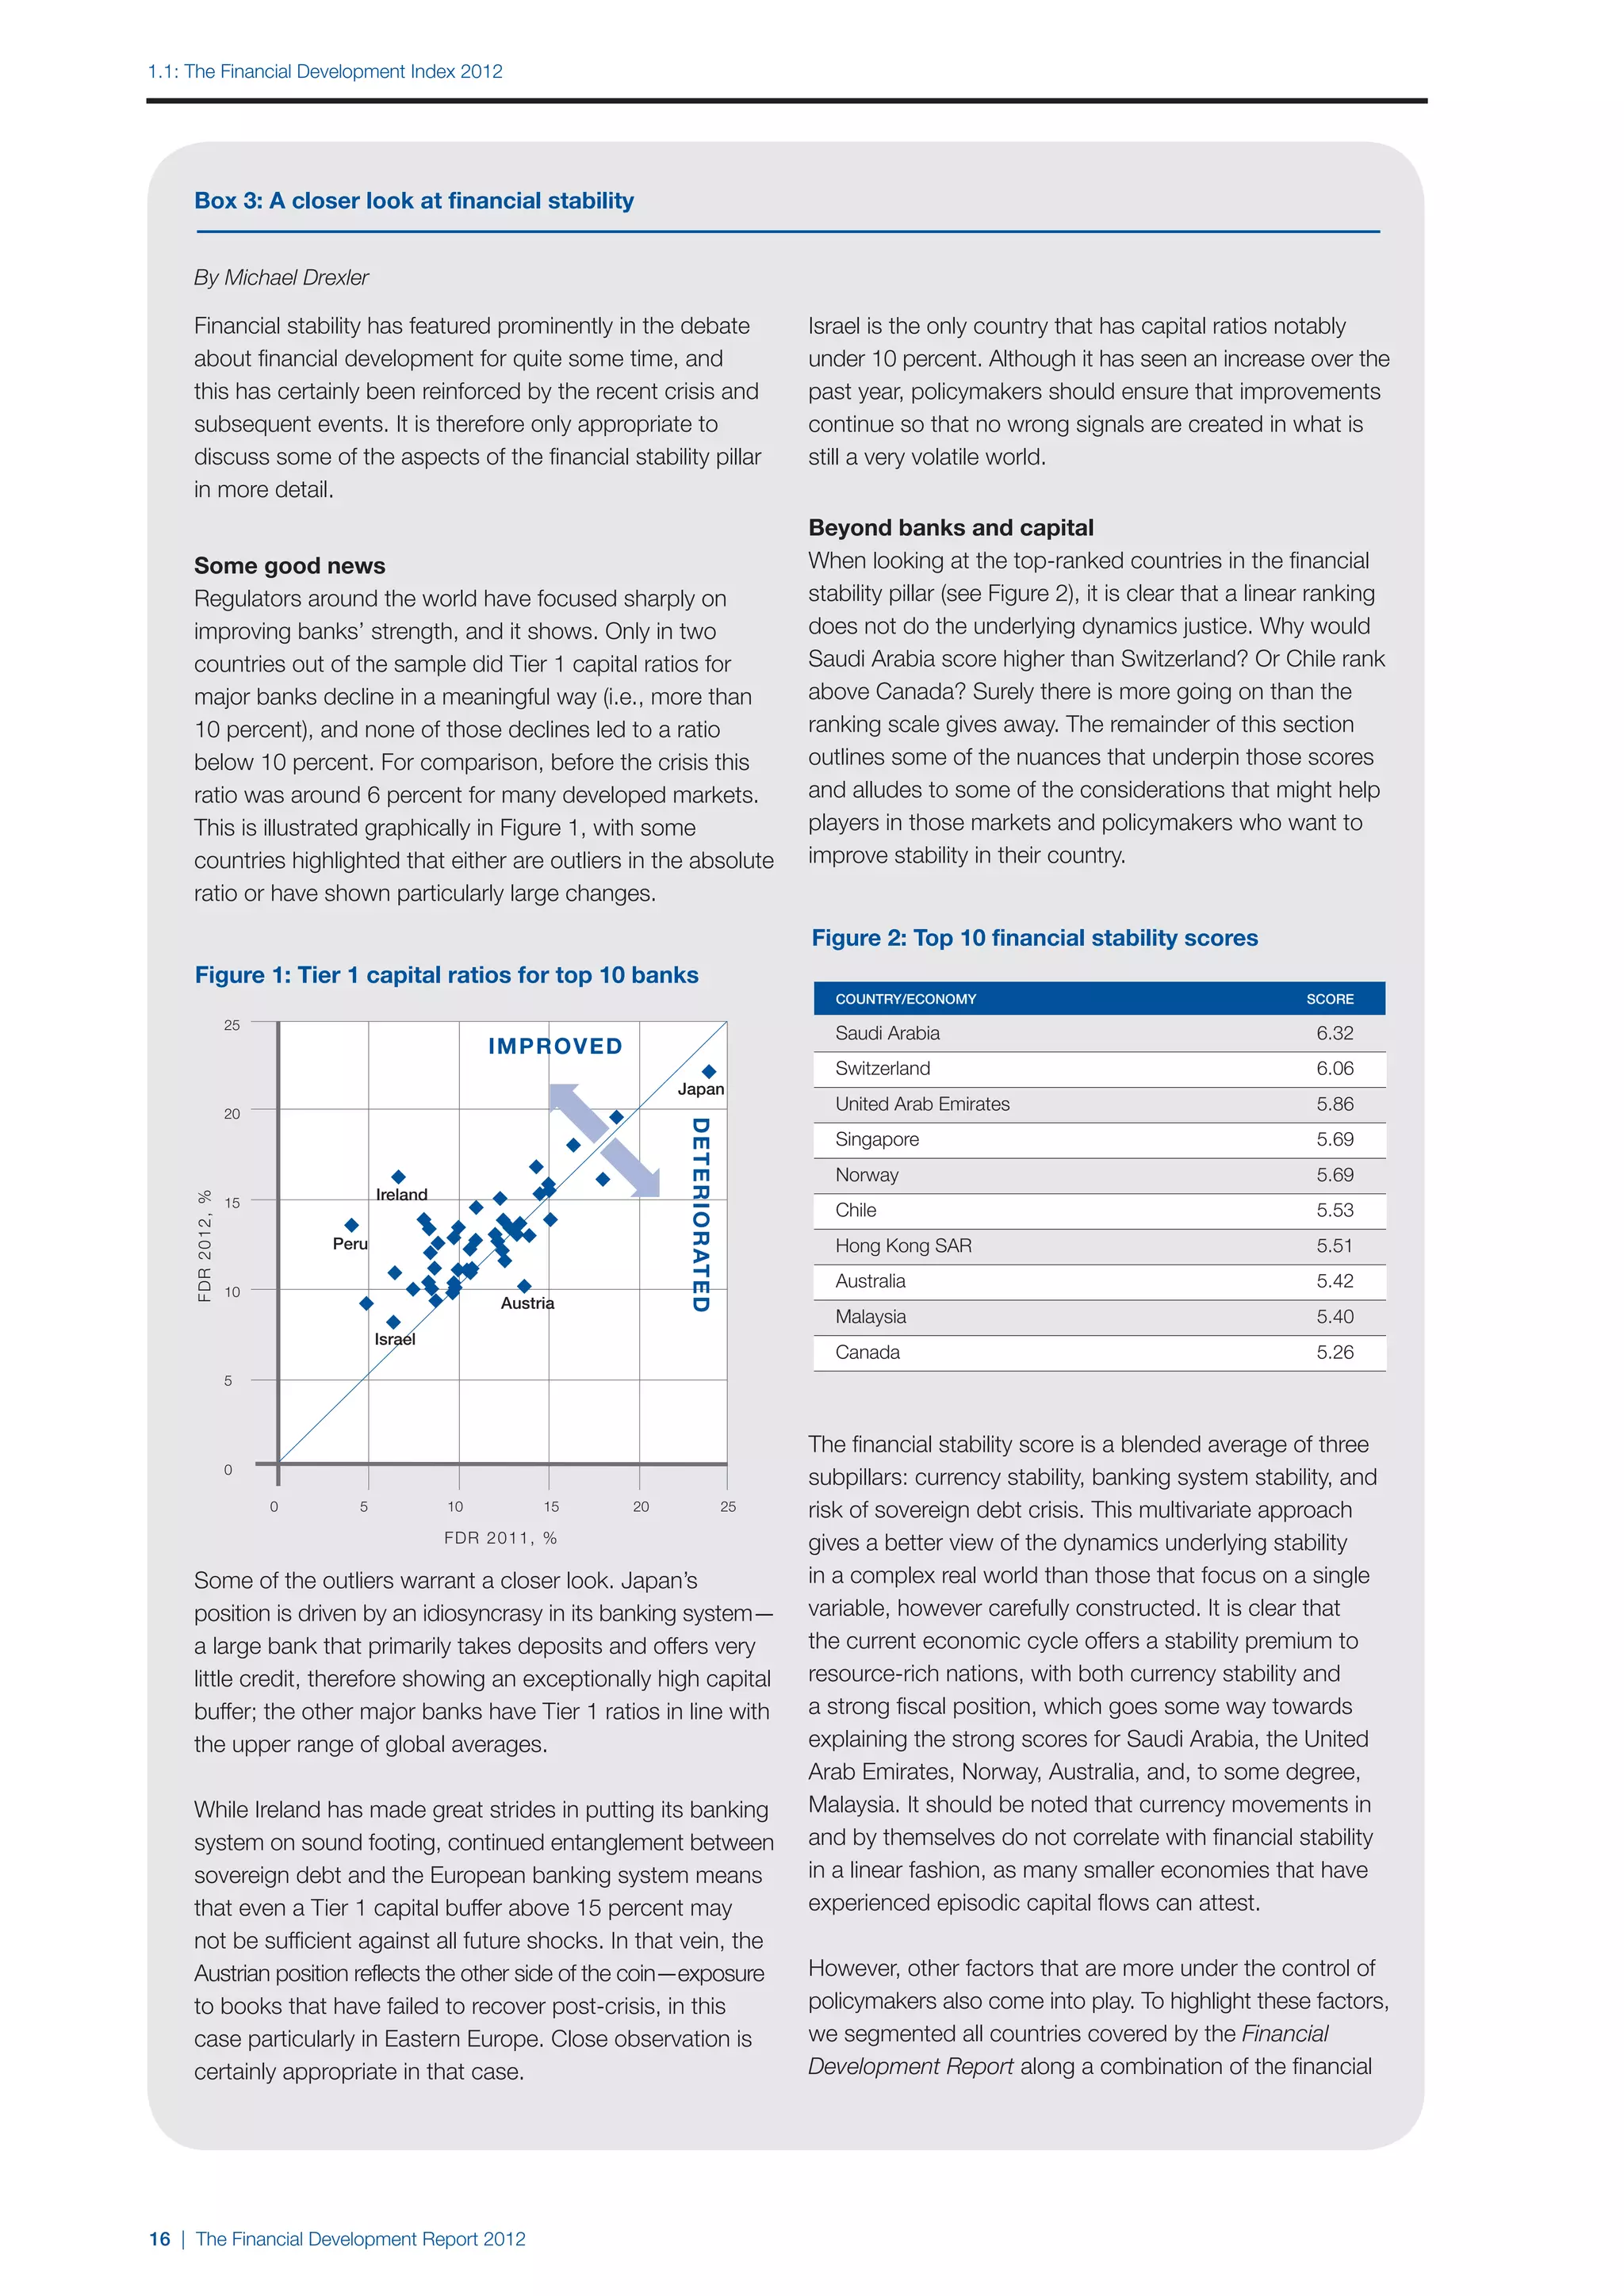
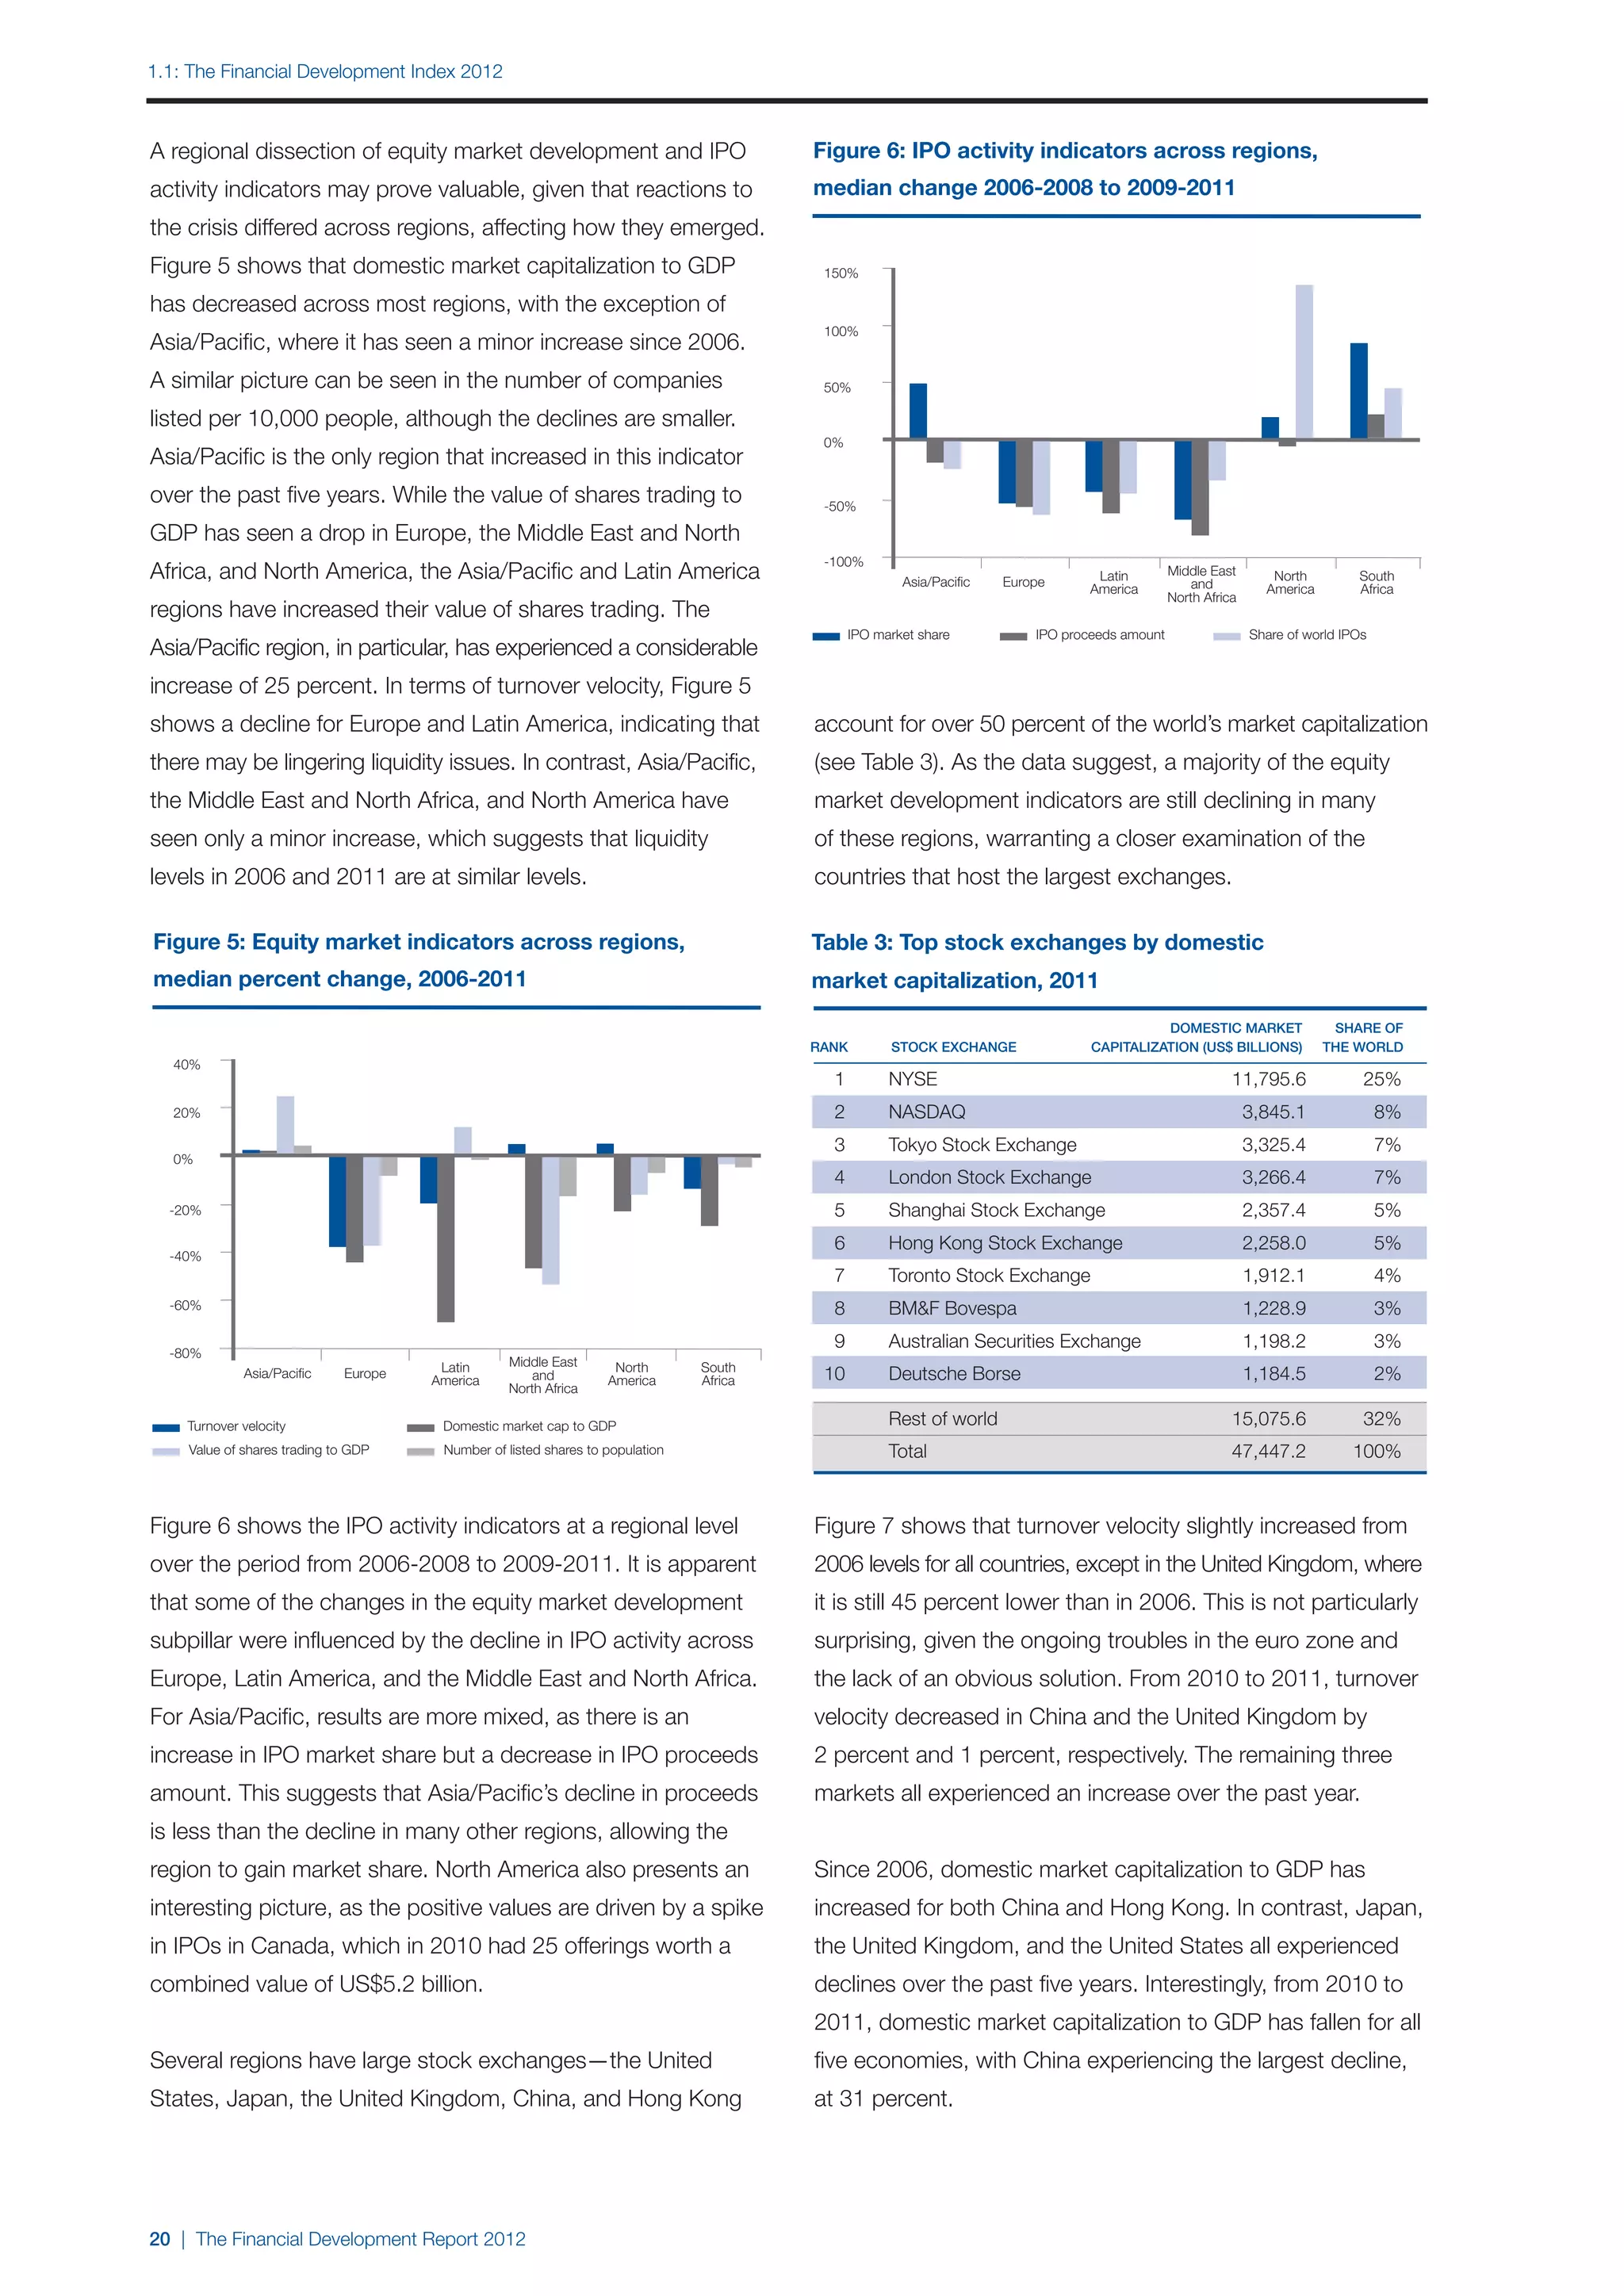
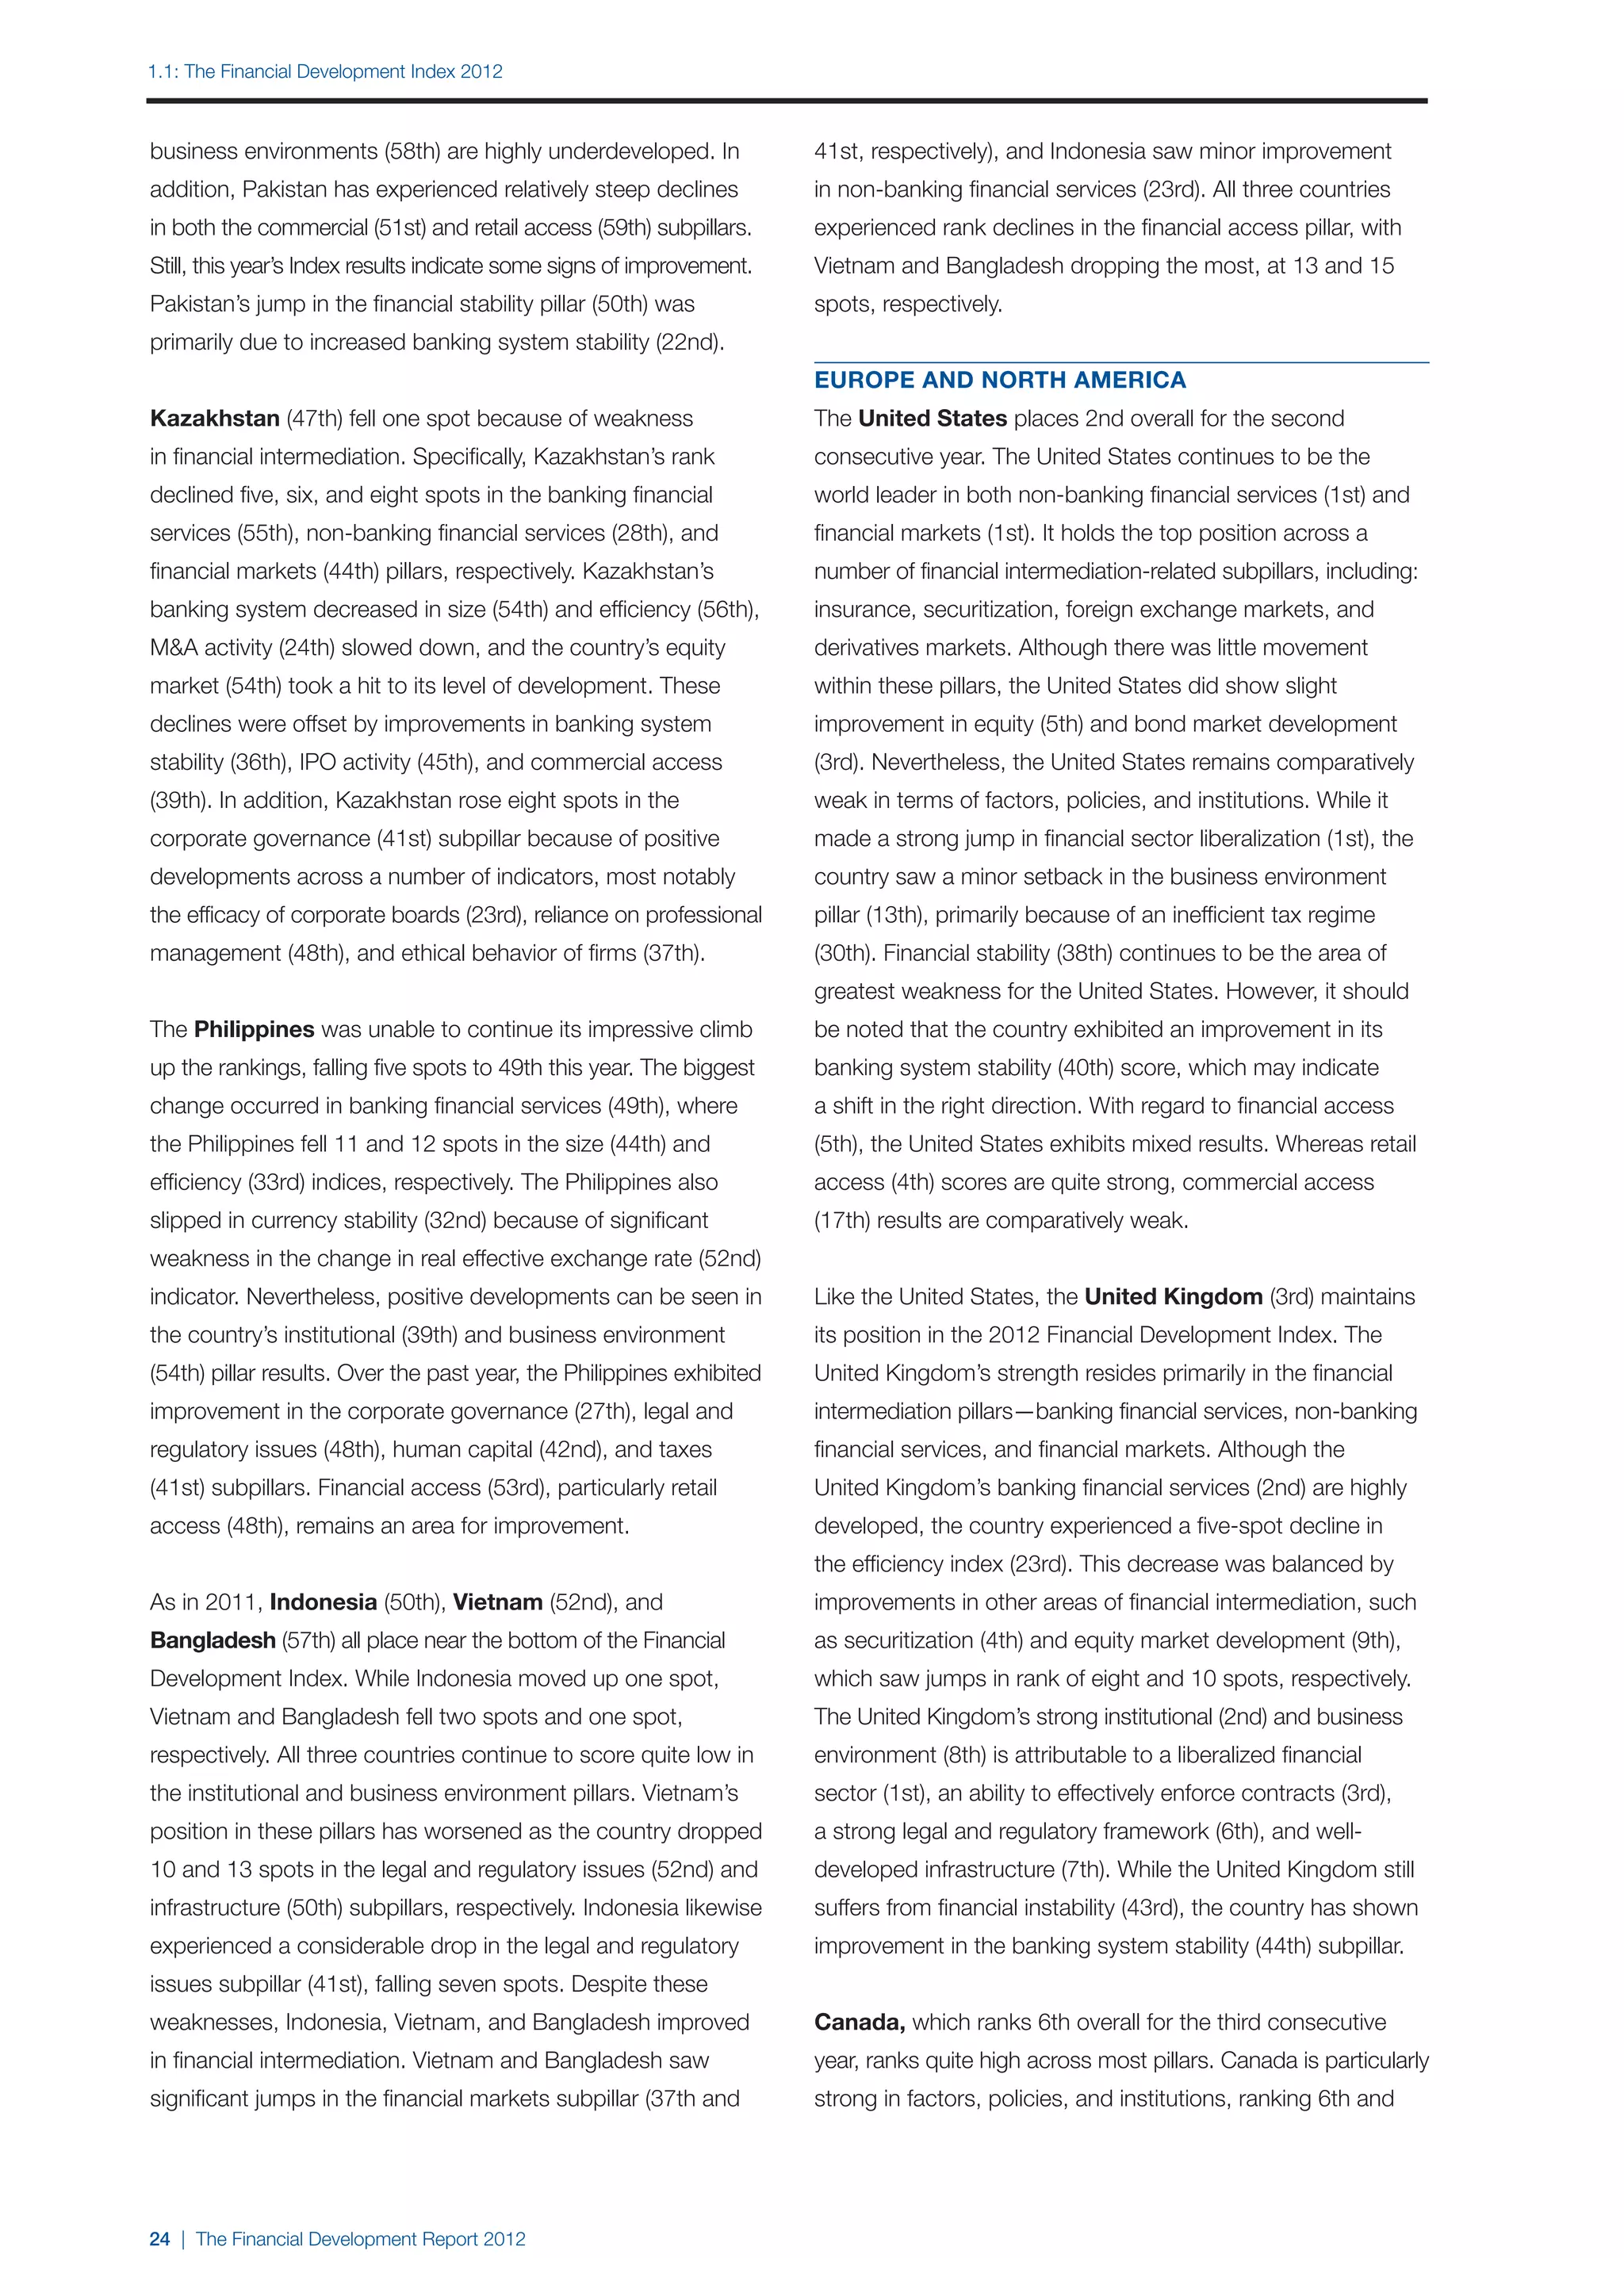
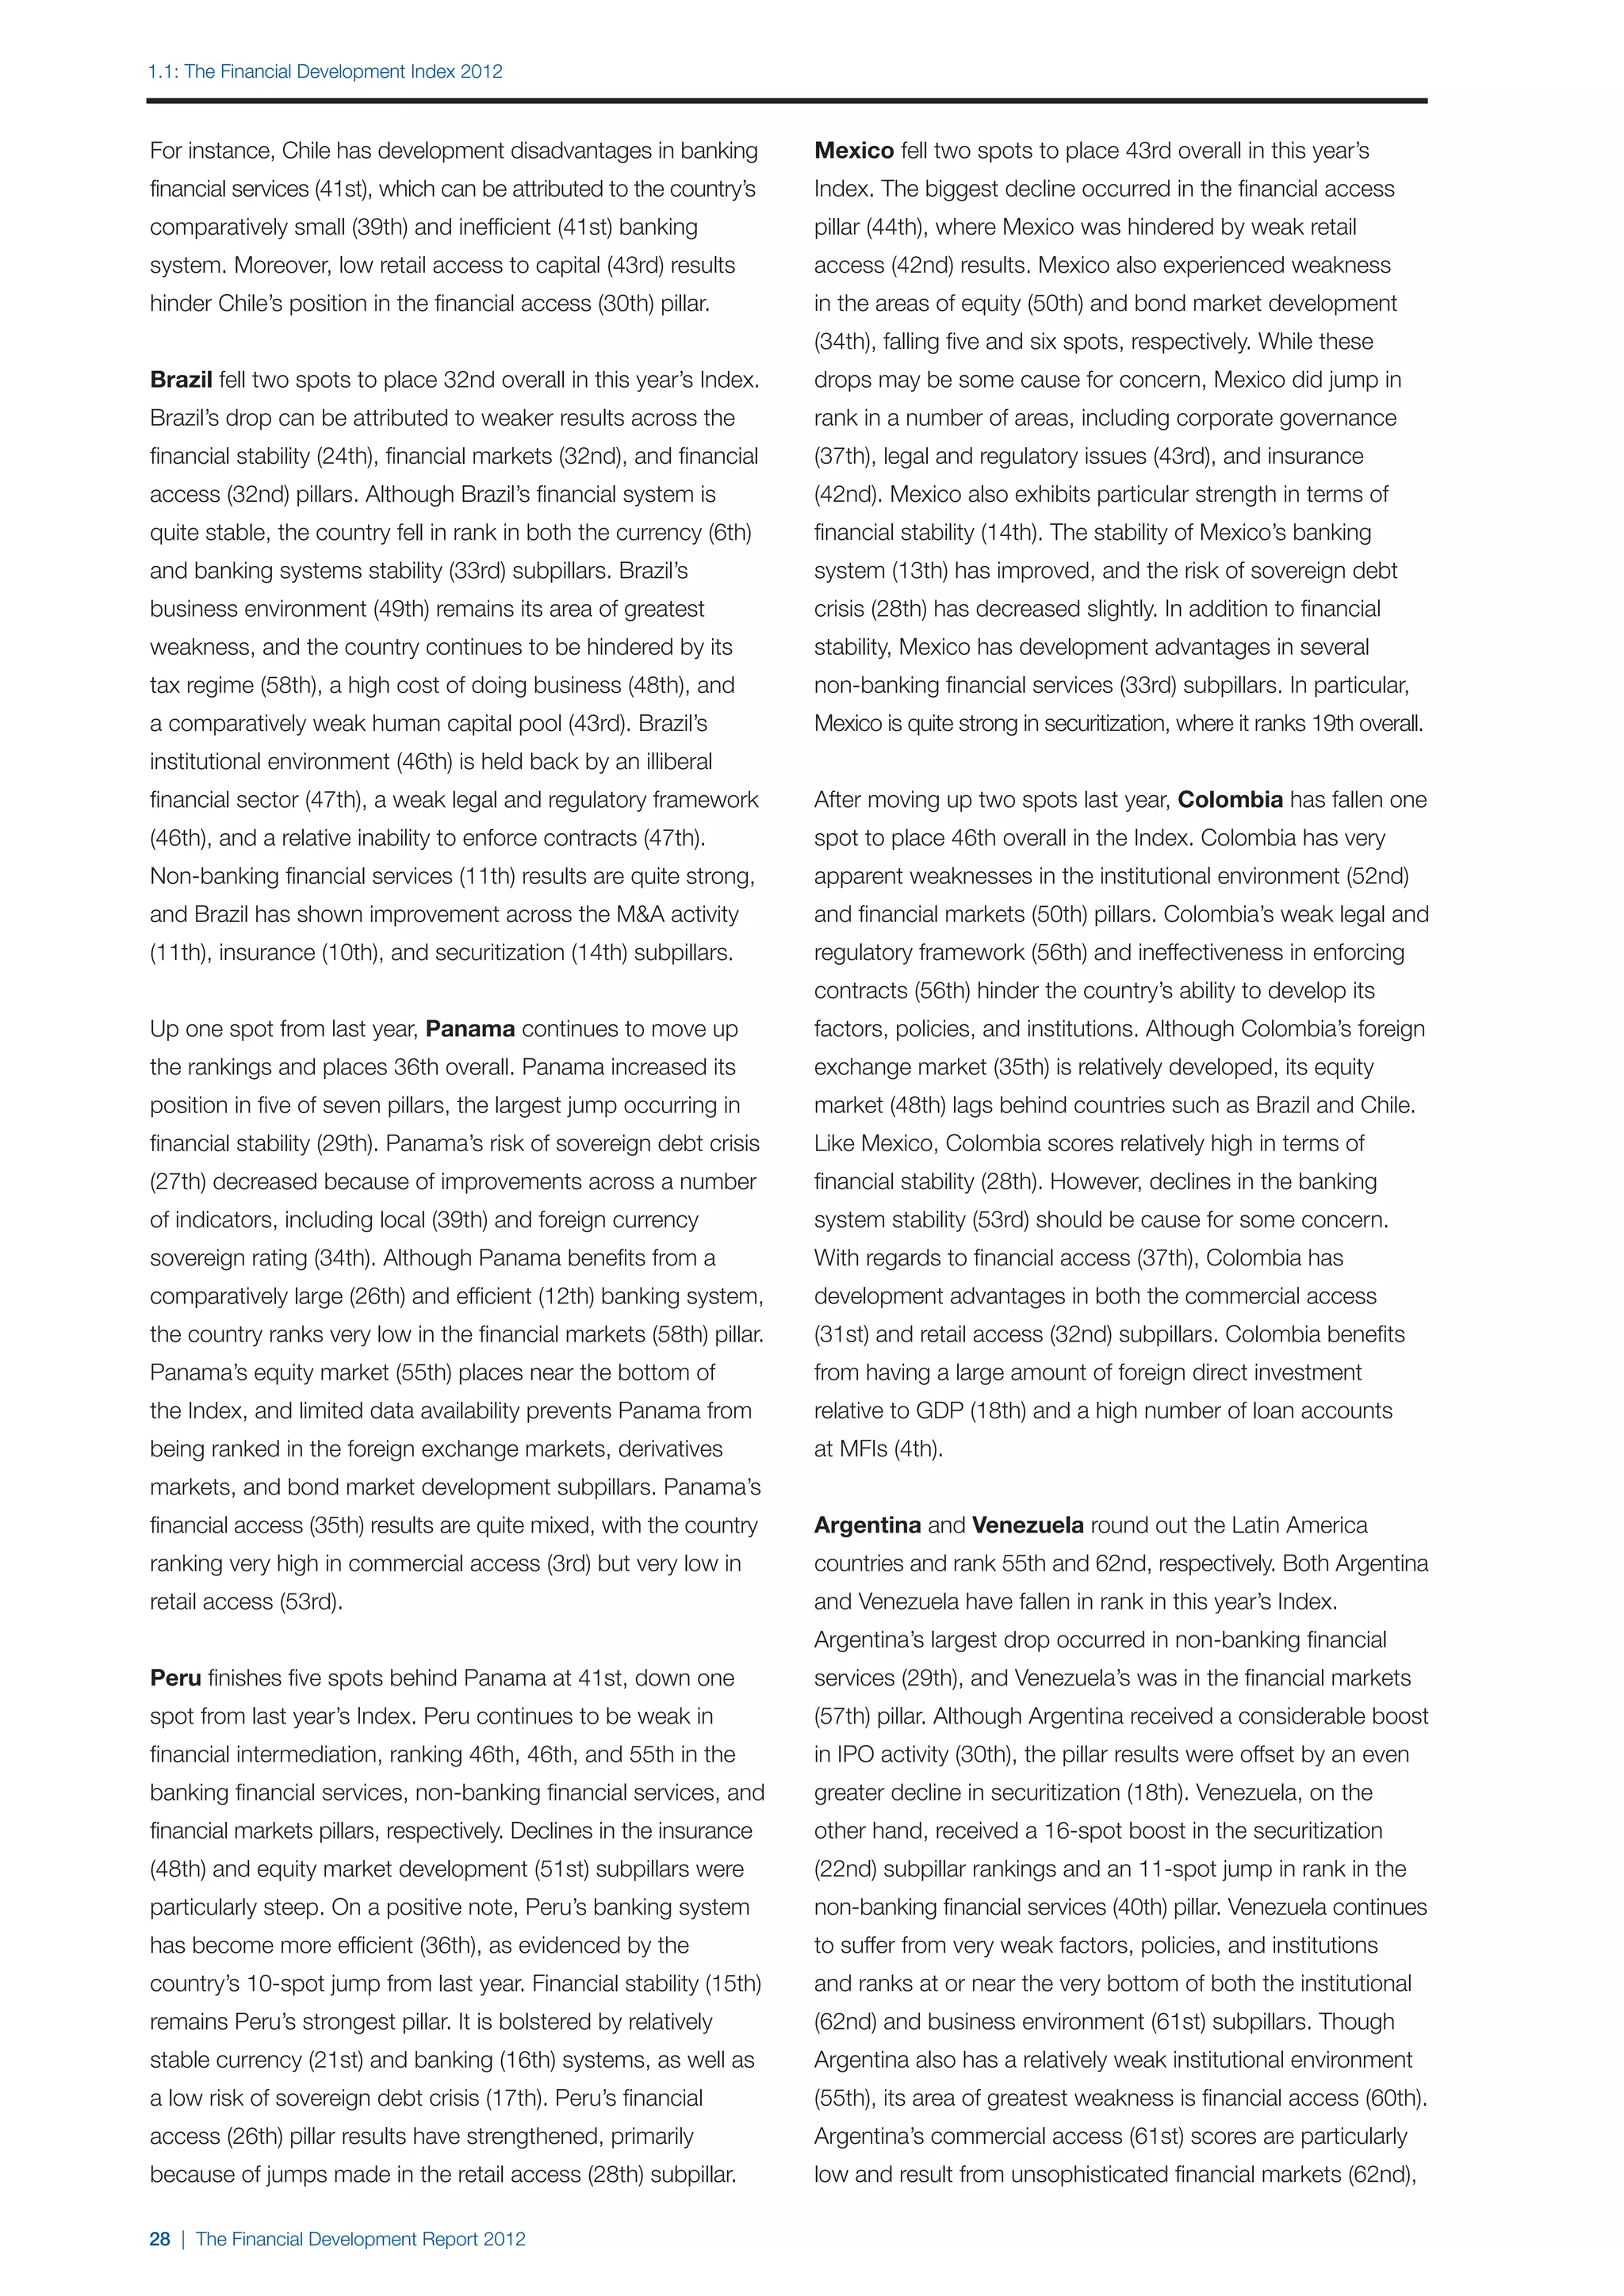
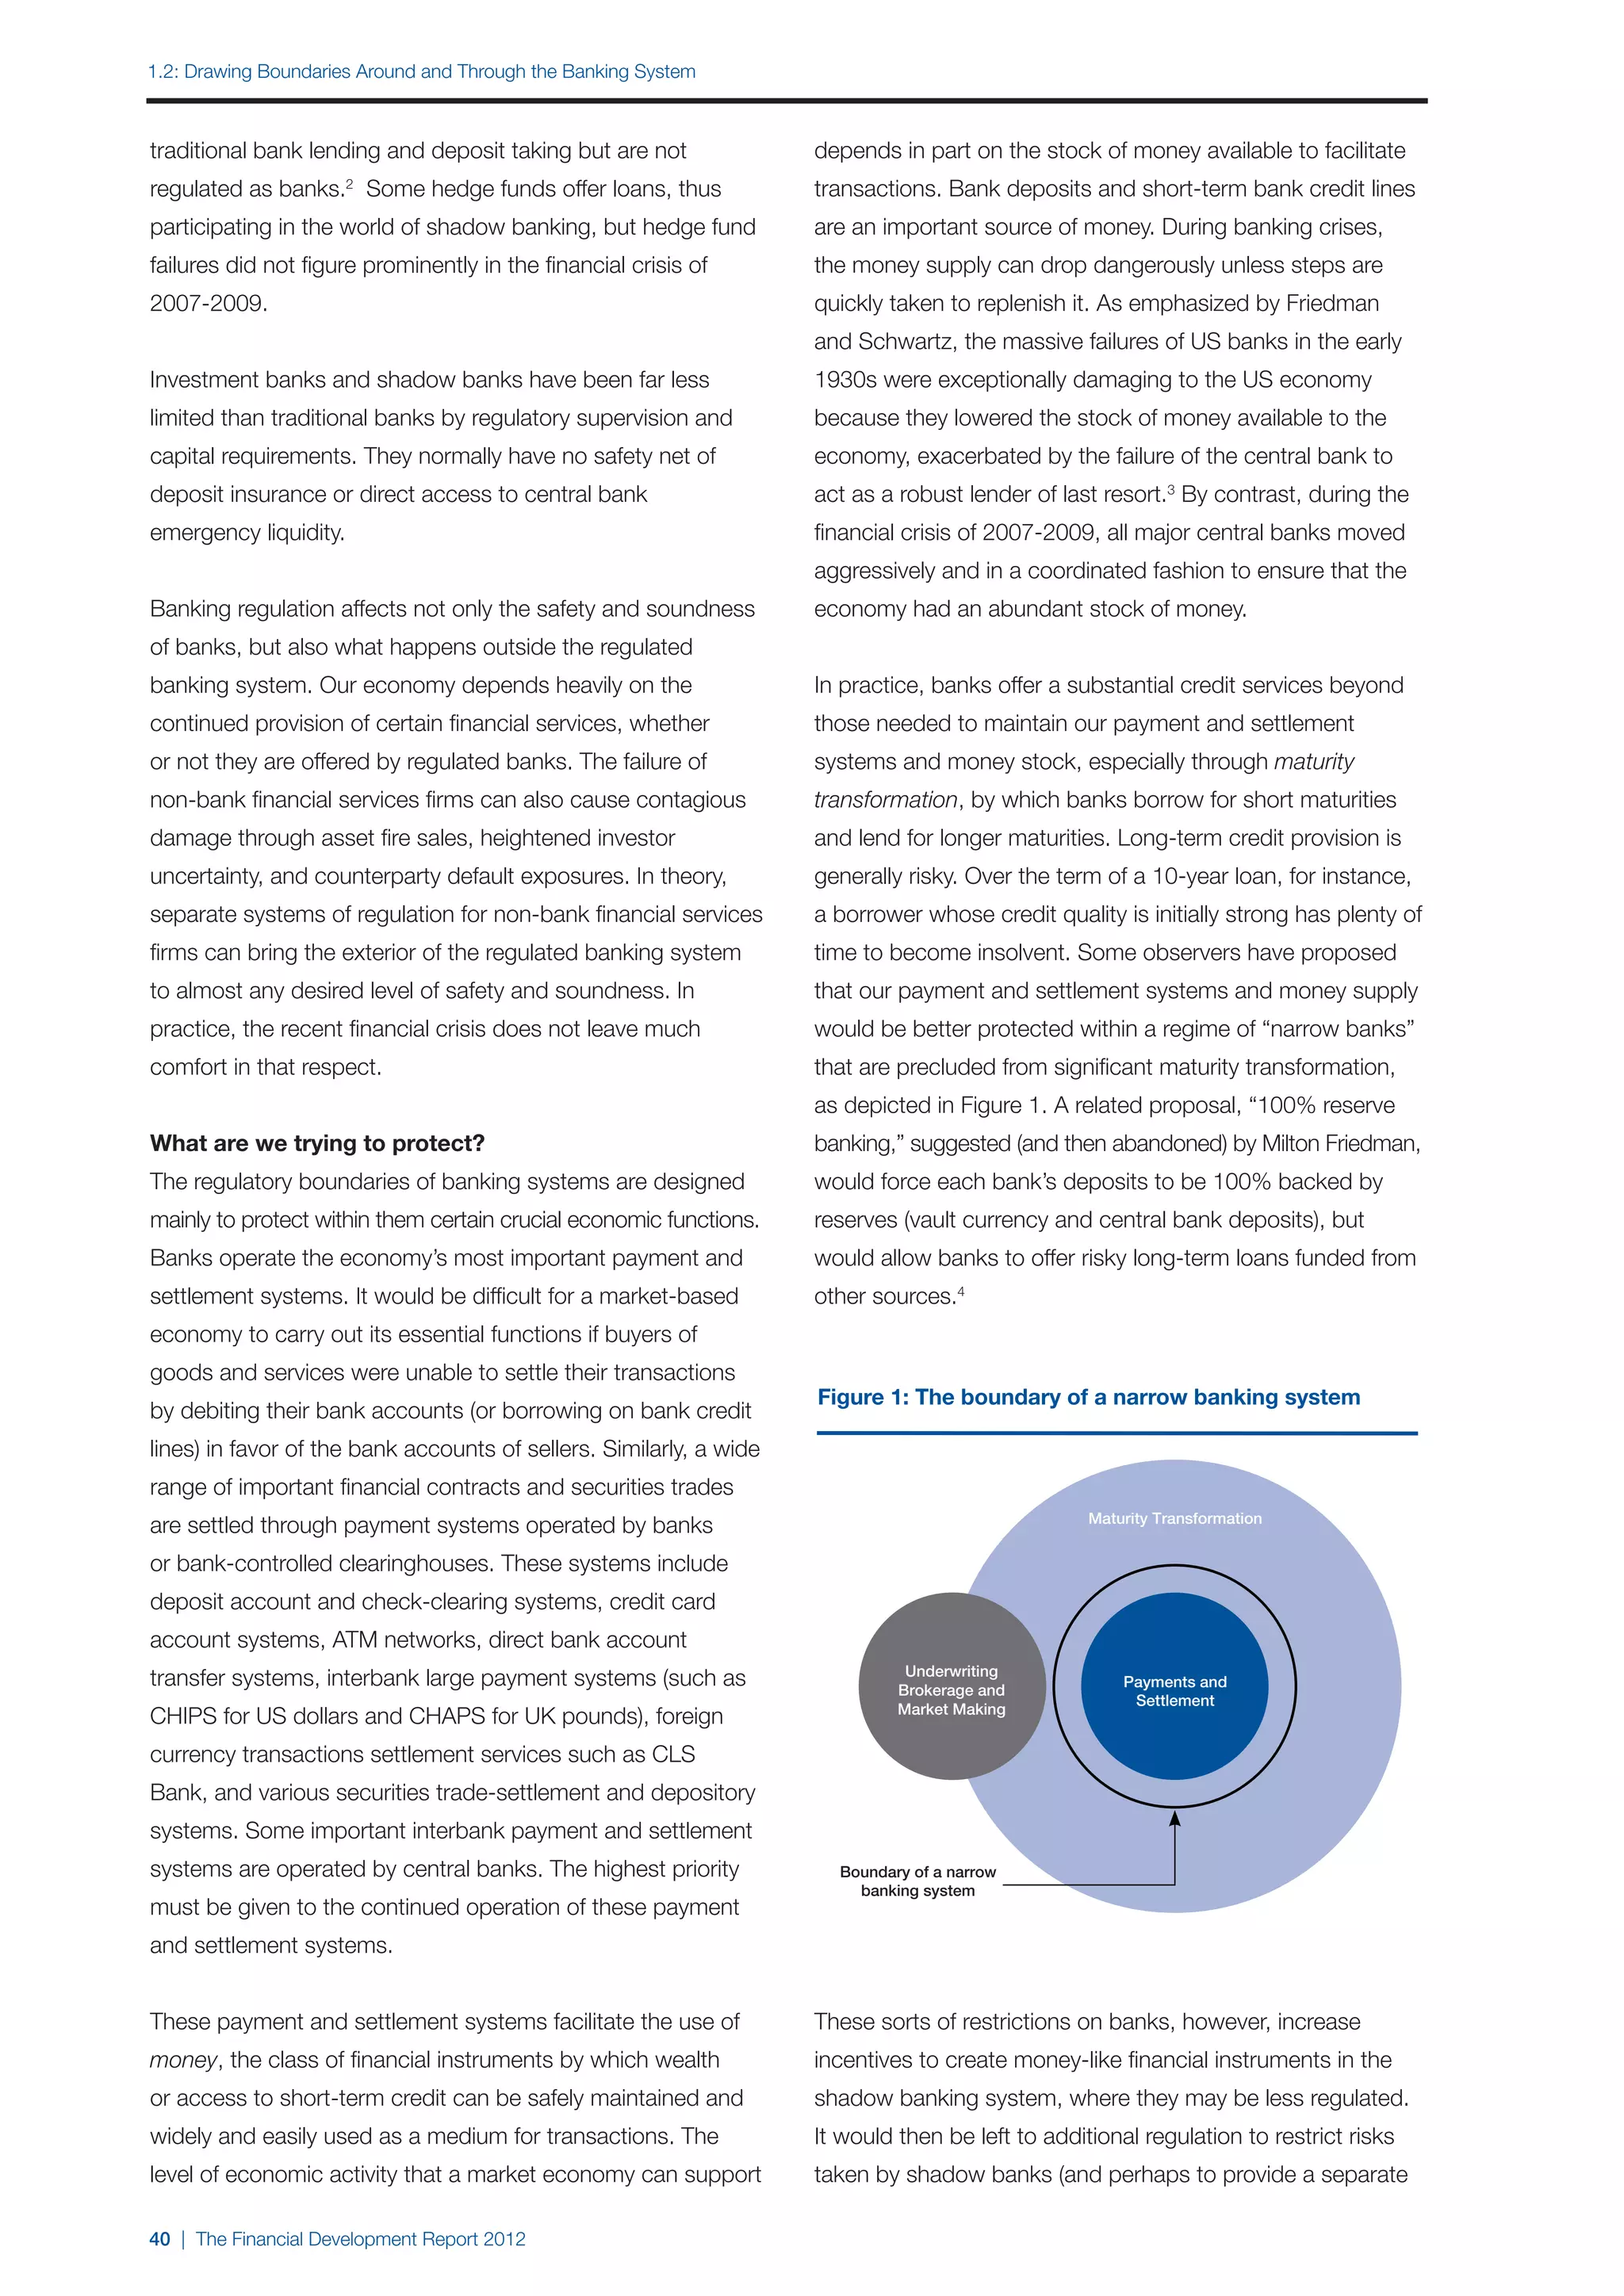
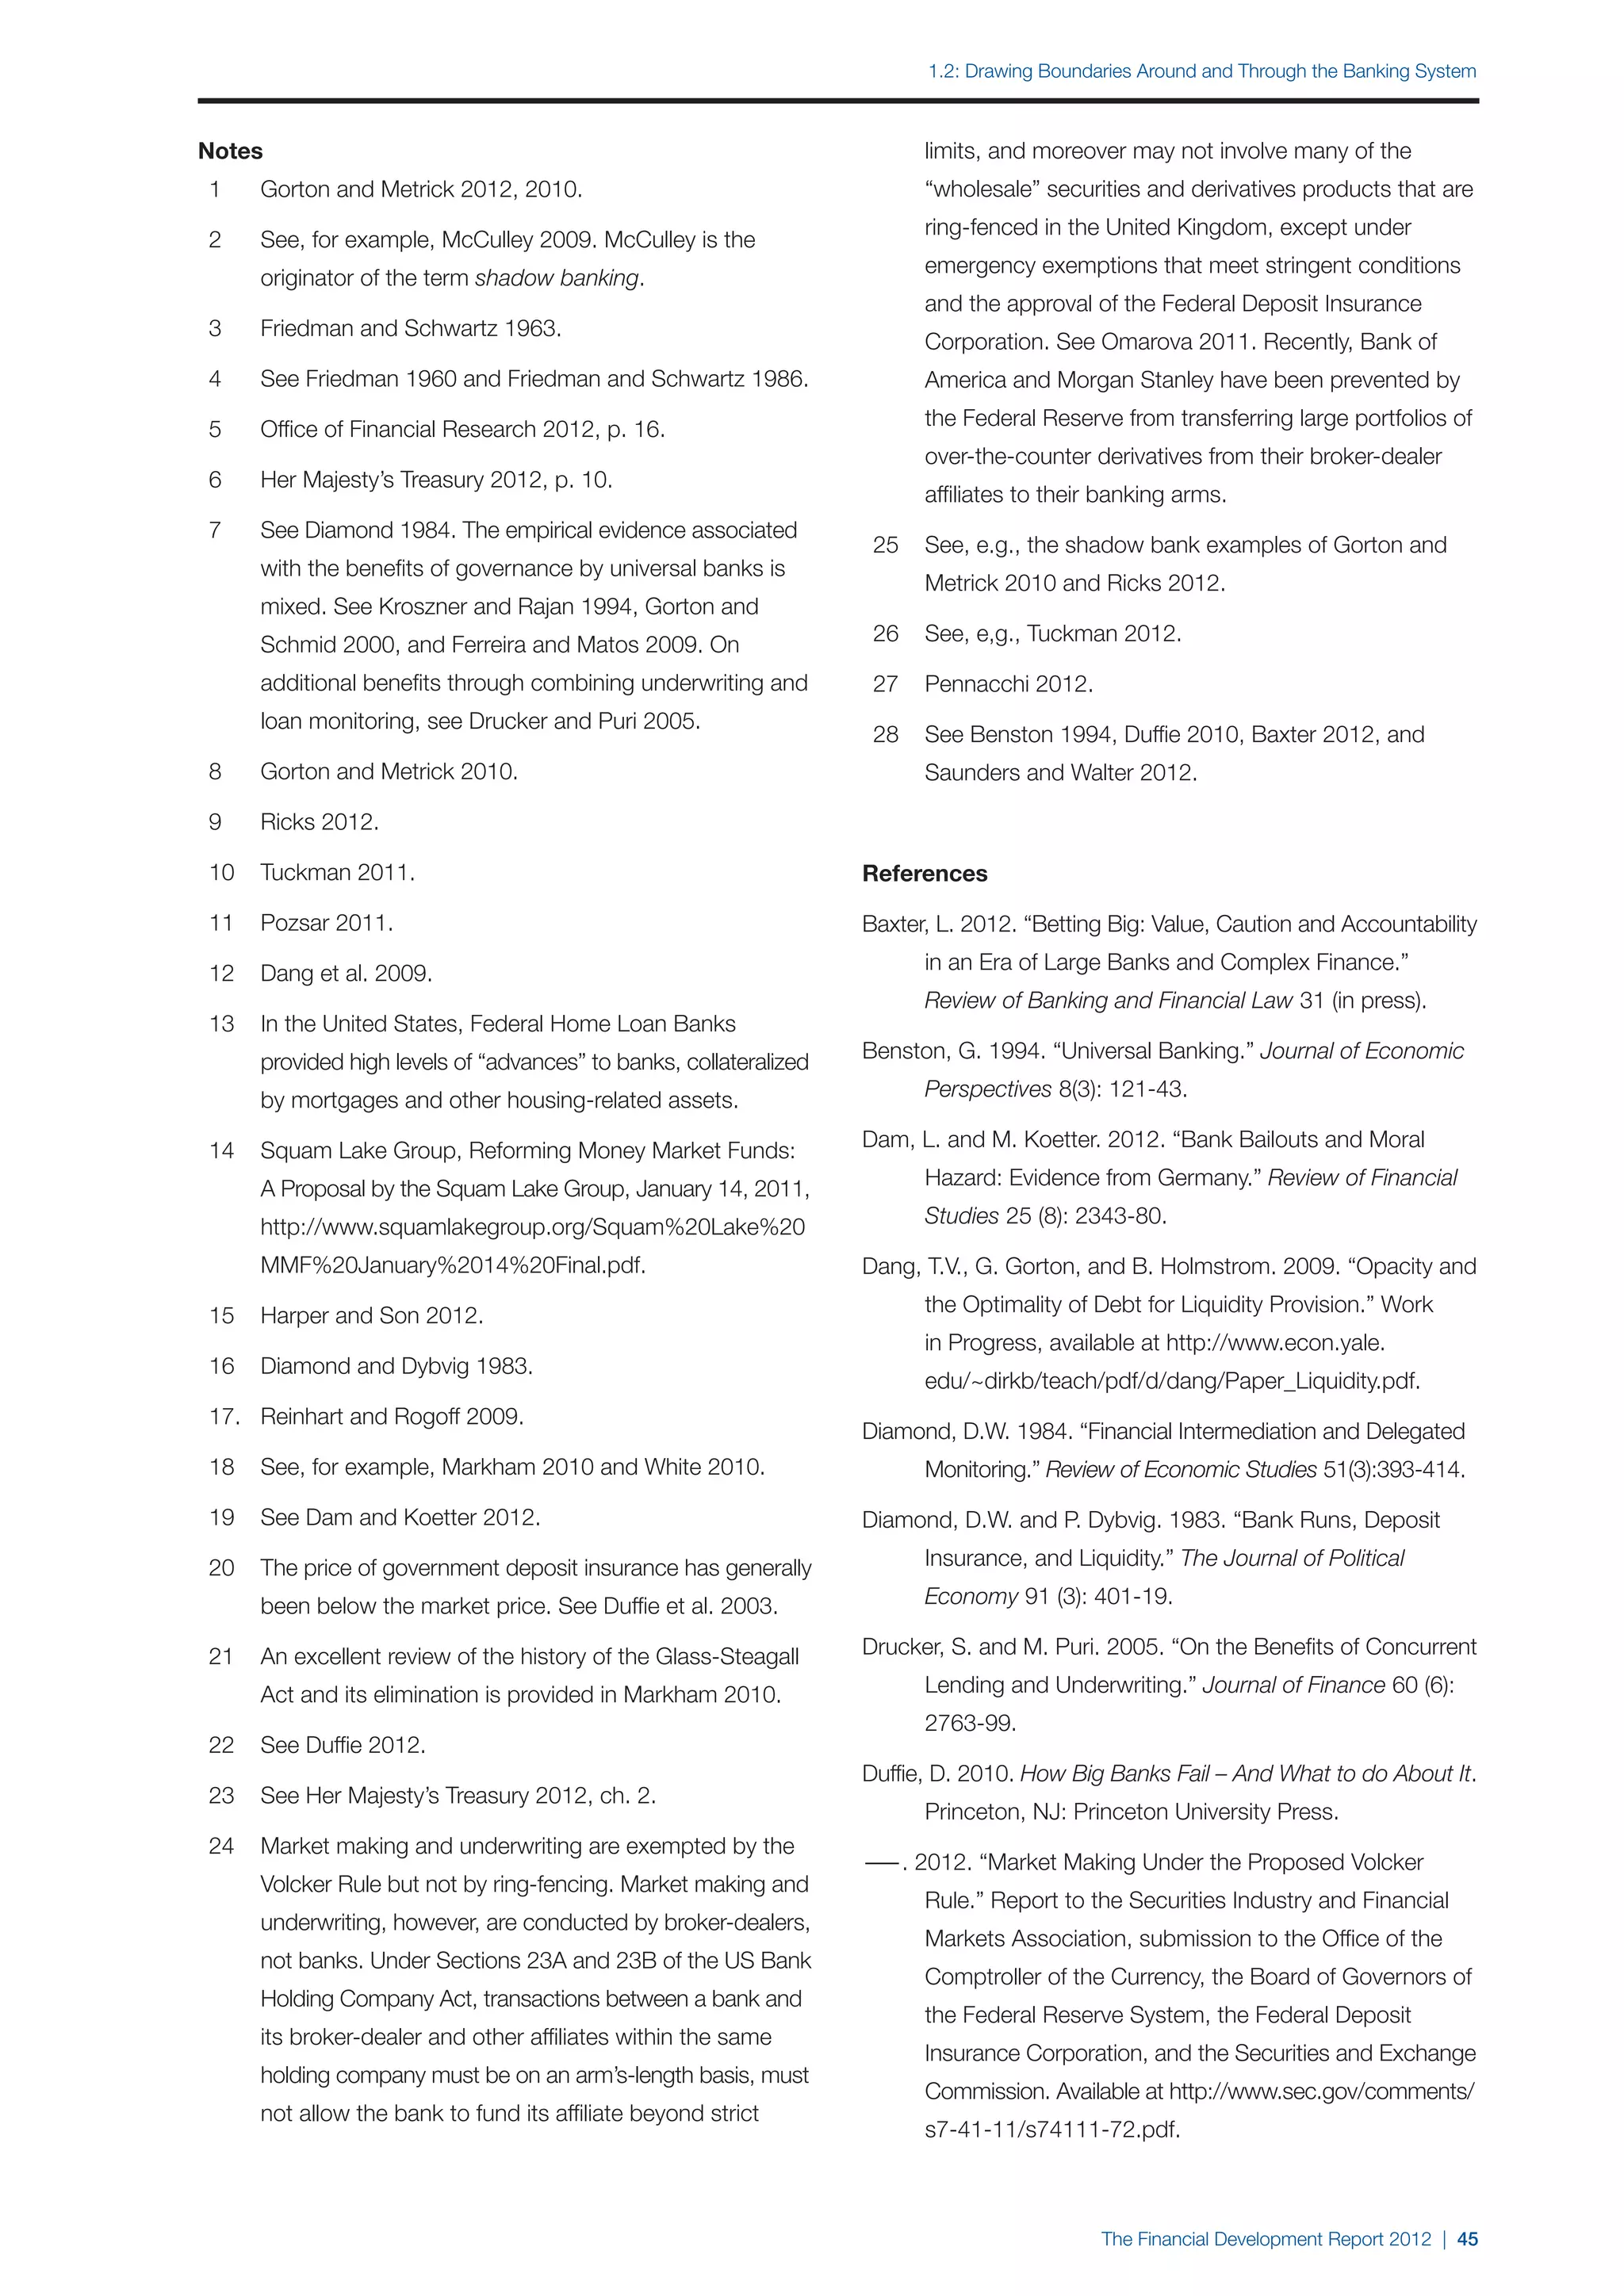
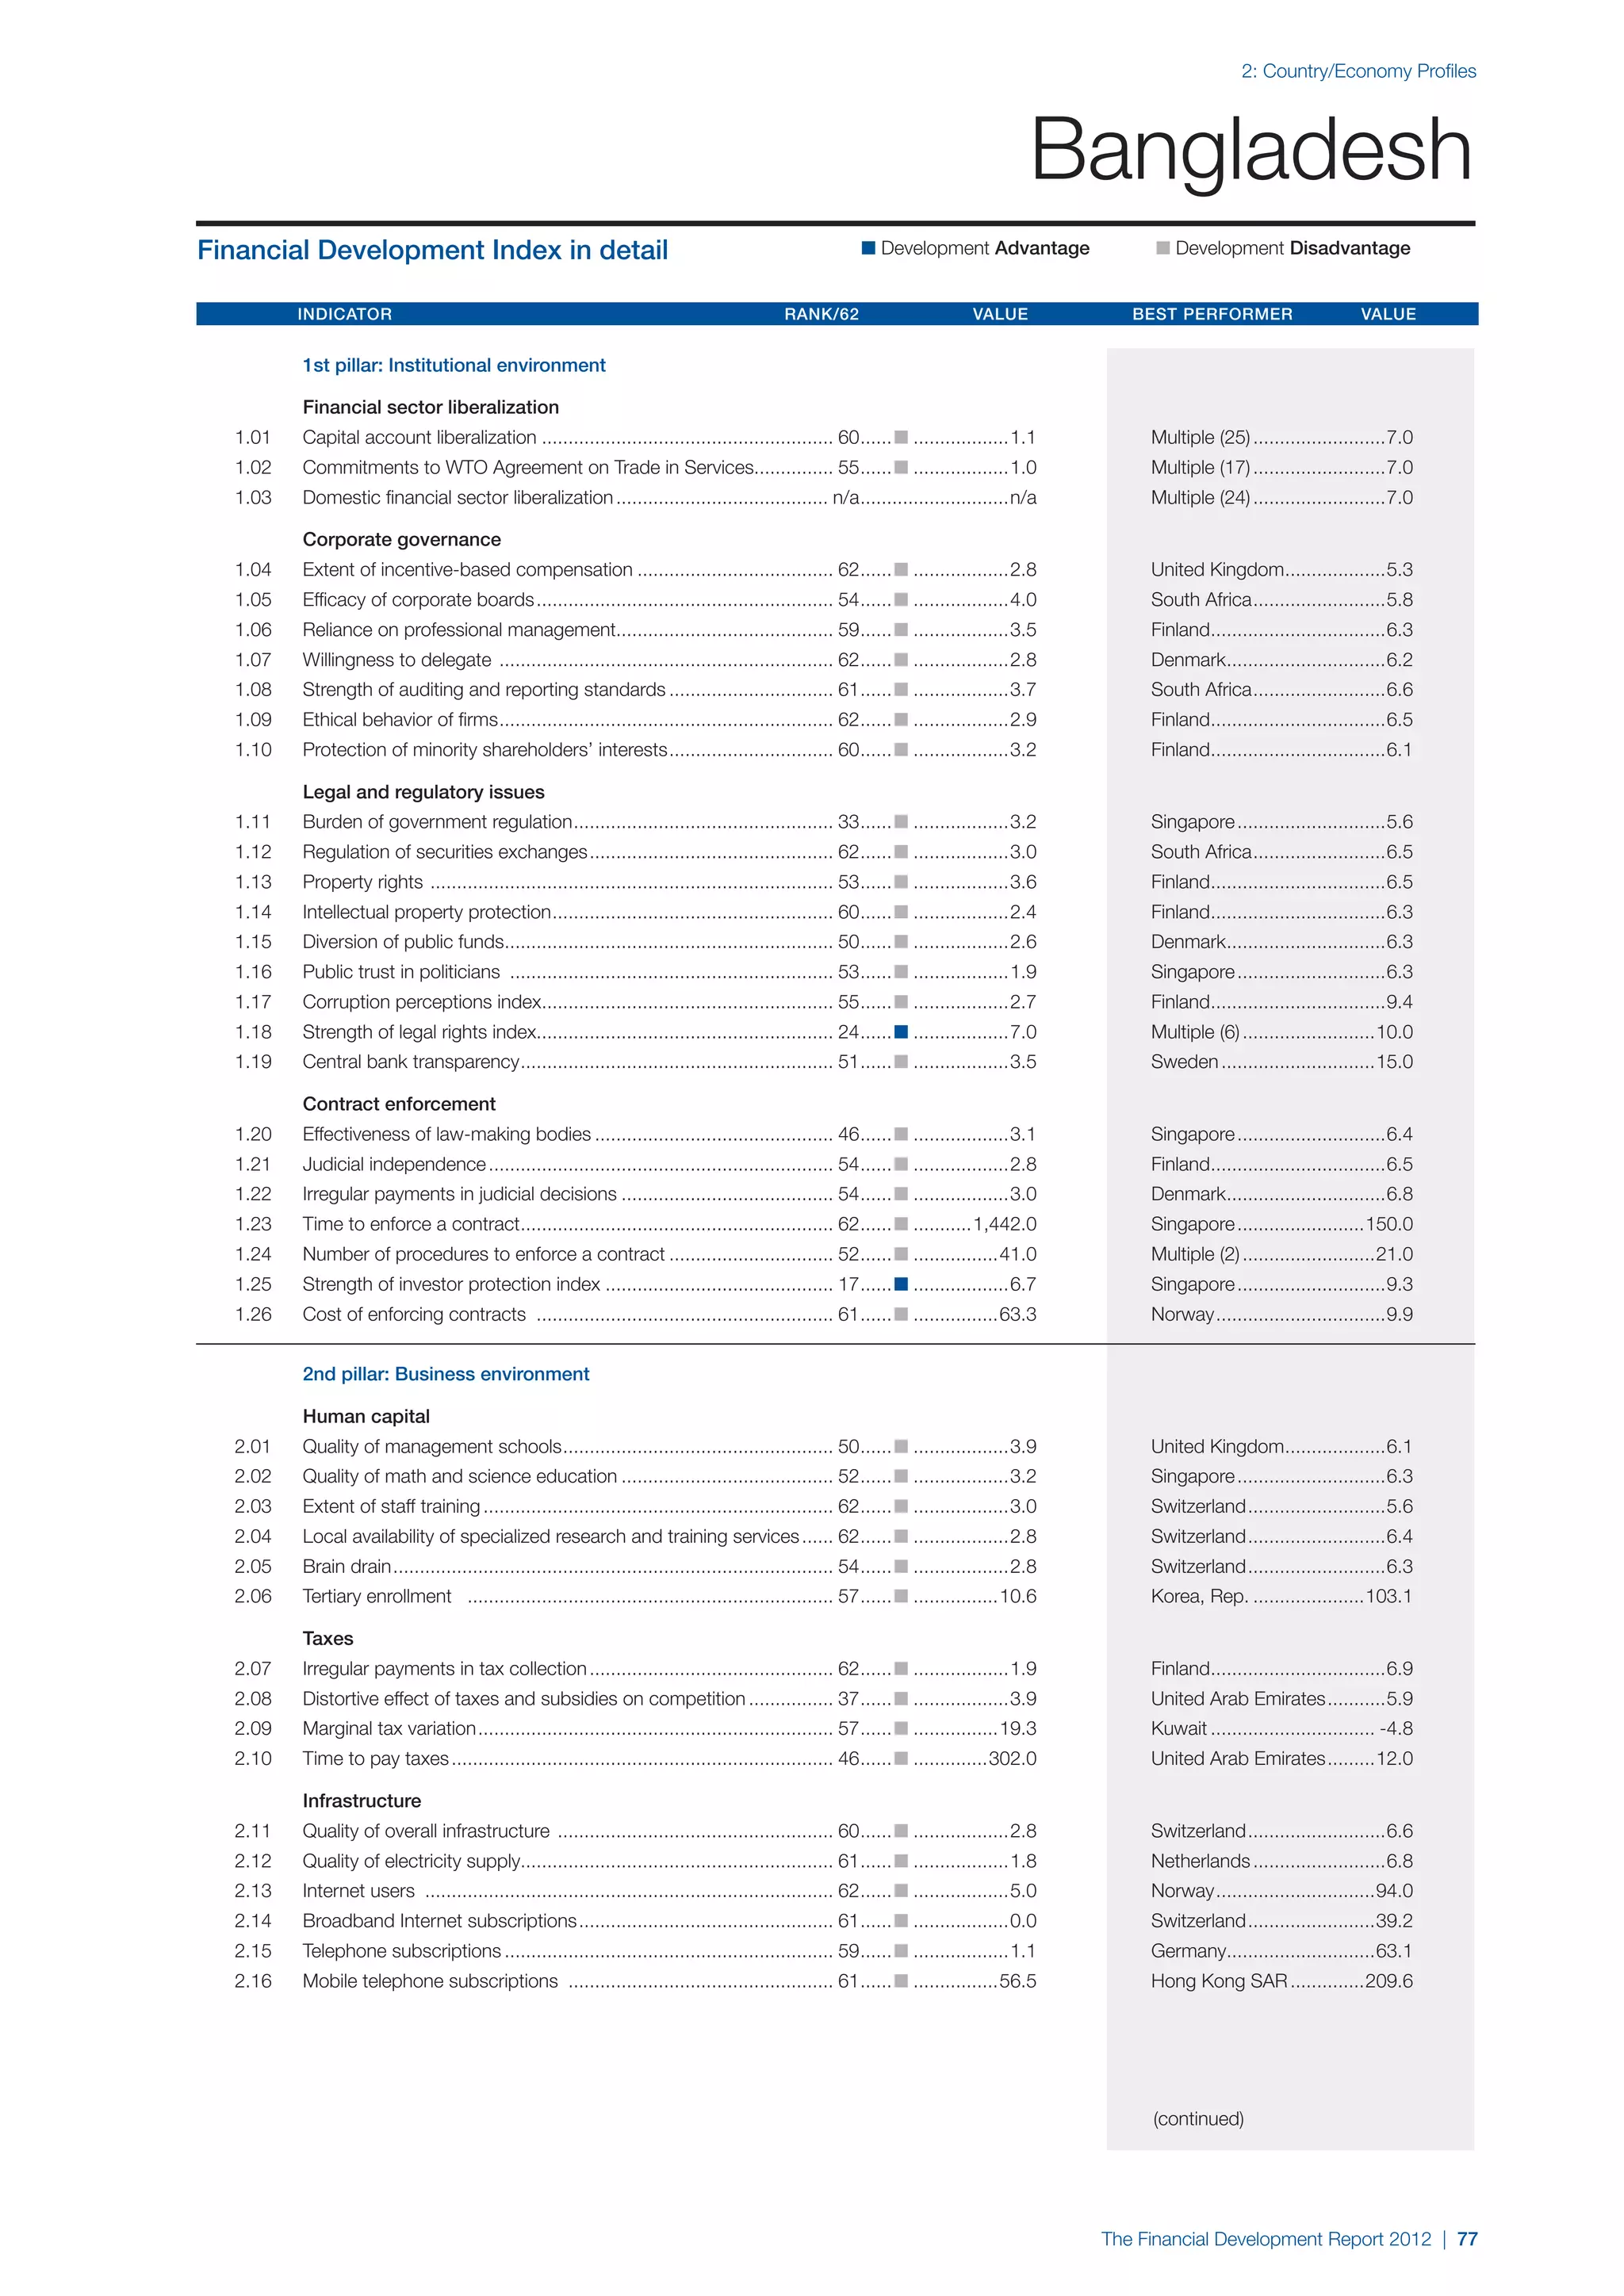
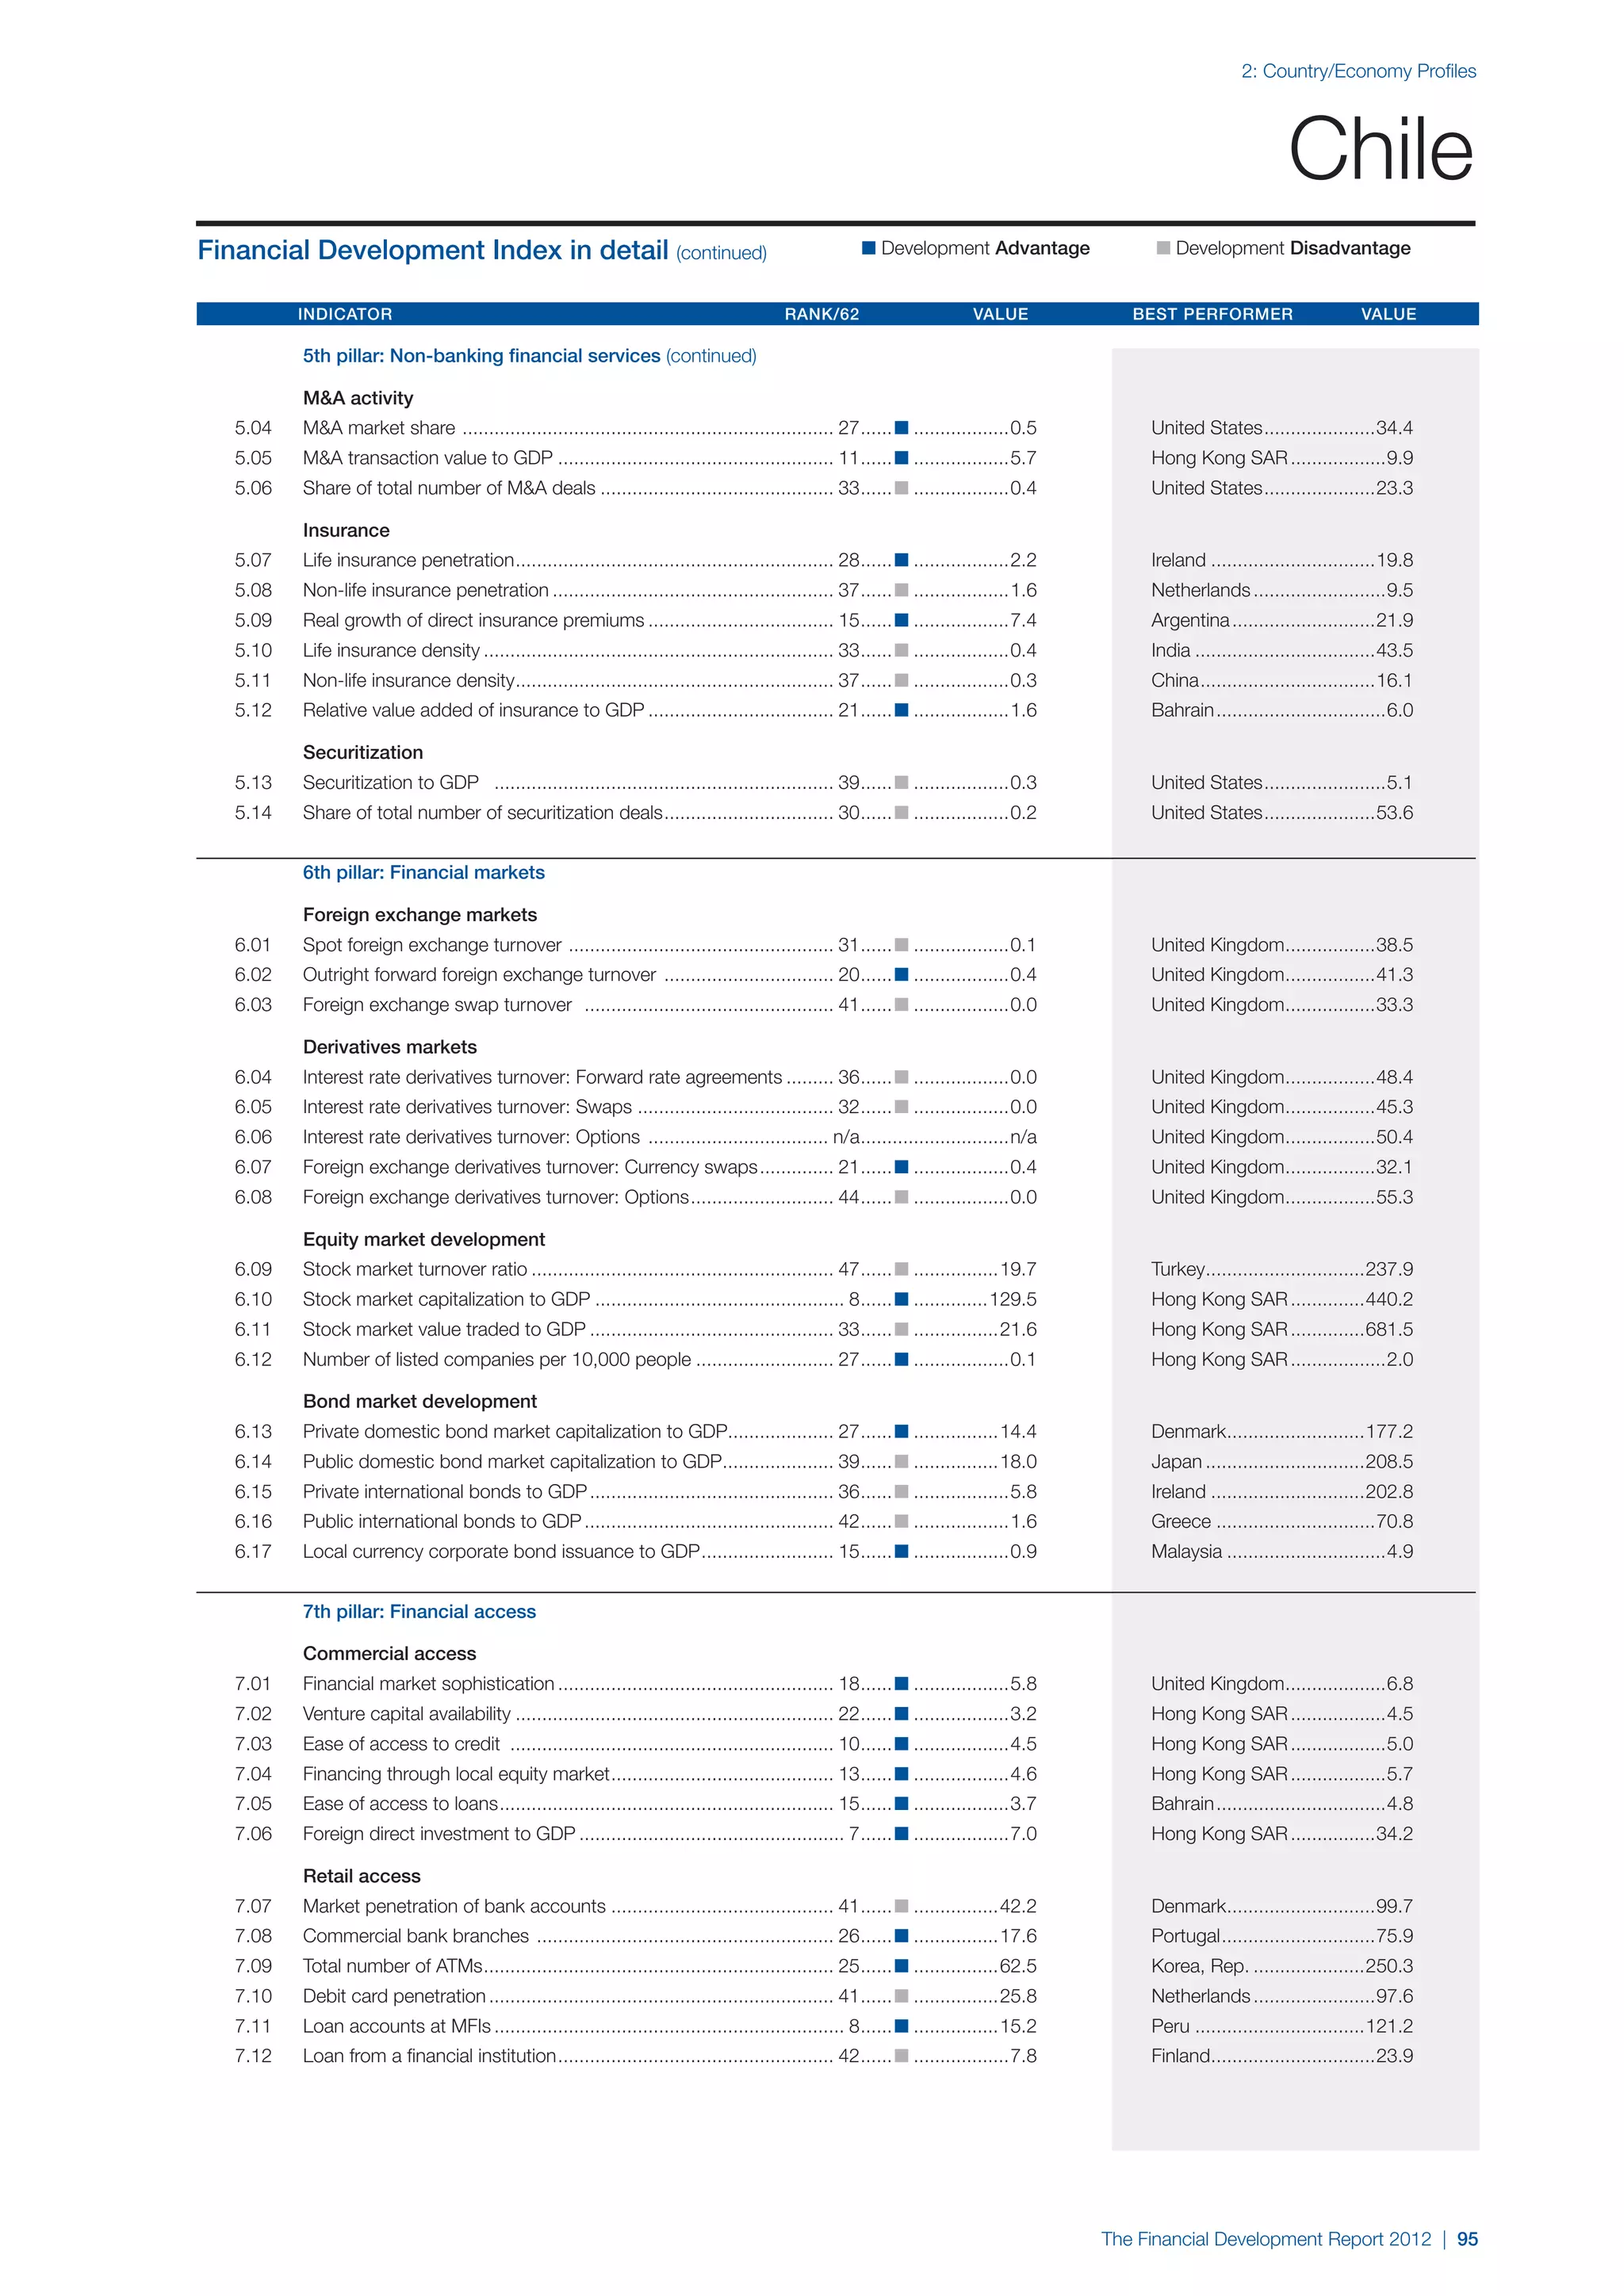
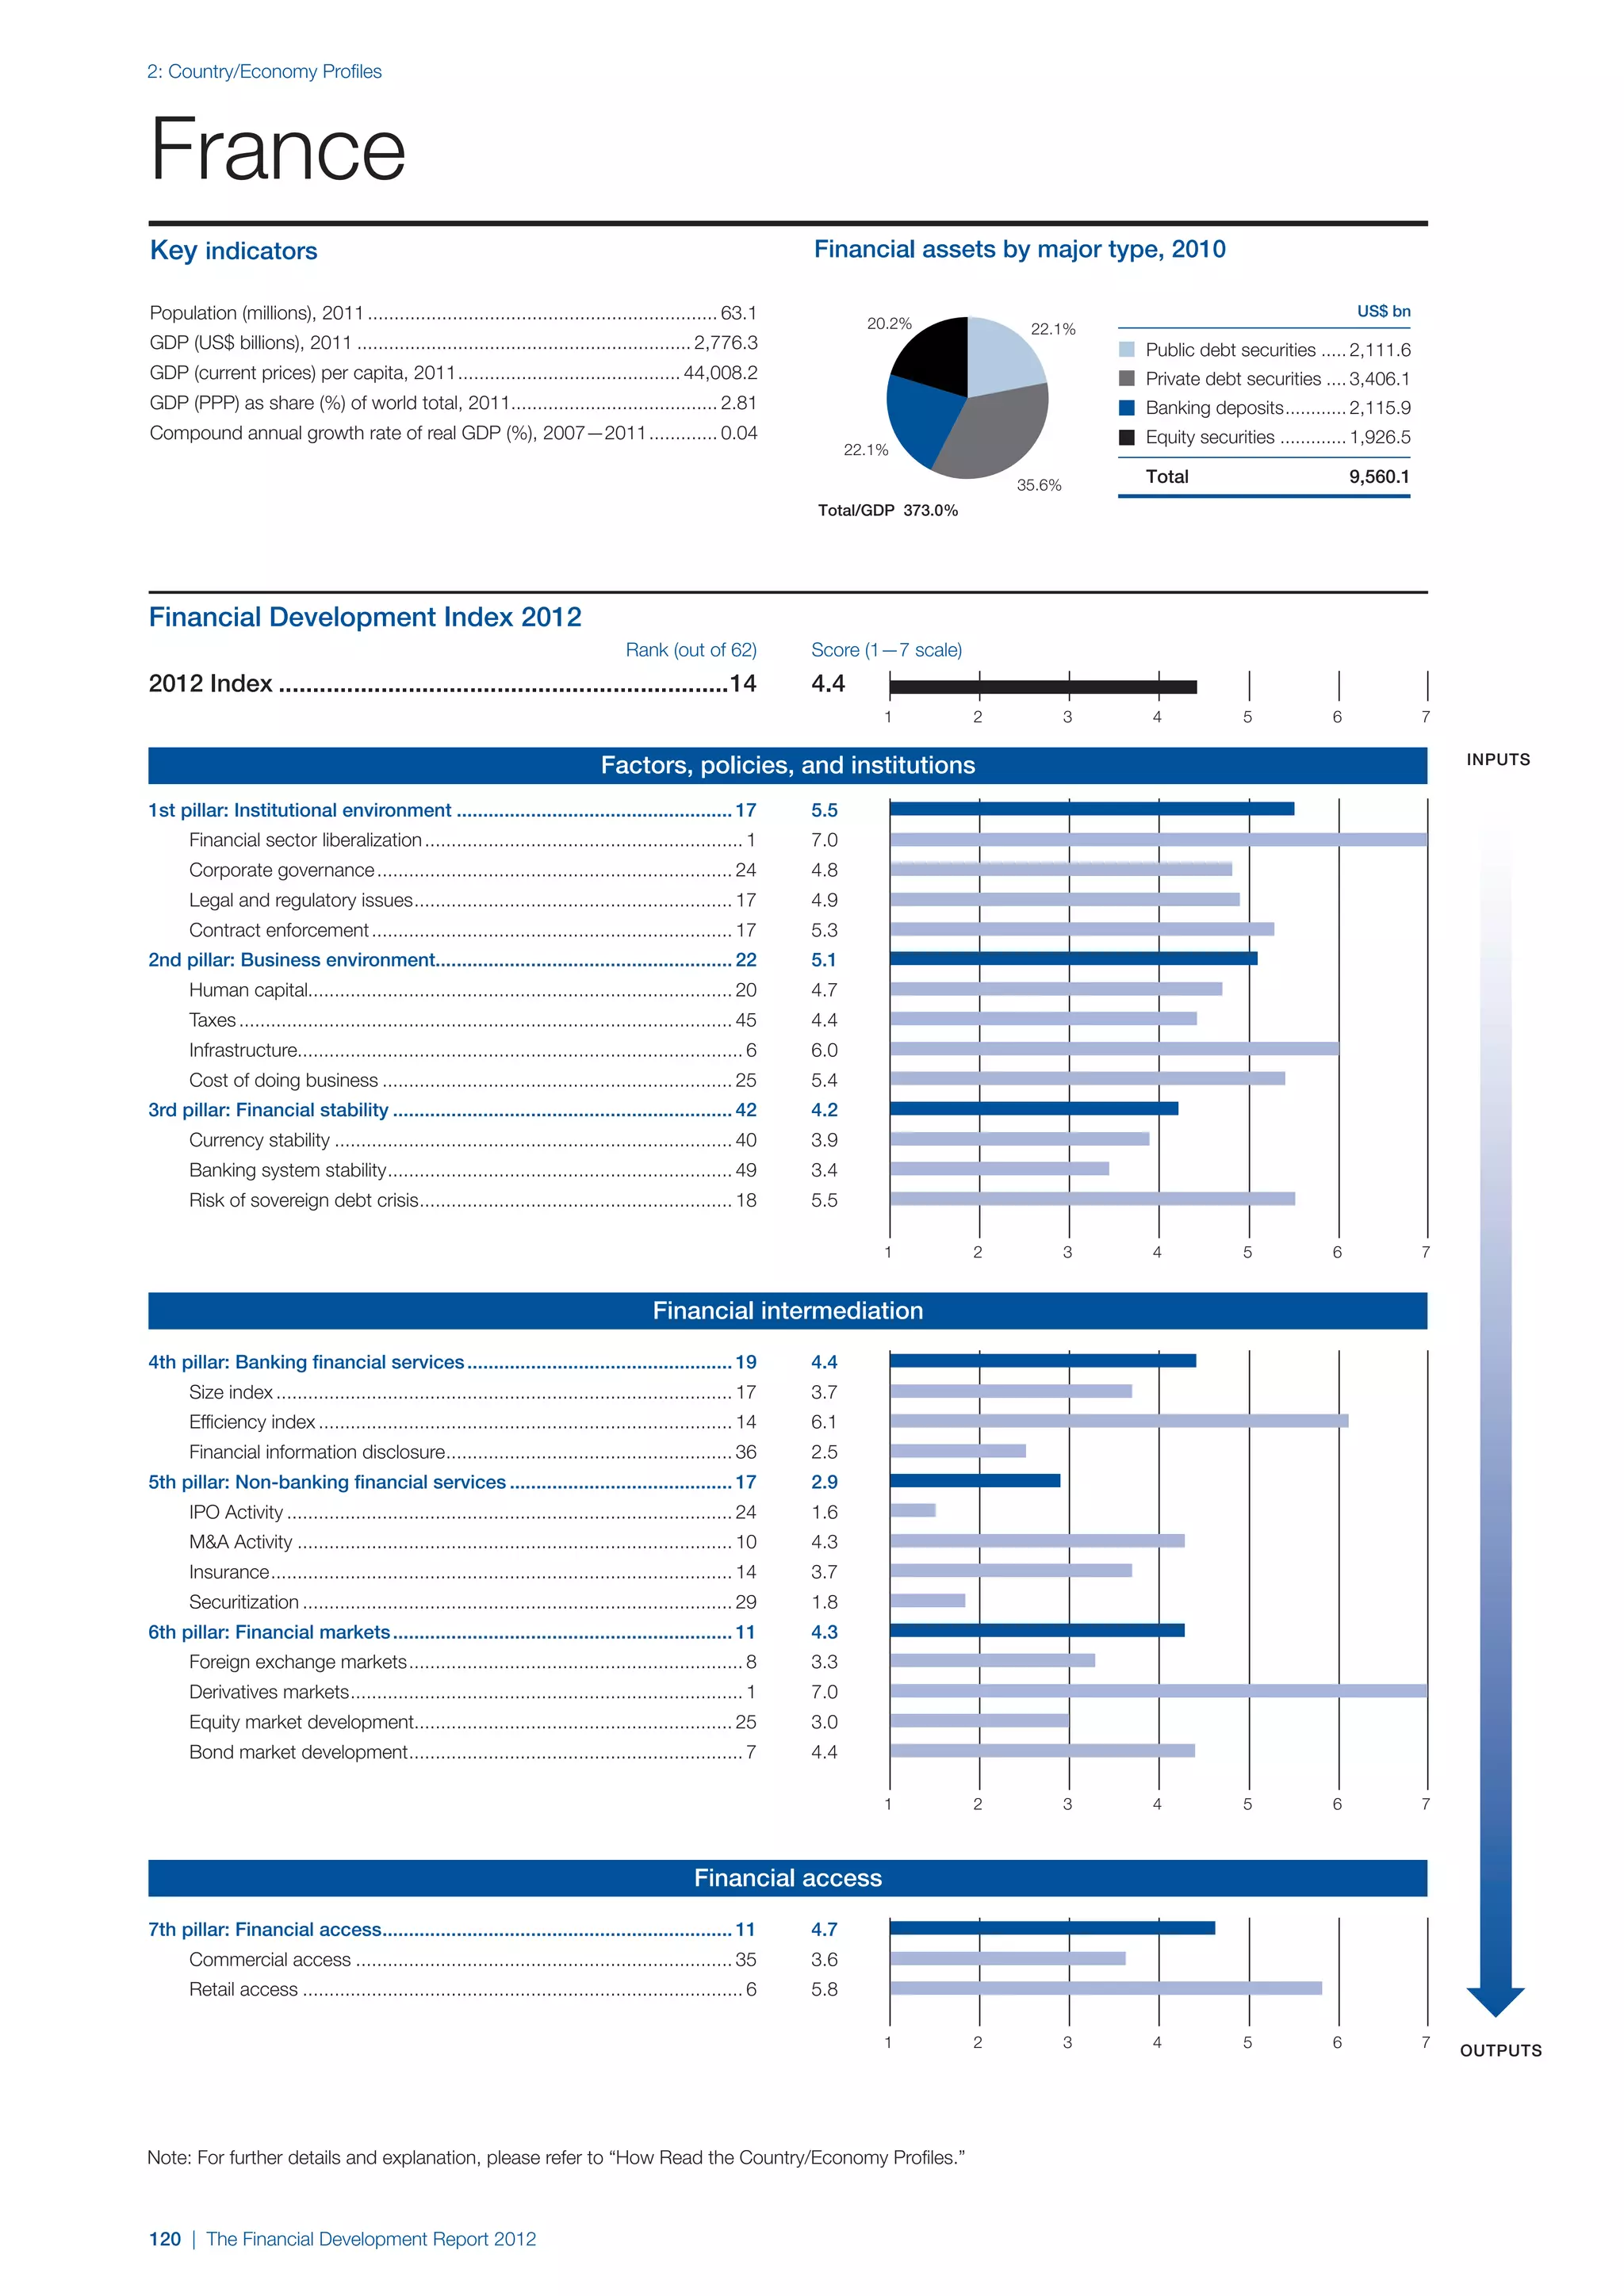
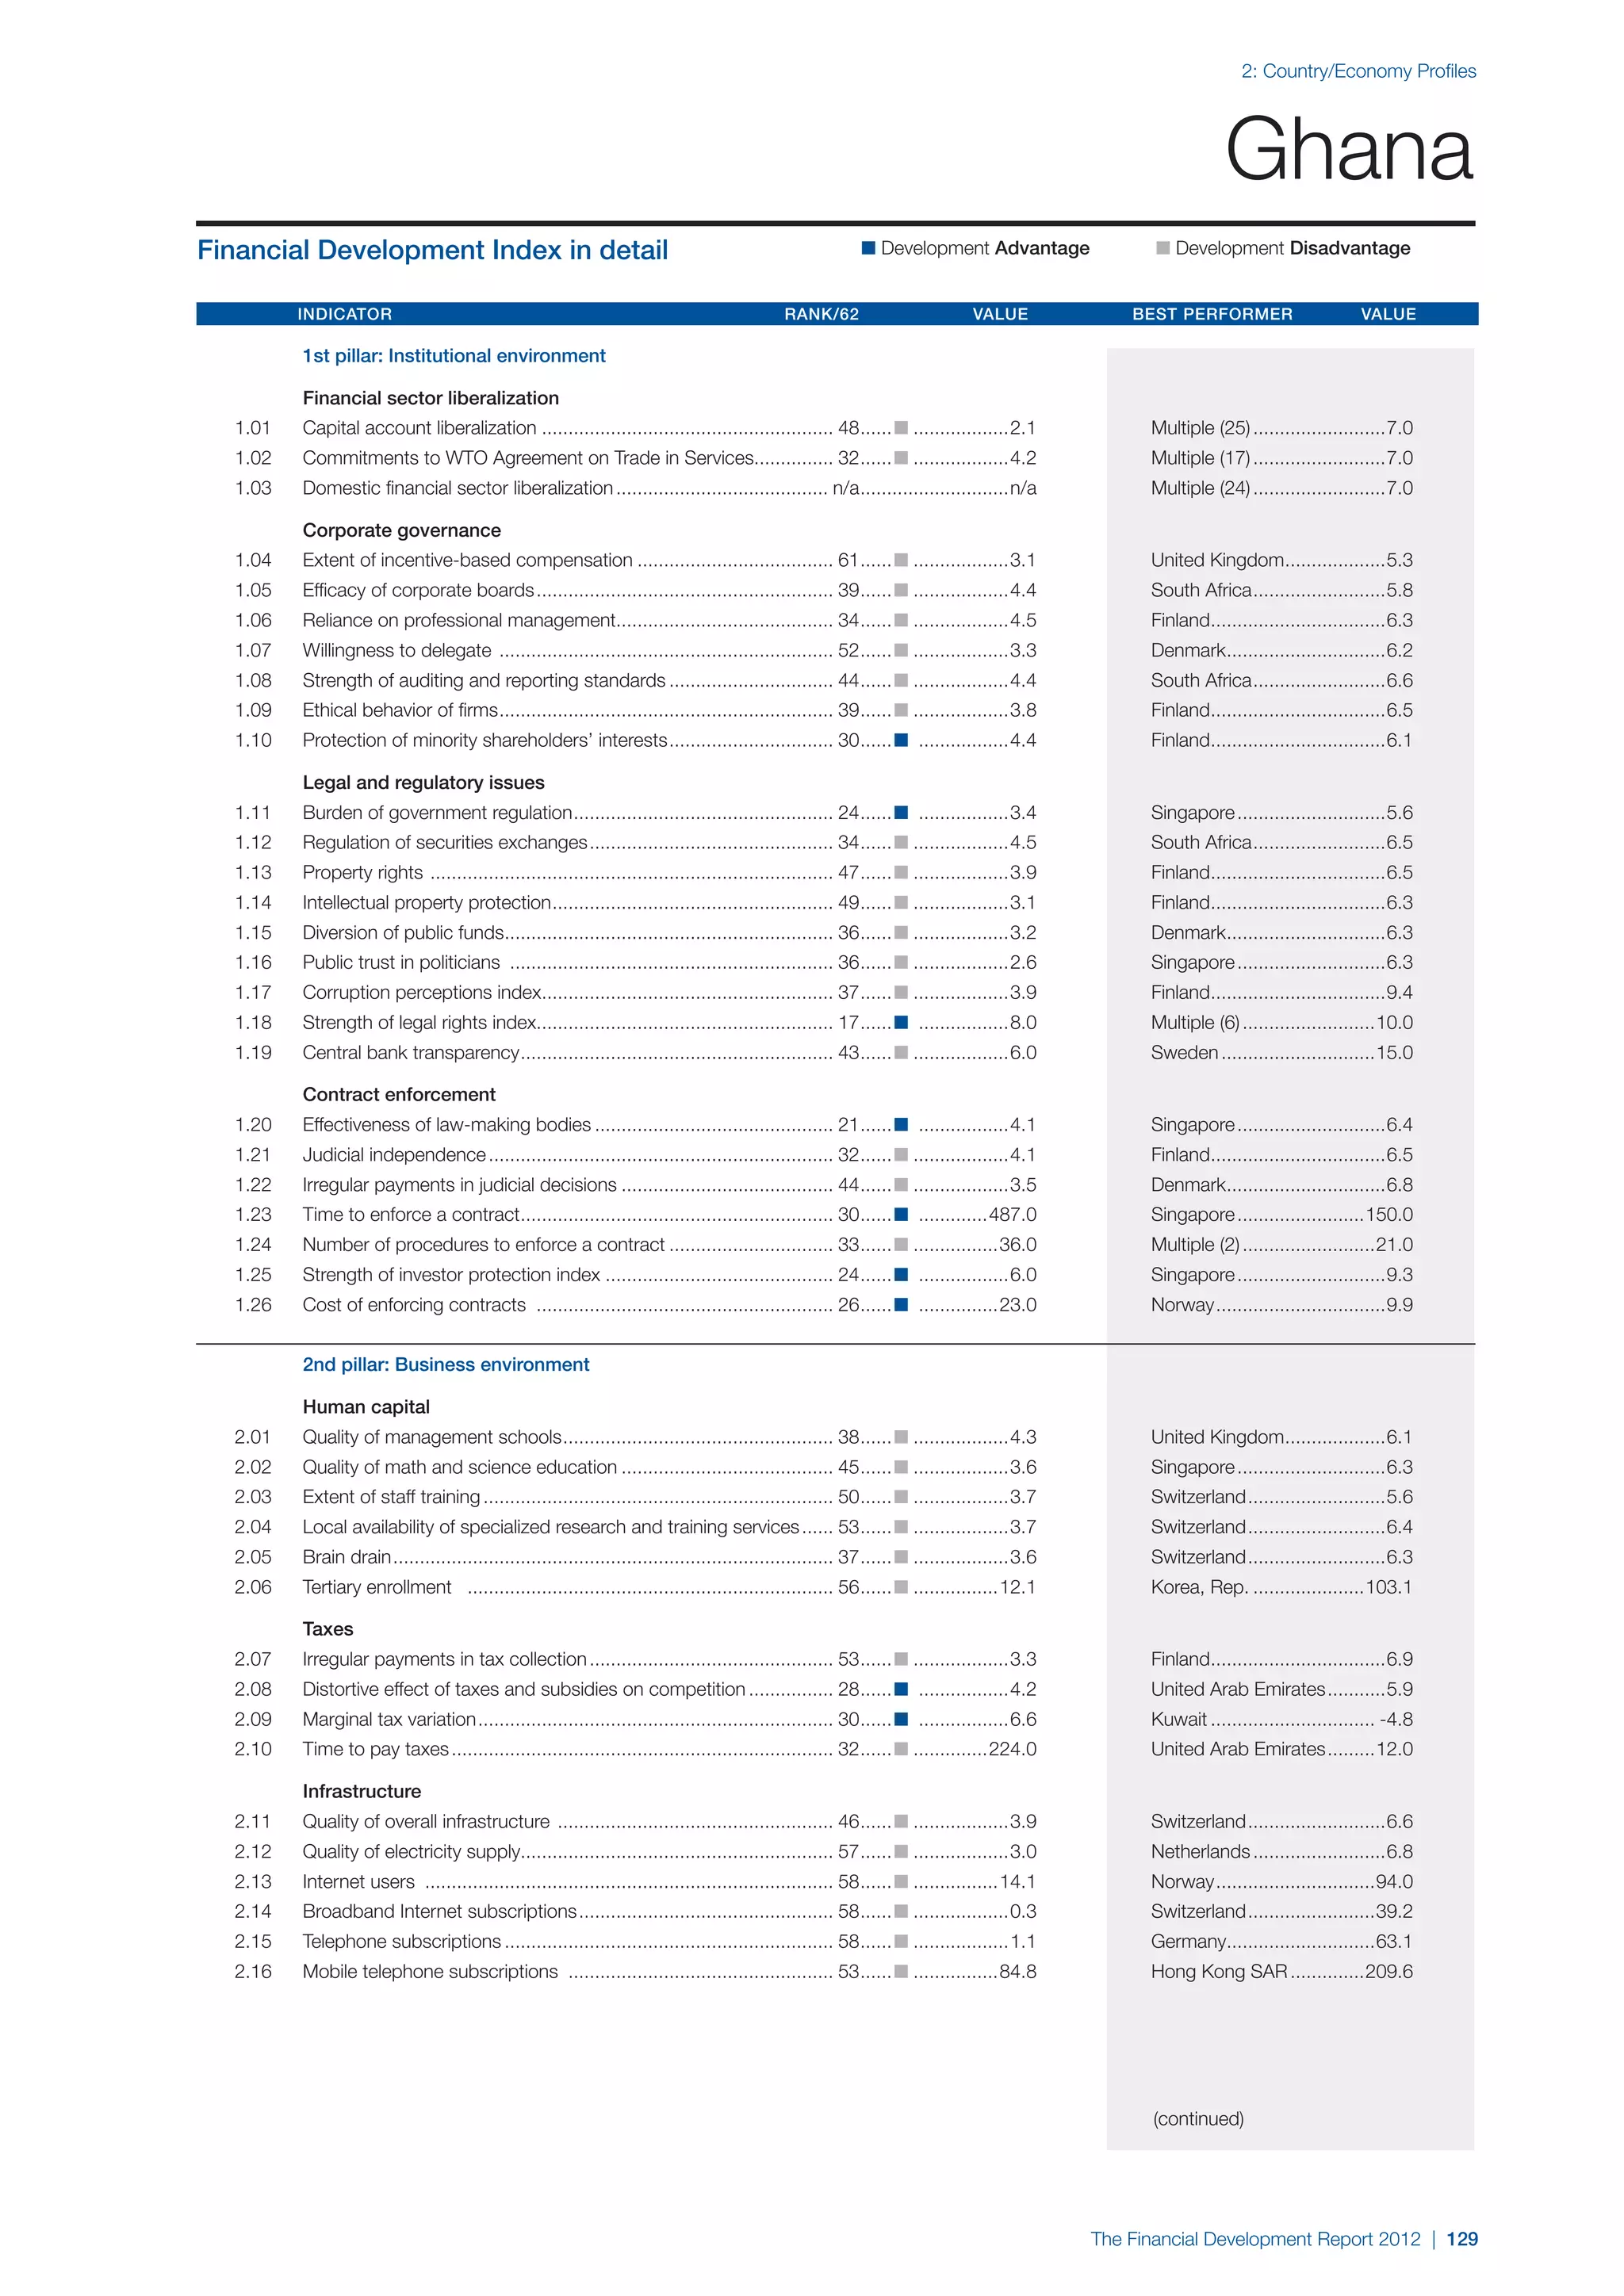
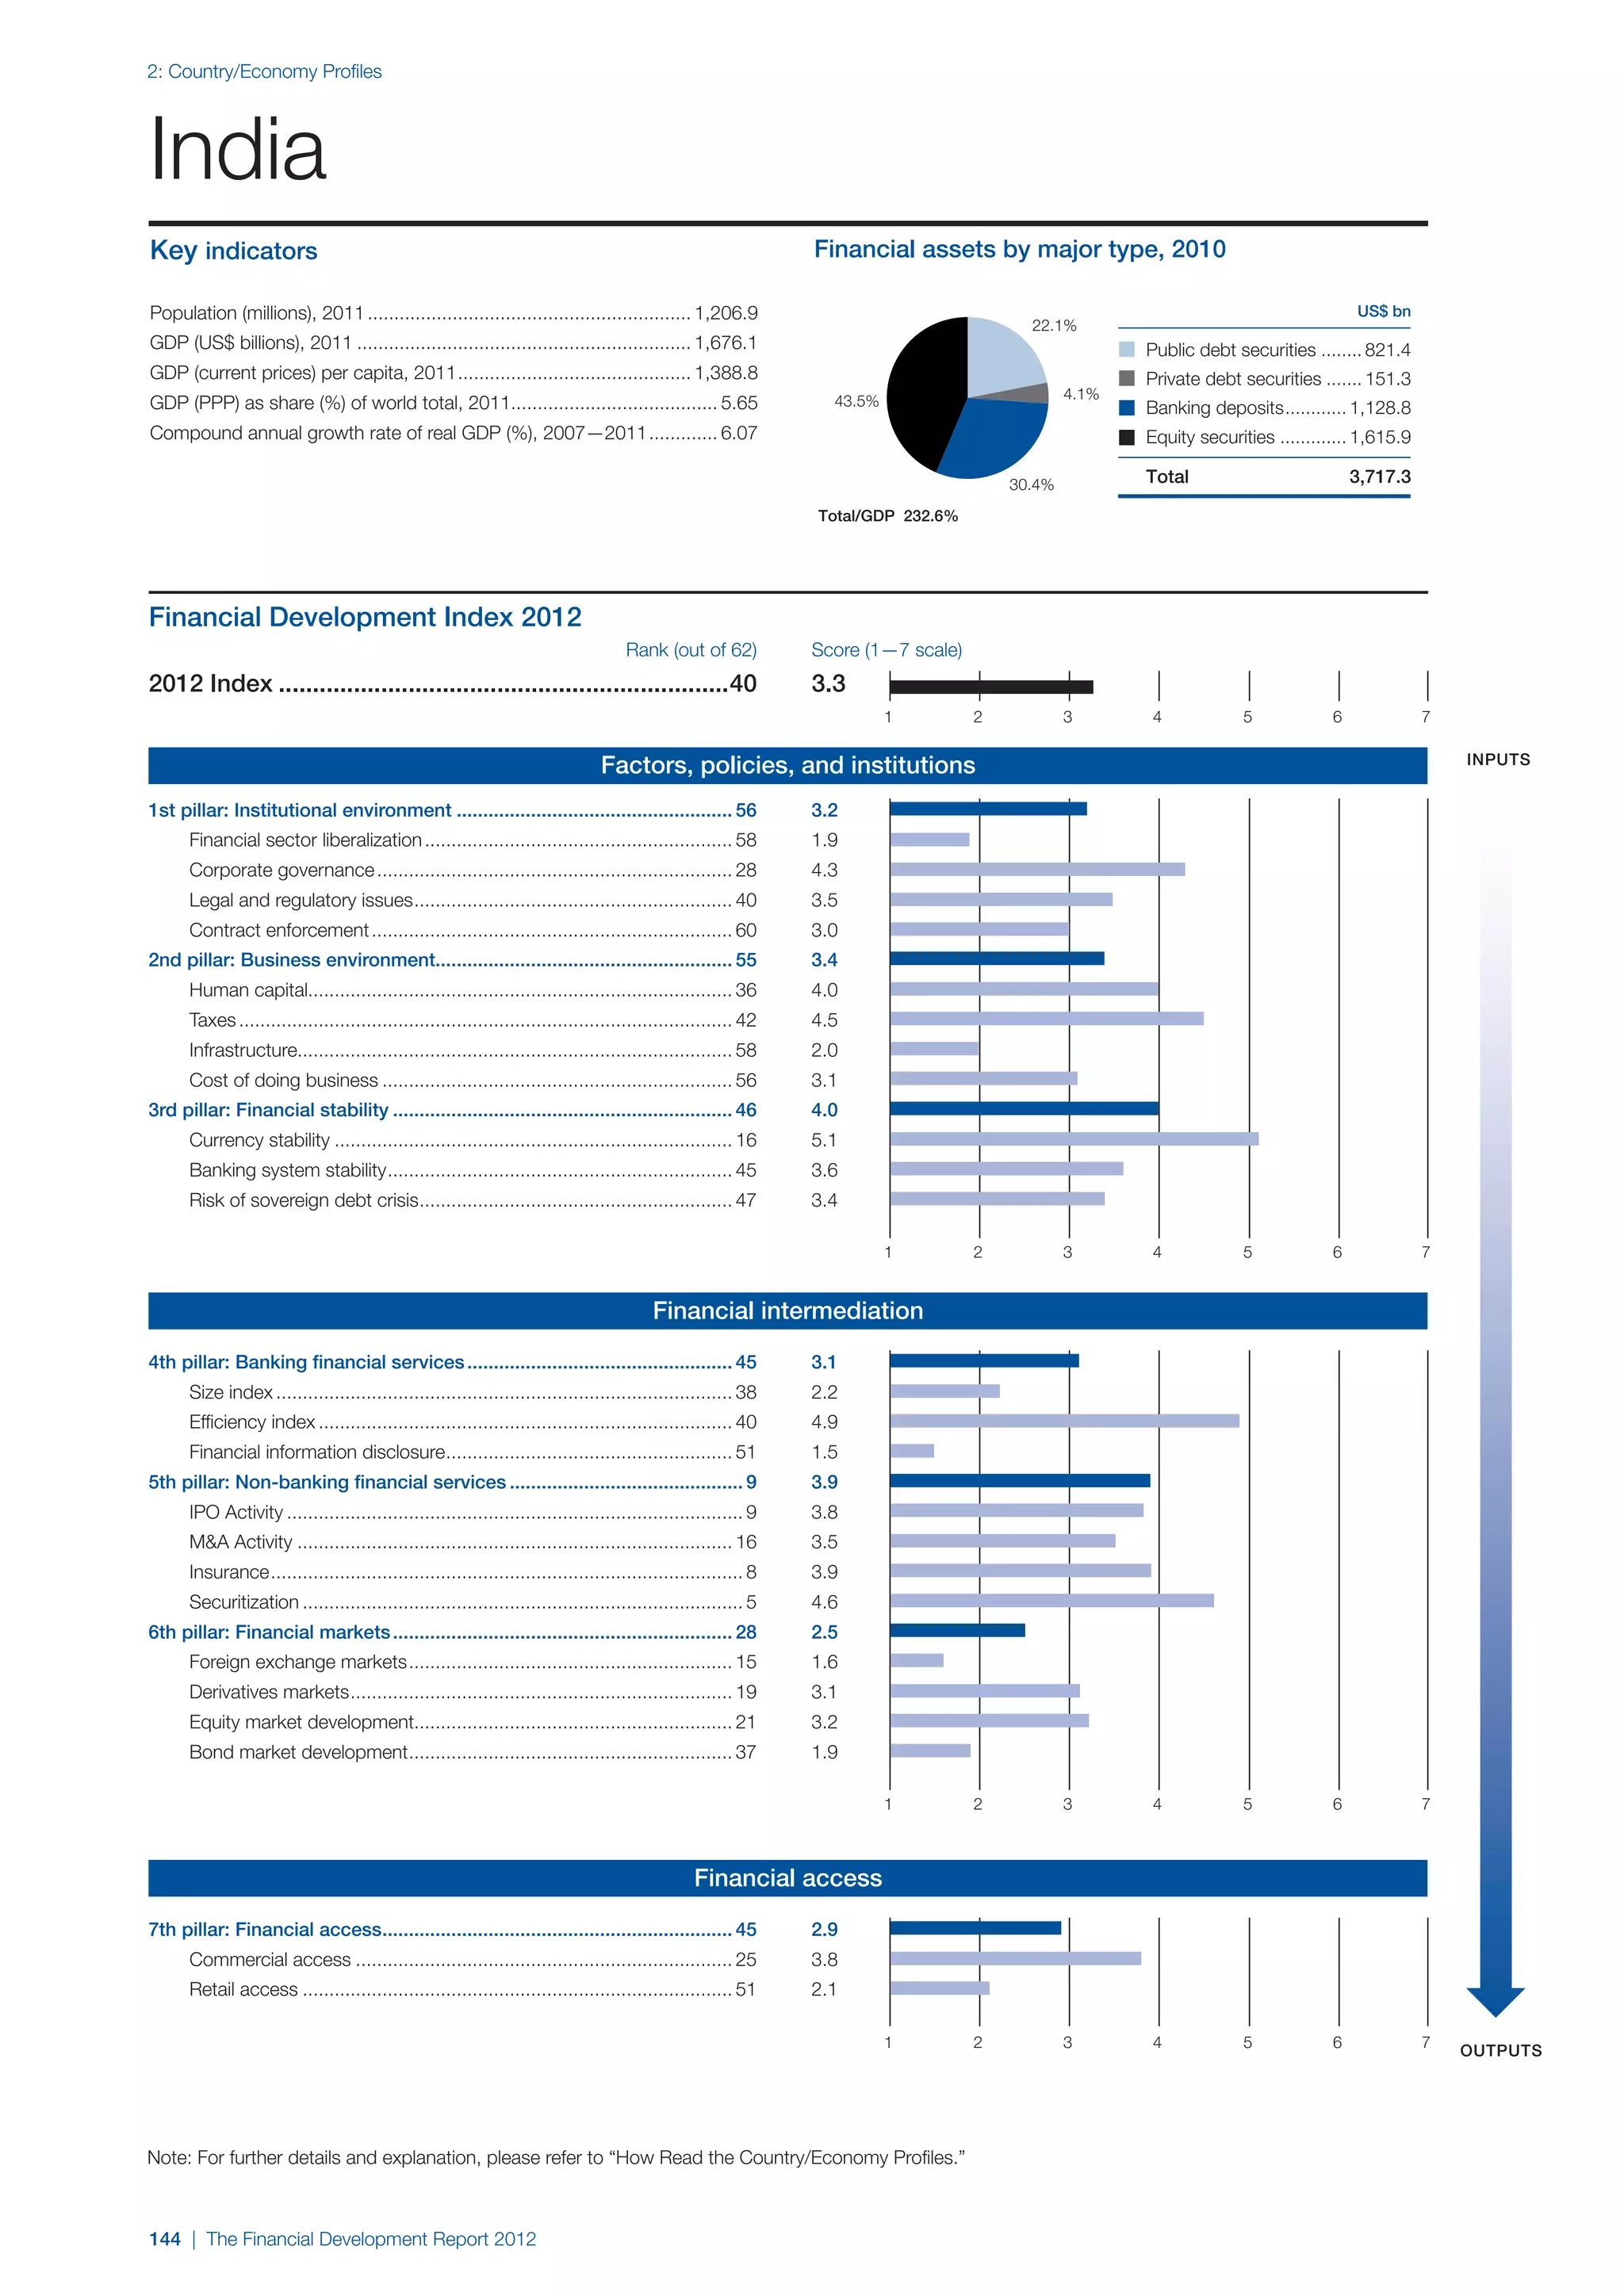
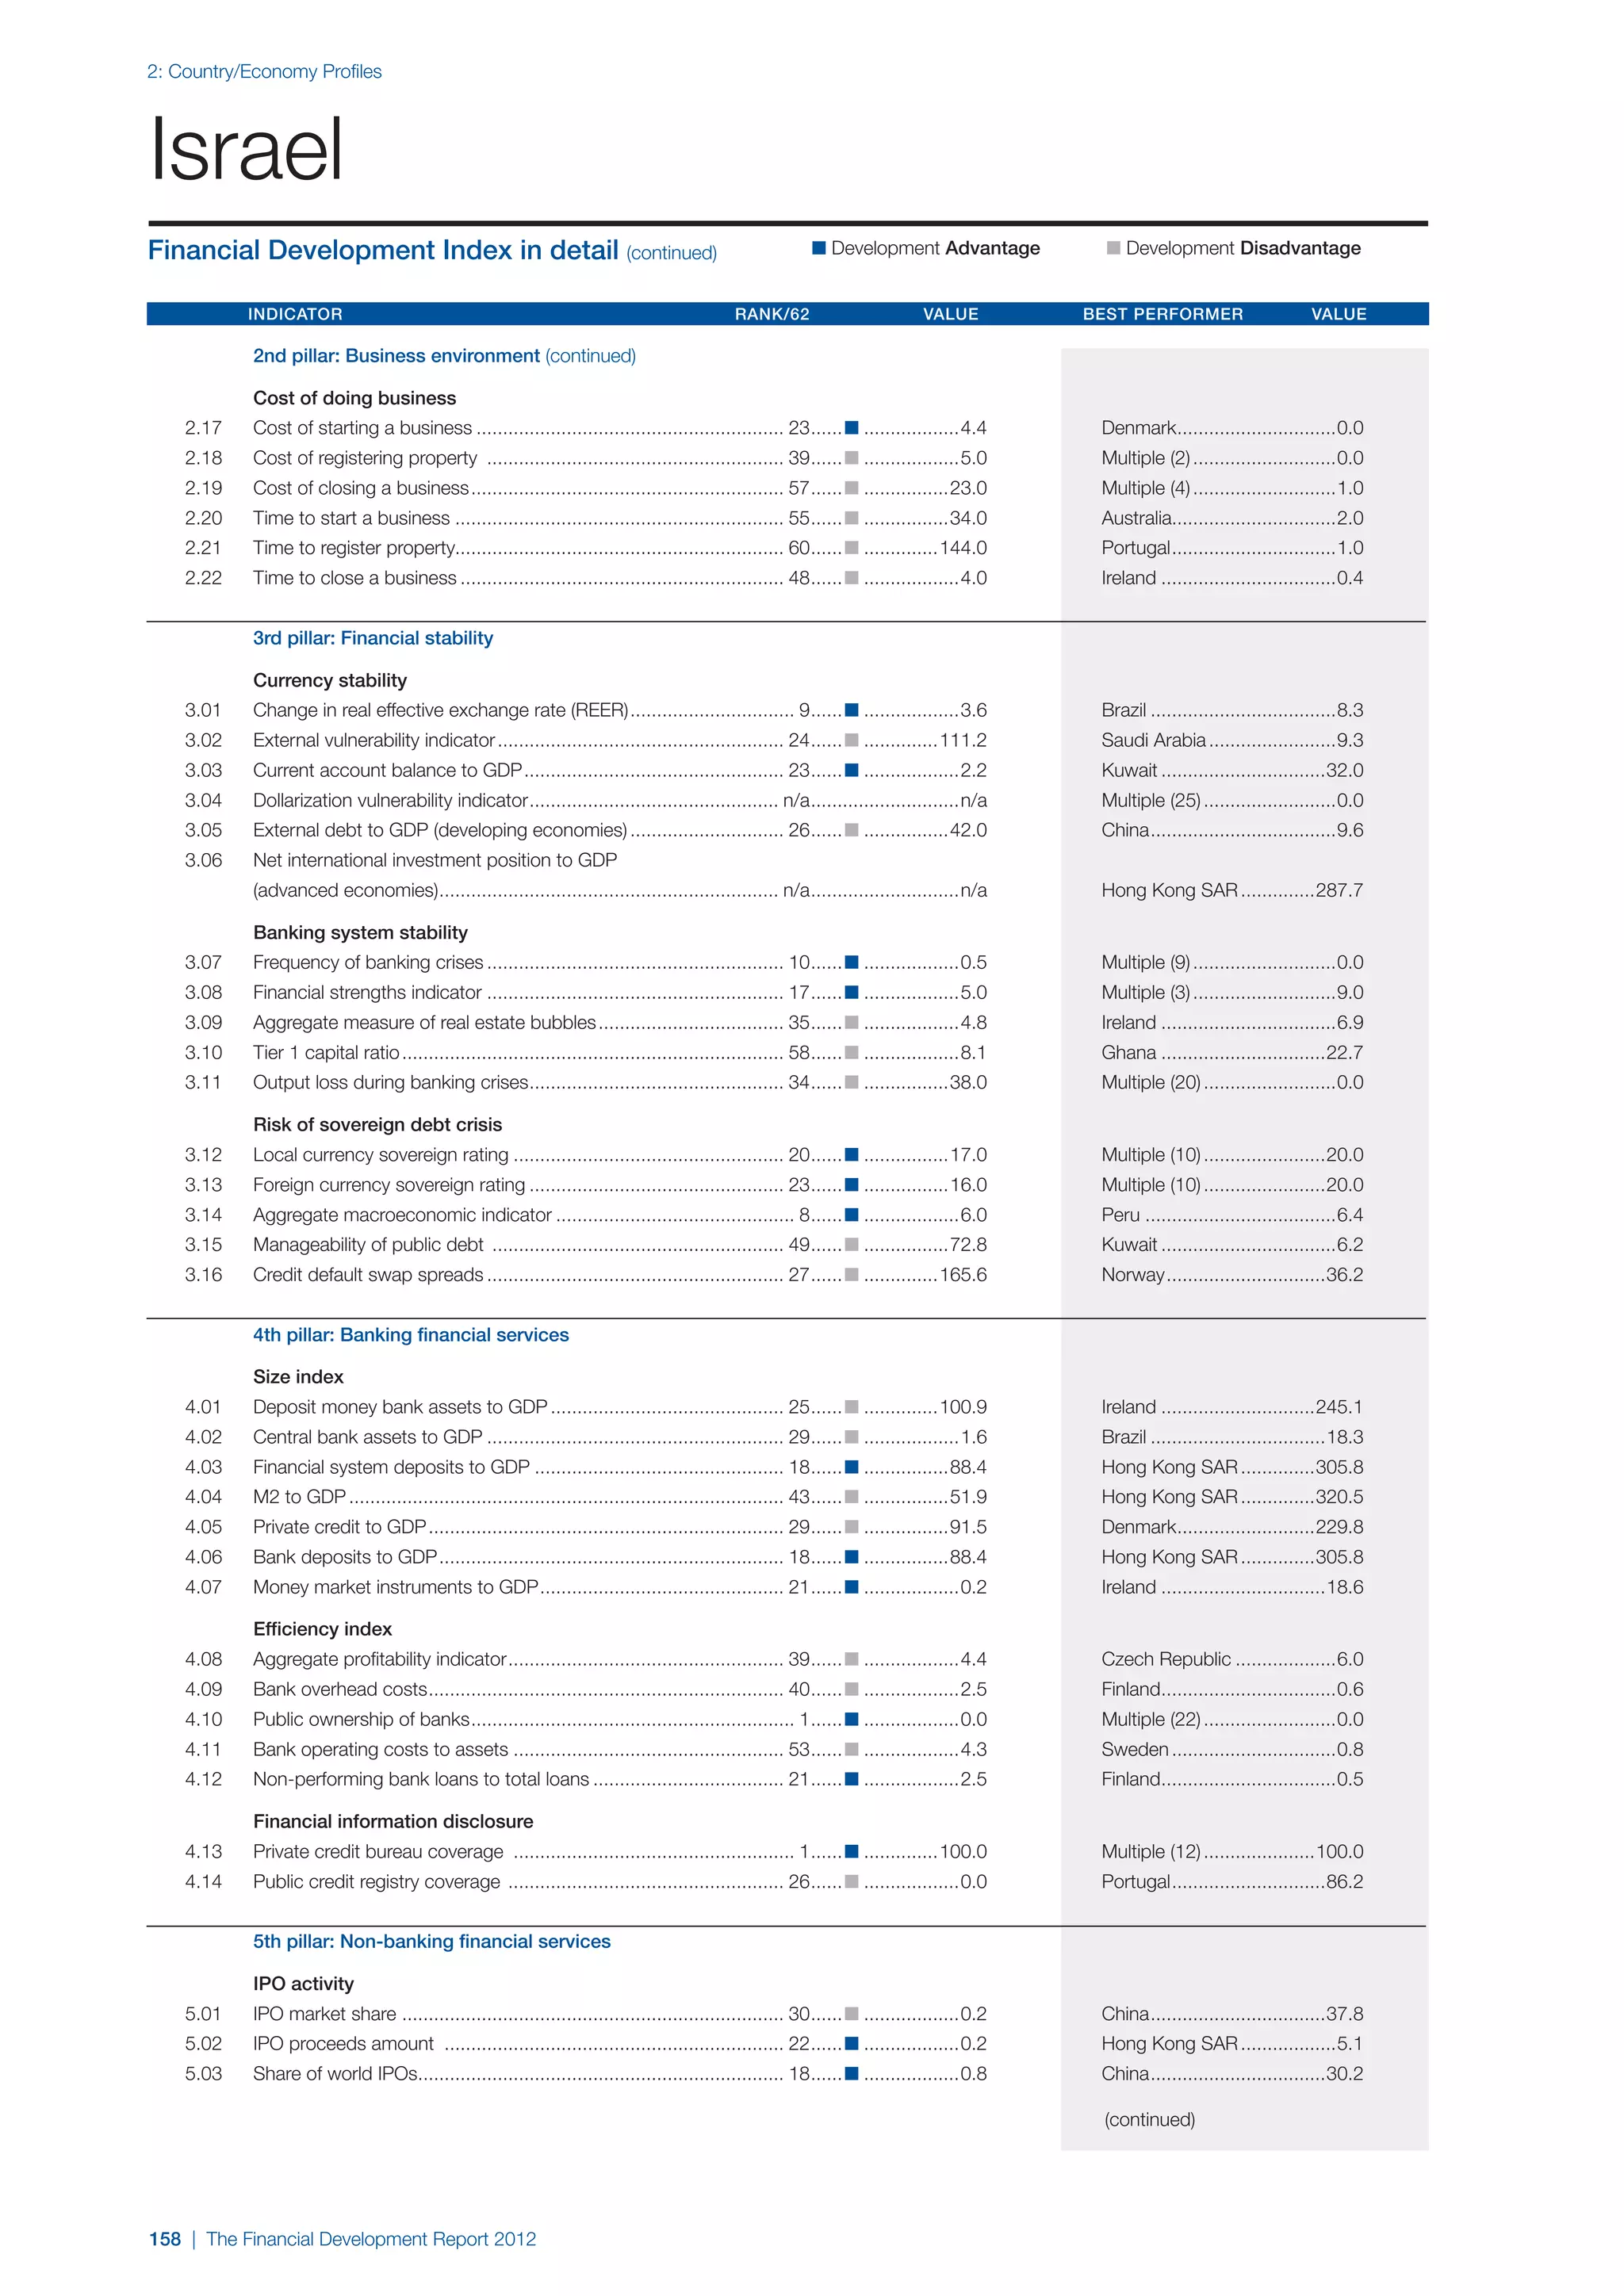
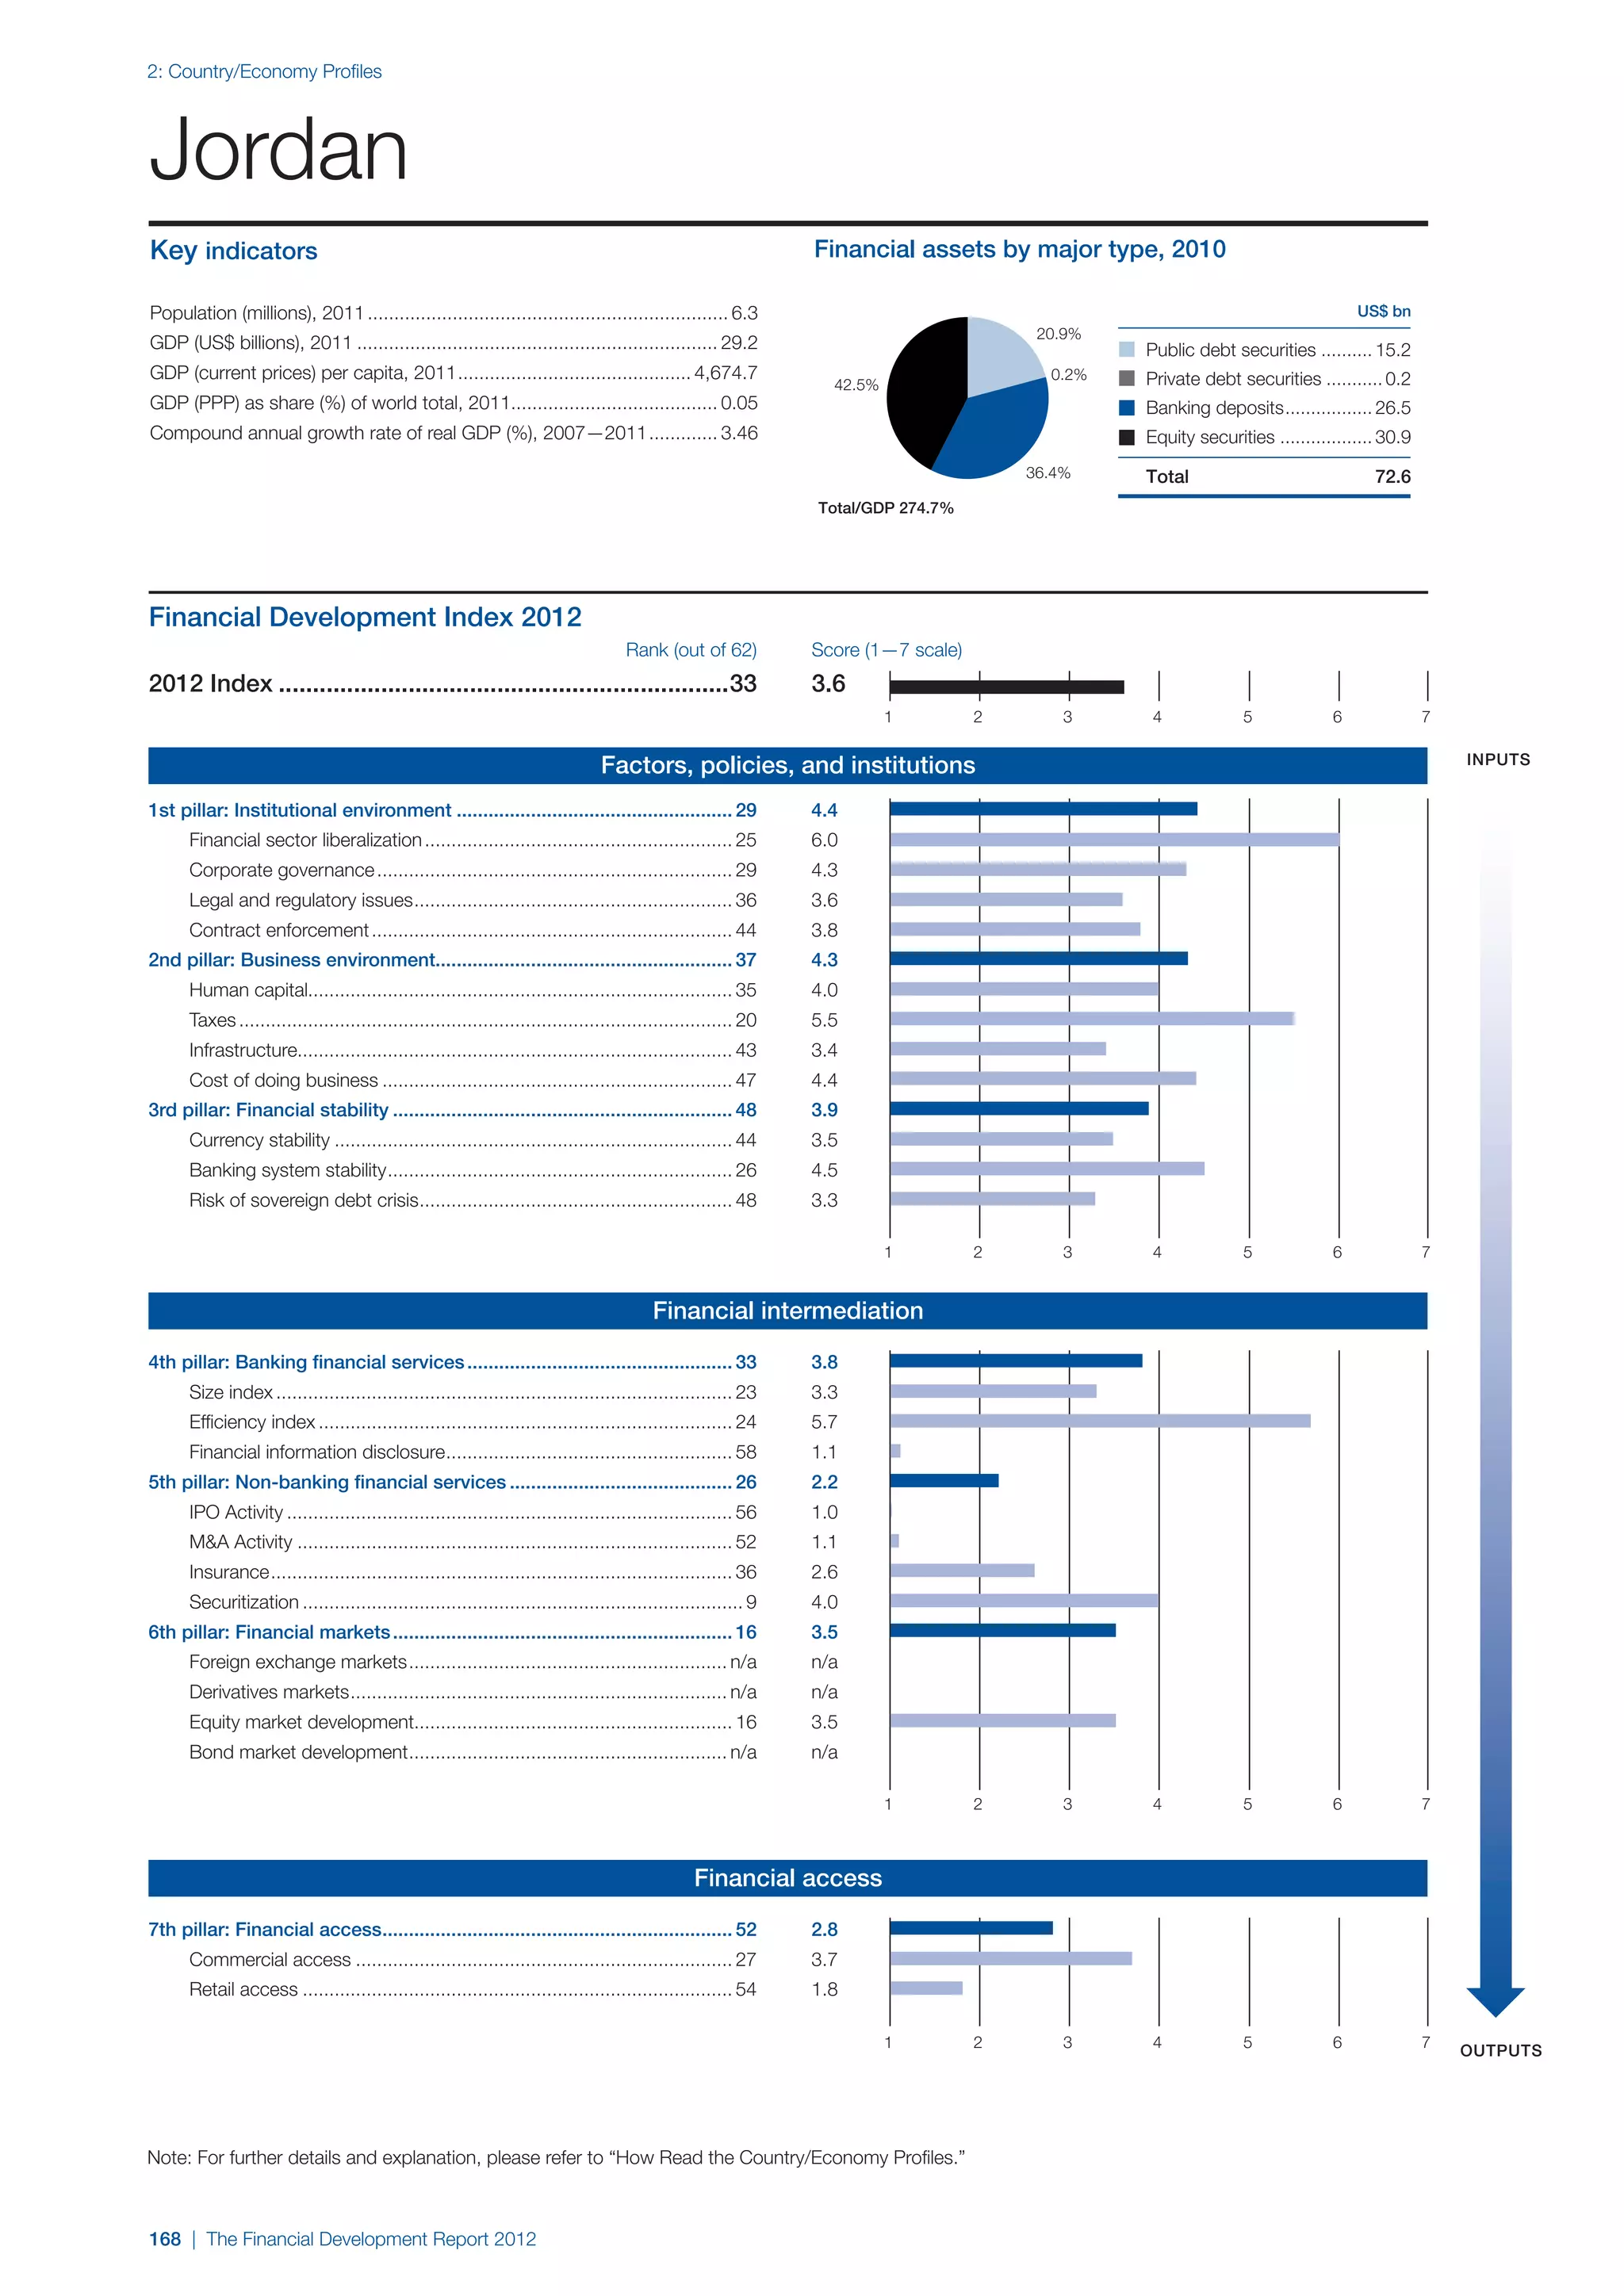
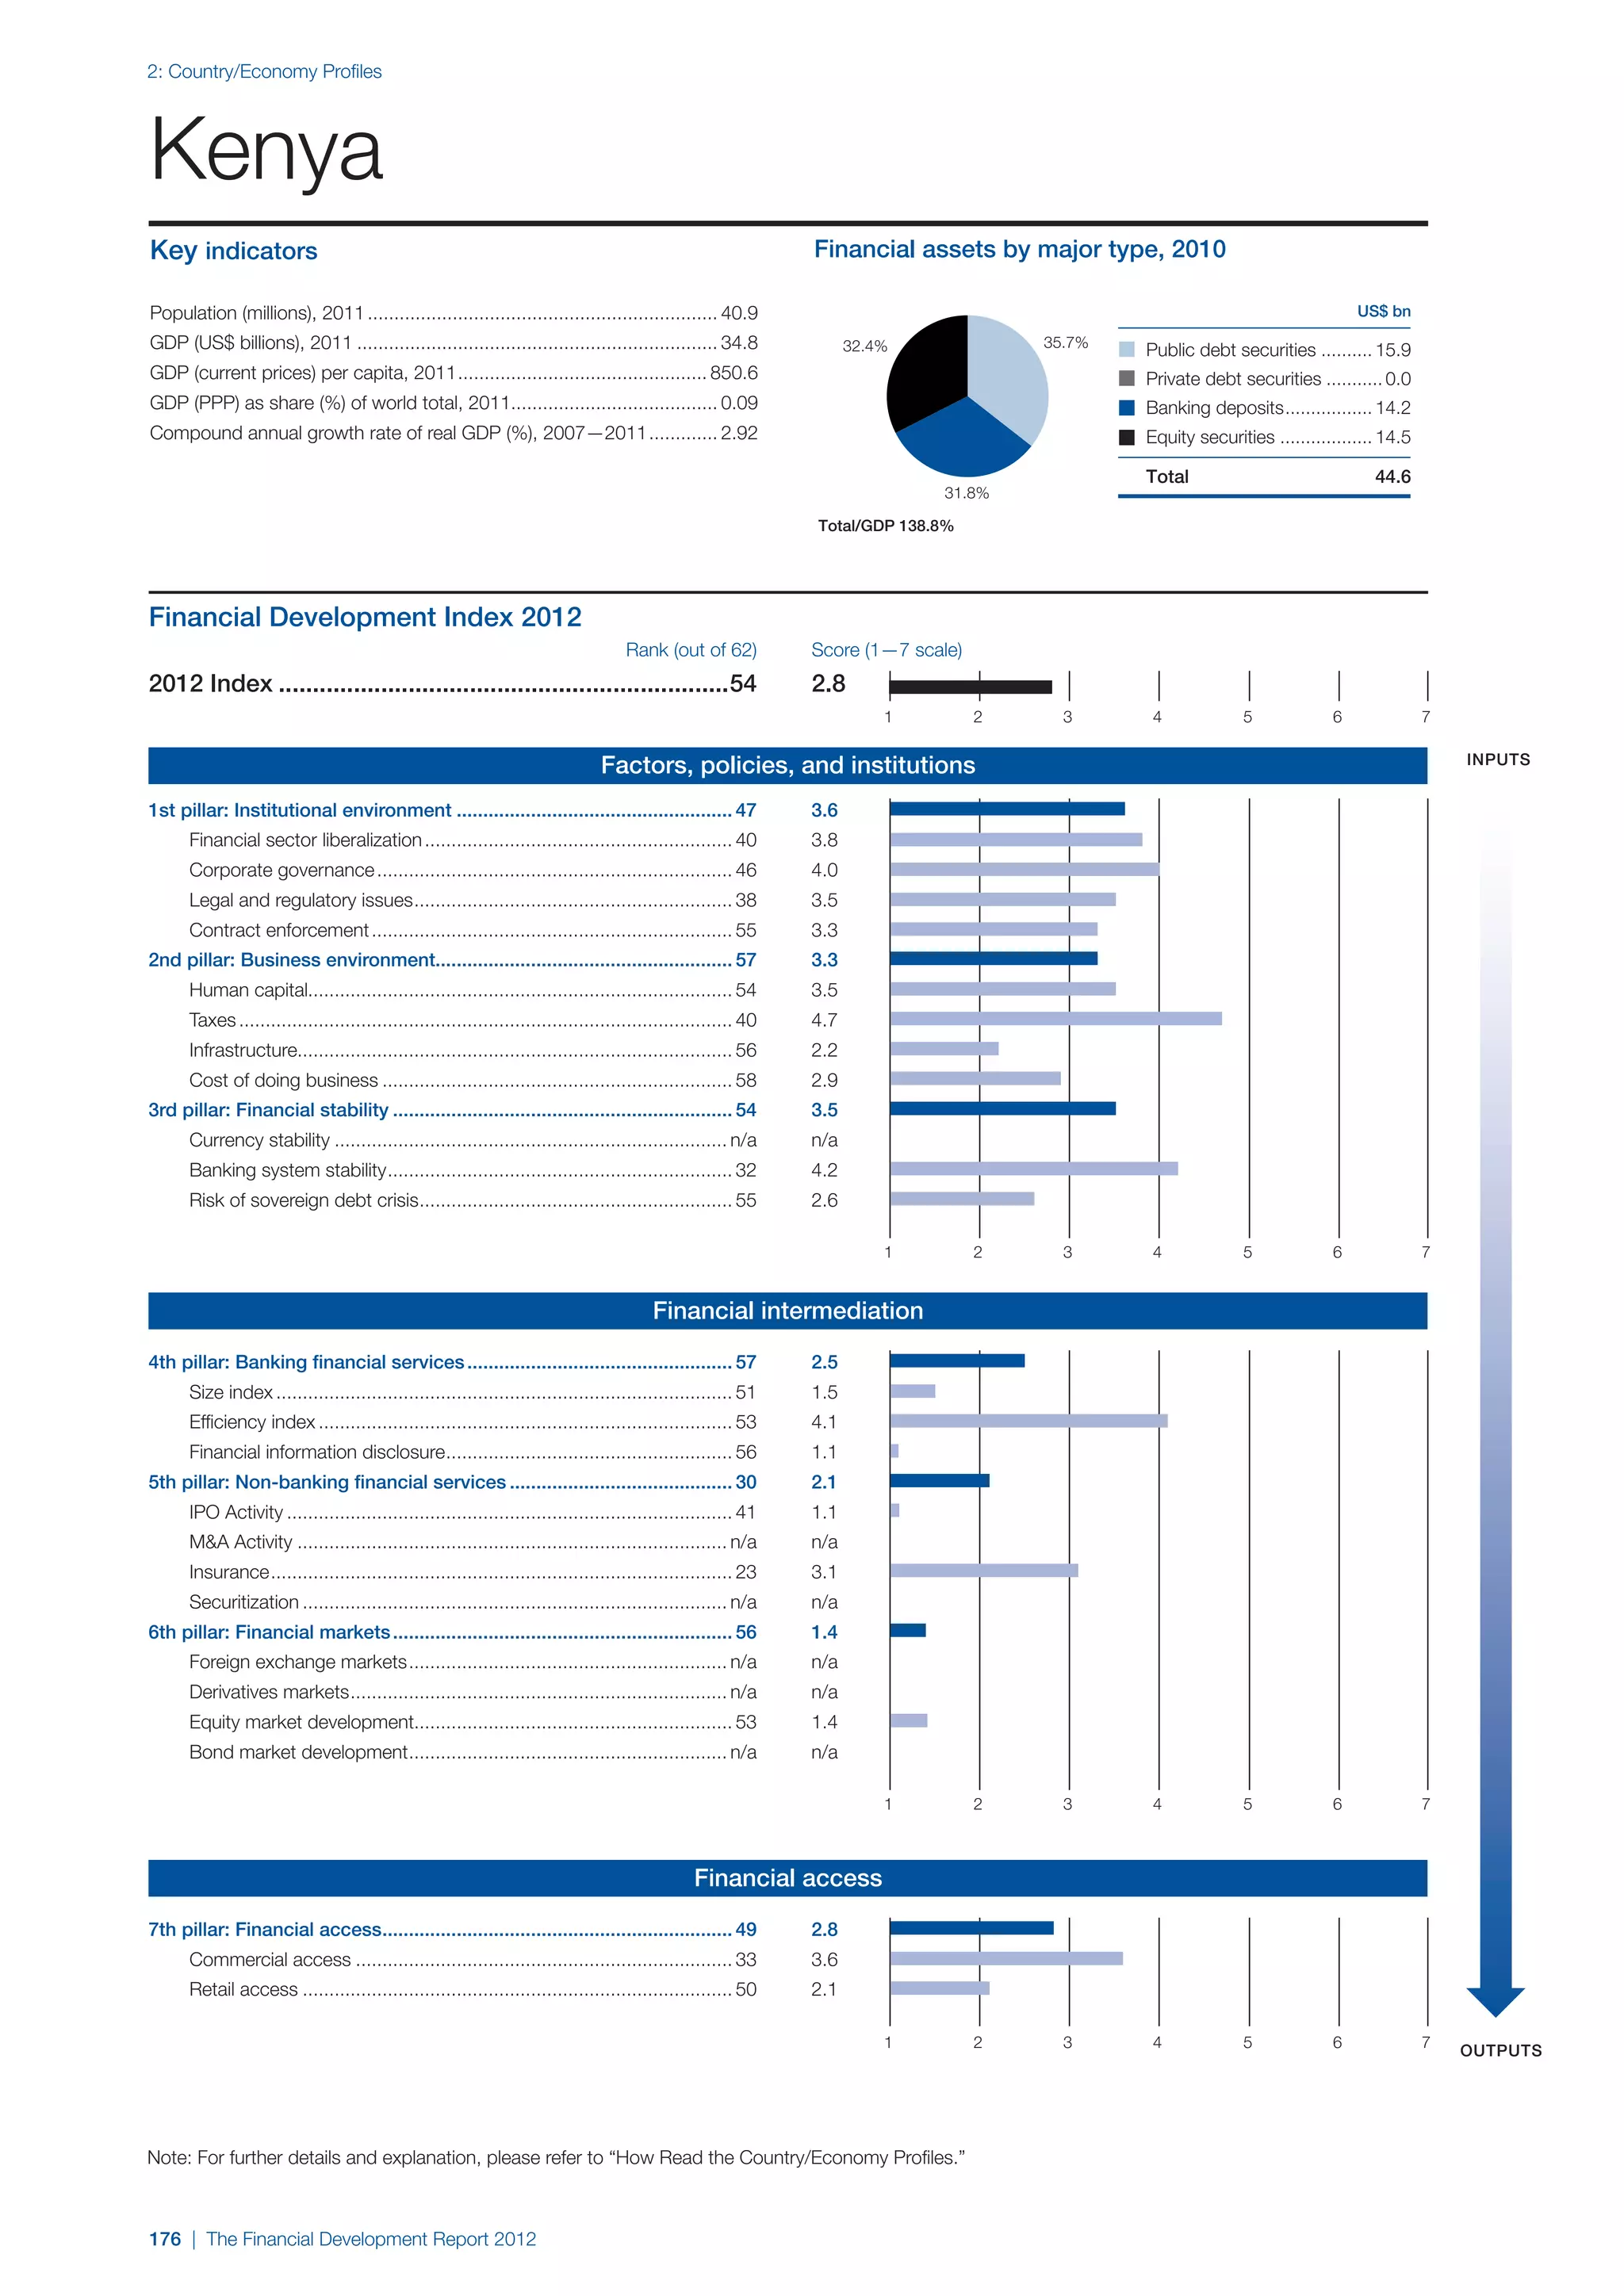
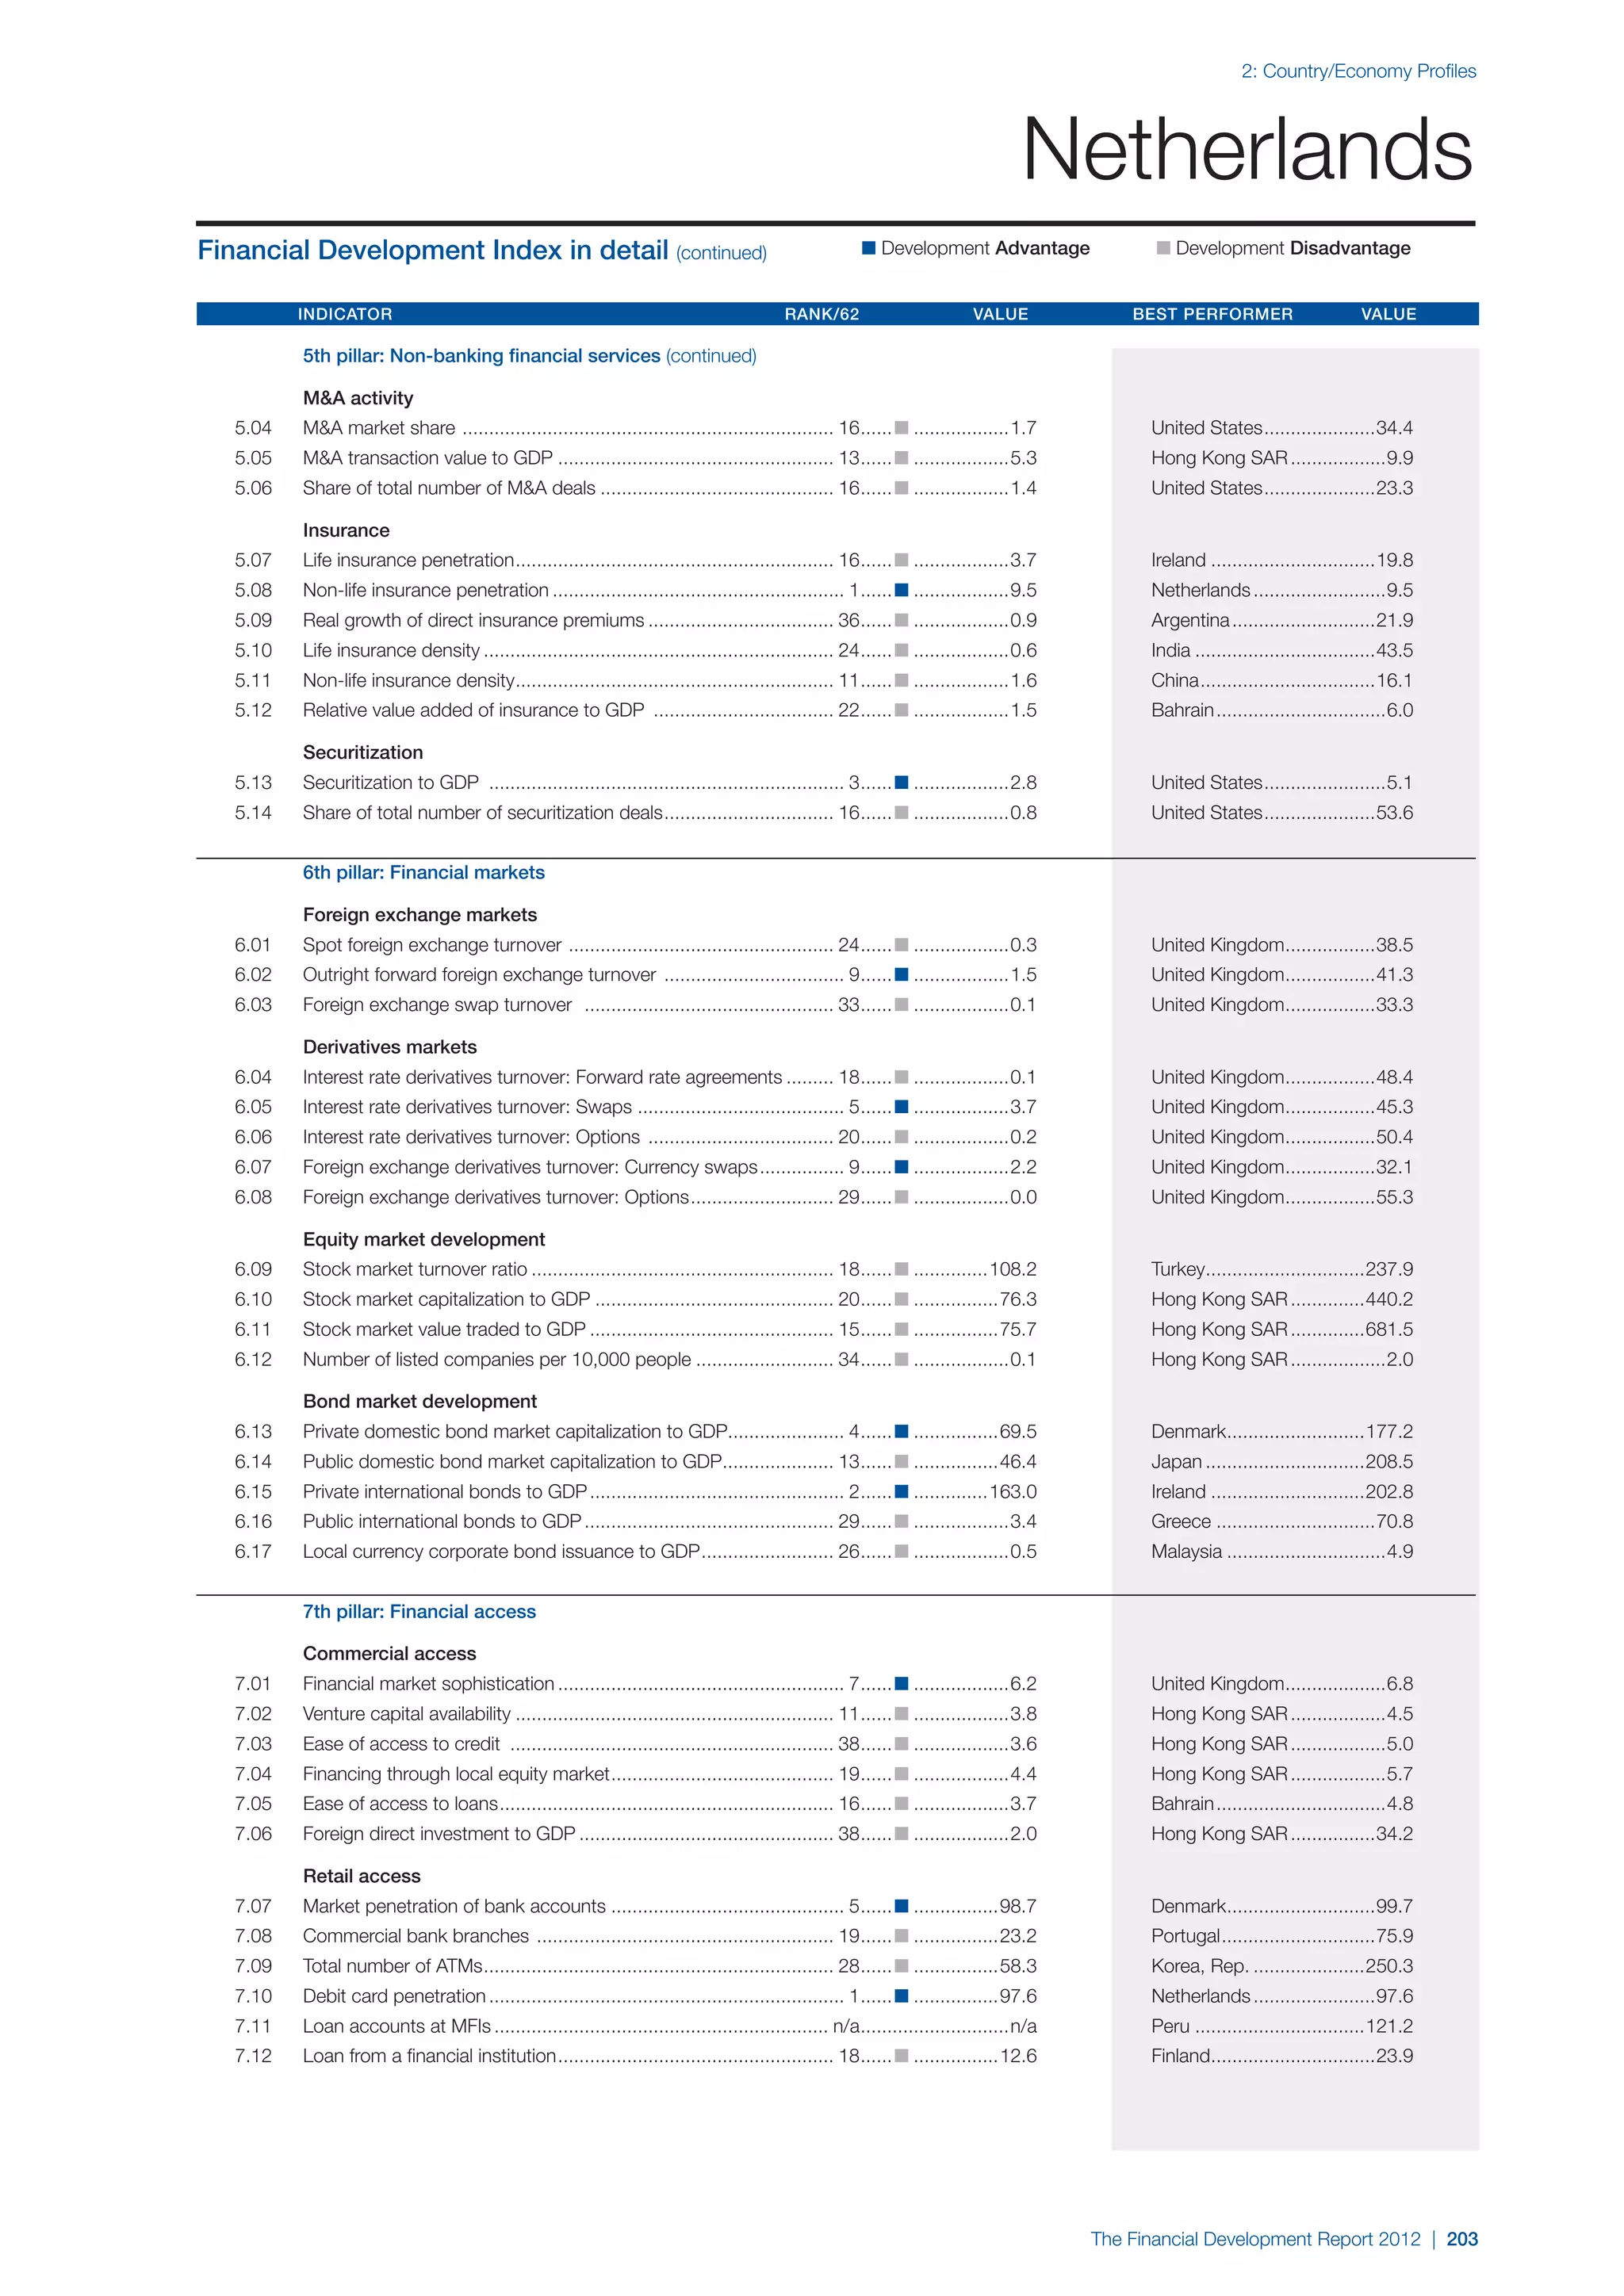
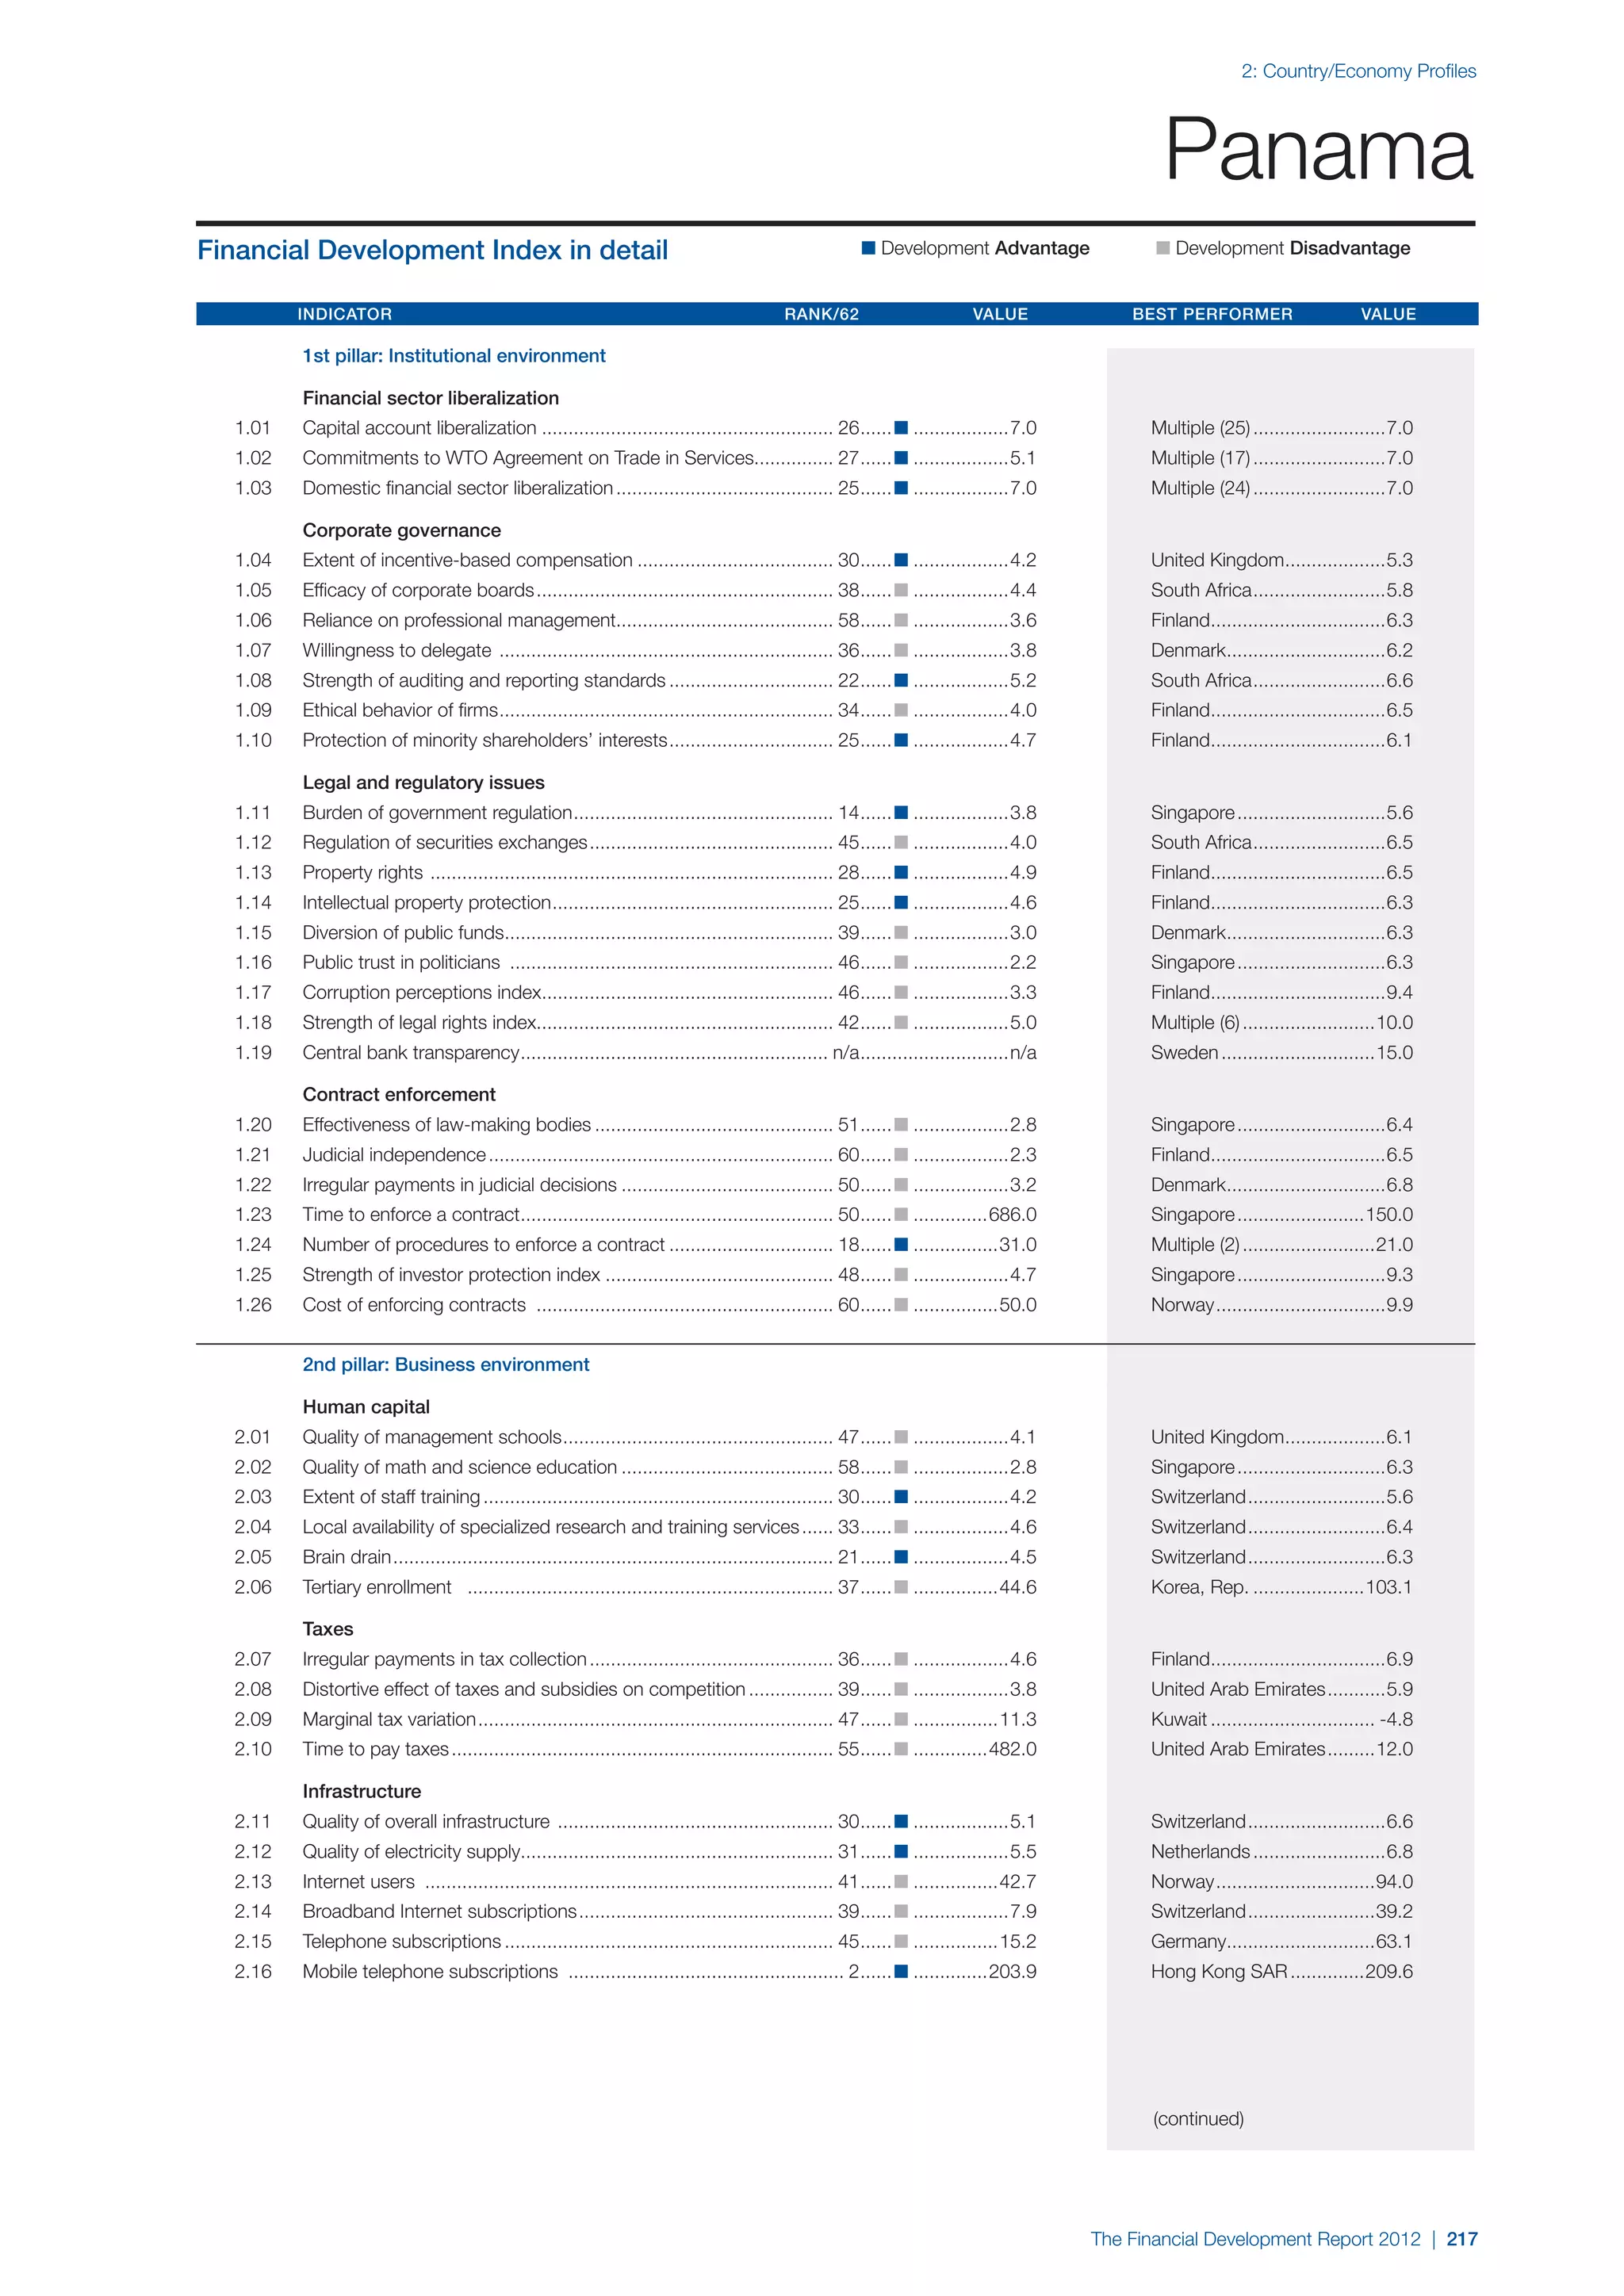
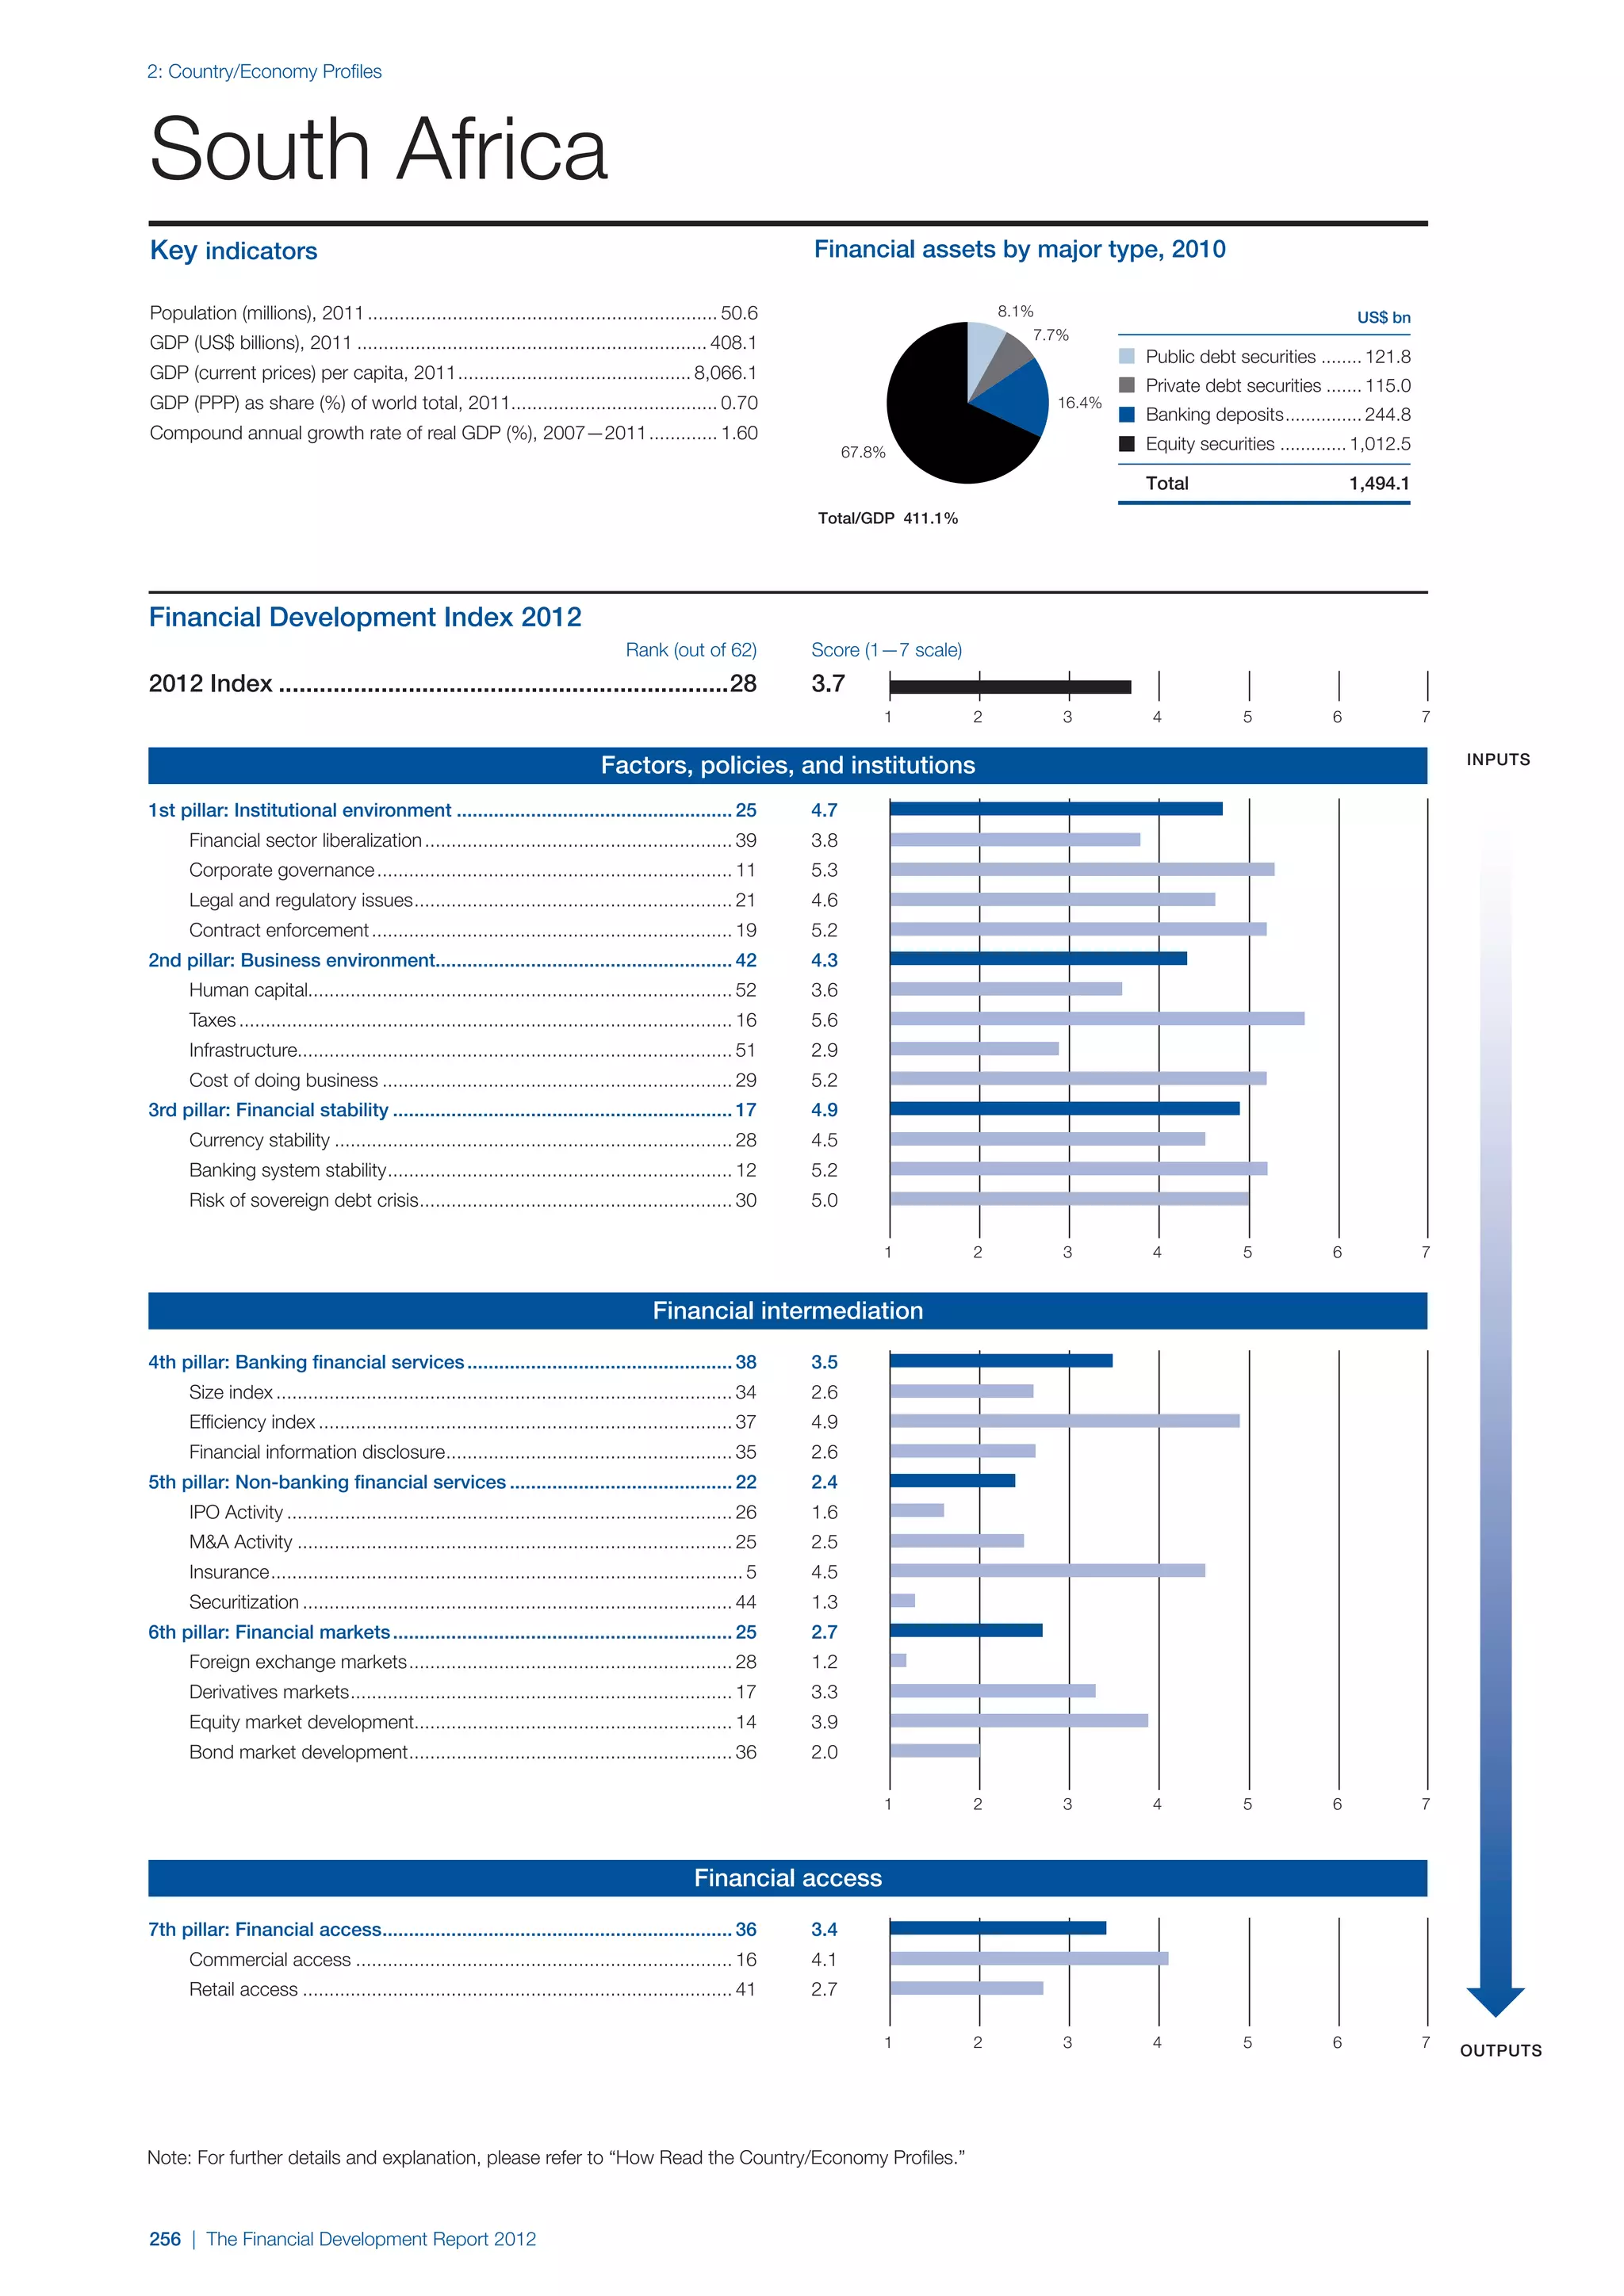
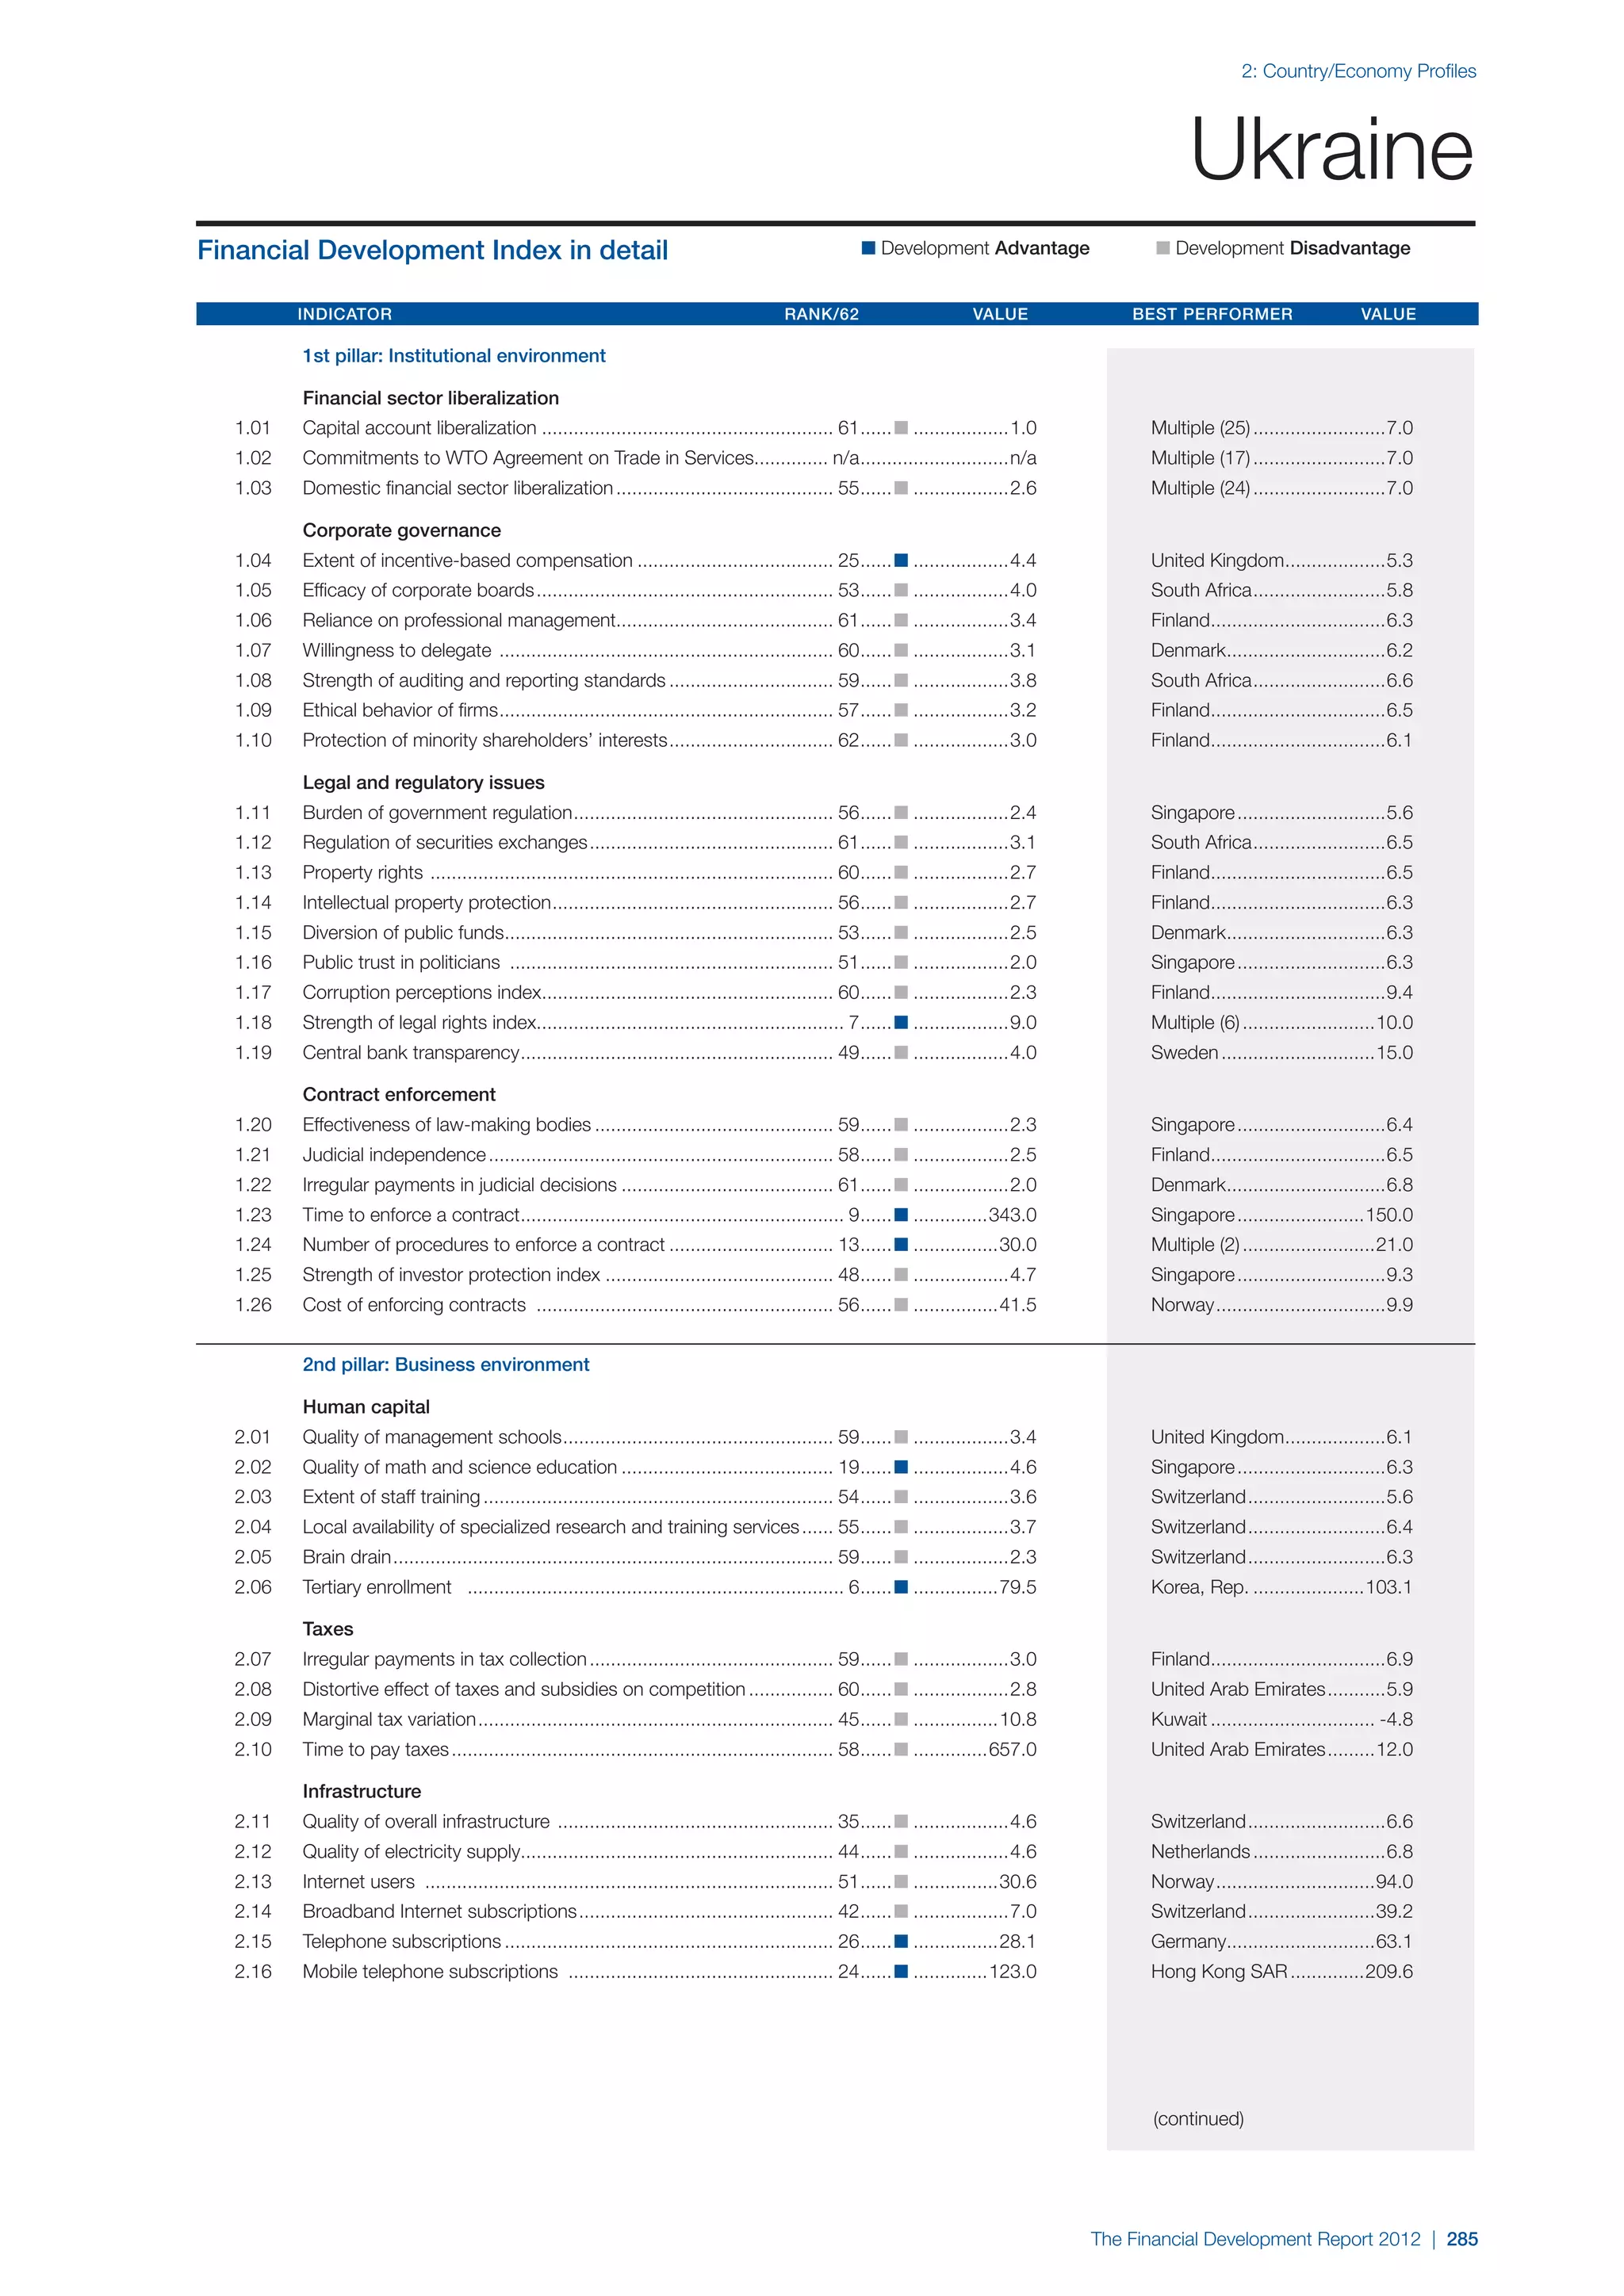
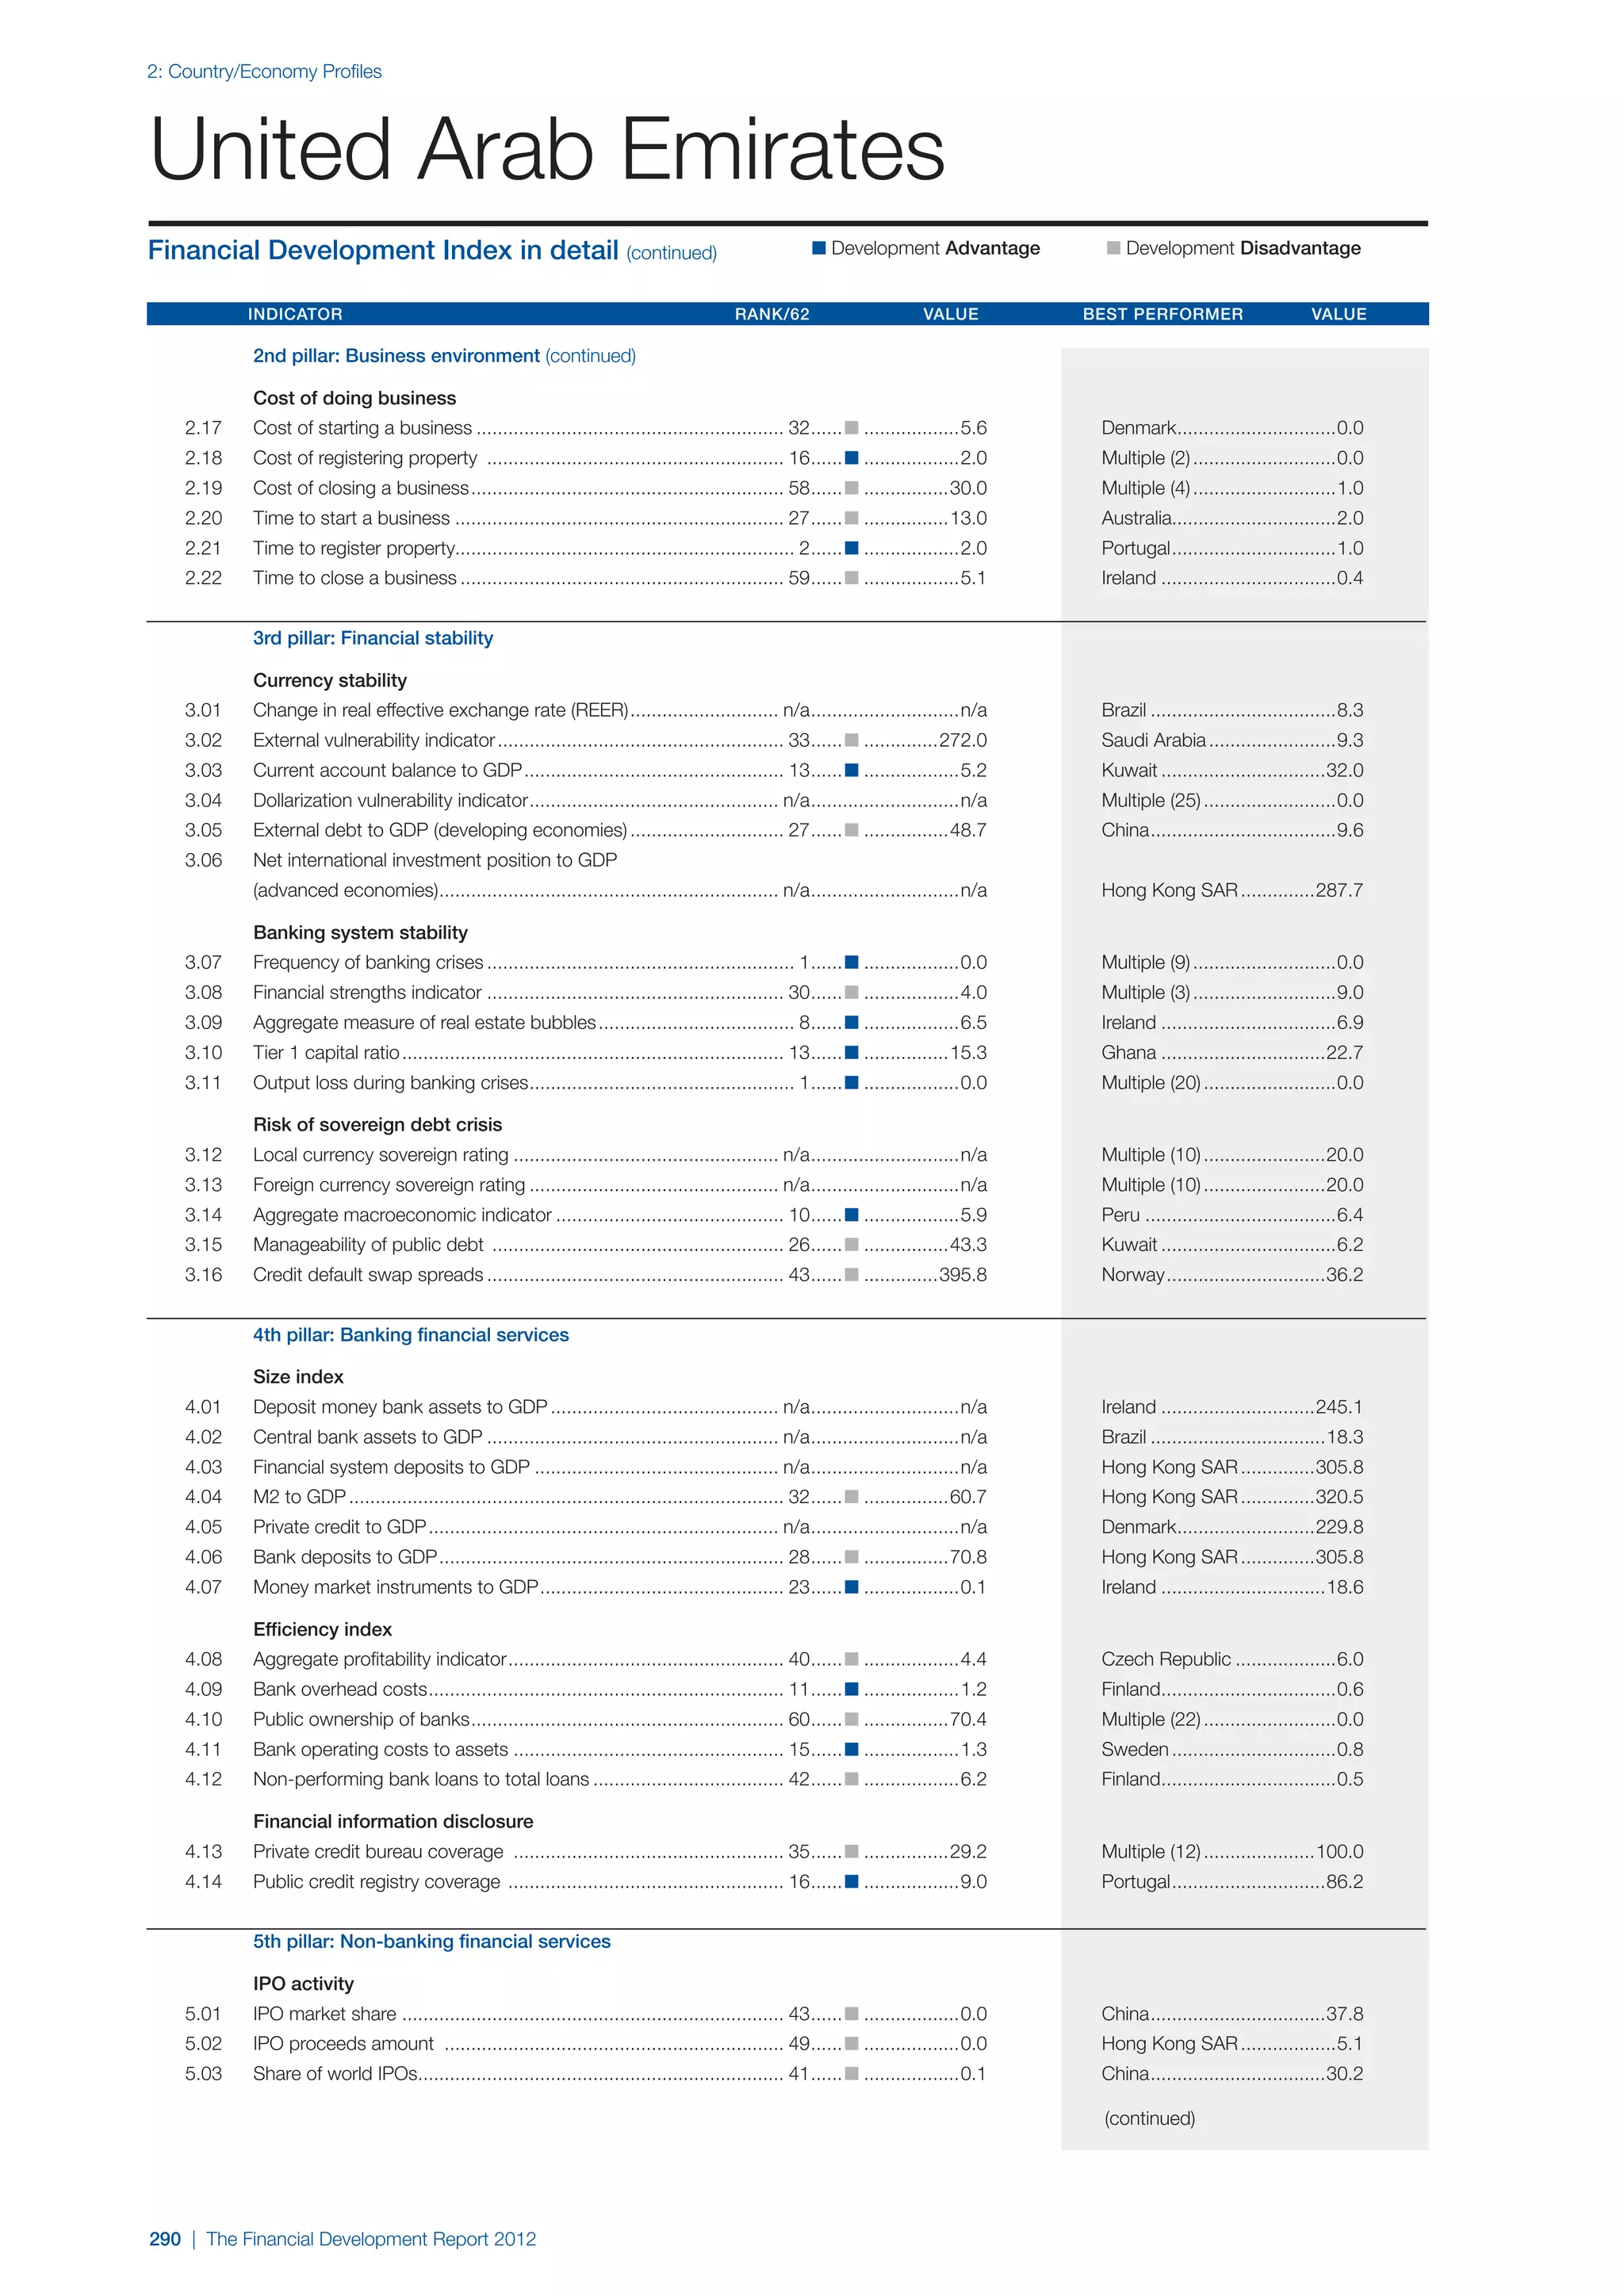
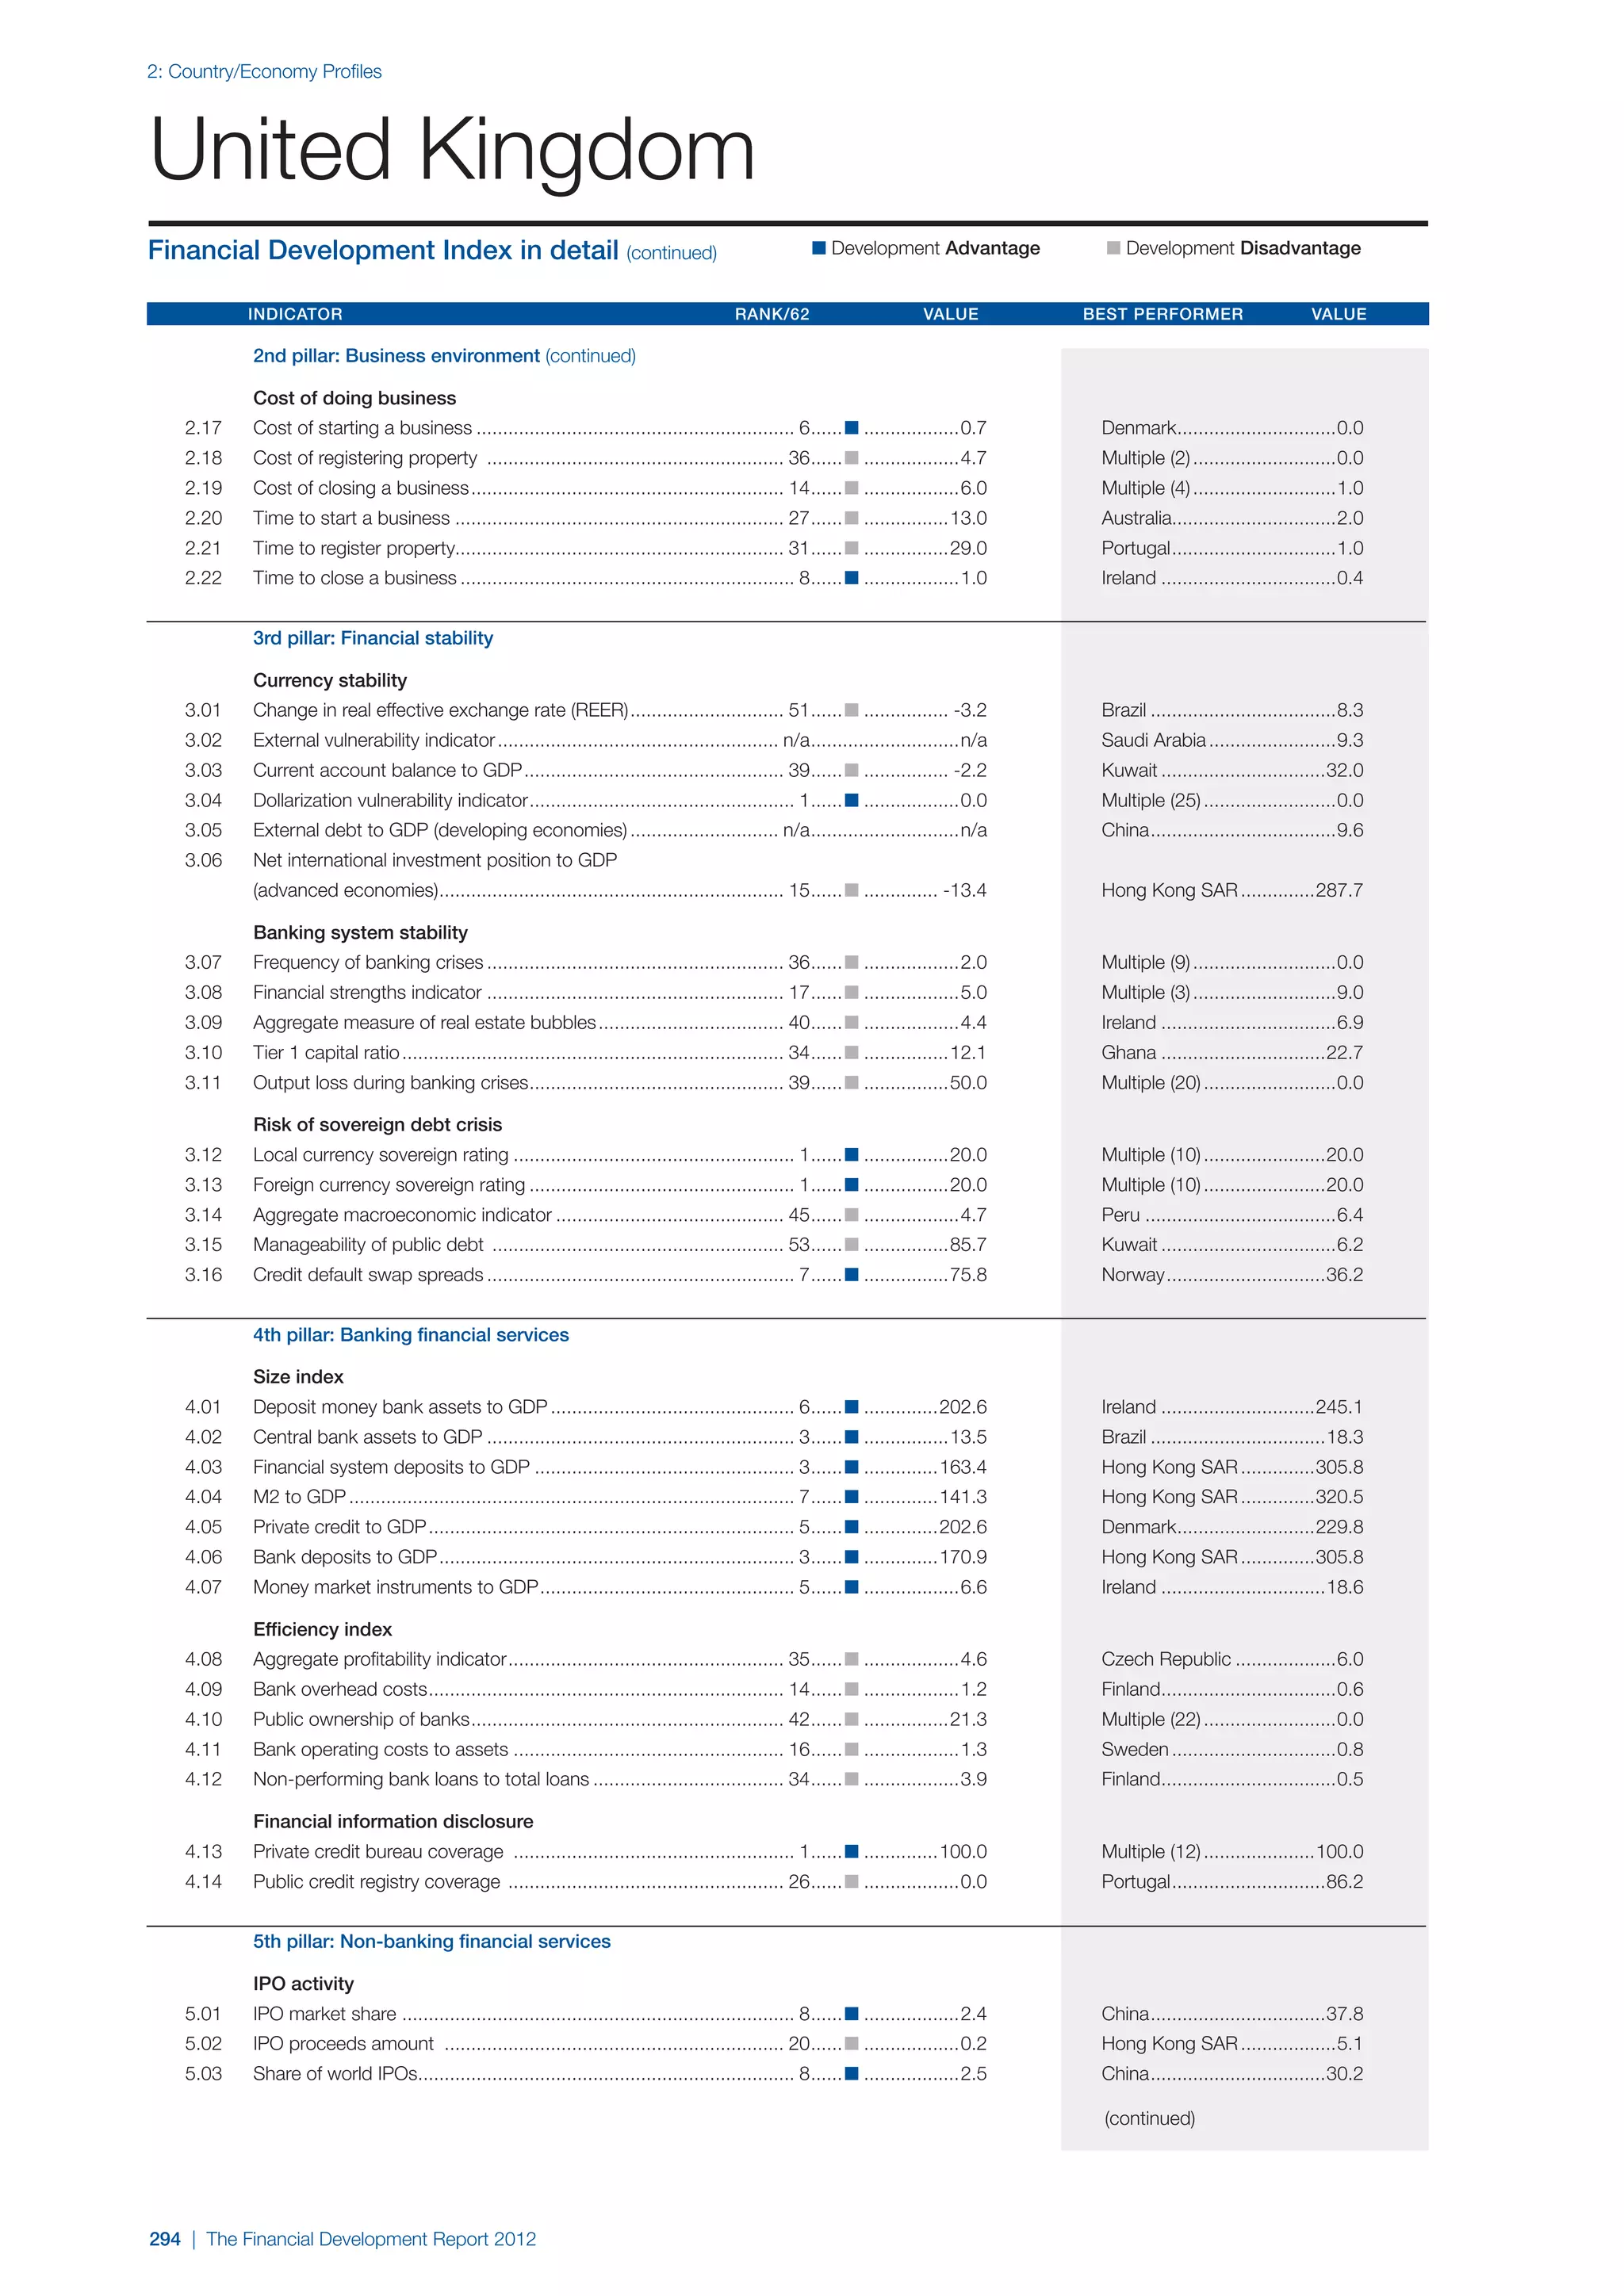
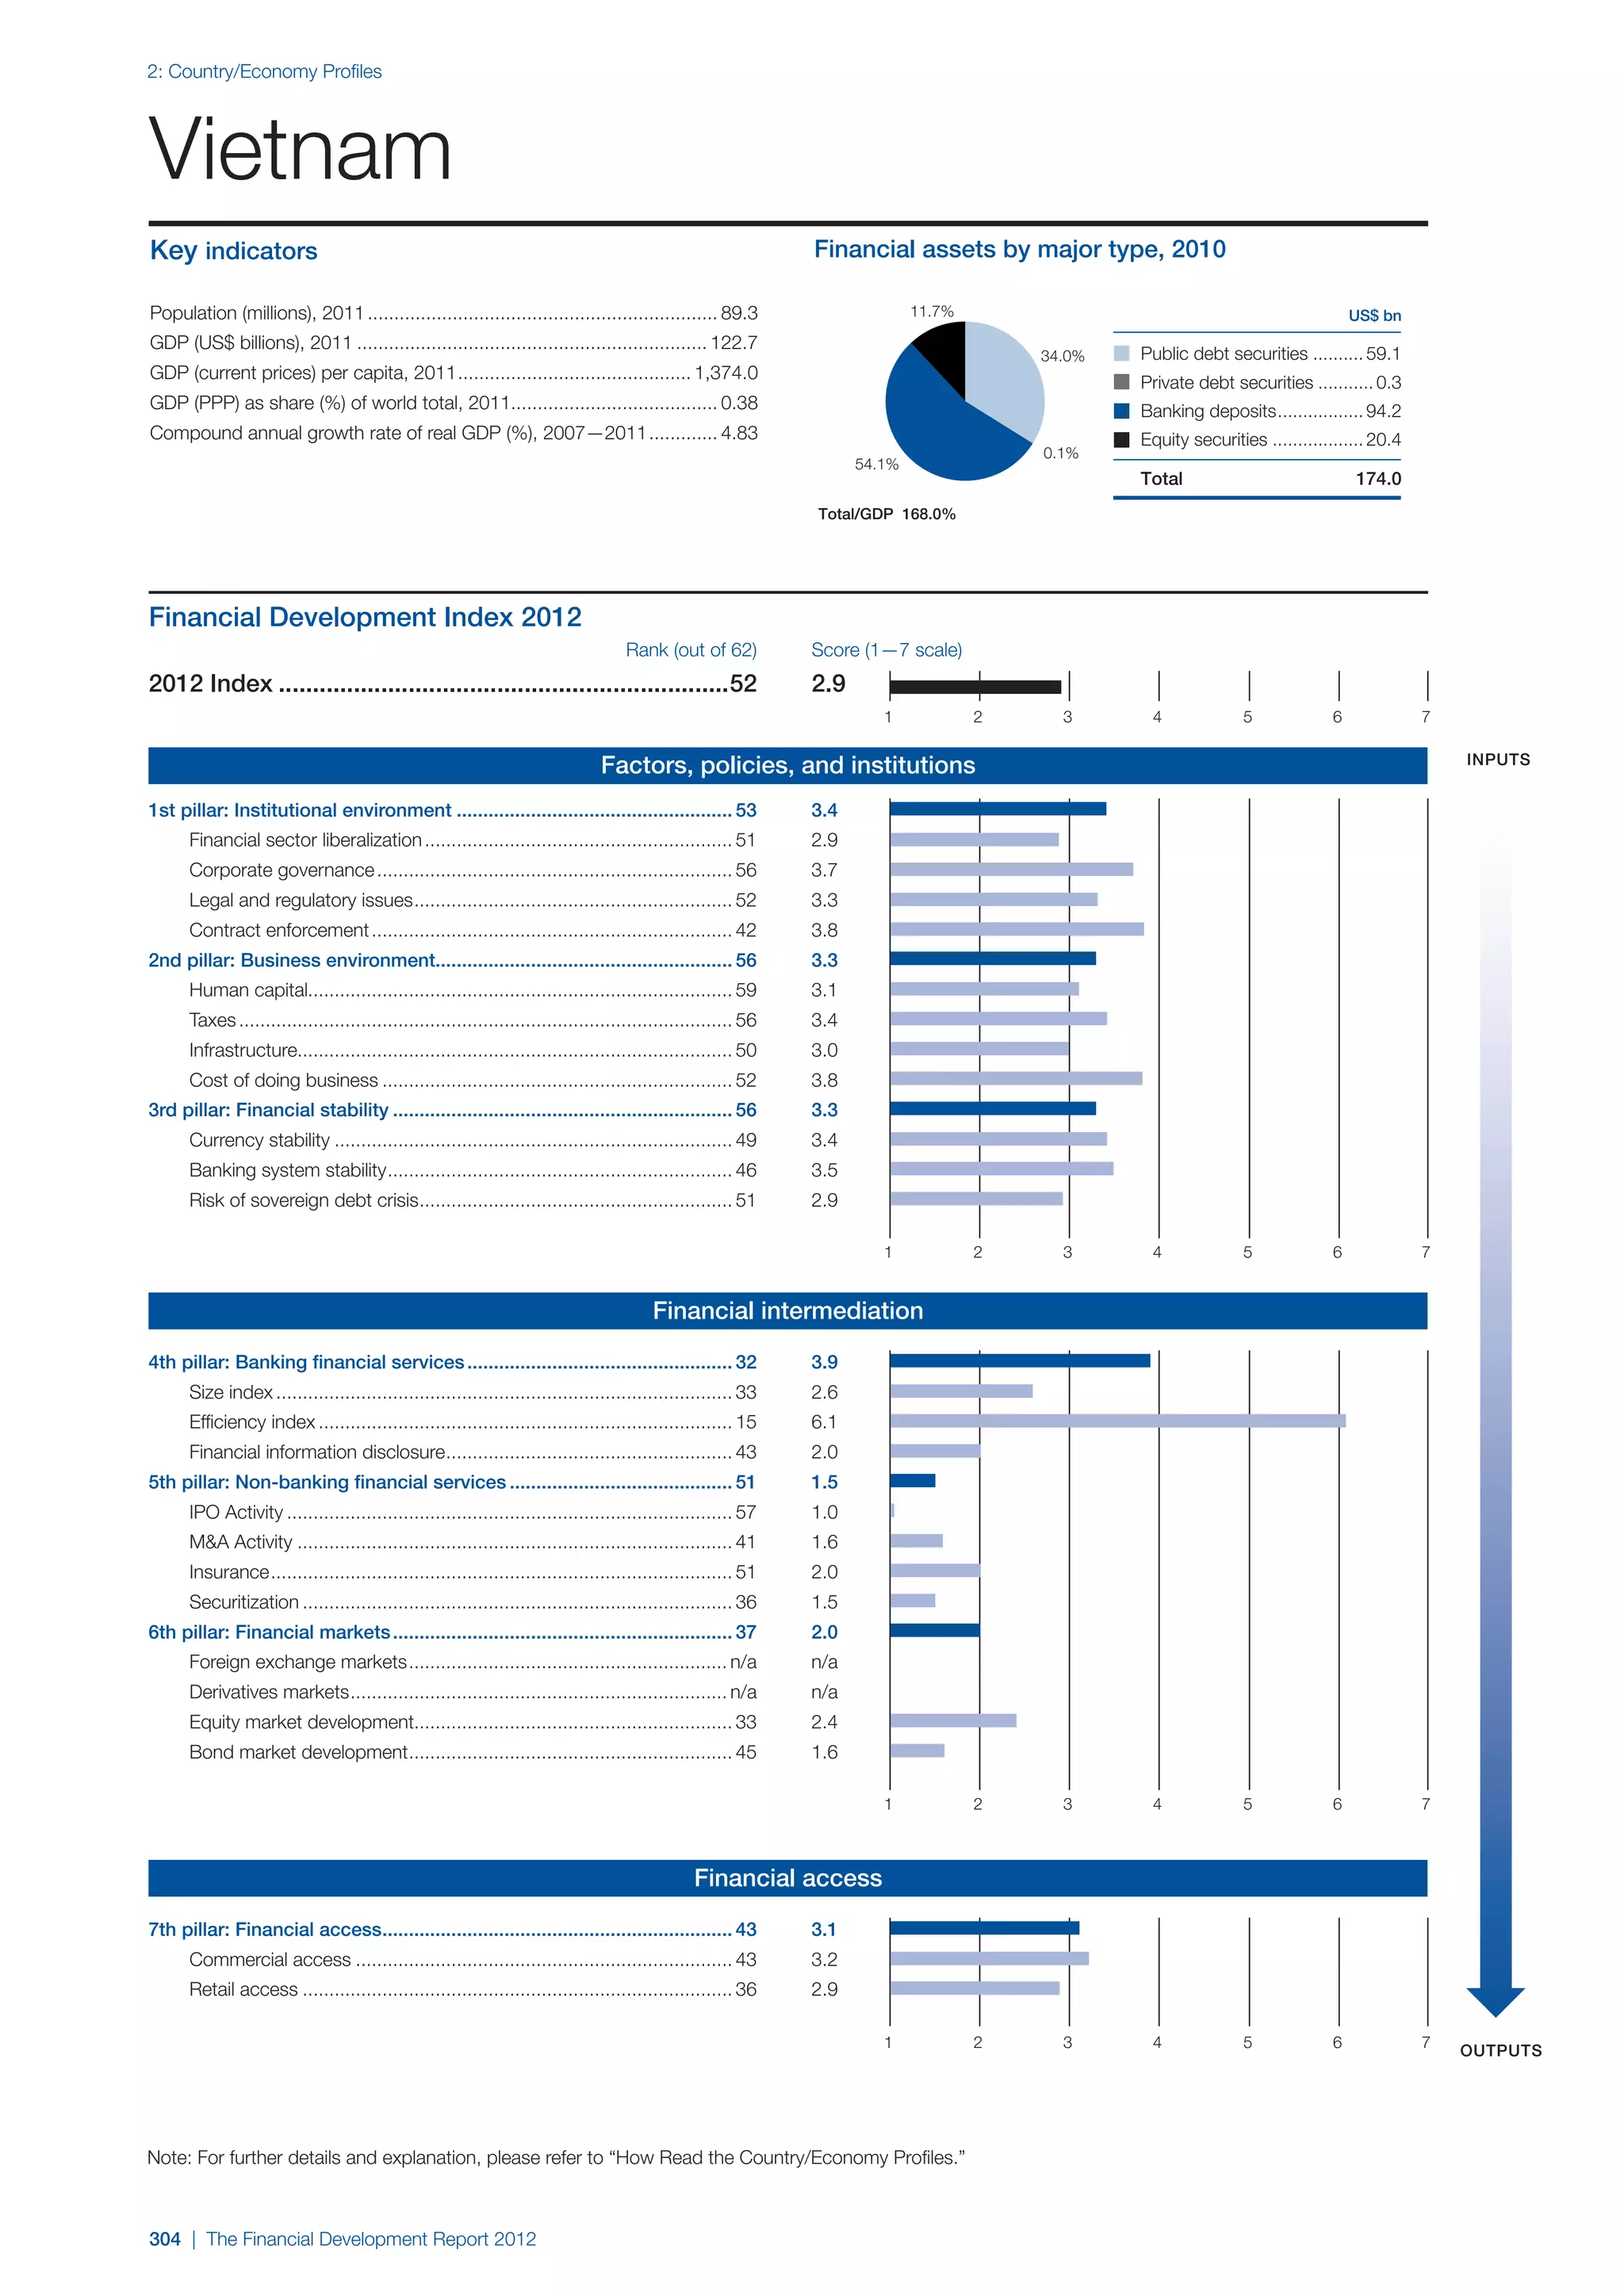
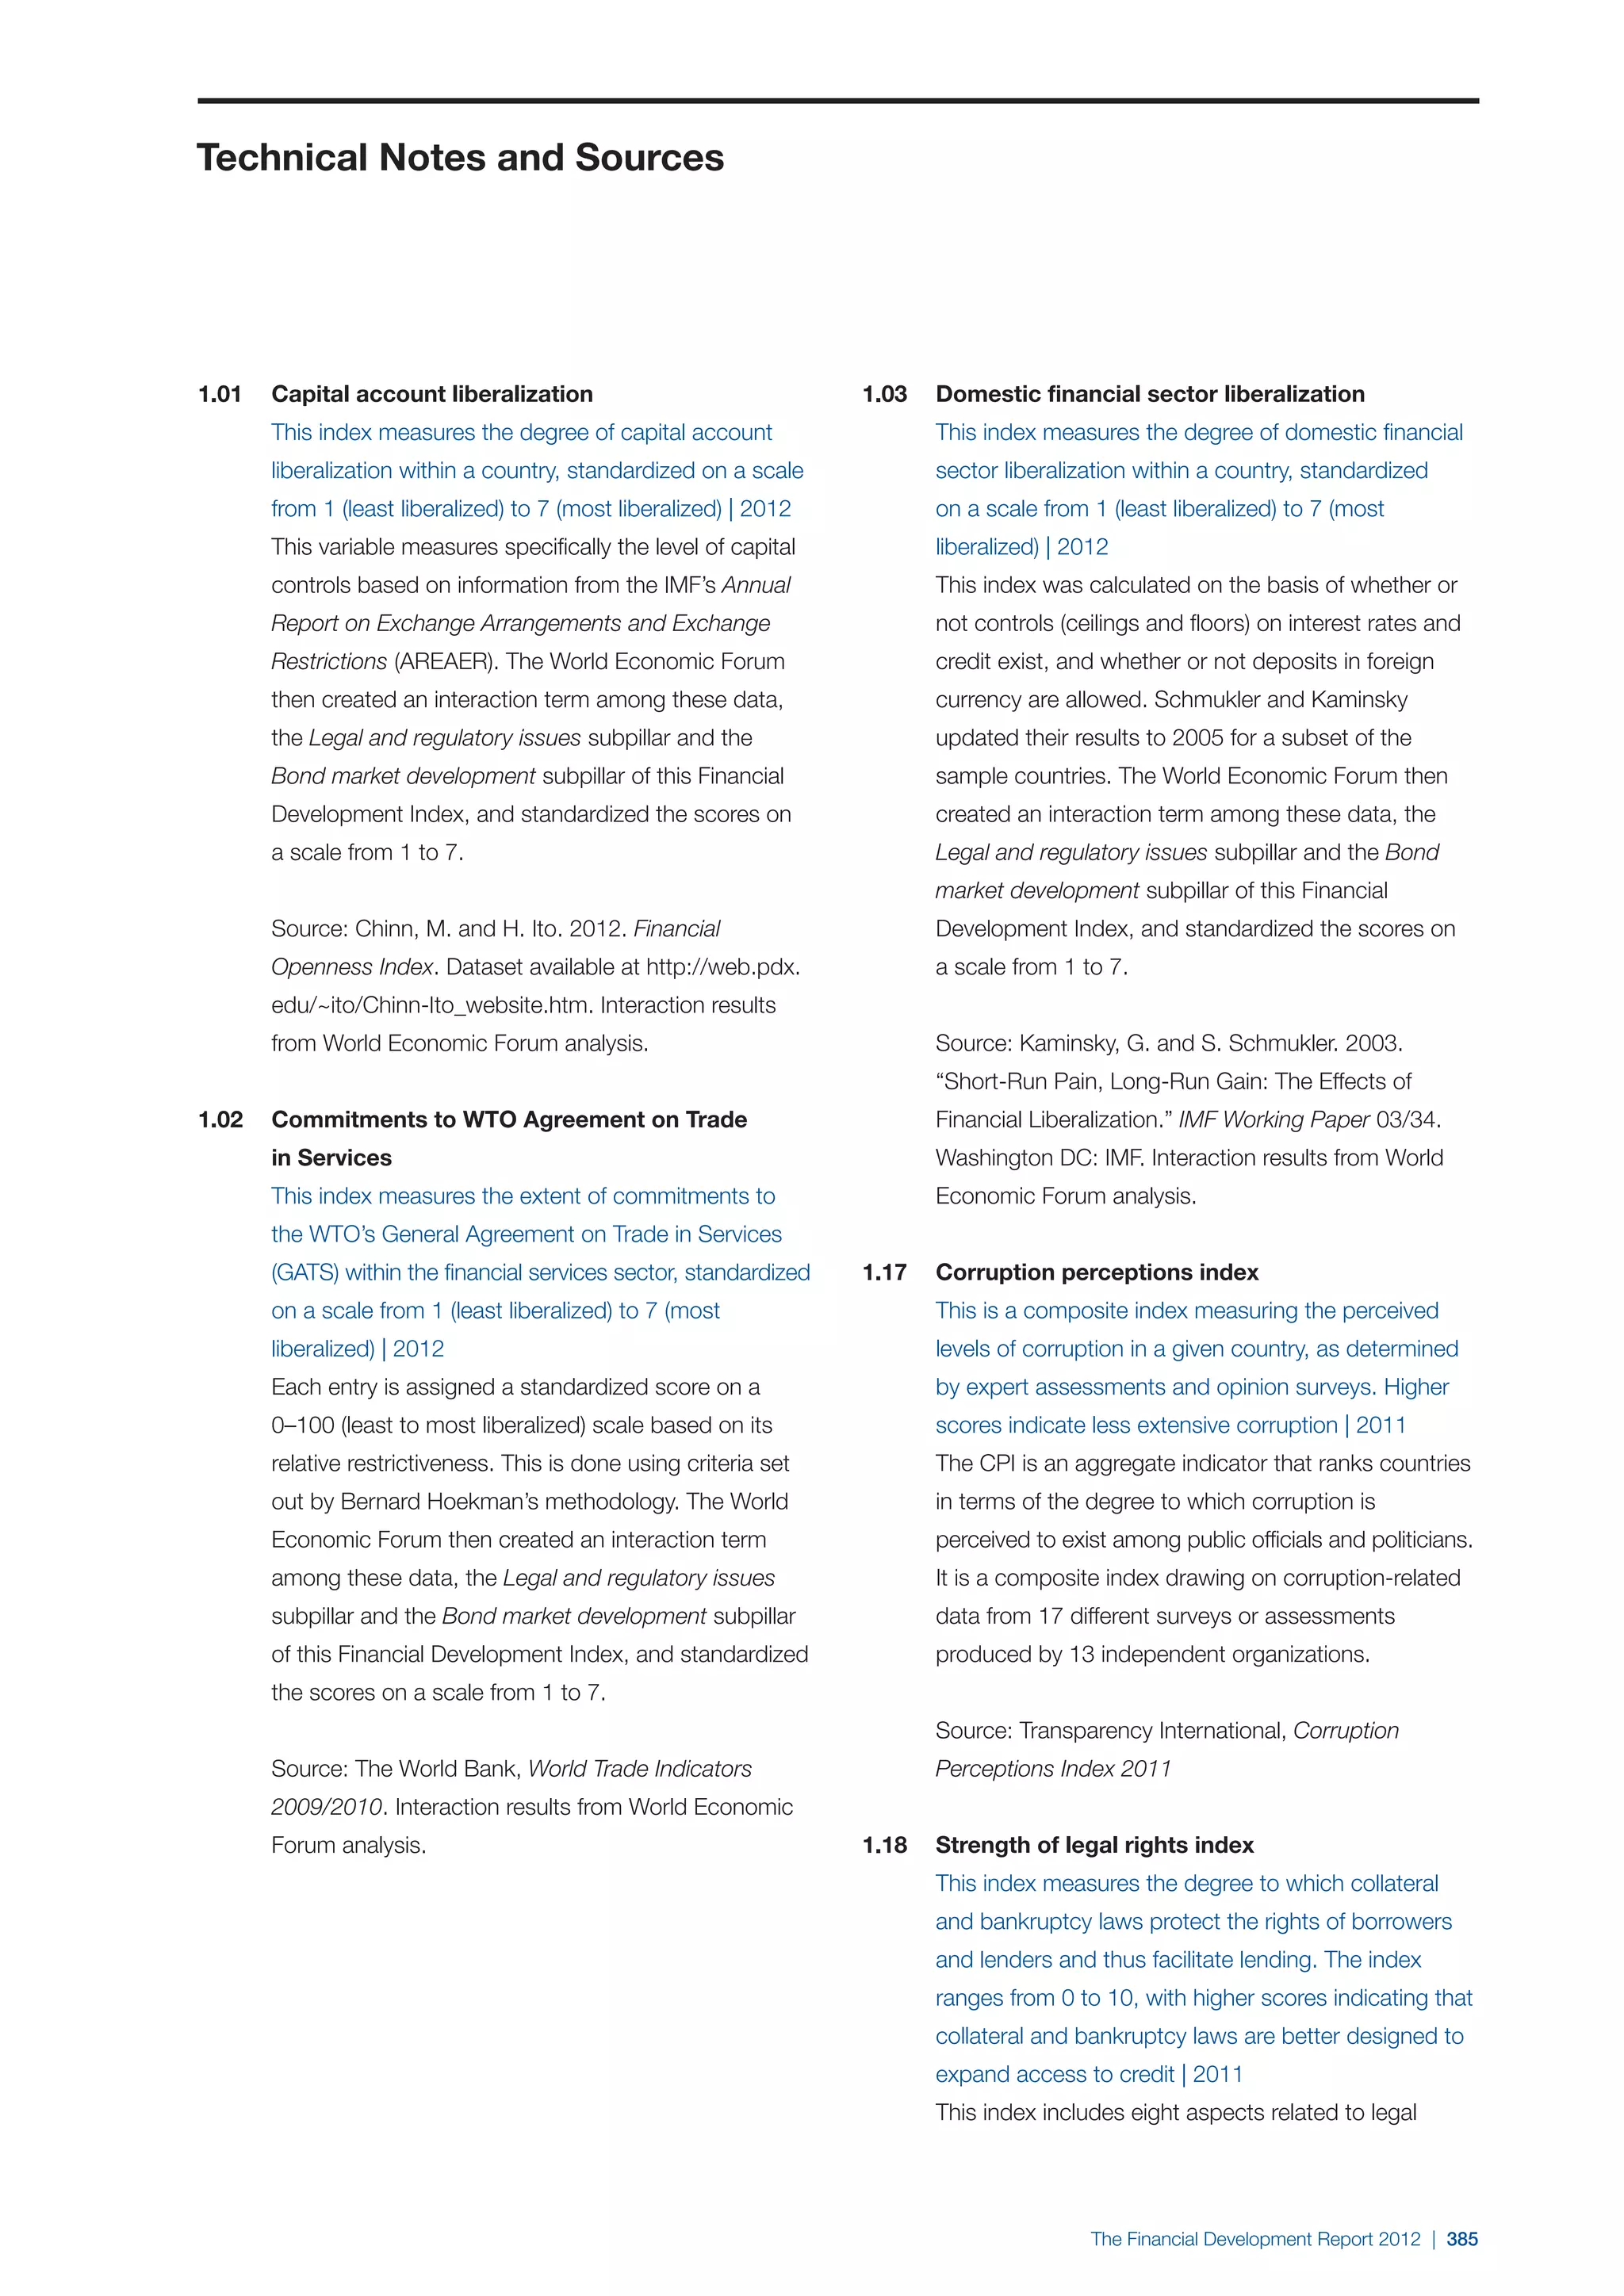
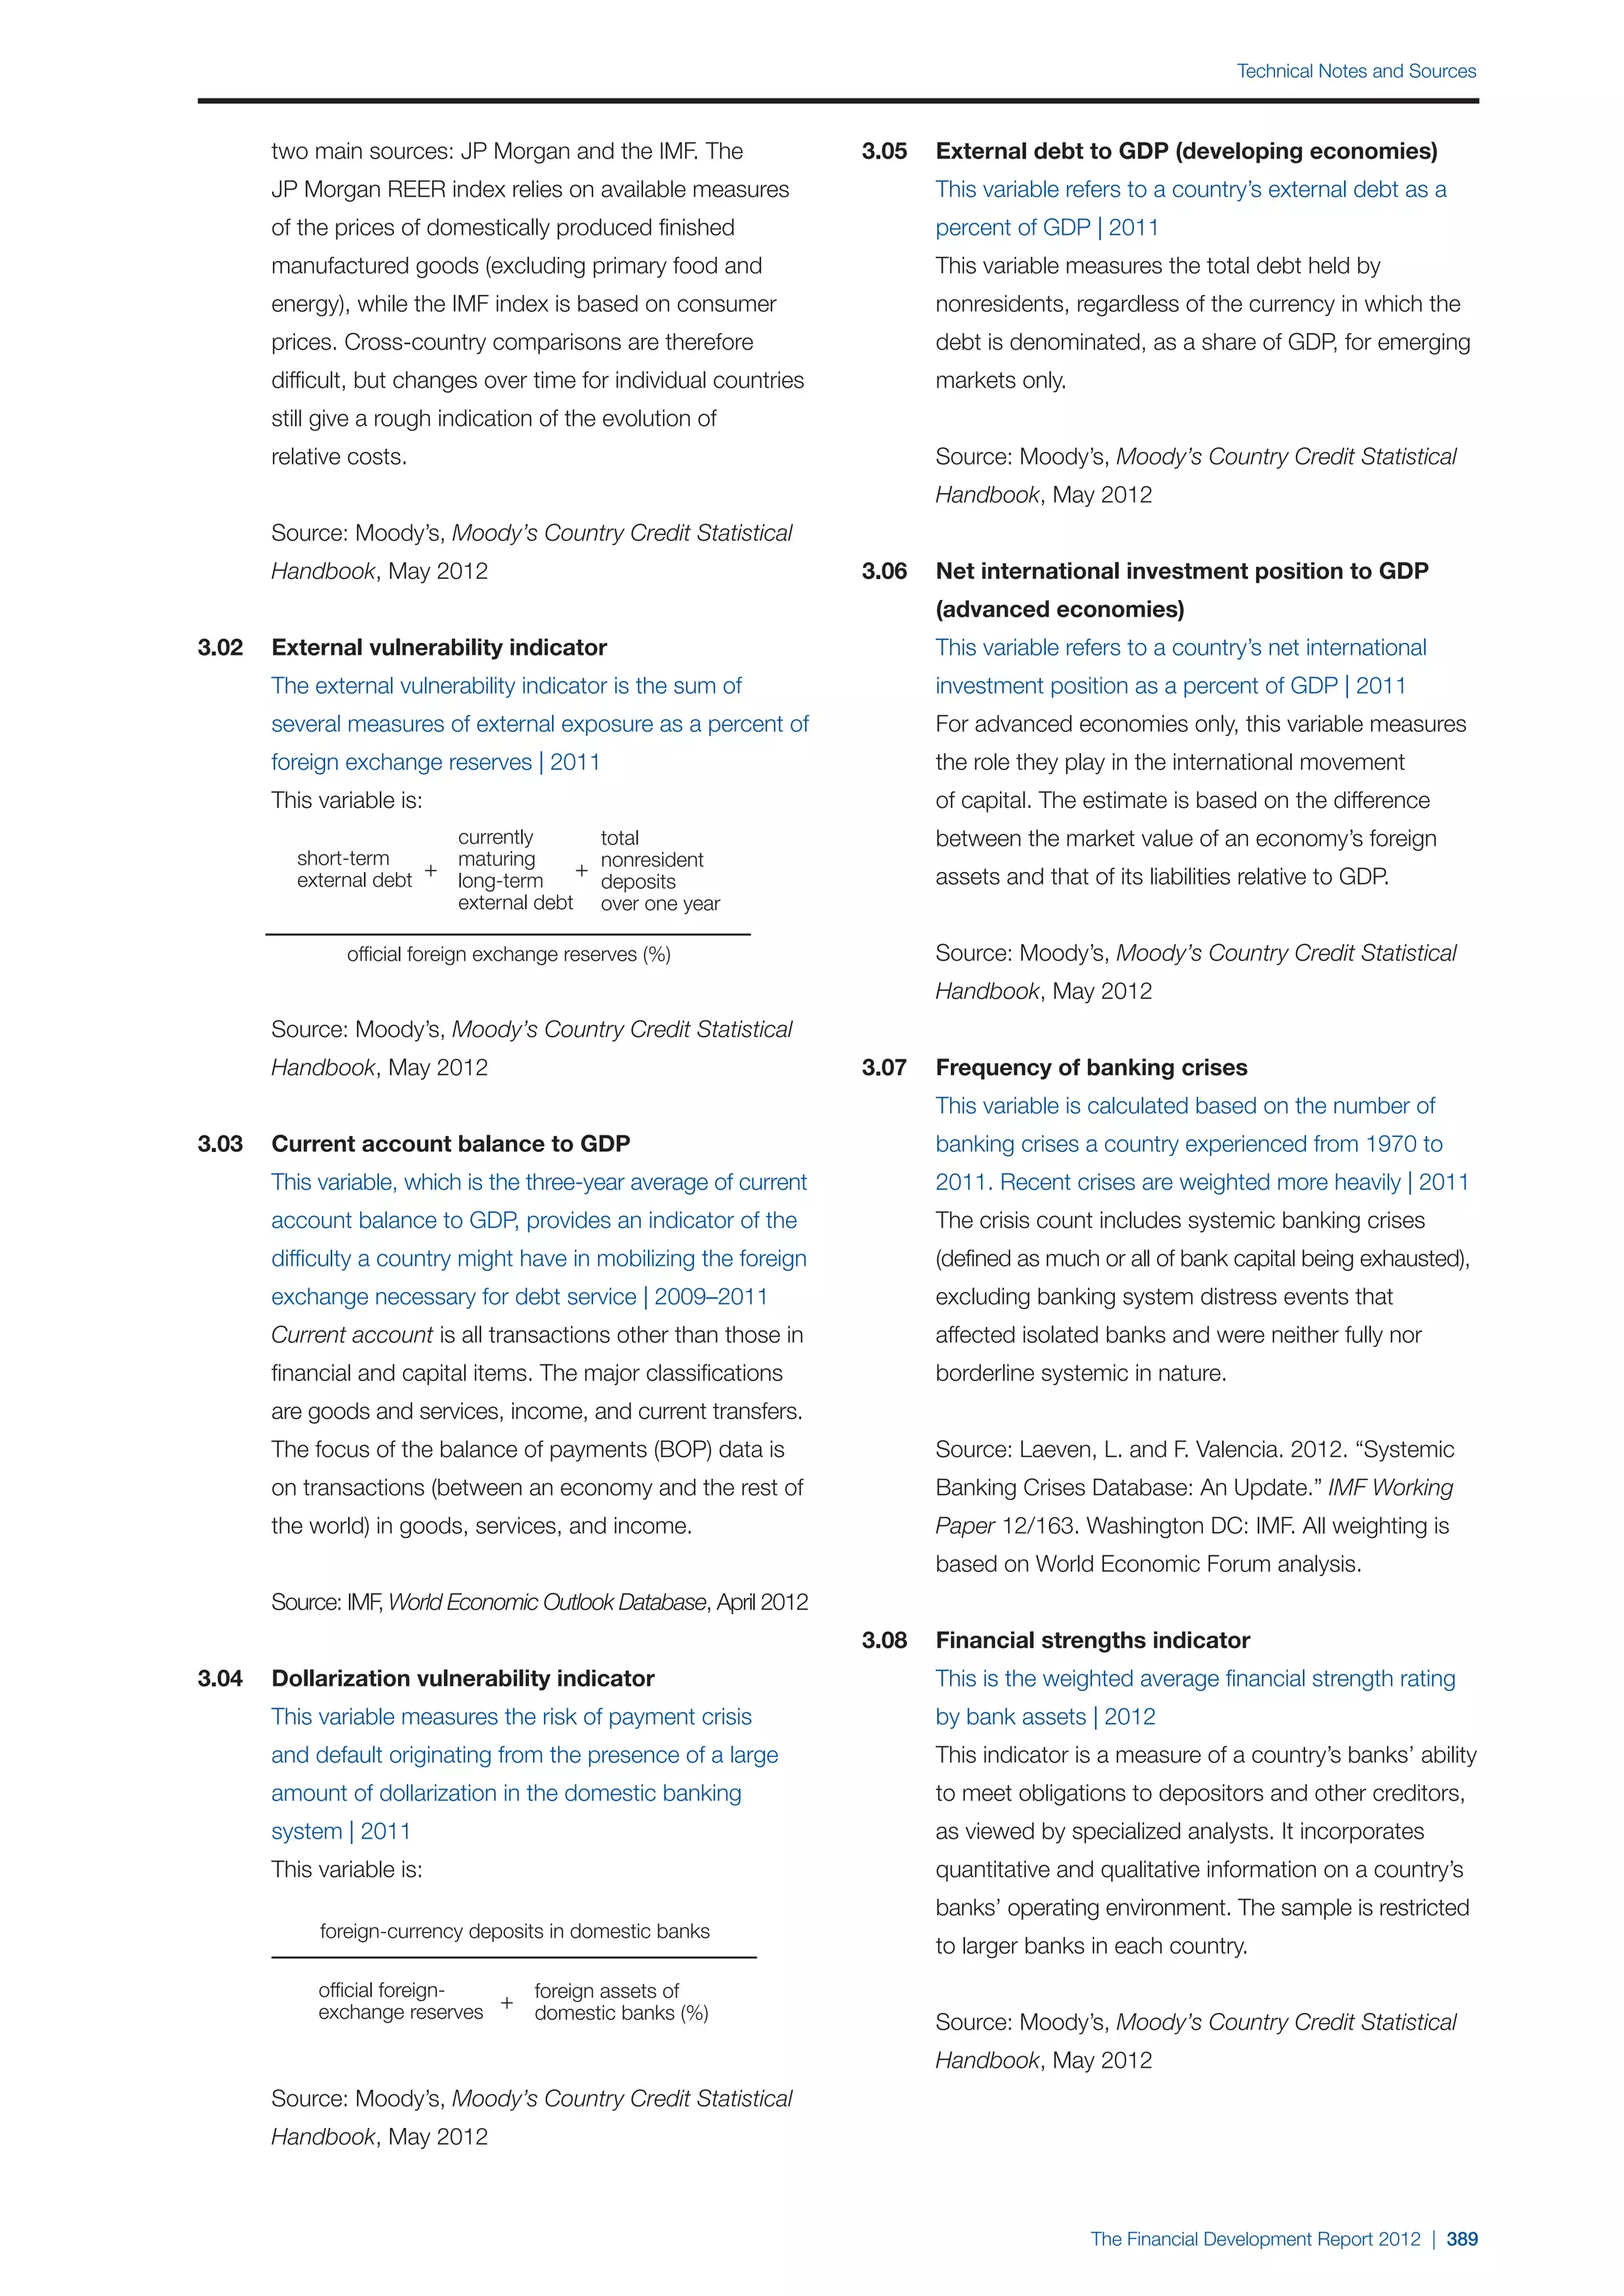
The United Kingdom has responded to the dangers to its boundaries of the banking system.
banking system revealed by the recent crisis with a plan to
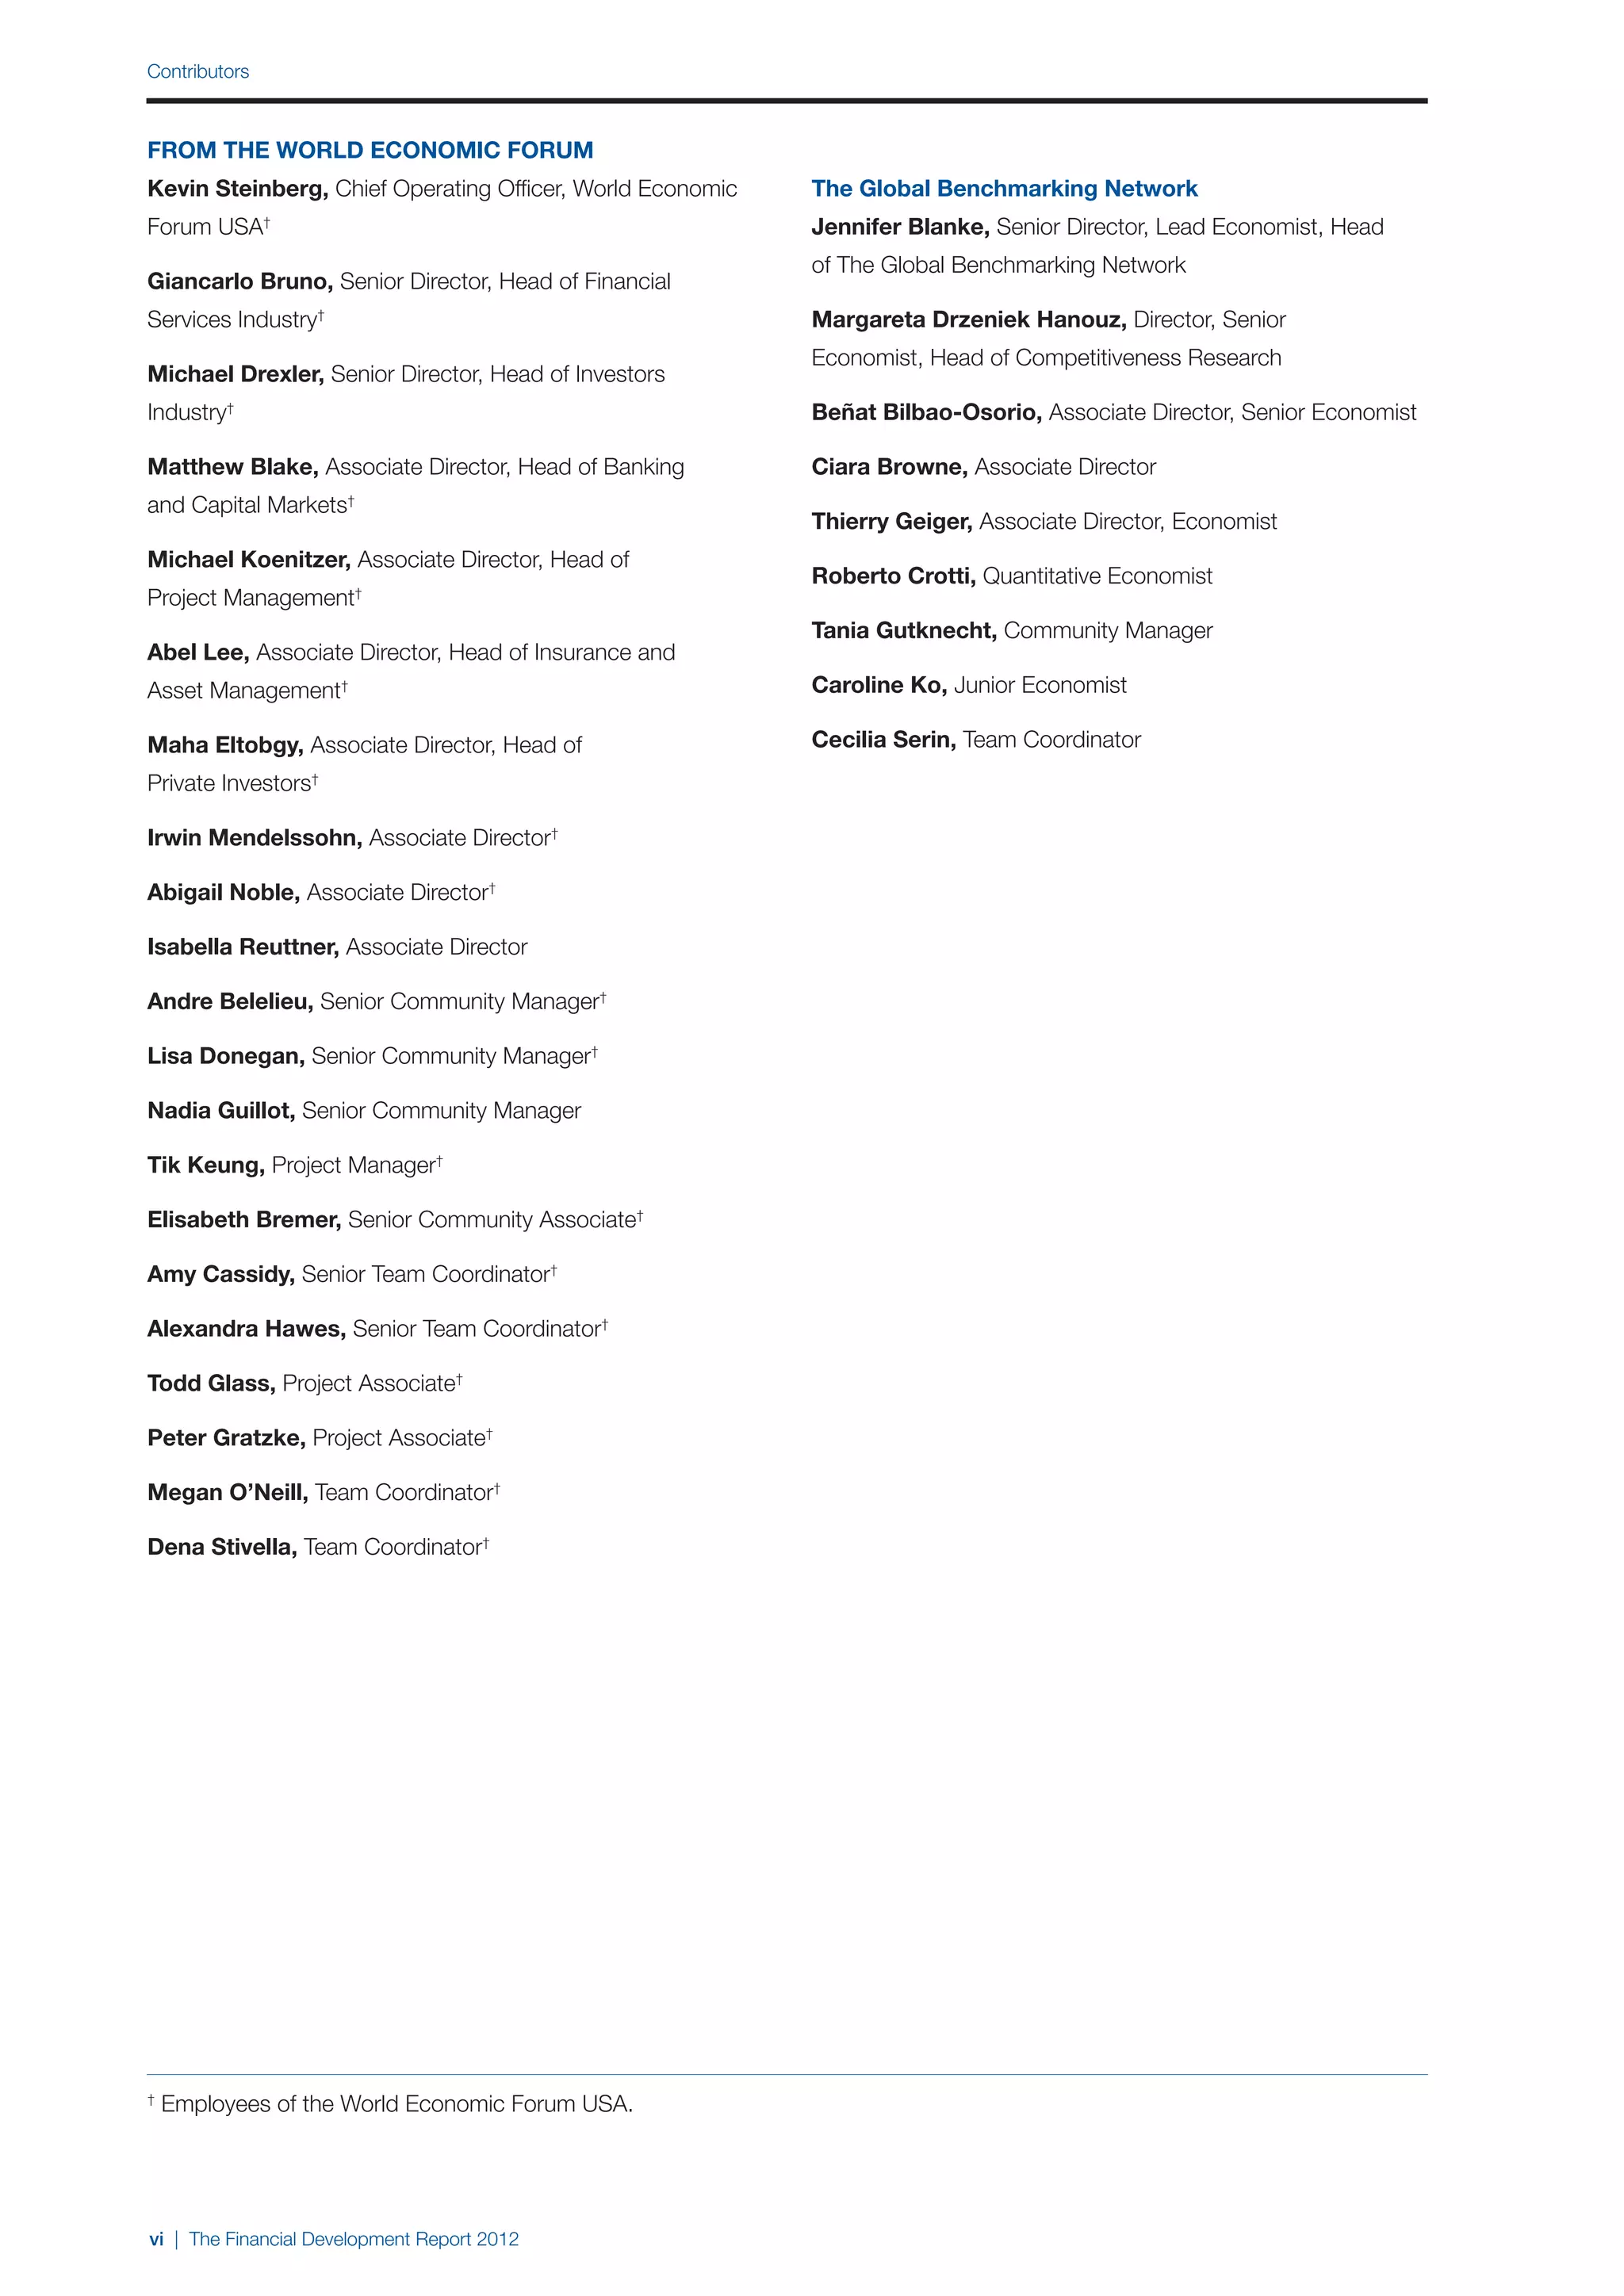
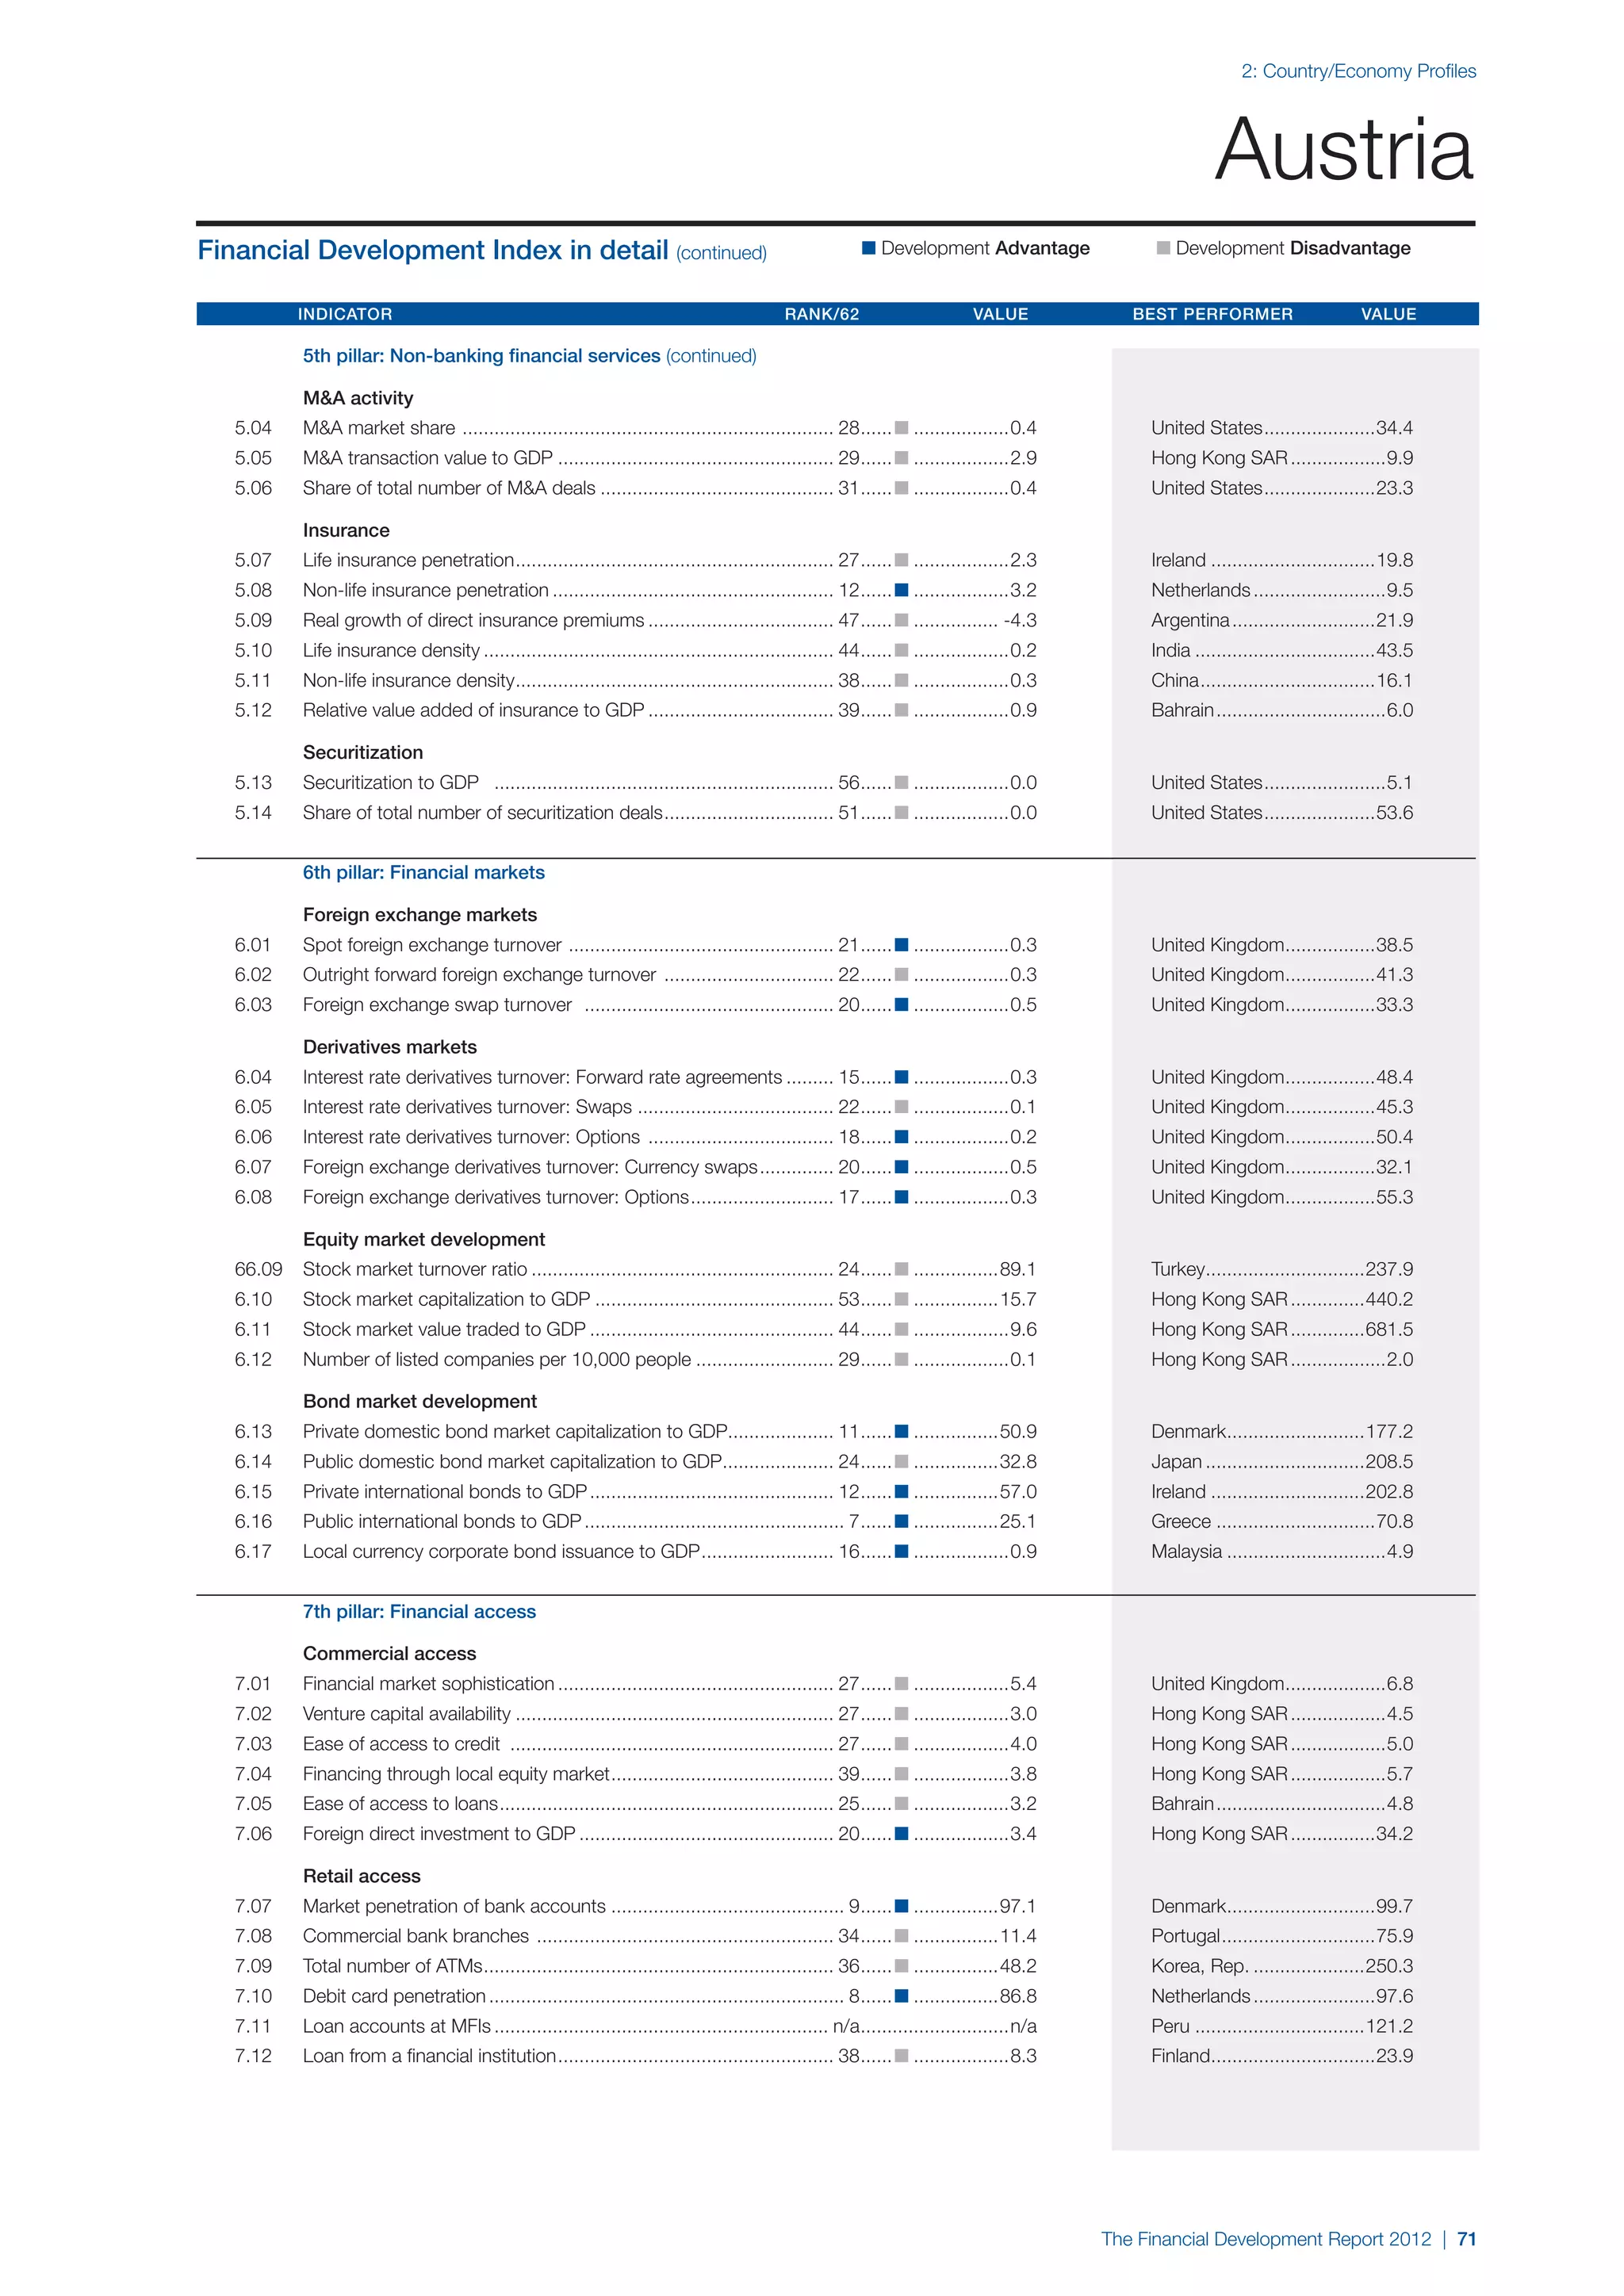
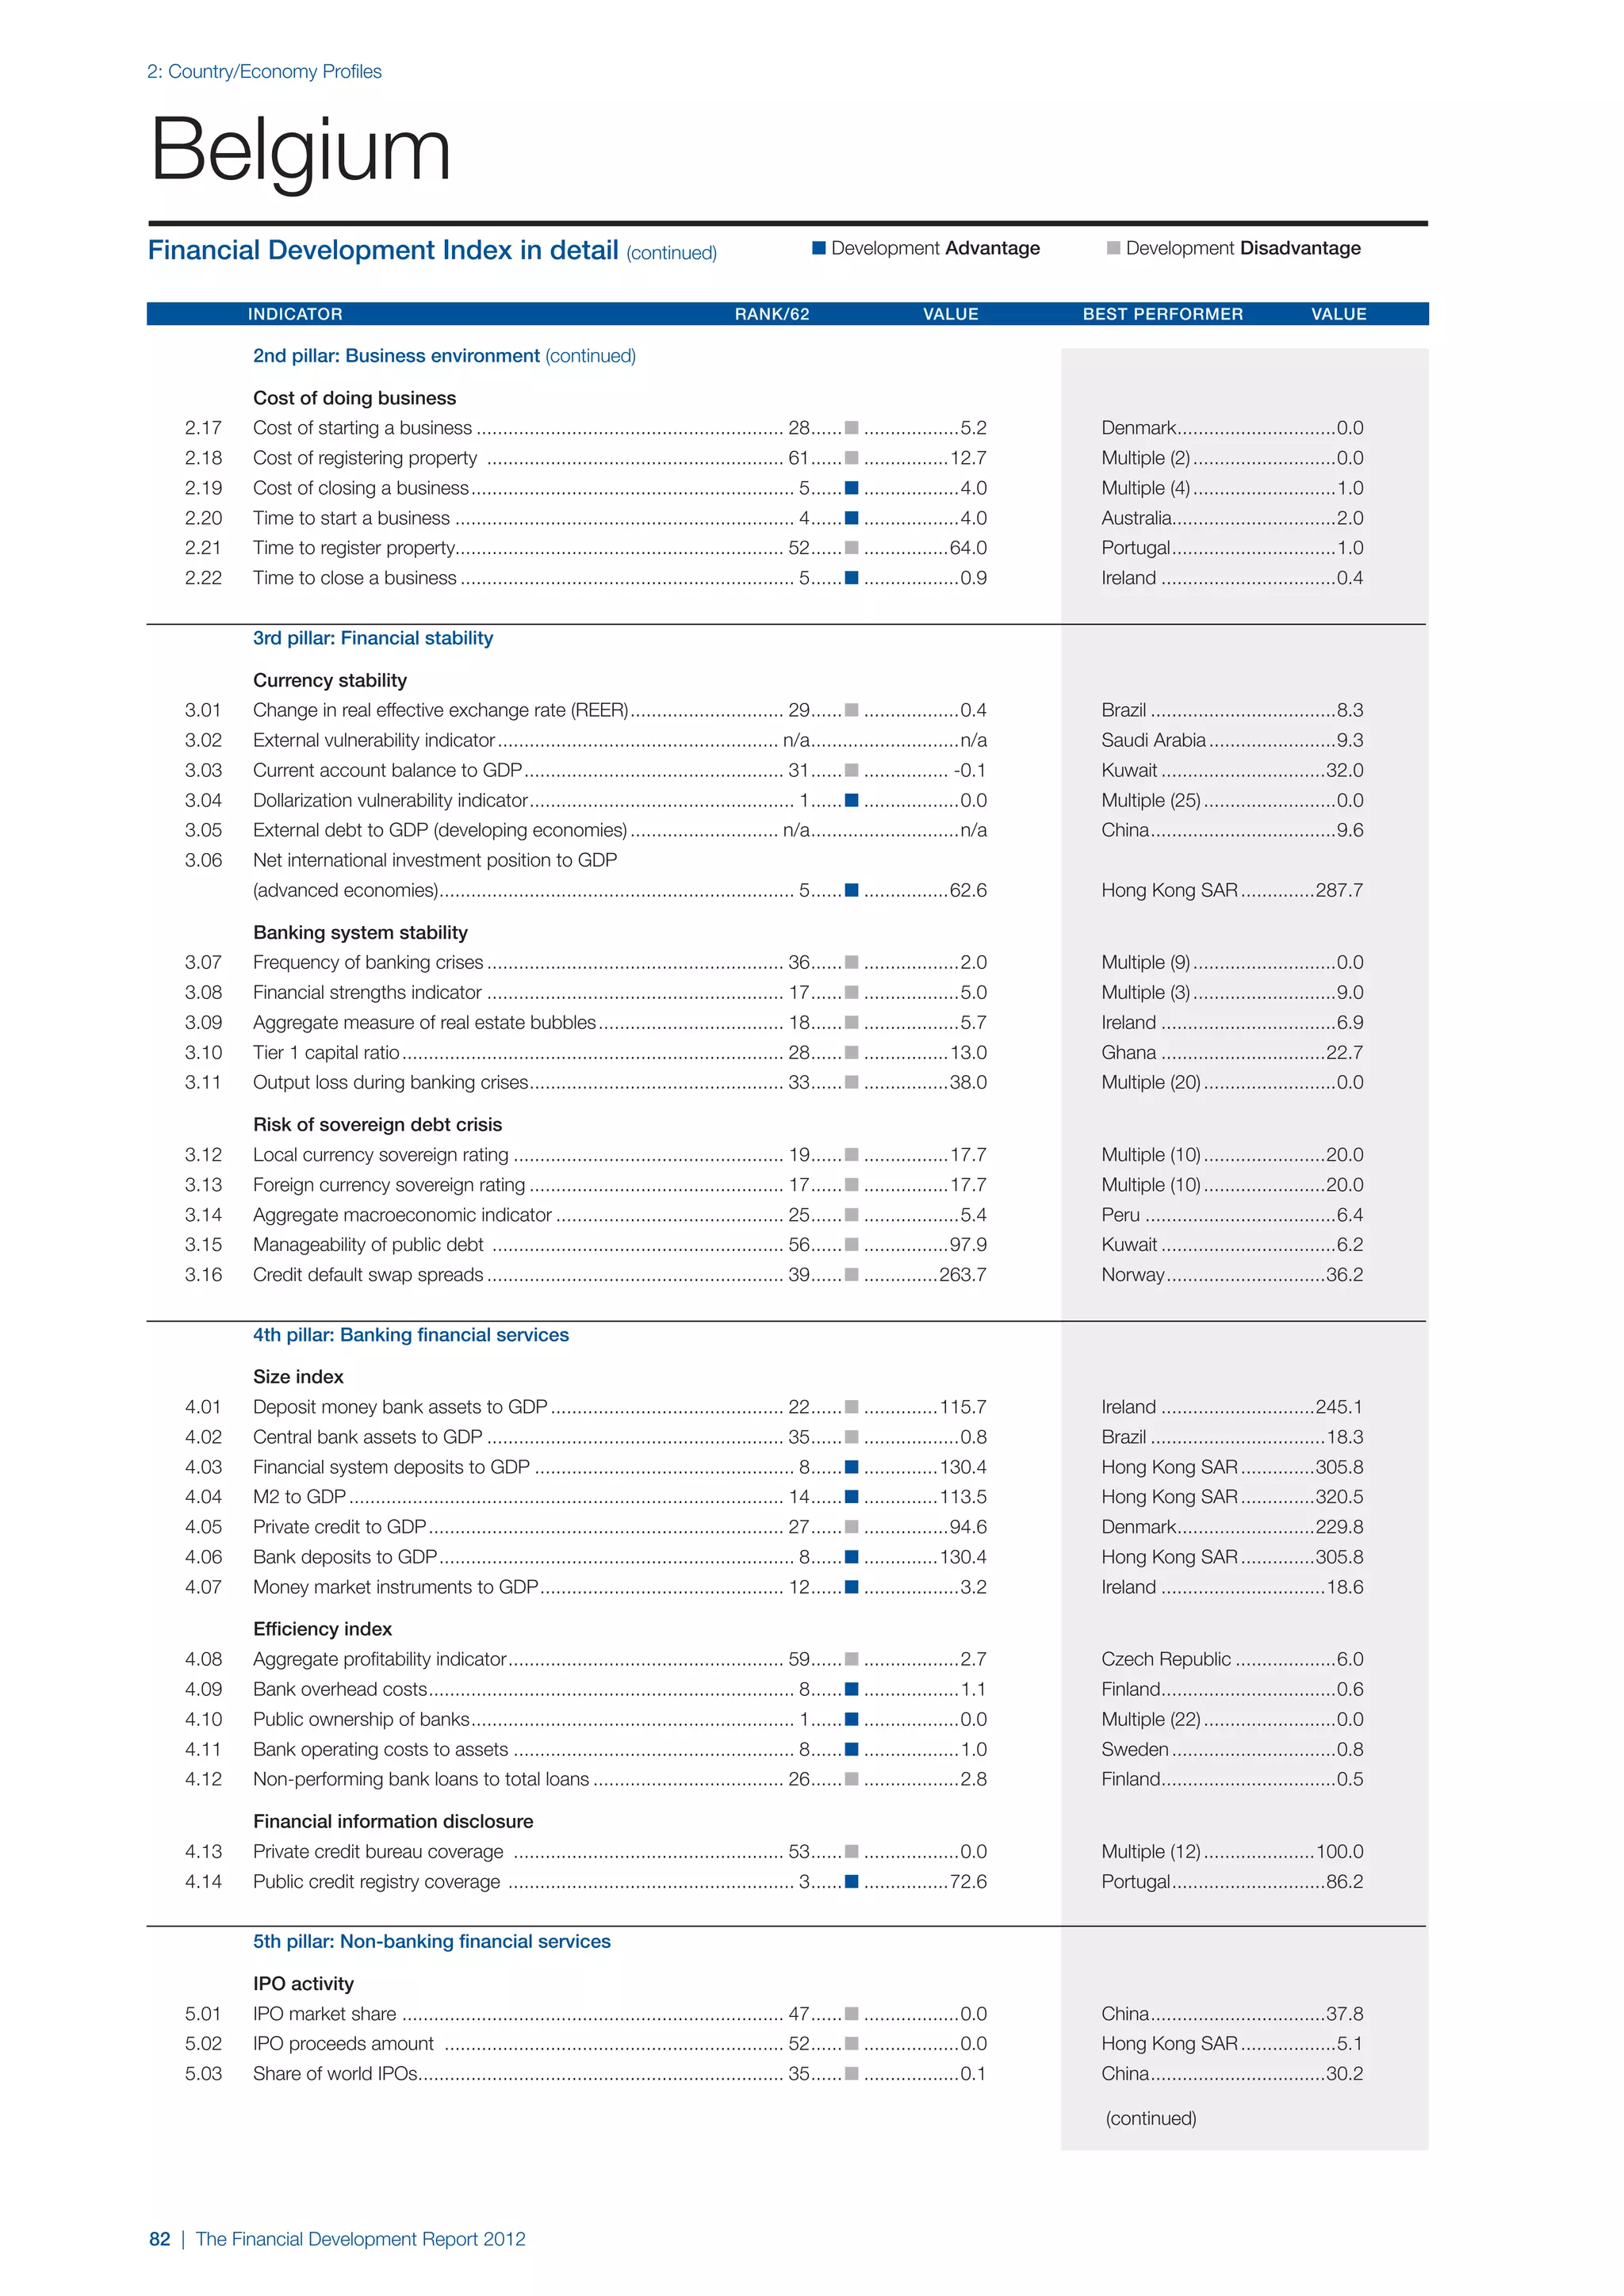
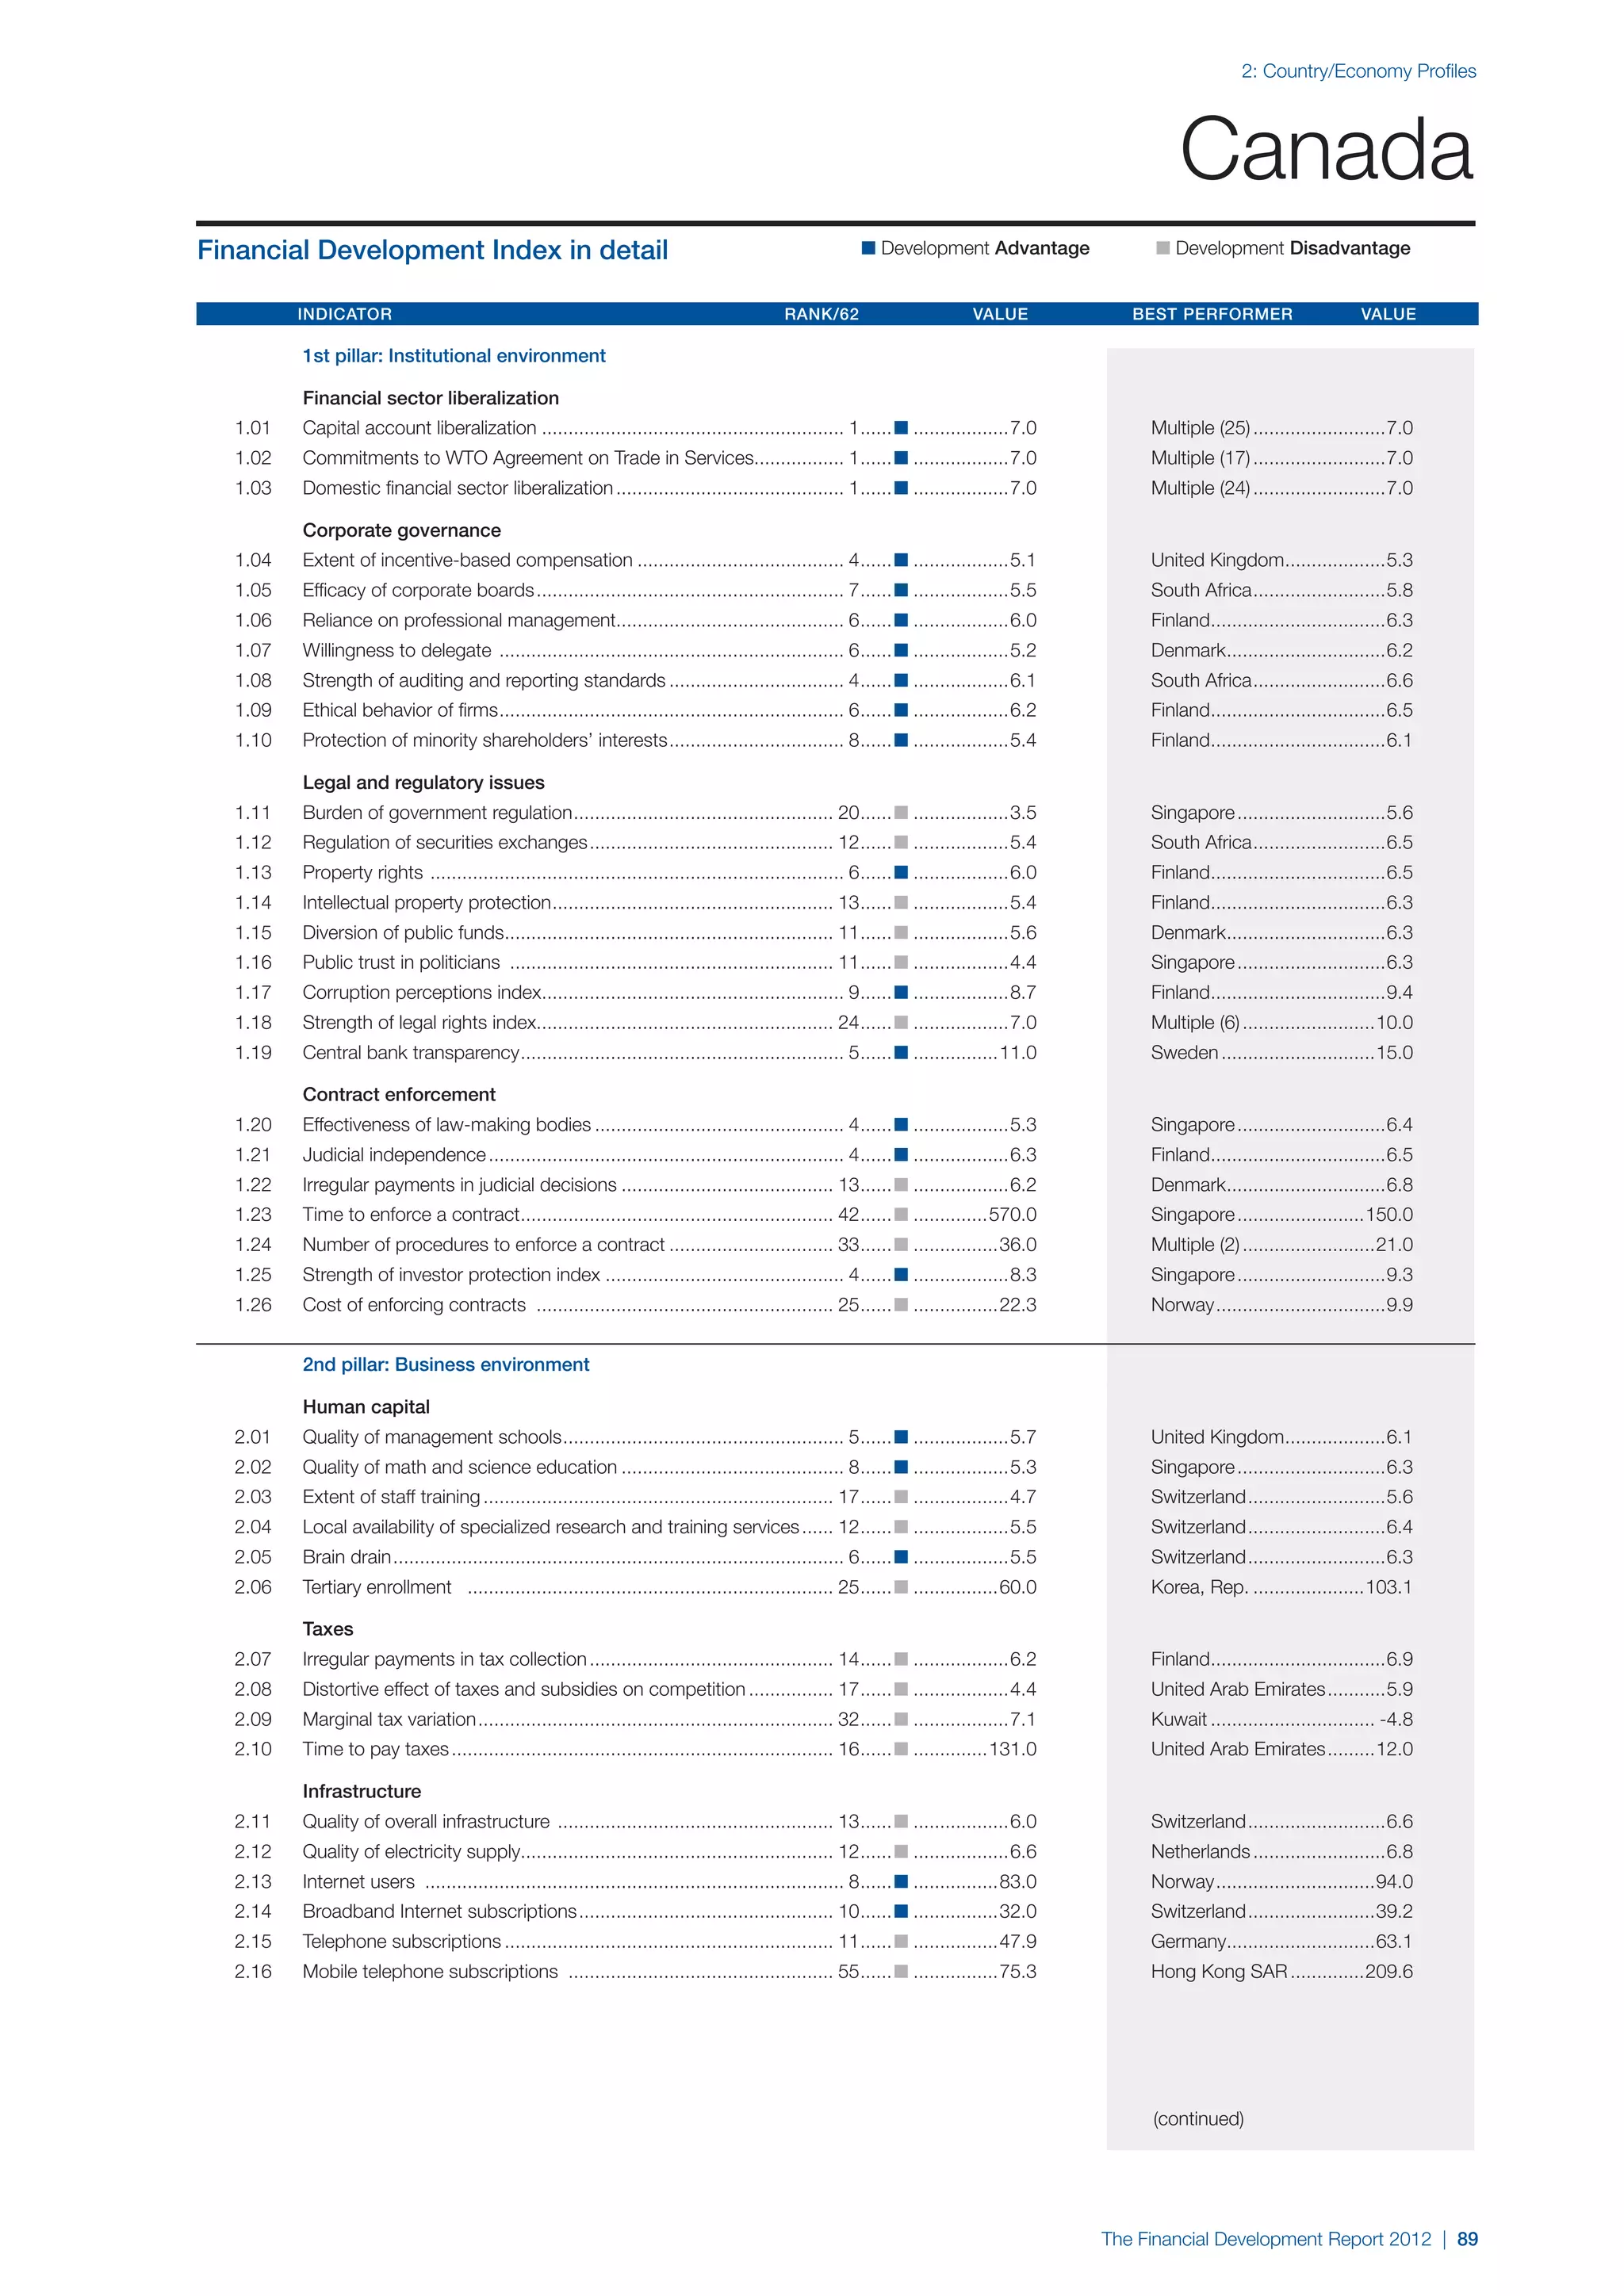
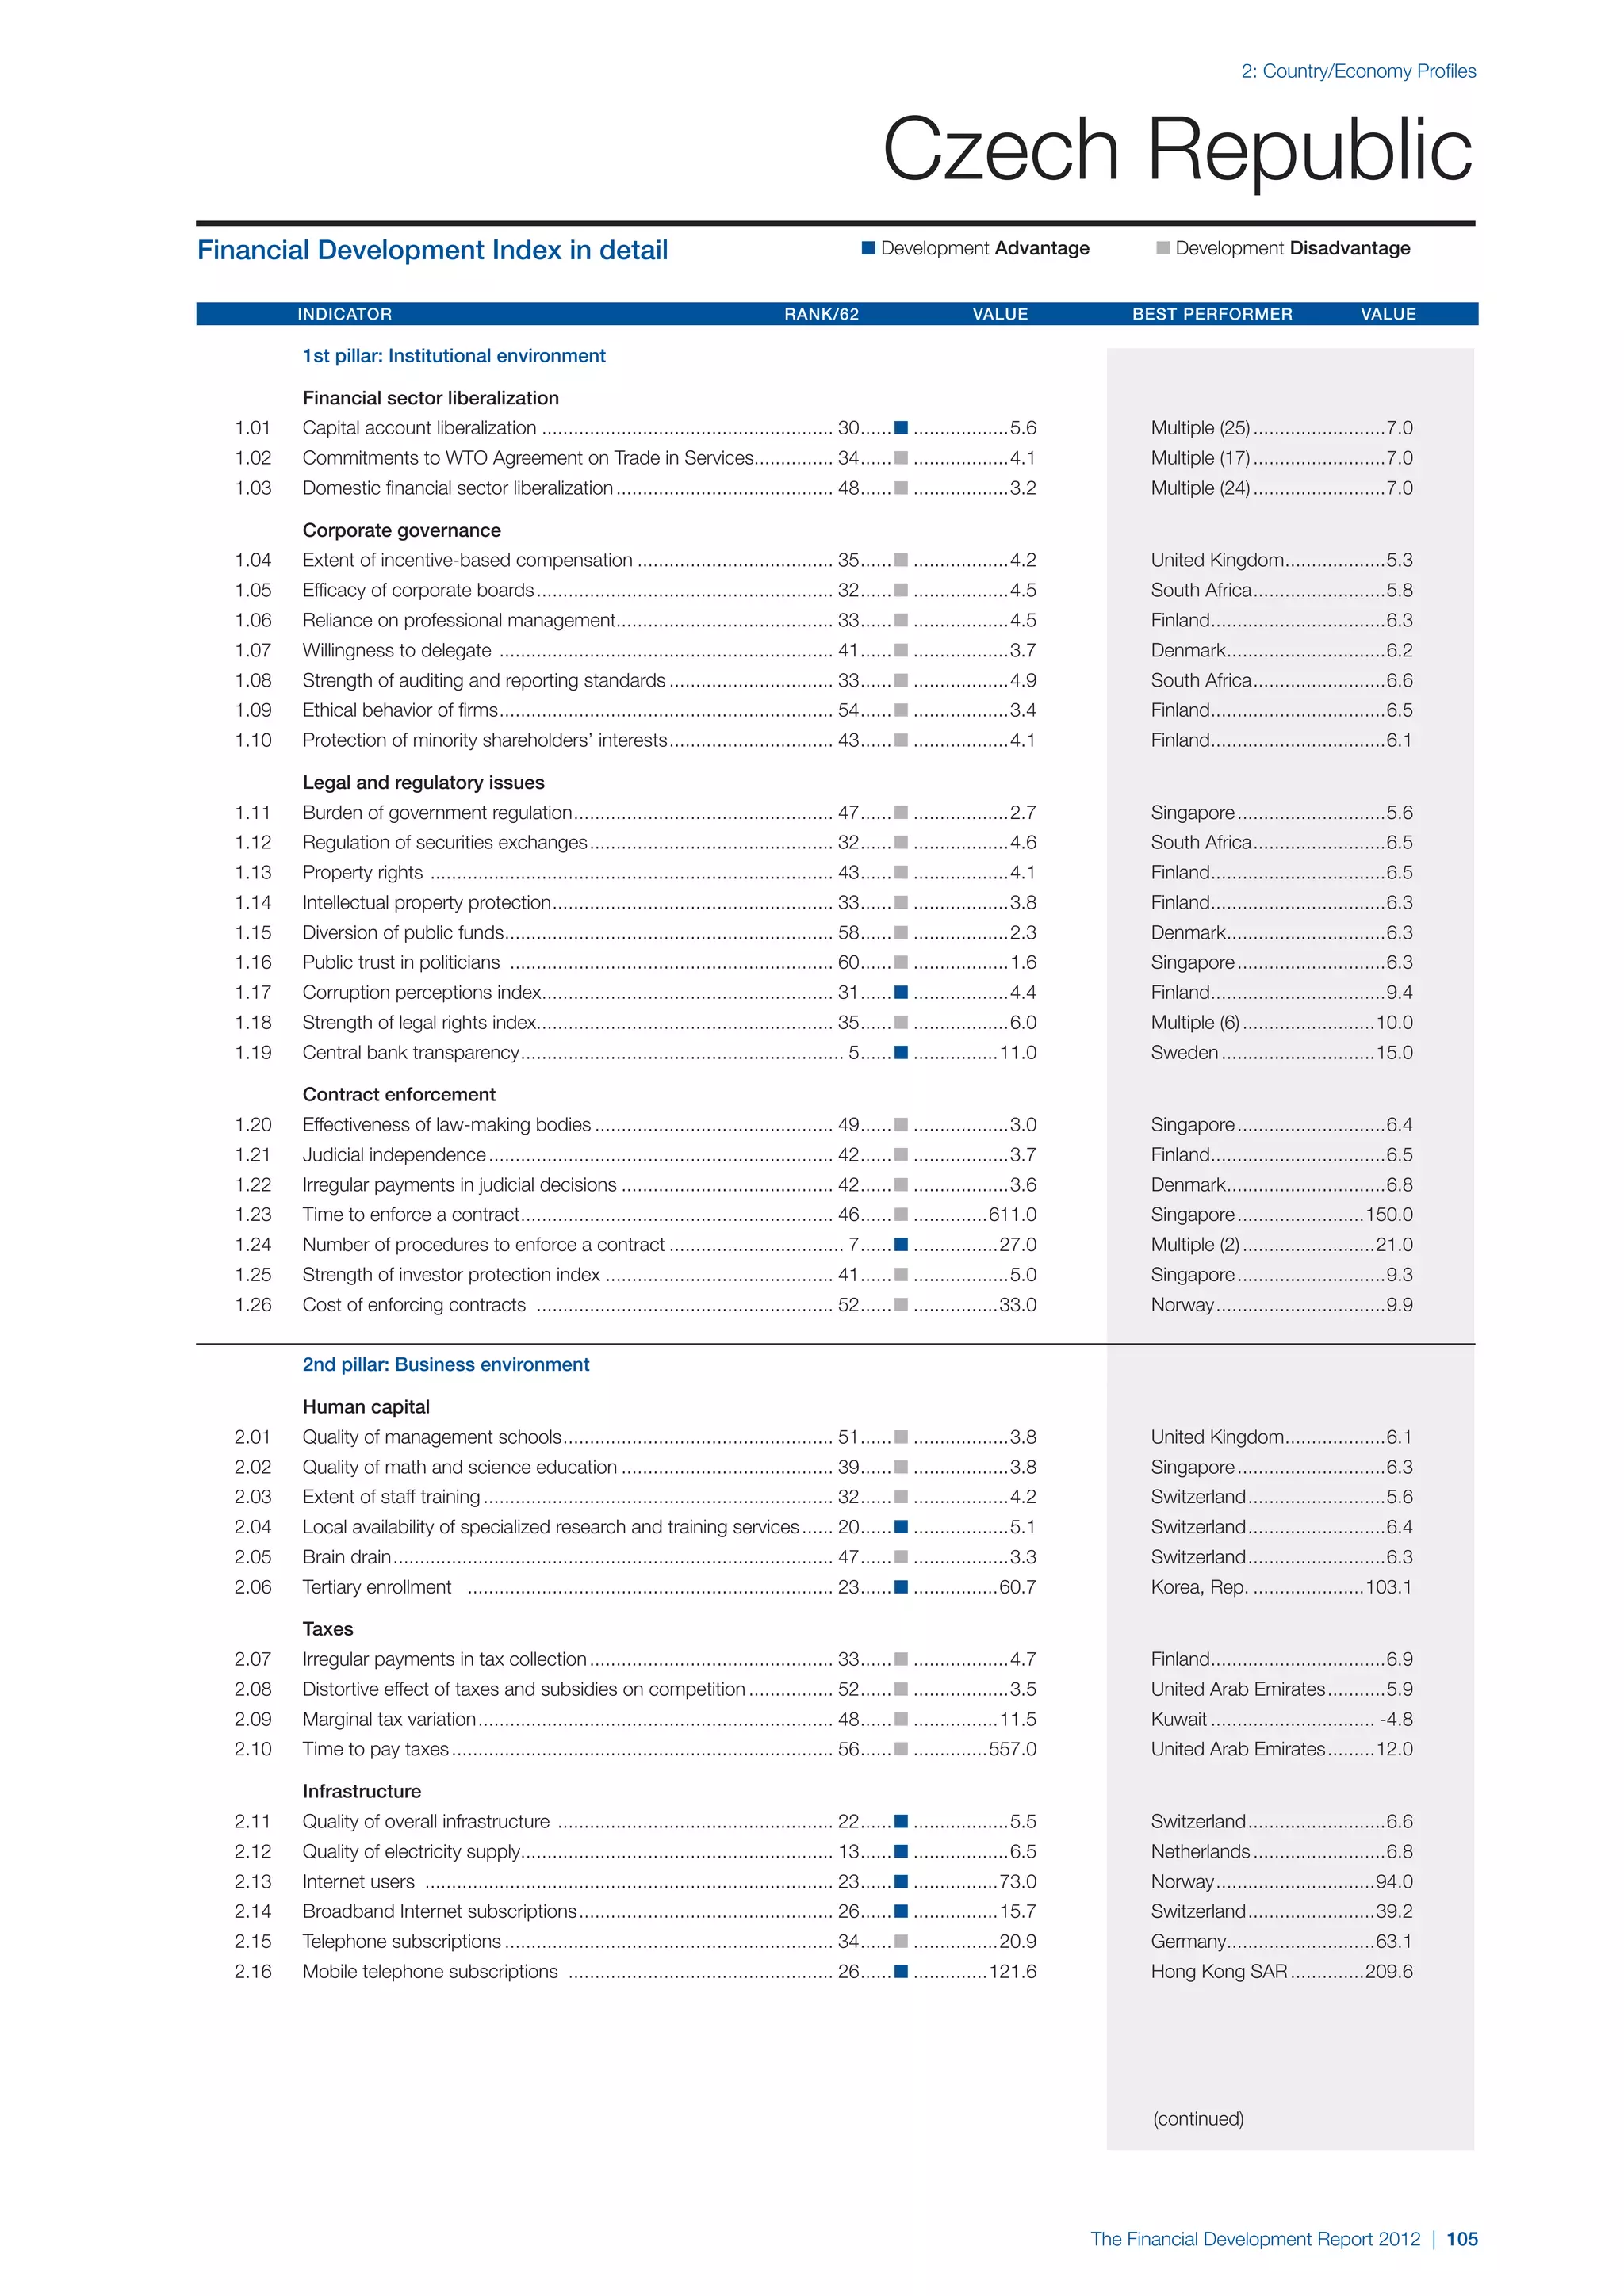
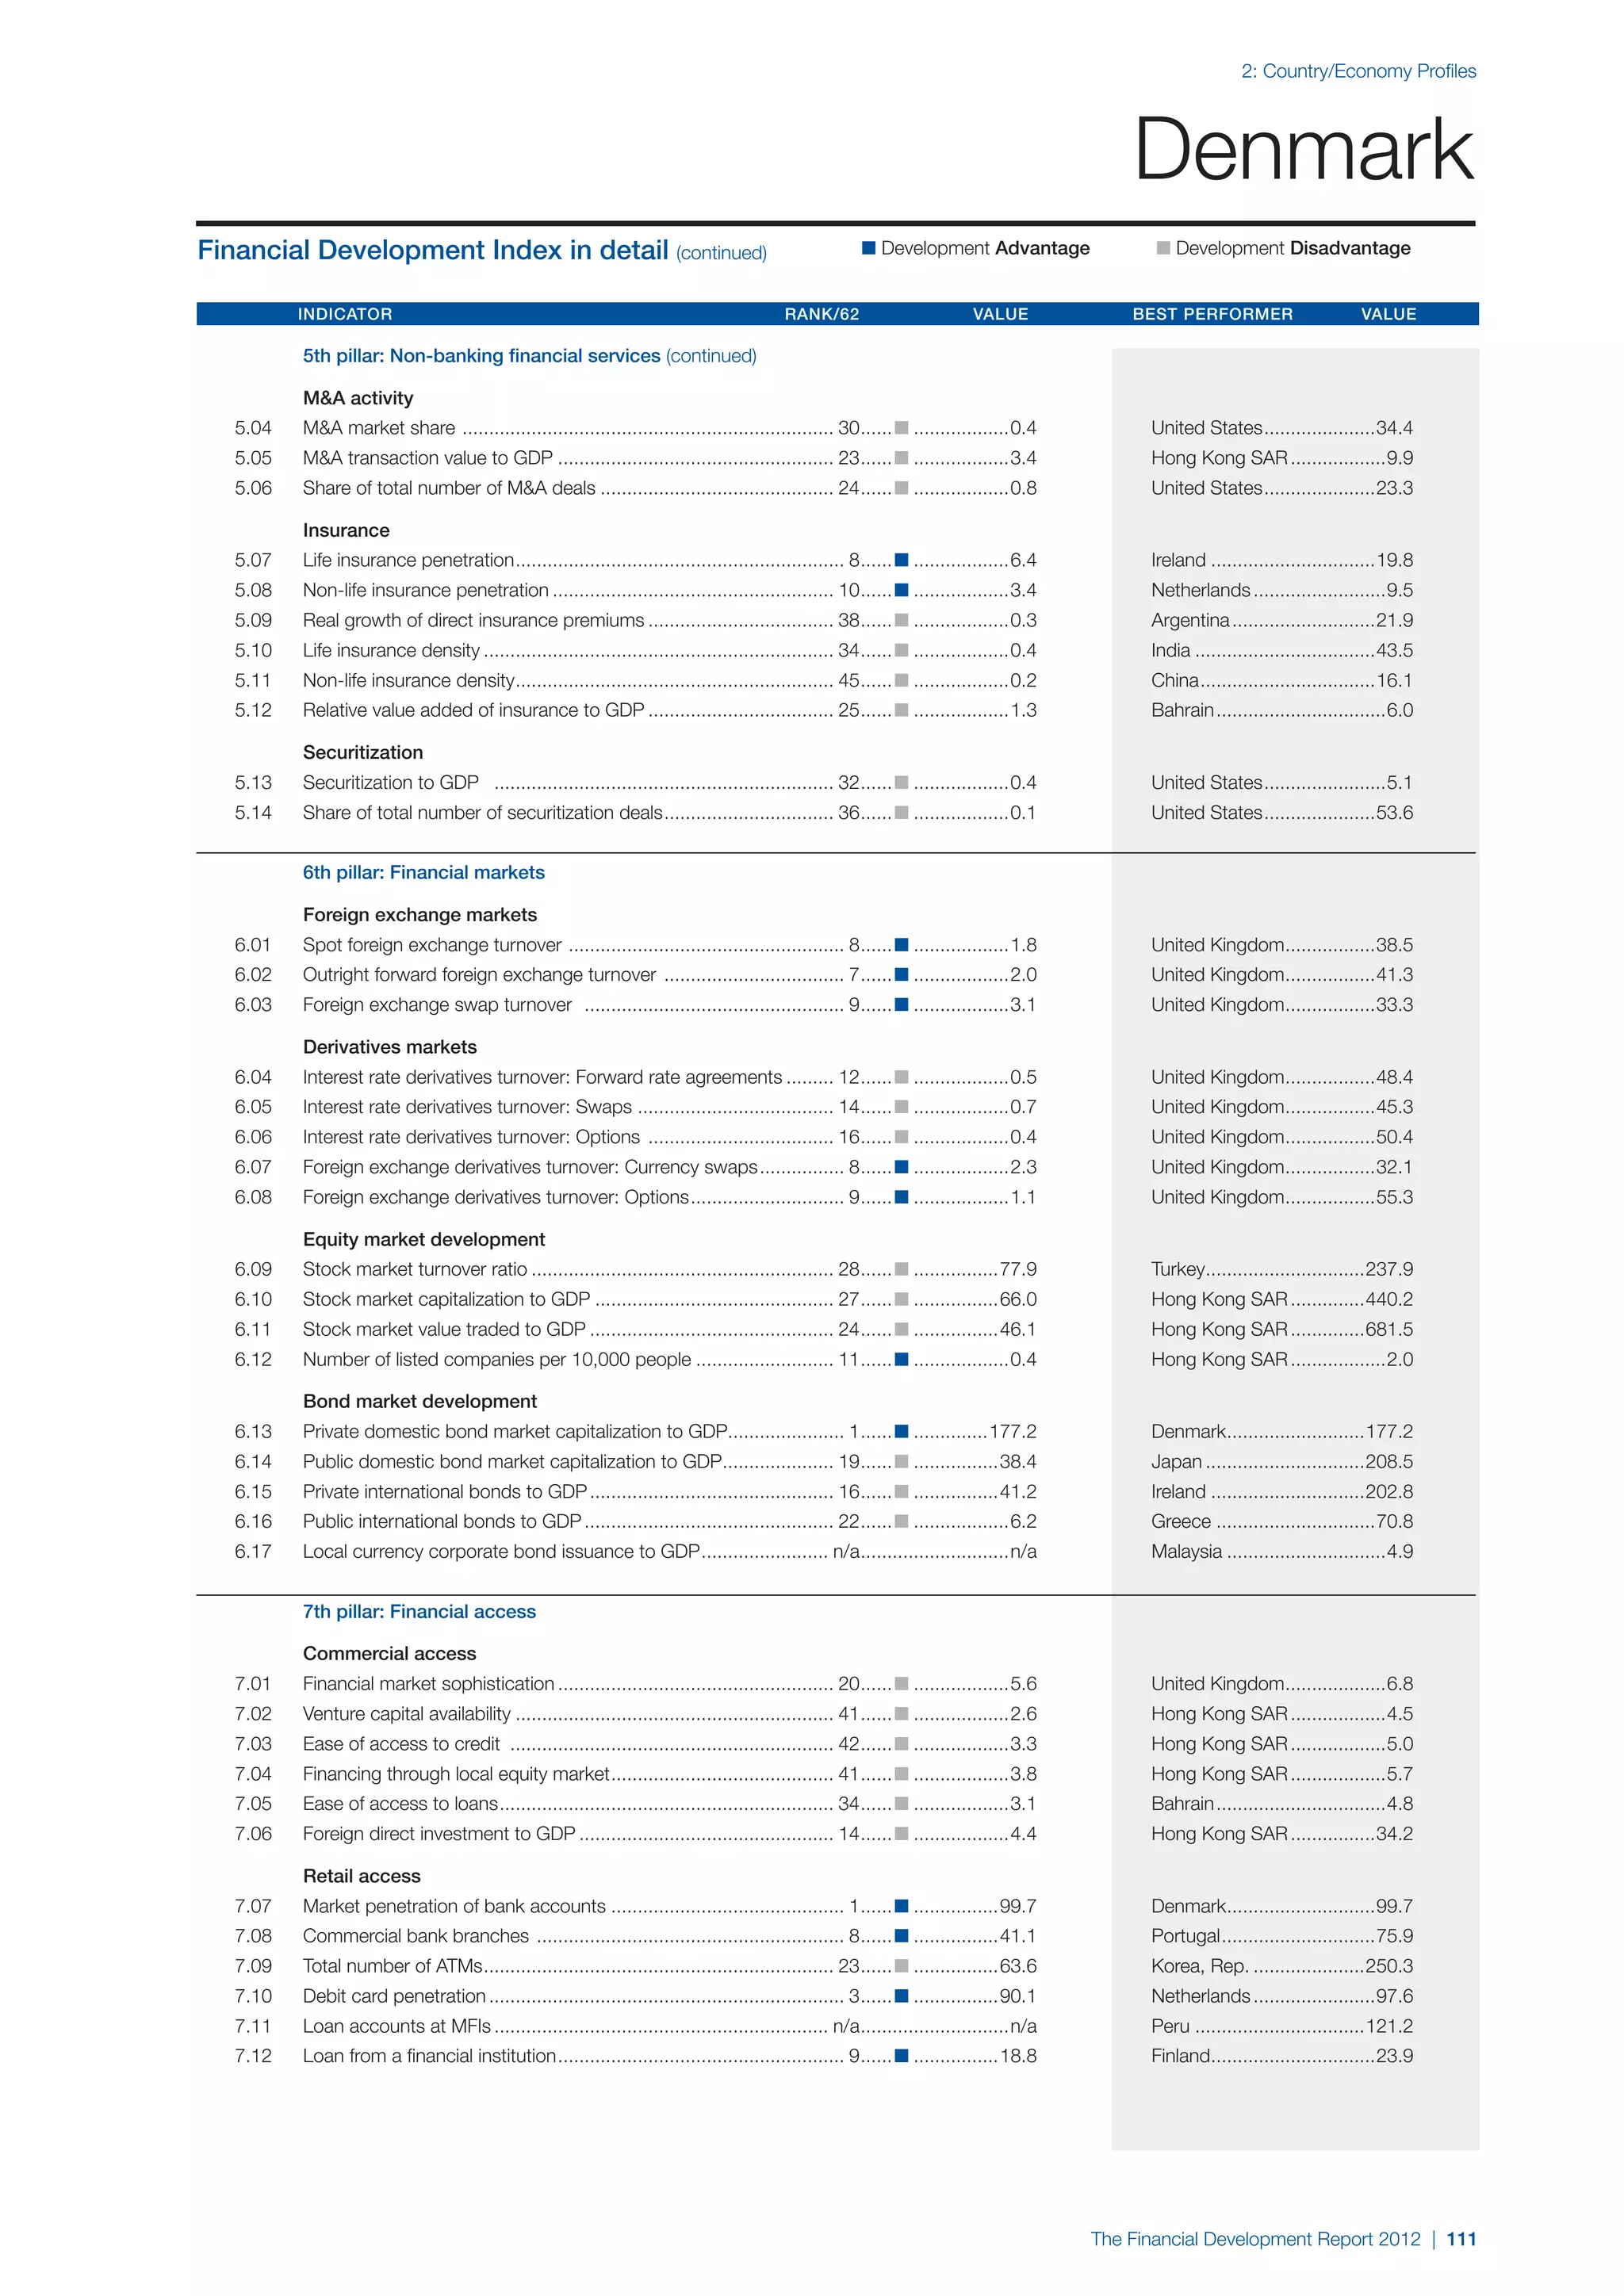
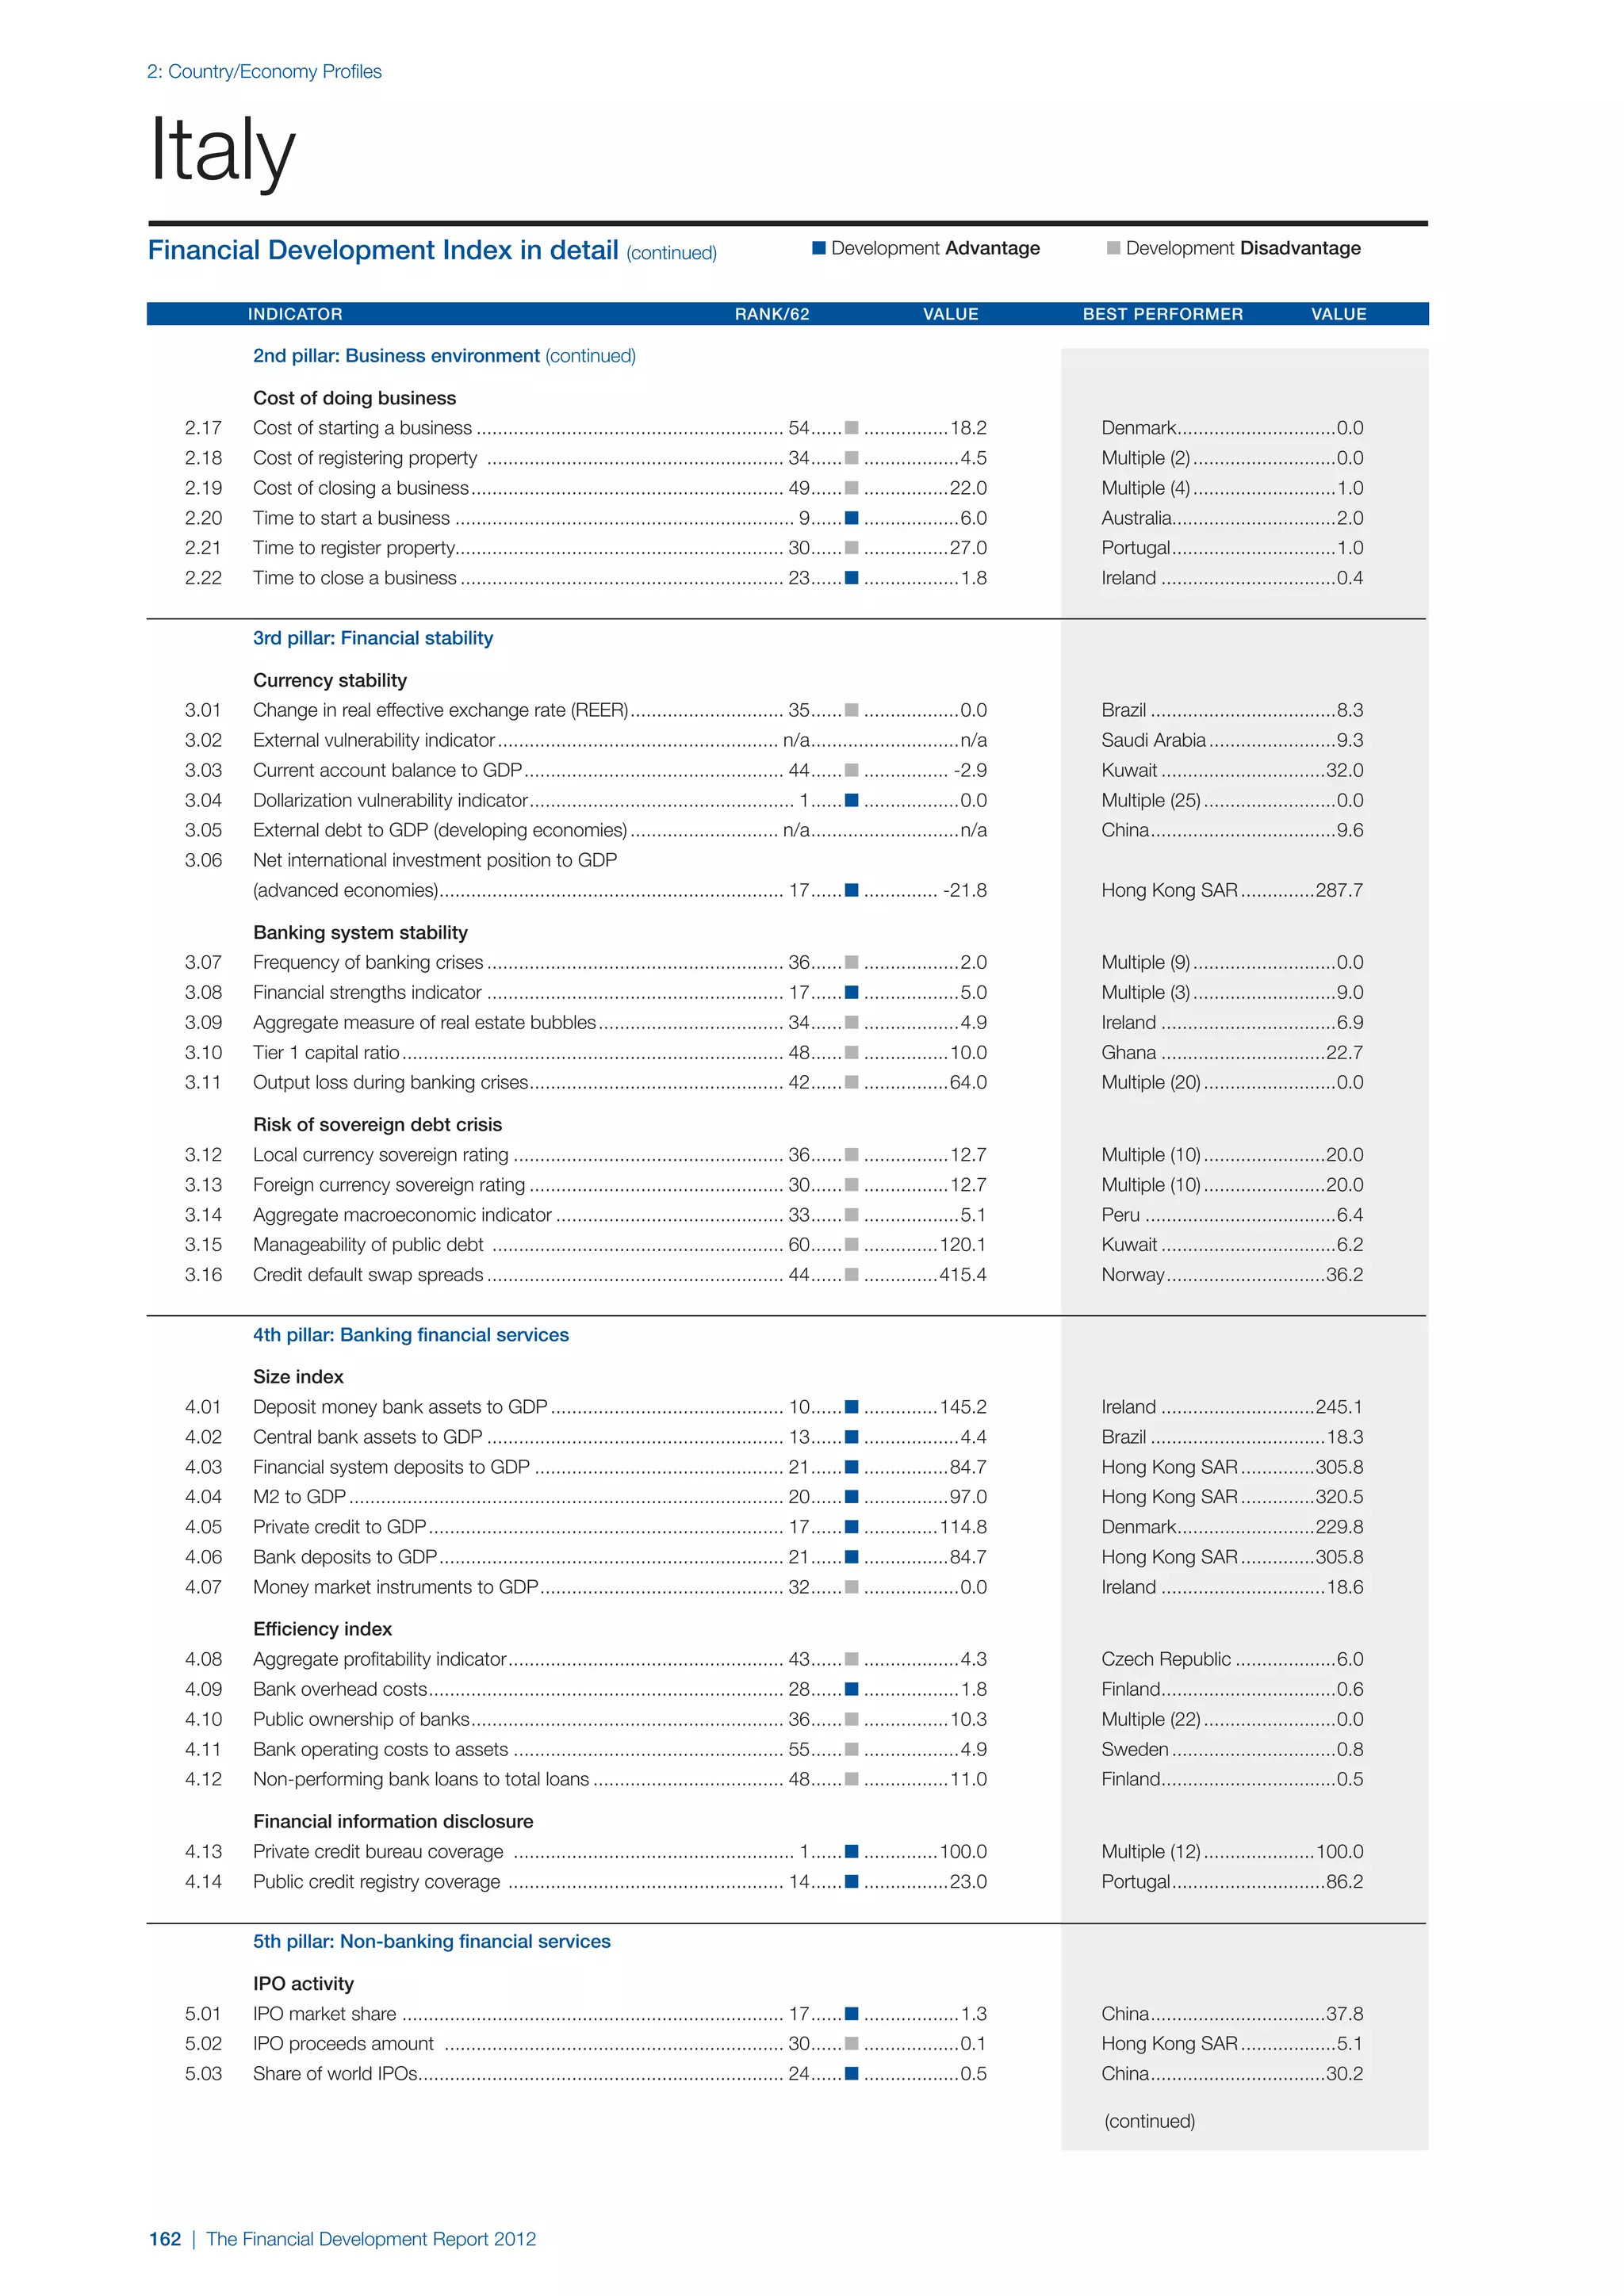
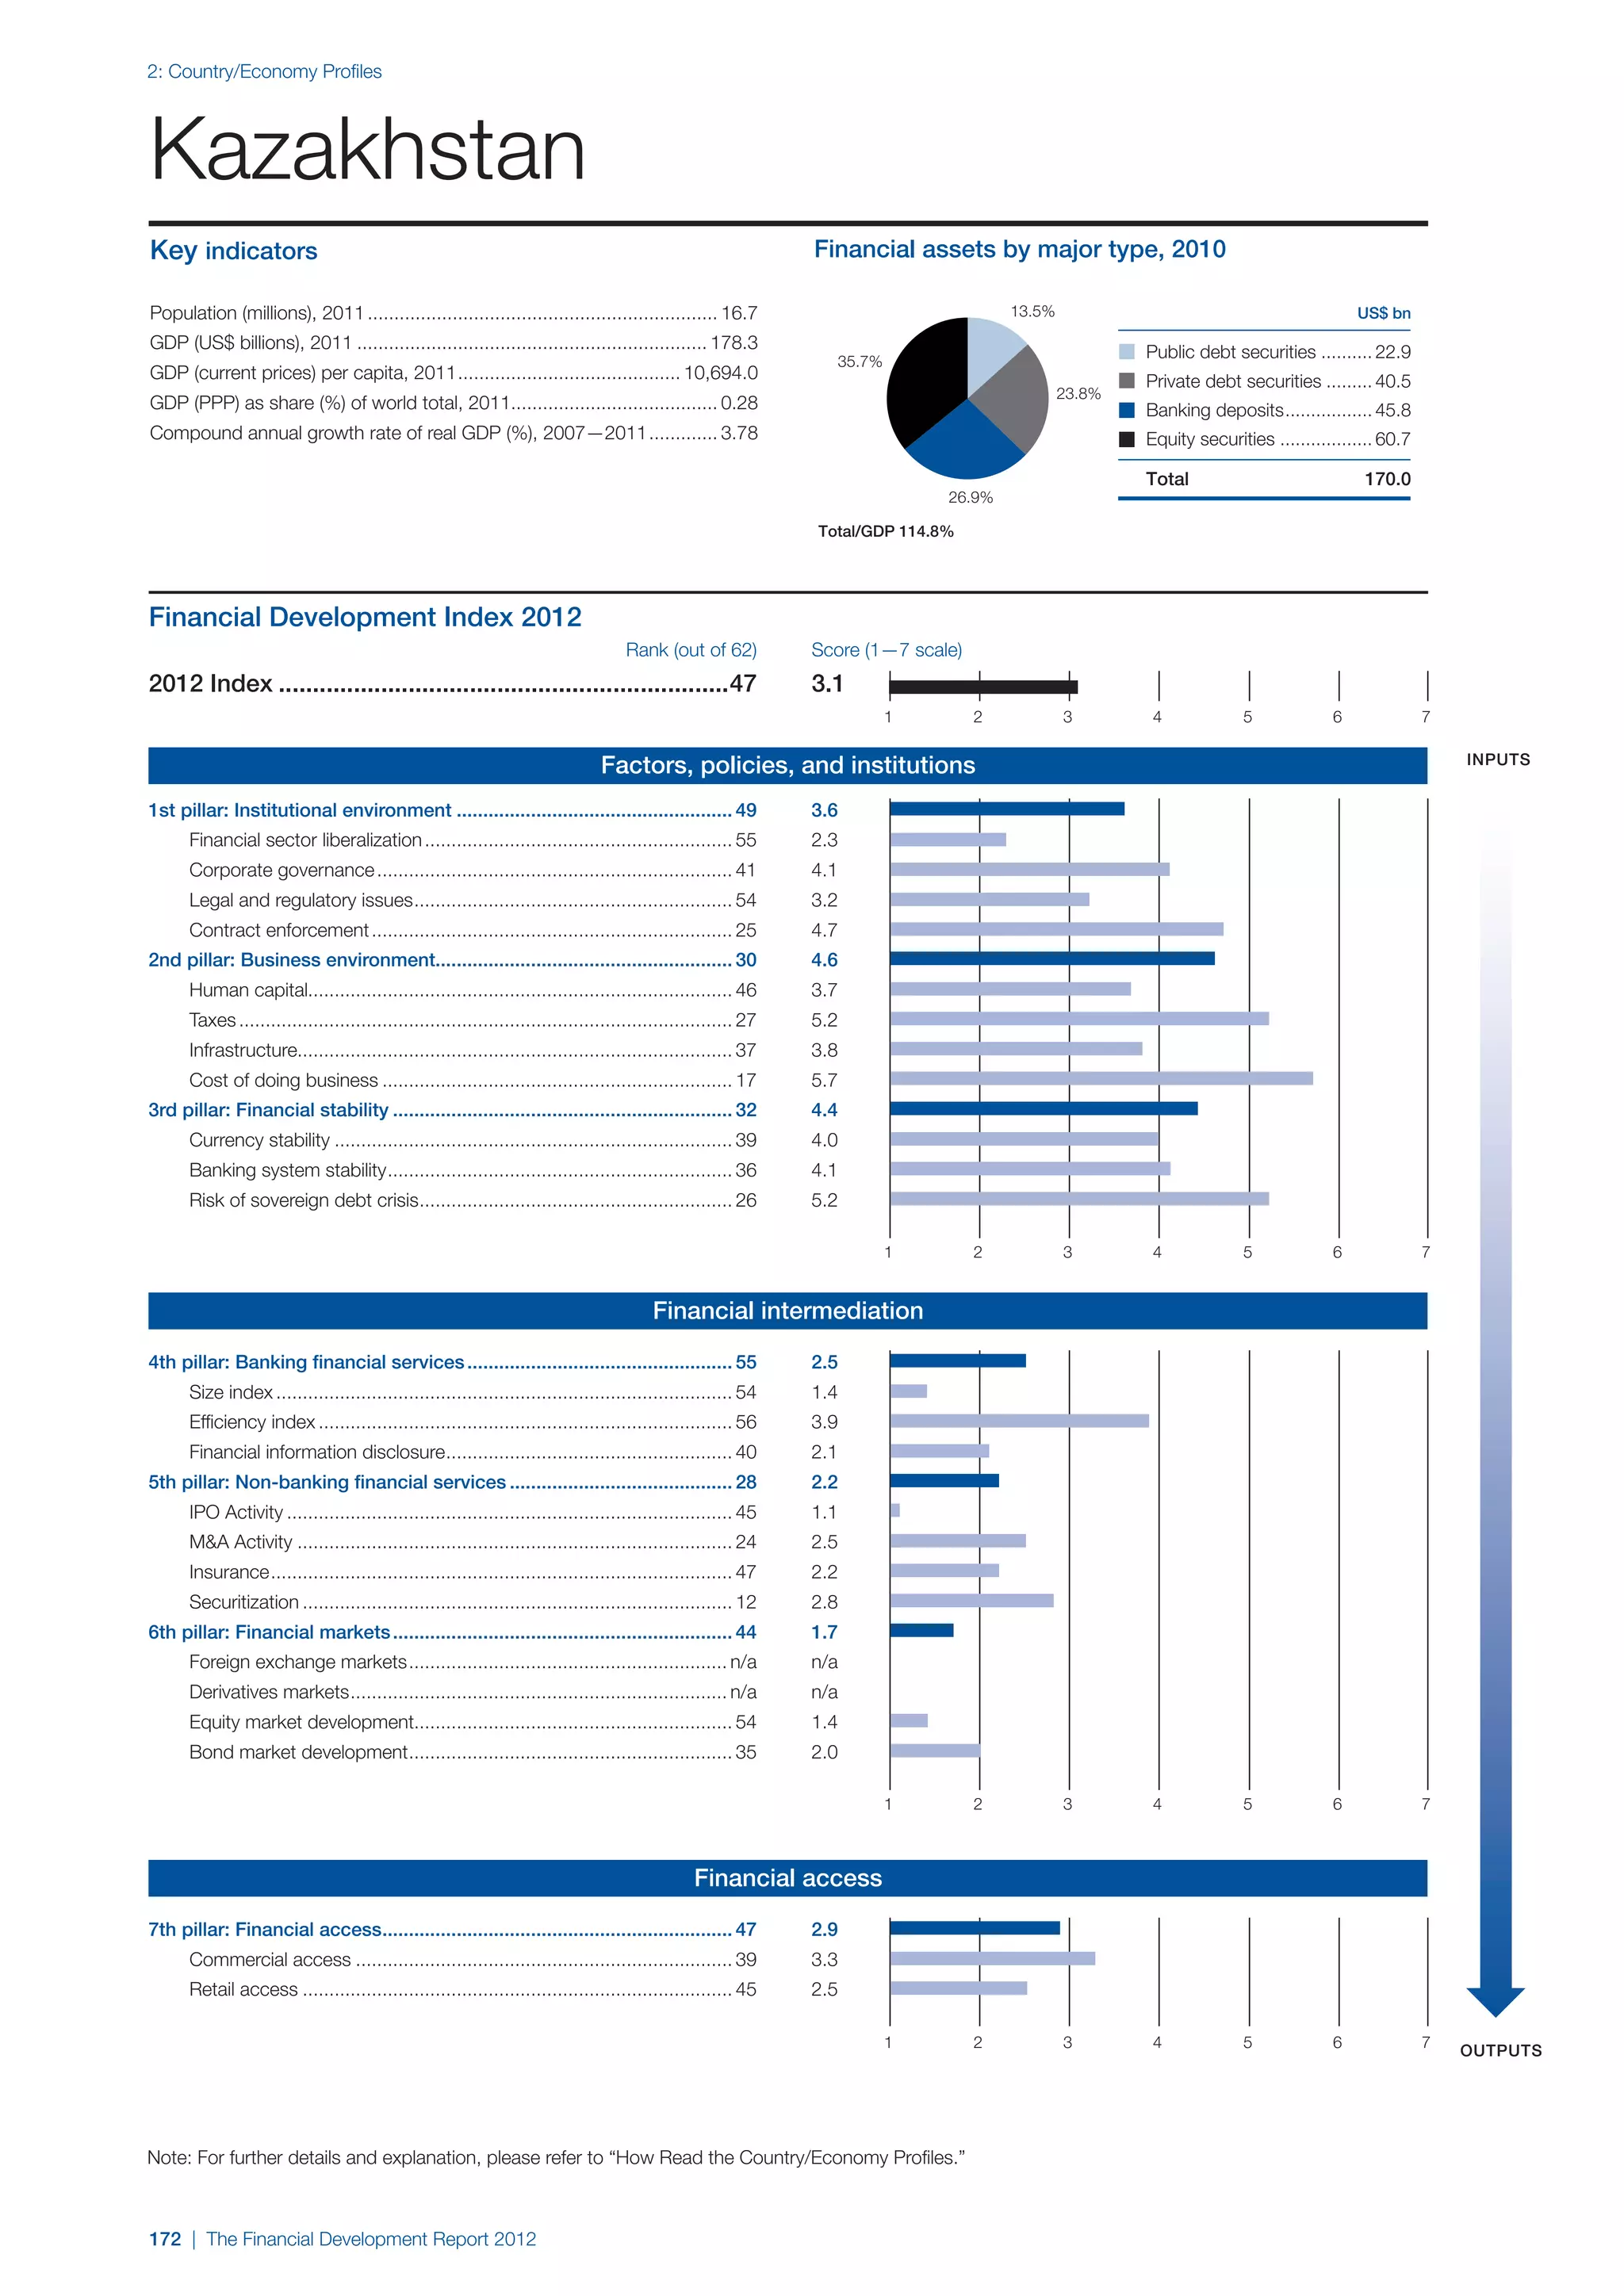
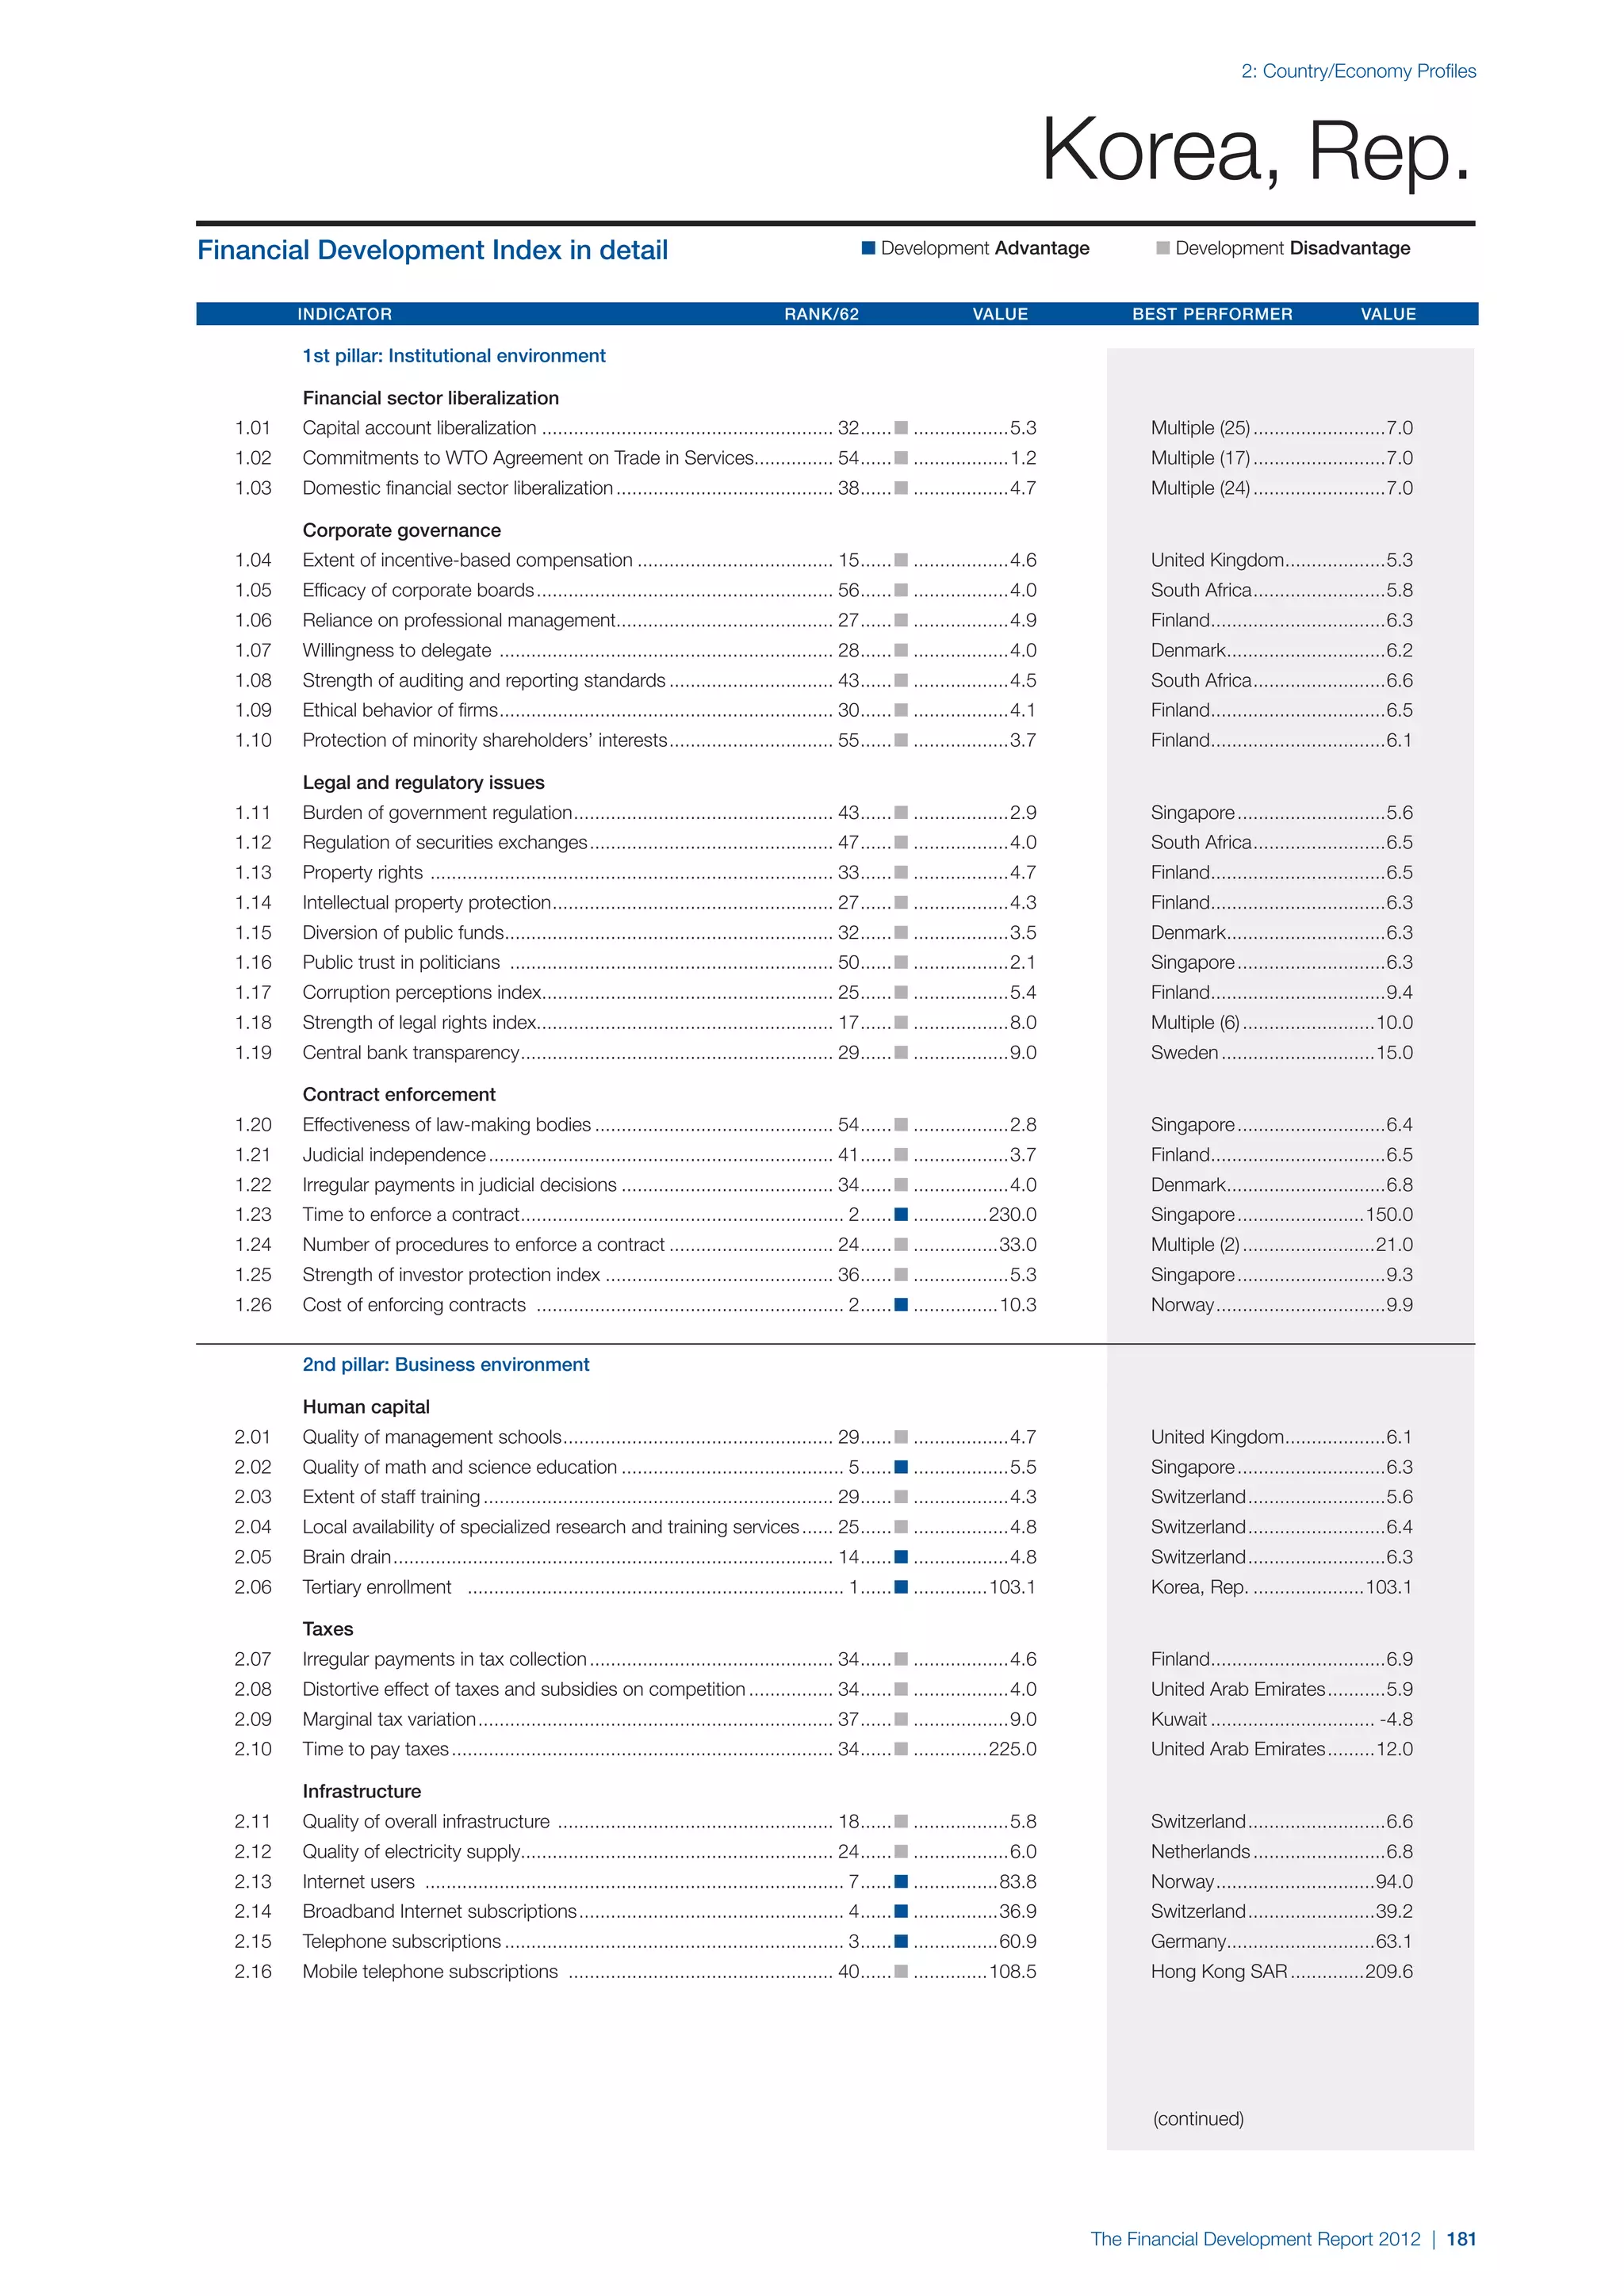
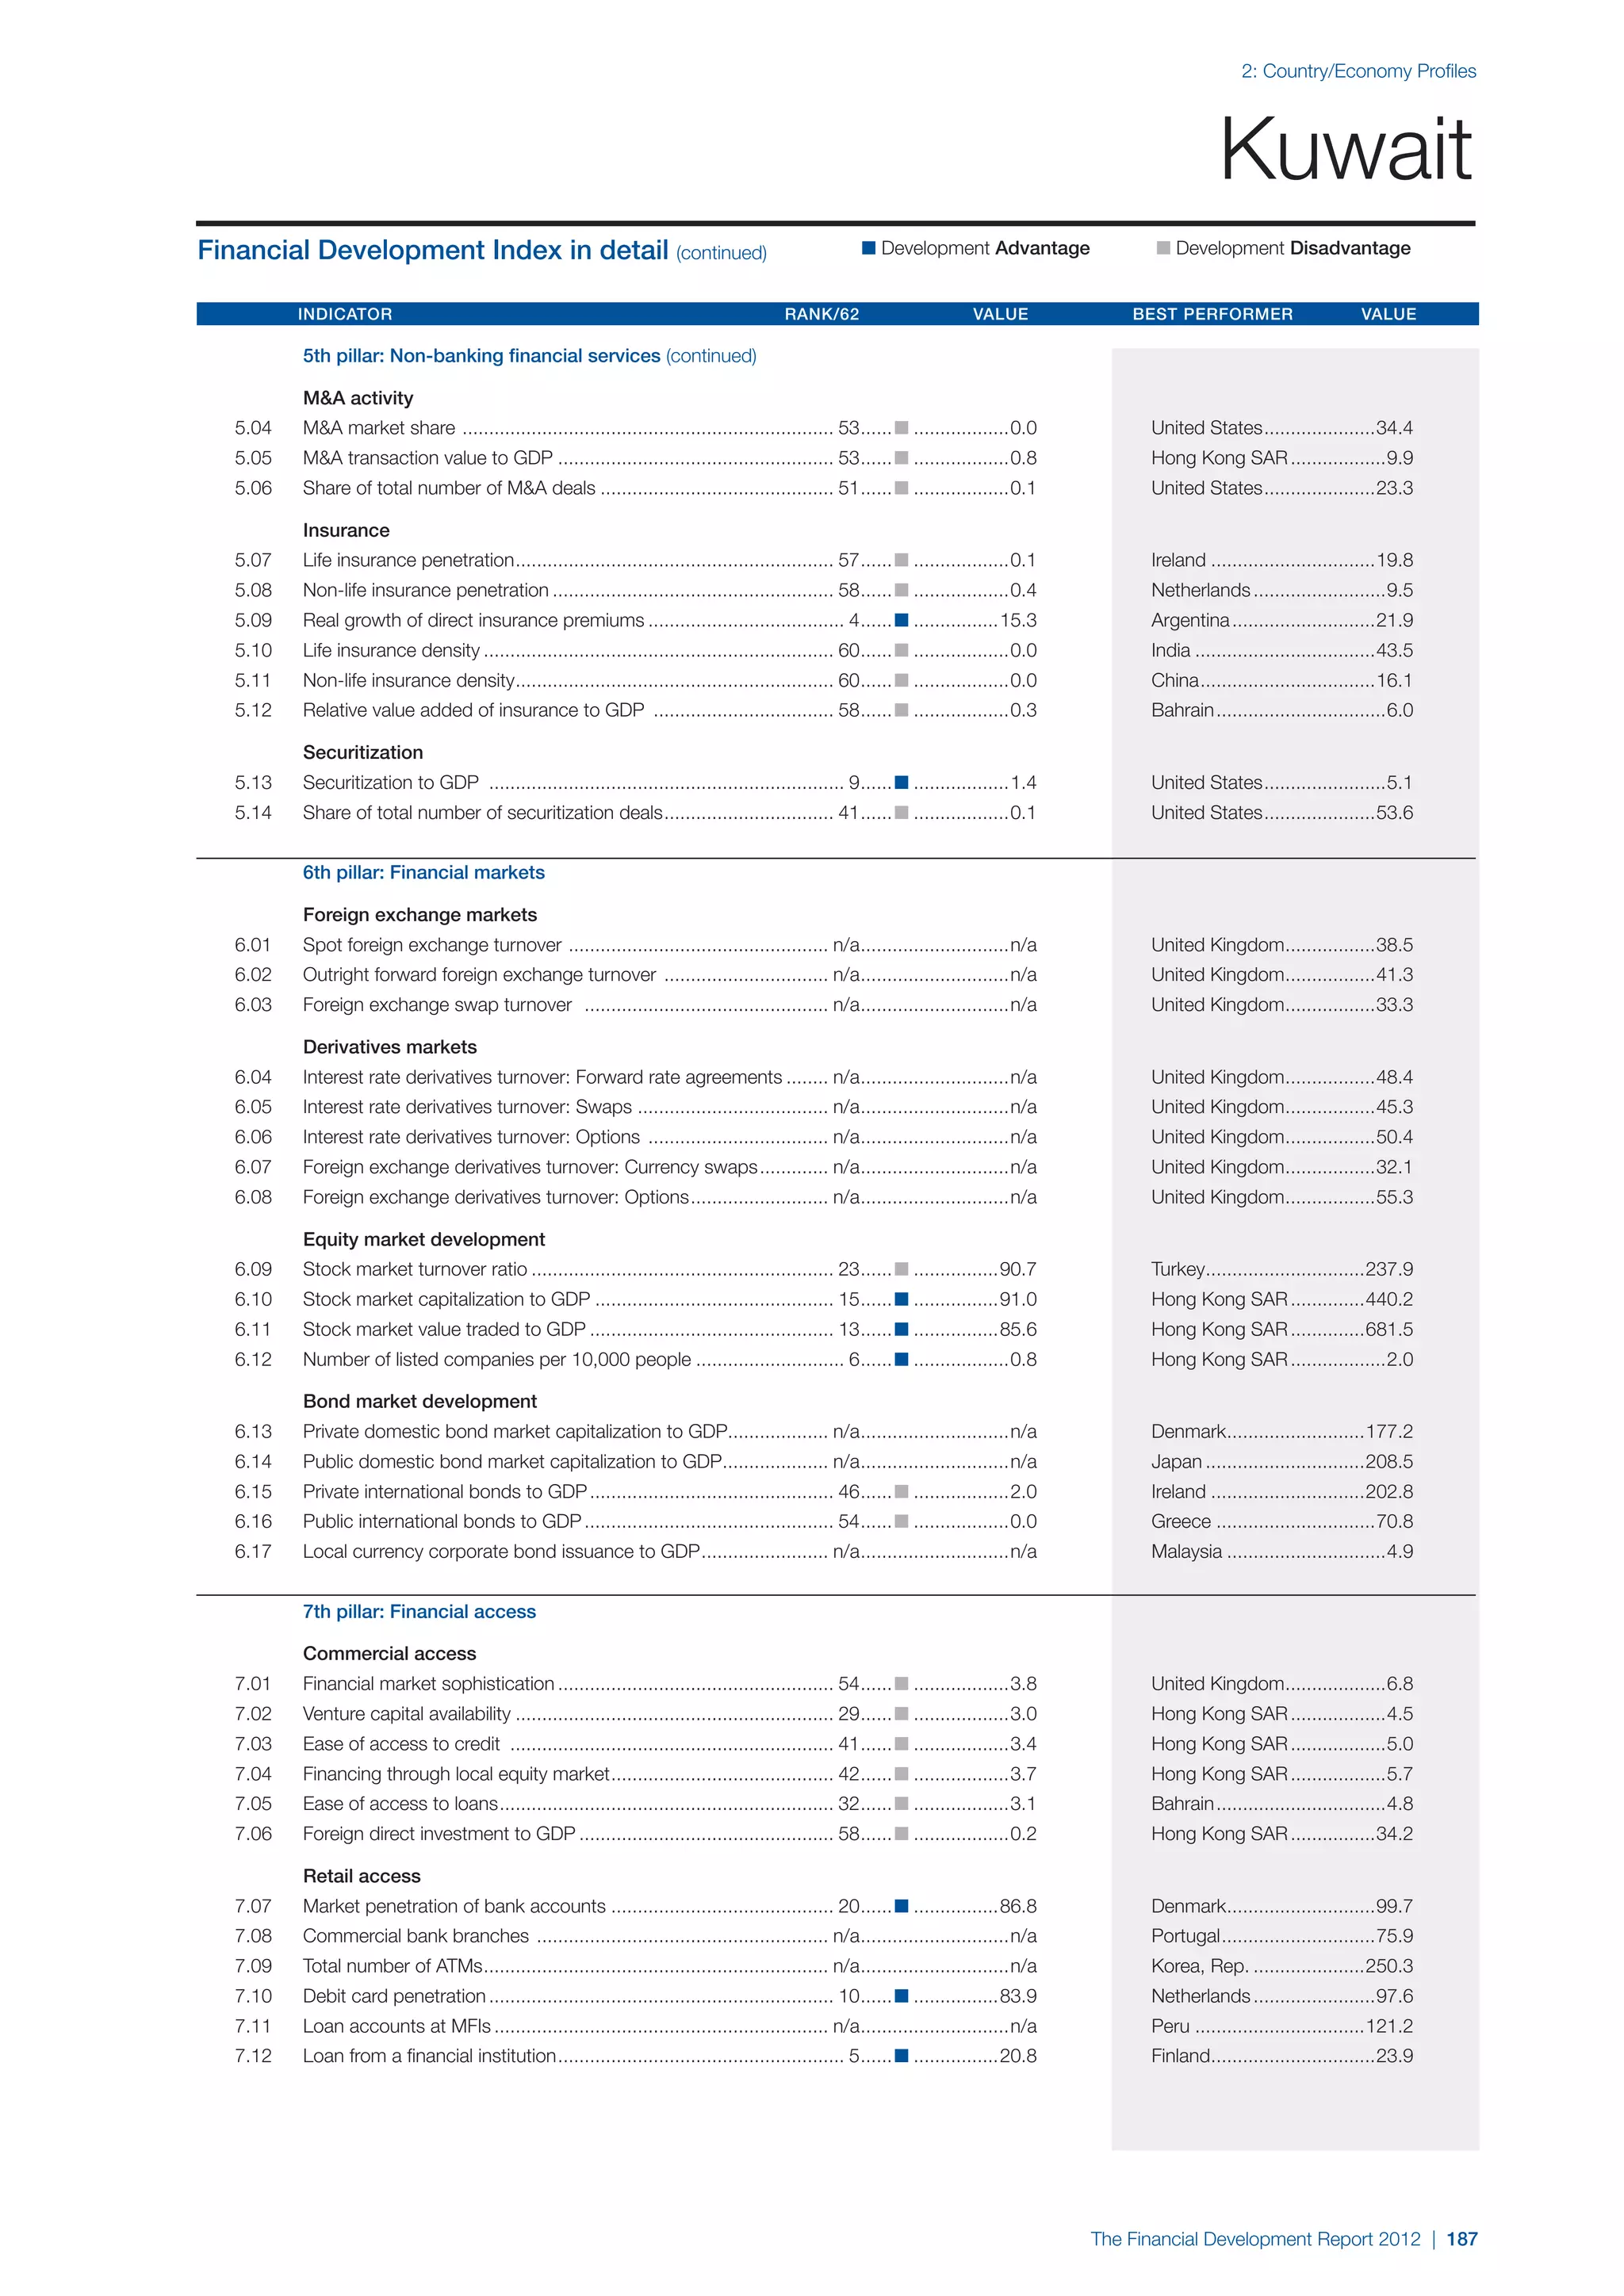
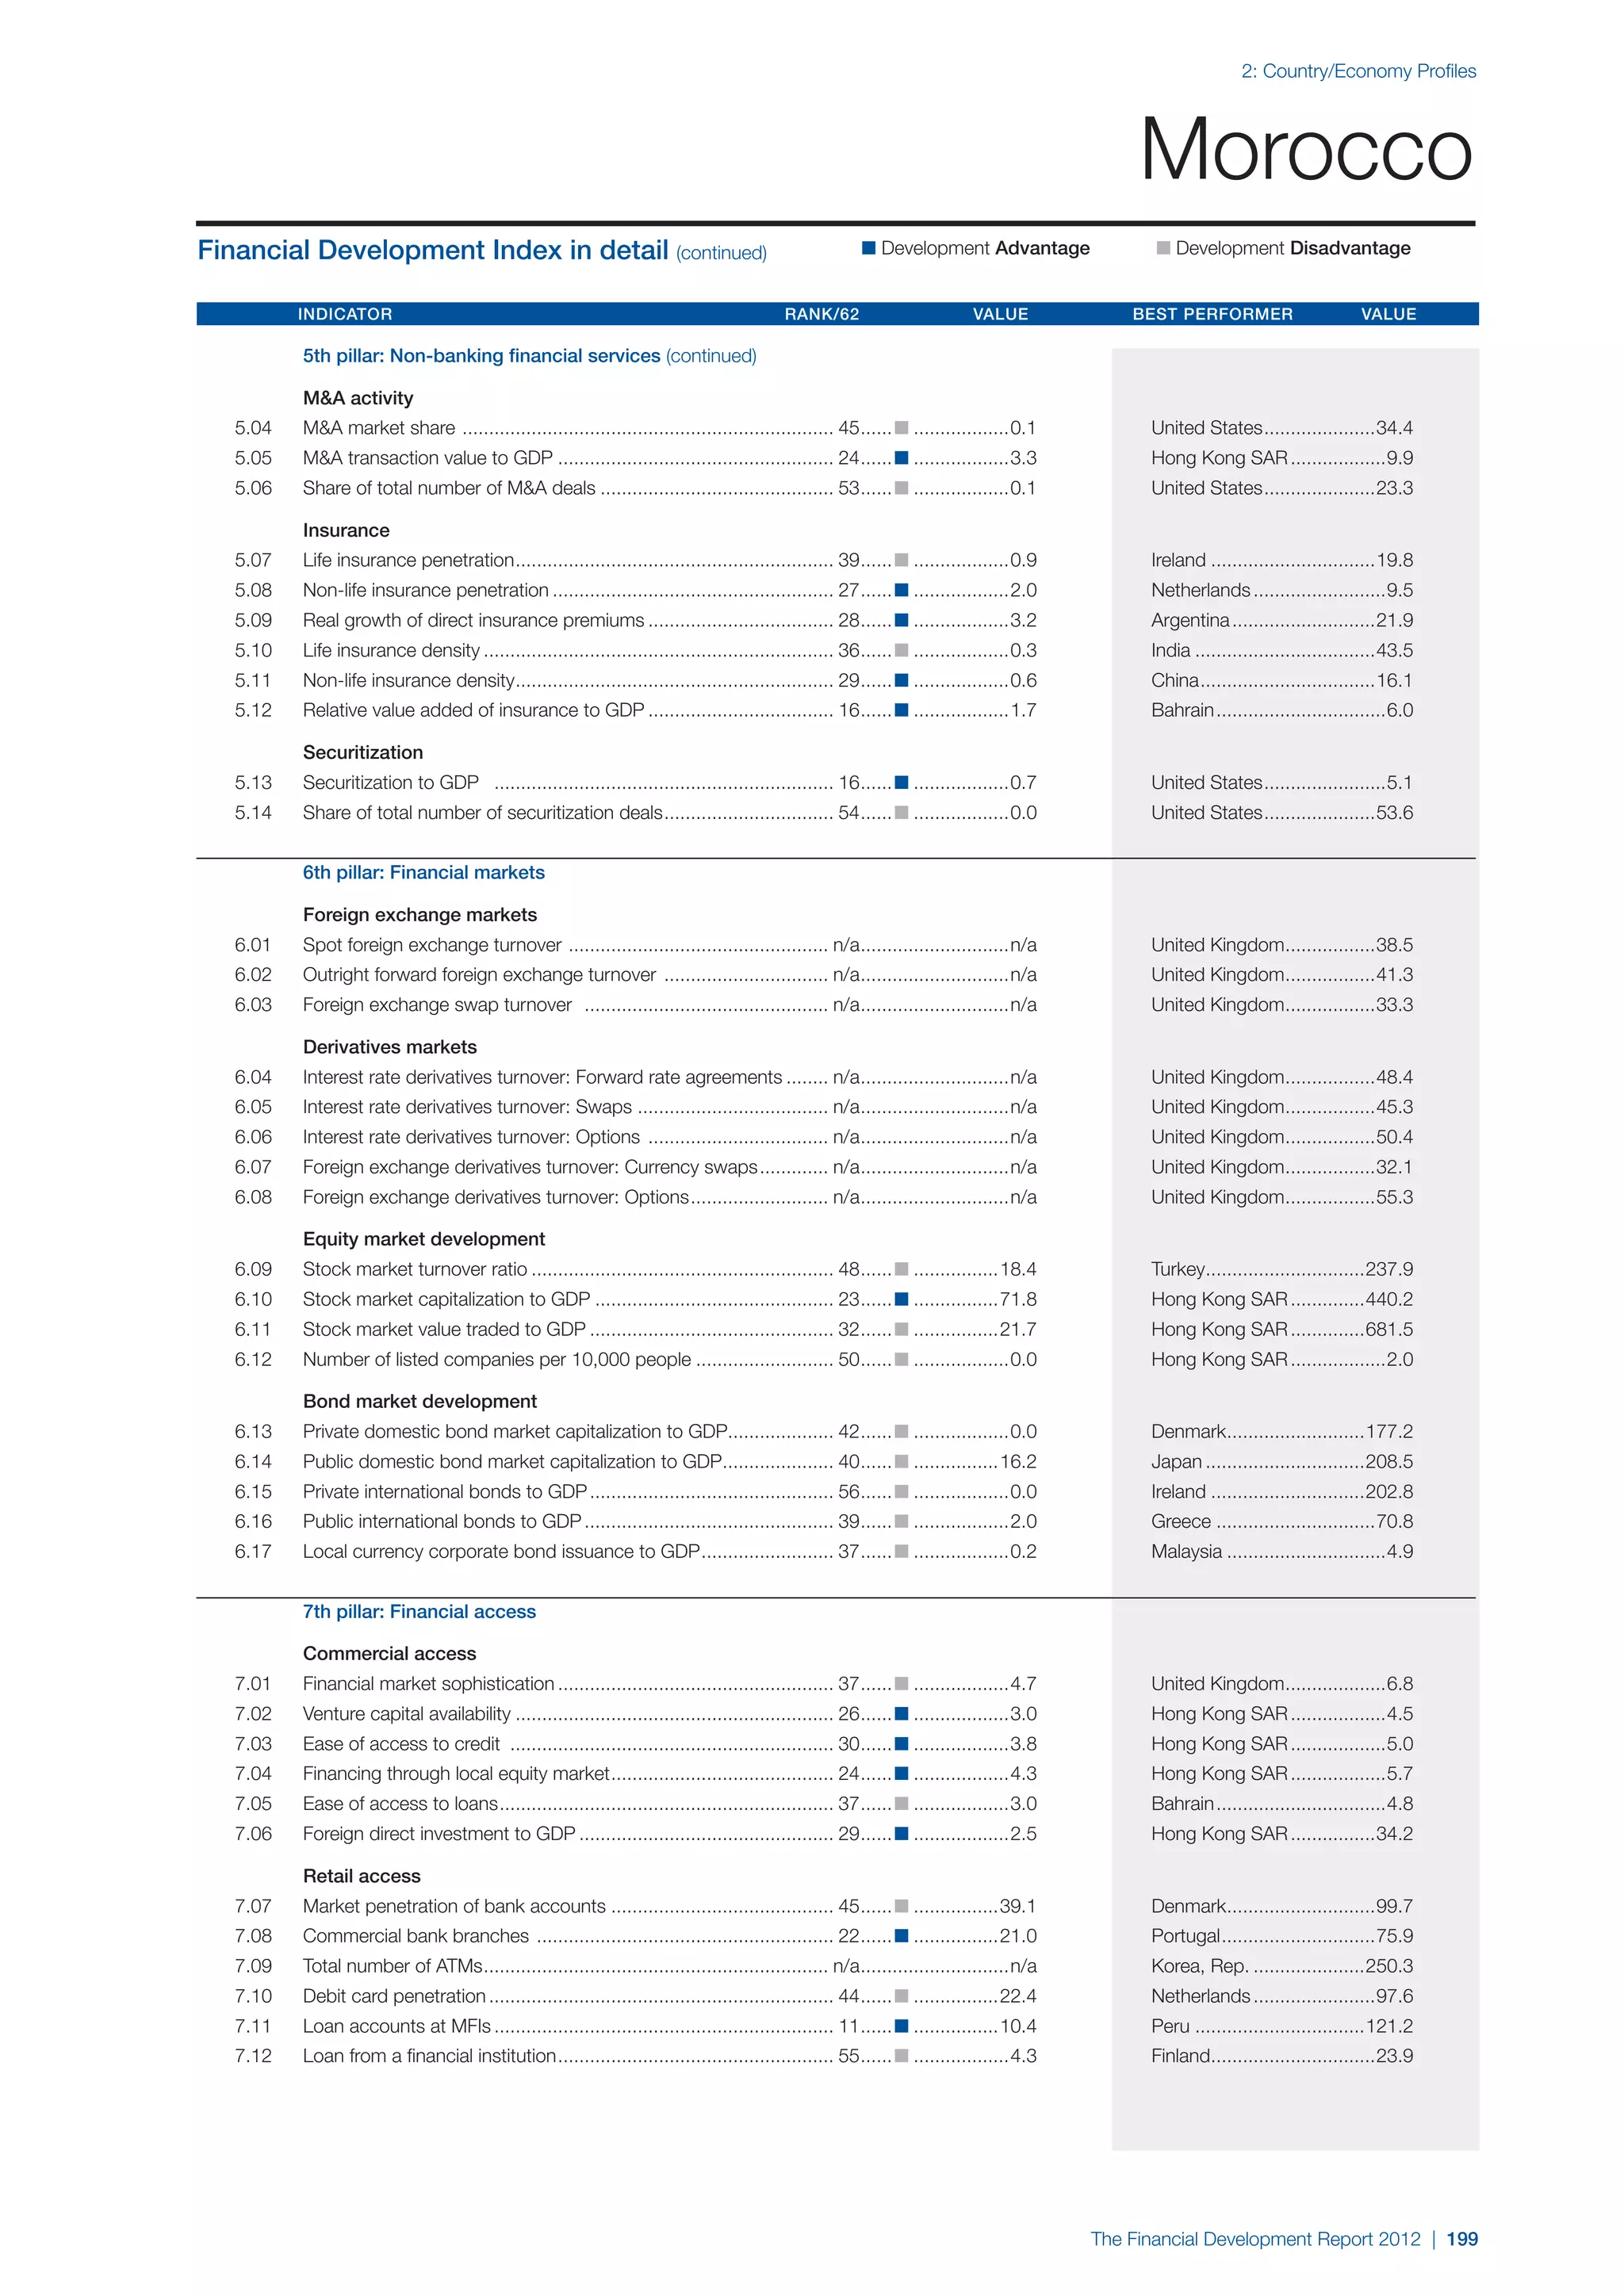
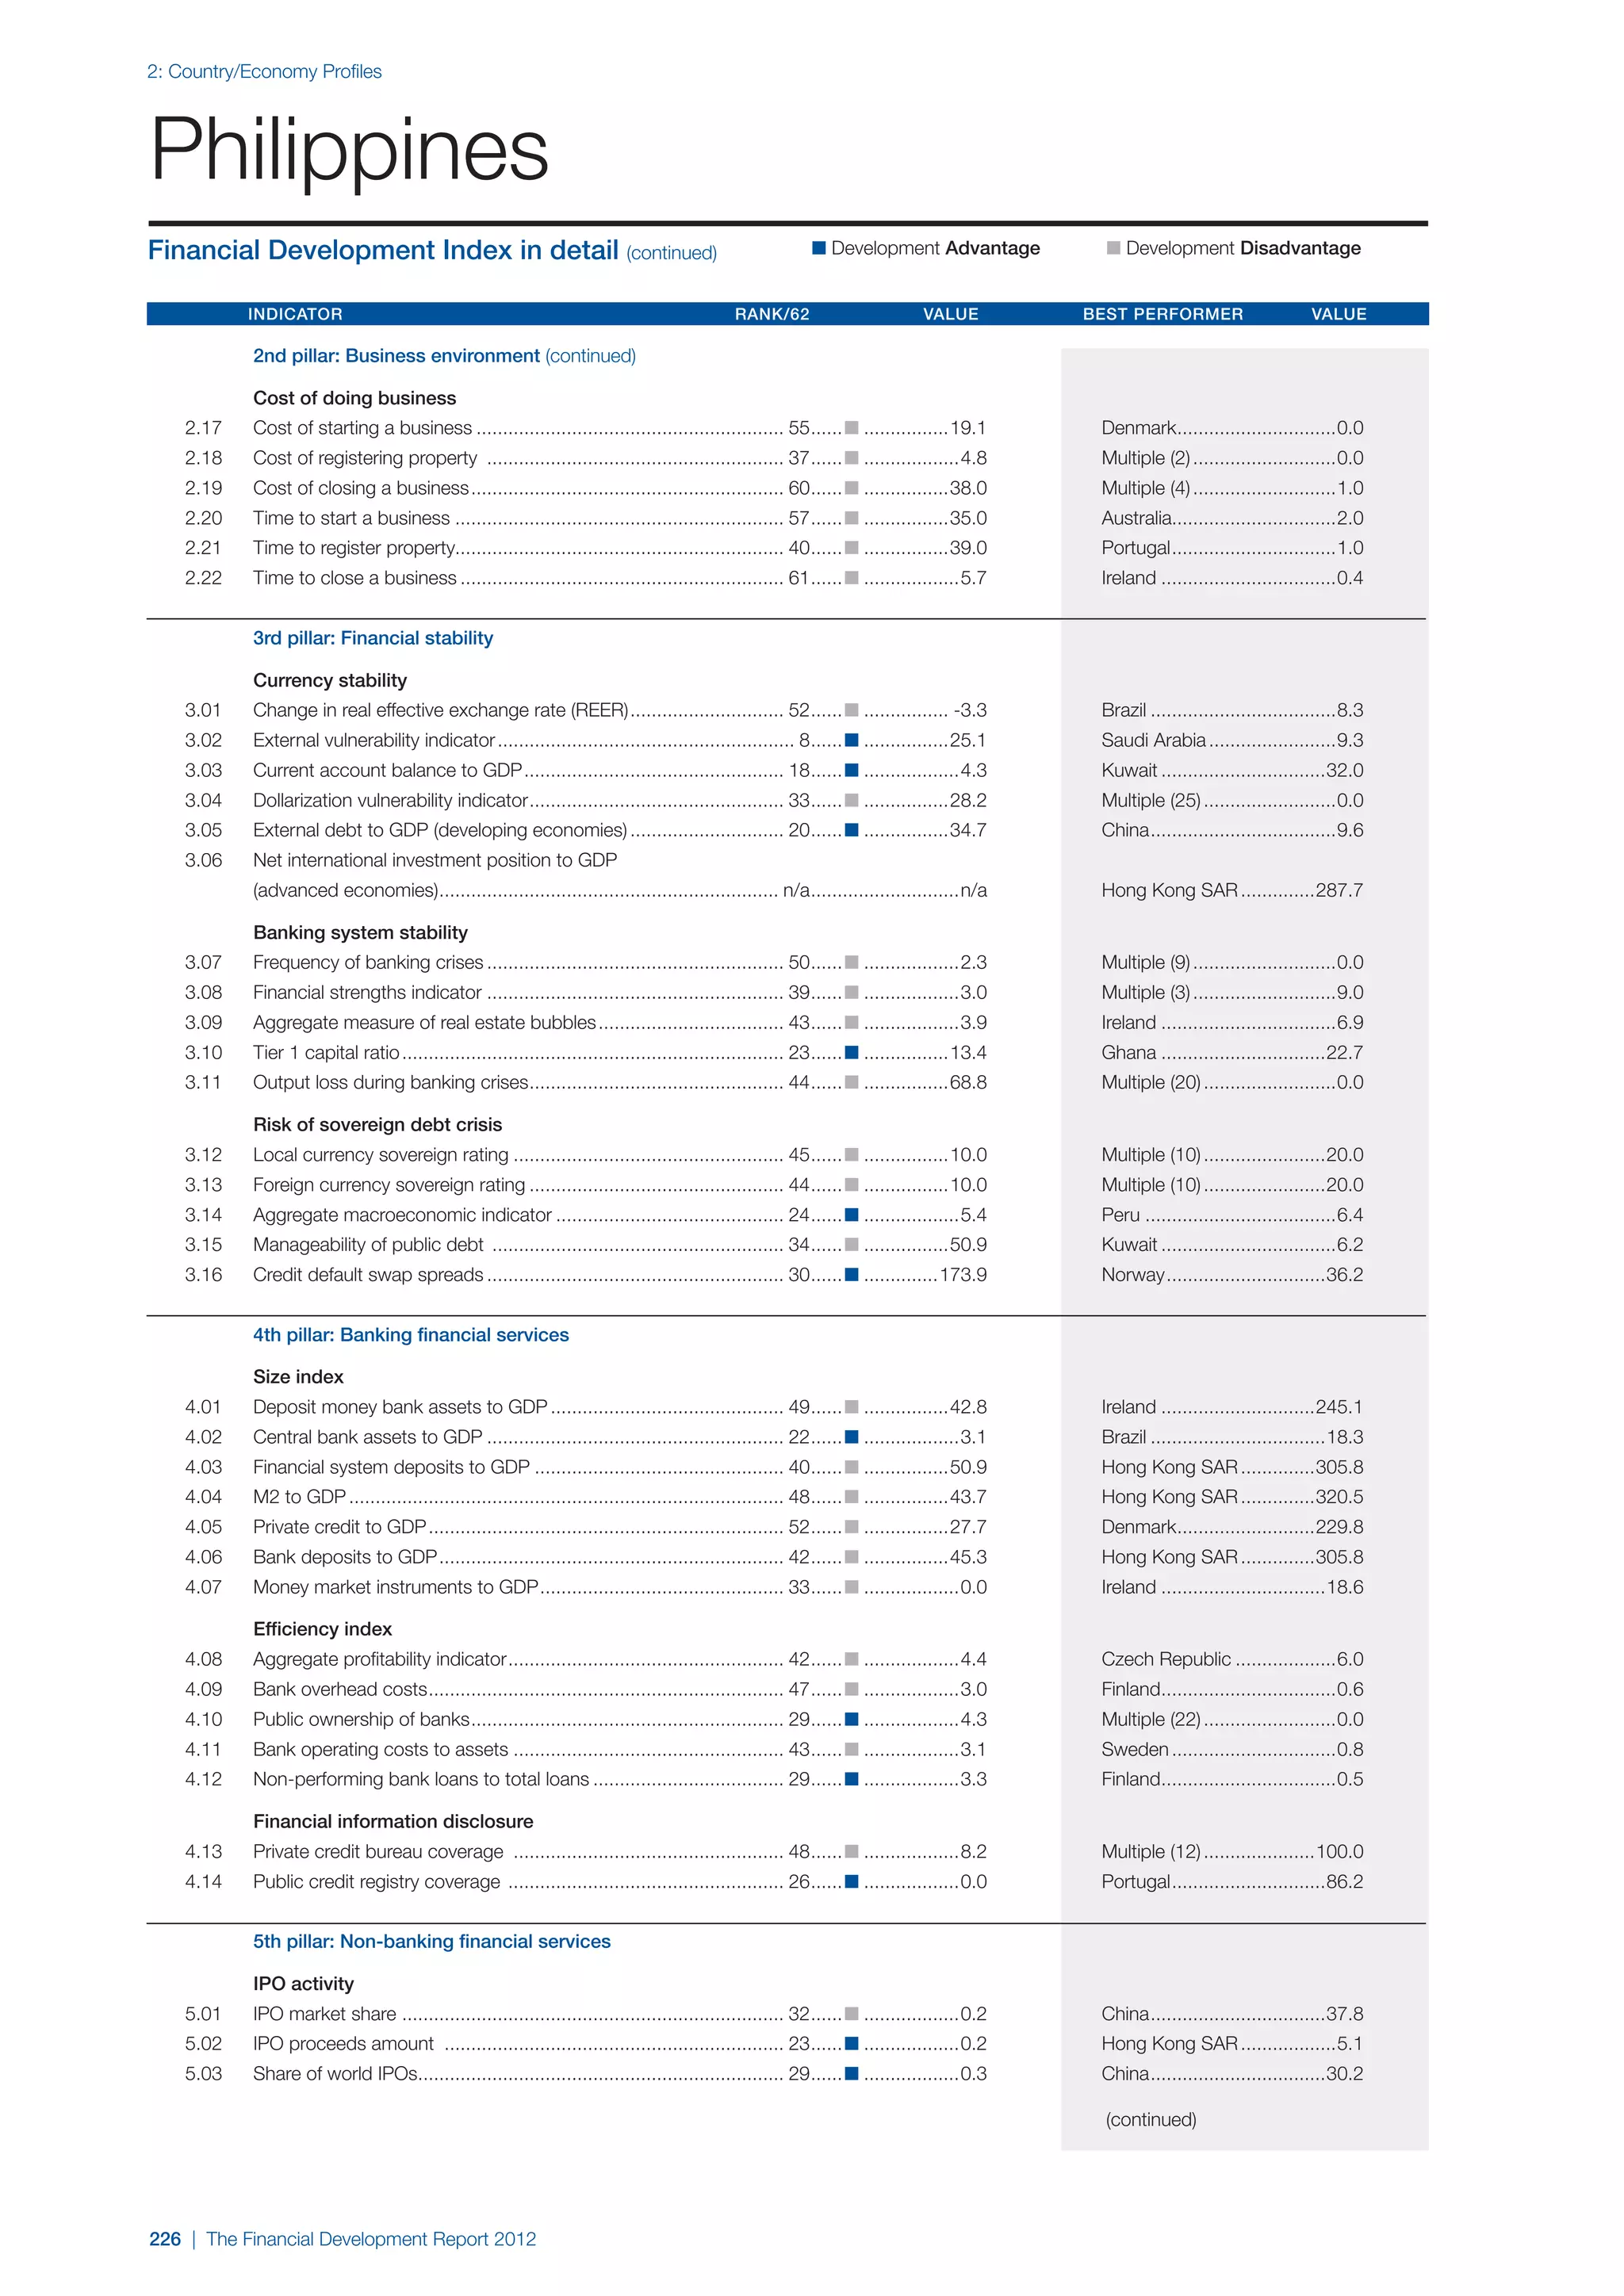
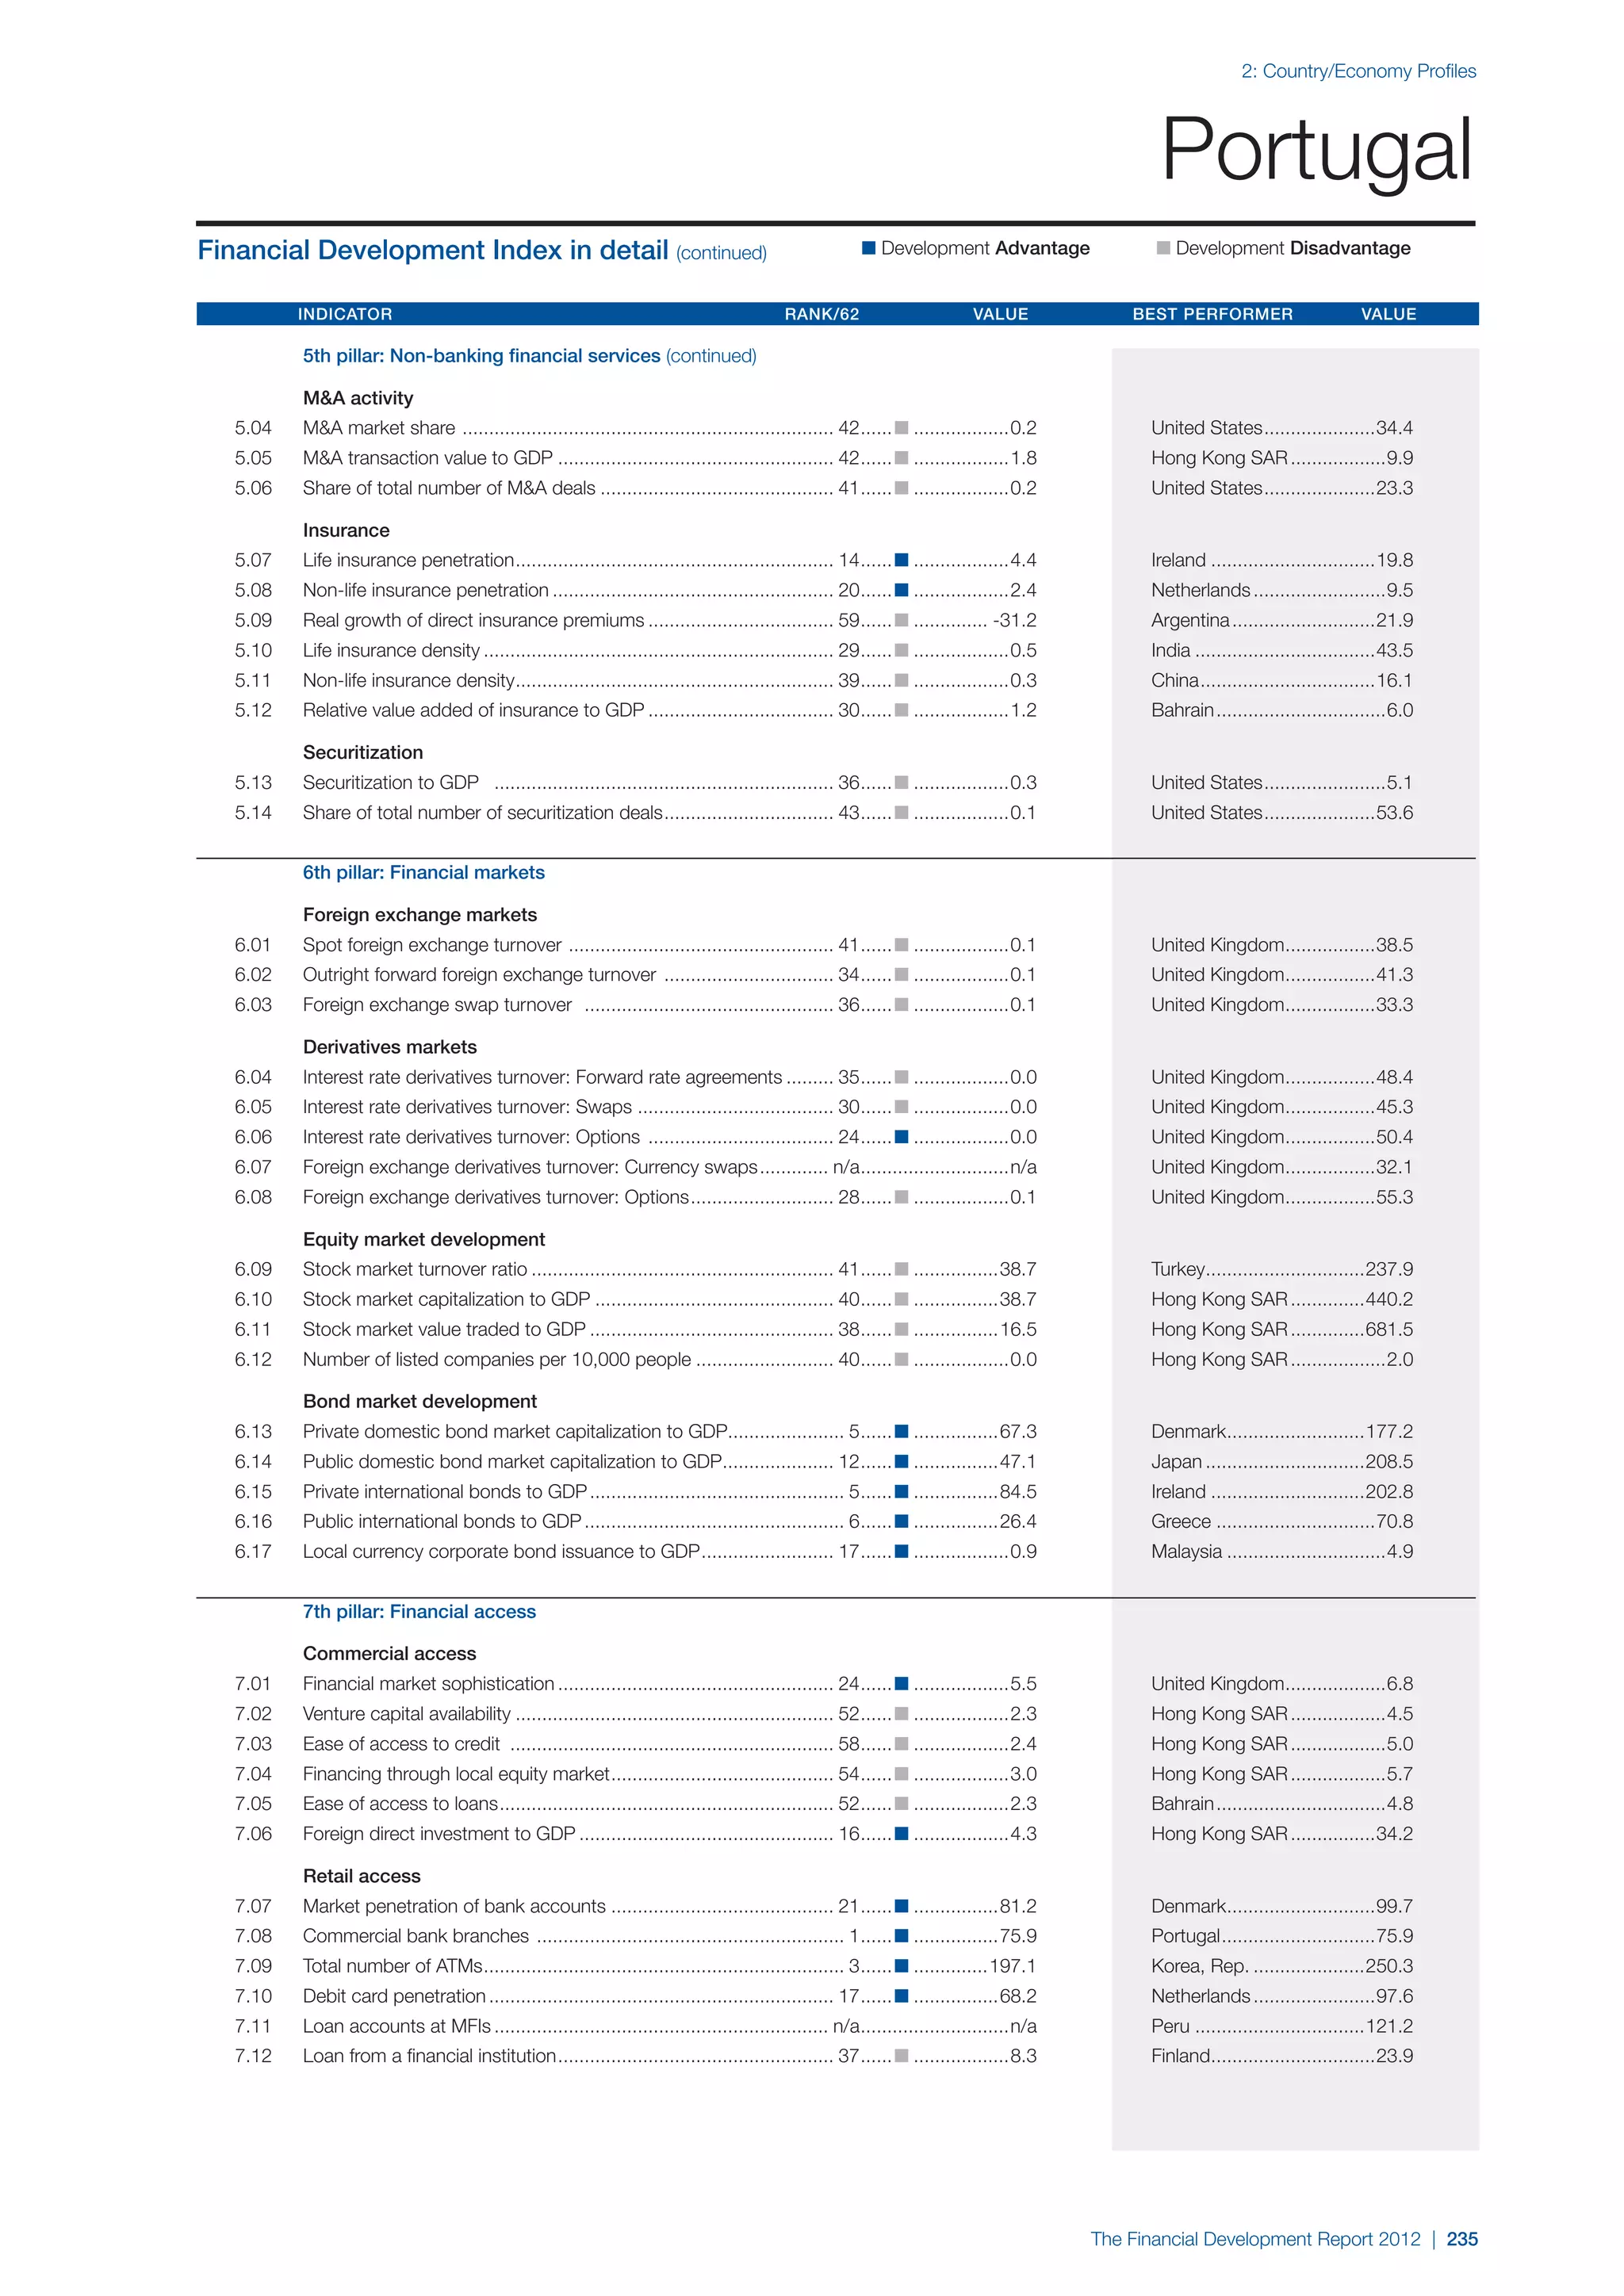
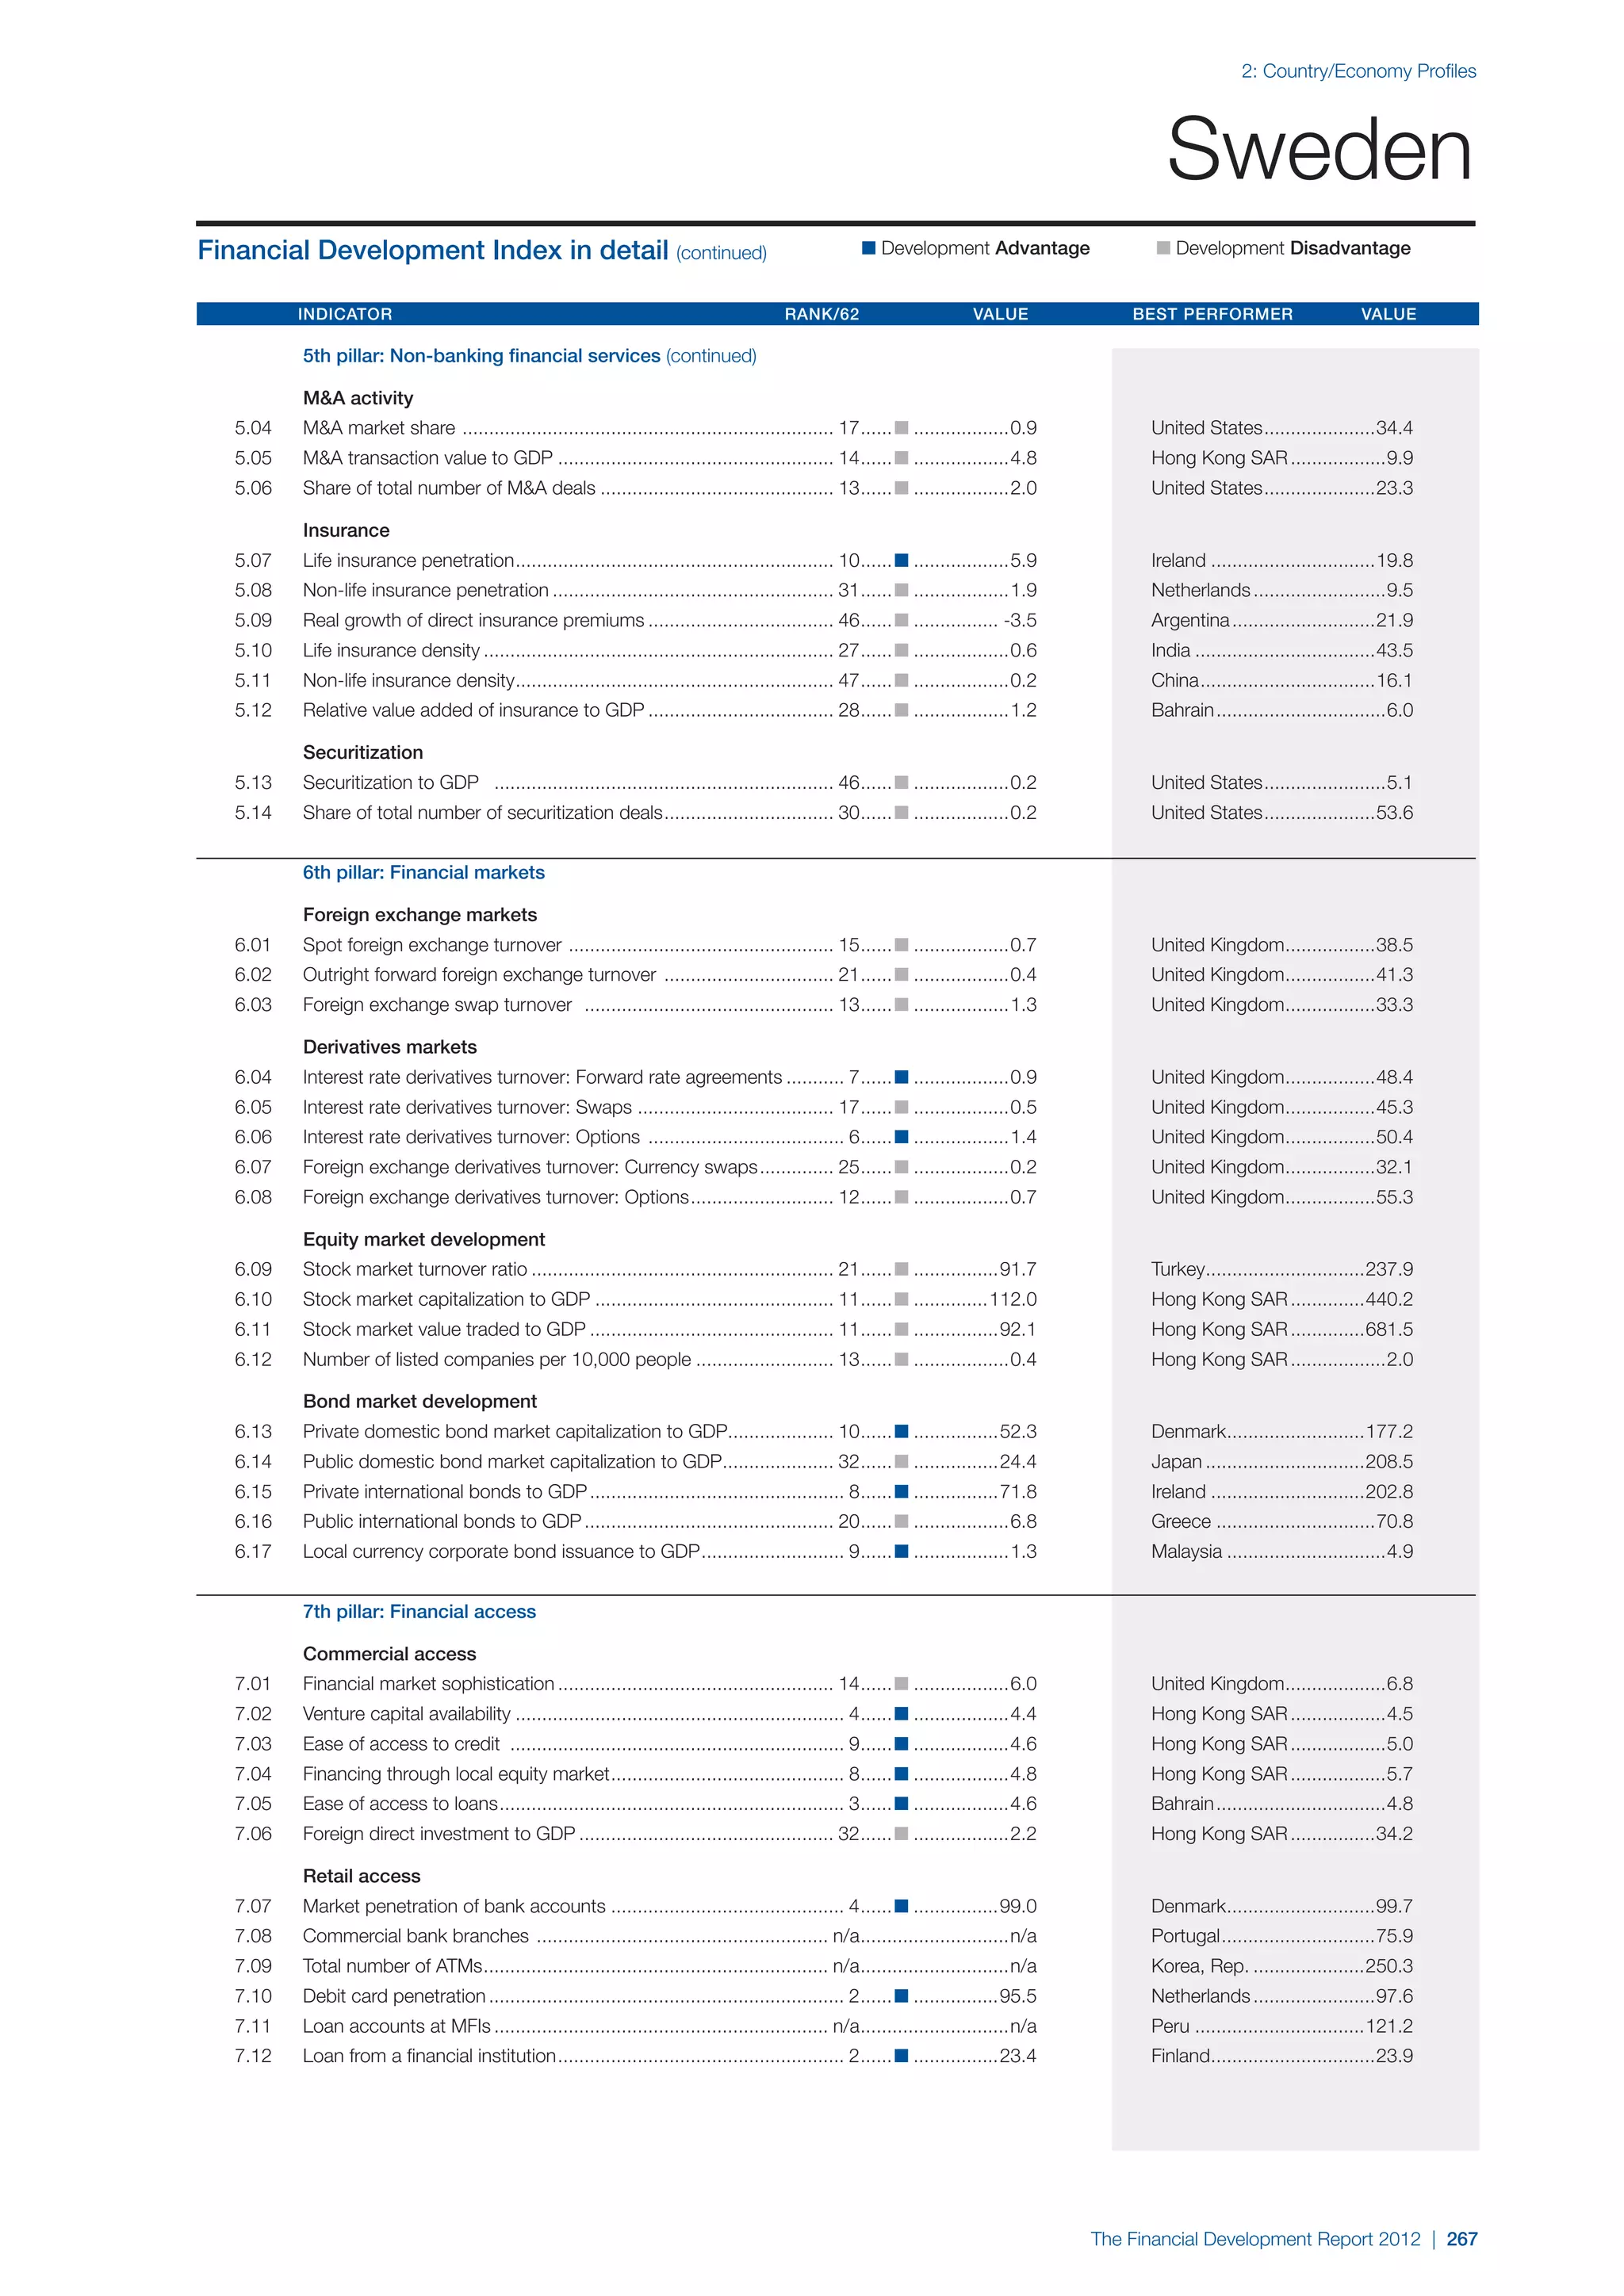
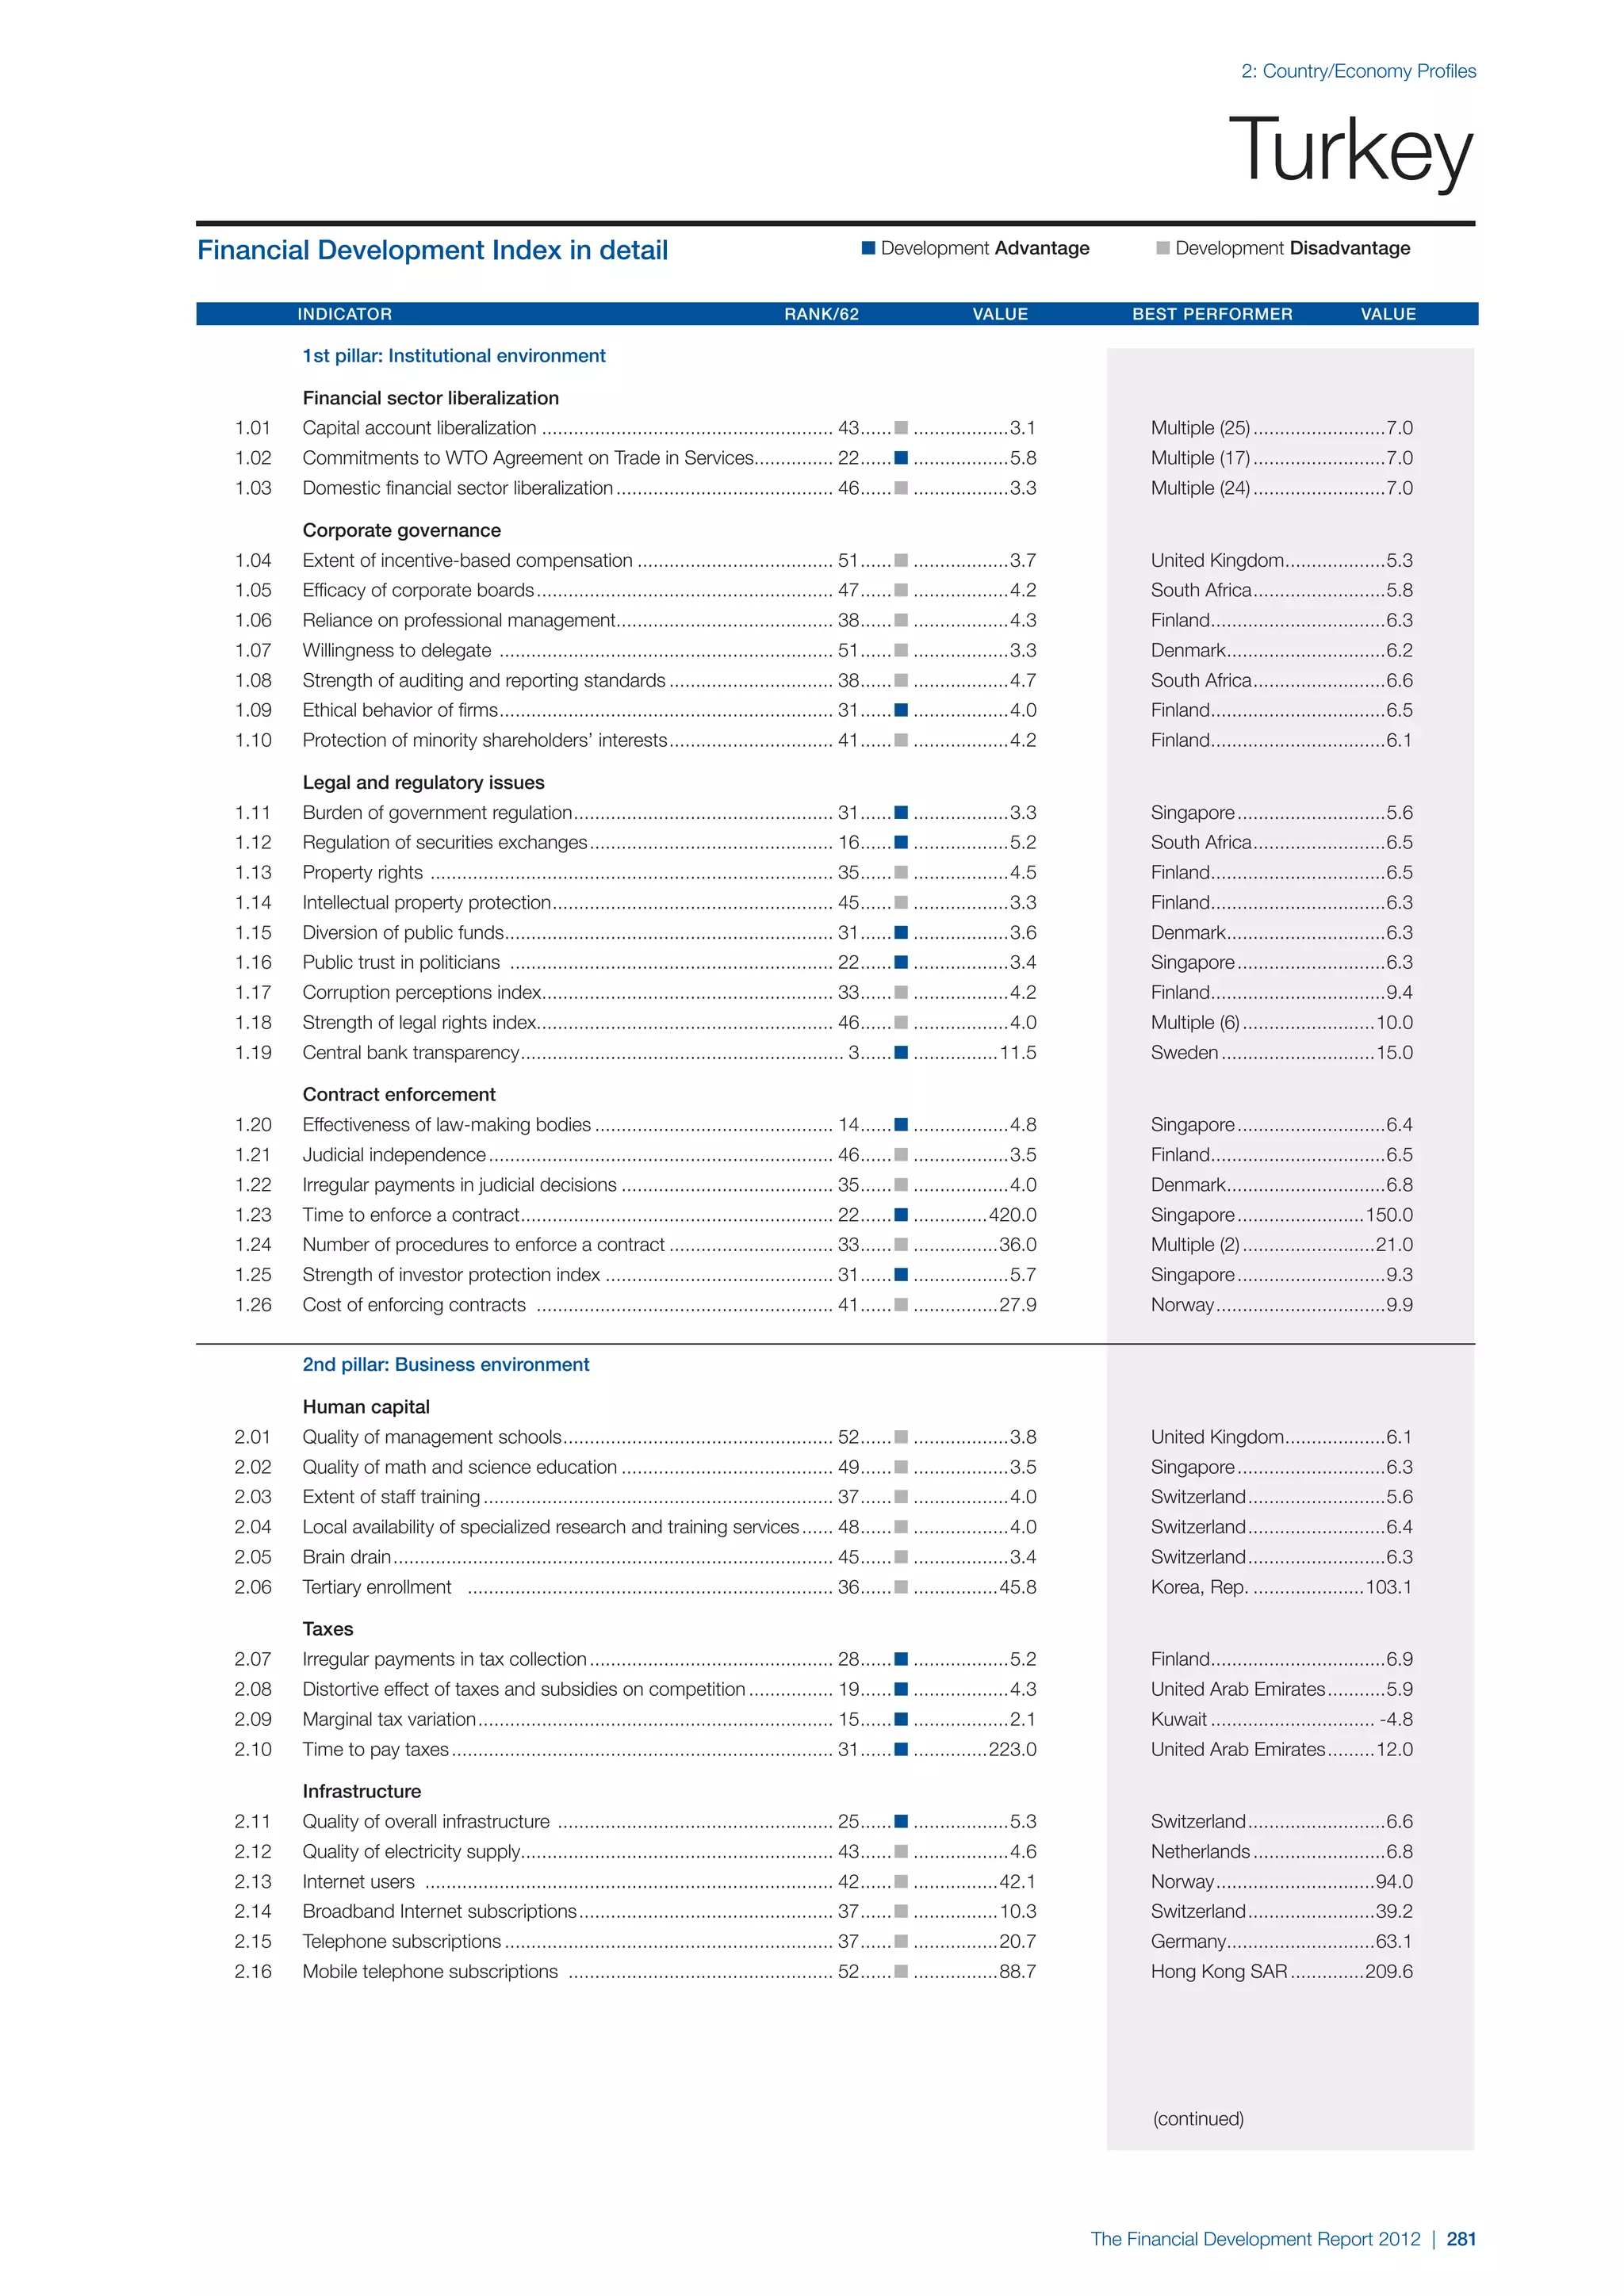
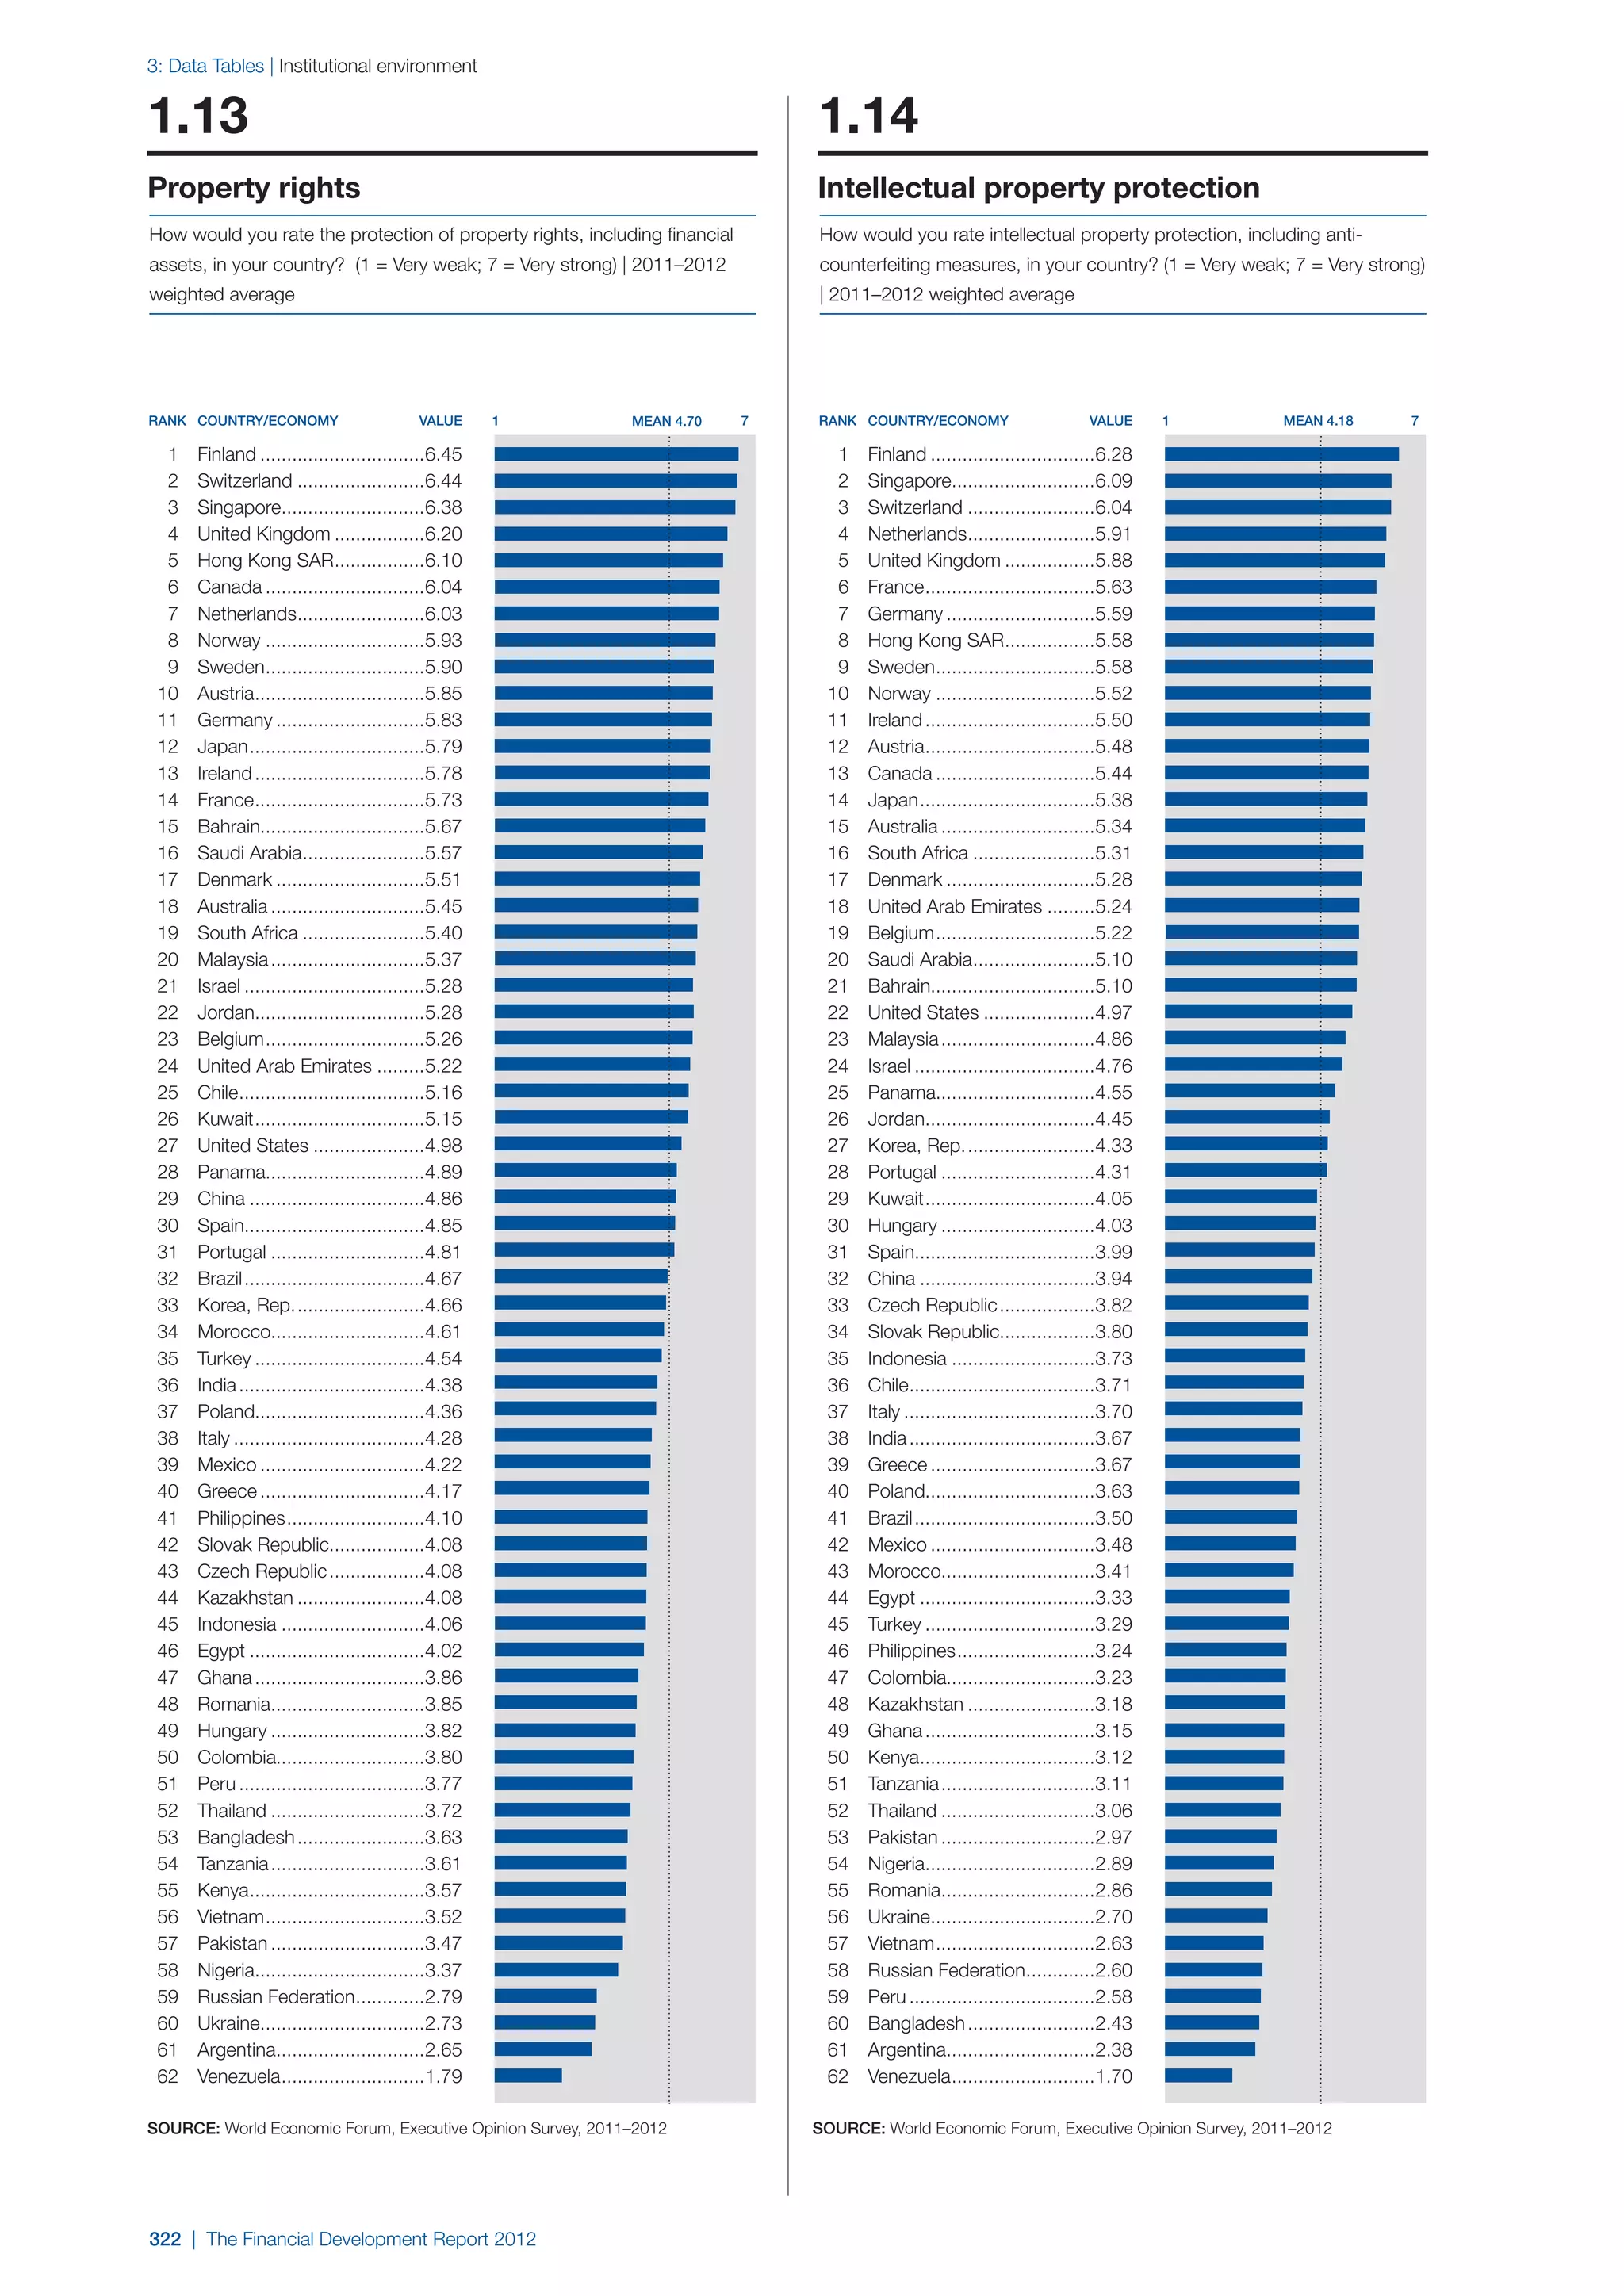
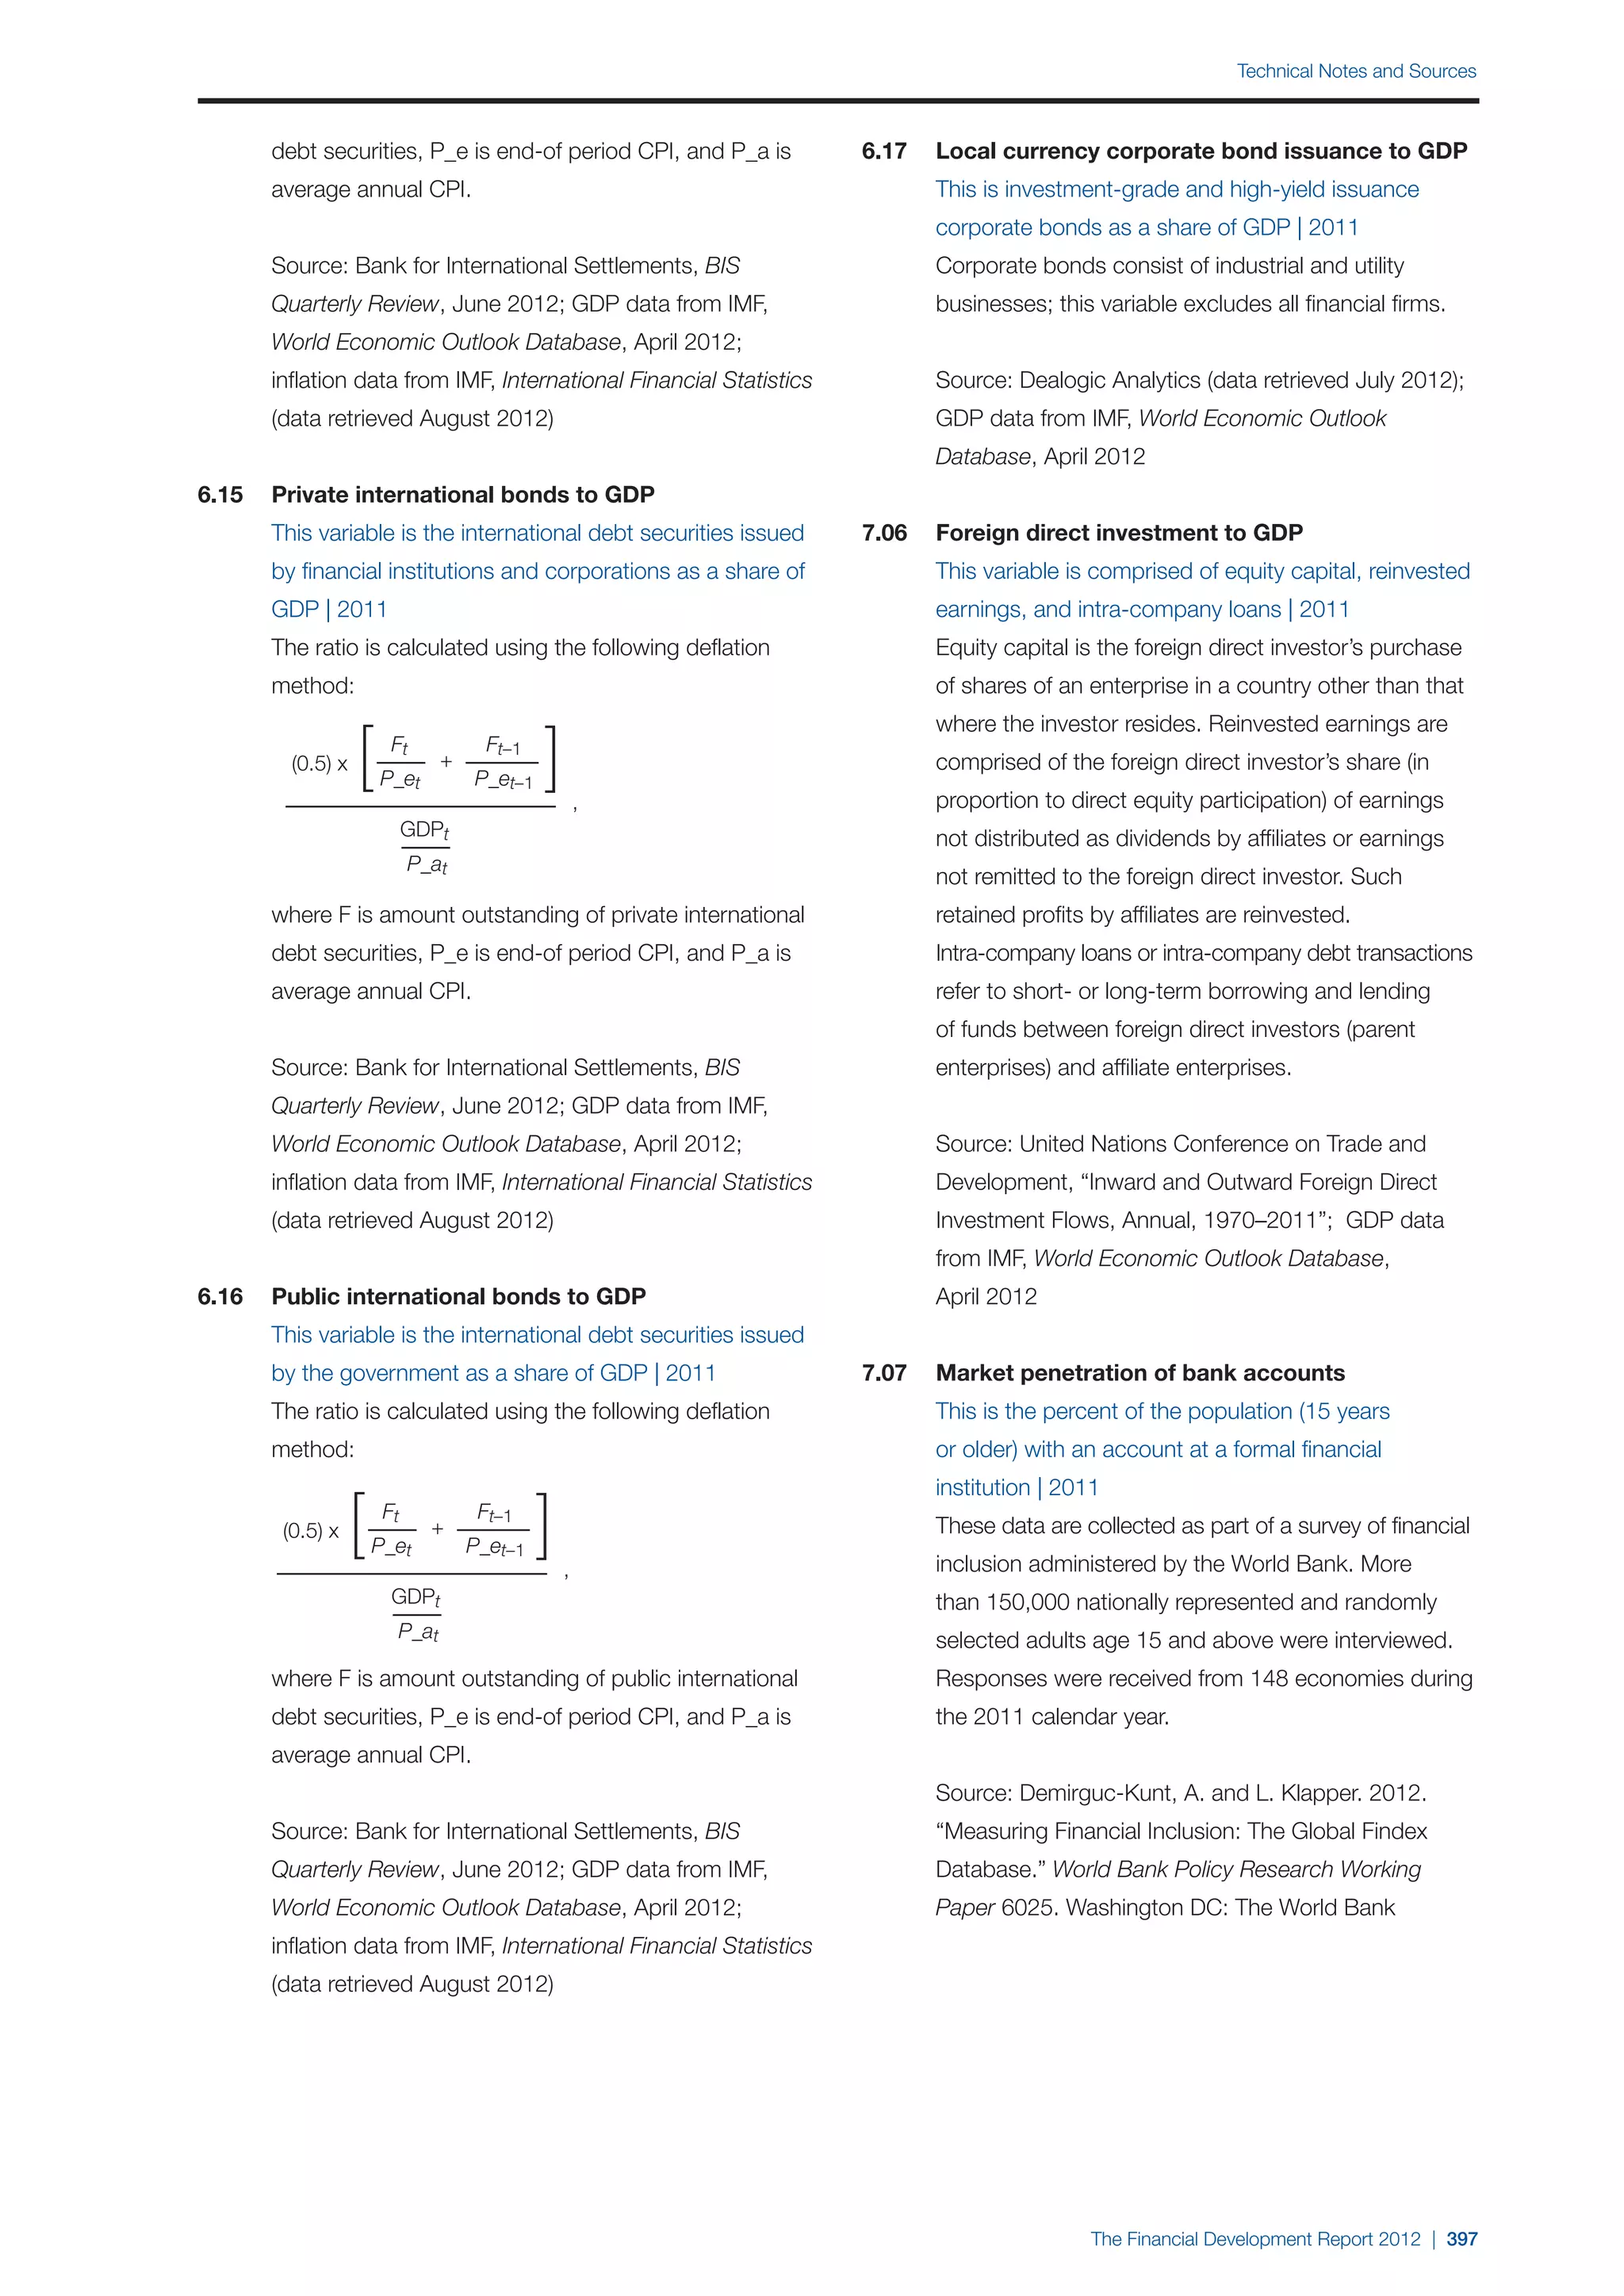
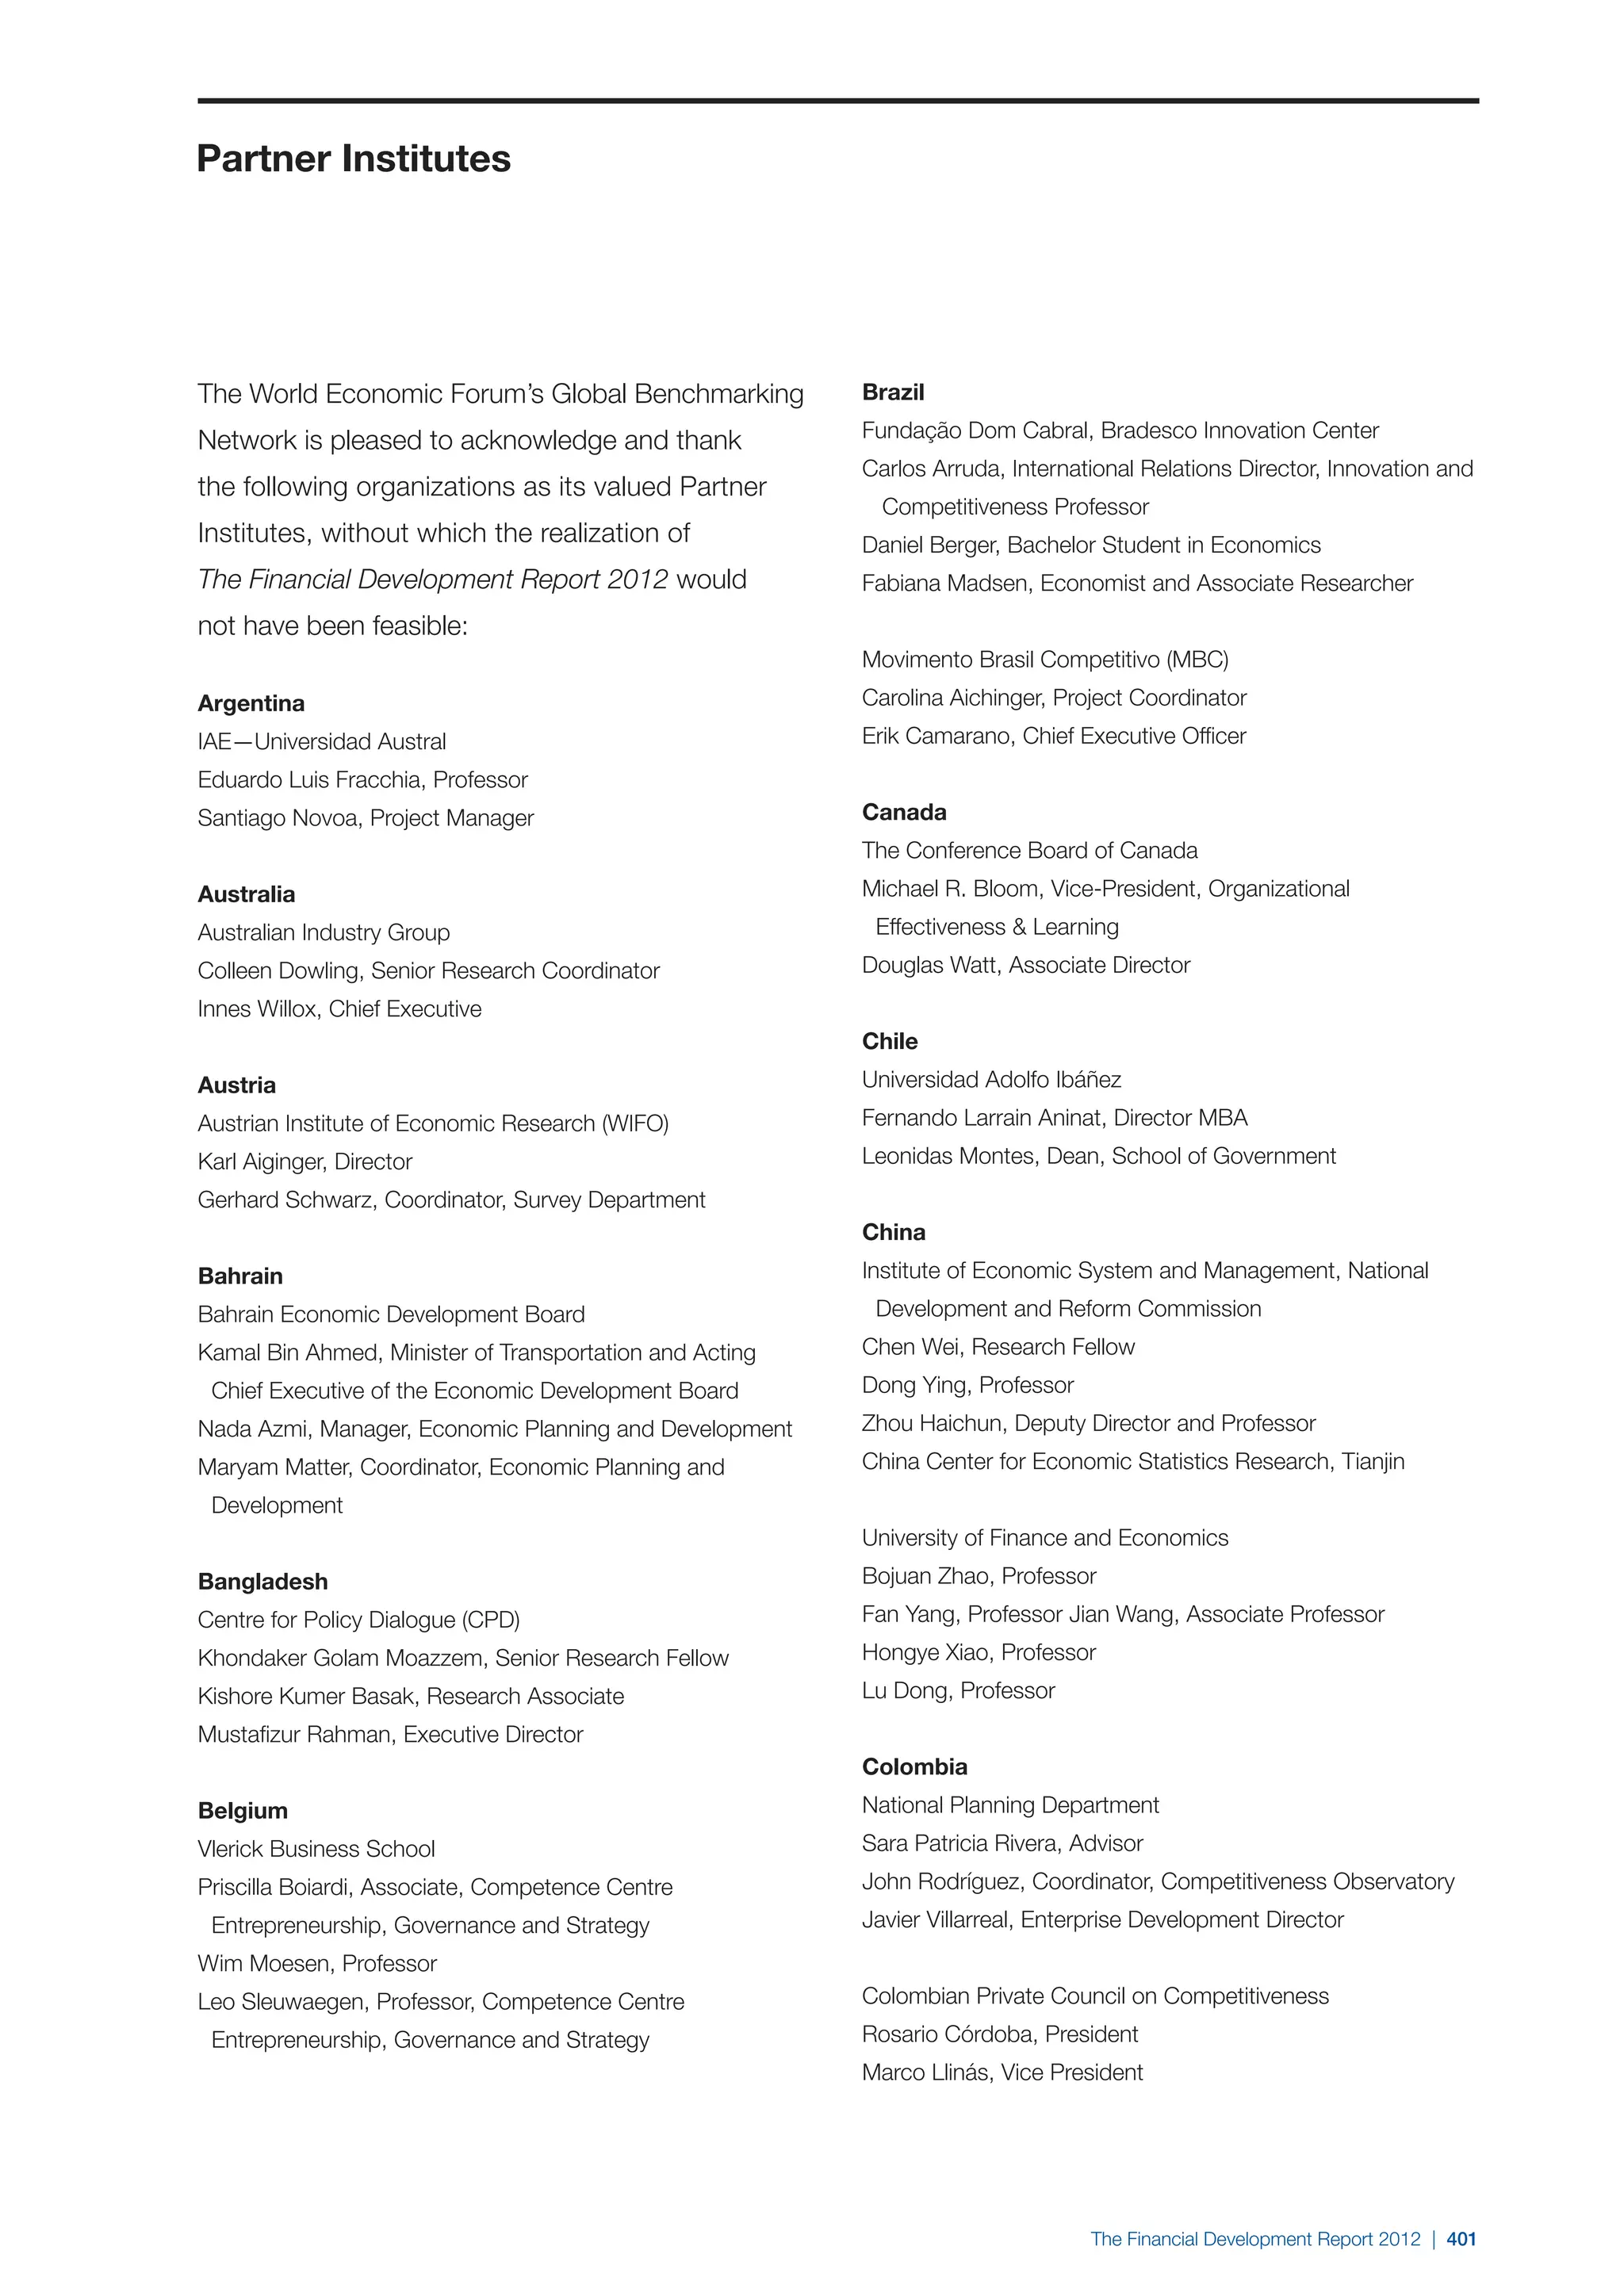
“ring-fence” its traditional domestic banks from wholesale Nothing about the boundaries of the regulated banking system
global banking activities, such as dealings in securities and should be taken on principle. Which activities are allowed
derivatives. Roughly speaking, this will mean that, whenever
23
within this specially protected regulatory environment is a
these two classes of activities are offered by the same bank, cost-benefit decision that should be based on how dangerous
the traditional domestic banking activities (including the it would be for these activities to be interrupted, what sorts
critical payment and settlement systems) must be backed of collateral damage might be caused by their failure, and
by a pool of capital that is legally insulated from losses what risks these activities would pose to financial stability
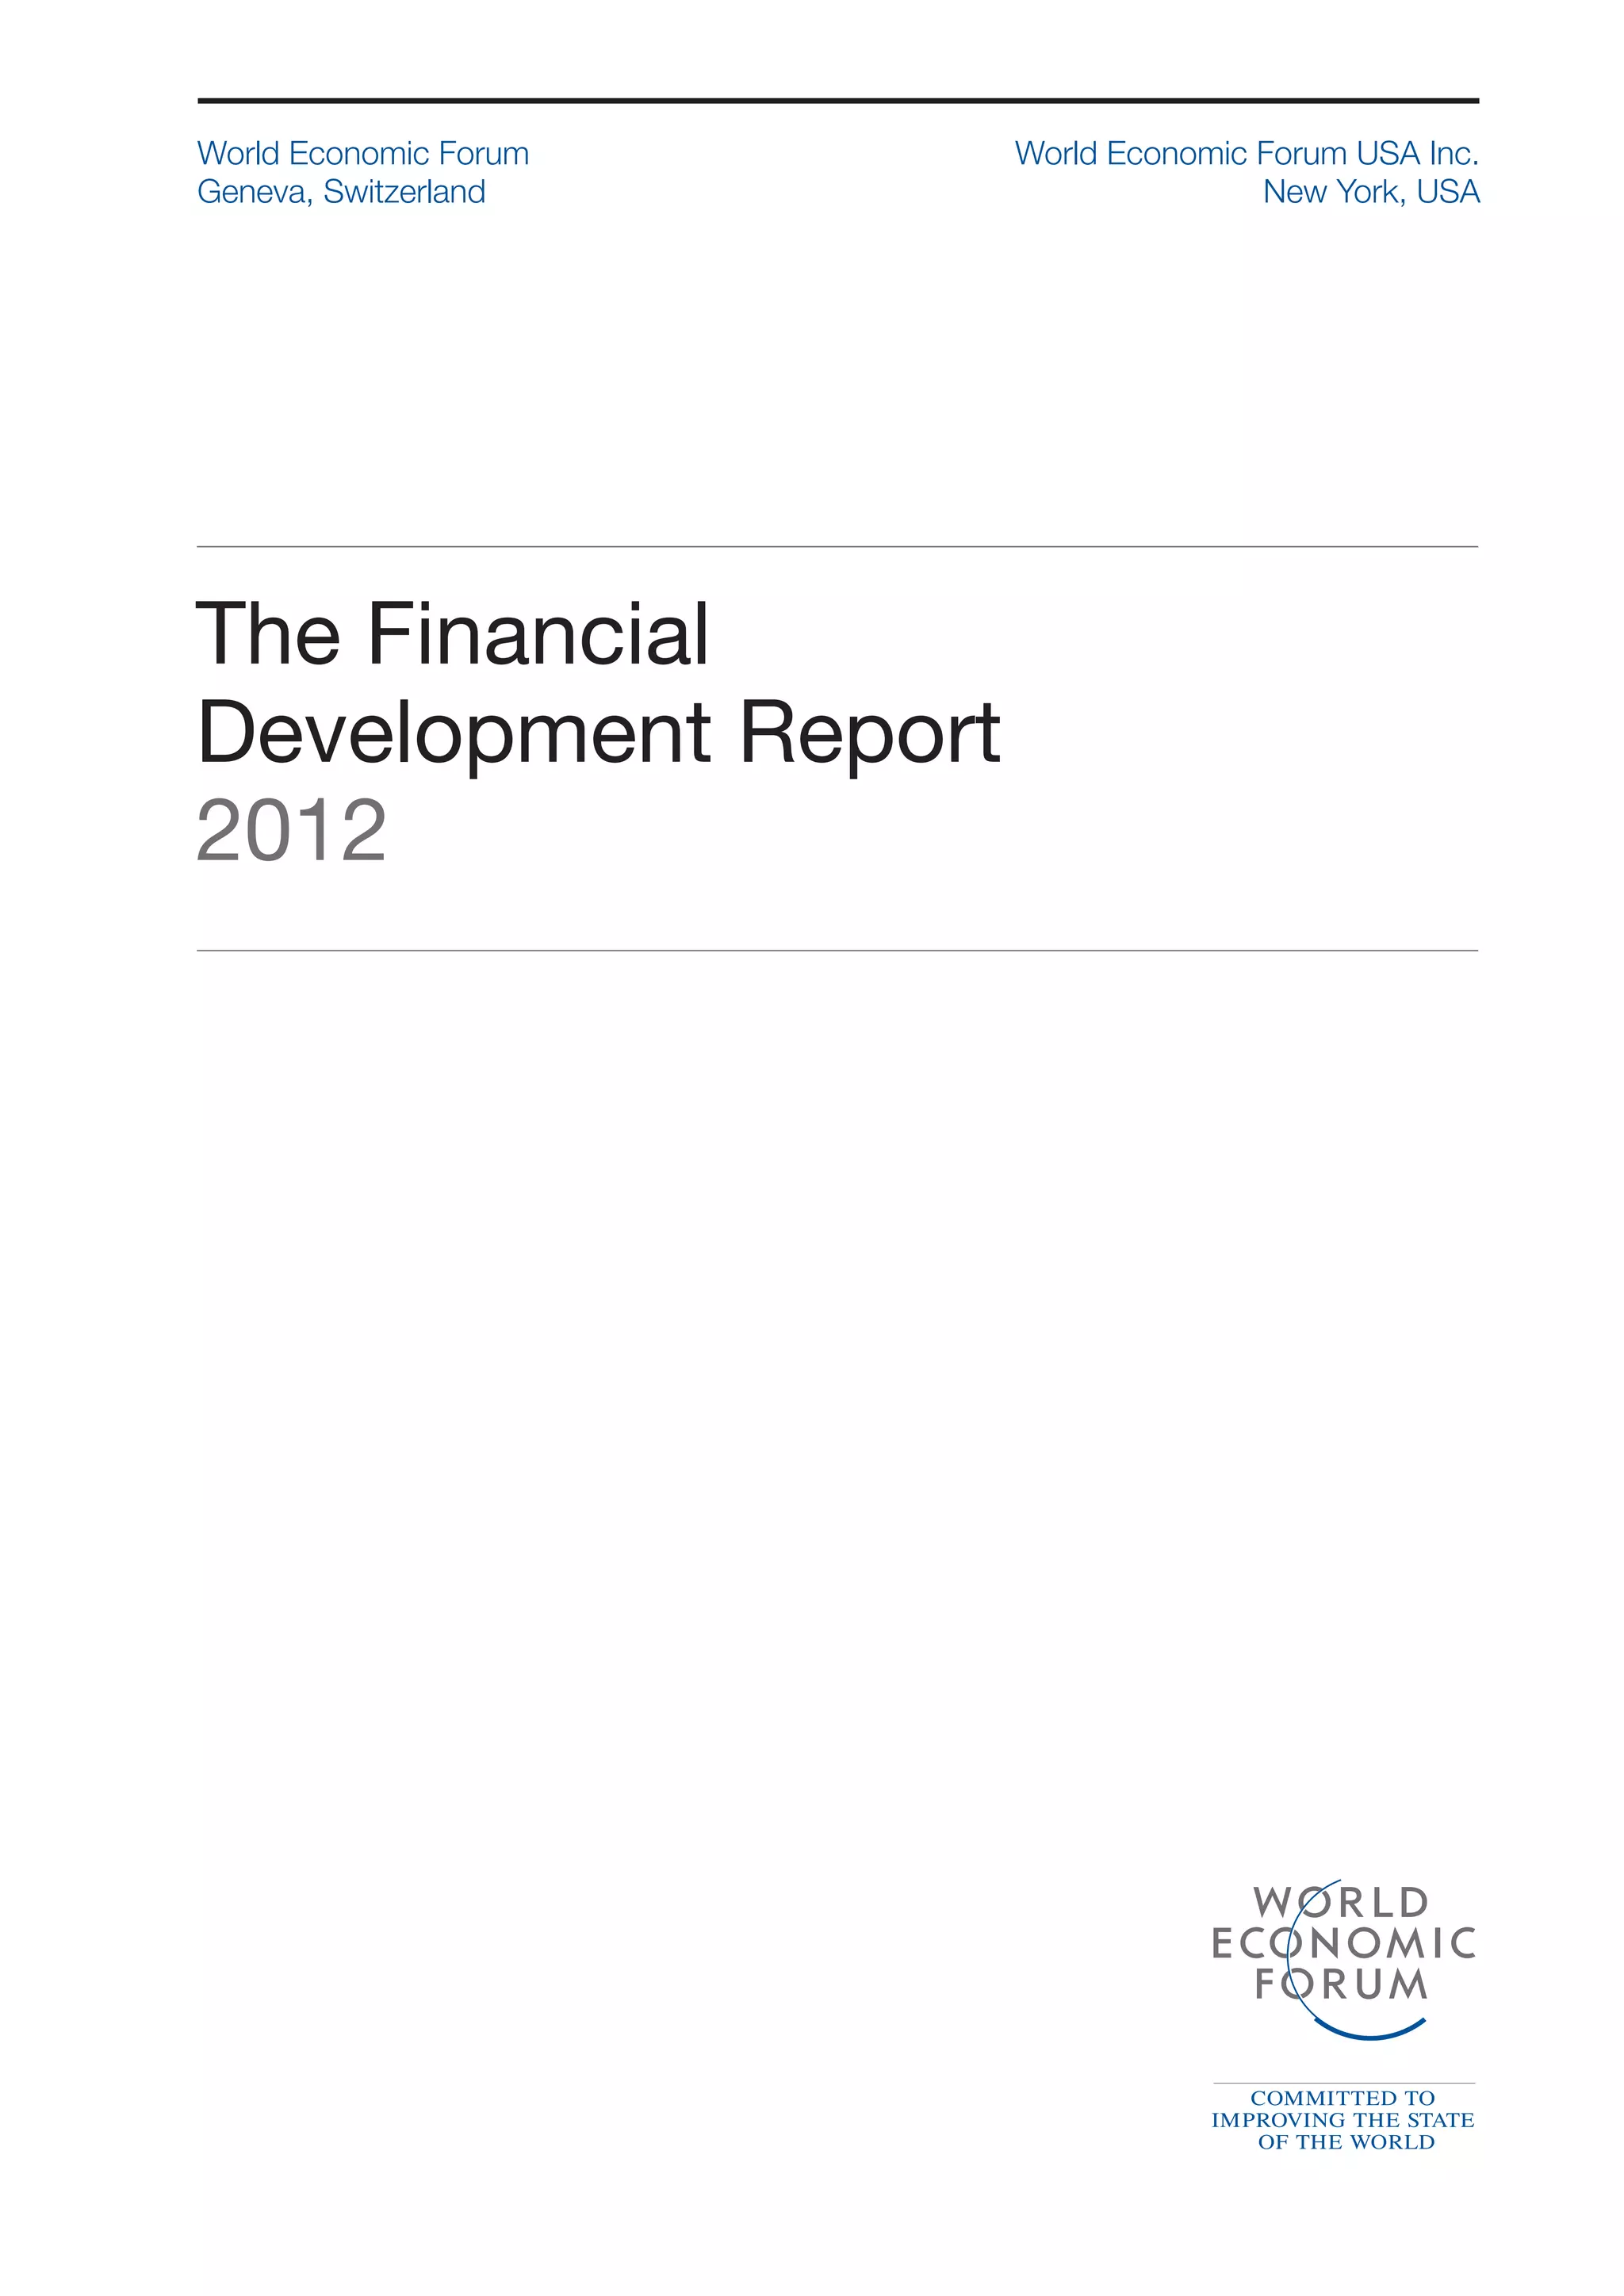
suffered on wholesale global banking activities, as depicted if conducted outside the regulated banking system. The
in Figure 4. benefits of access to the safety net are also to be evaluated
against the associated moral hazard, which leads to socially
inefficient risk taking, to the extent that it cannot be controlled
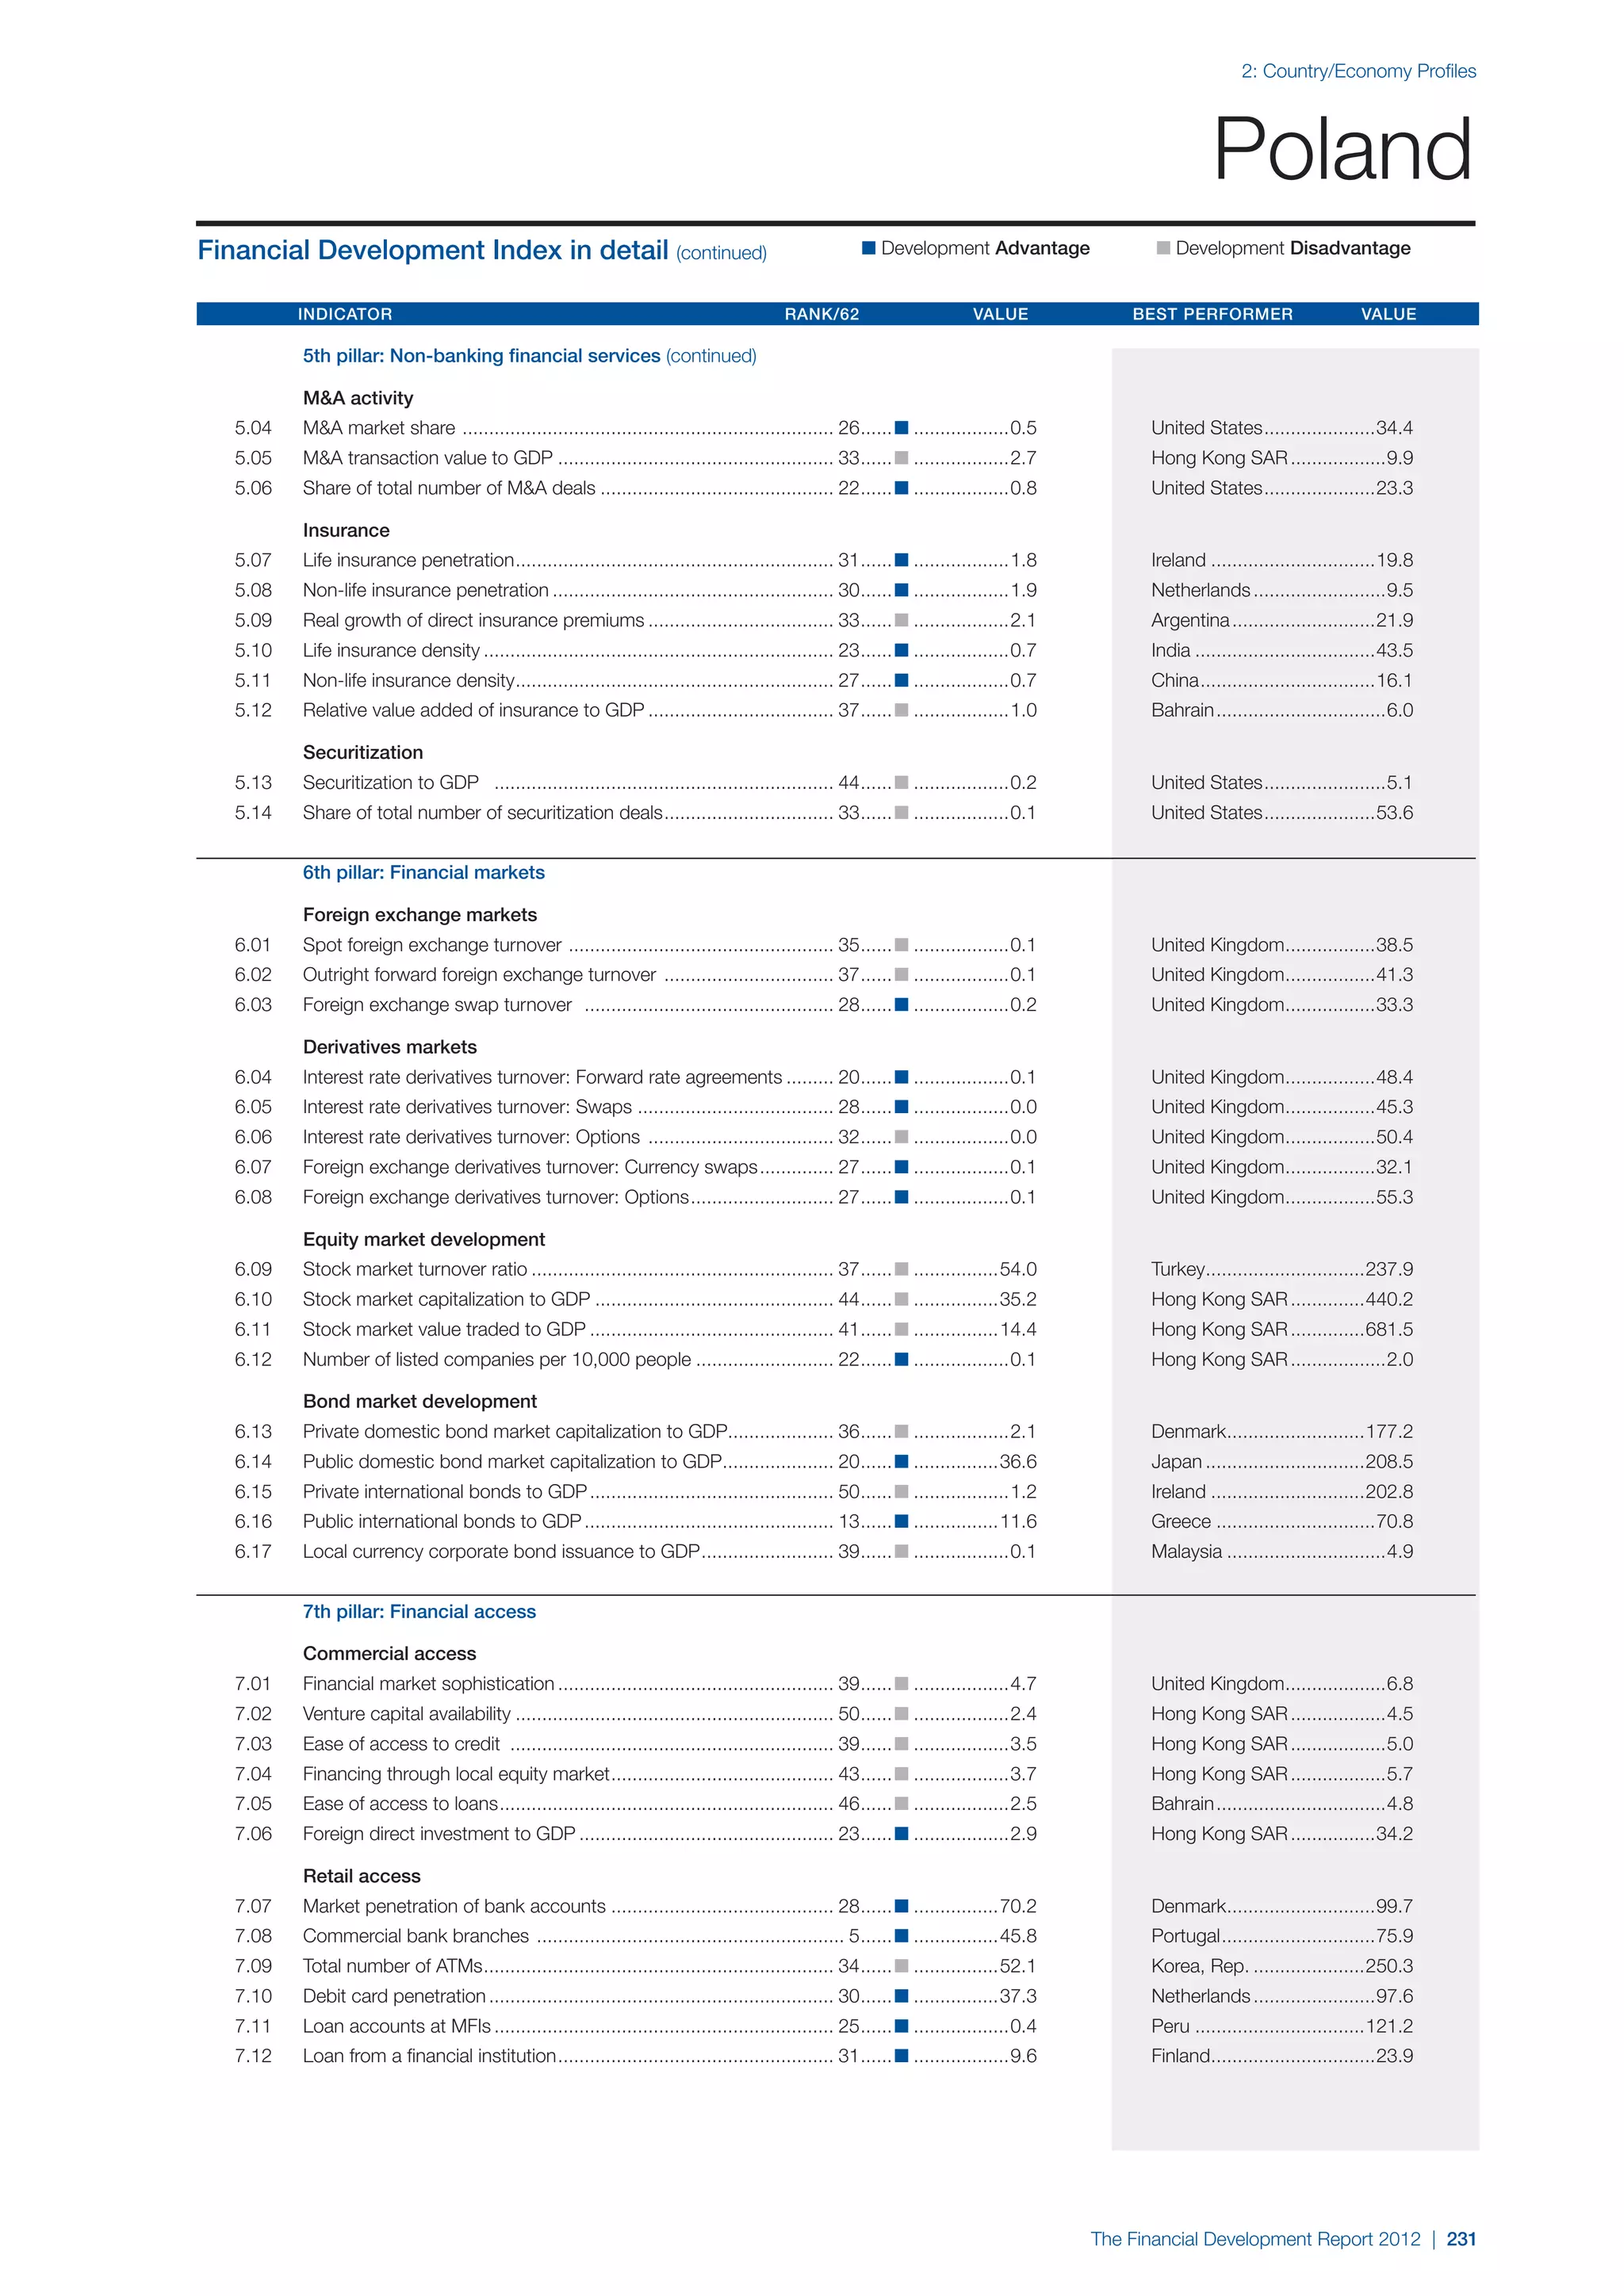
Figure 4: Ring-fencing within the boundary of by other regulation.
a universal banking system
There can be more than a single monolithic safety net, as
with the ring-fencing approach of the United Kingdom. Even
Maturity Transformation
more surgical approaches to safety nets include regulated
categories of special-purpose narrow banks25 or a market for
access to emergency liquidity.26
Underwriting
Payments and
The regulation of activities by banks clearly influences the
Brokerage and
Settlement
Market Making activities undertaken in the shadow banking system. The
activity limits and safety nets that apply inside and outside the
regulated banking environments should be coordinated.
Regulatory boundaries should also reflect any clear economies
Ring-fencing within or diseconomies of scope that may add to the costs and
a banking system
benefits of bundling financial services of various sorts within
the same enterprise. These economies affect both technical
operating costs and customer service quality and efficiency.
As with the Volcker Rule, ring-fencing is easier to describe There are also diseconomies of scope associated with
in general terms than it will be to implement. For example, complexity, both for the management of financial institutions
some domestic commercial banking clients may wish to use and for their regulatory supervision.
derivatives to hedge business risks associated with interest
rates, commodities, or foreign exchange. It will be difficult in After a review of the available evidence, Pennacchi writes,
practice to know when clients are indeed obtaining commercial “There appears to be little or no benefits [sic] available from
hedging services or are actually routing demand for speculative traditional banks that could not be obtained in a carefully
positions through the “domestic side” of the bank in order to designed narrow bank financial system.”27 As to whether
have a safer counterparty. there are net efficiency gains associated with extending
traditional banks into universal banks, analysts reach mixed
or uncertain conclusions.28
44 | The Financial Development Report 2012](https://image.slidesharecdn.com/weffinancialdevelopmentreport2012-121108135403-phpapp01/75/World-Economic-Forum-The-Financial-Development-Report-2012-60-2048.jpg)
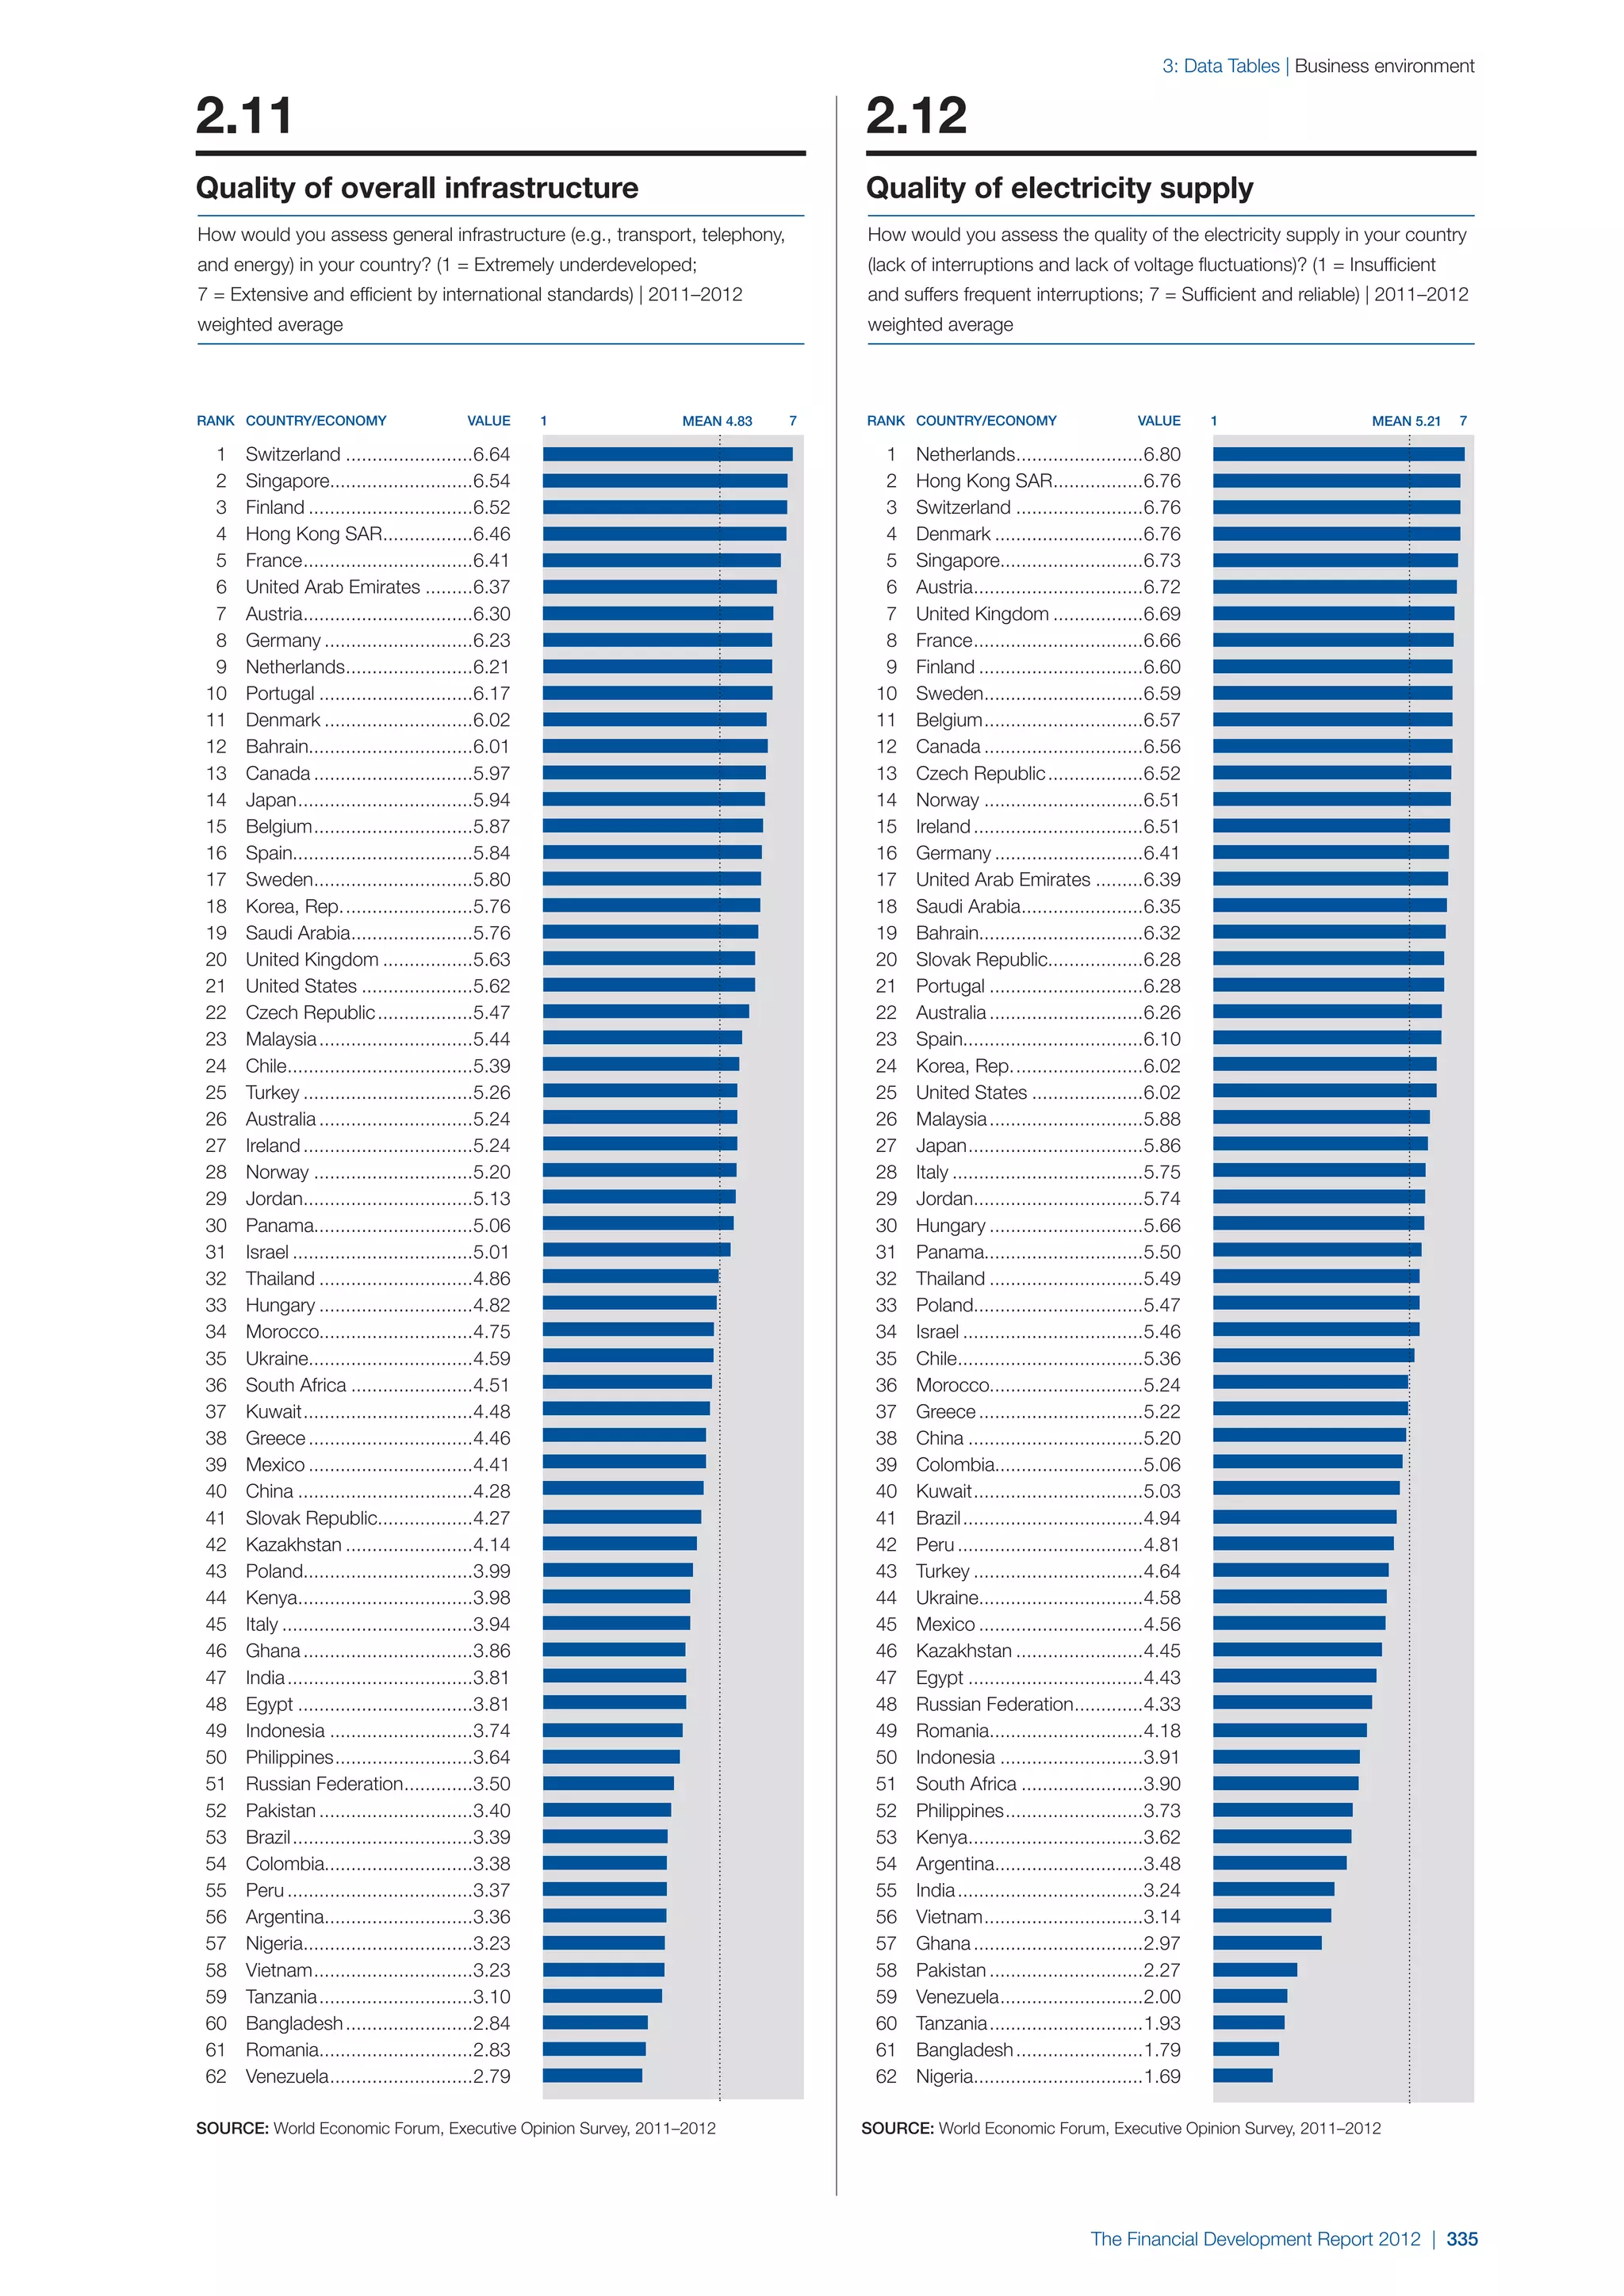
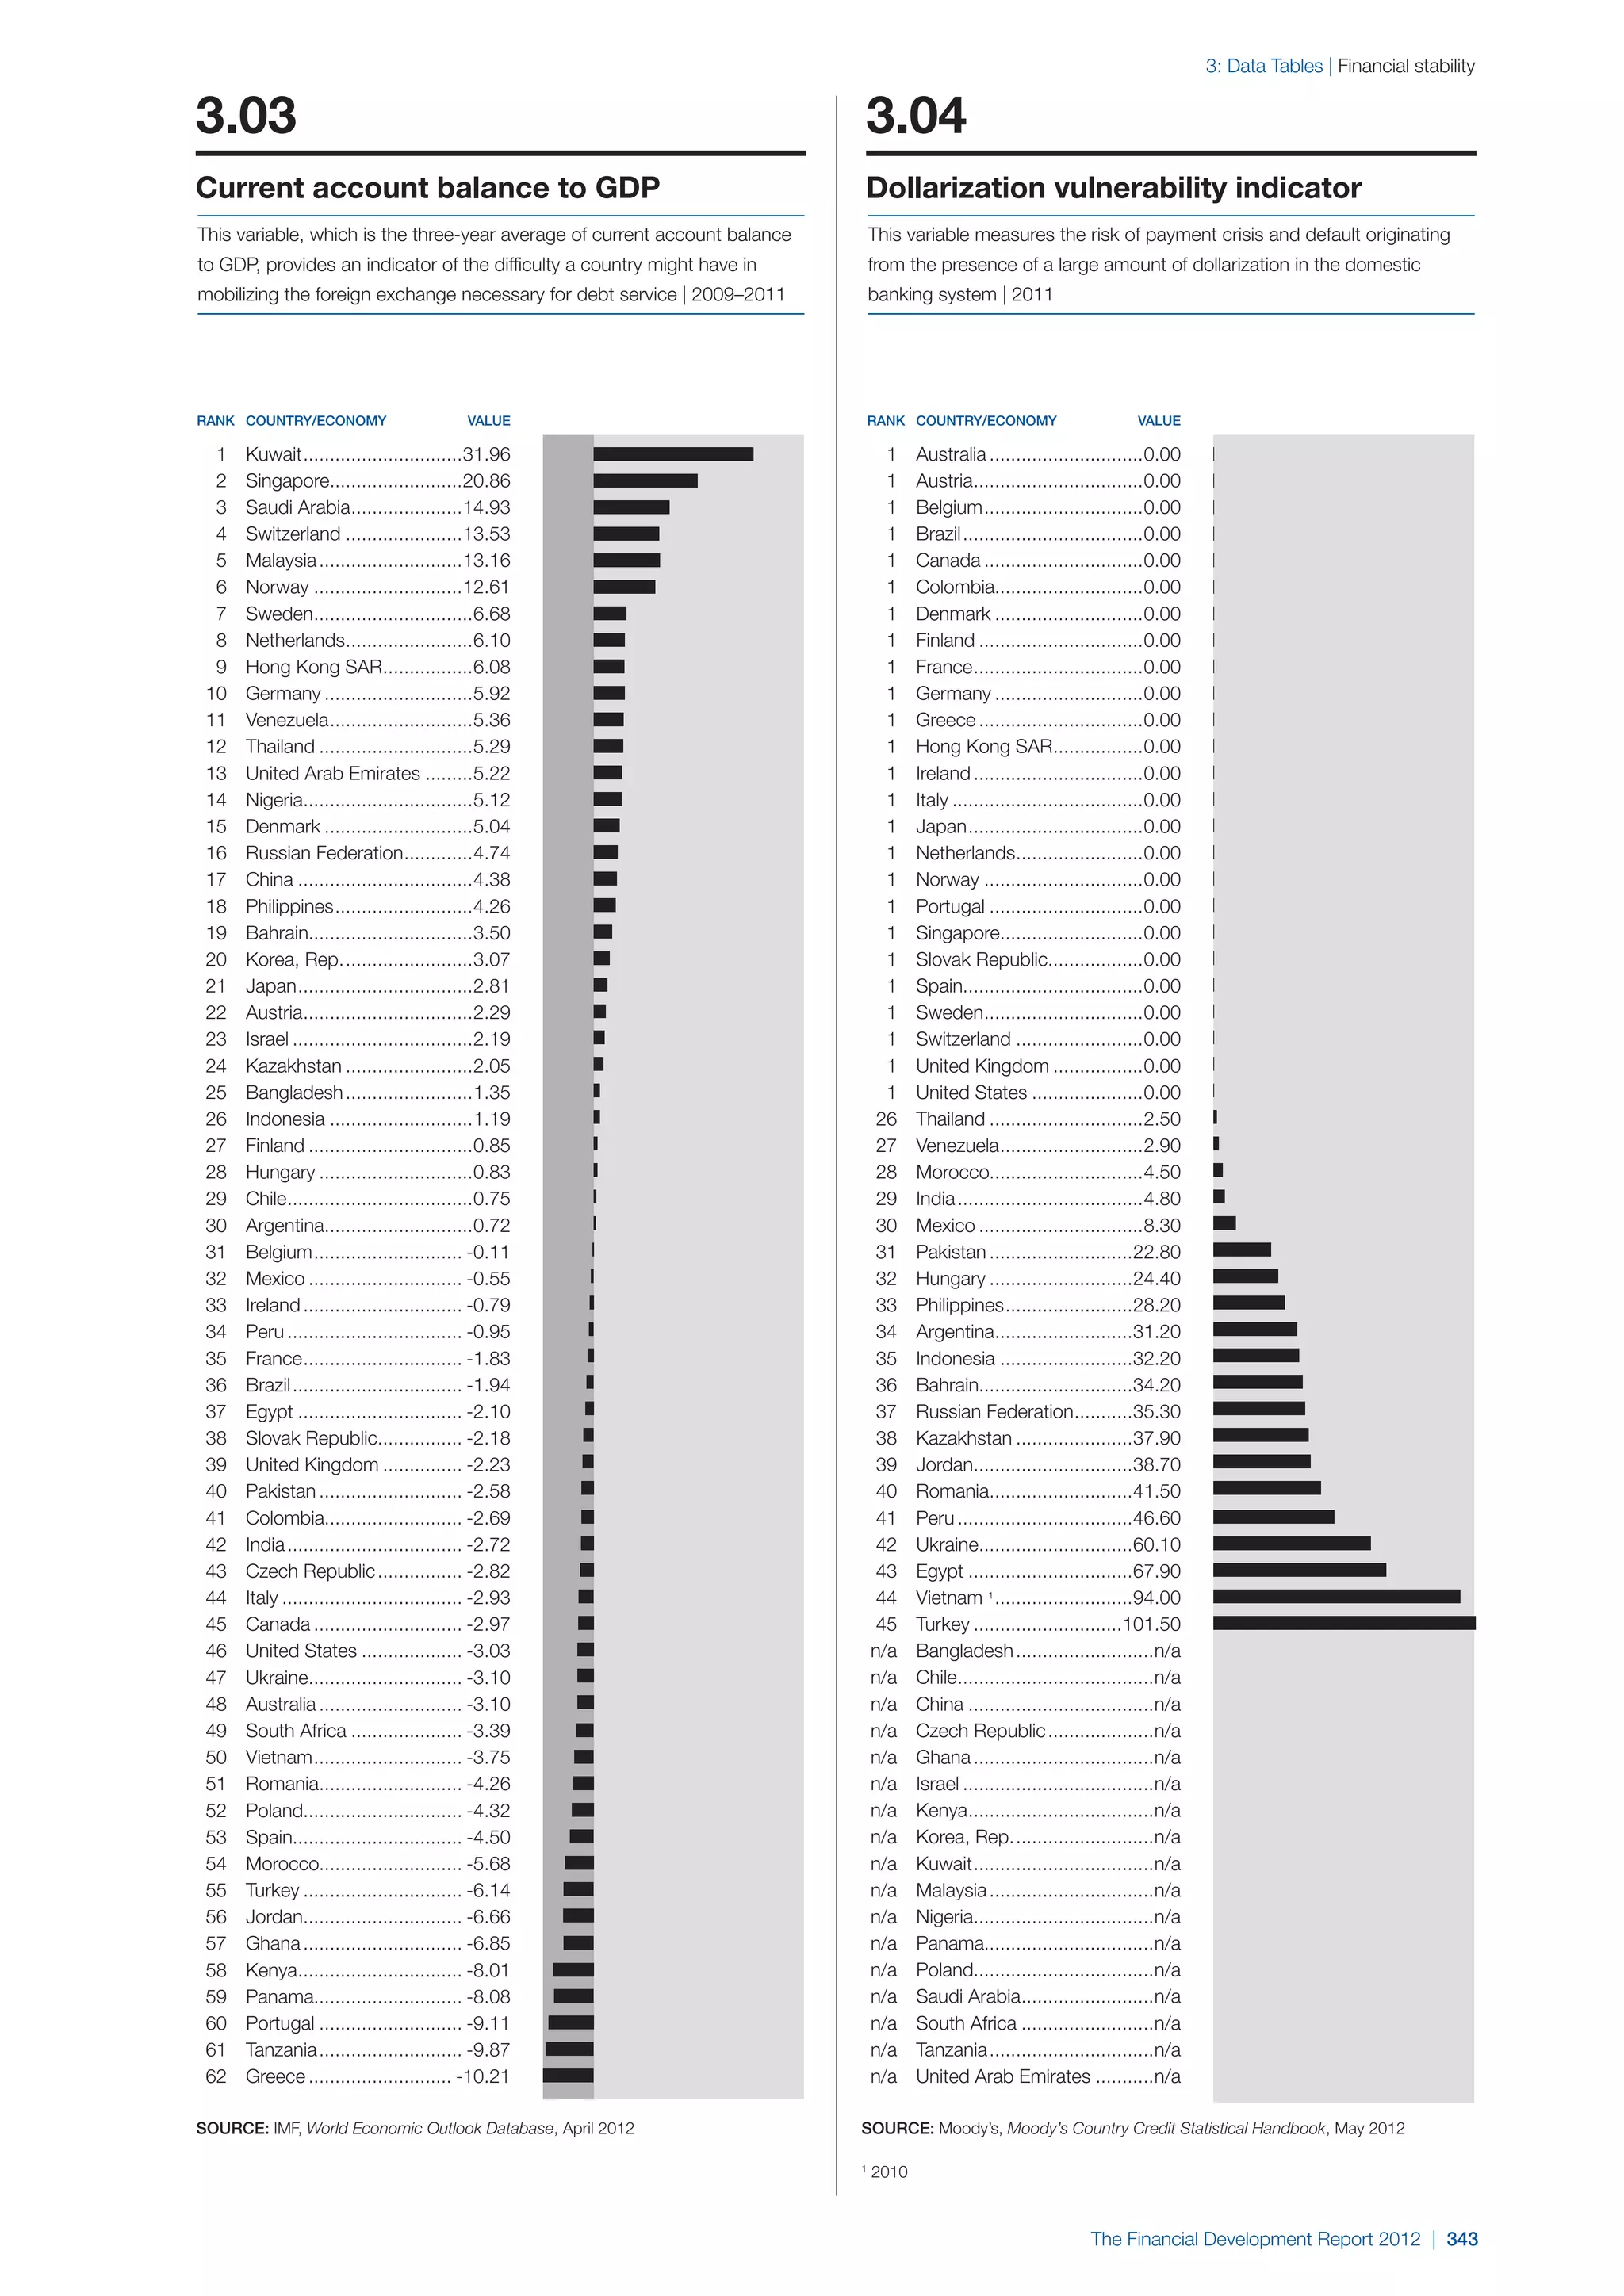
![1.3: Branching out: The Rise of Emerging Market Banks
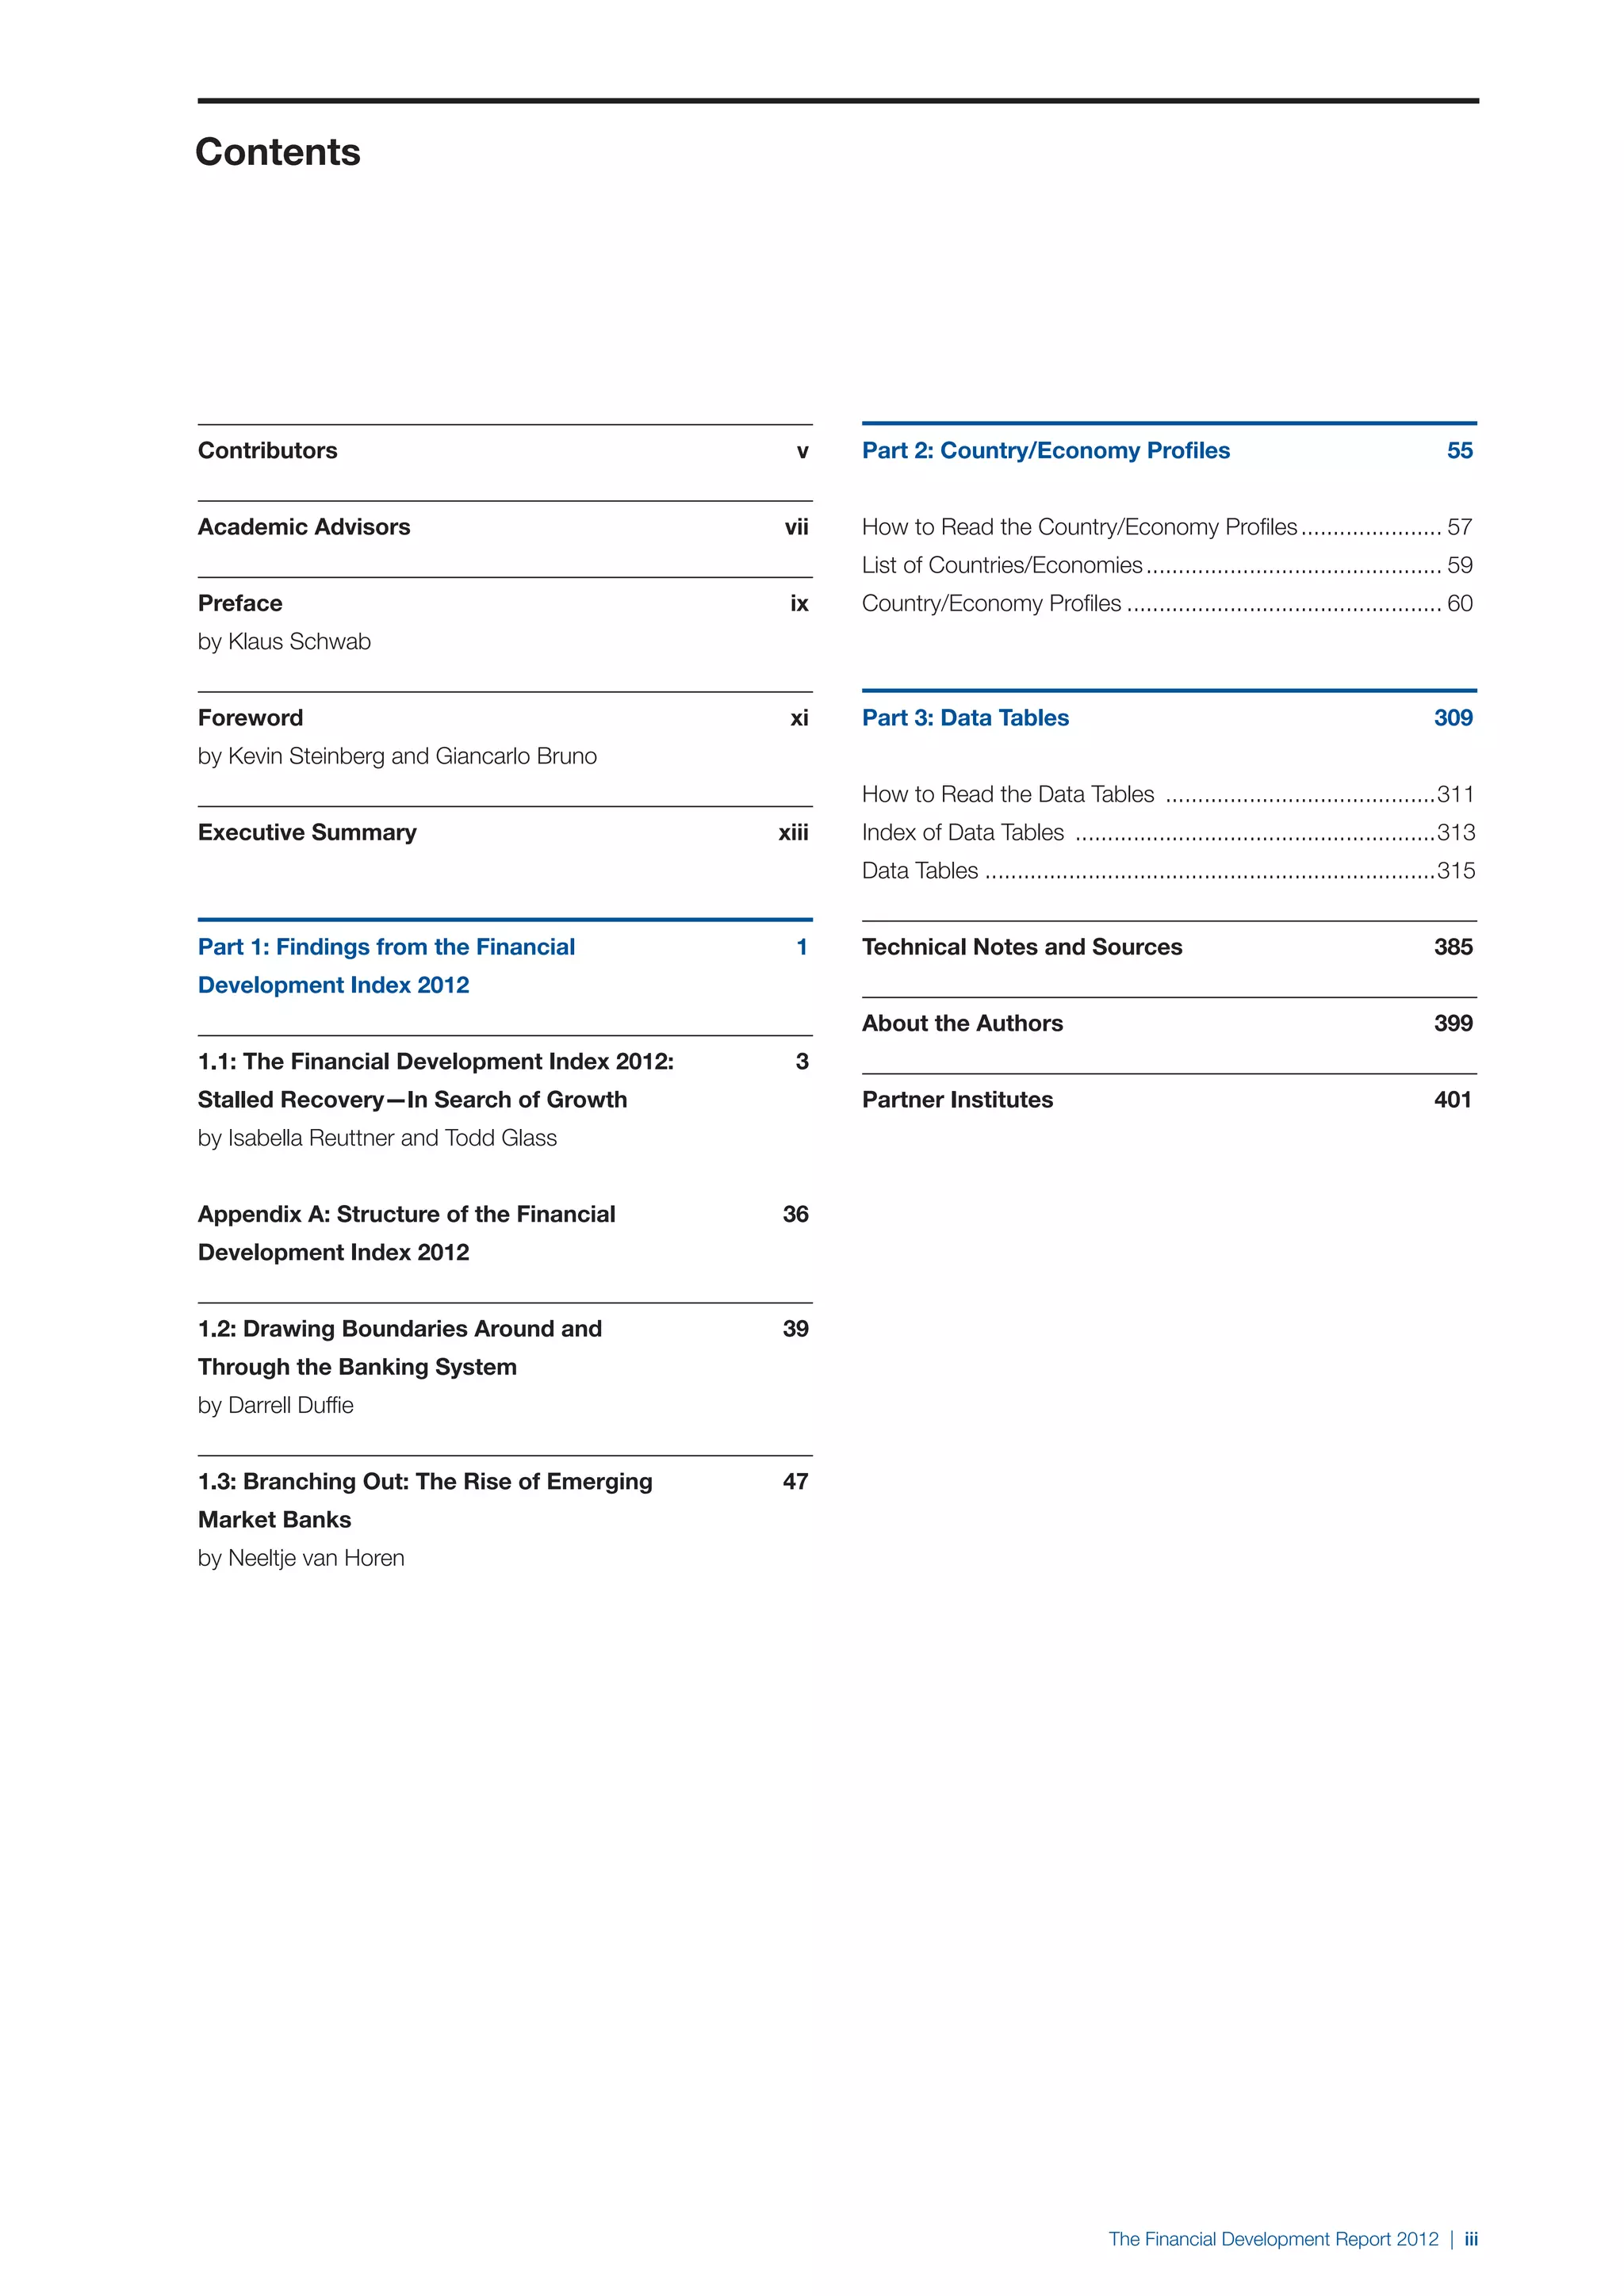
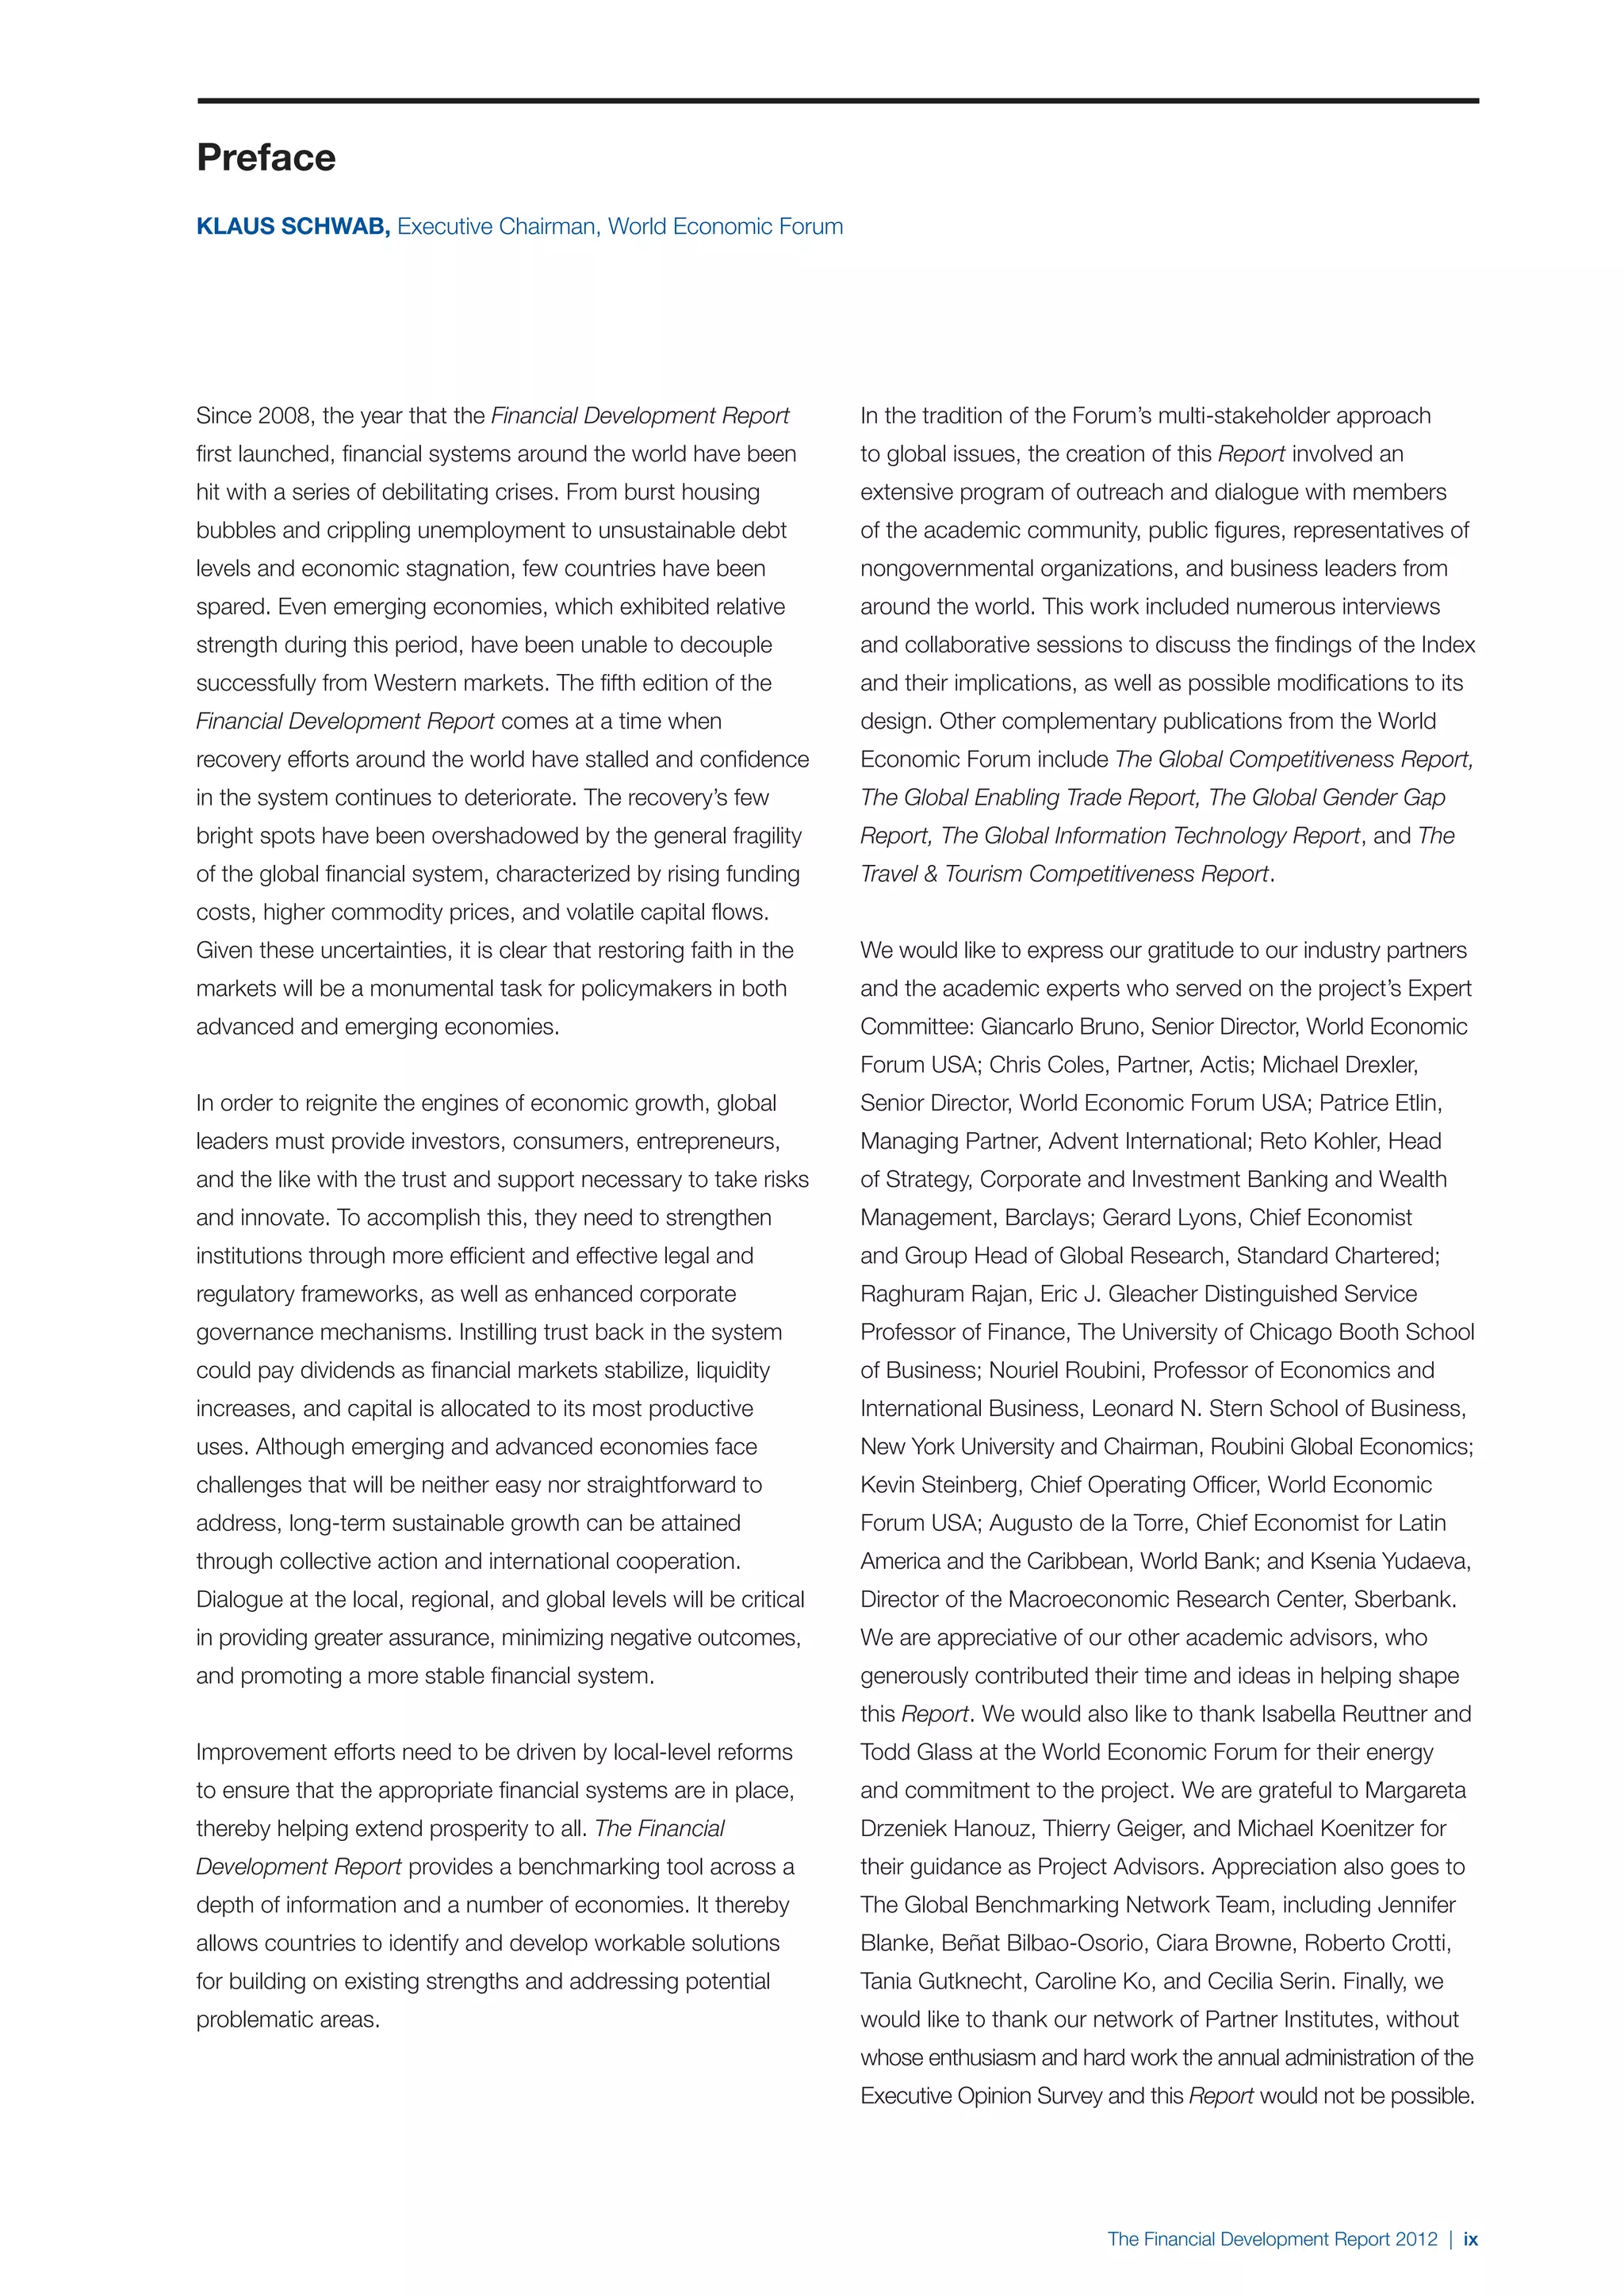
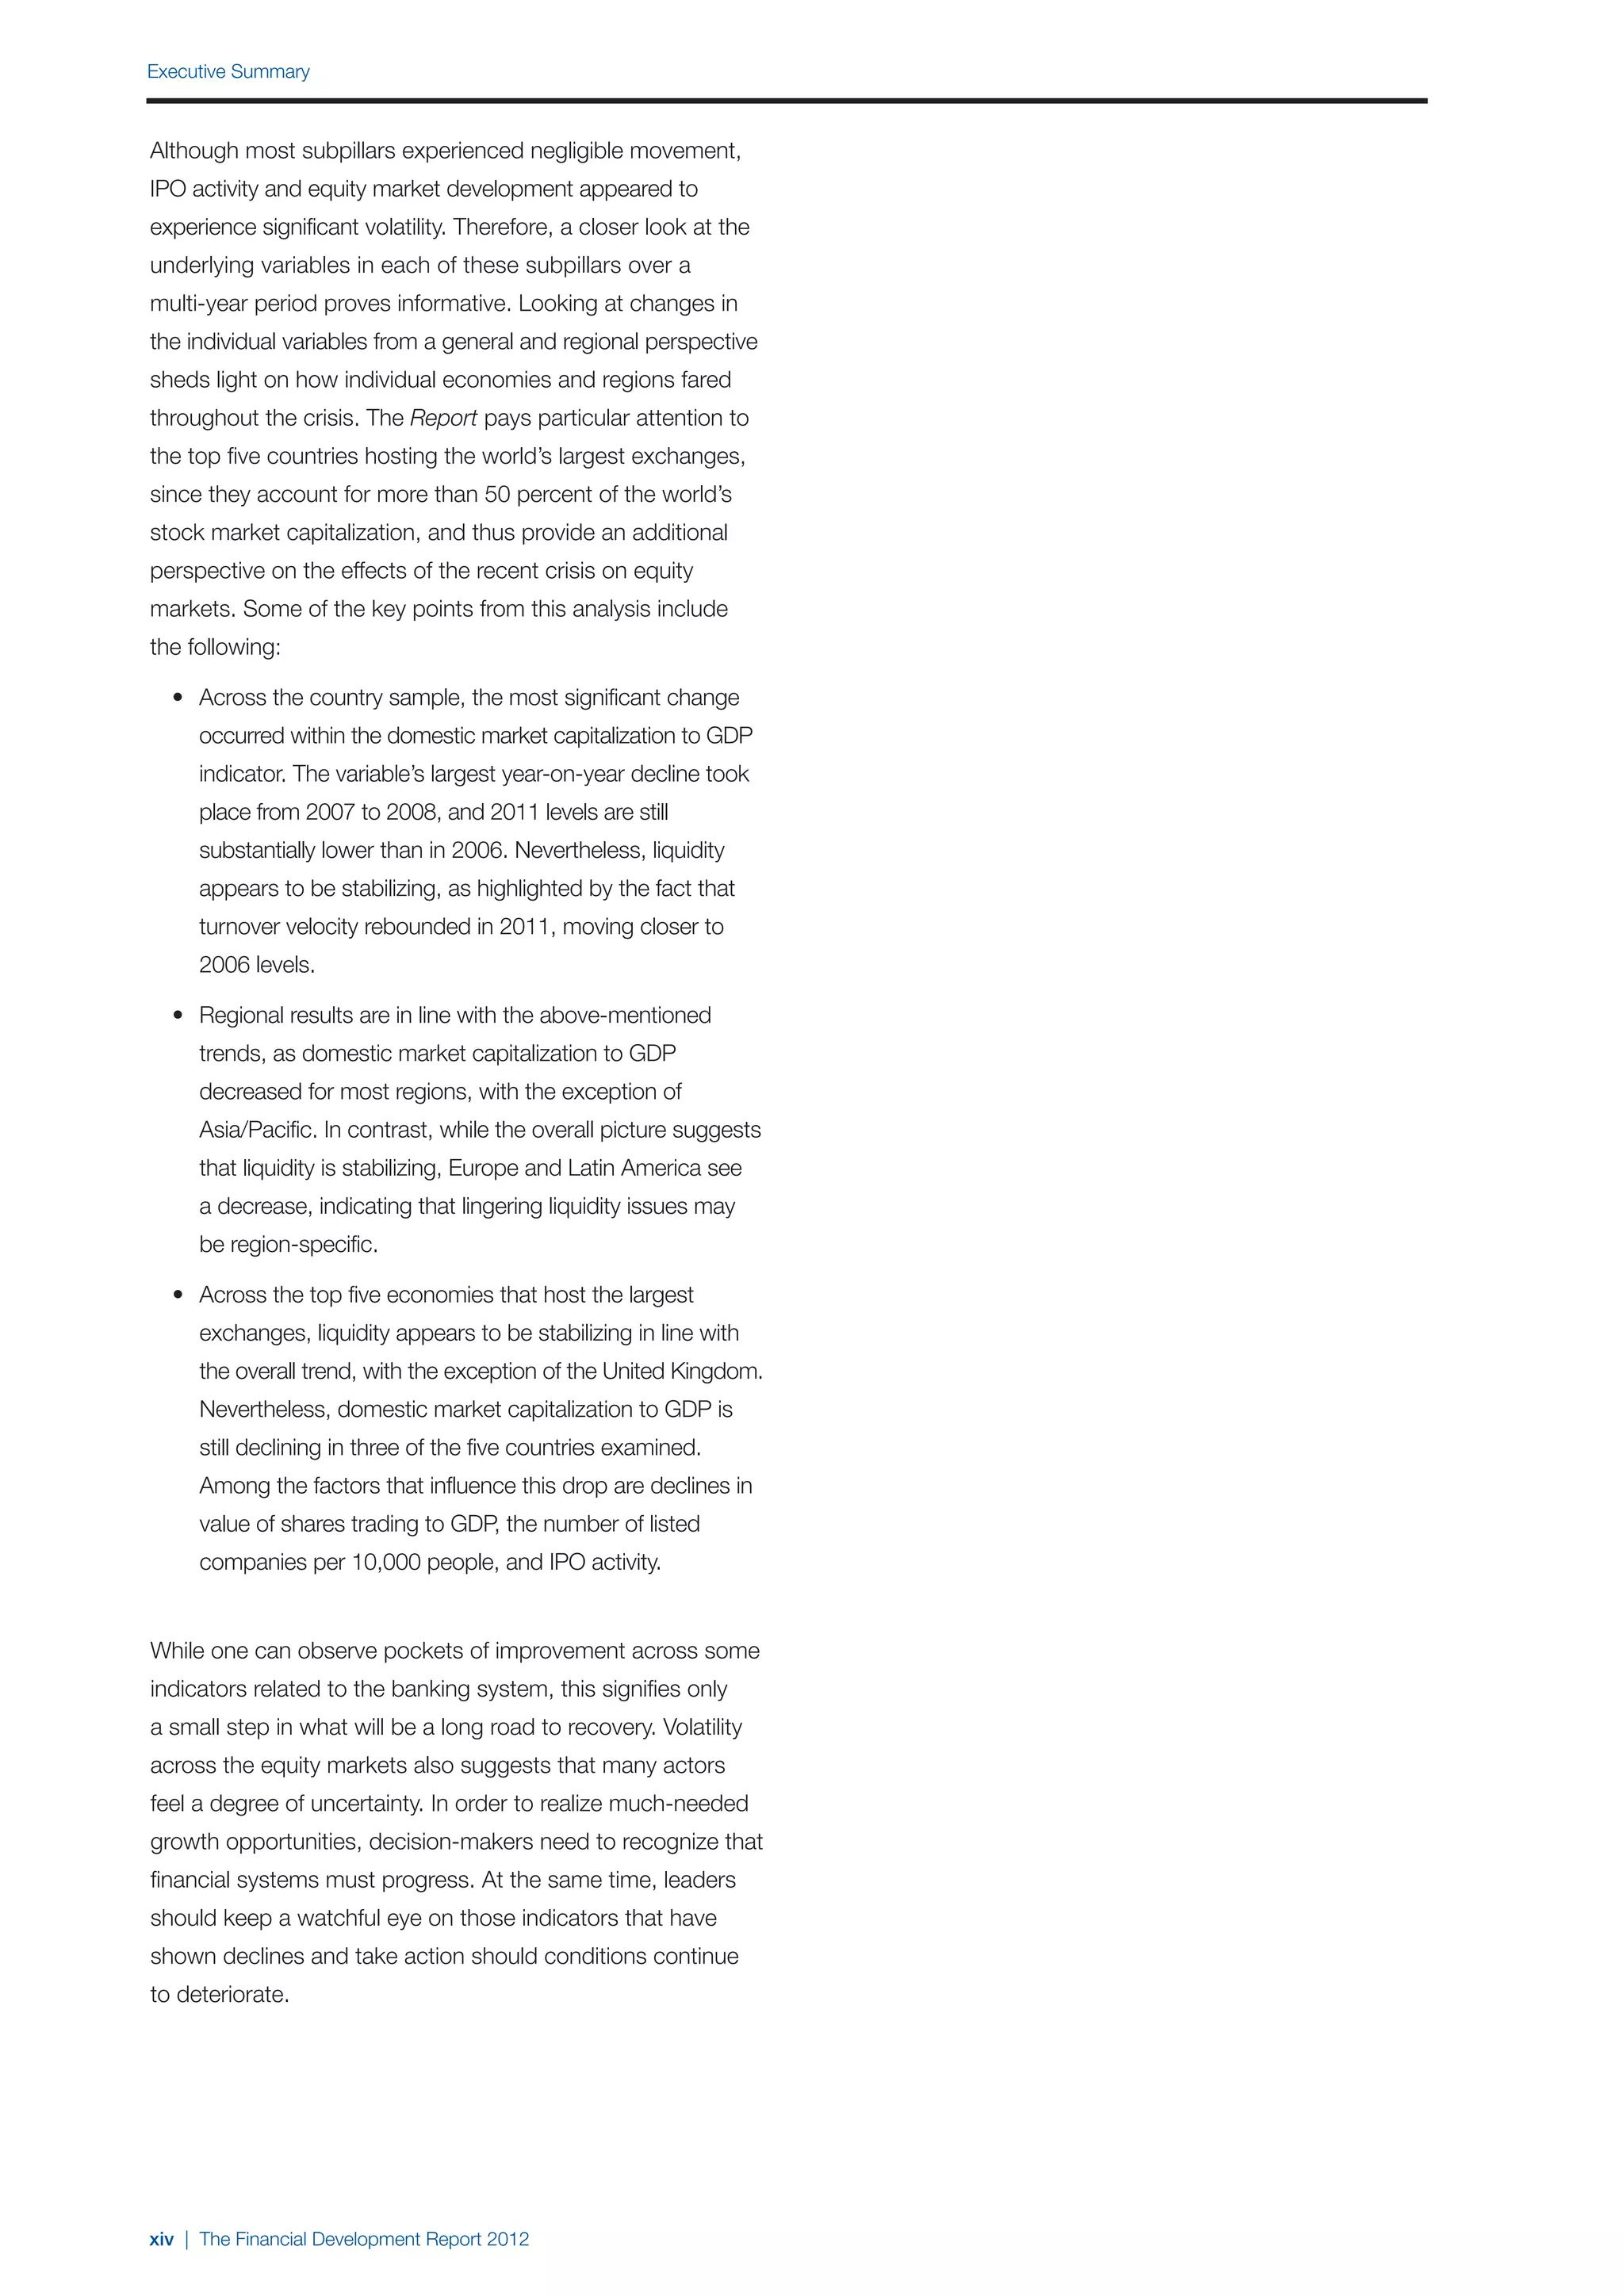
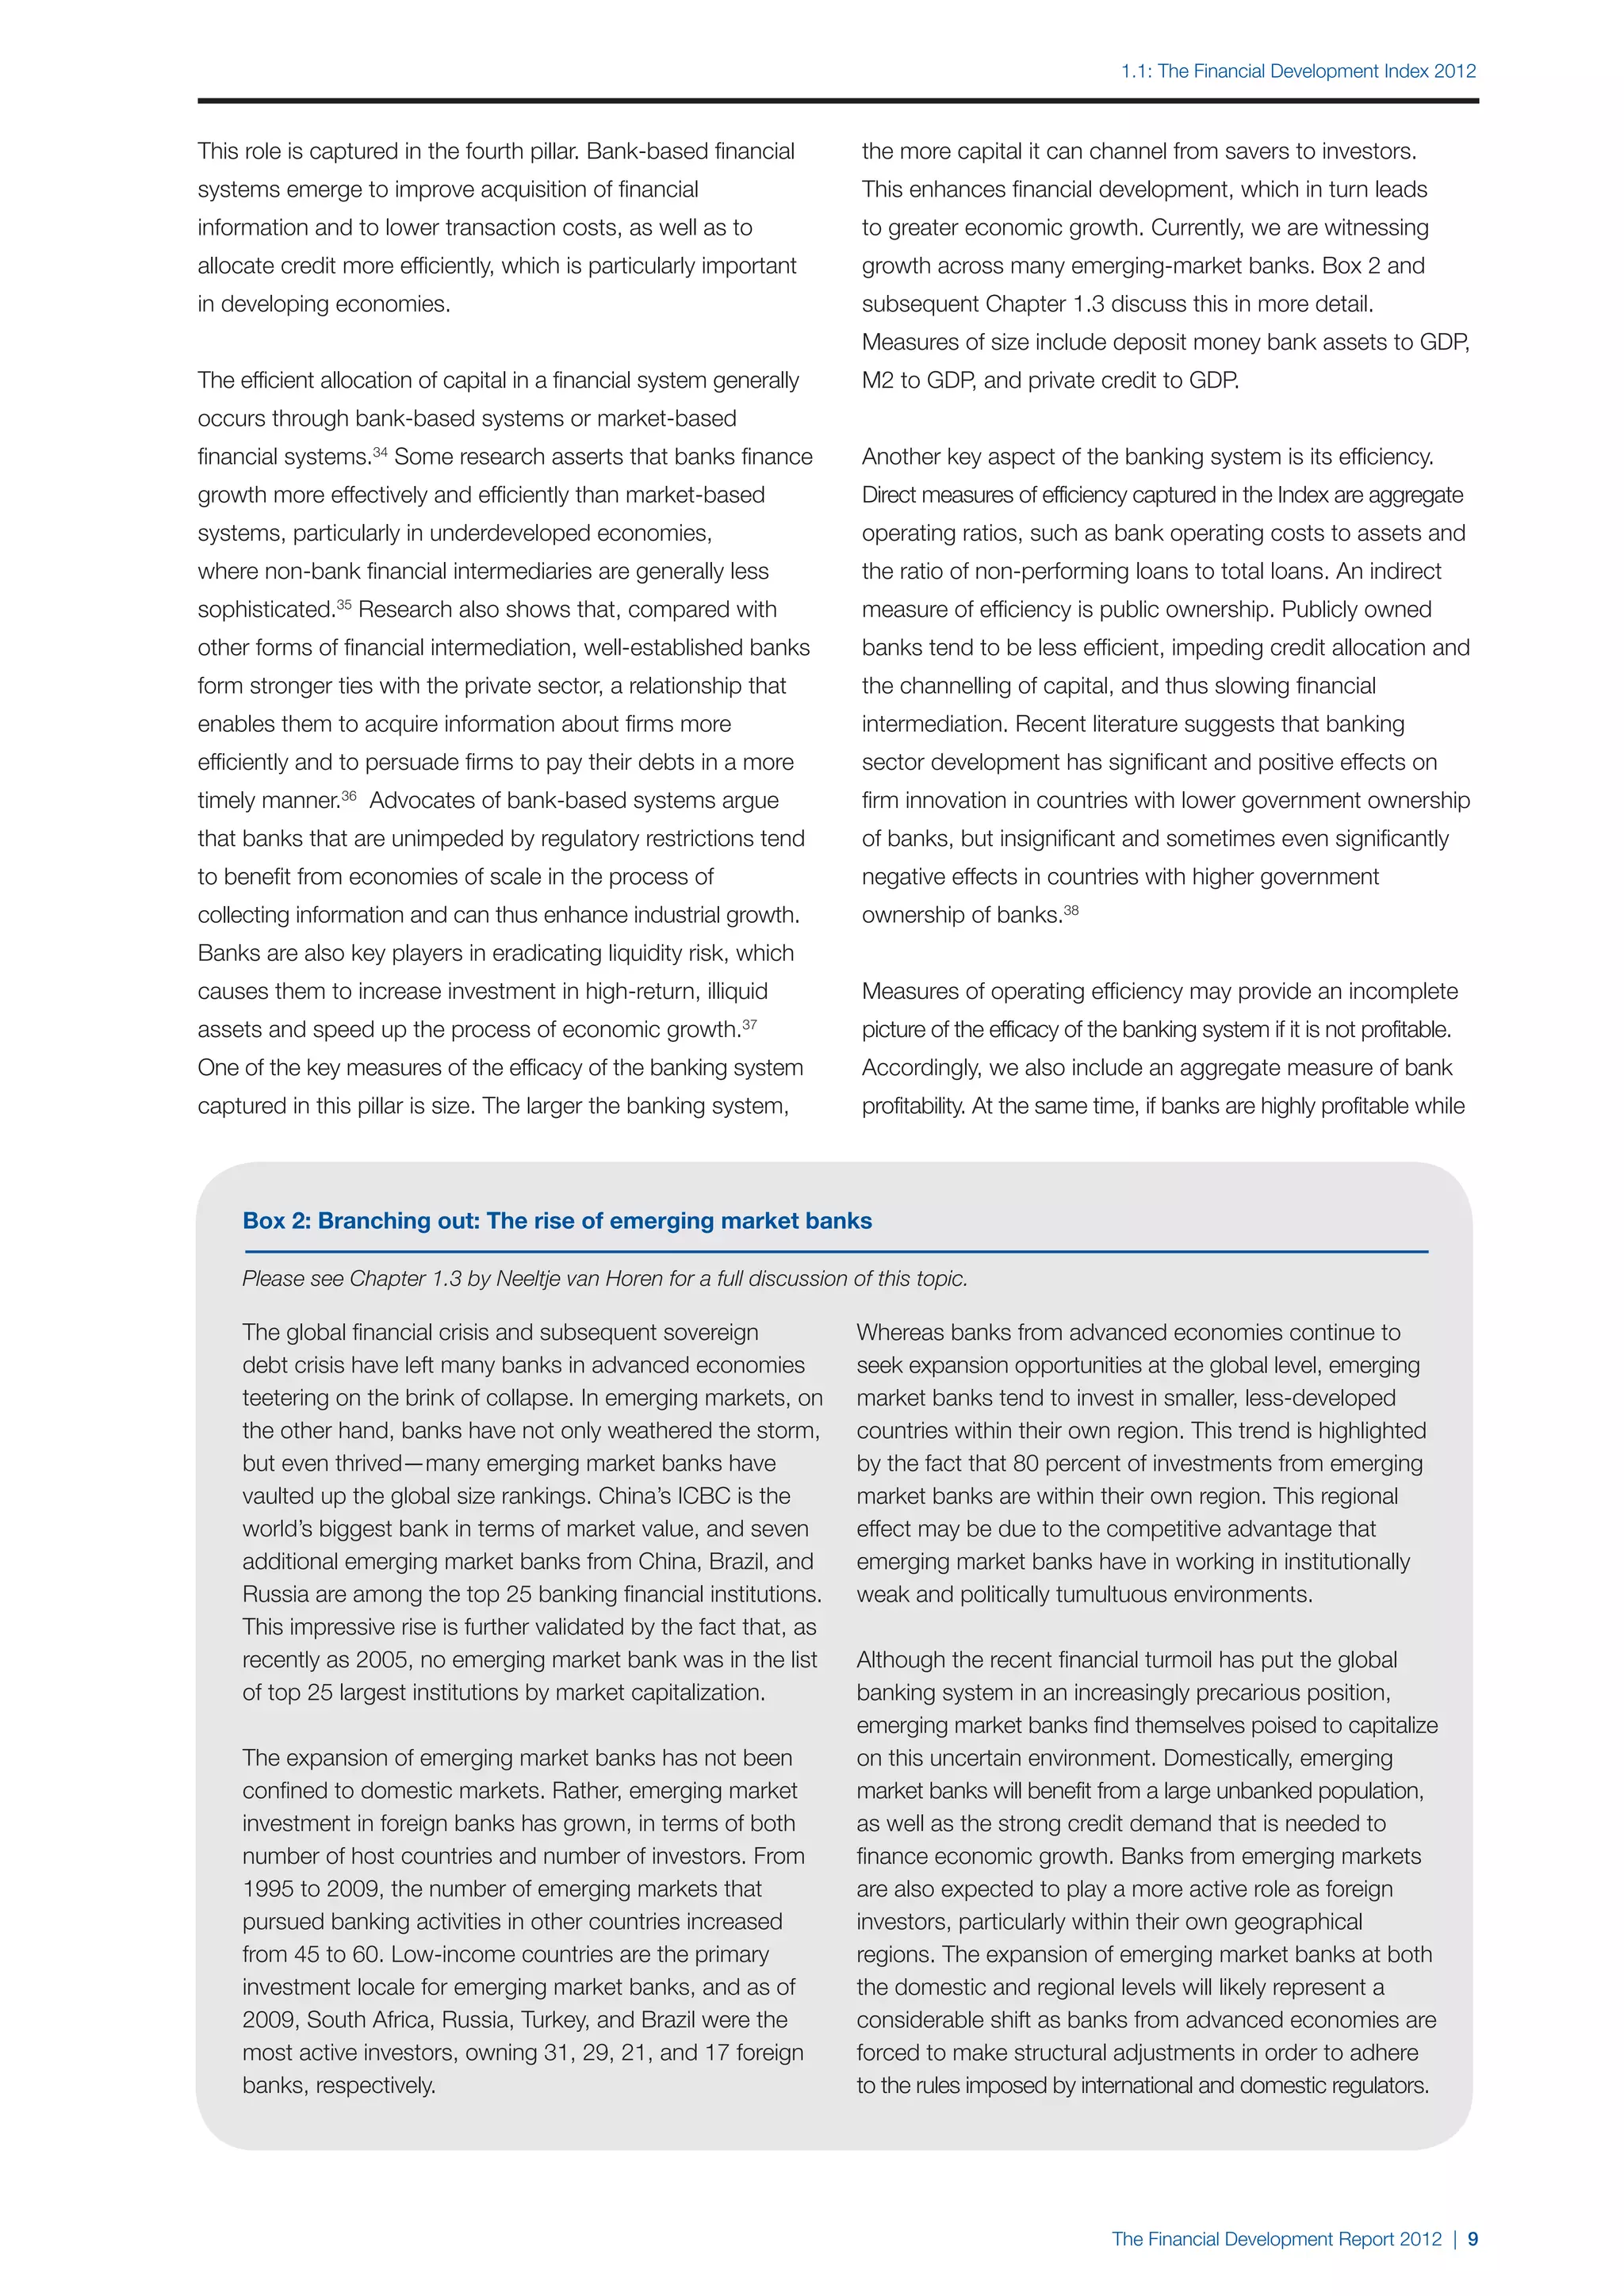
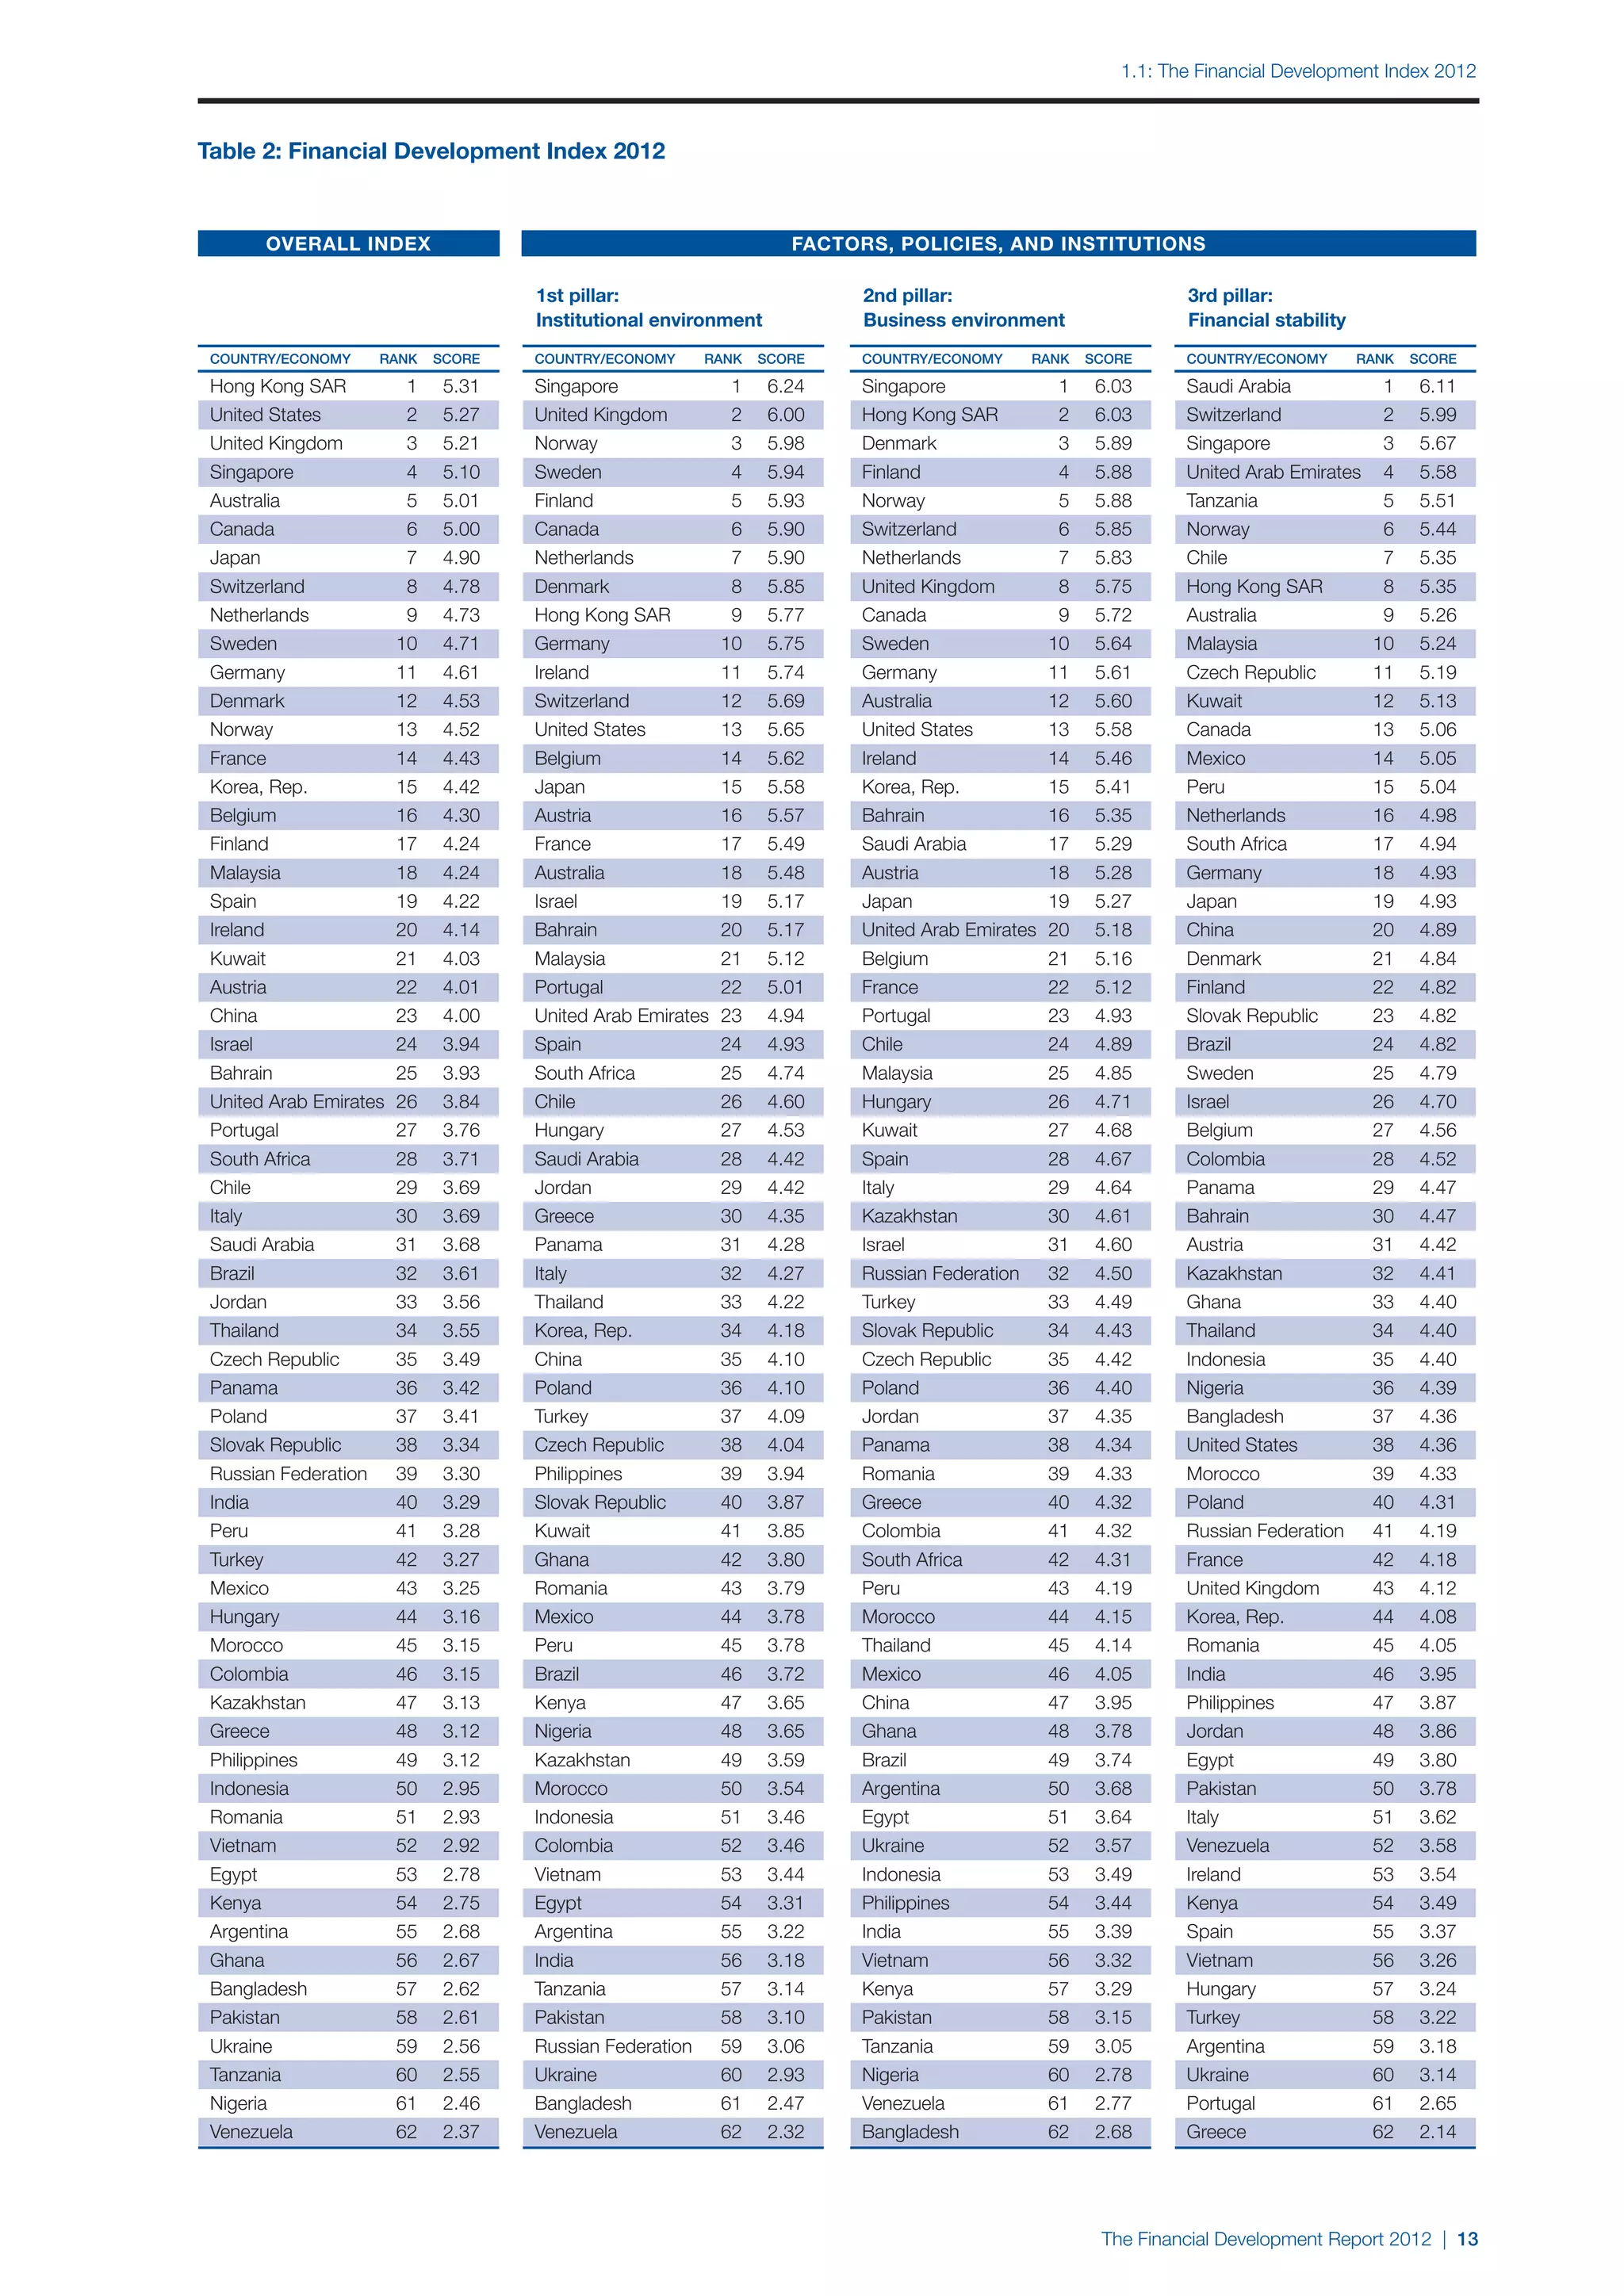
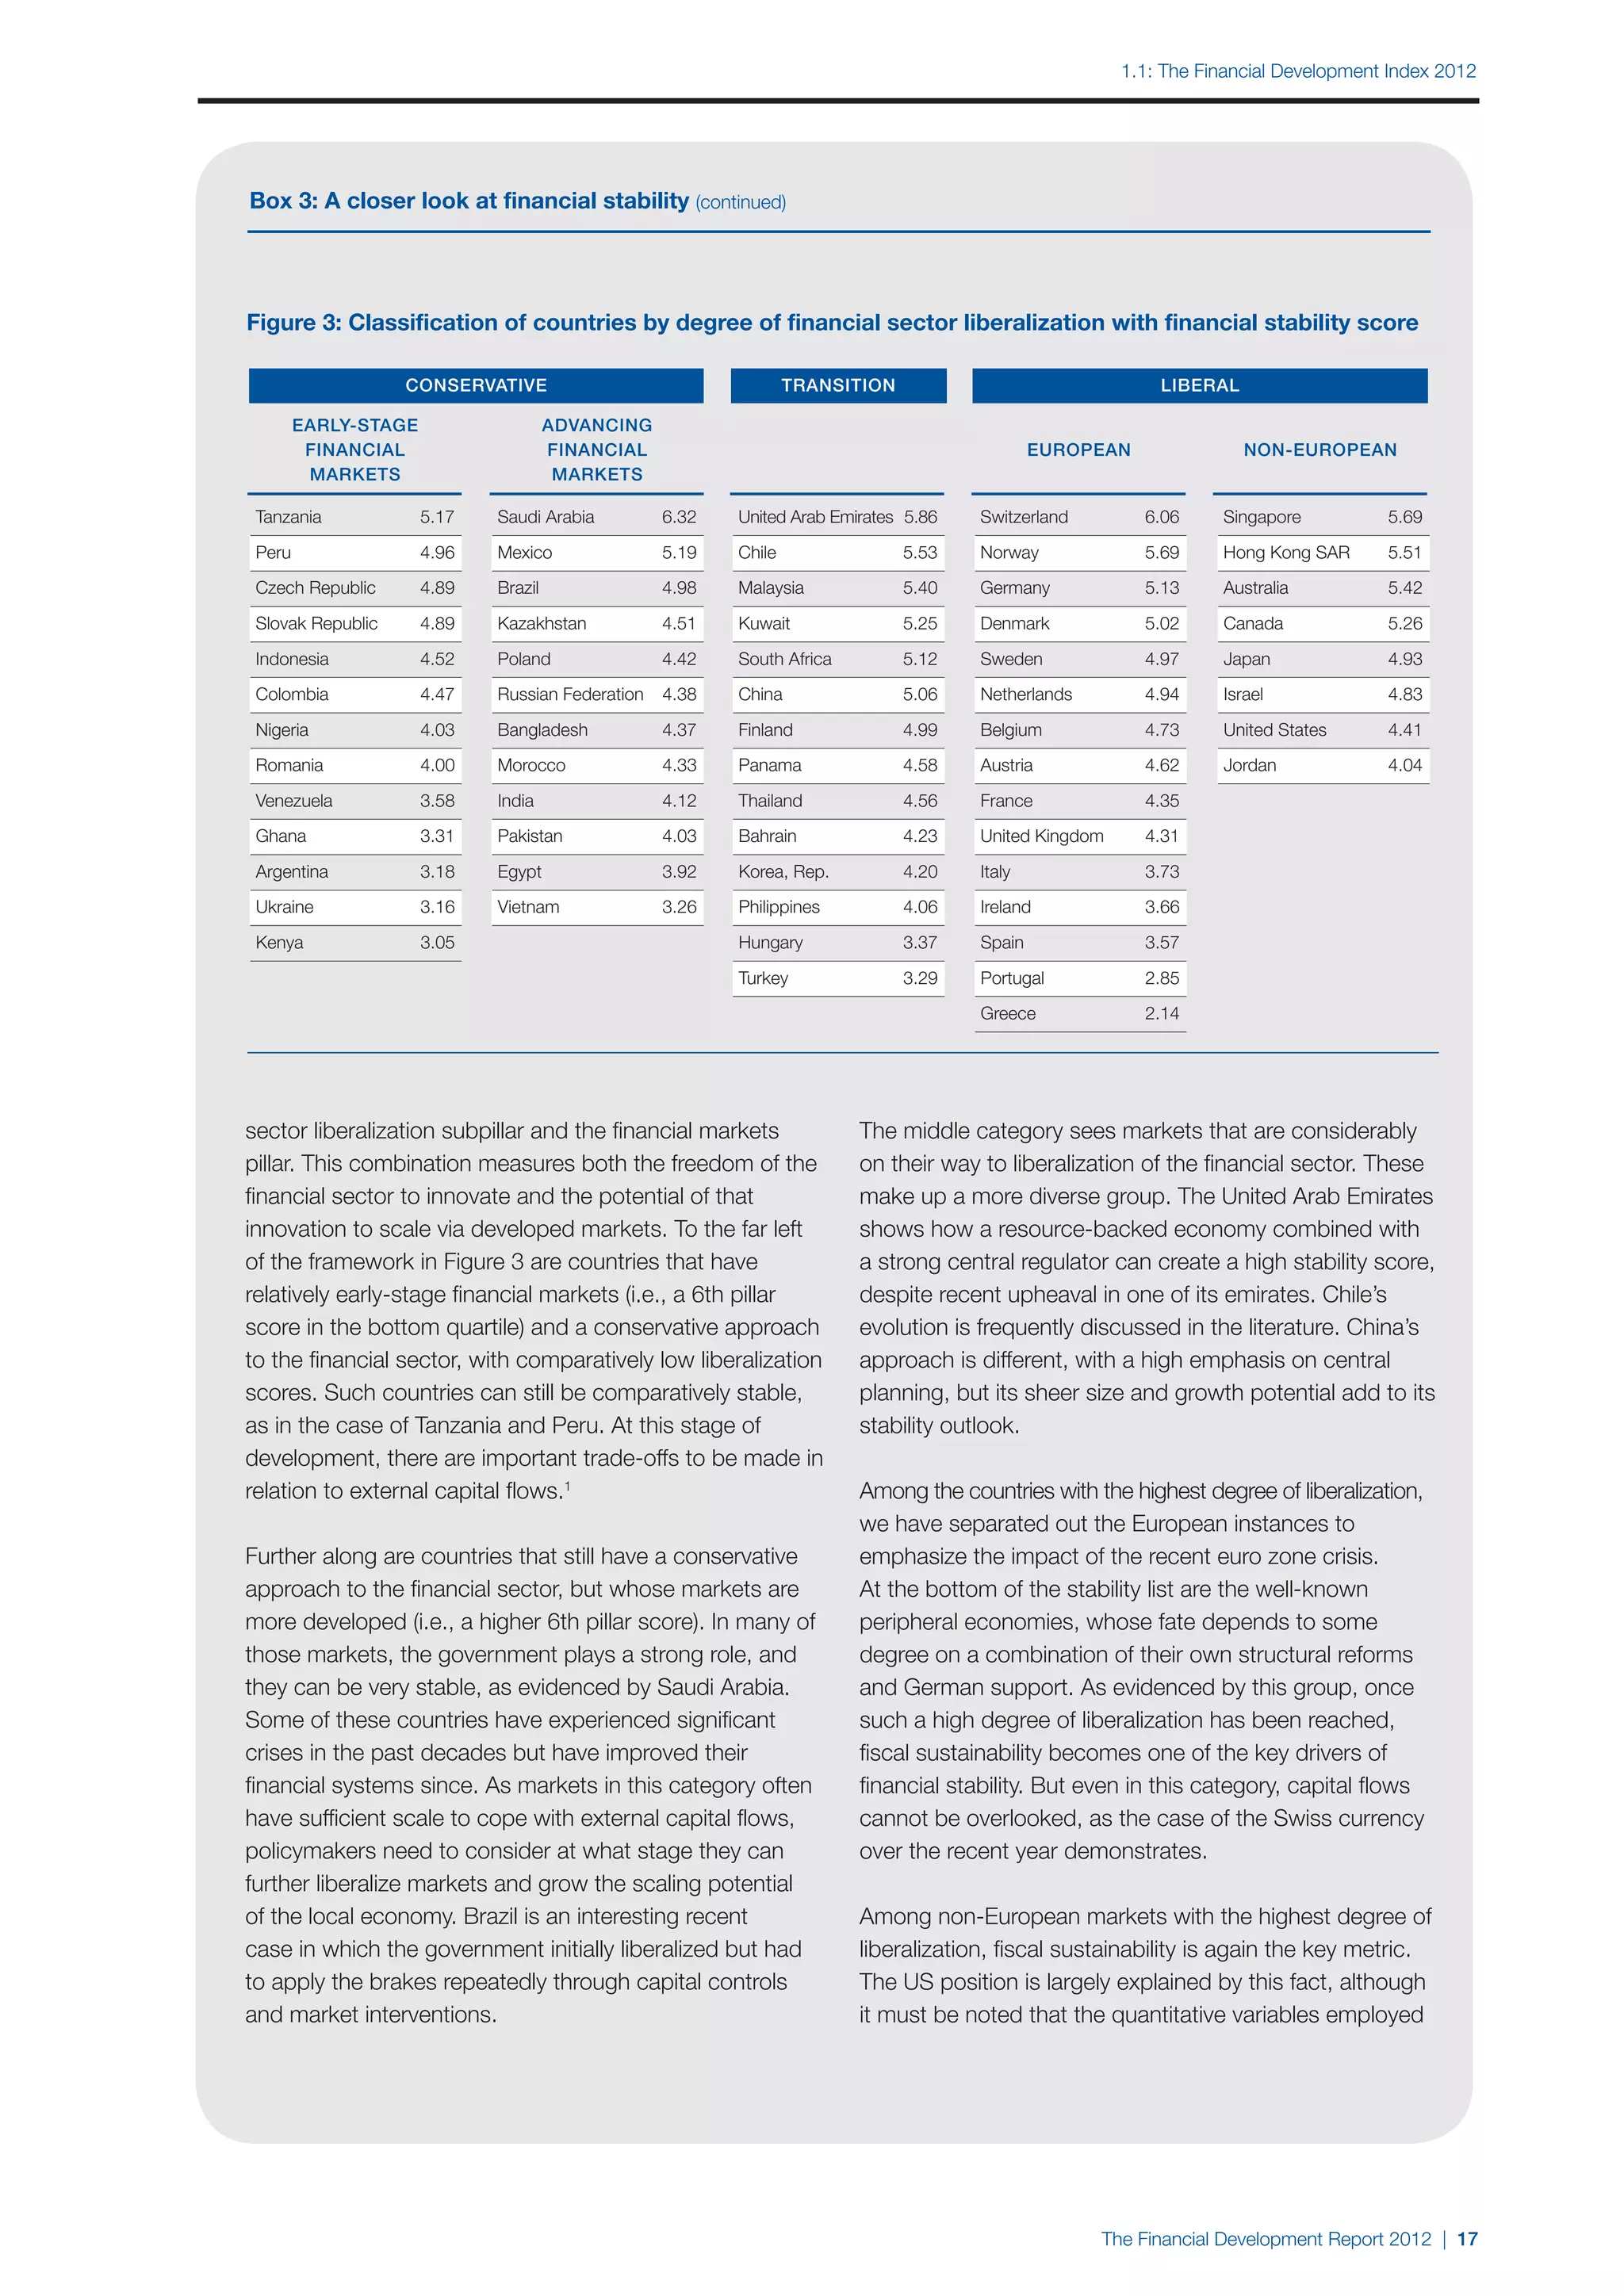
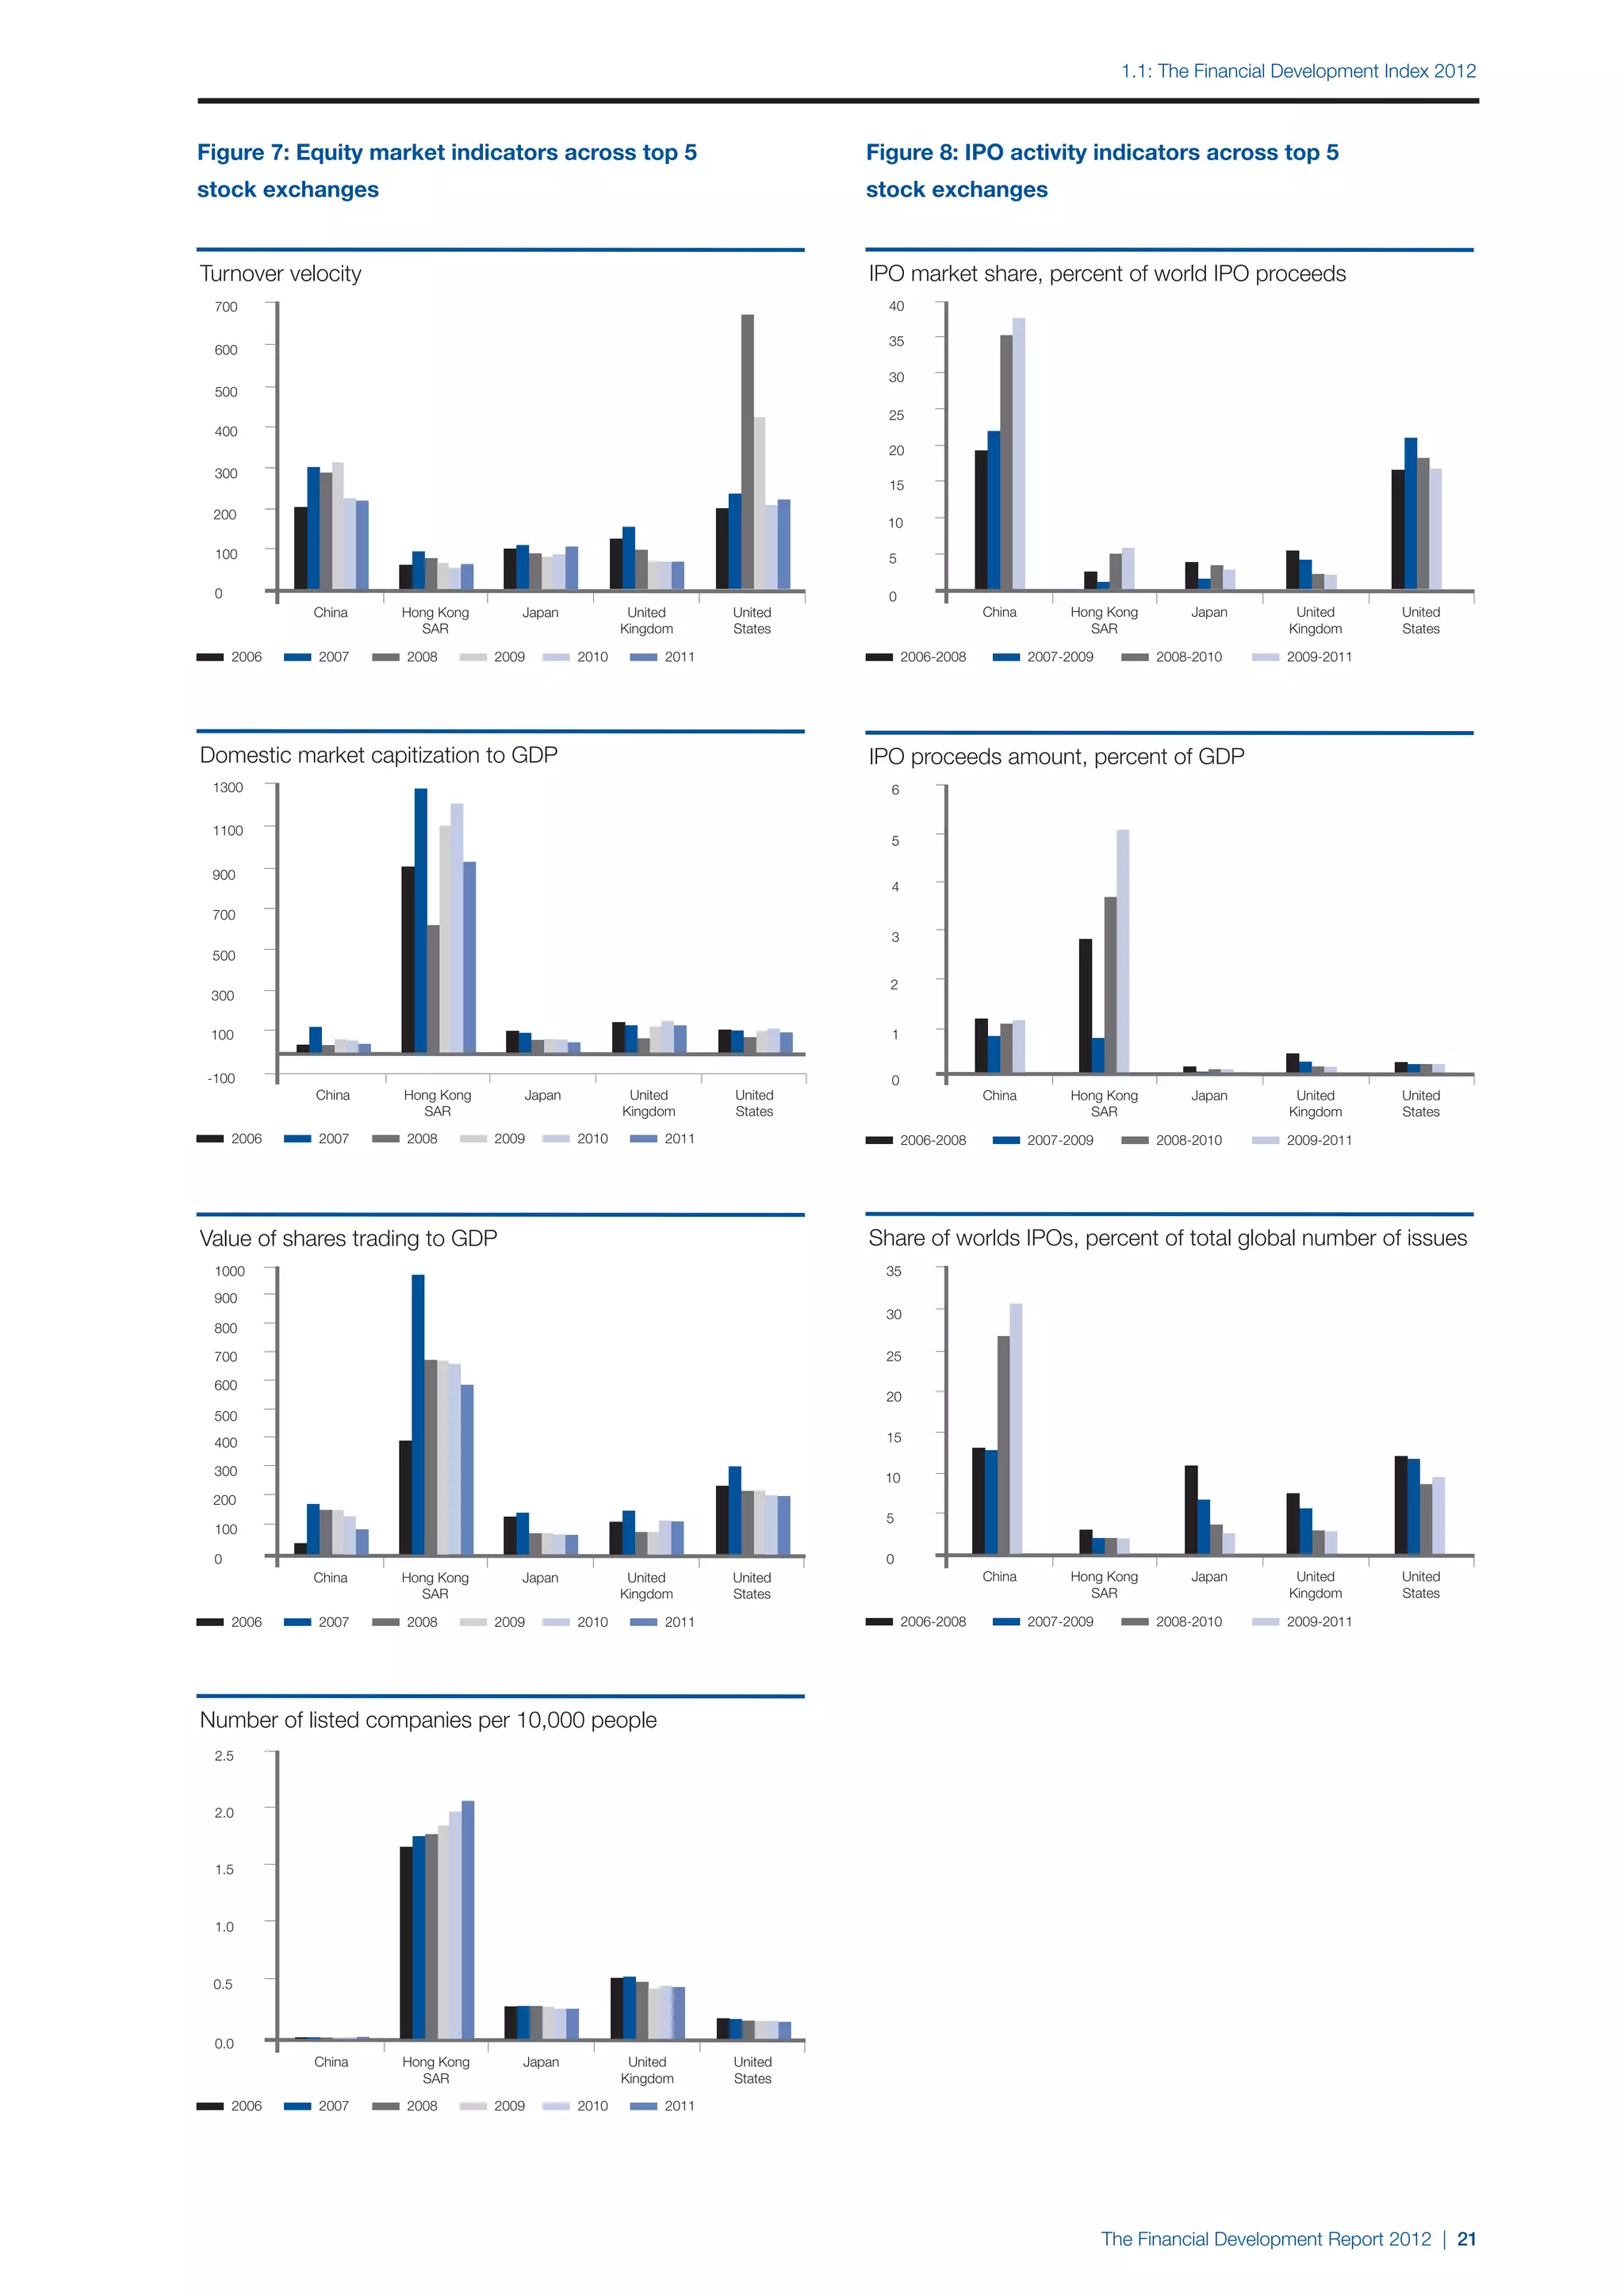
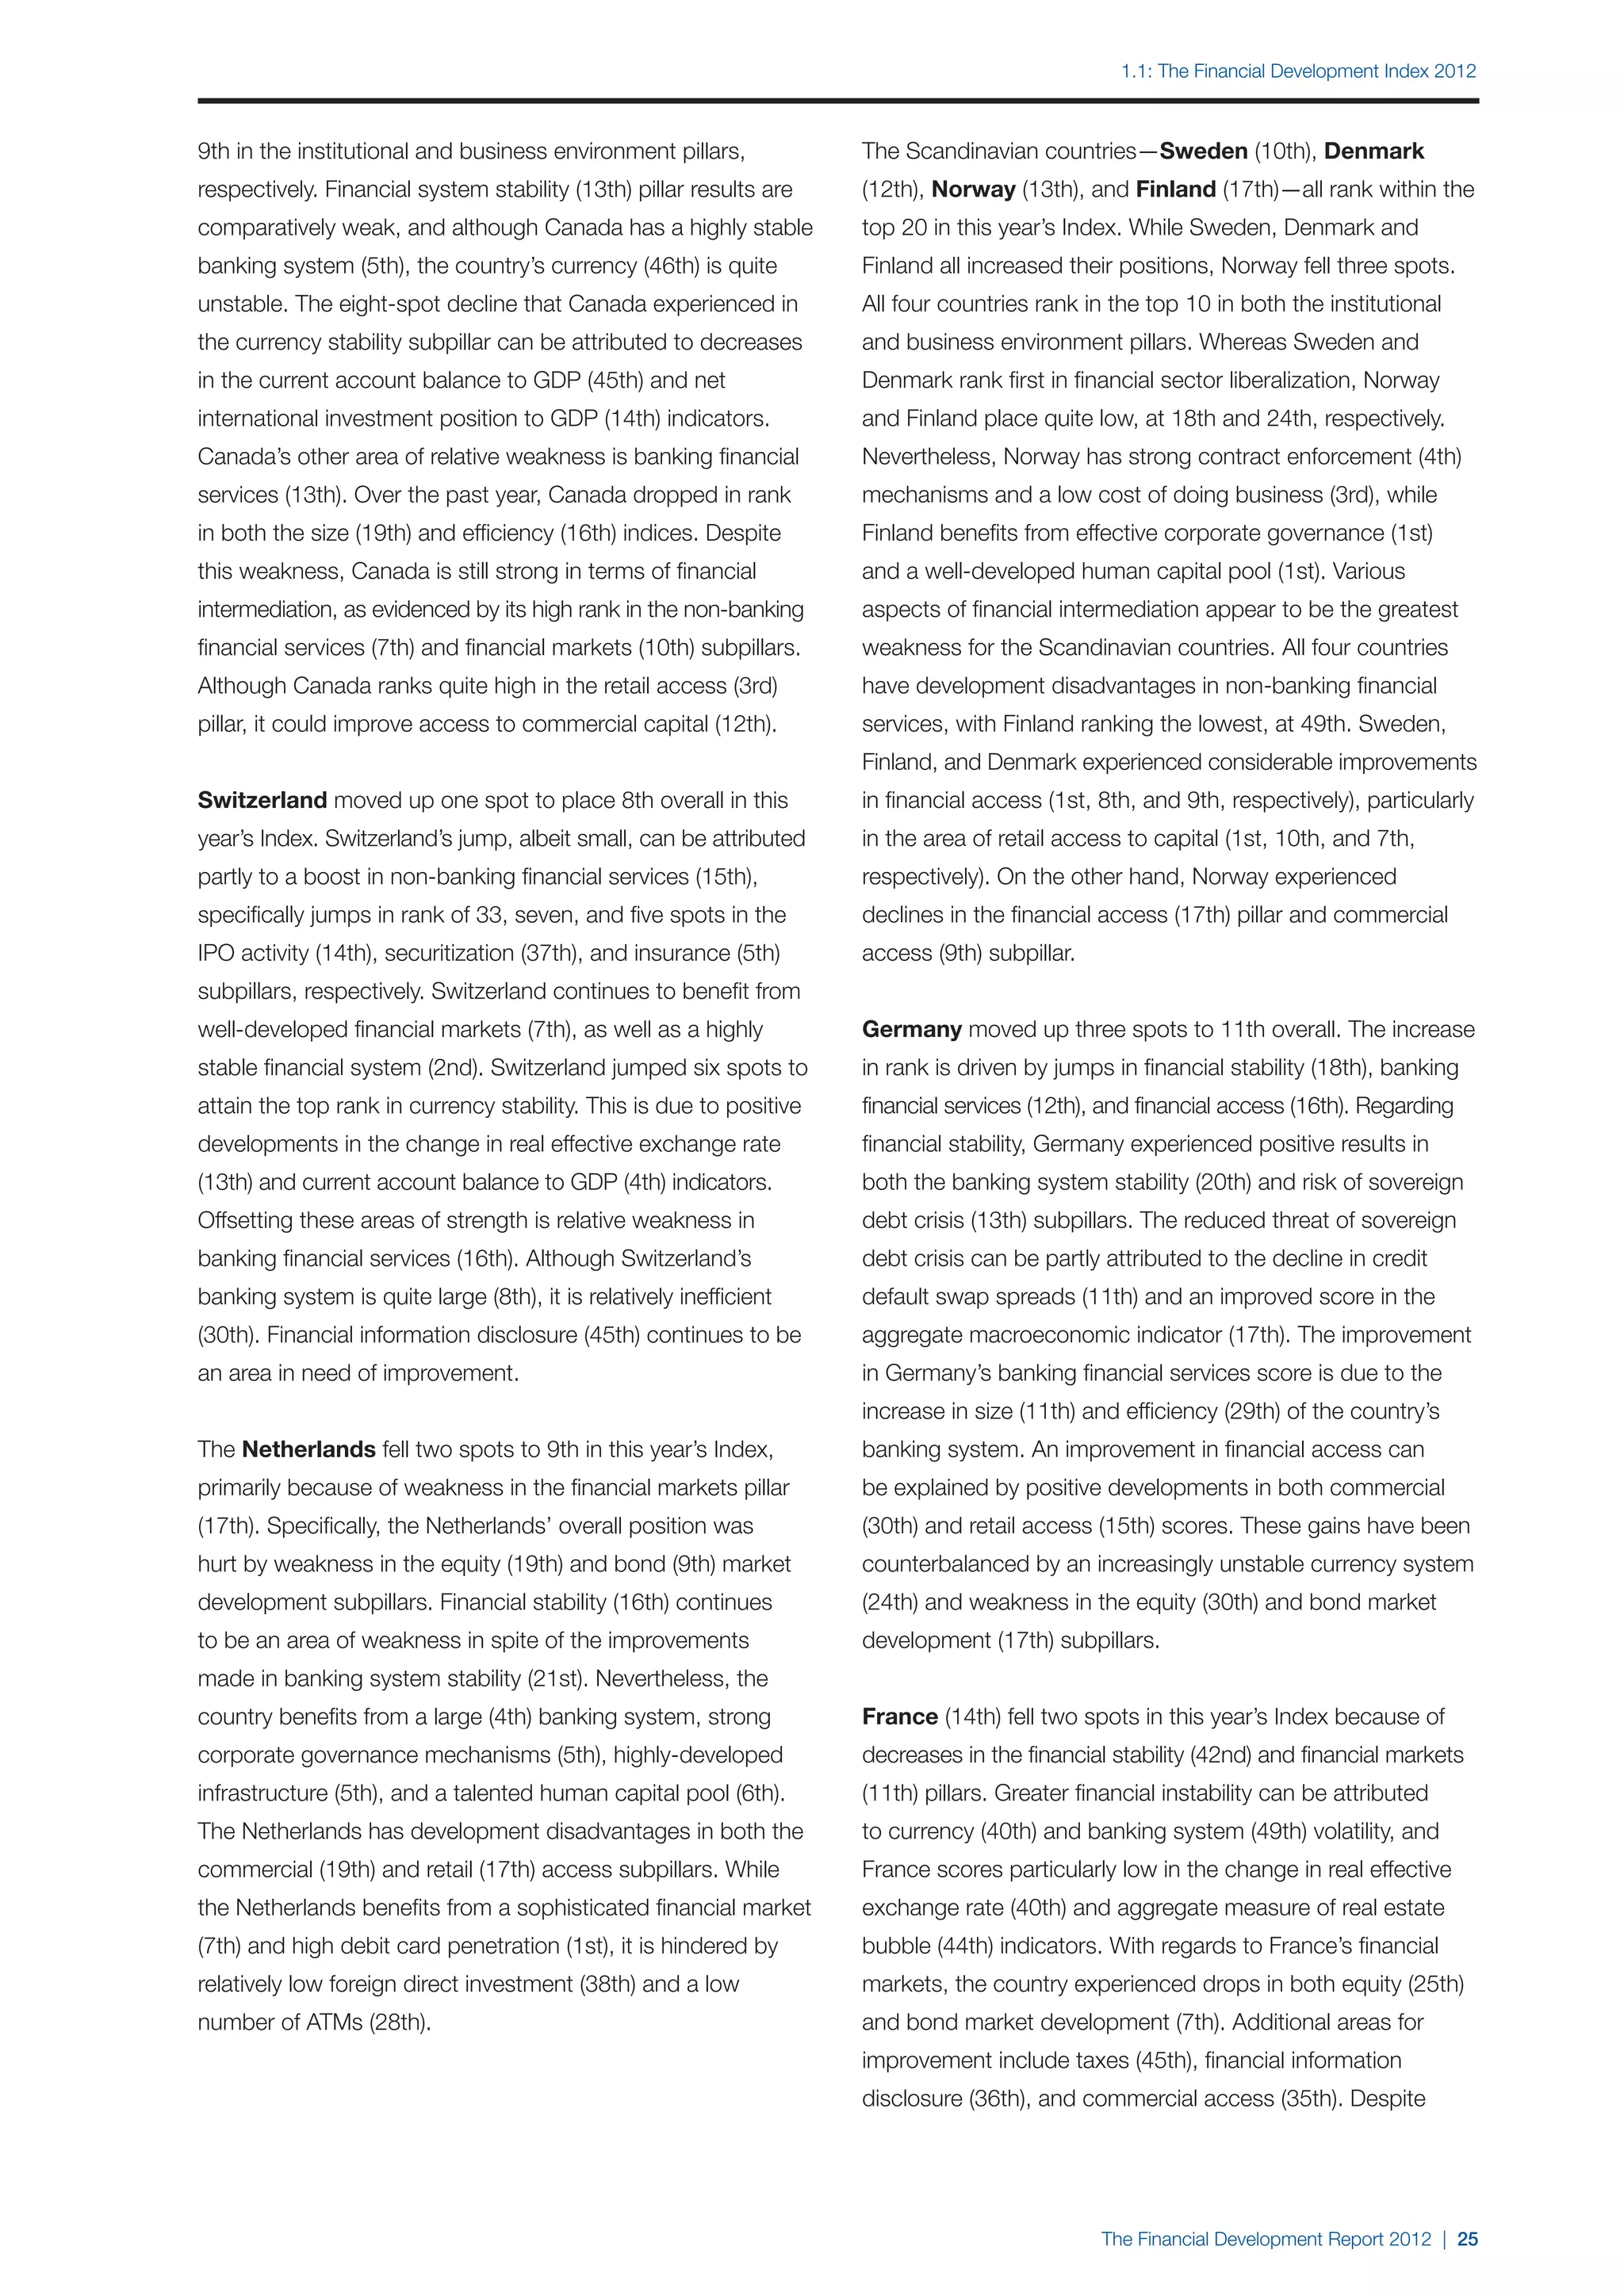
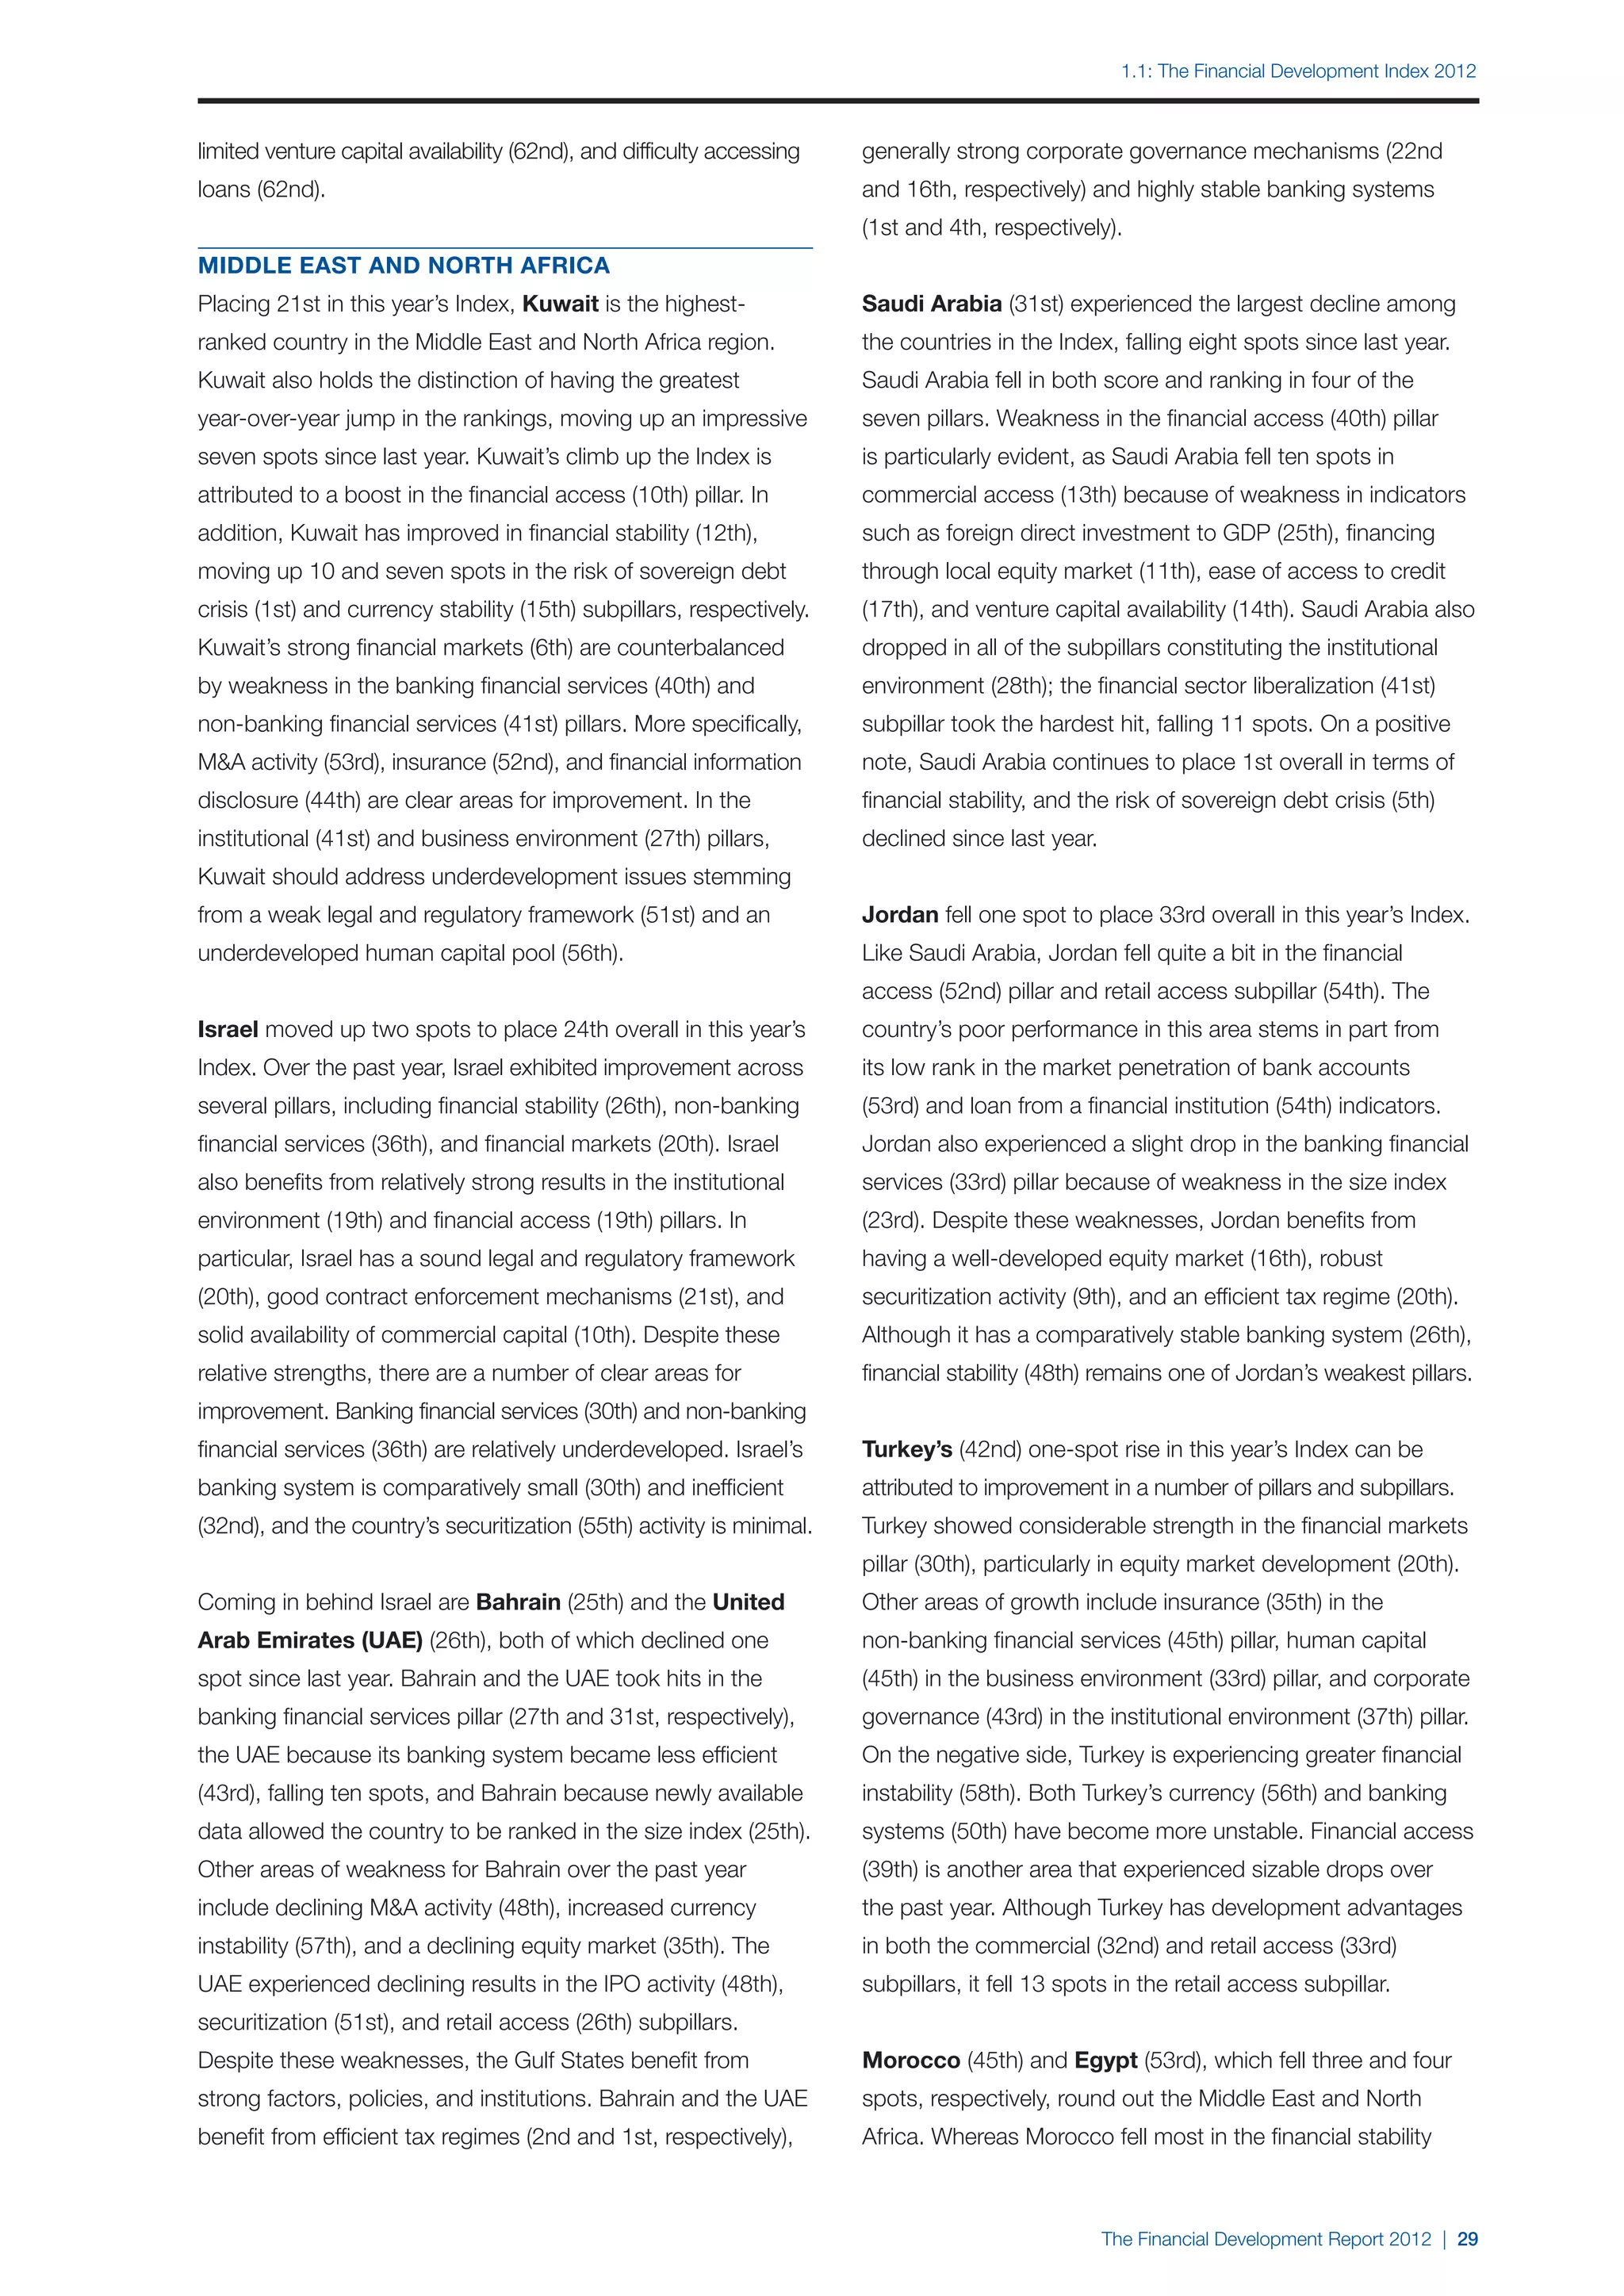
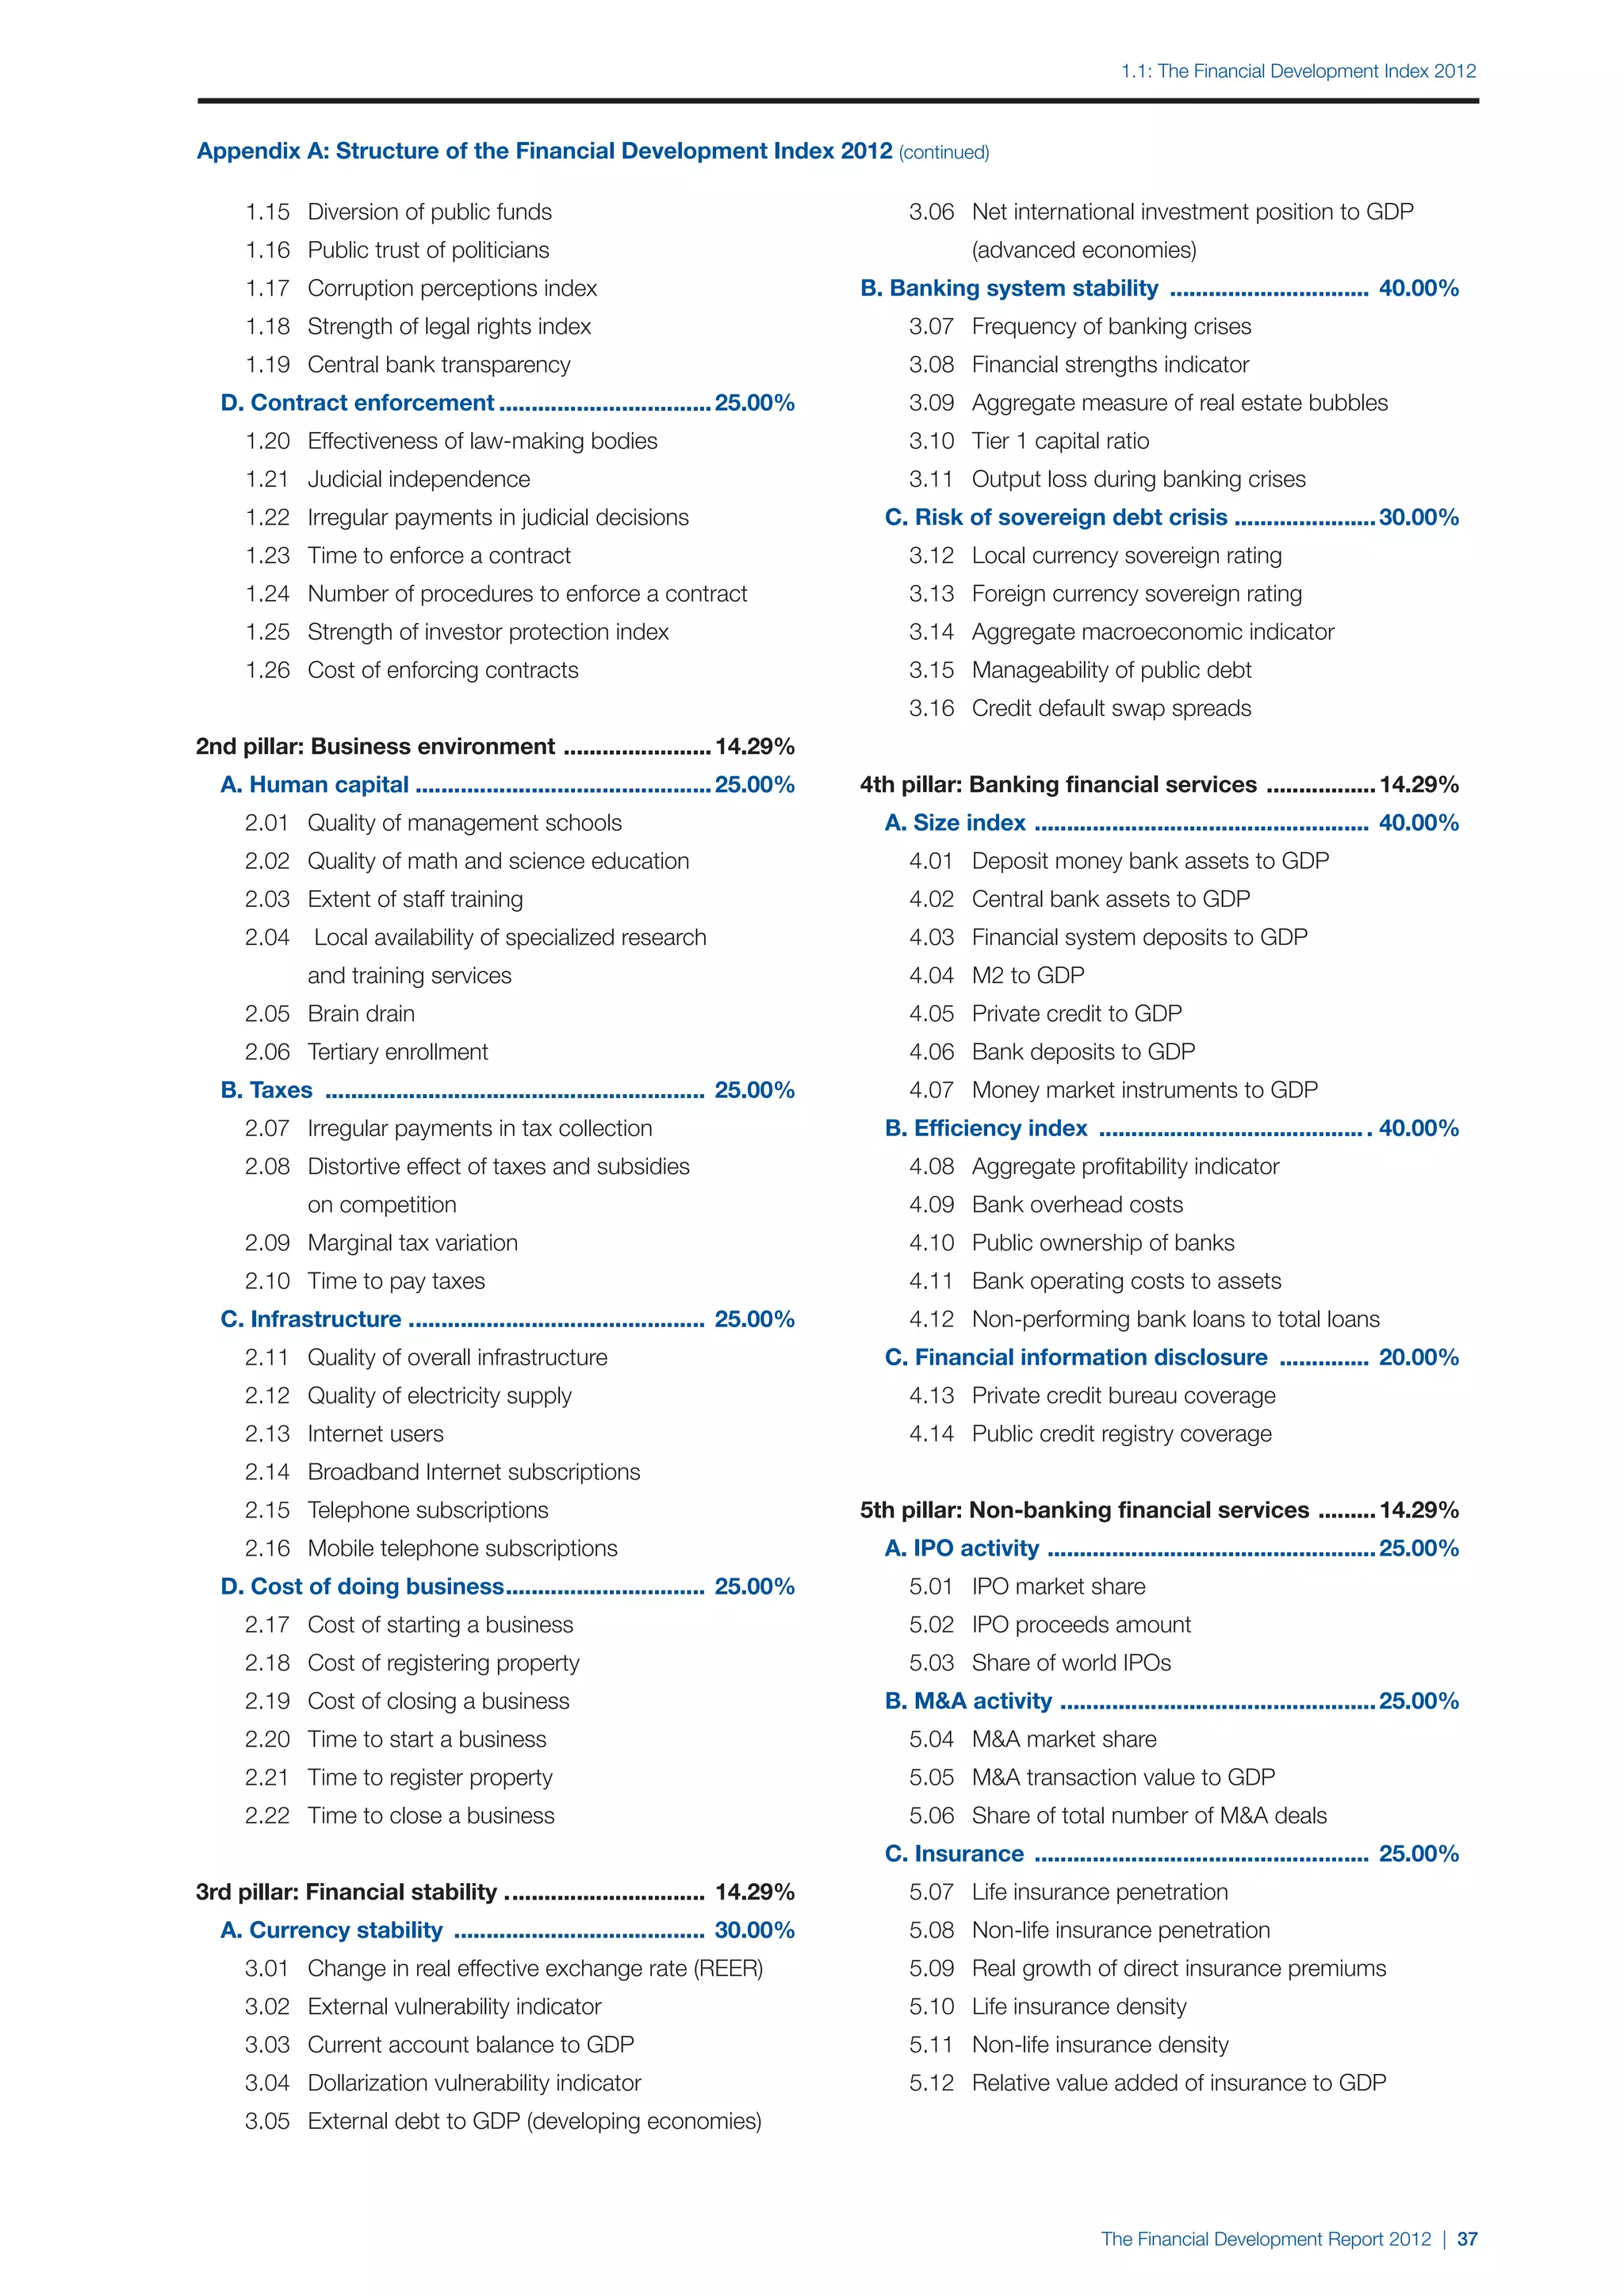
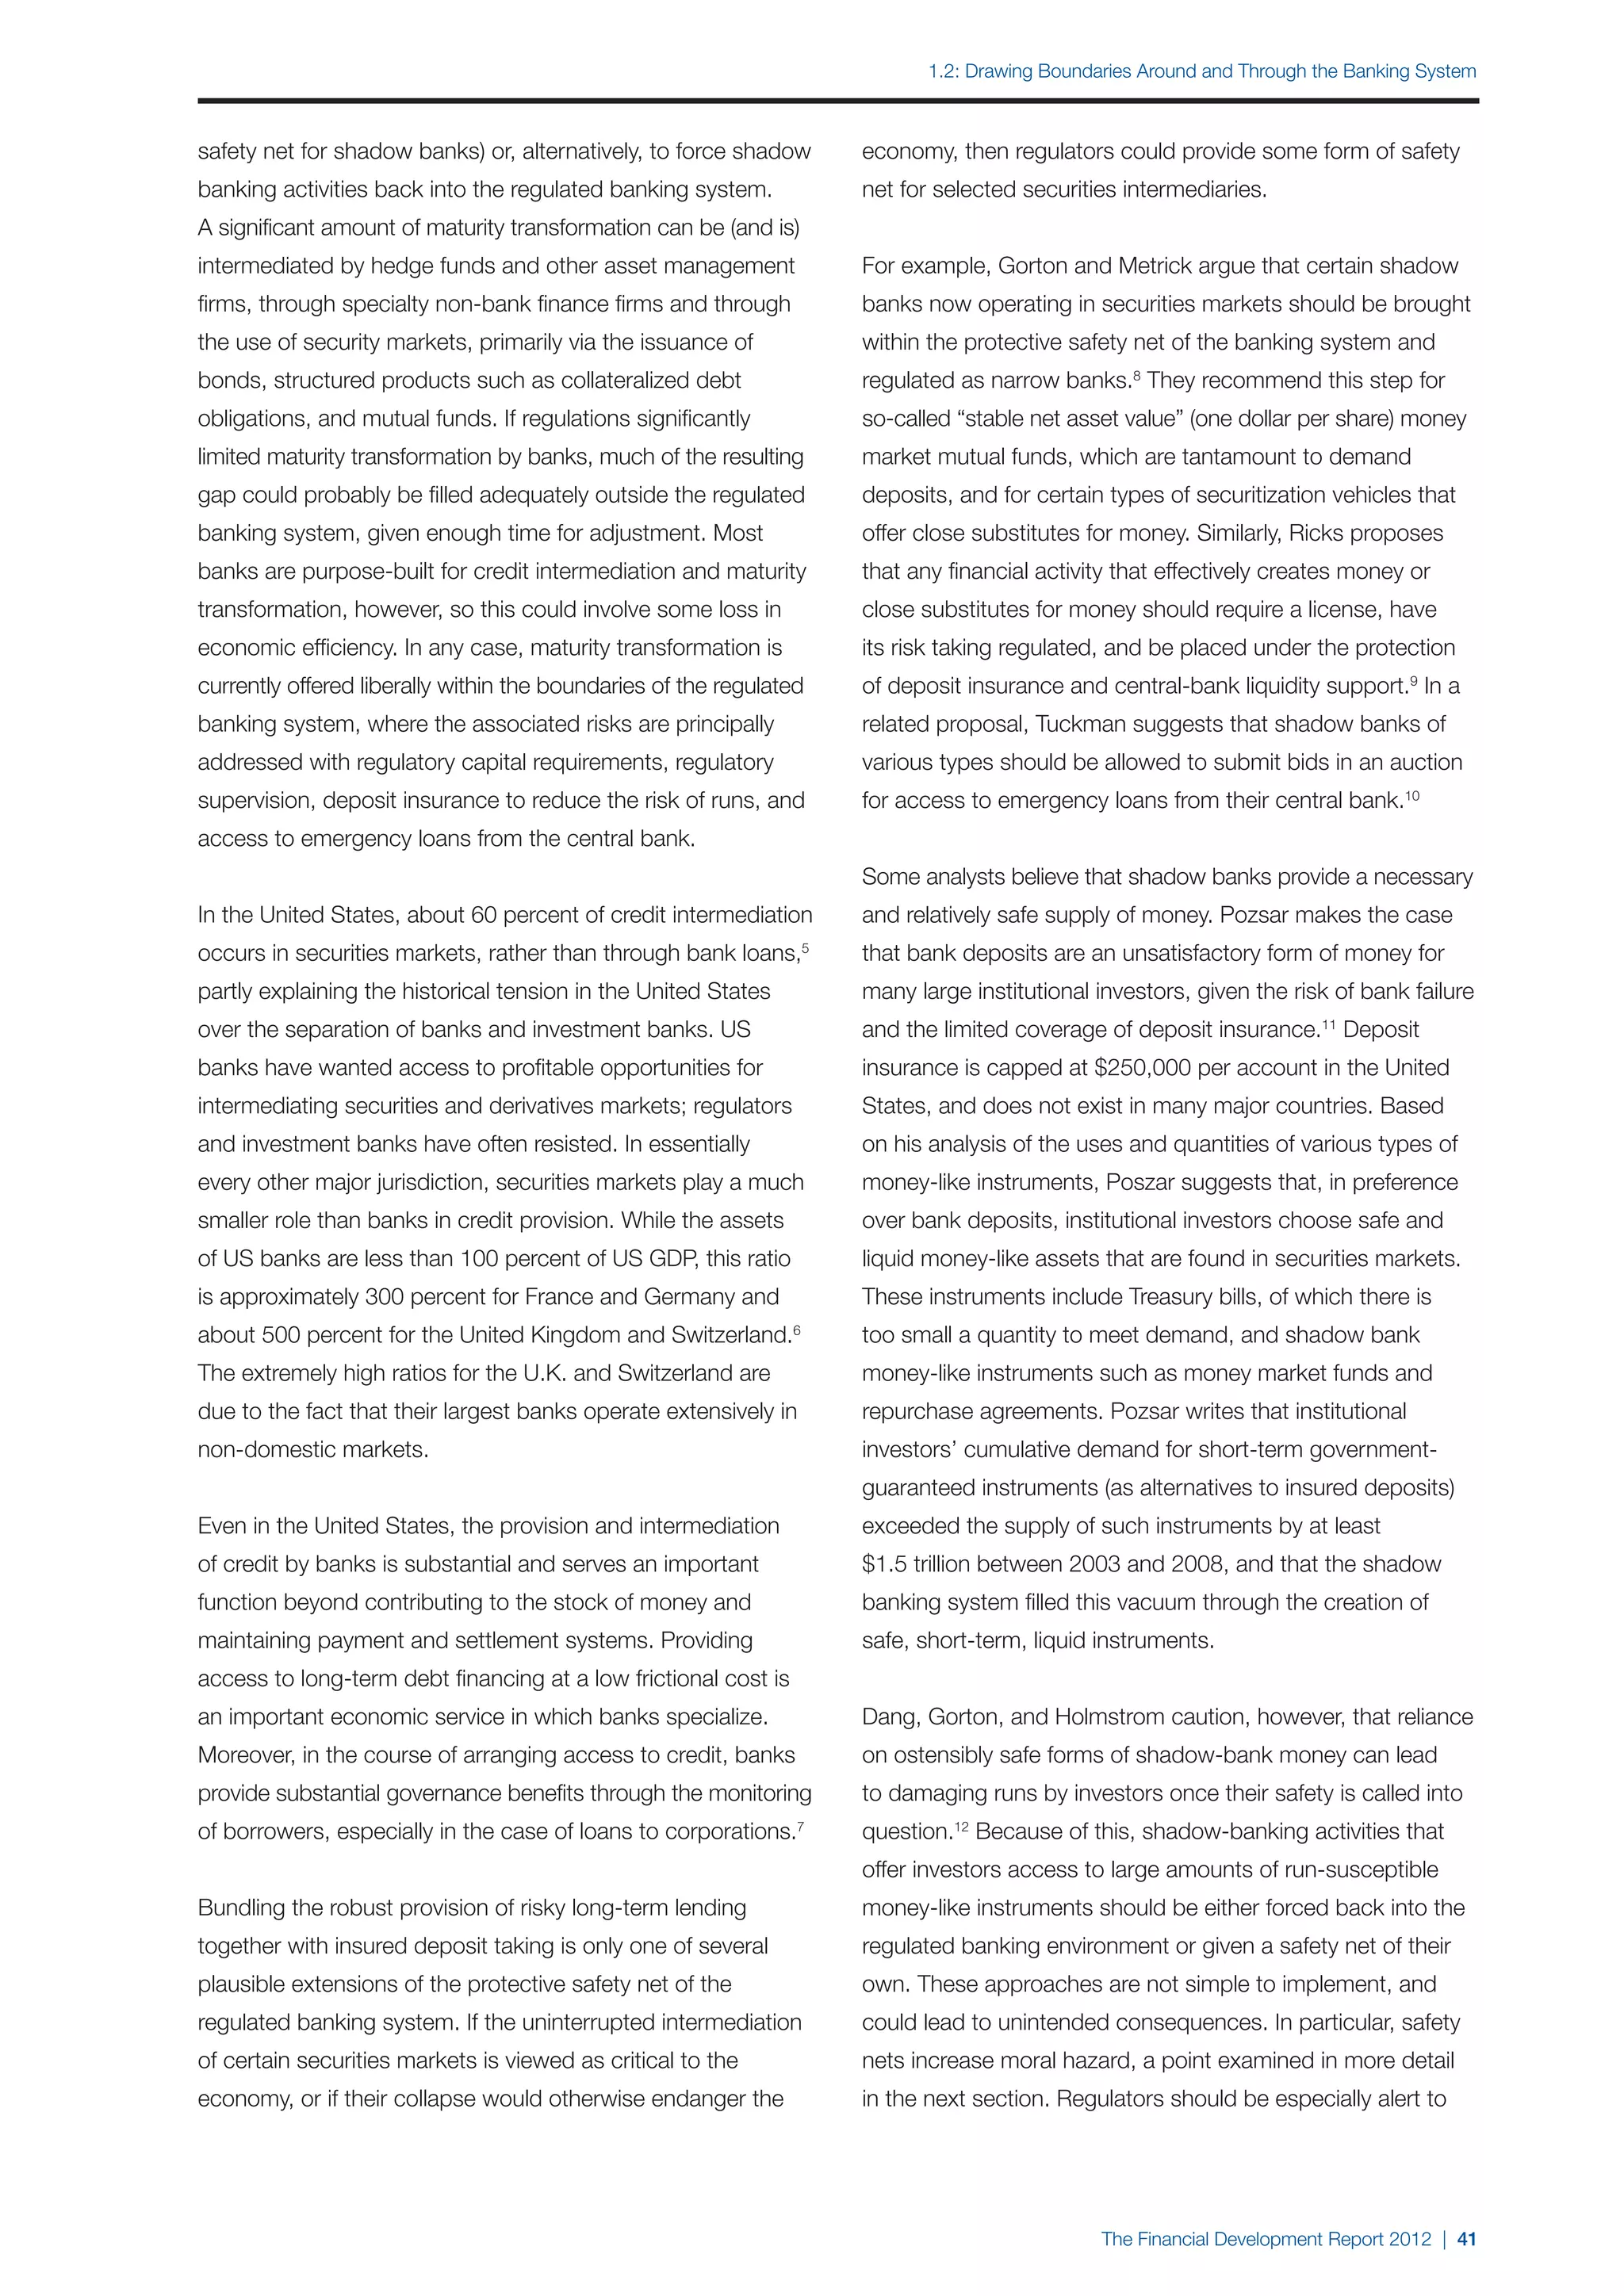
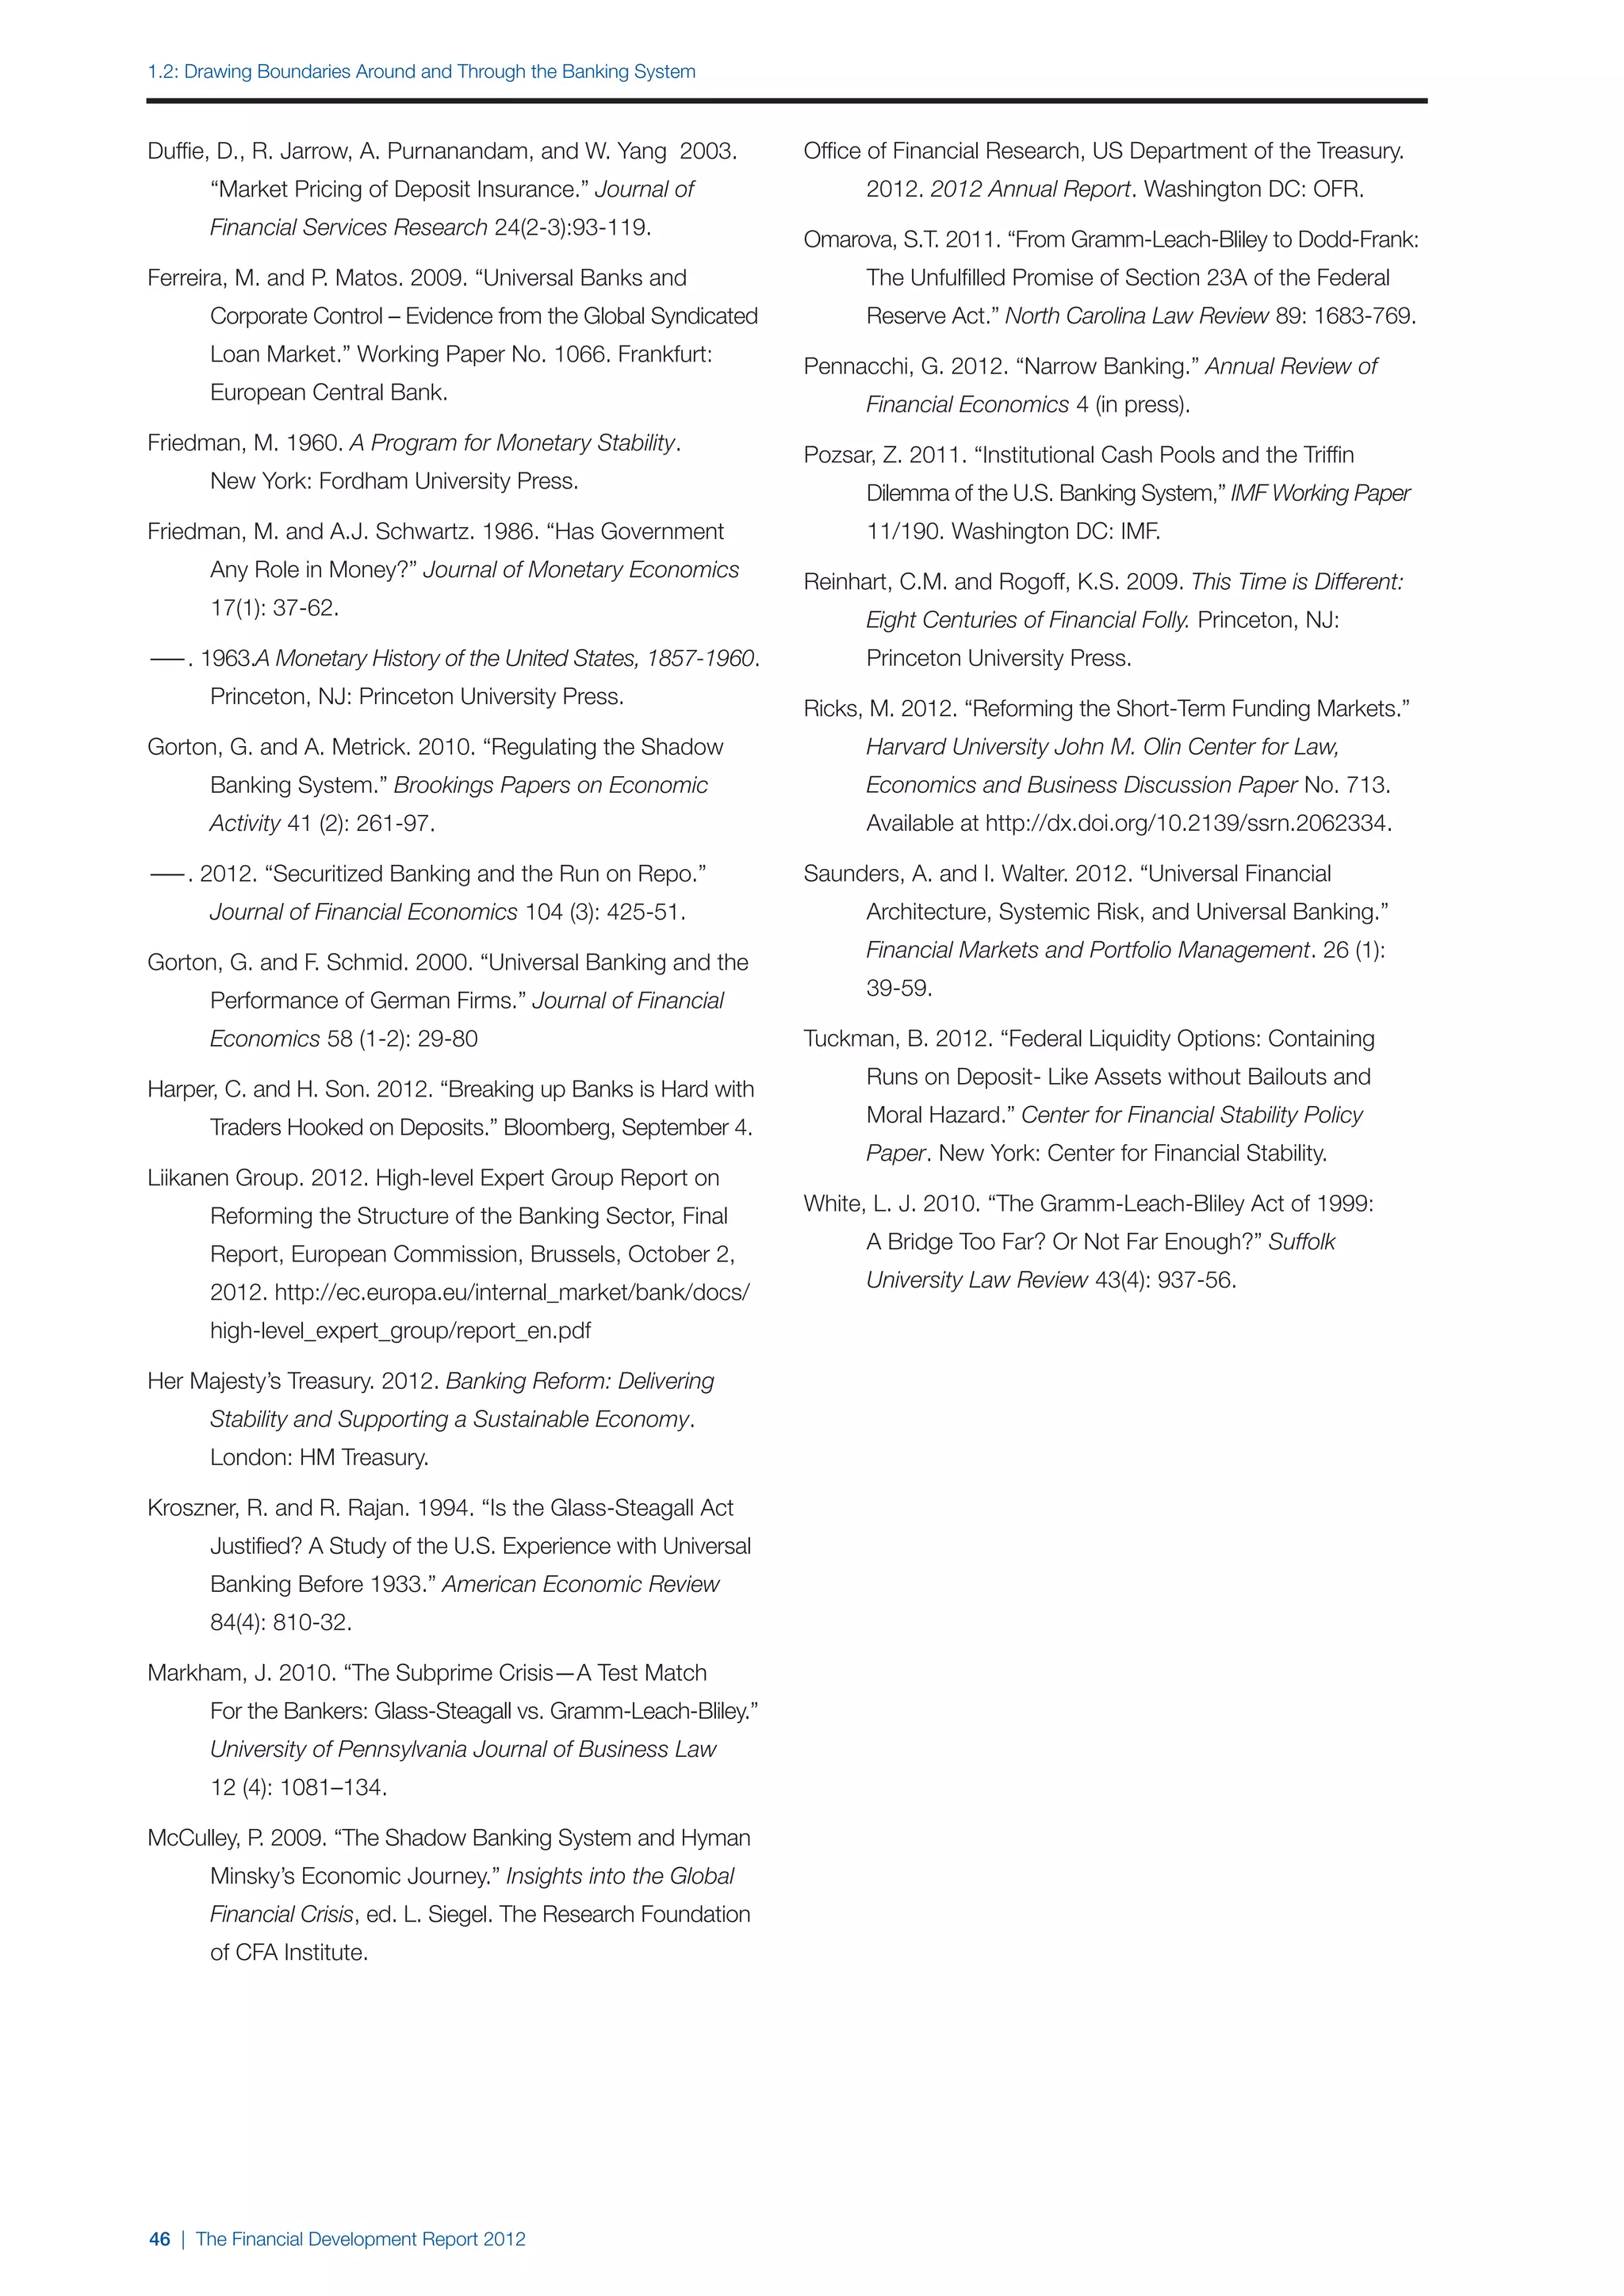
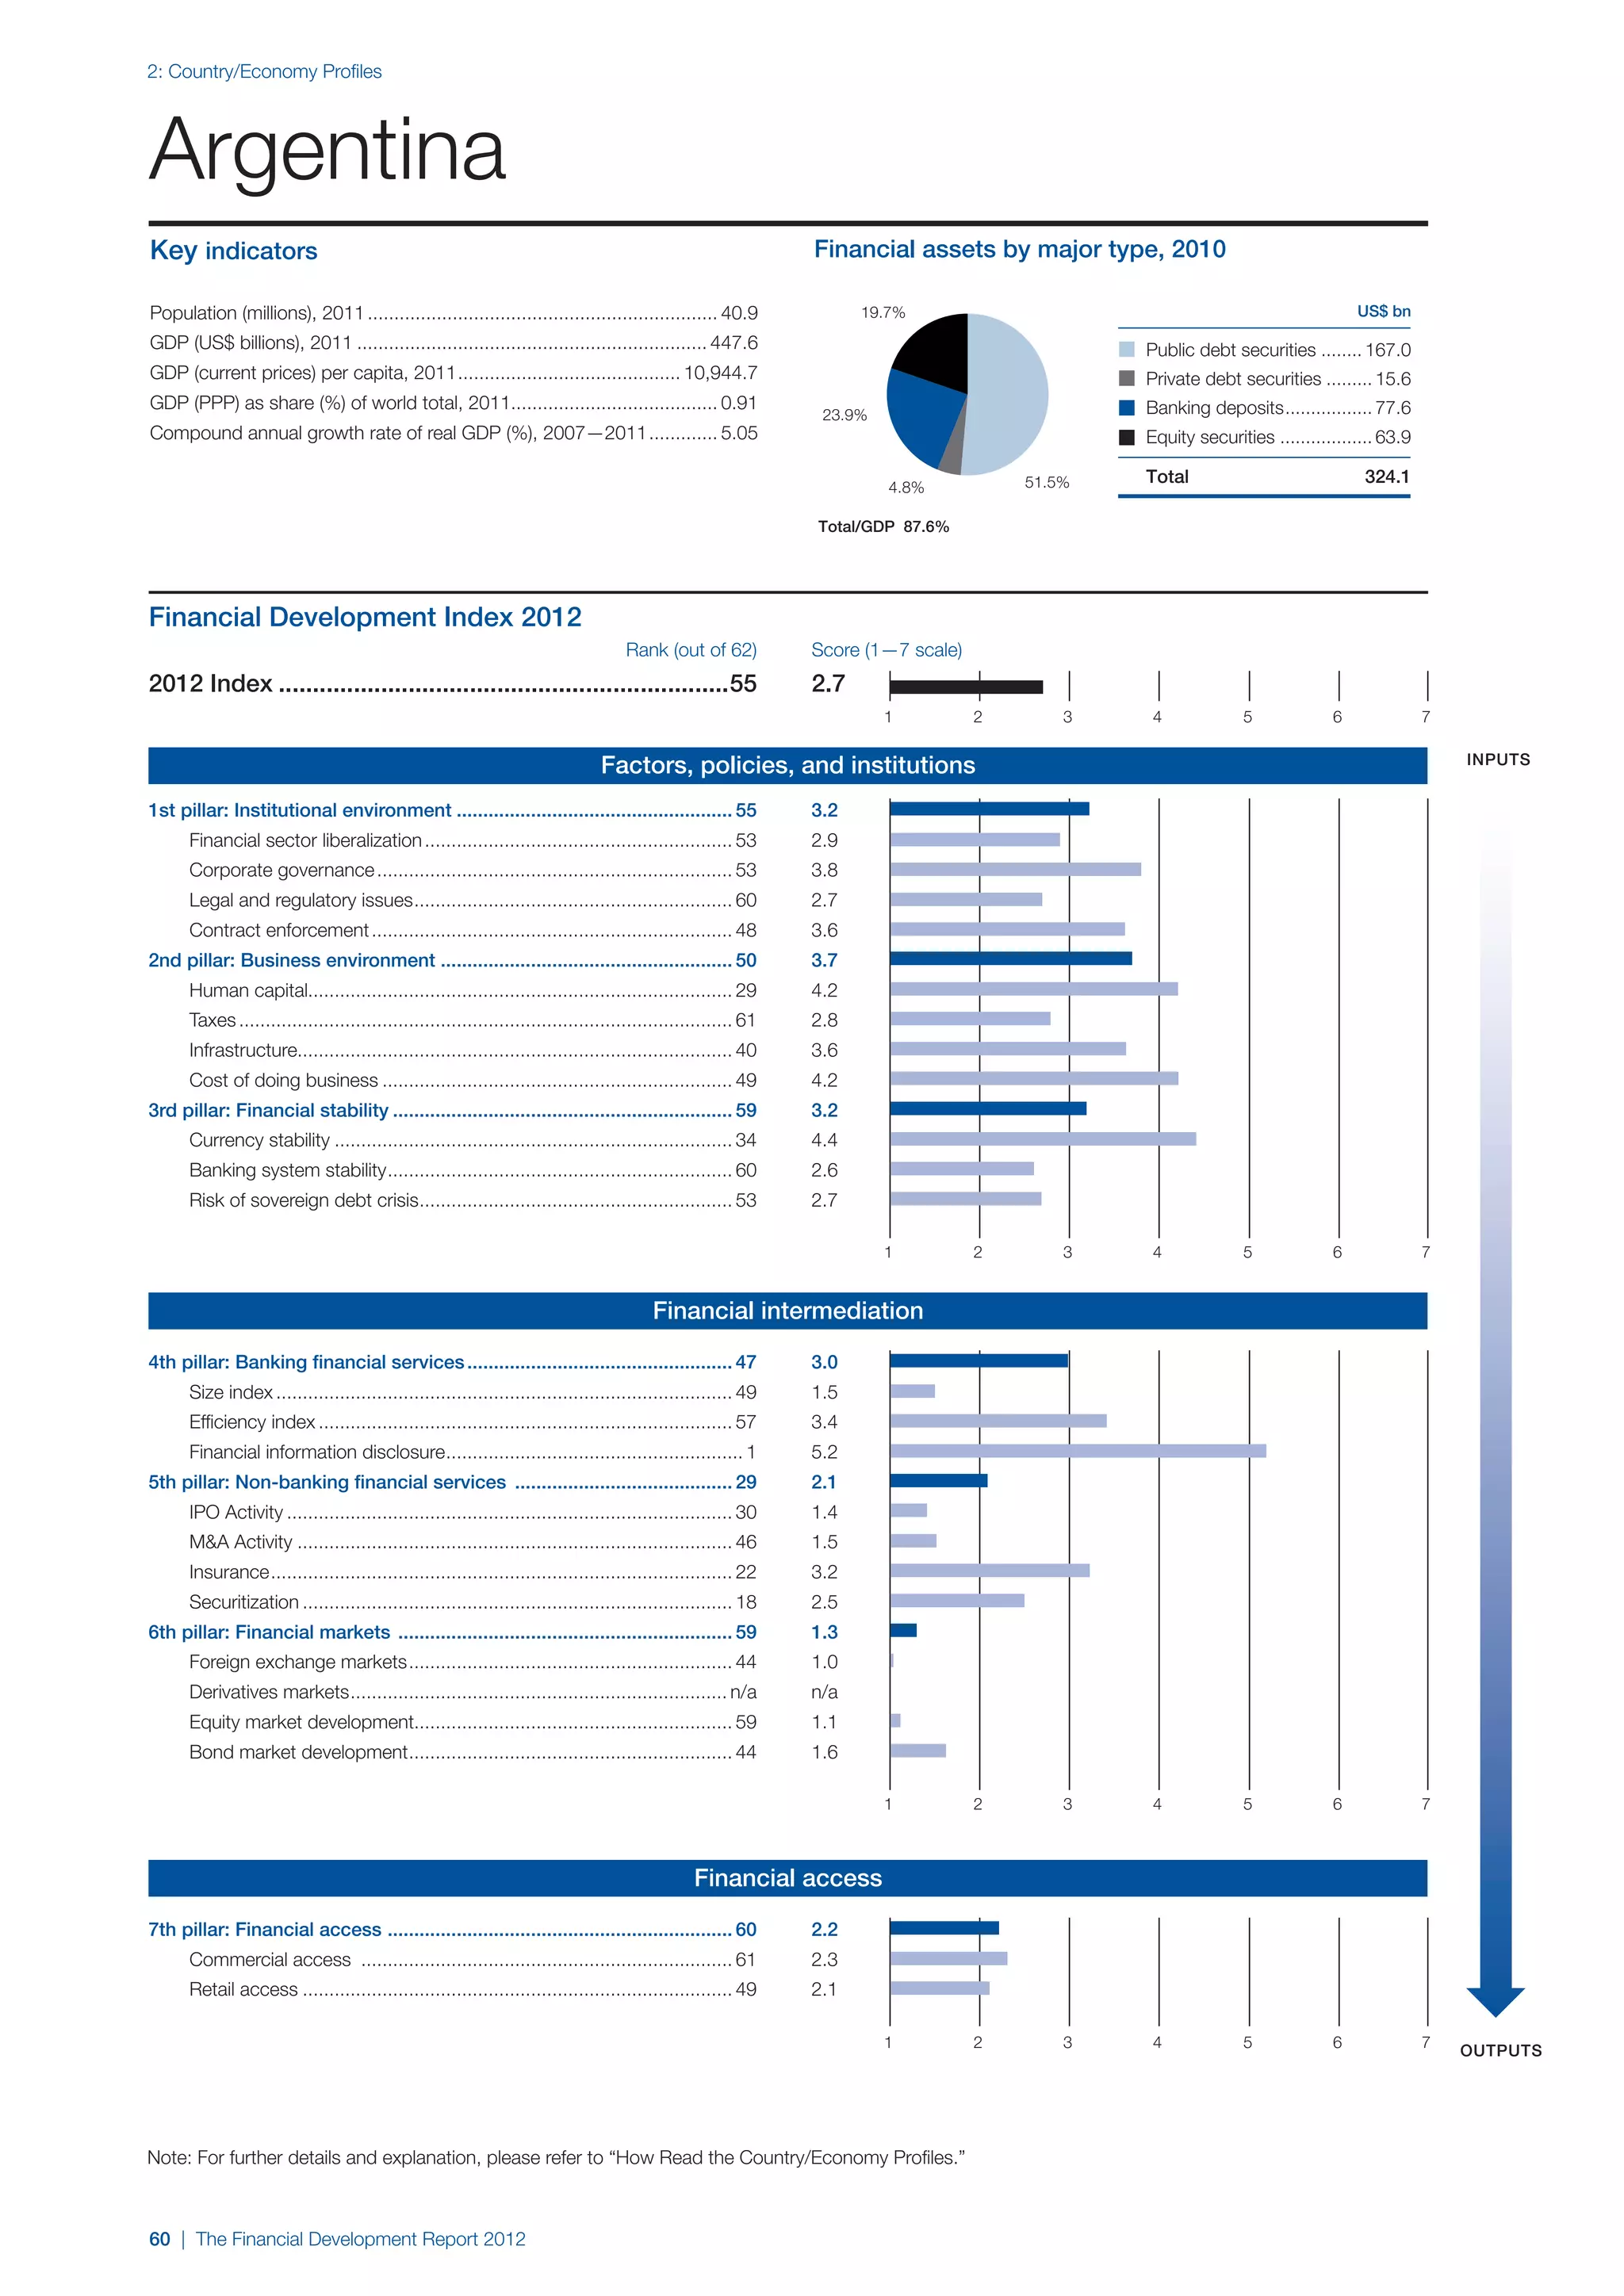
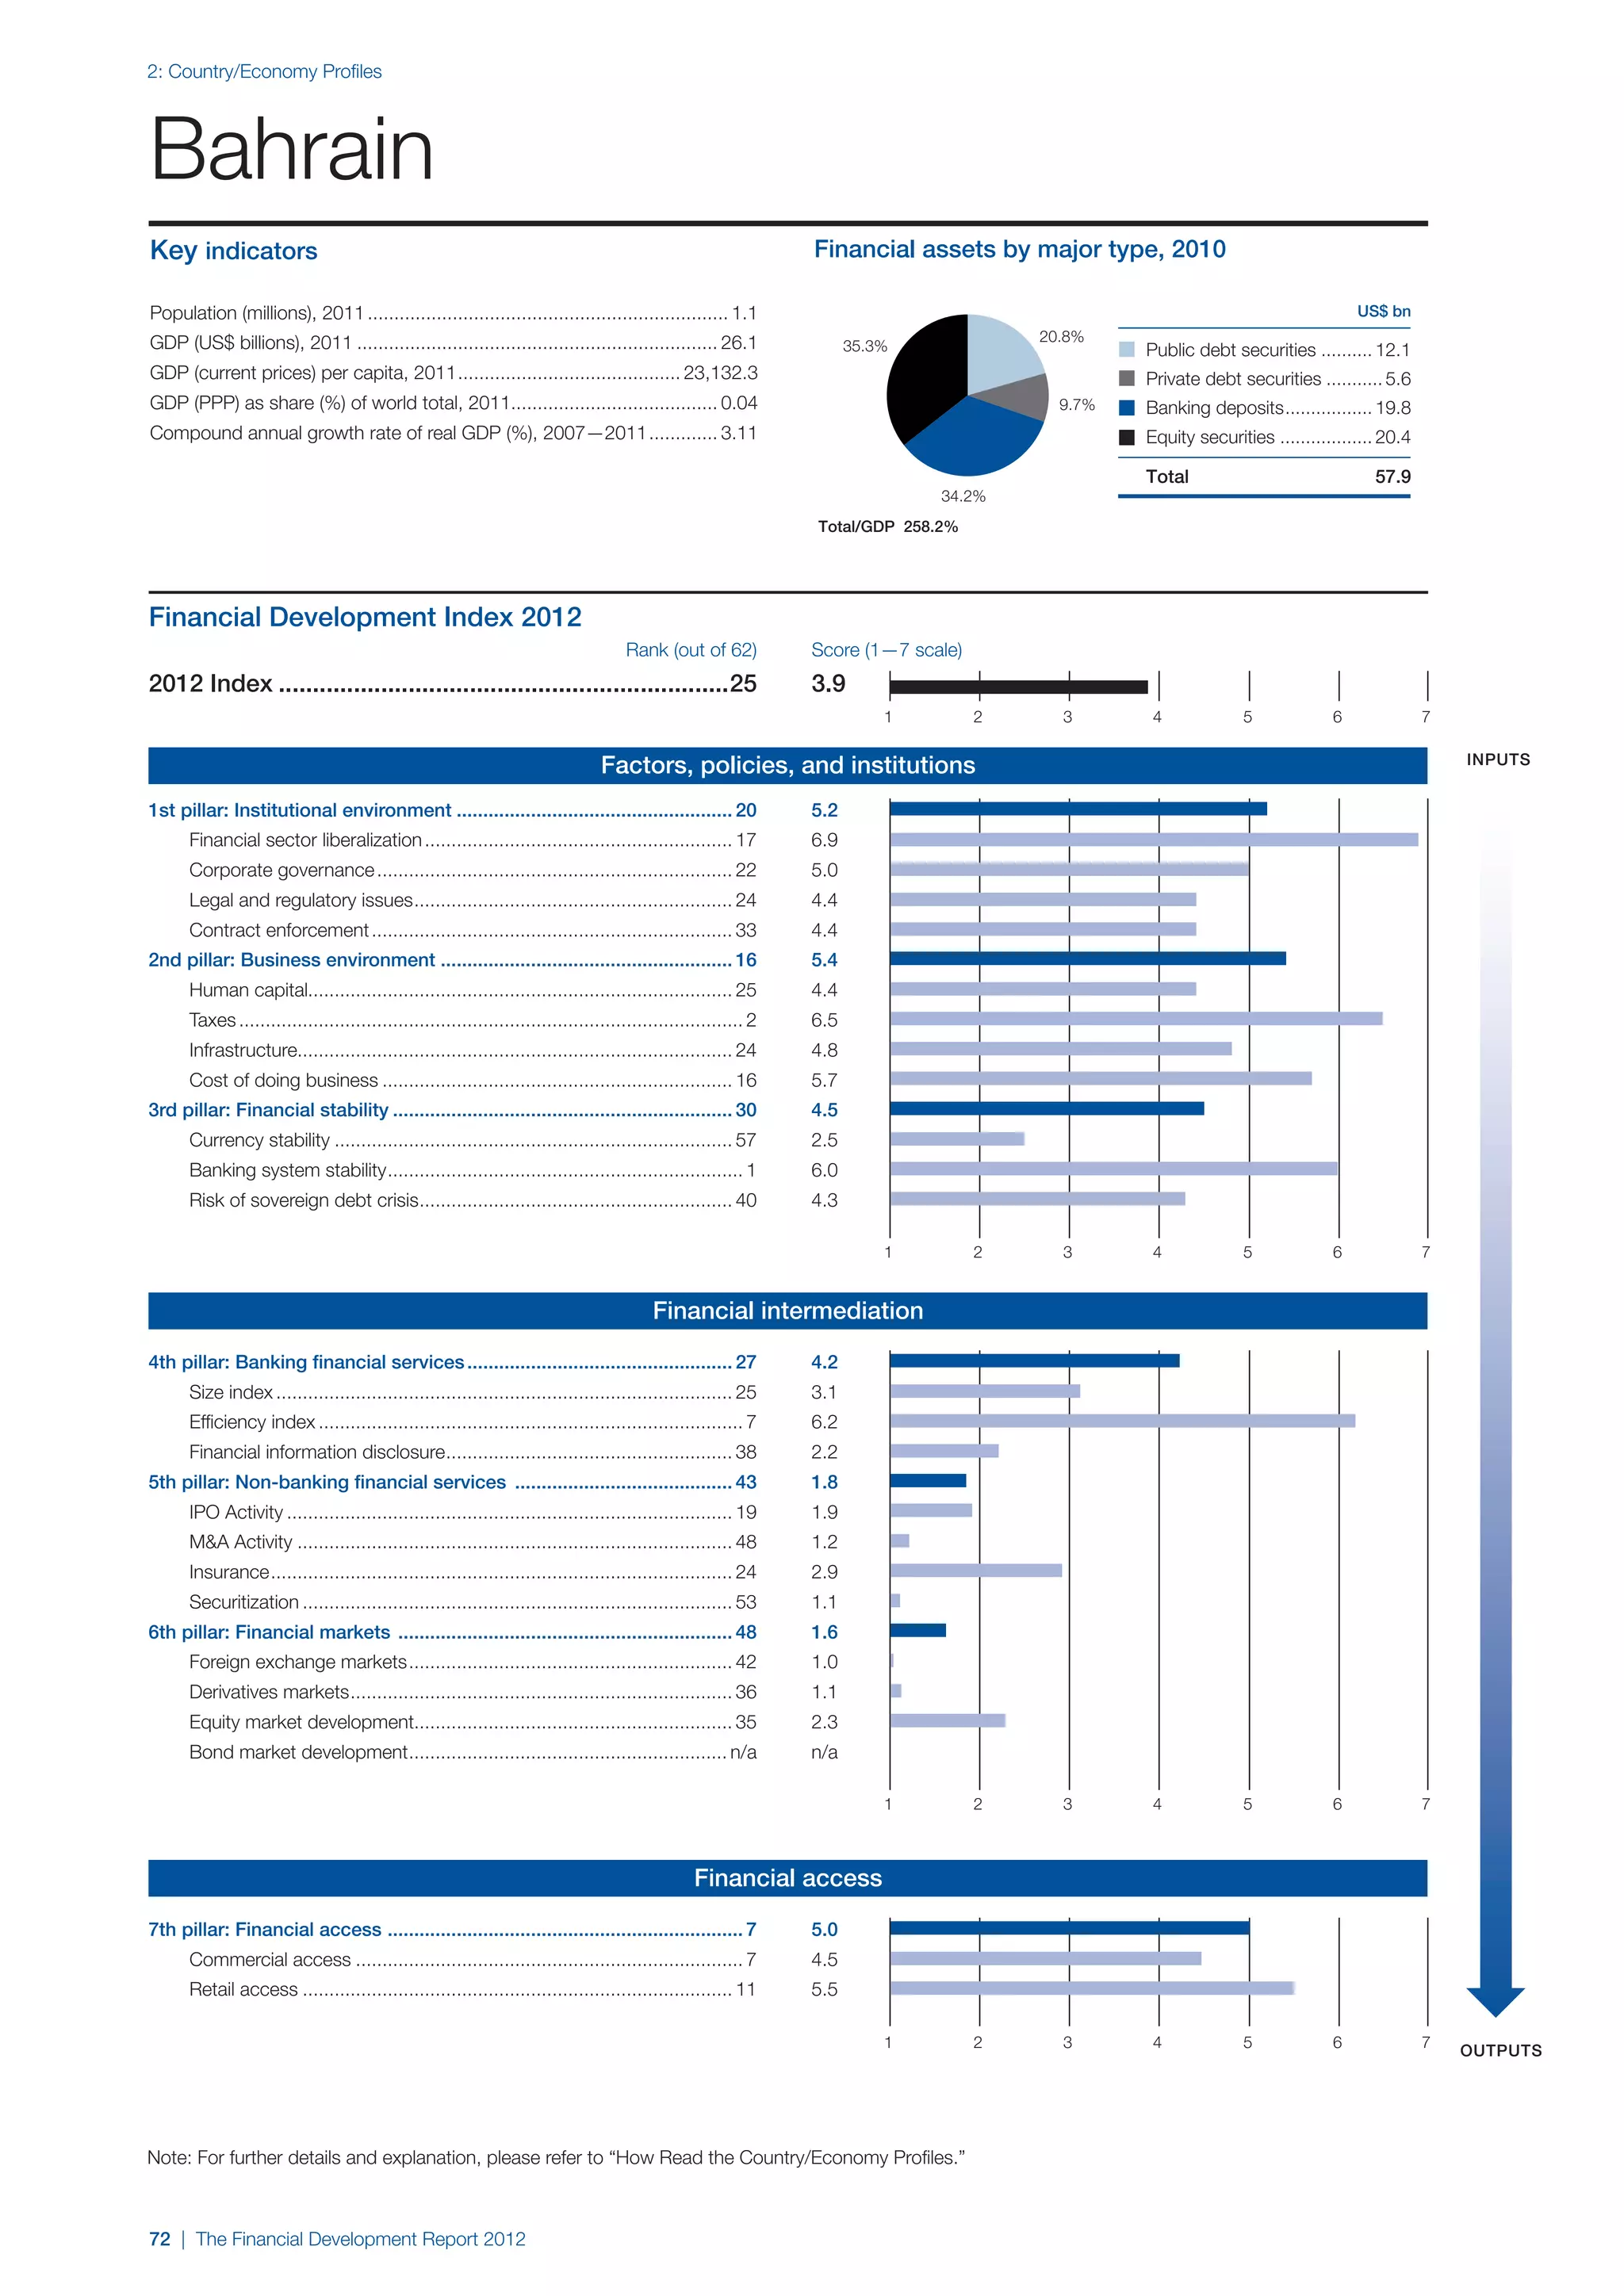
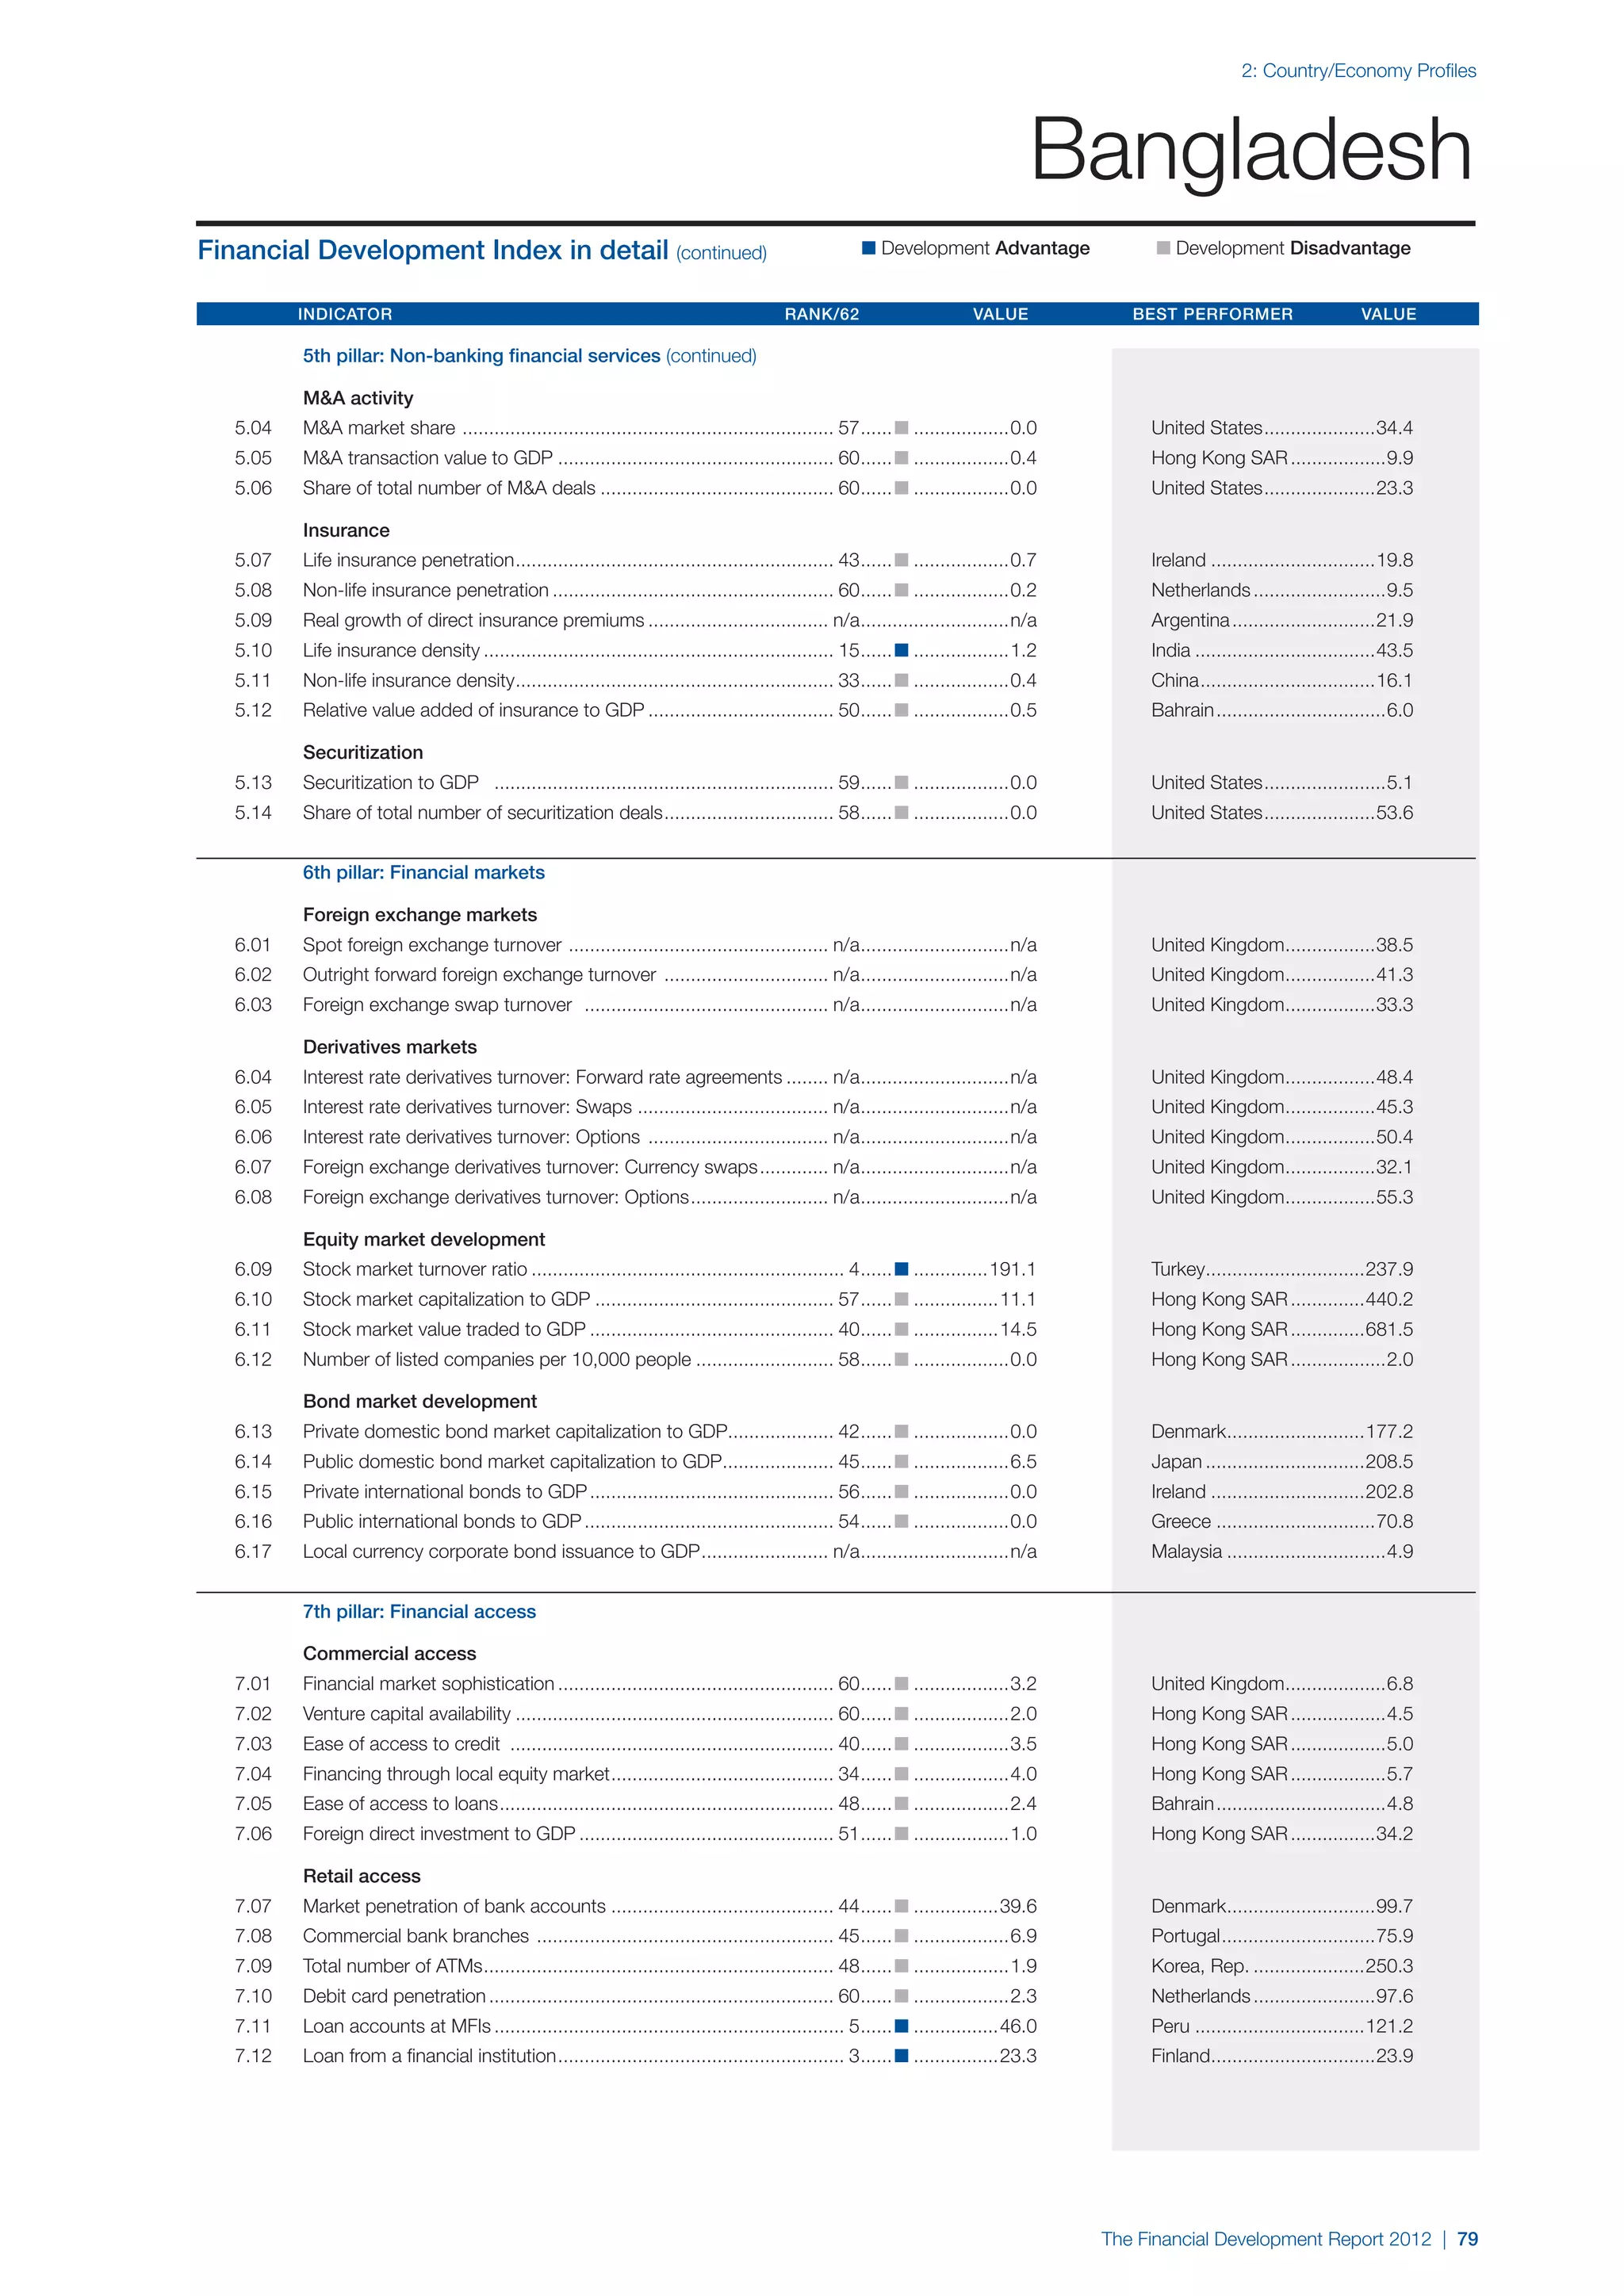
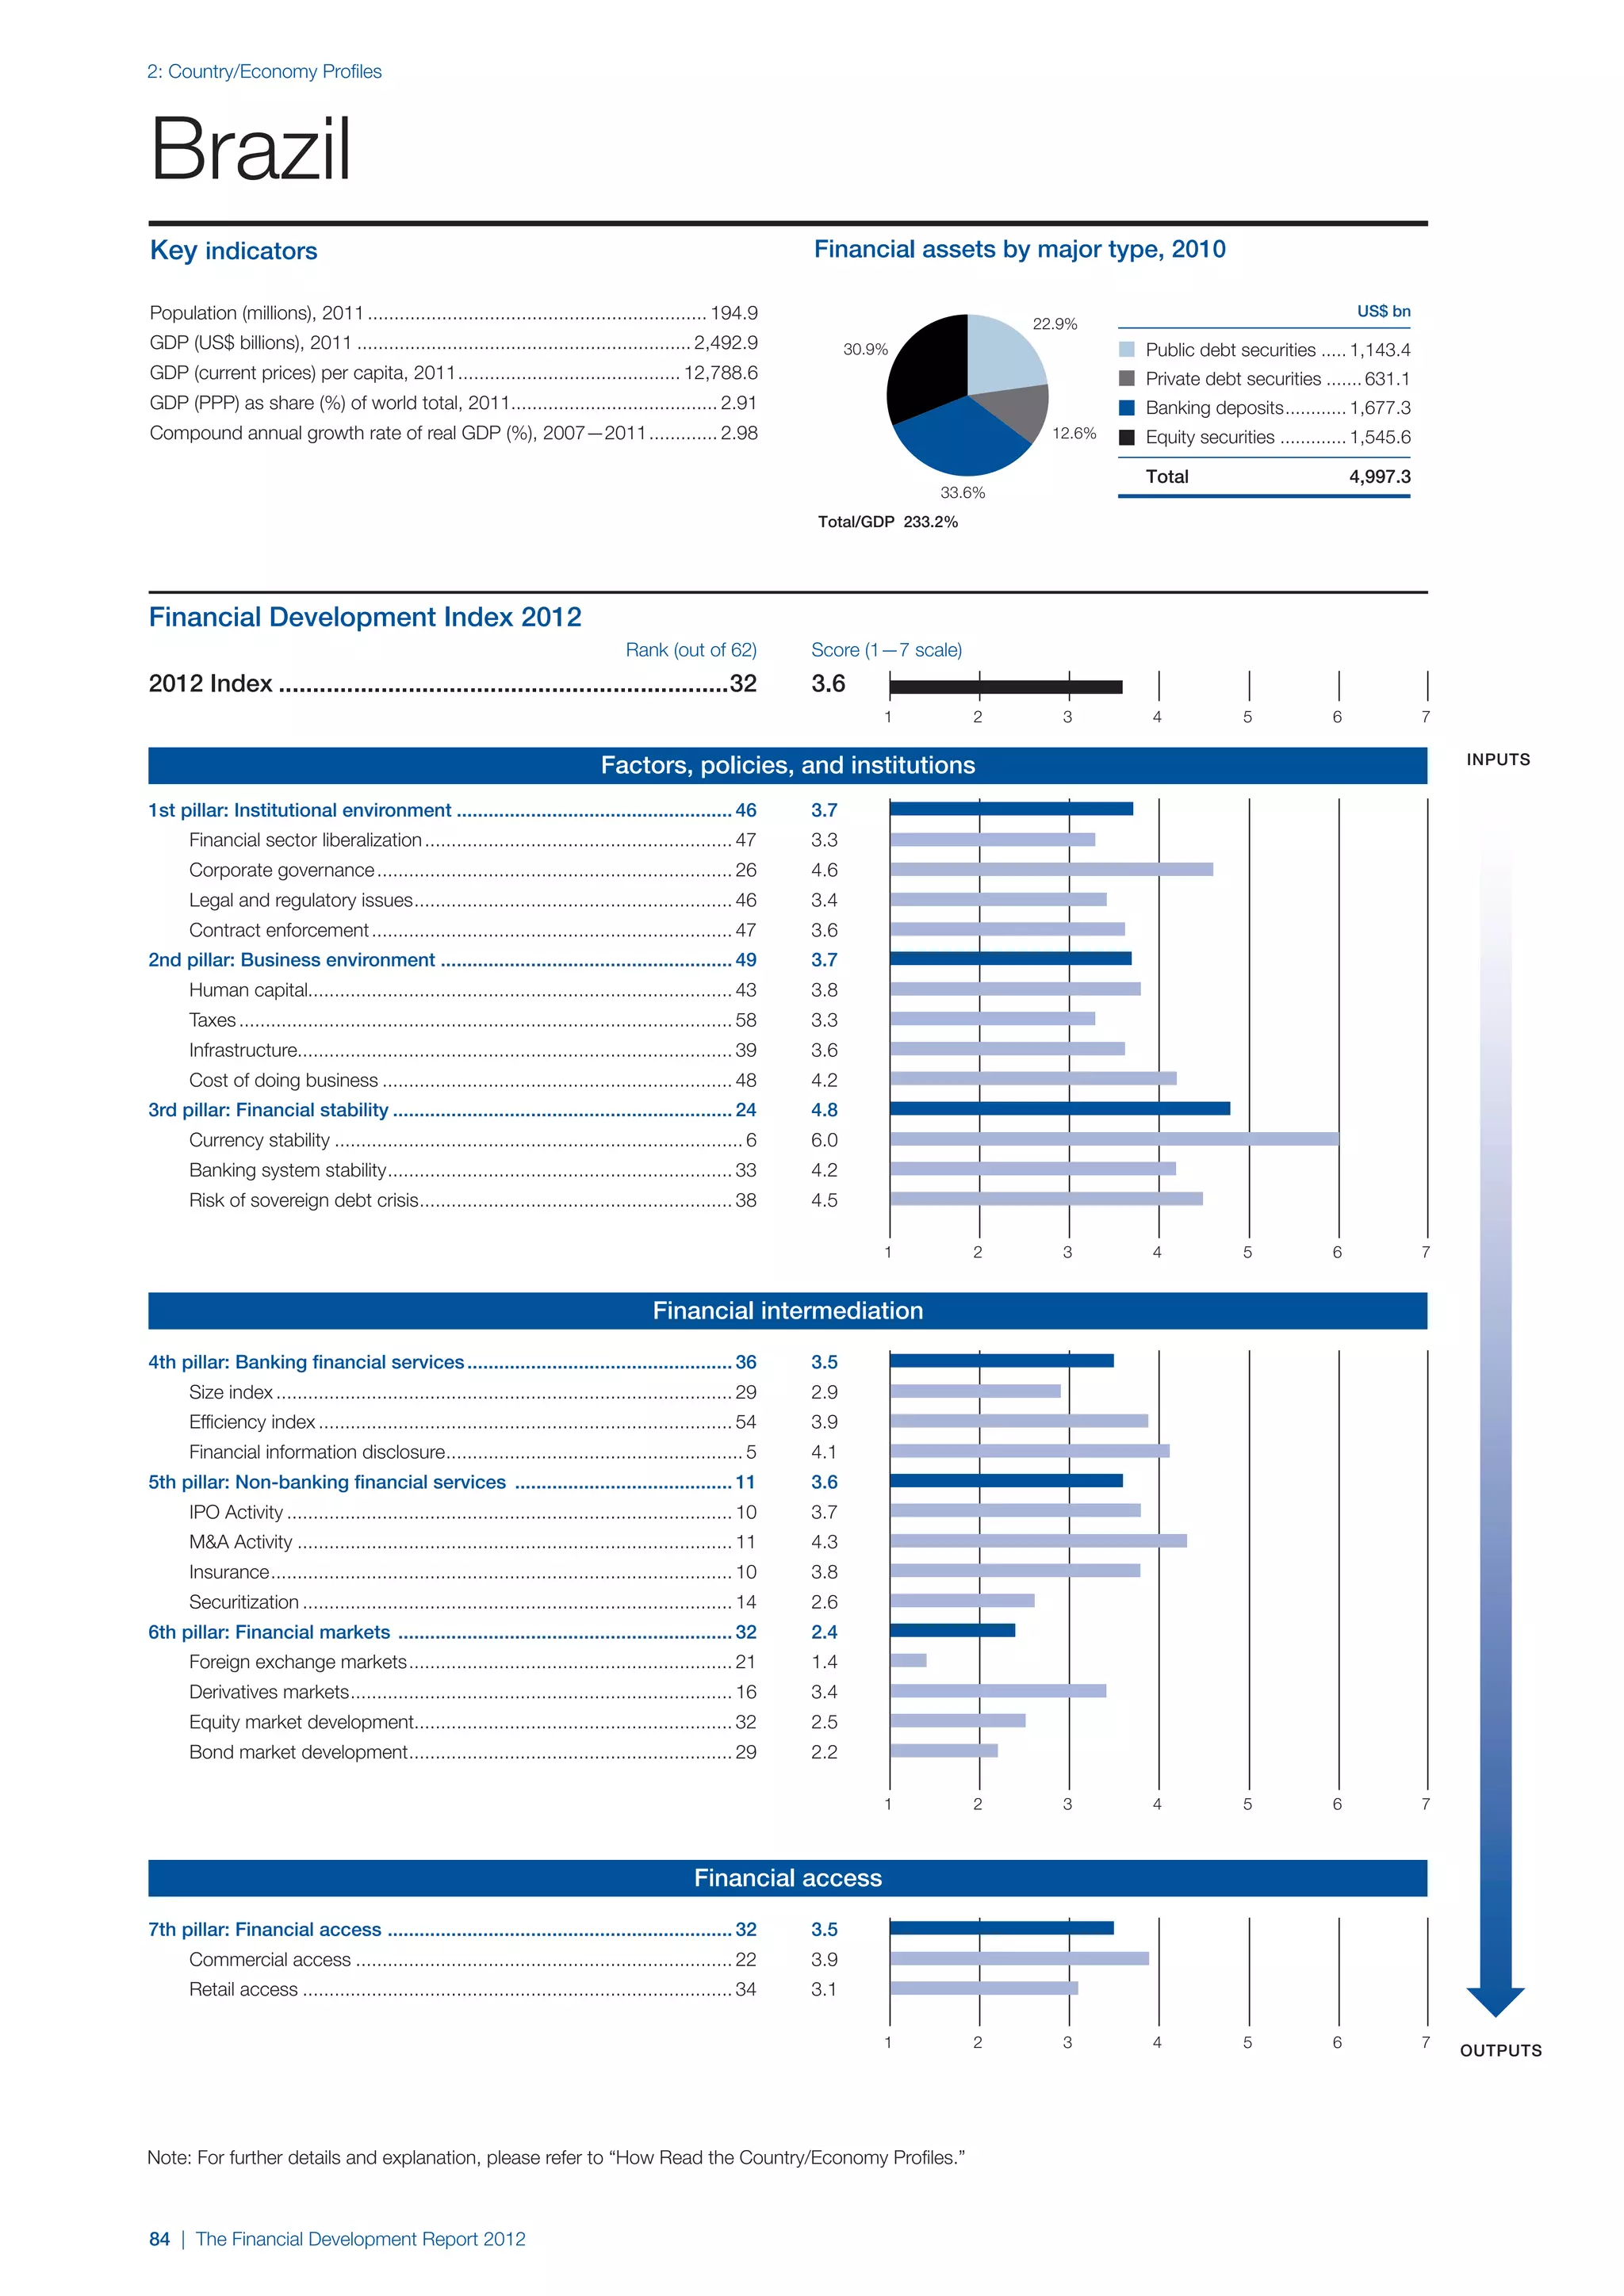
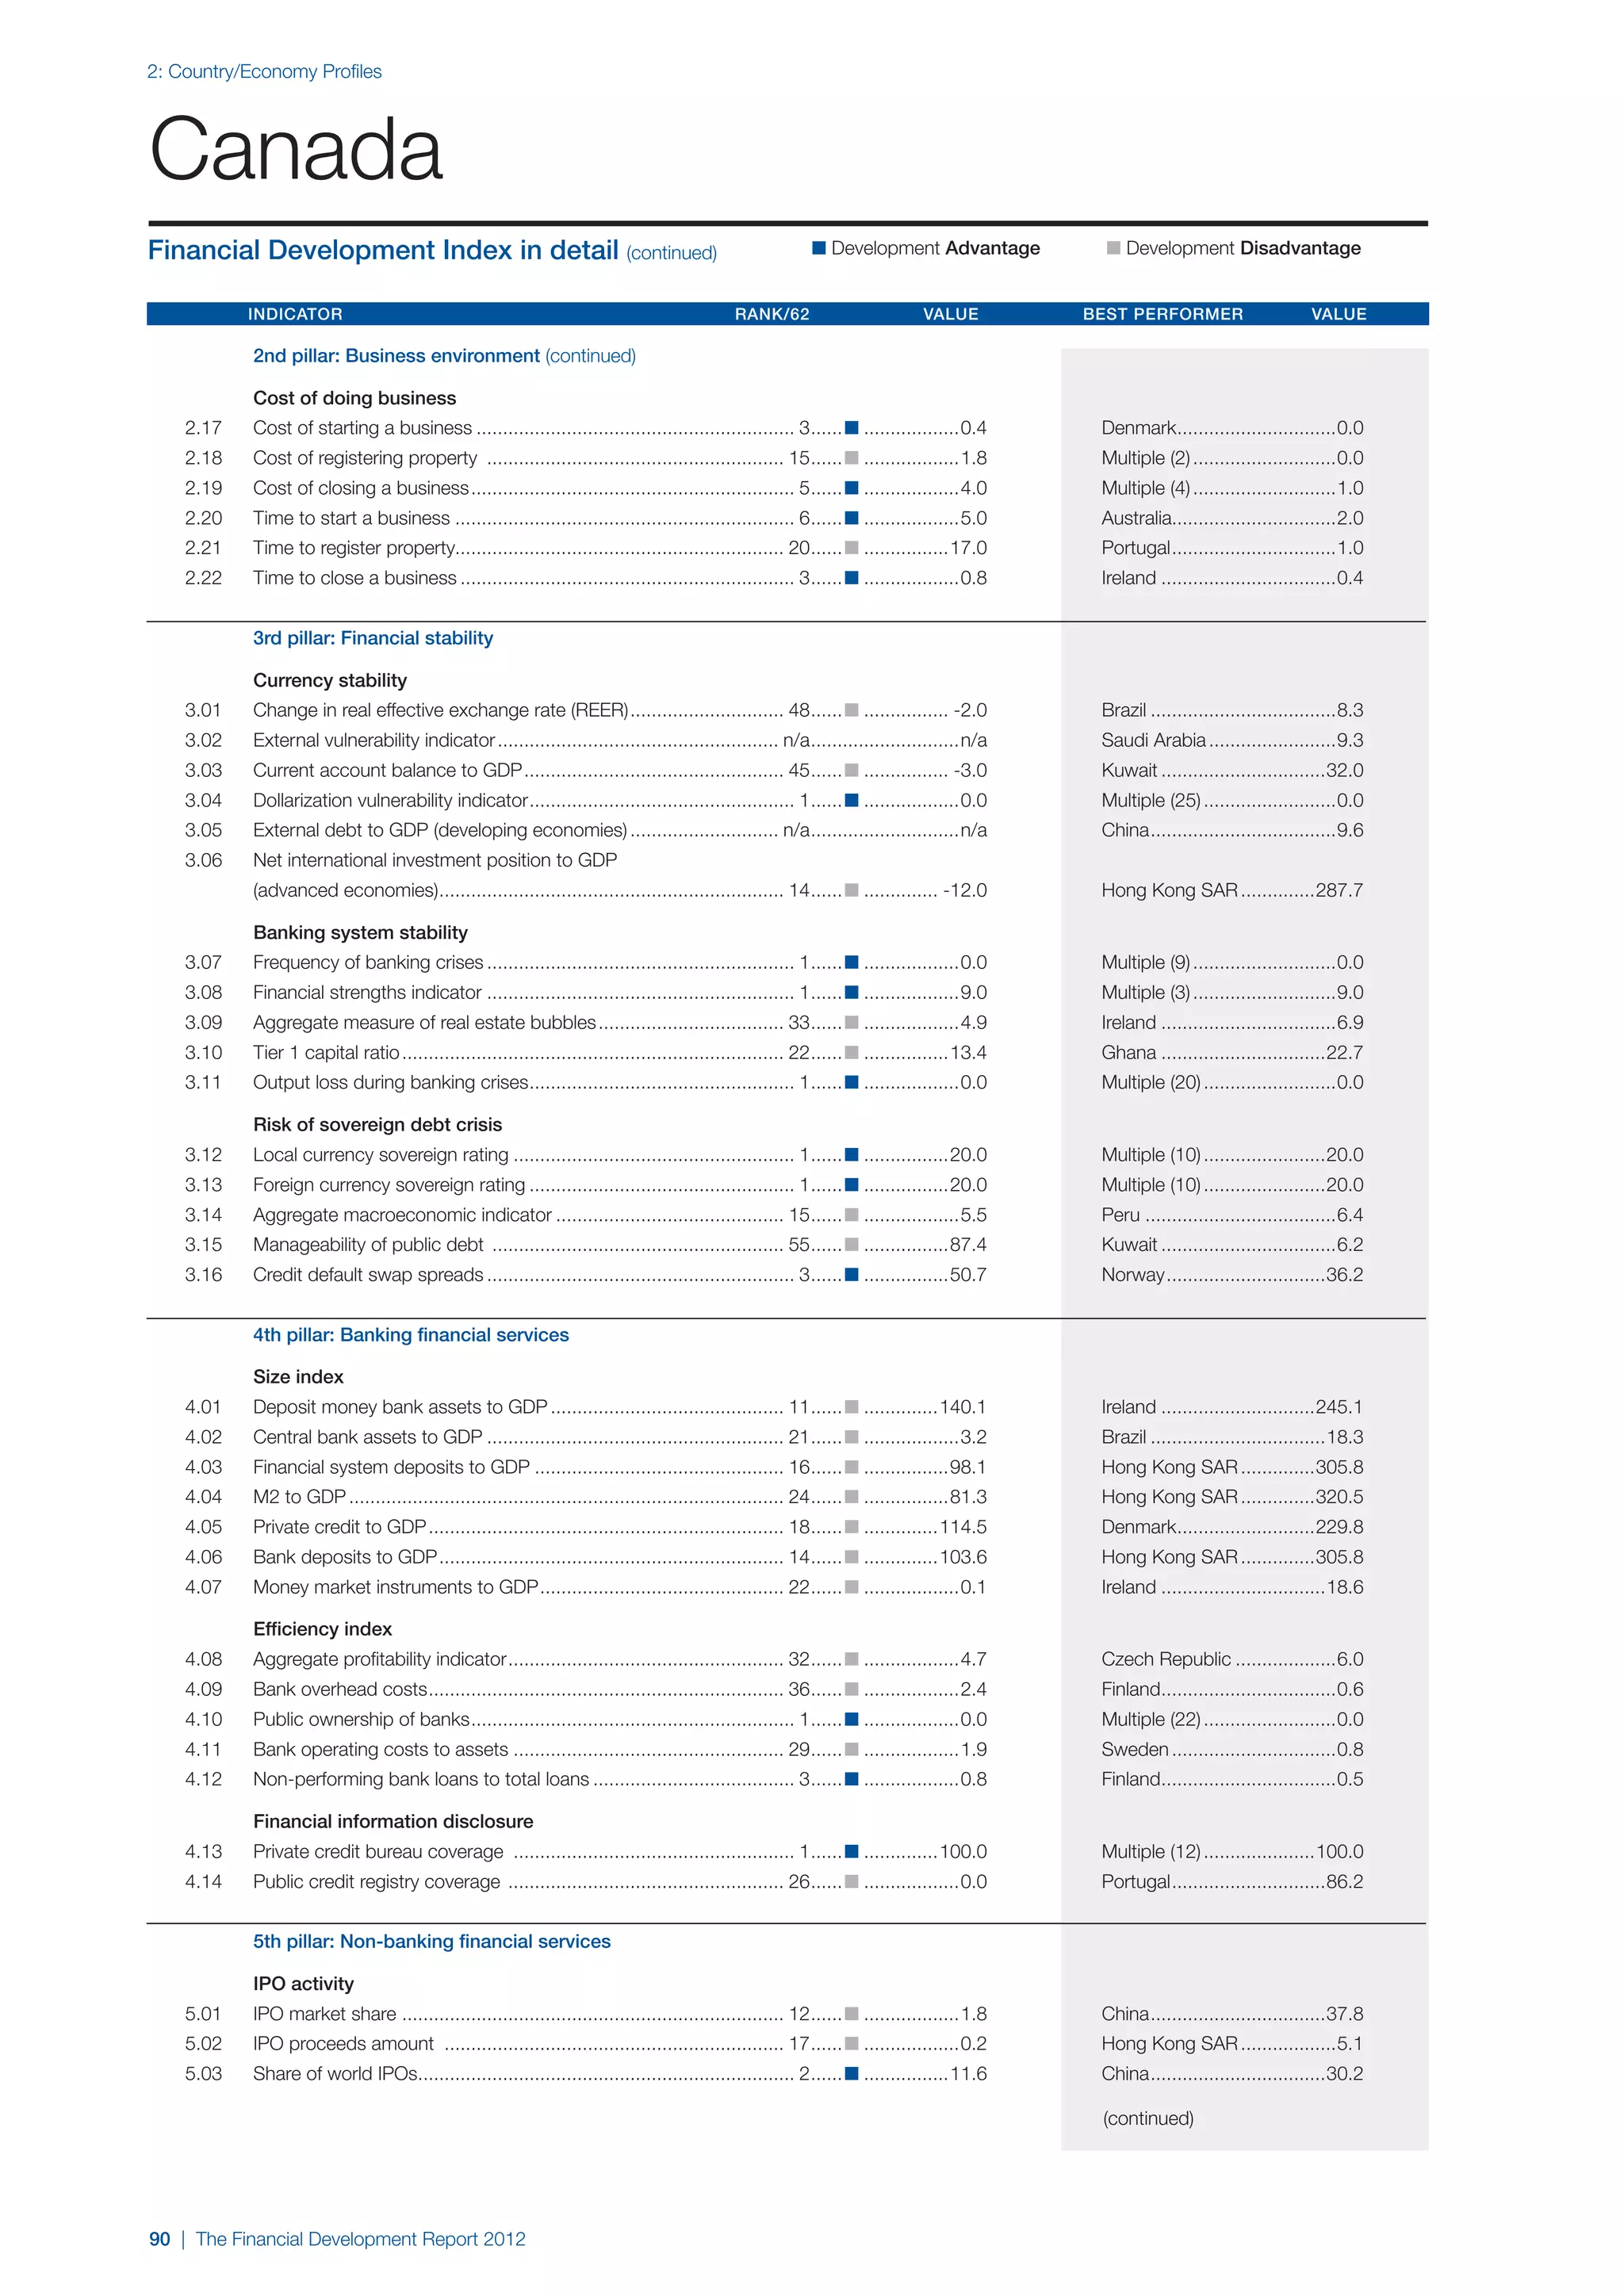
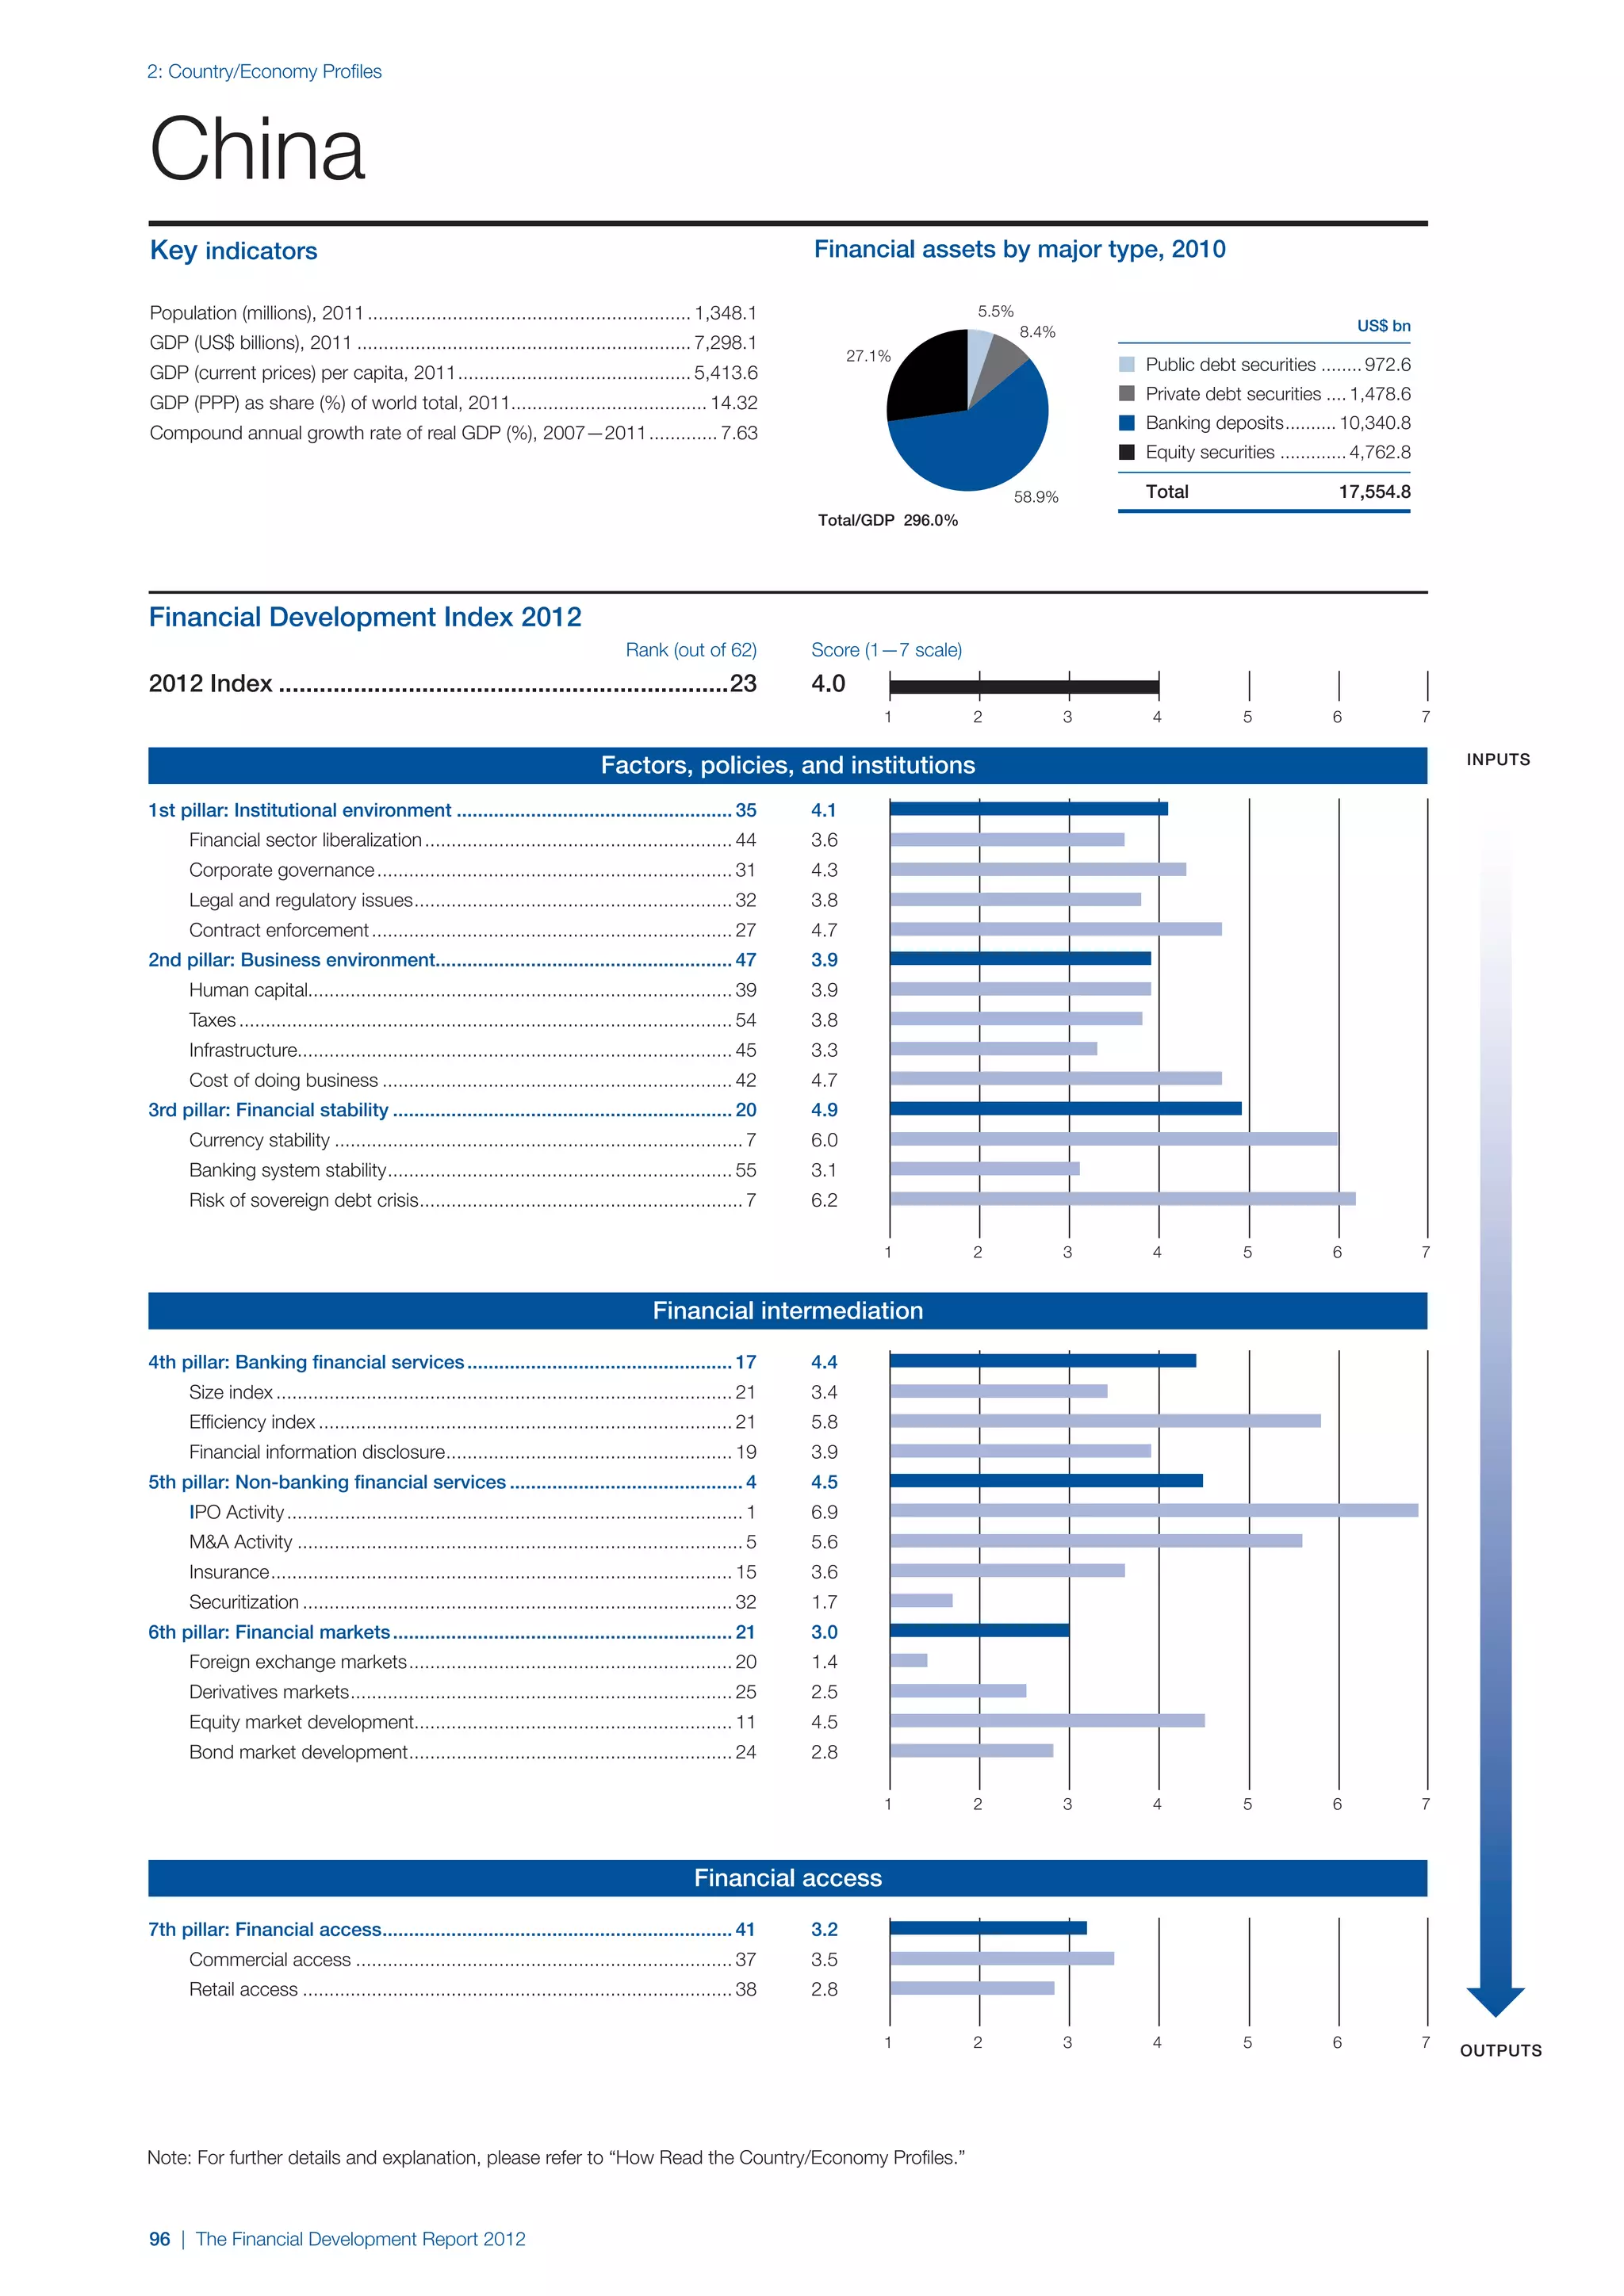
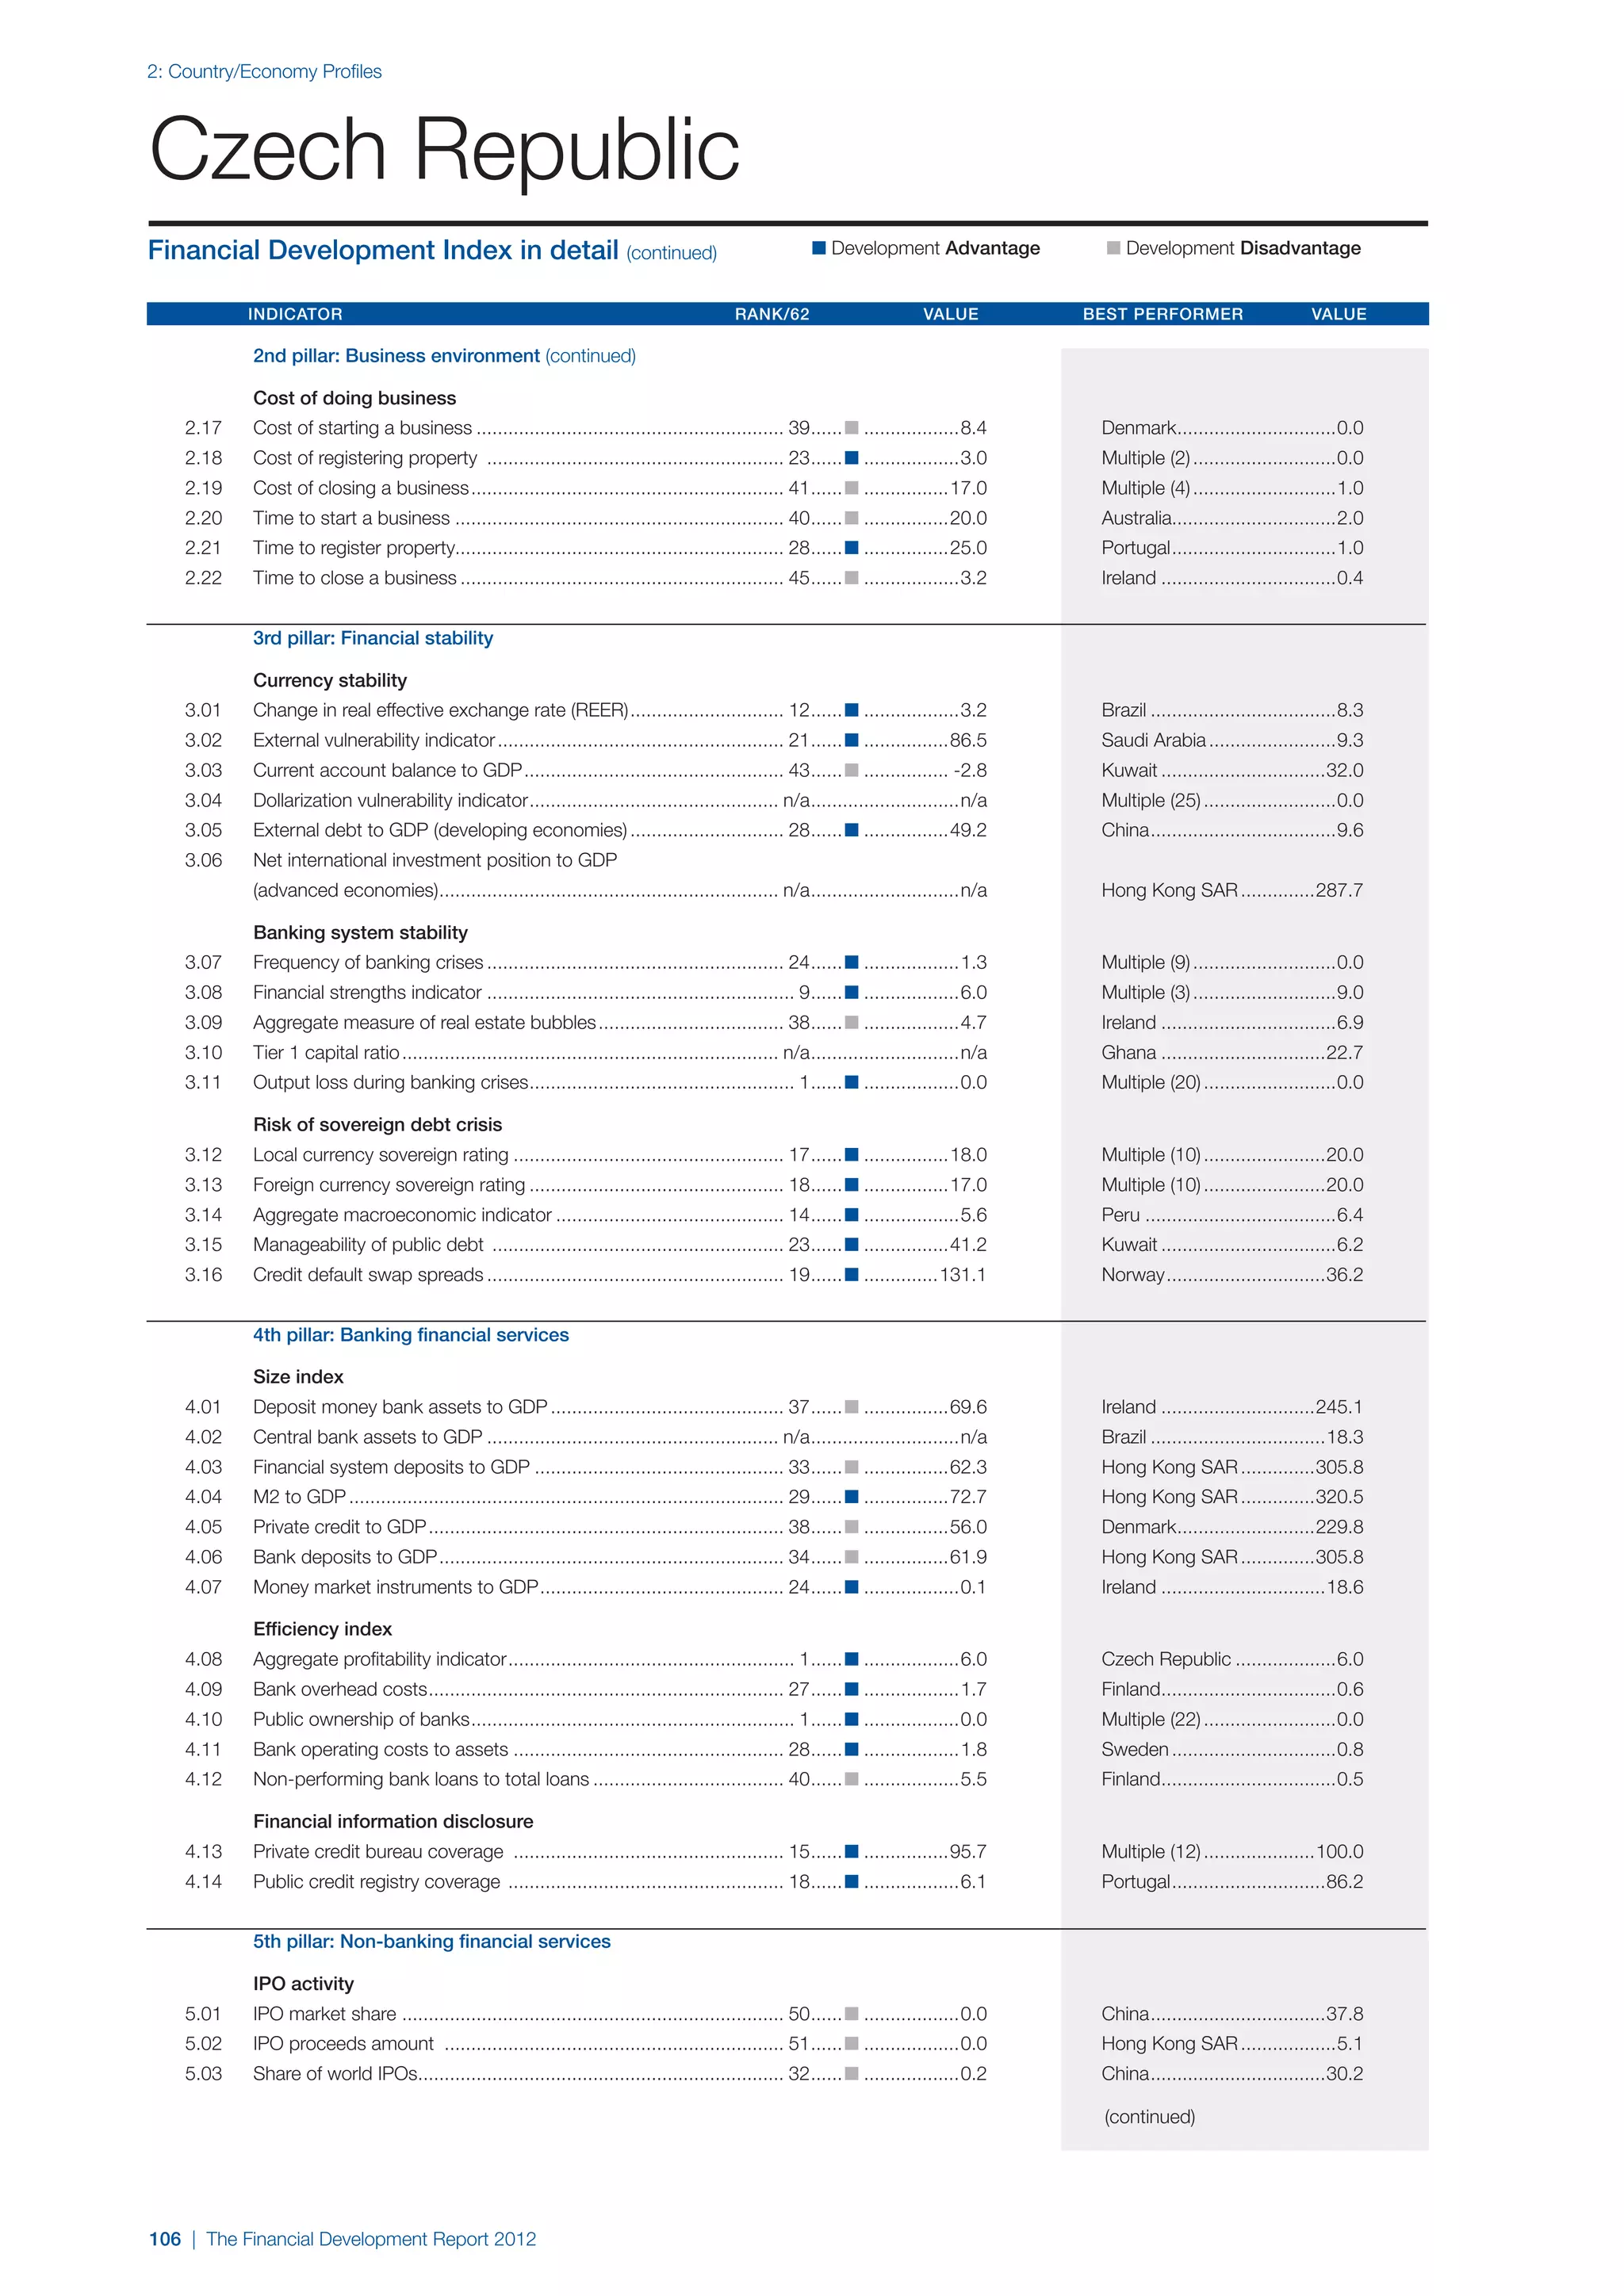
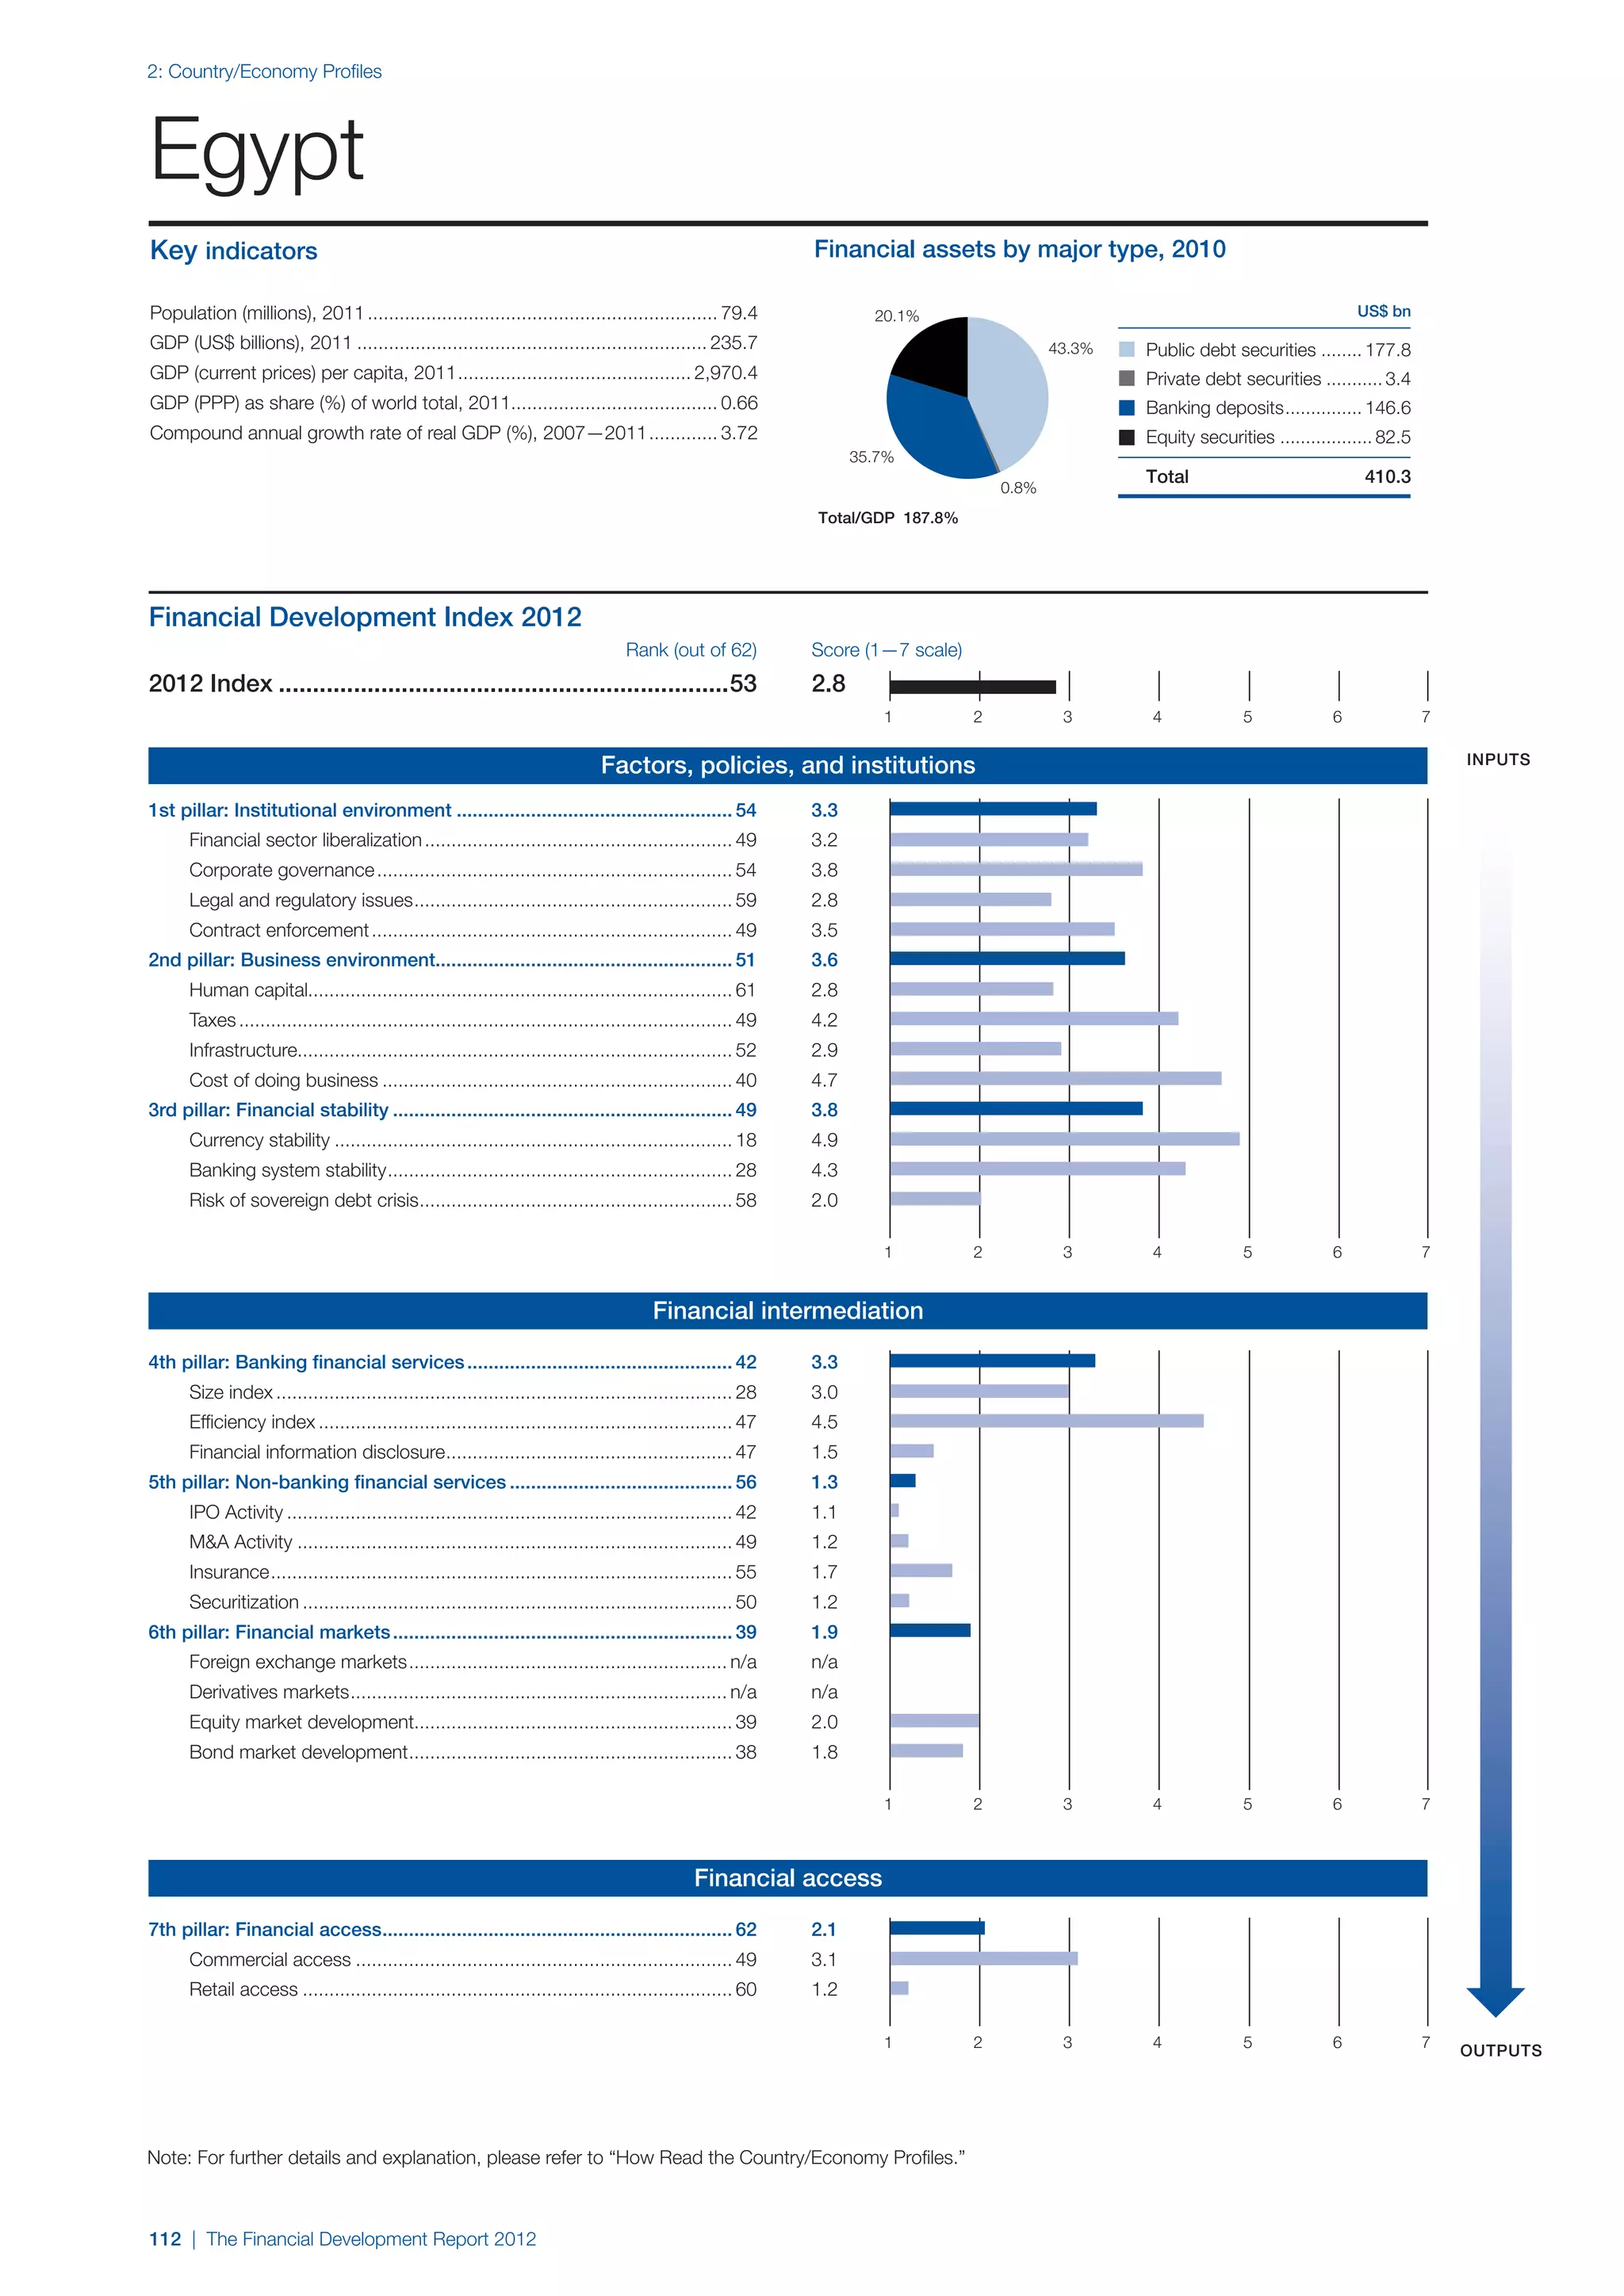
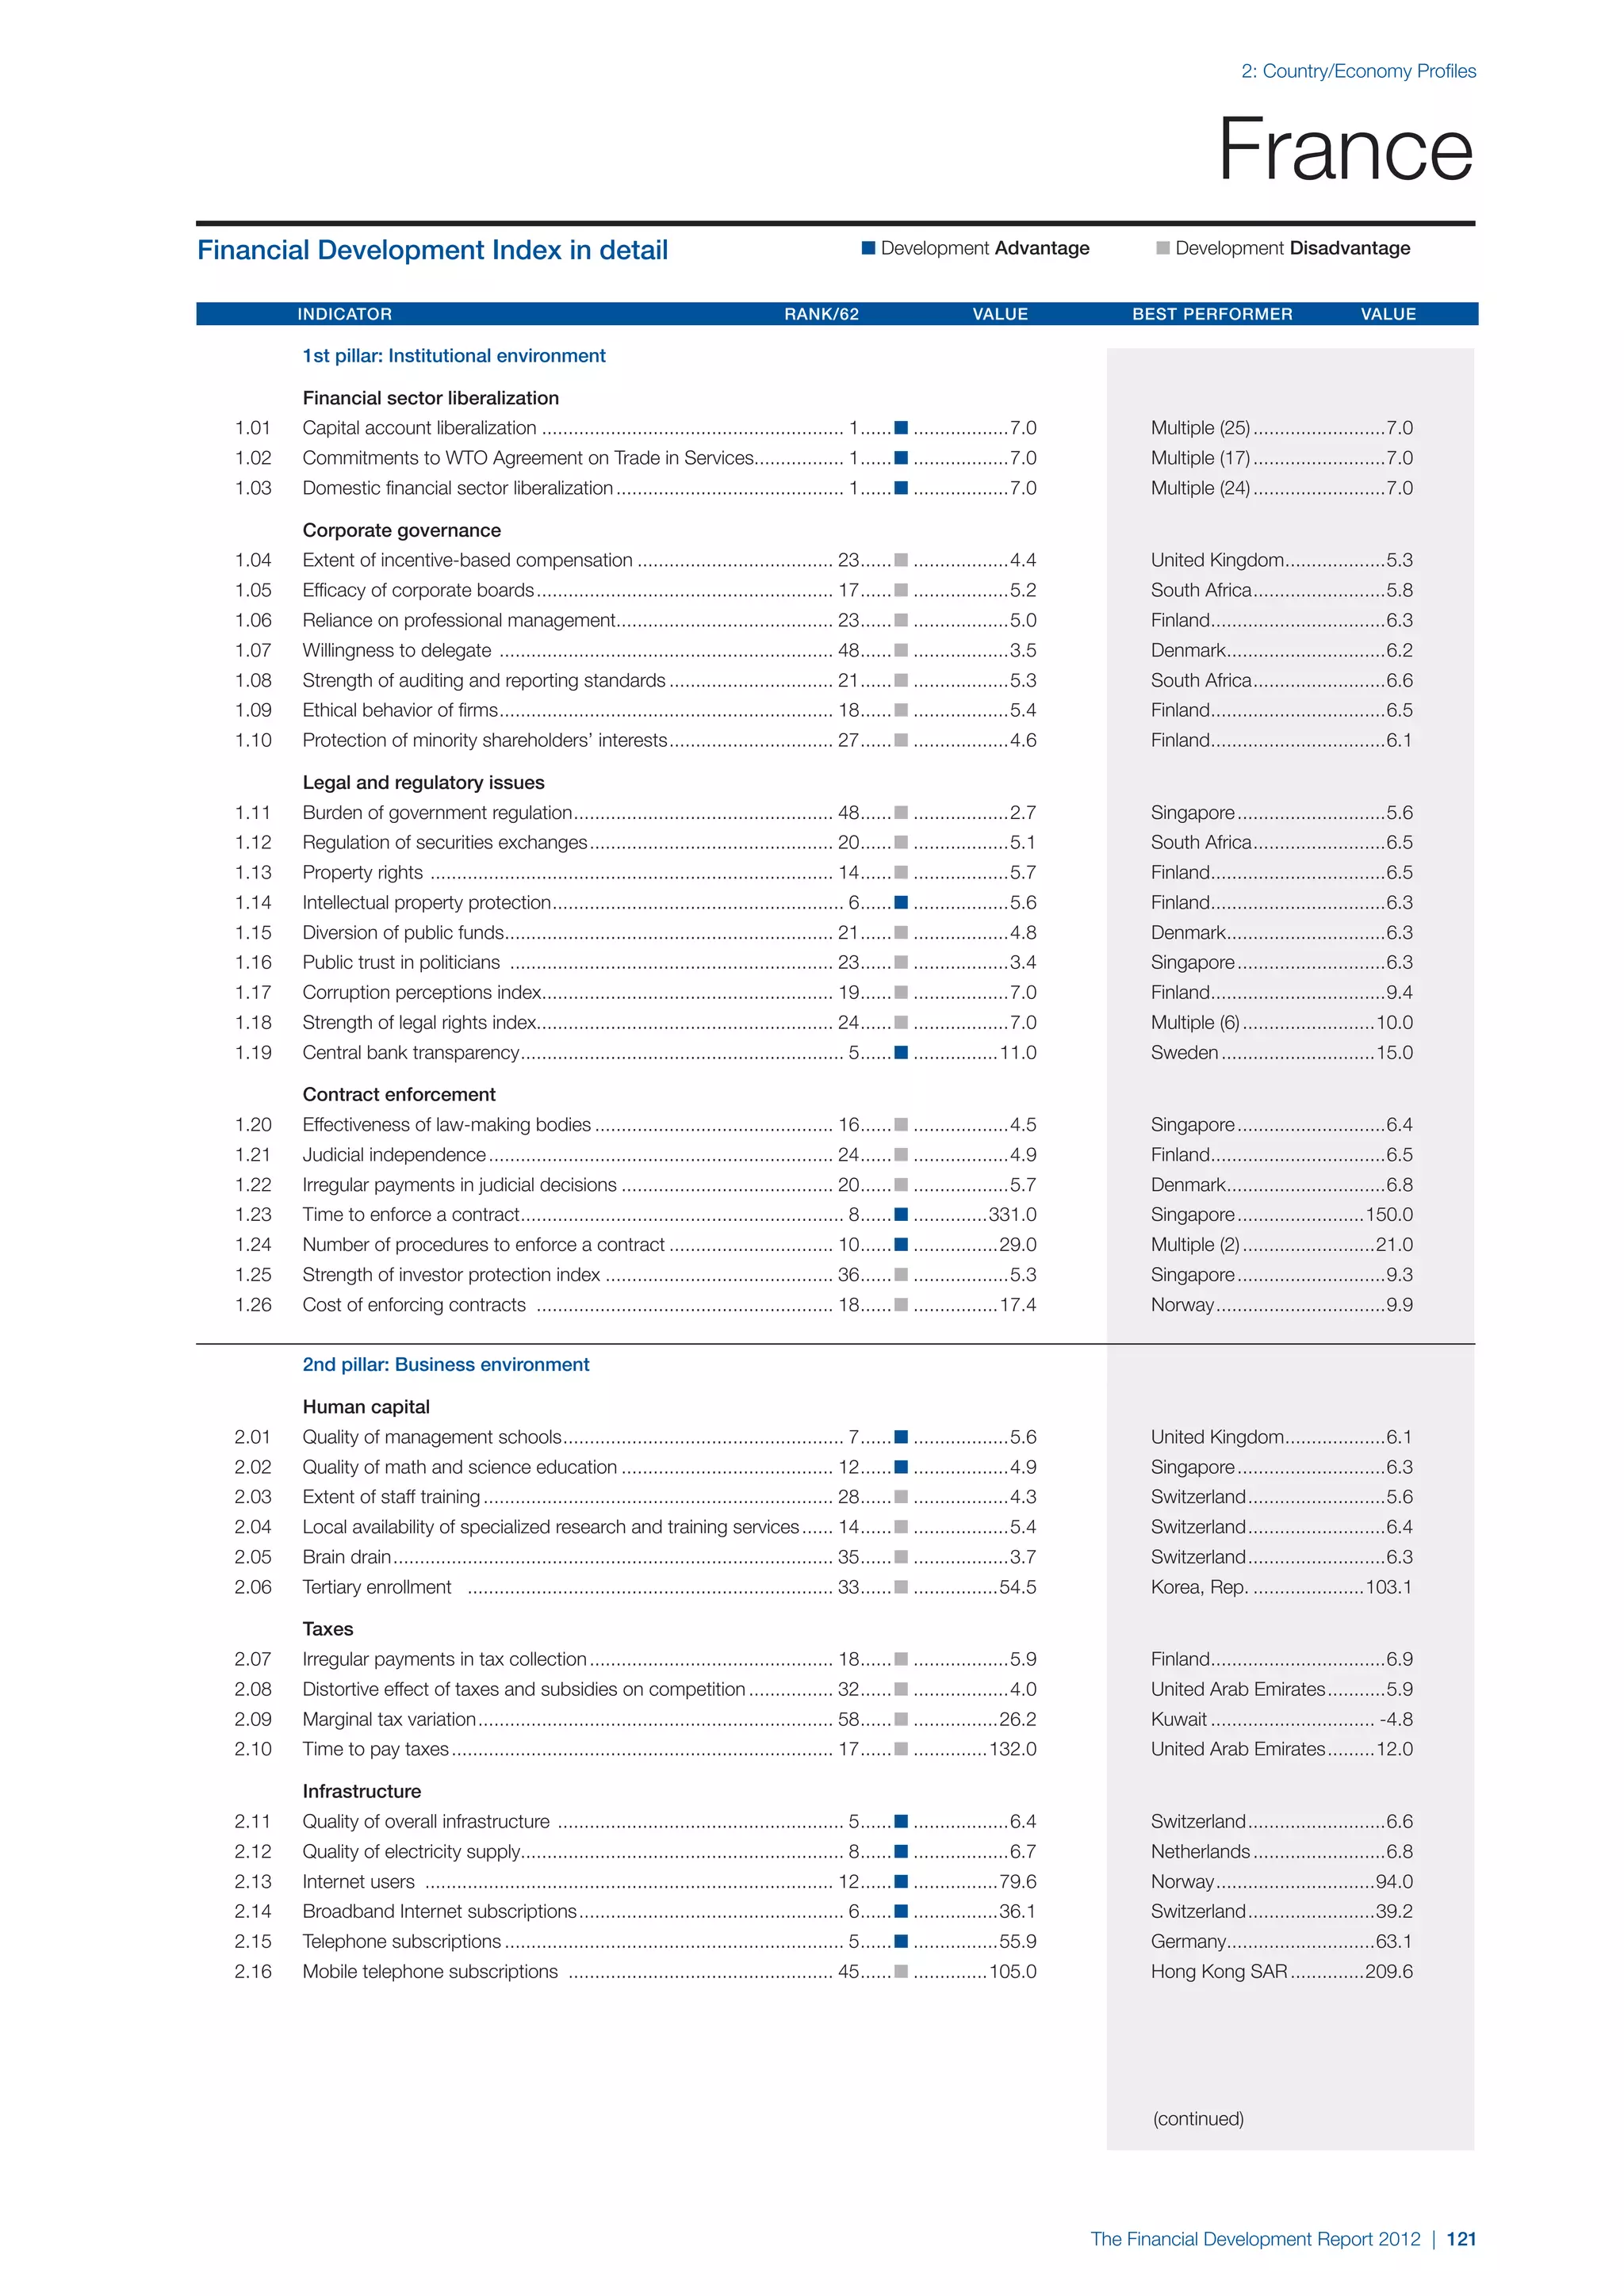
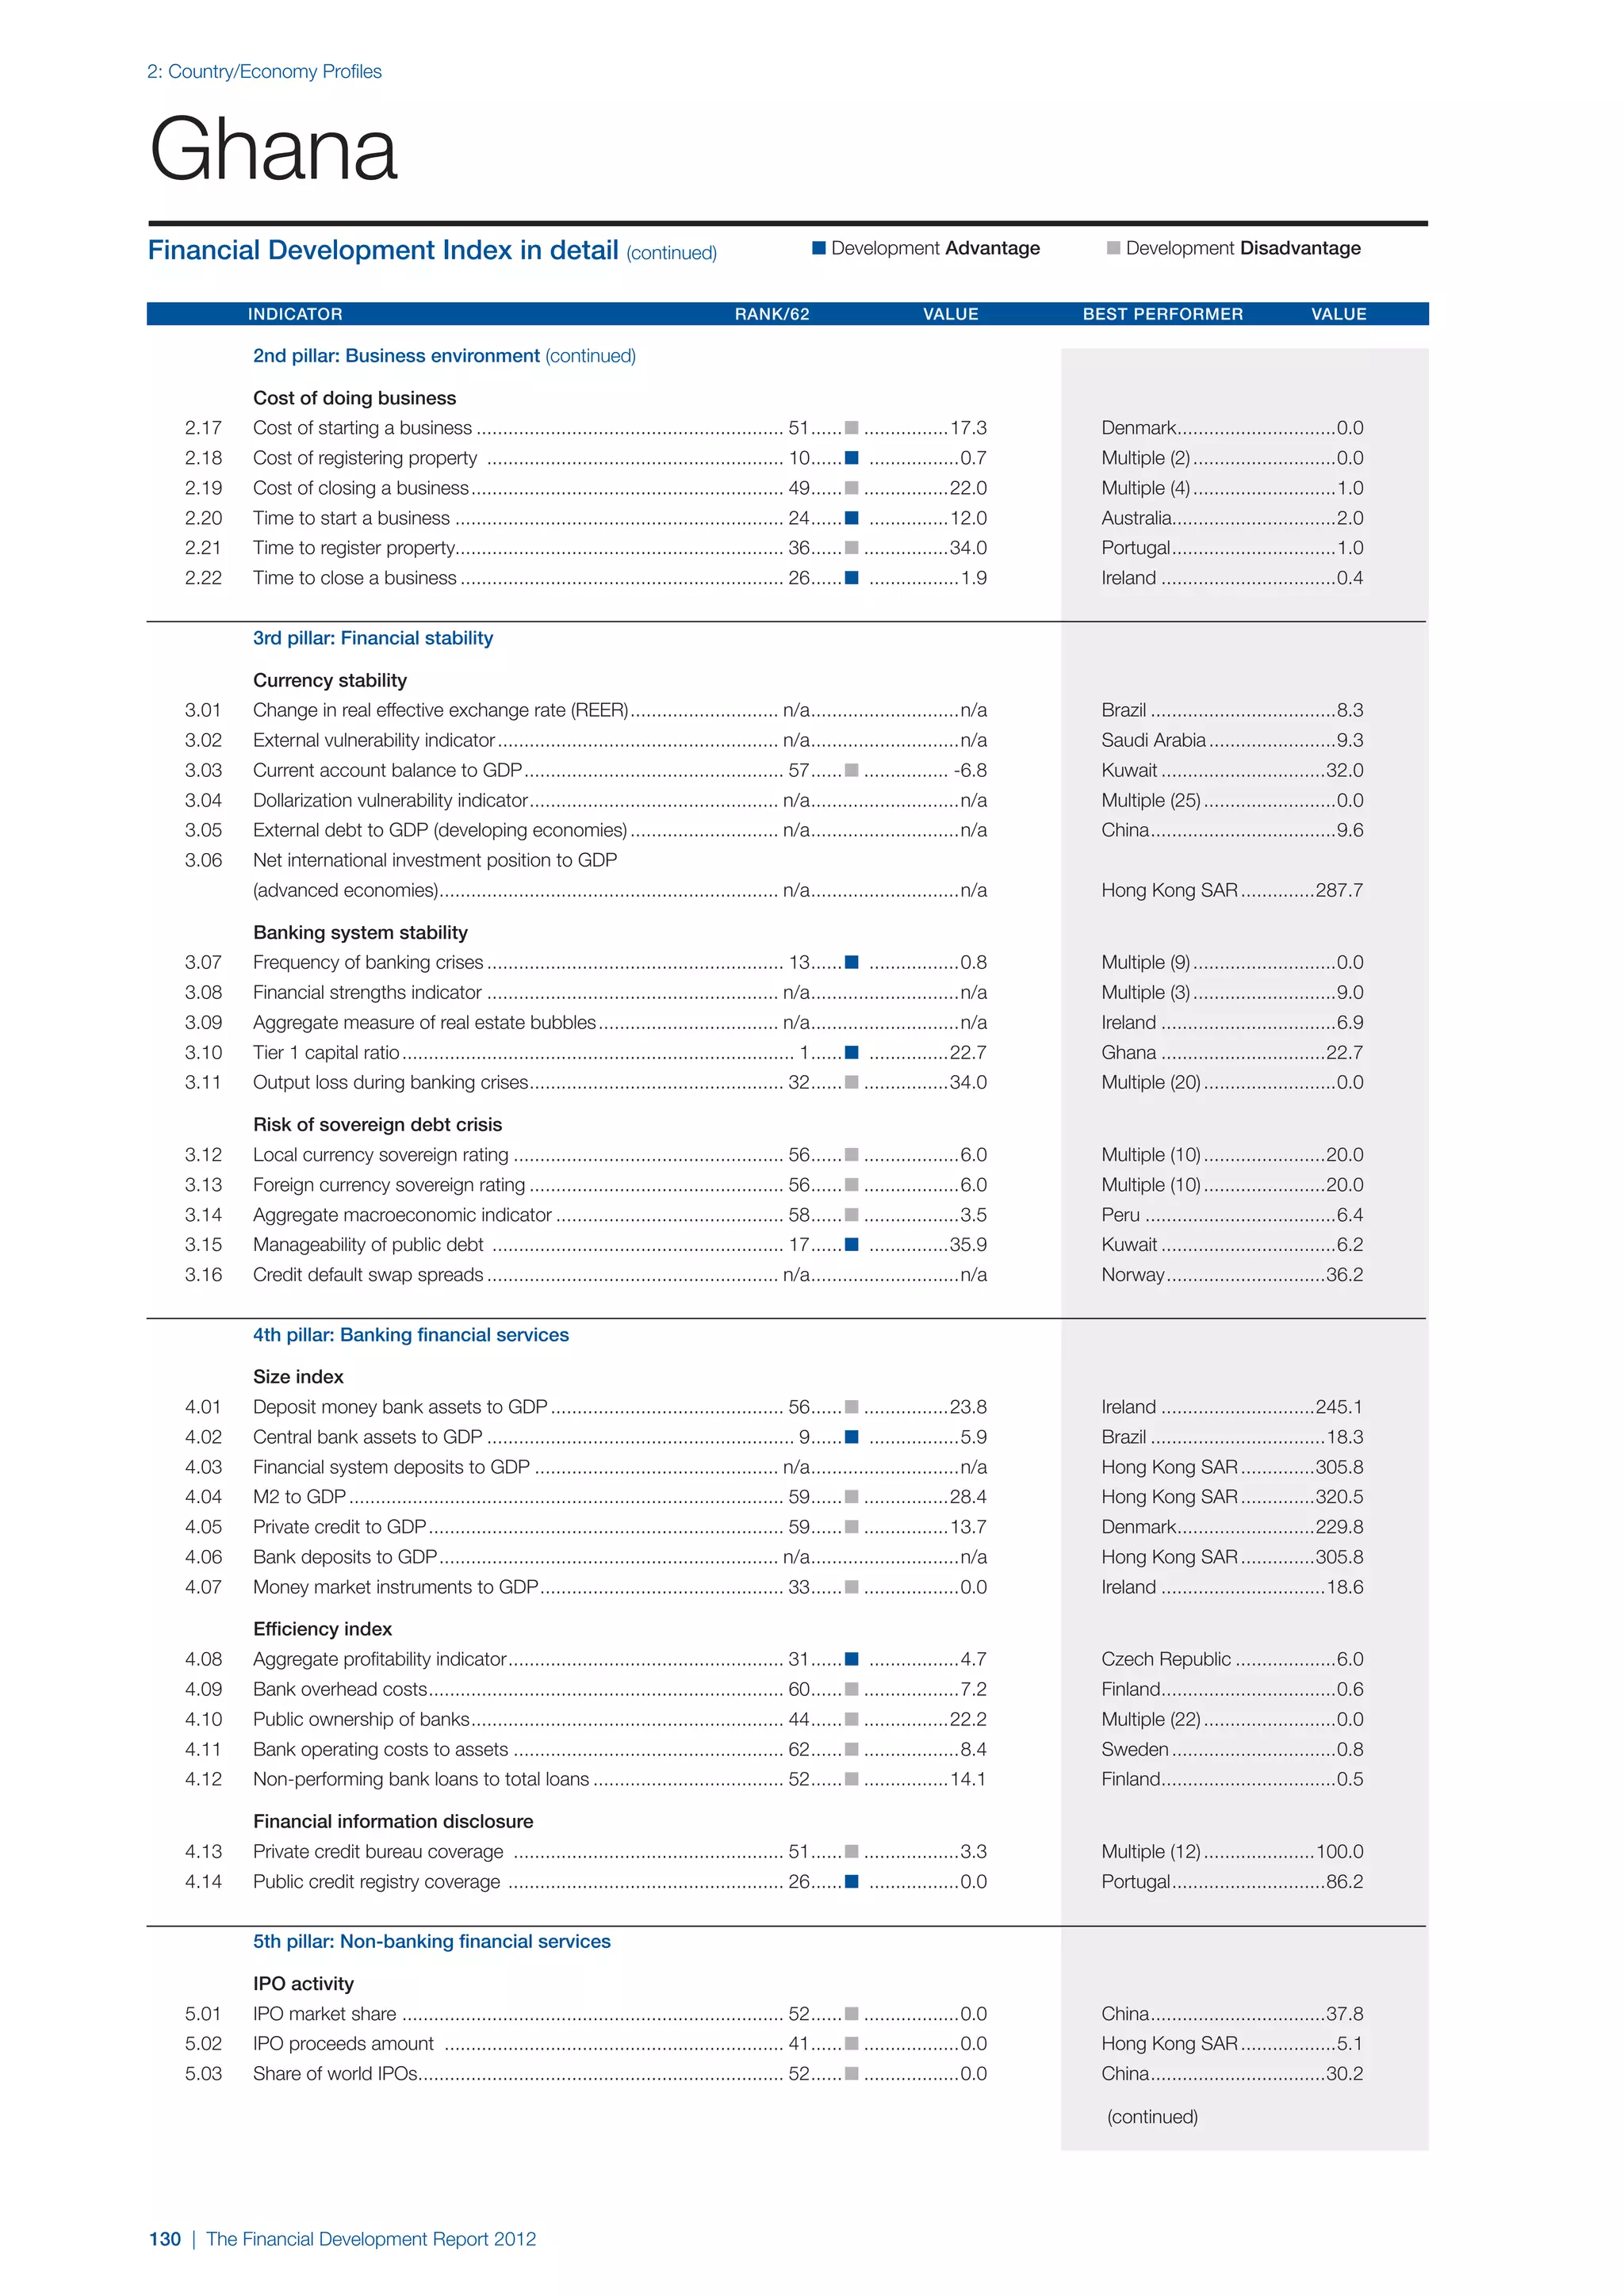
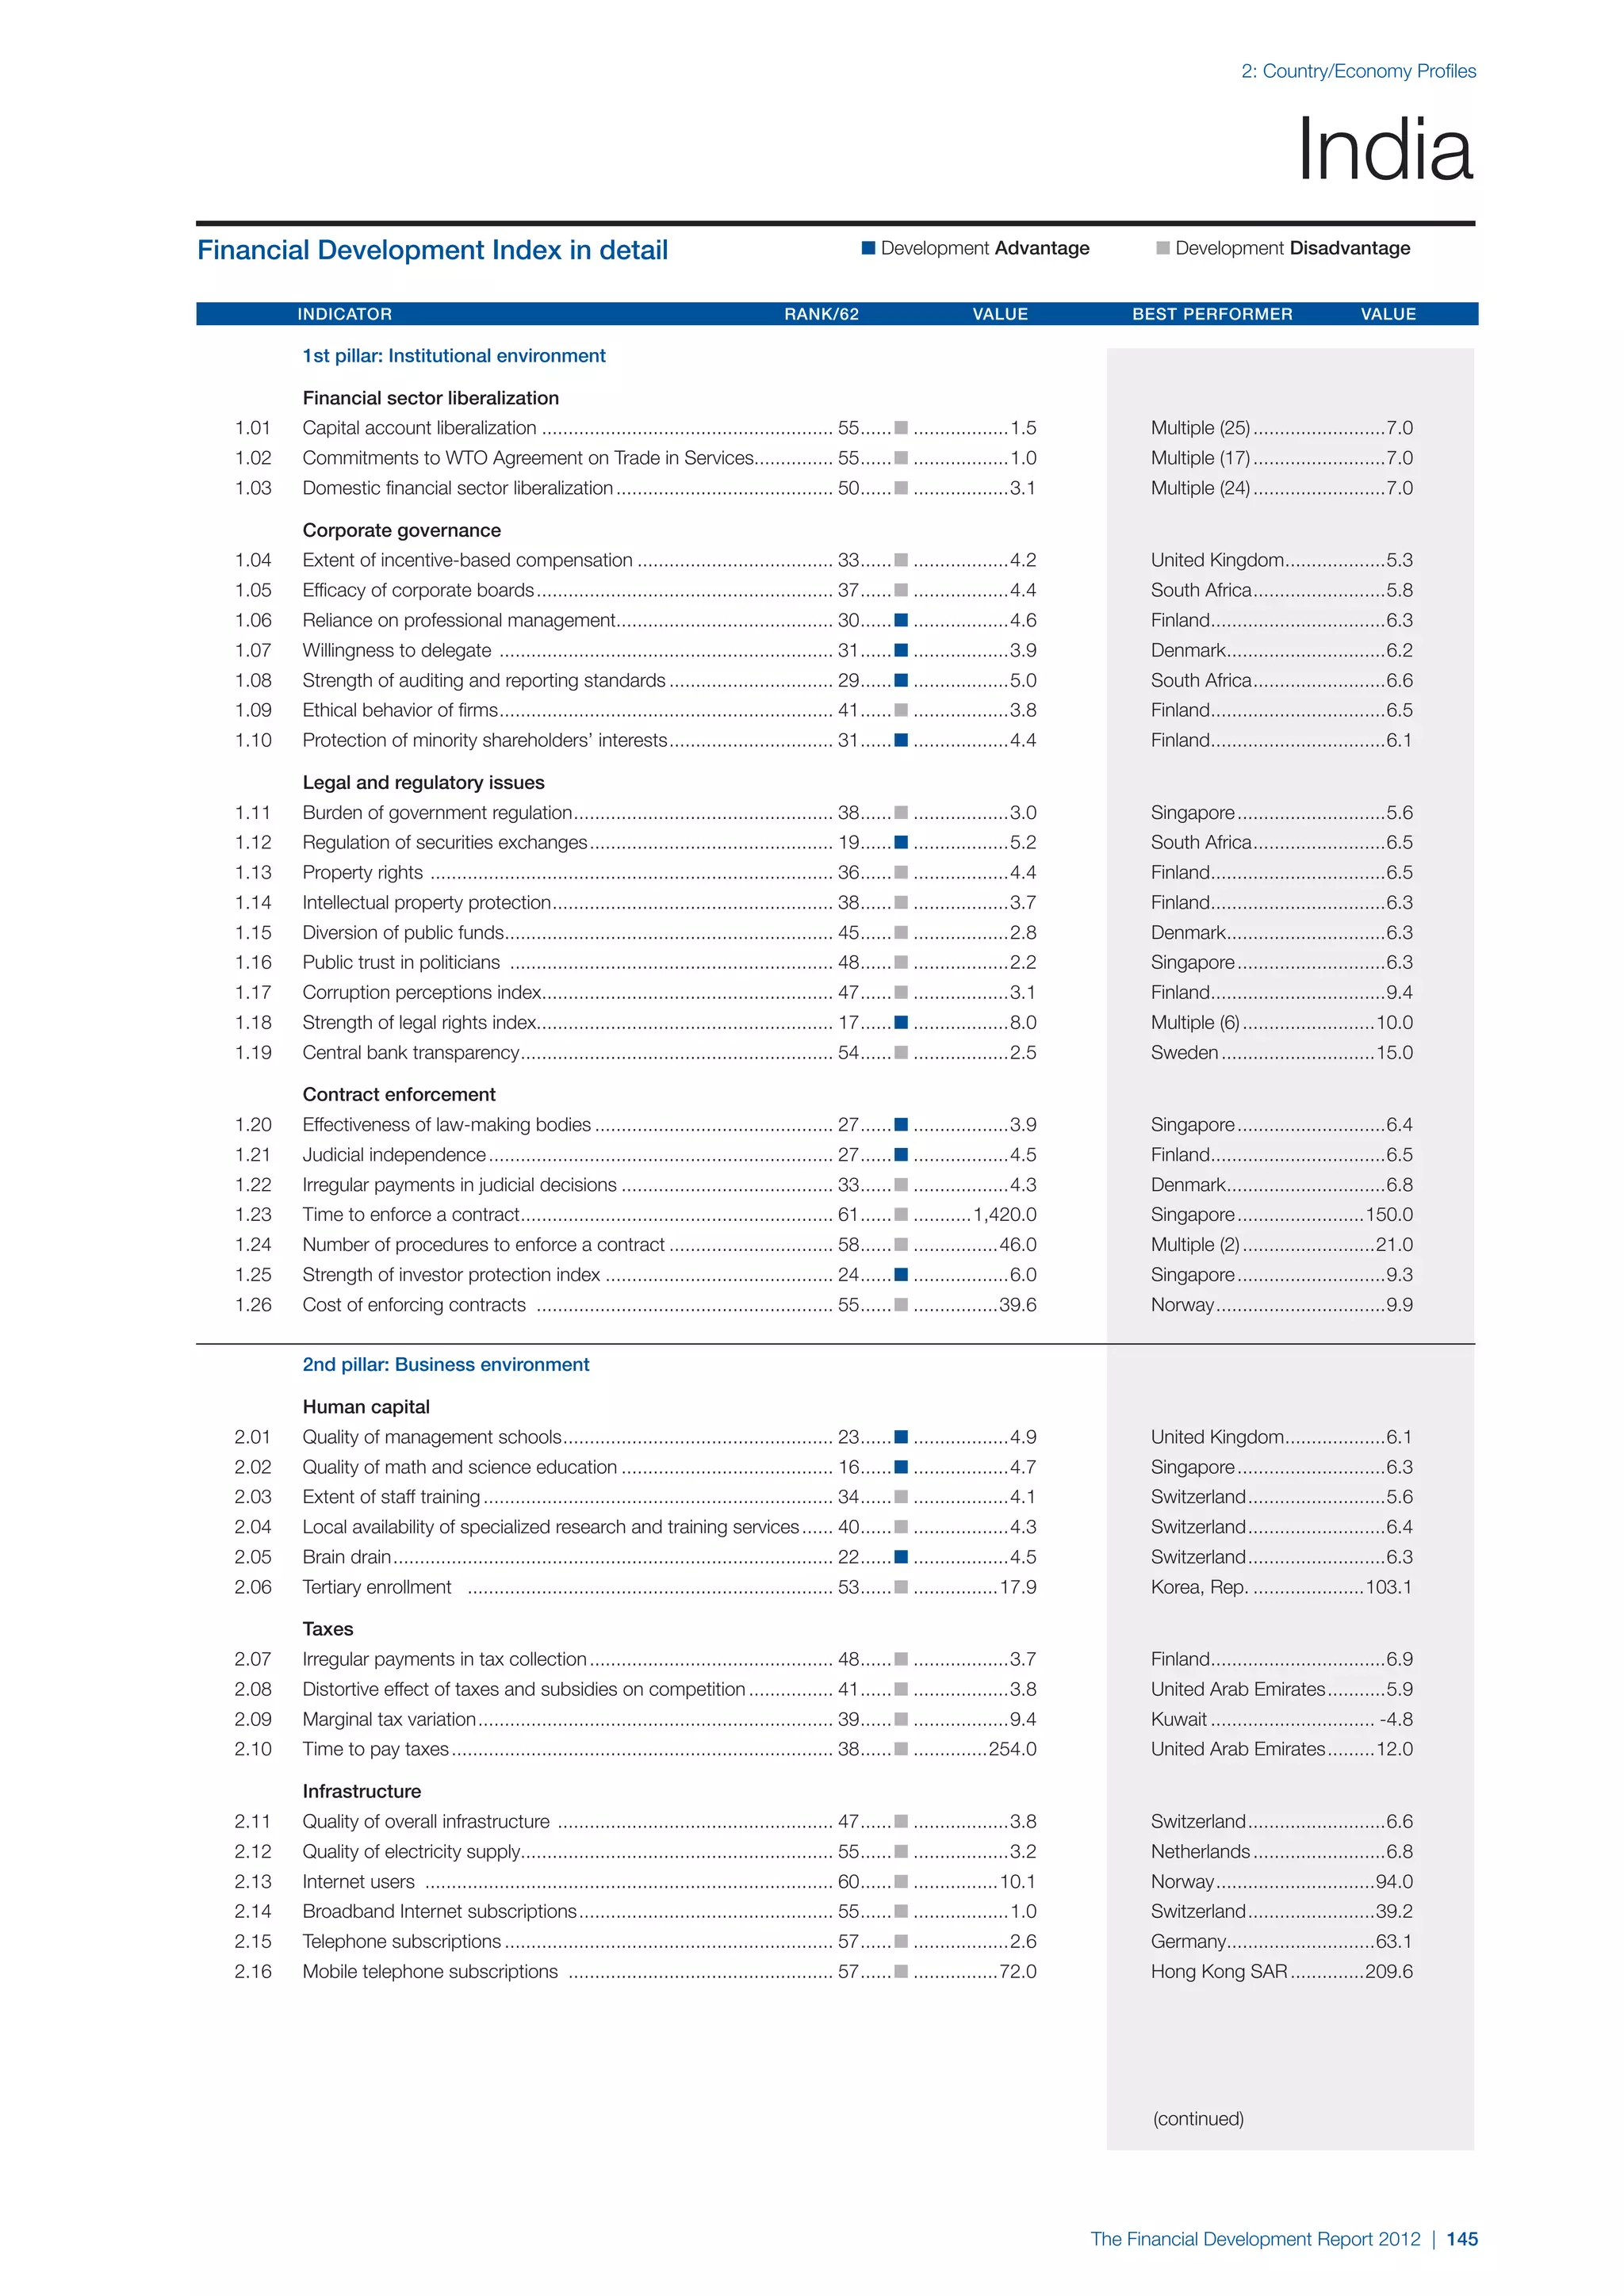
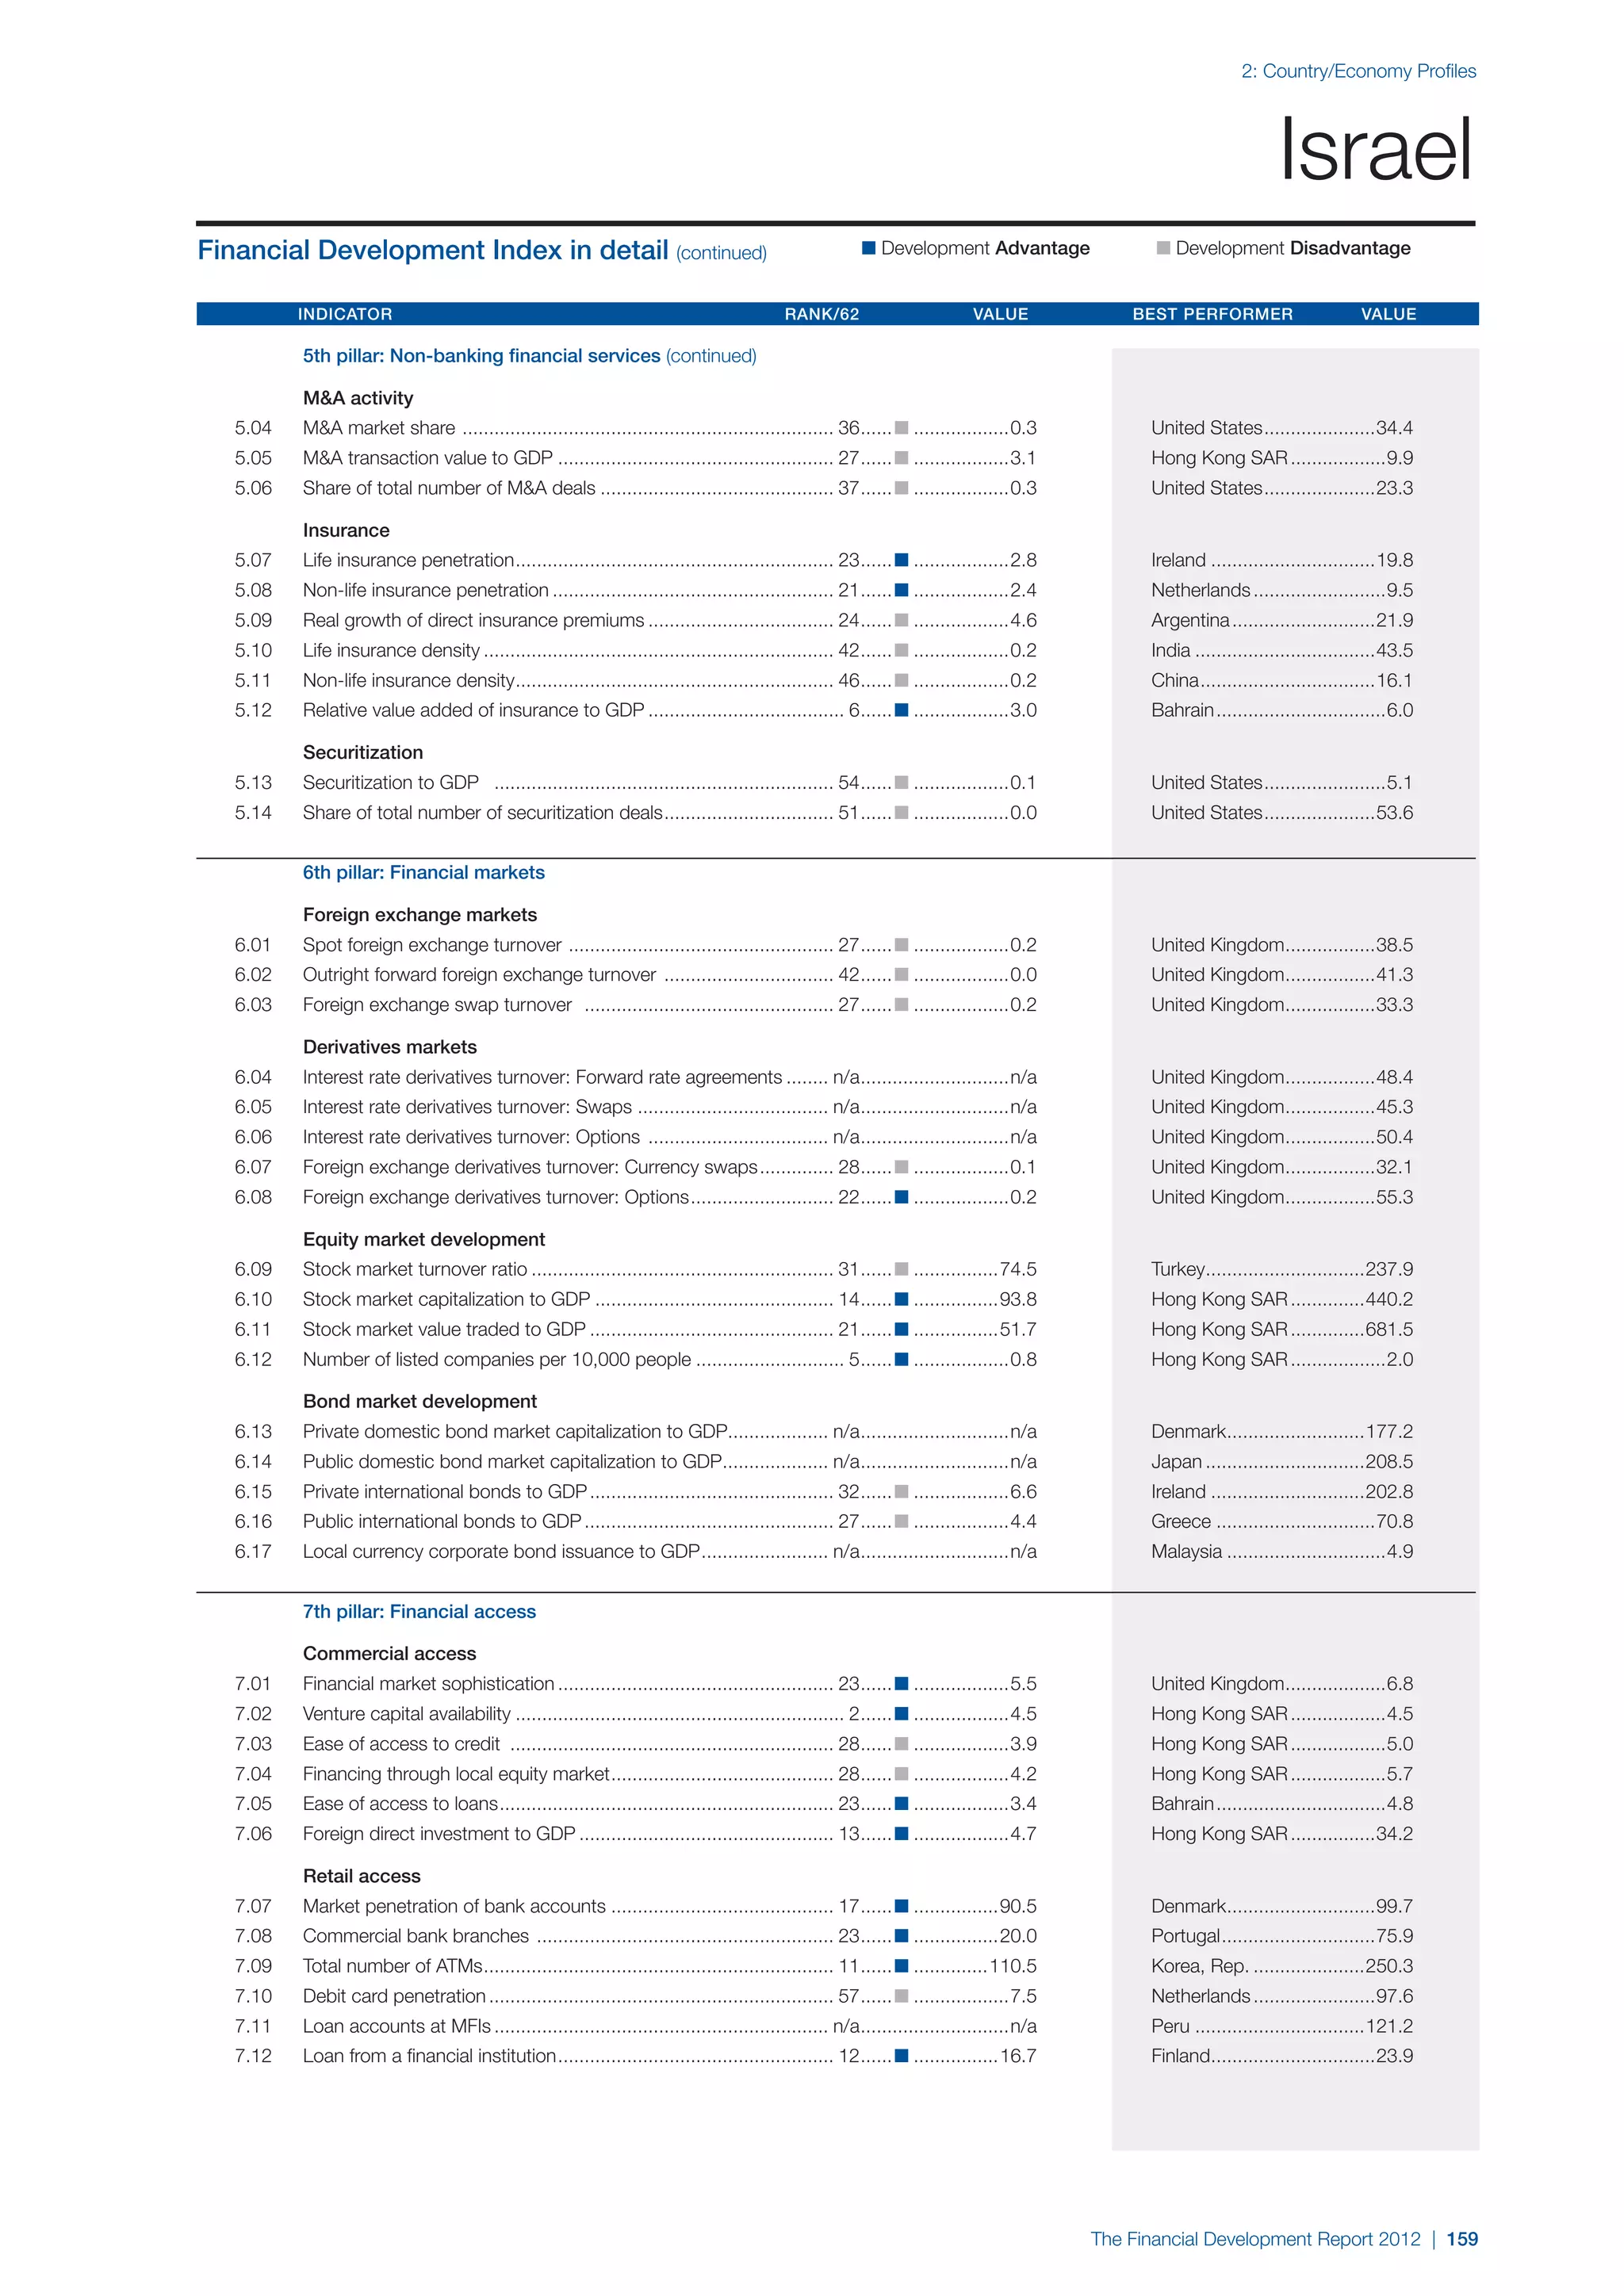
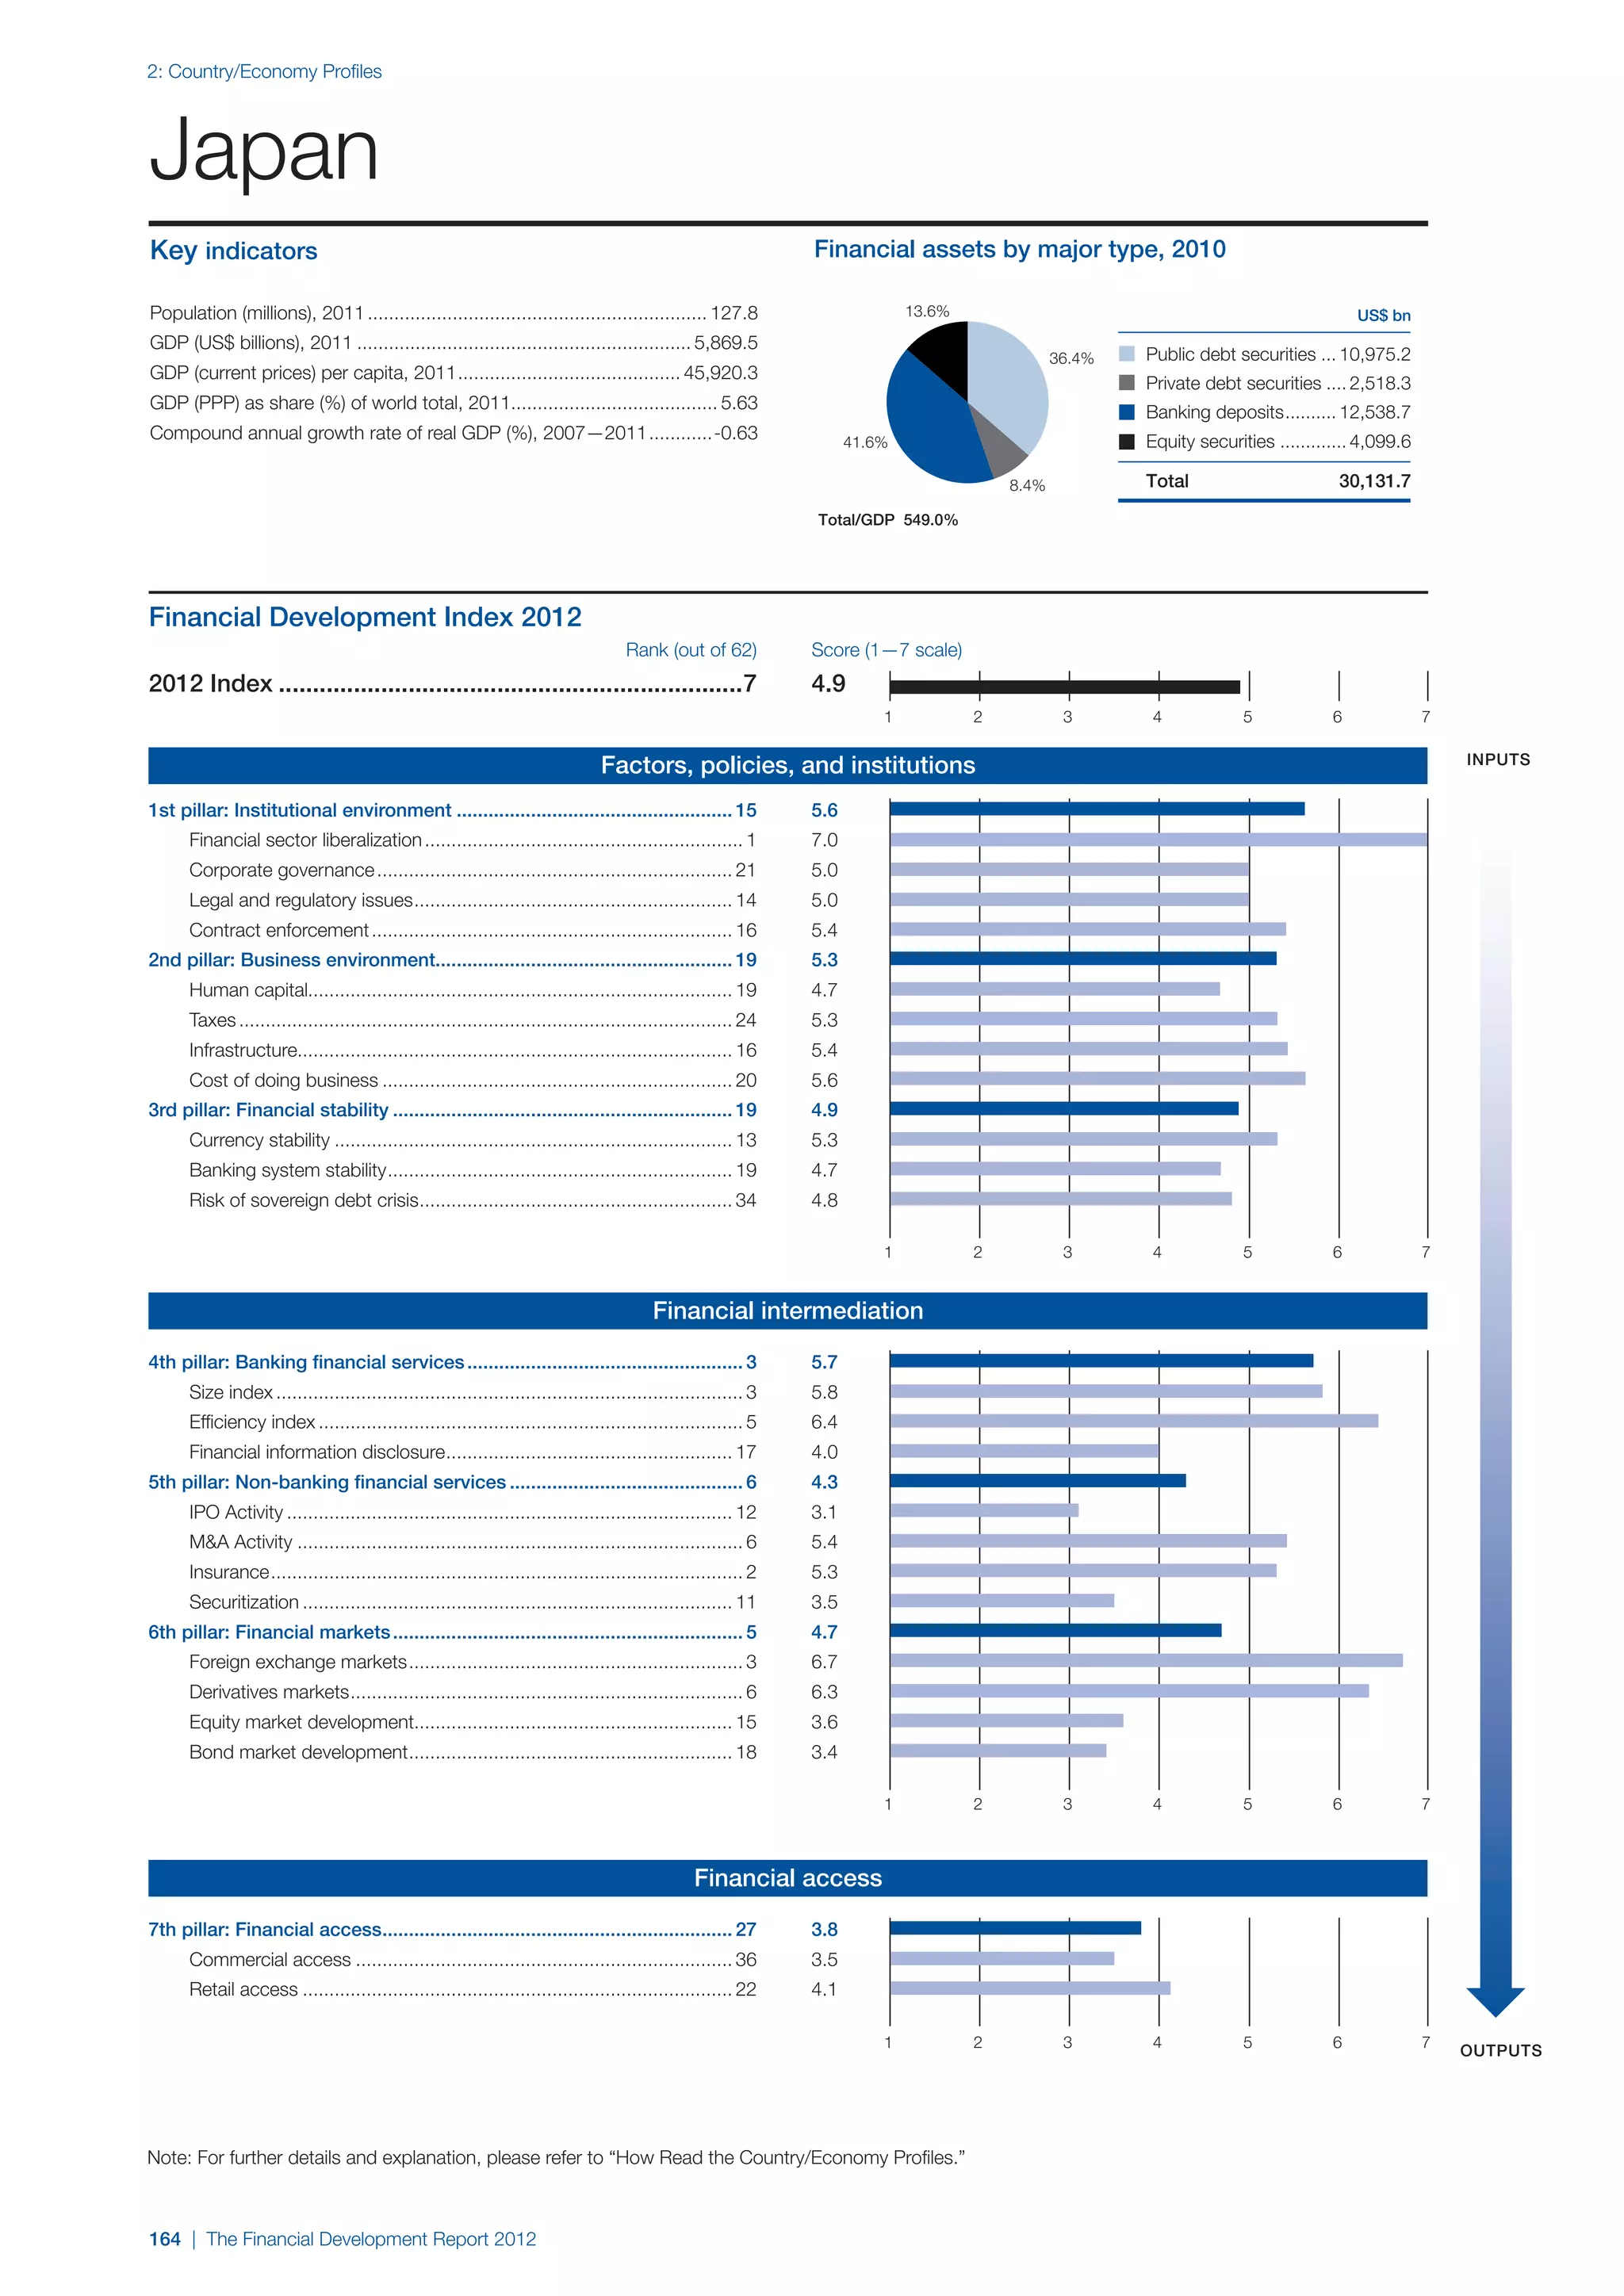
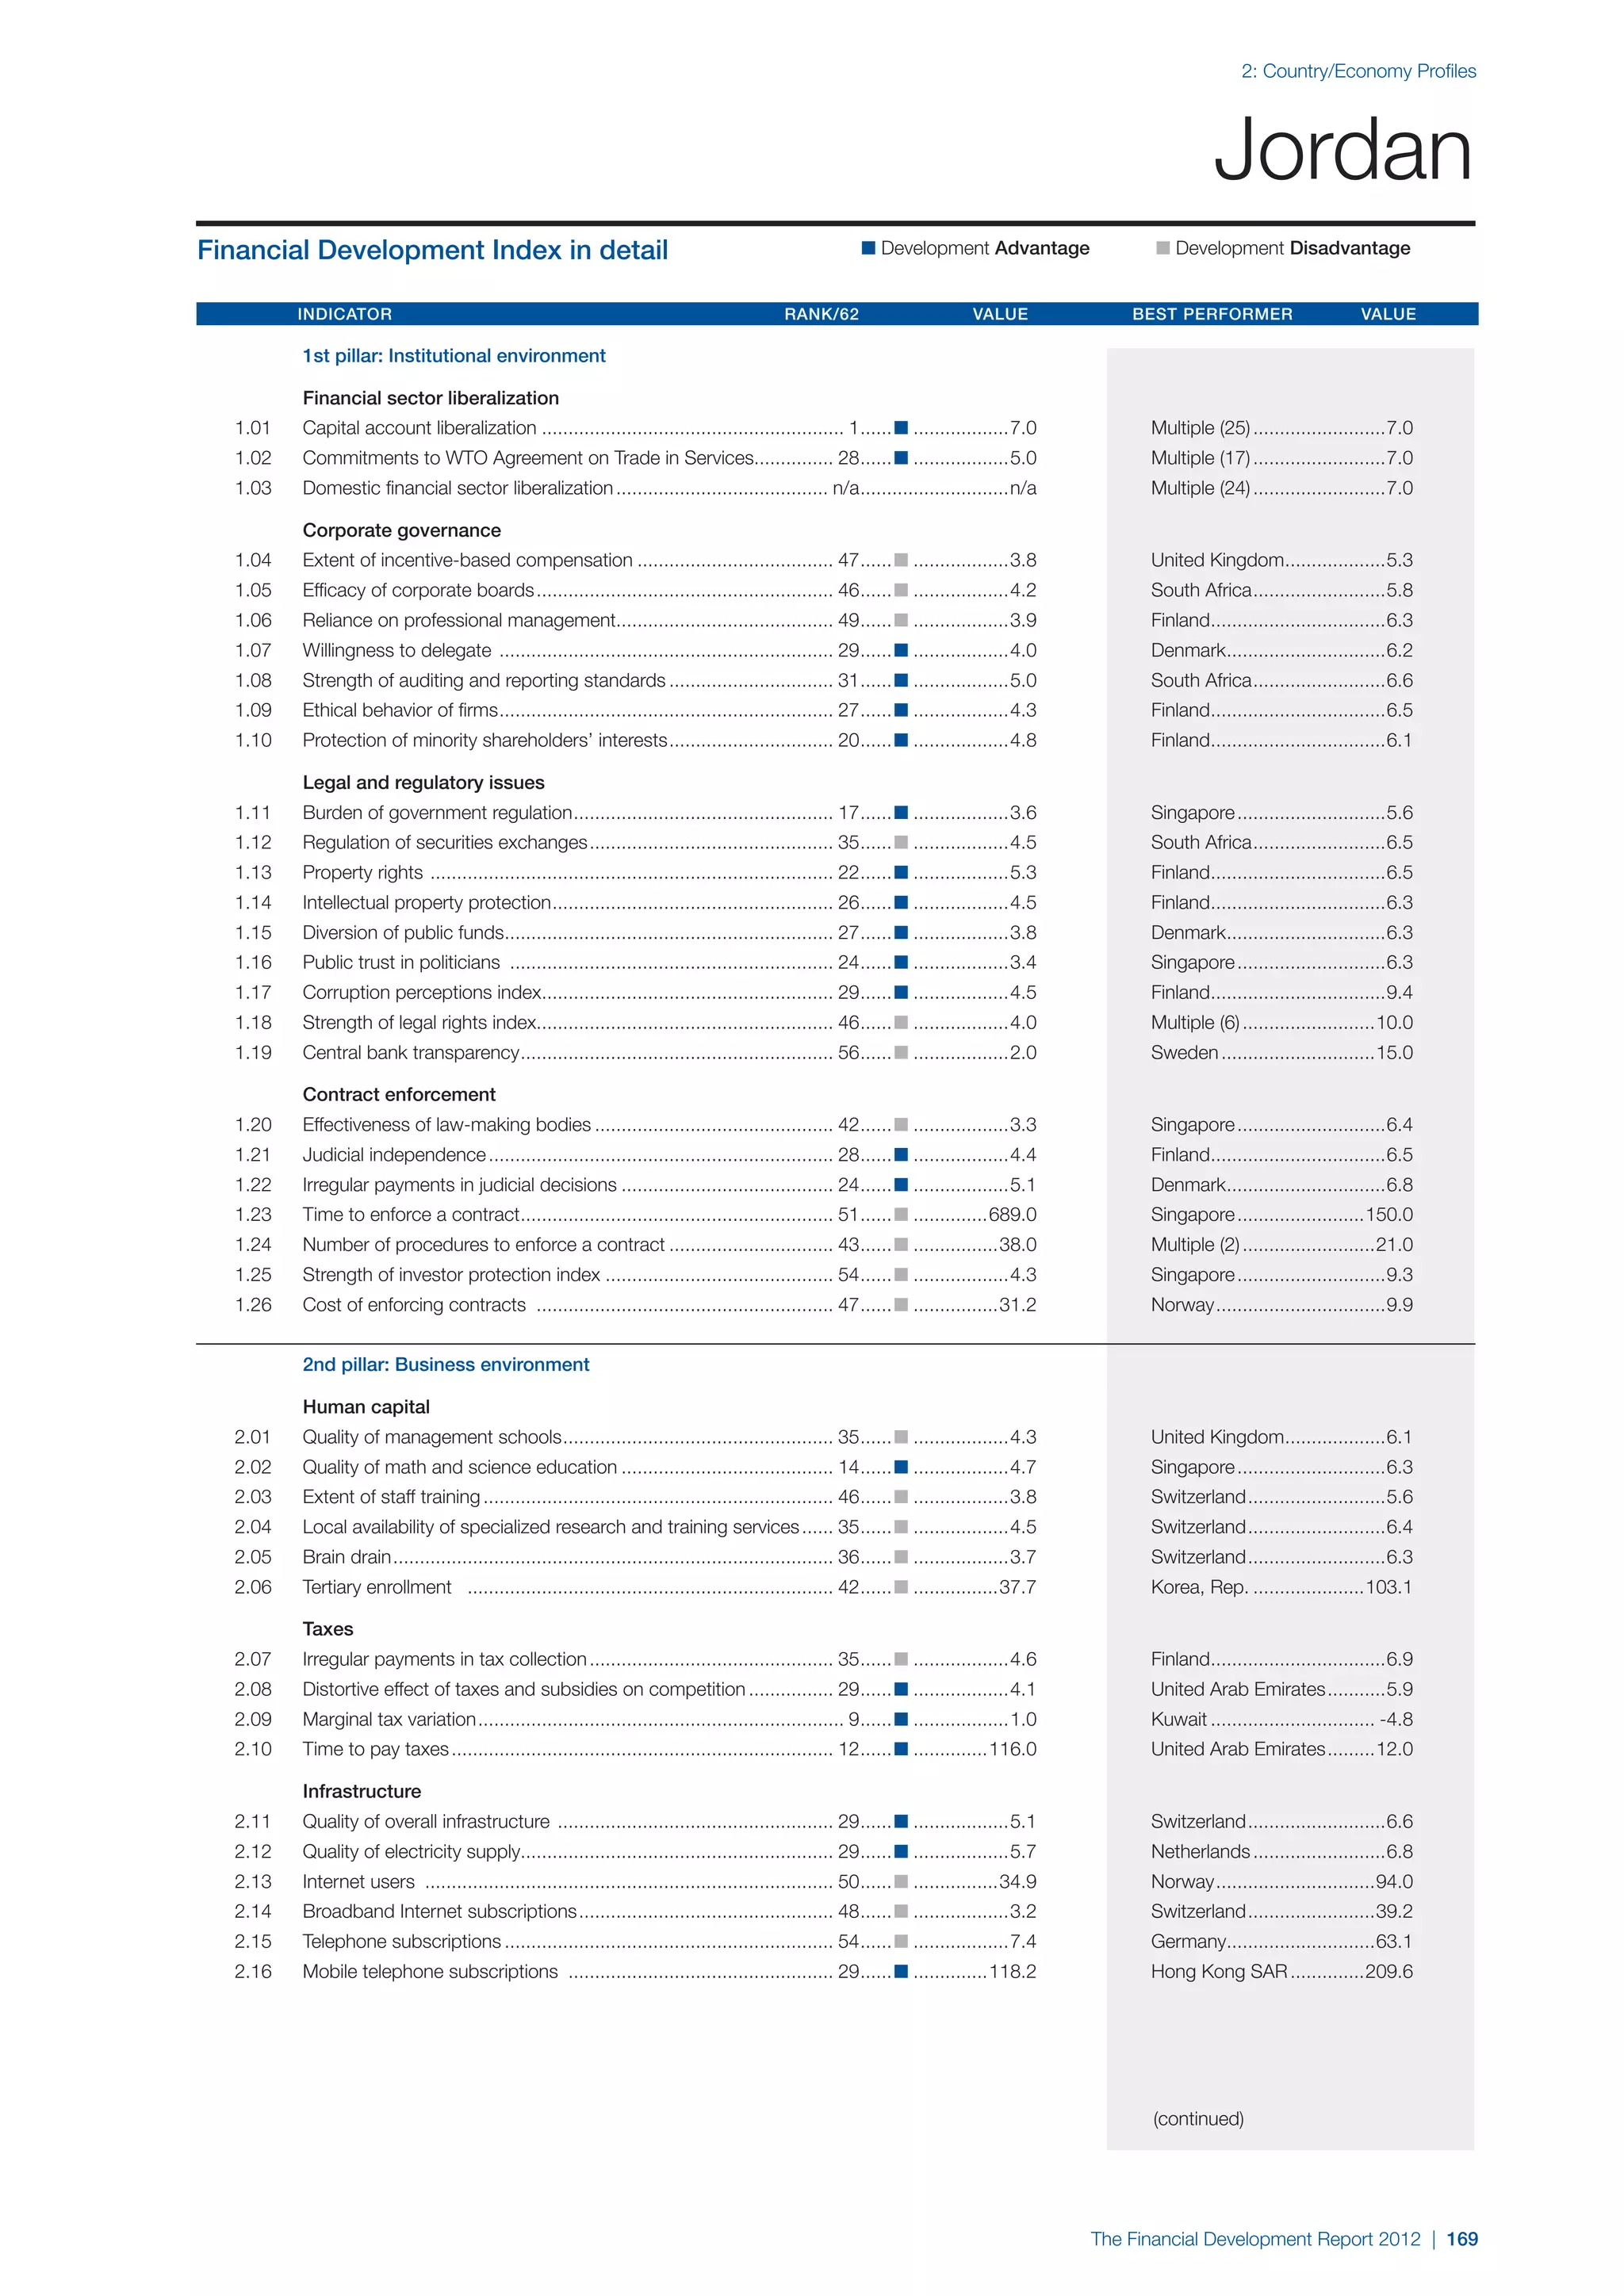
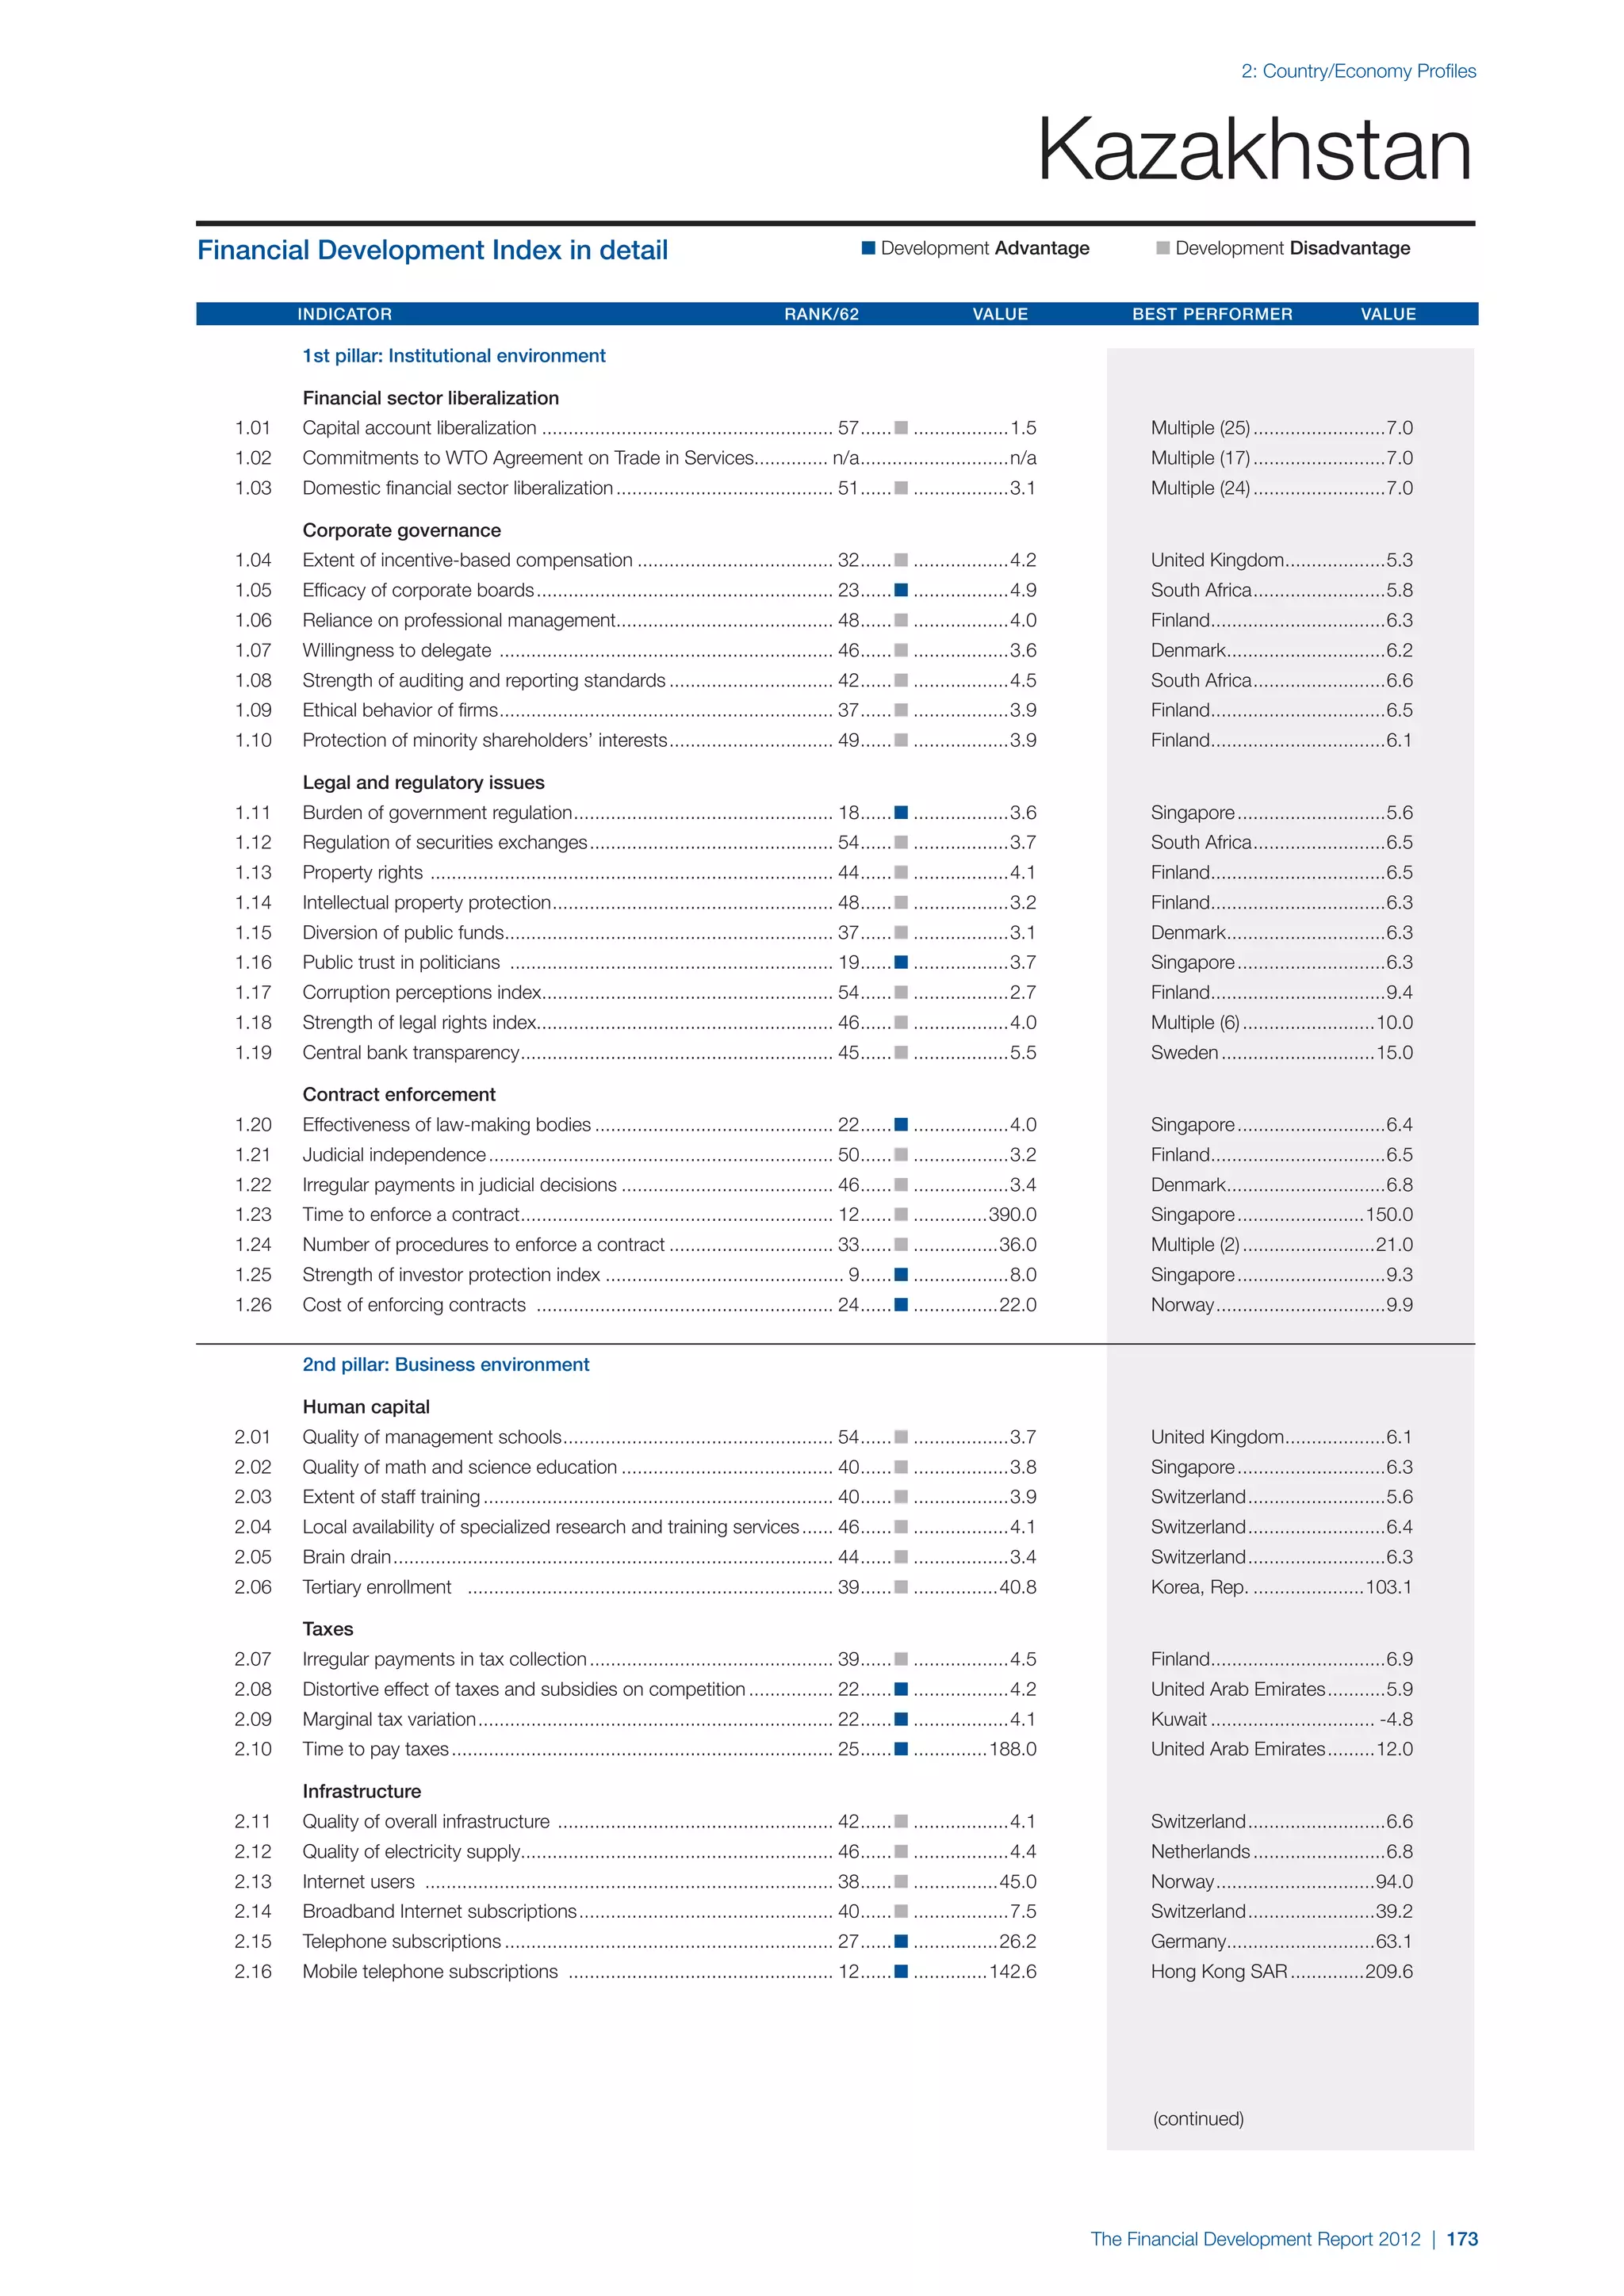
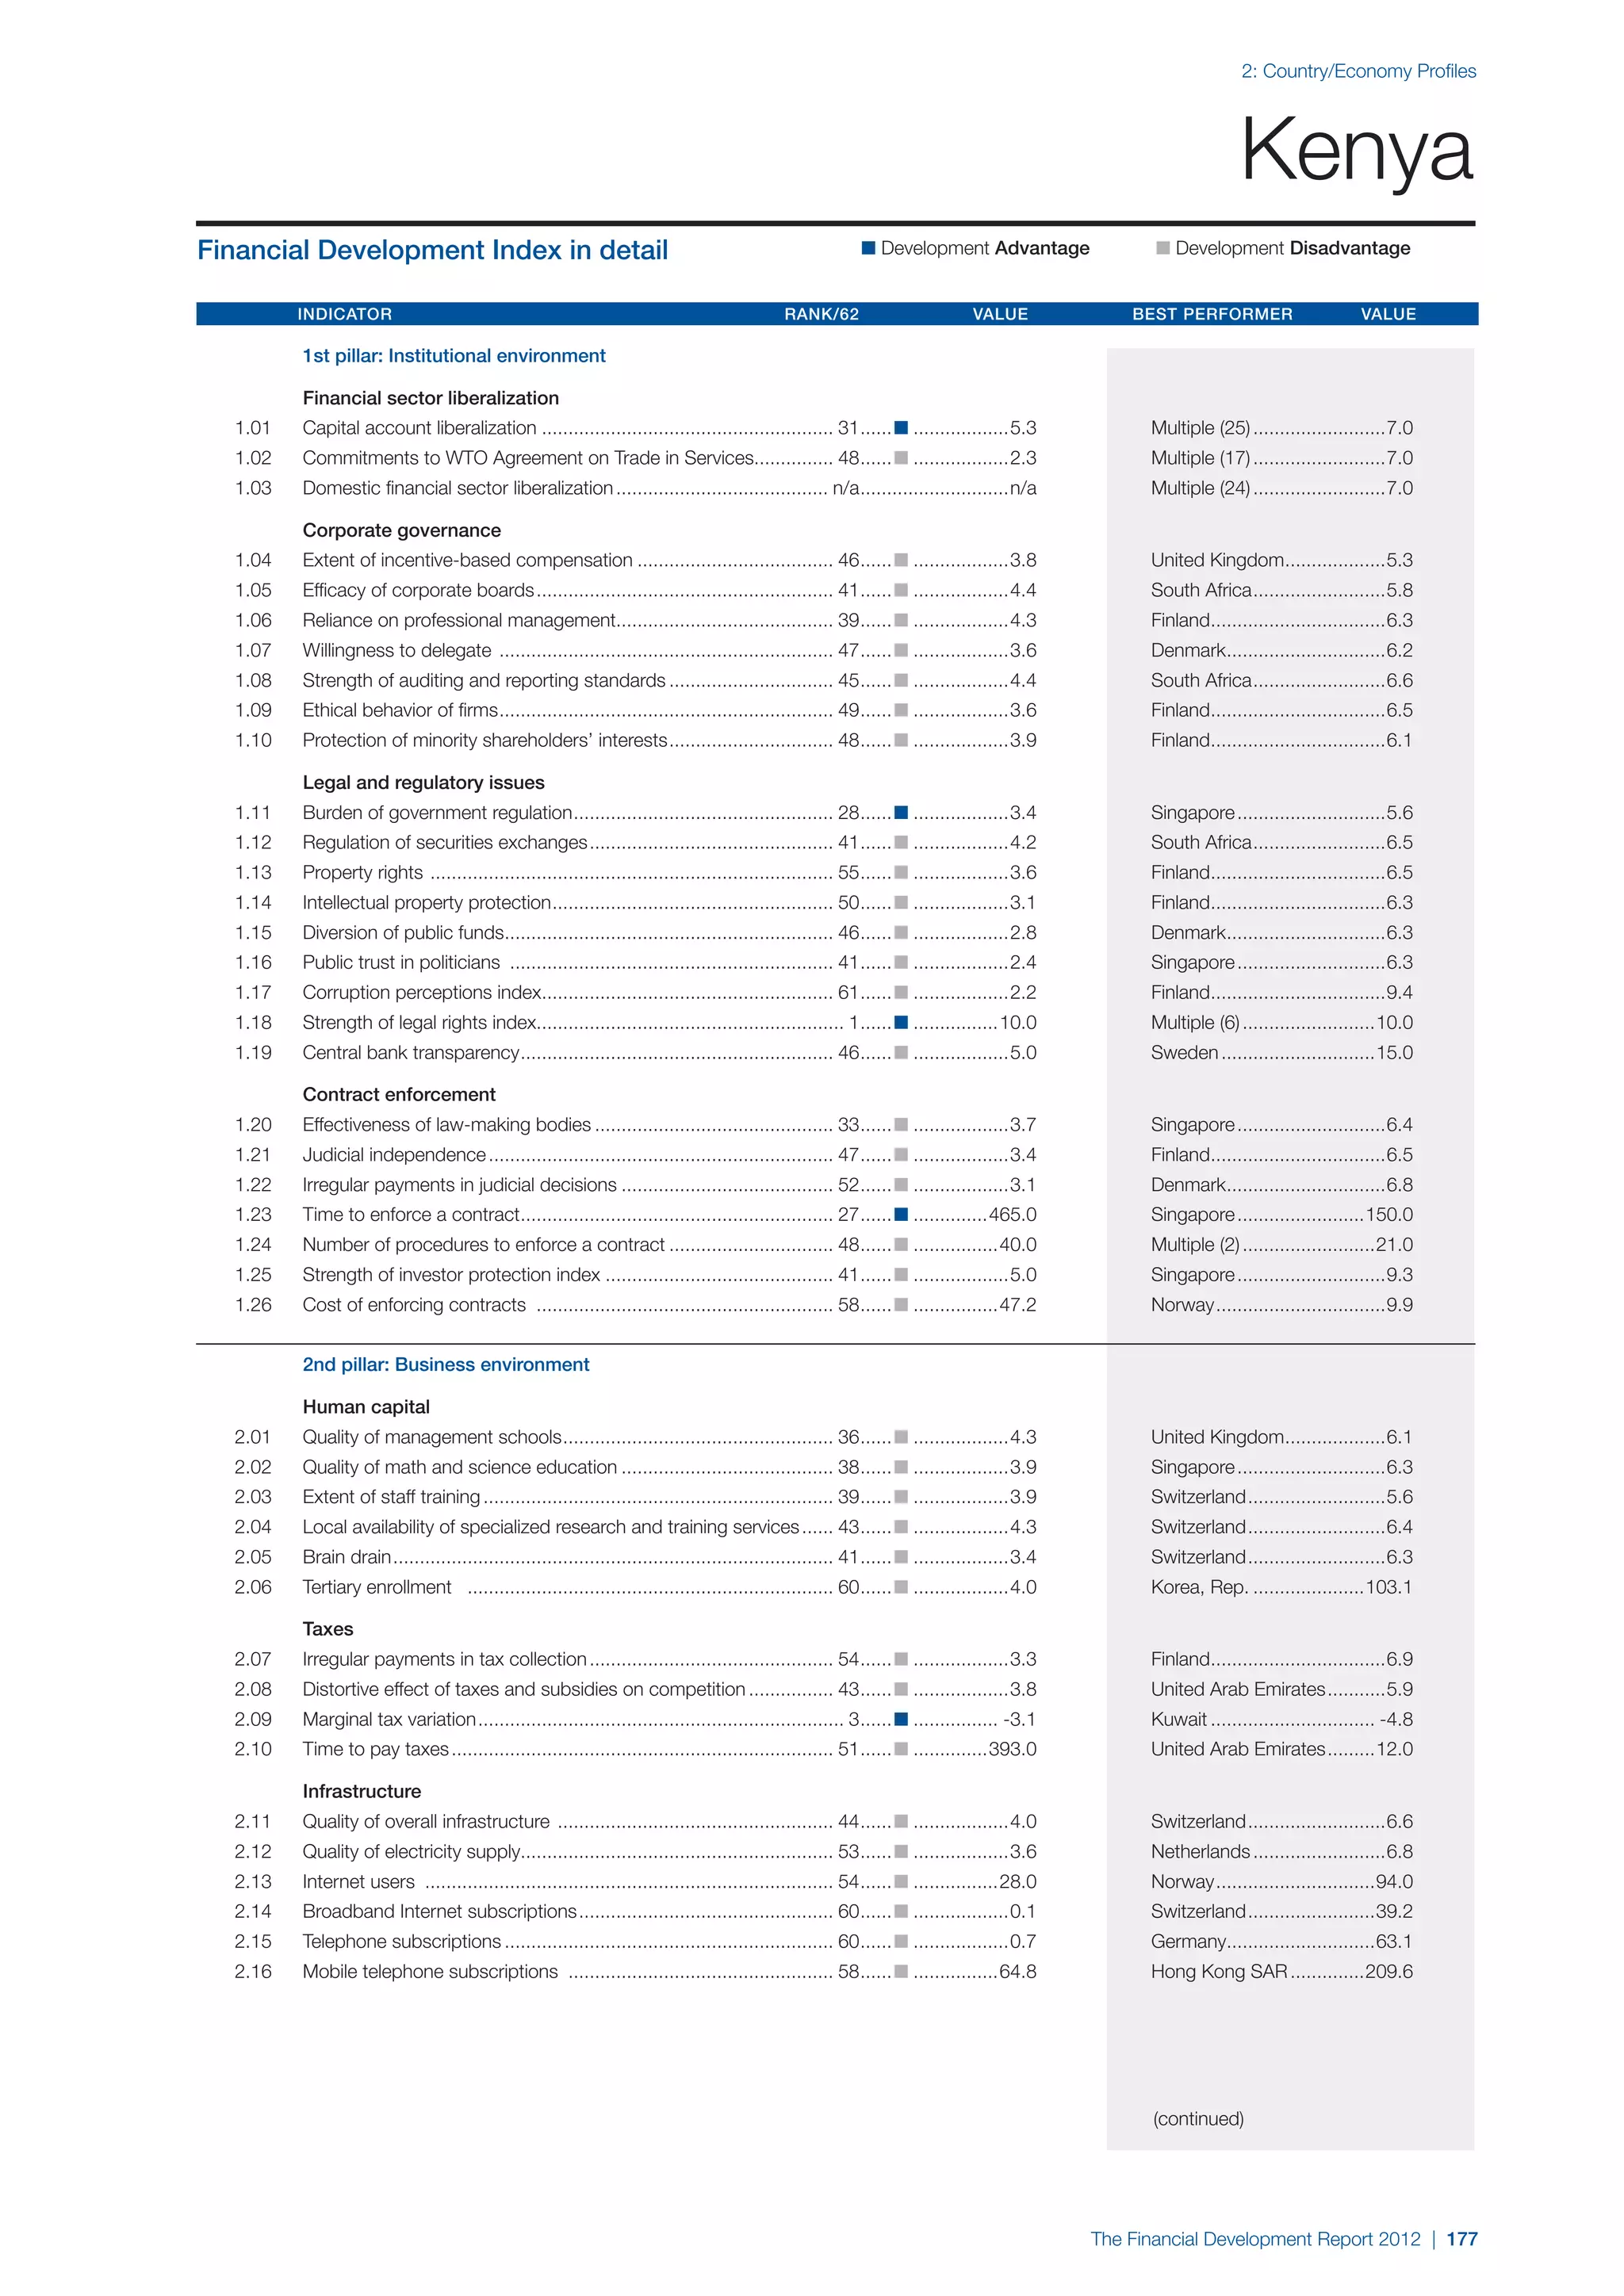
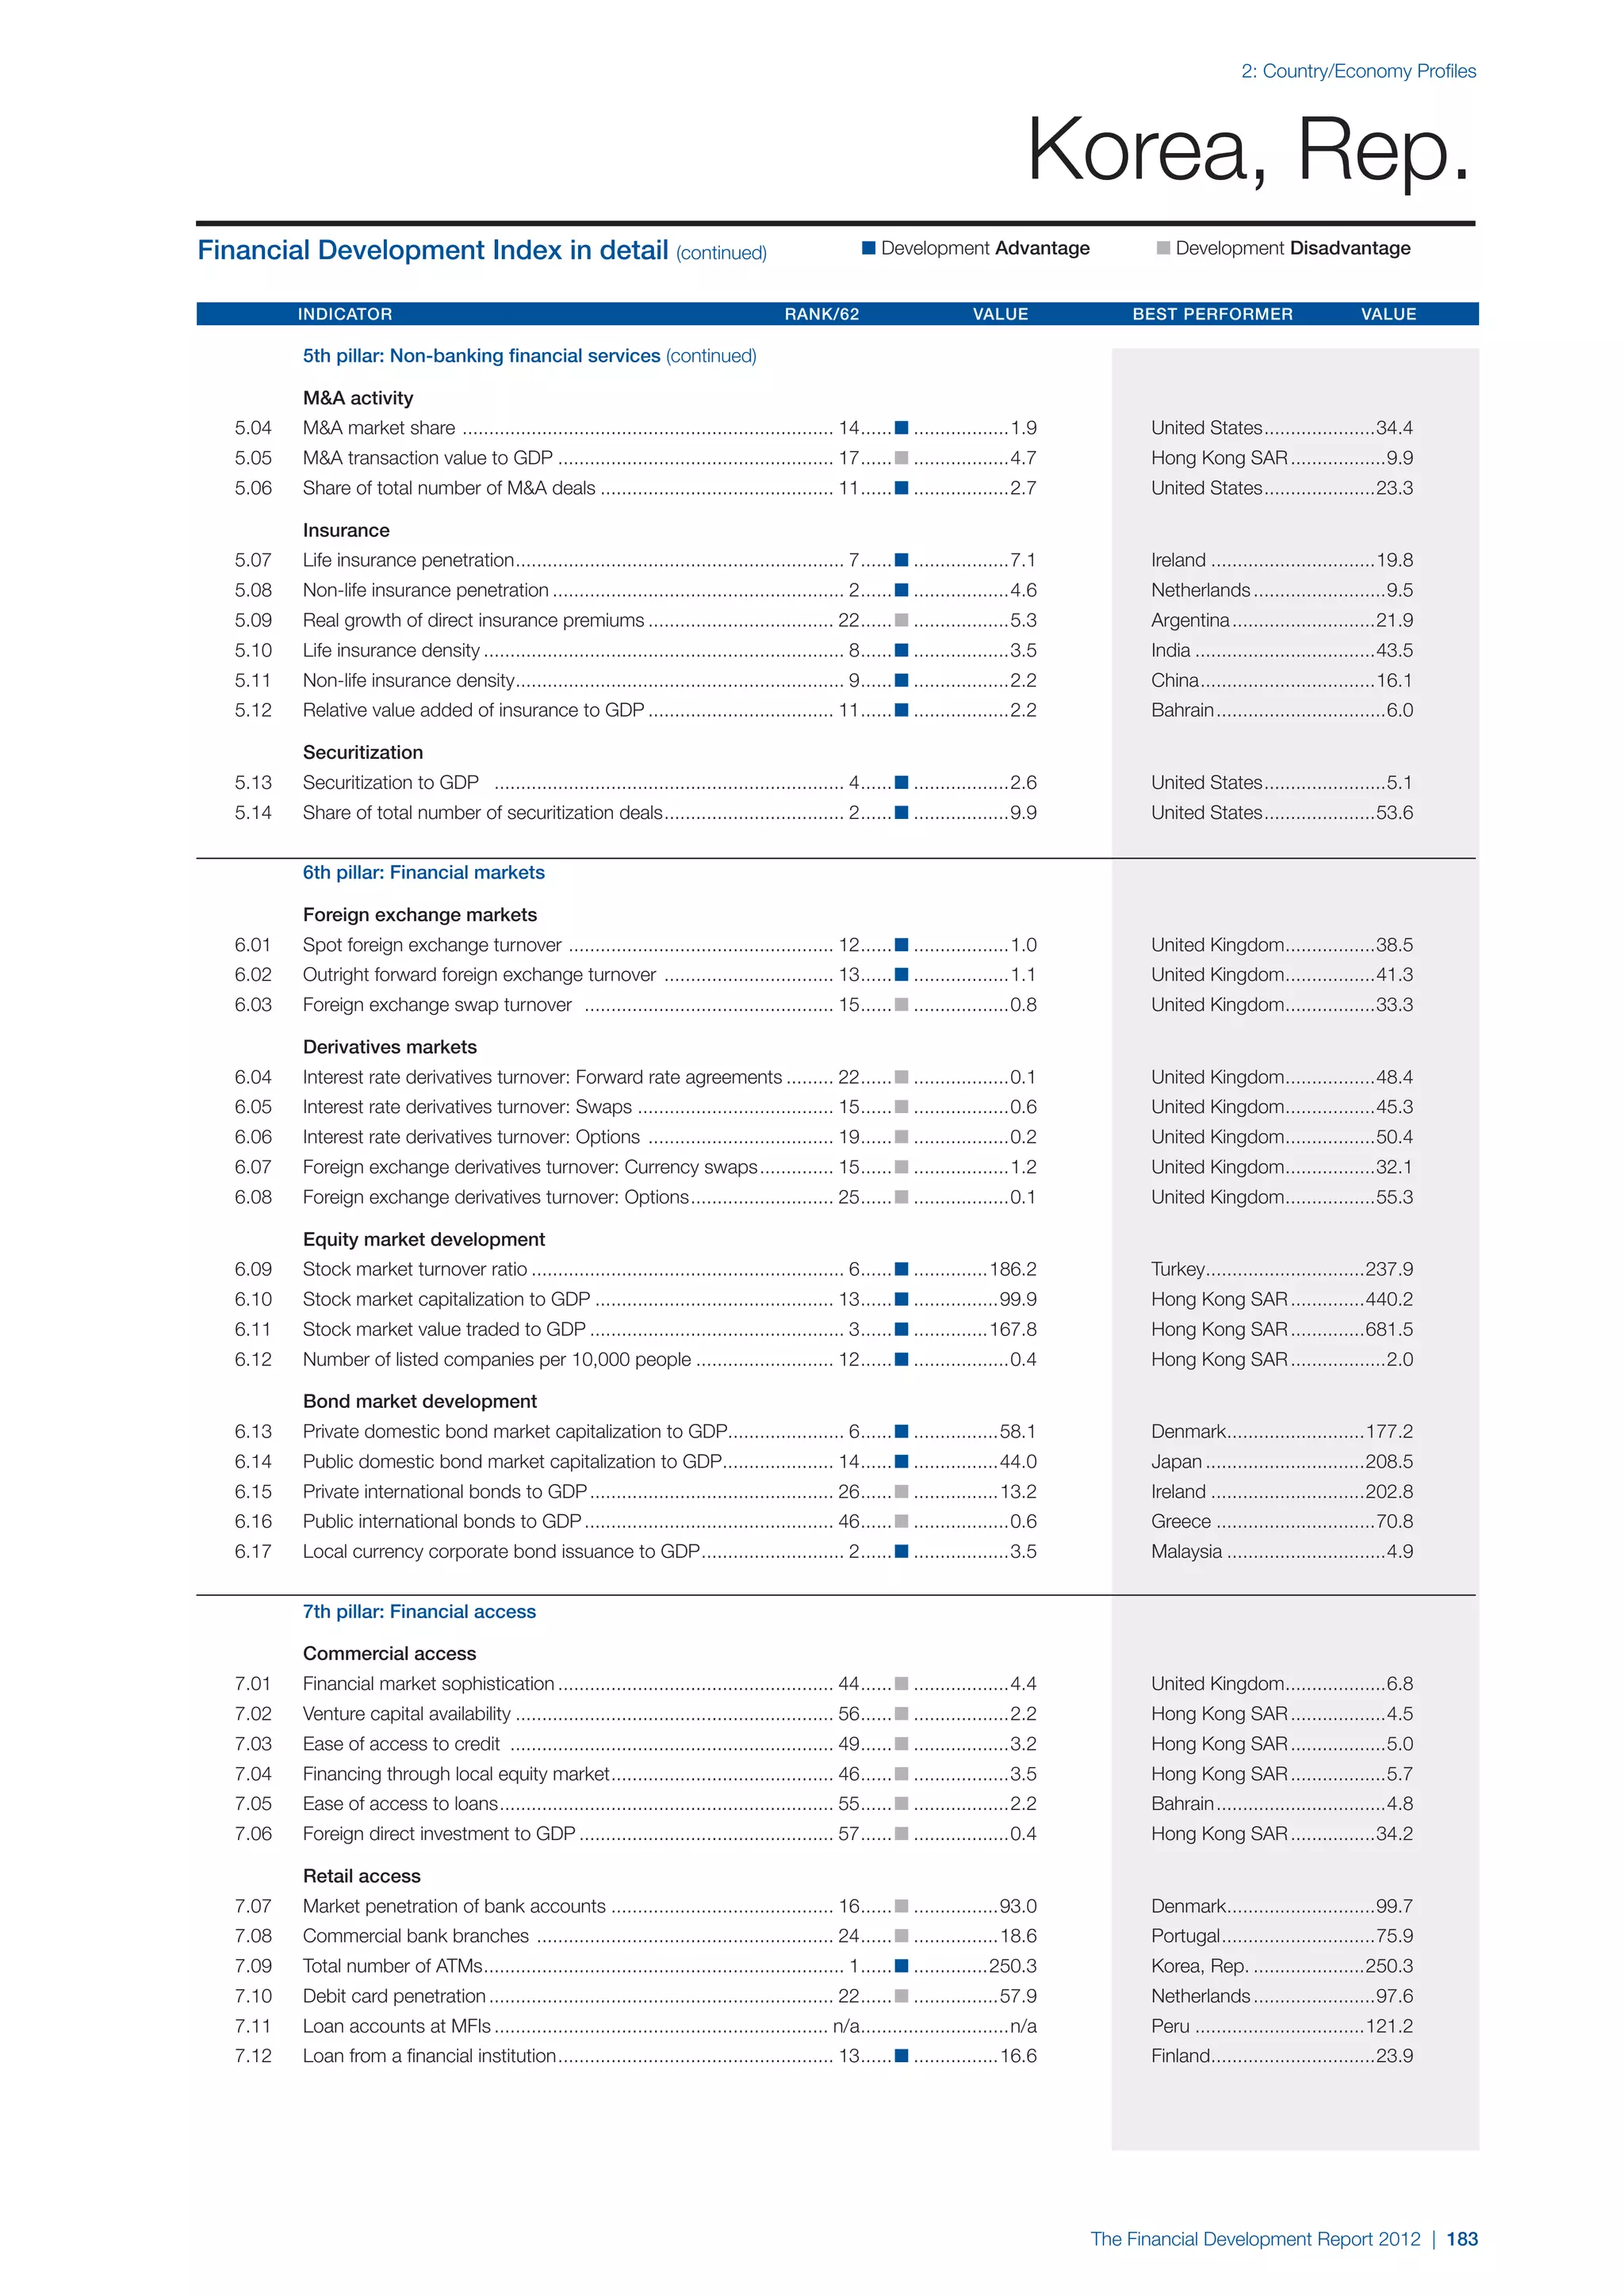
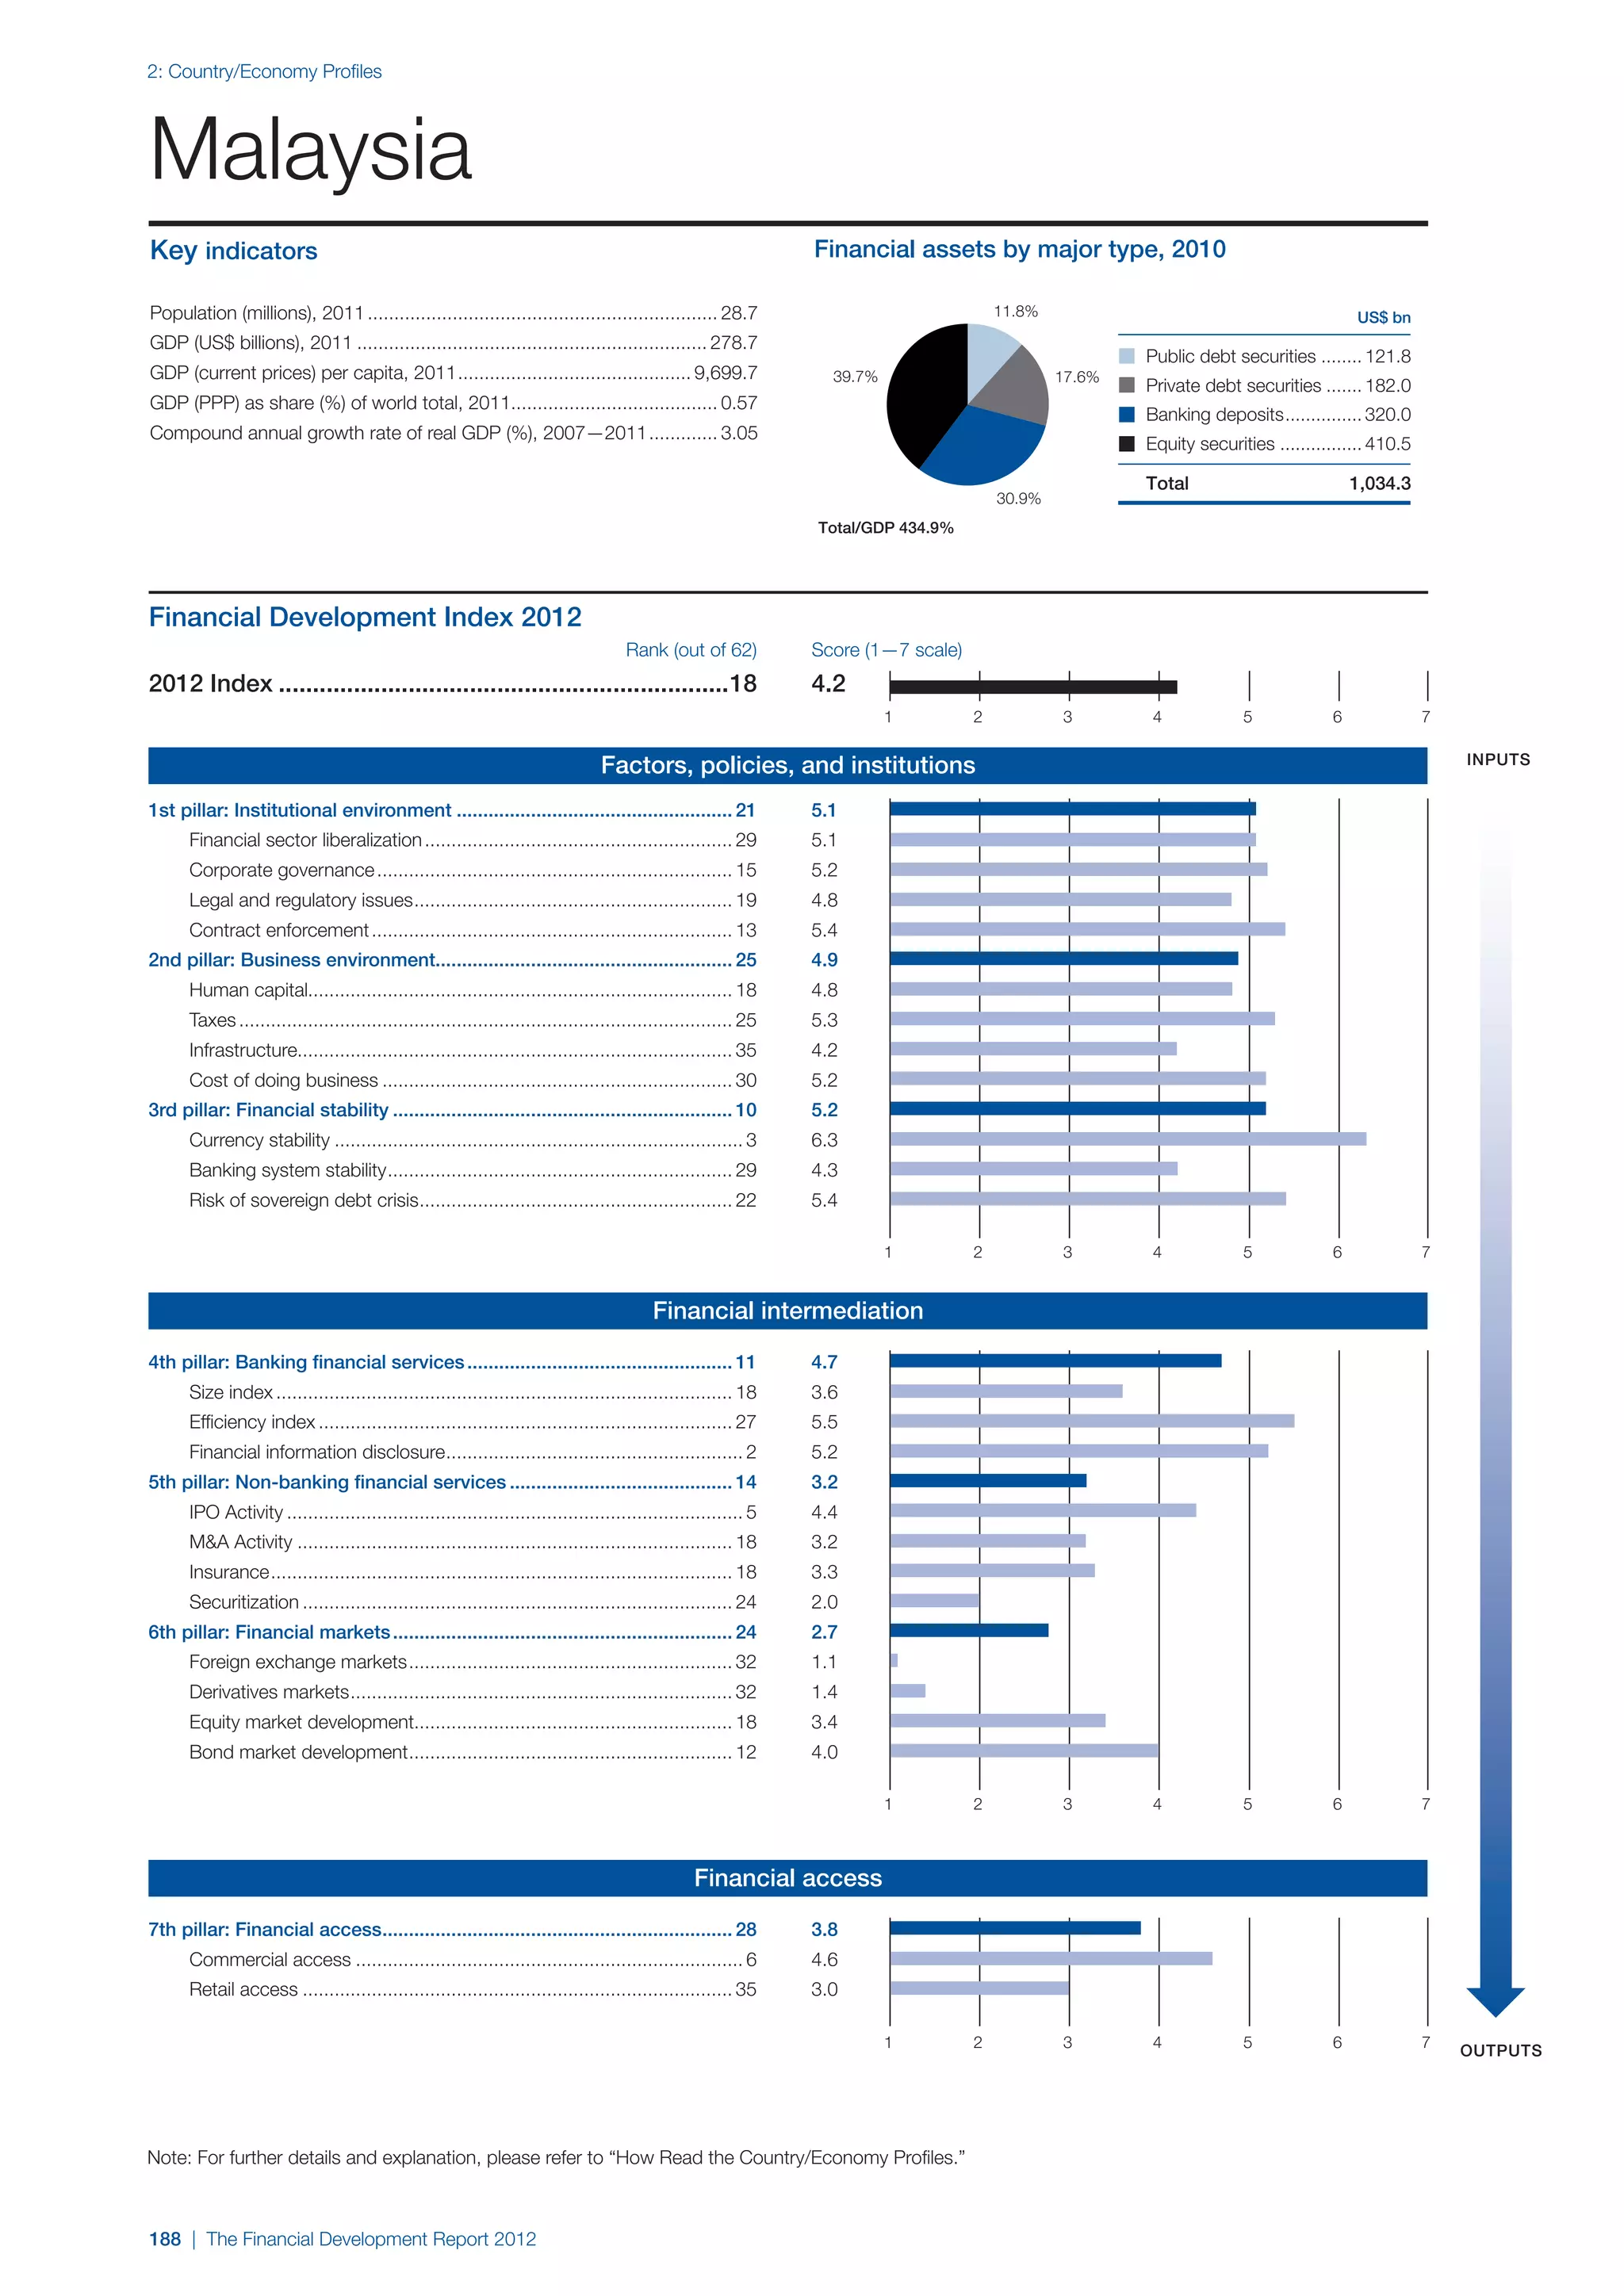
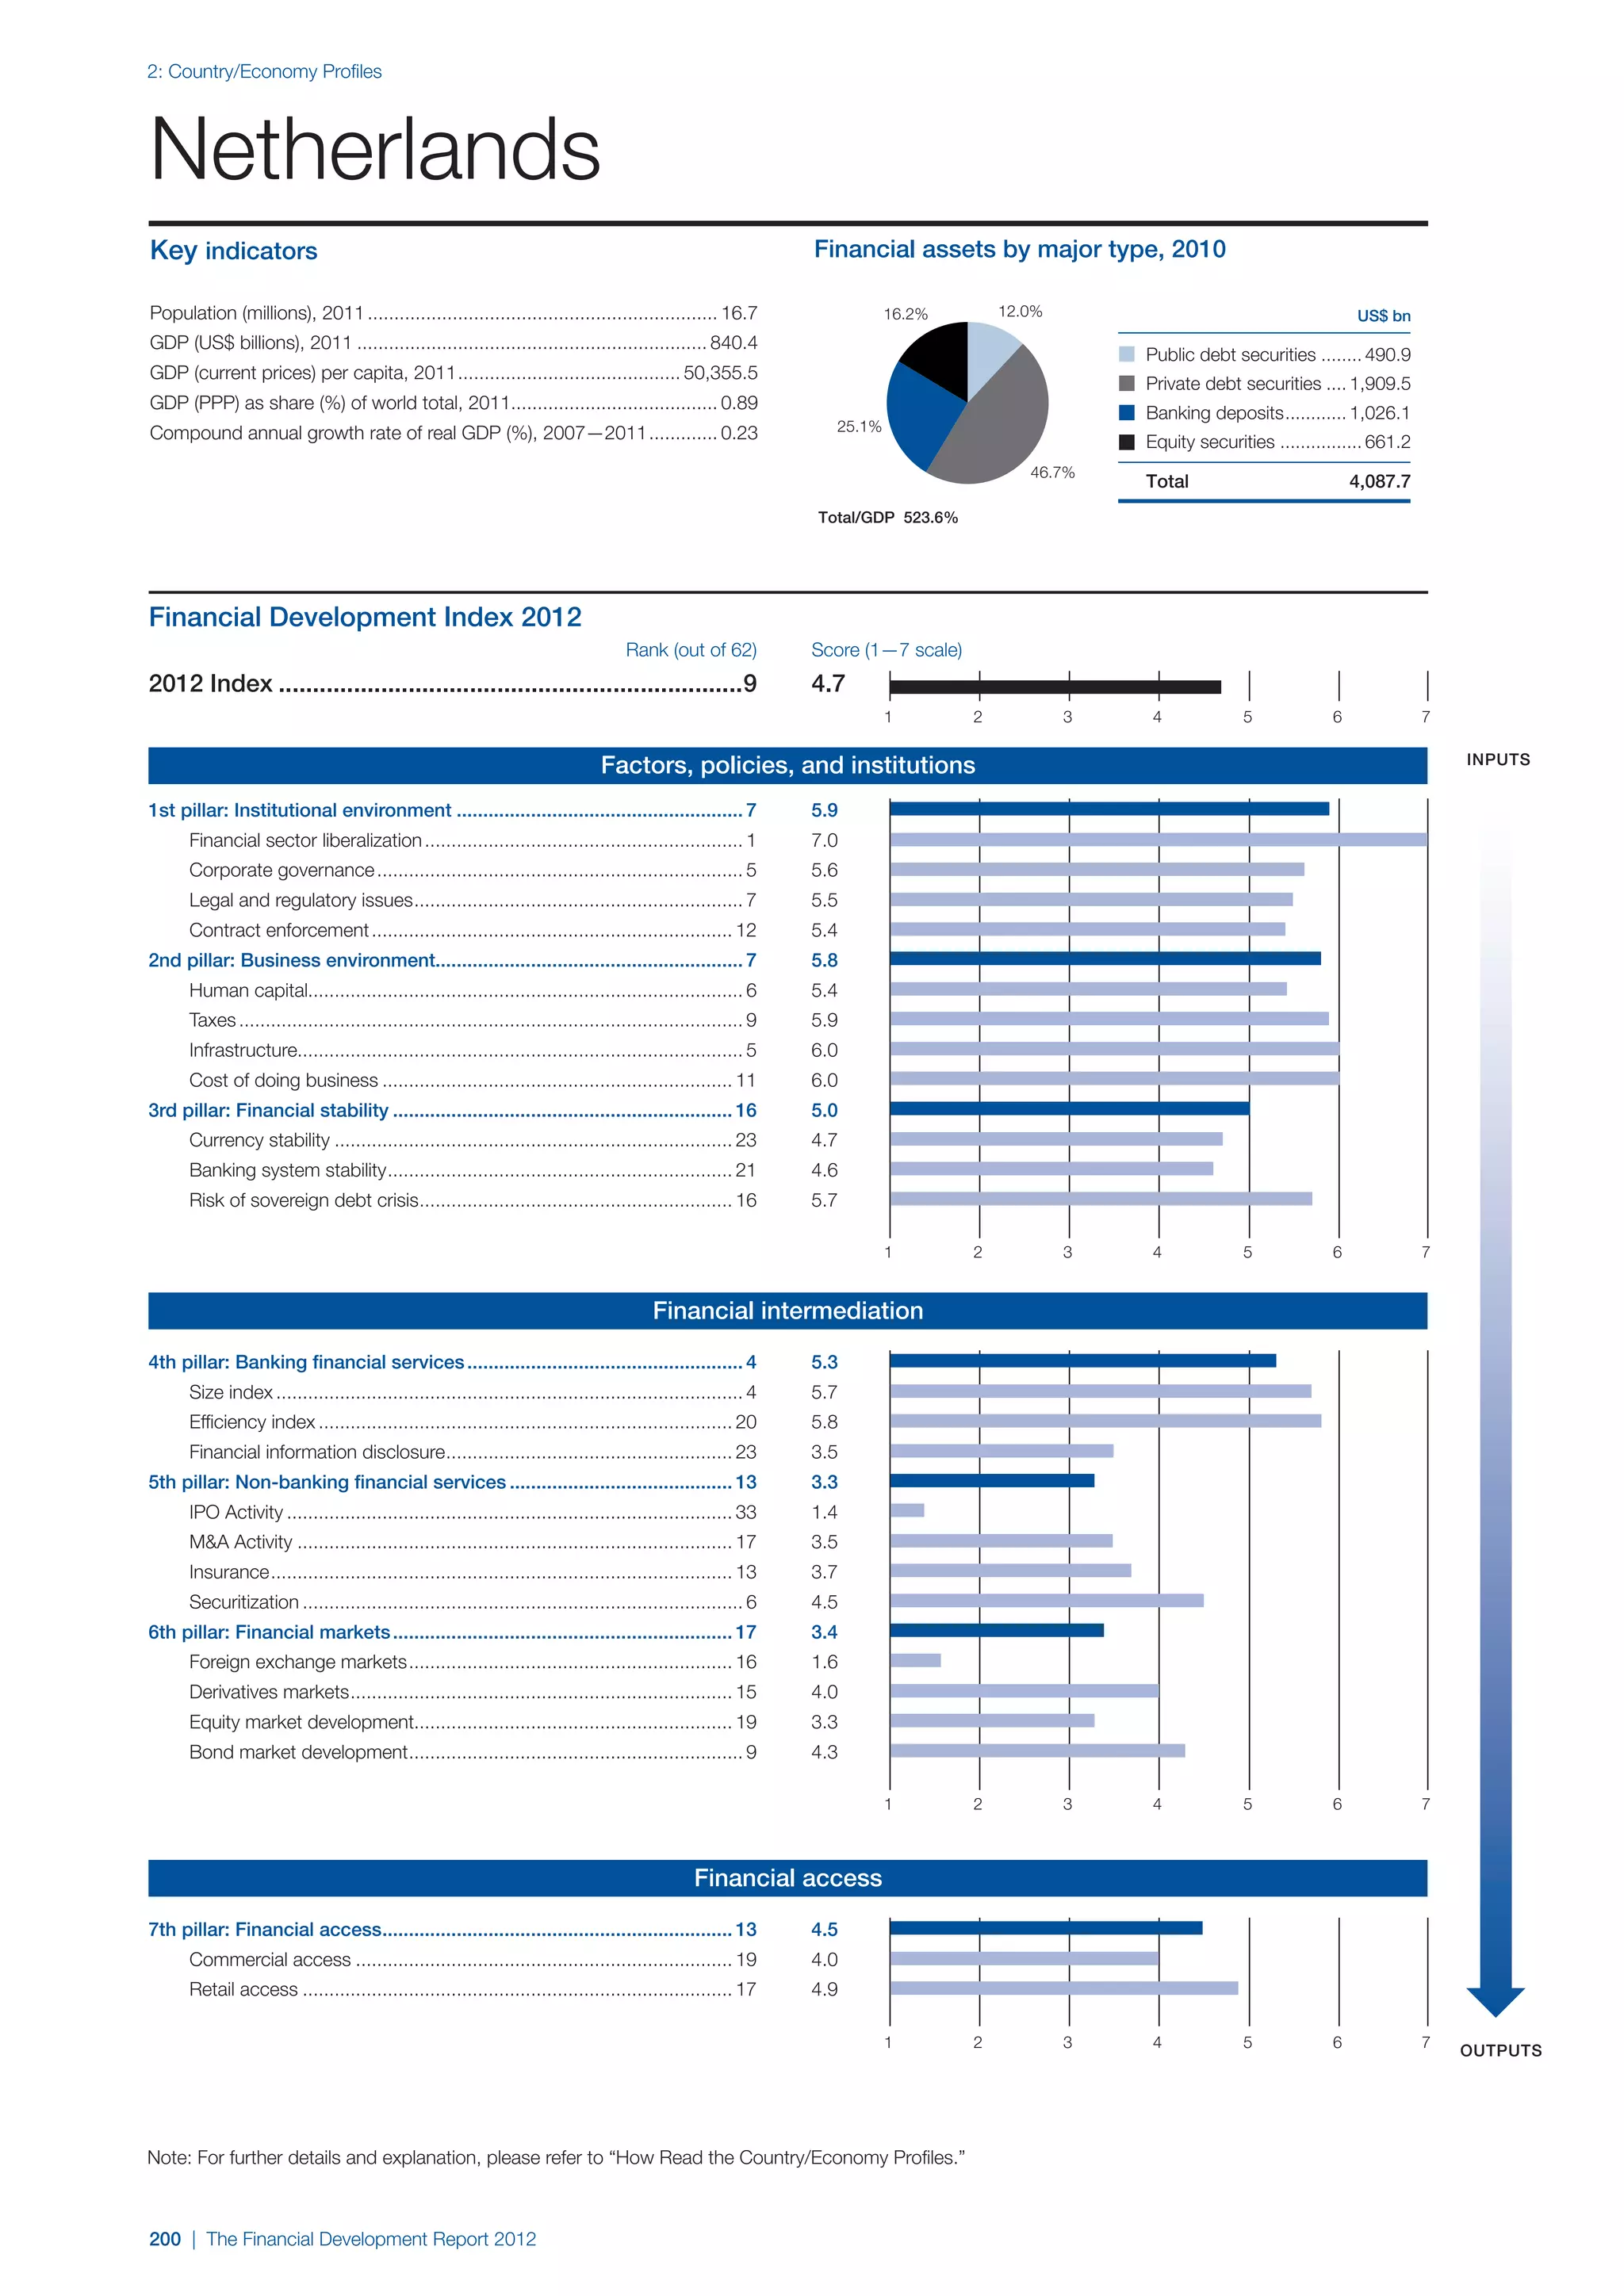
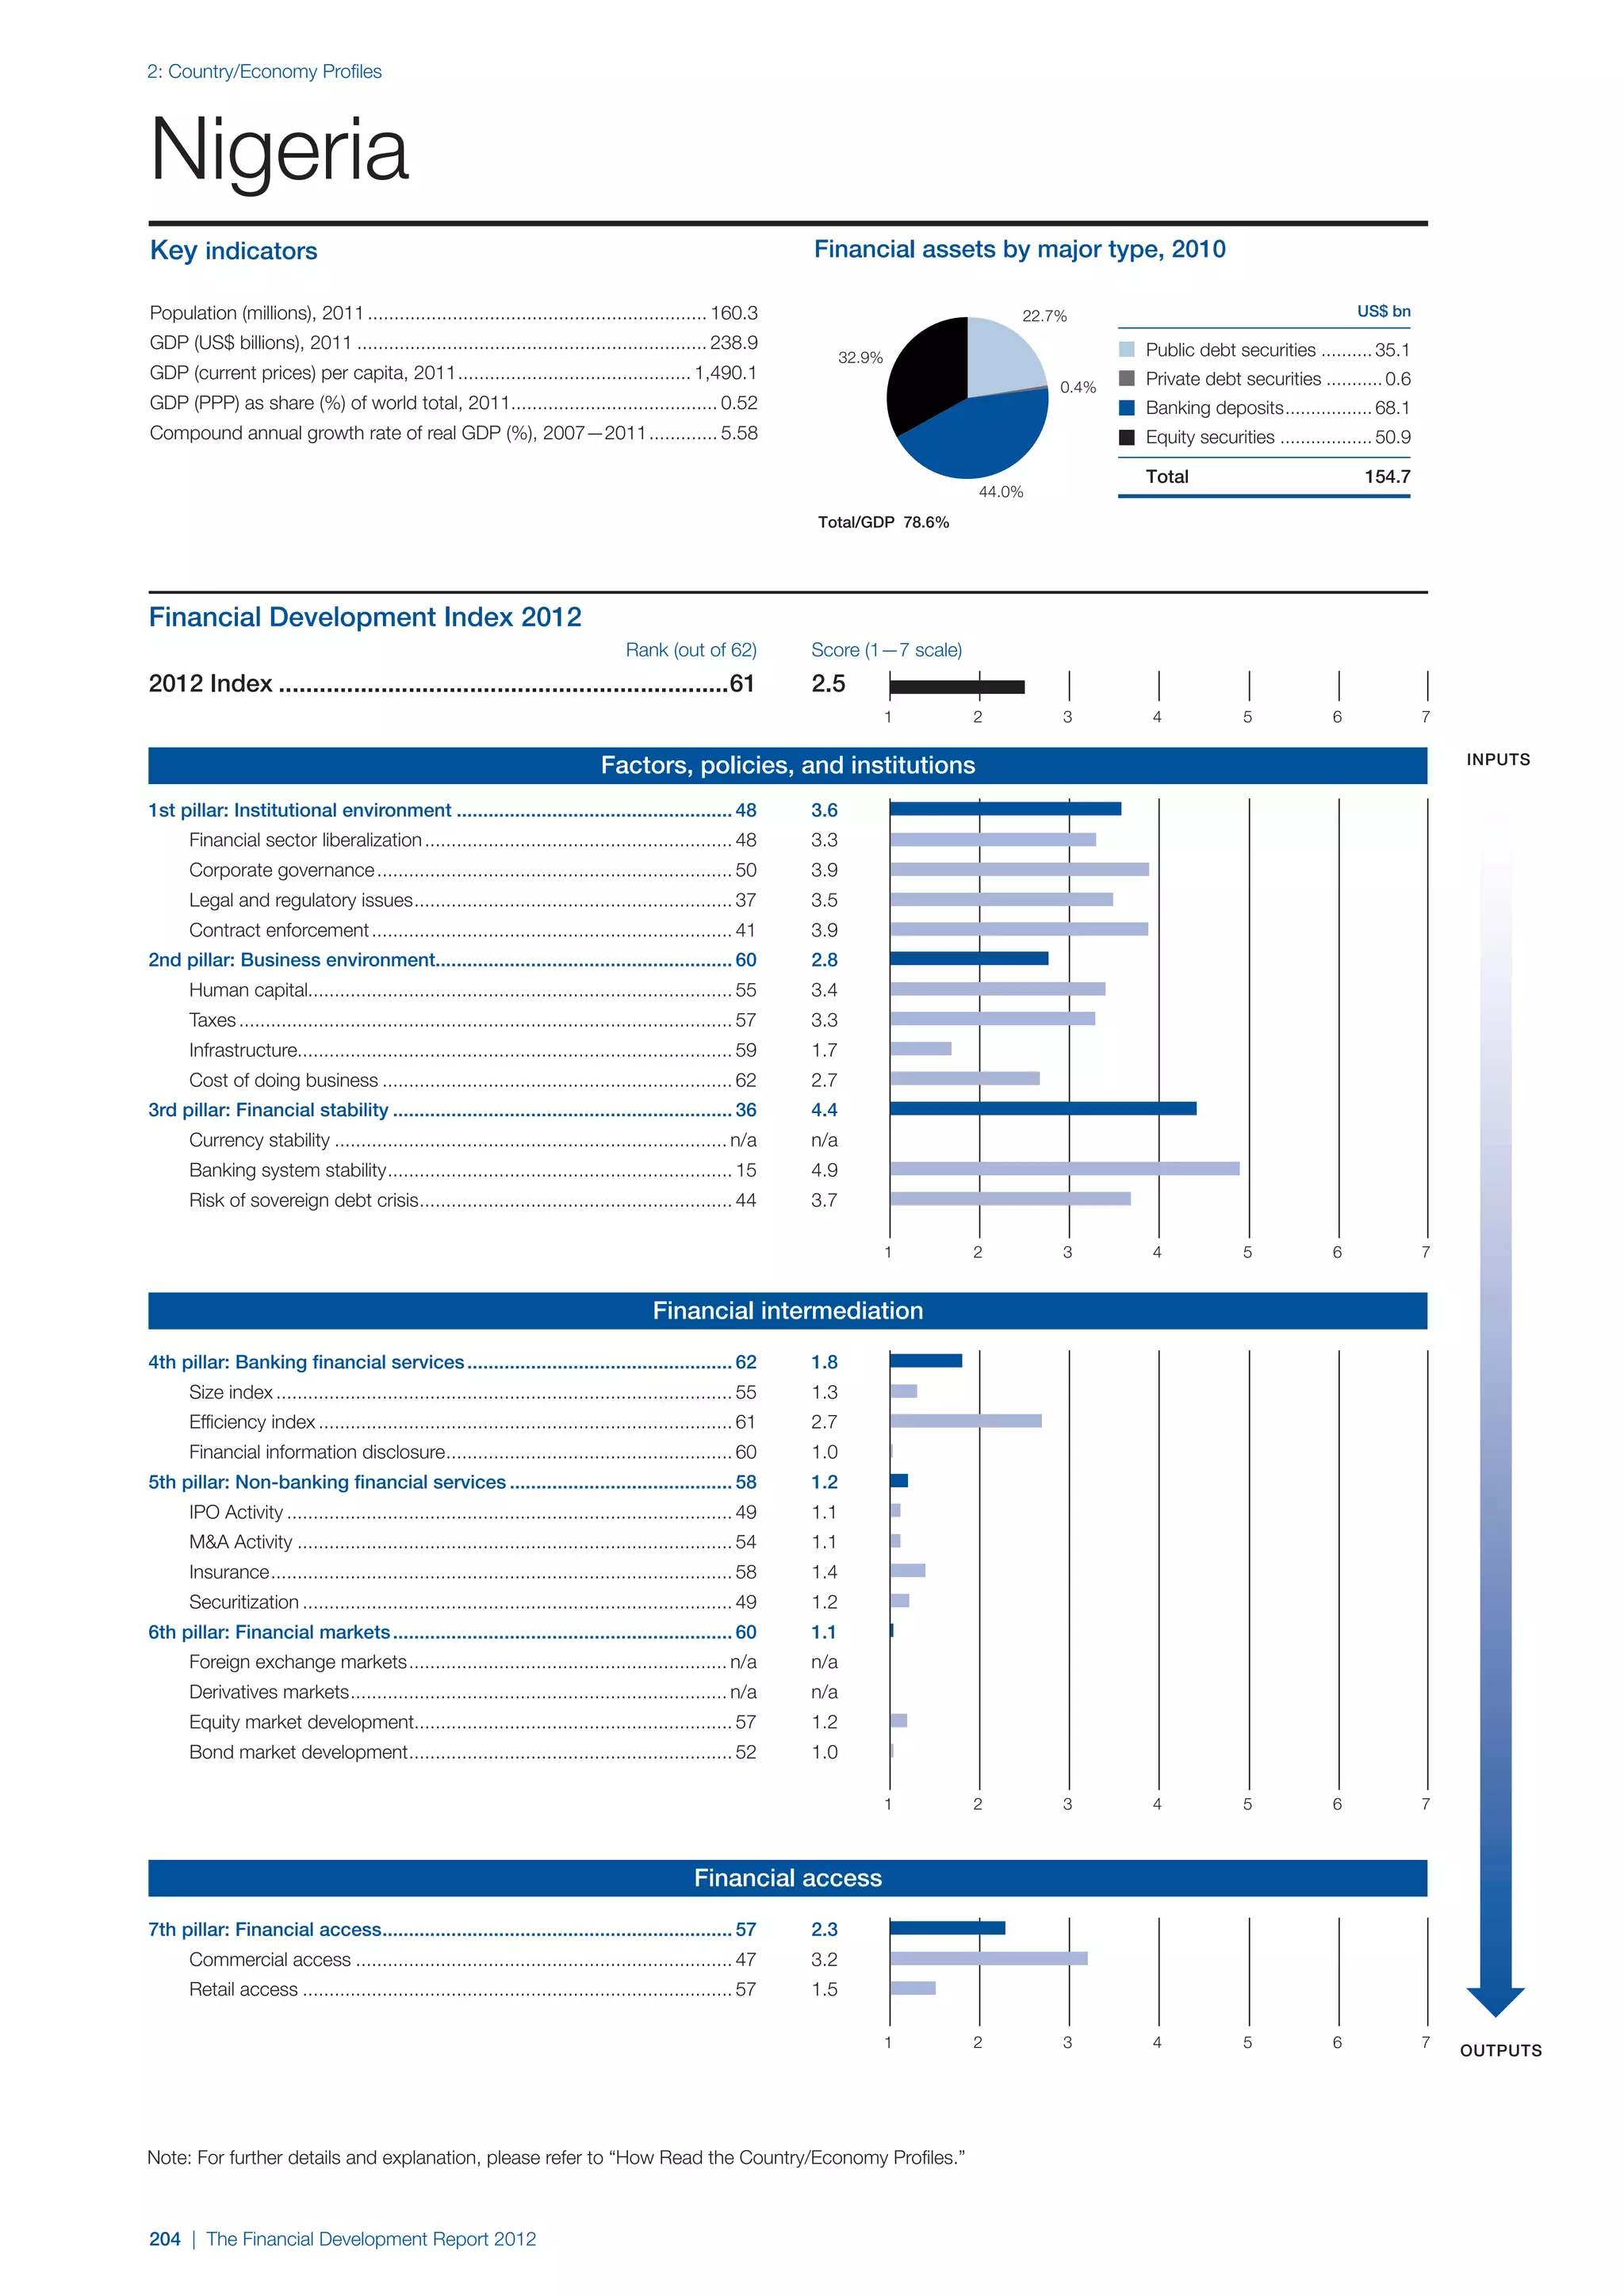
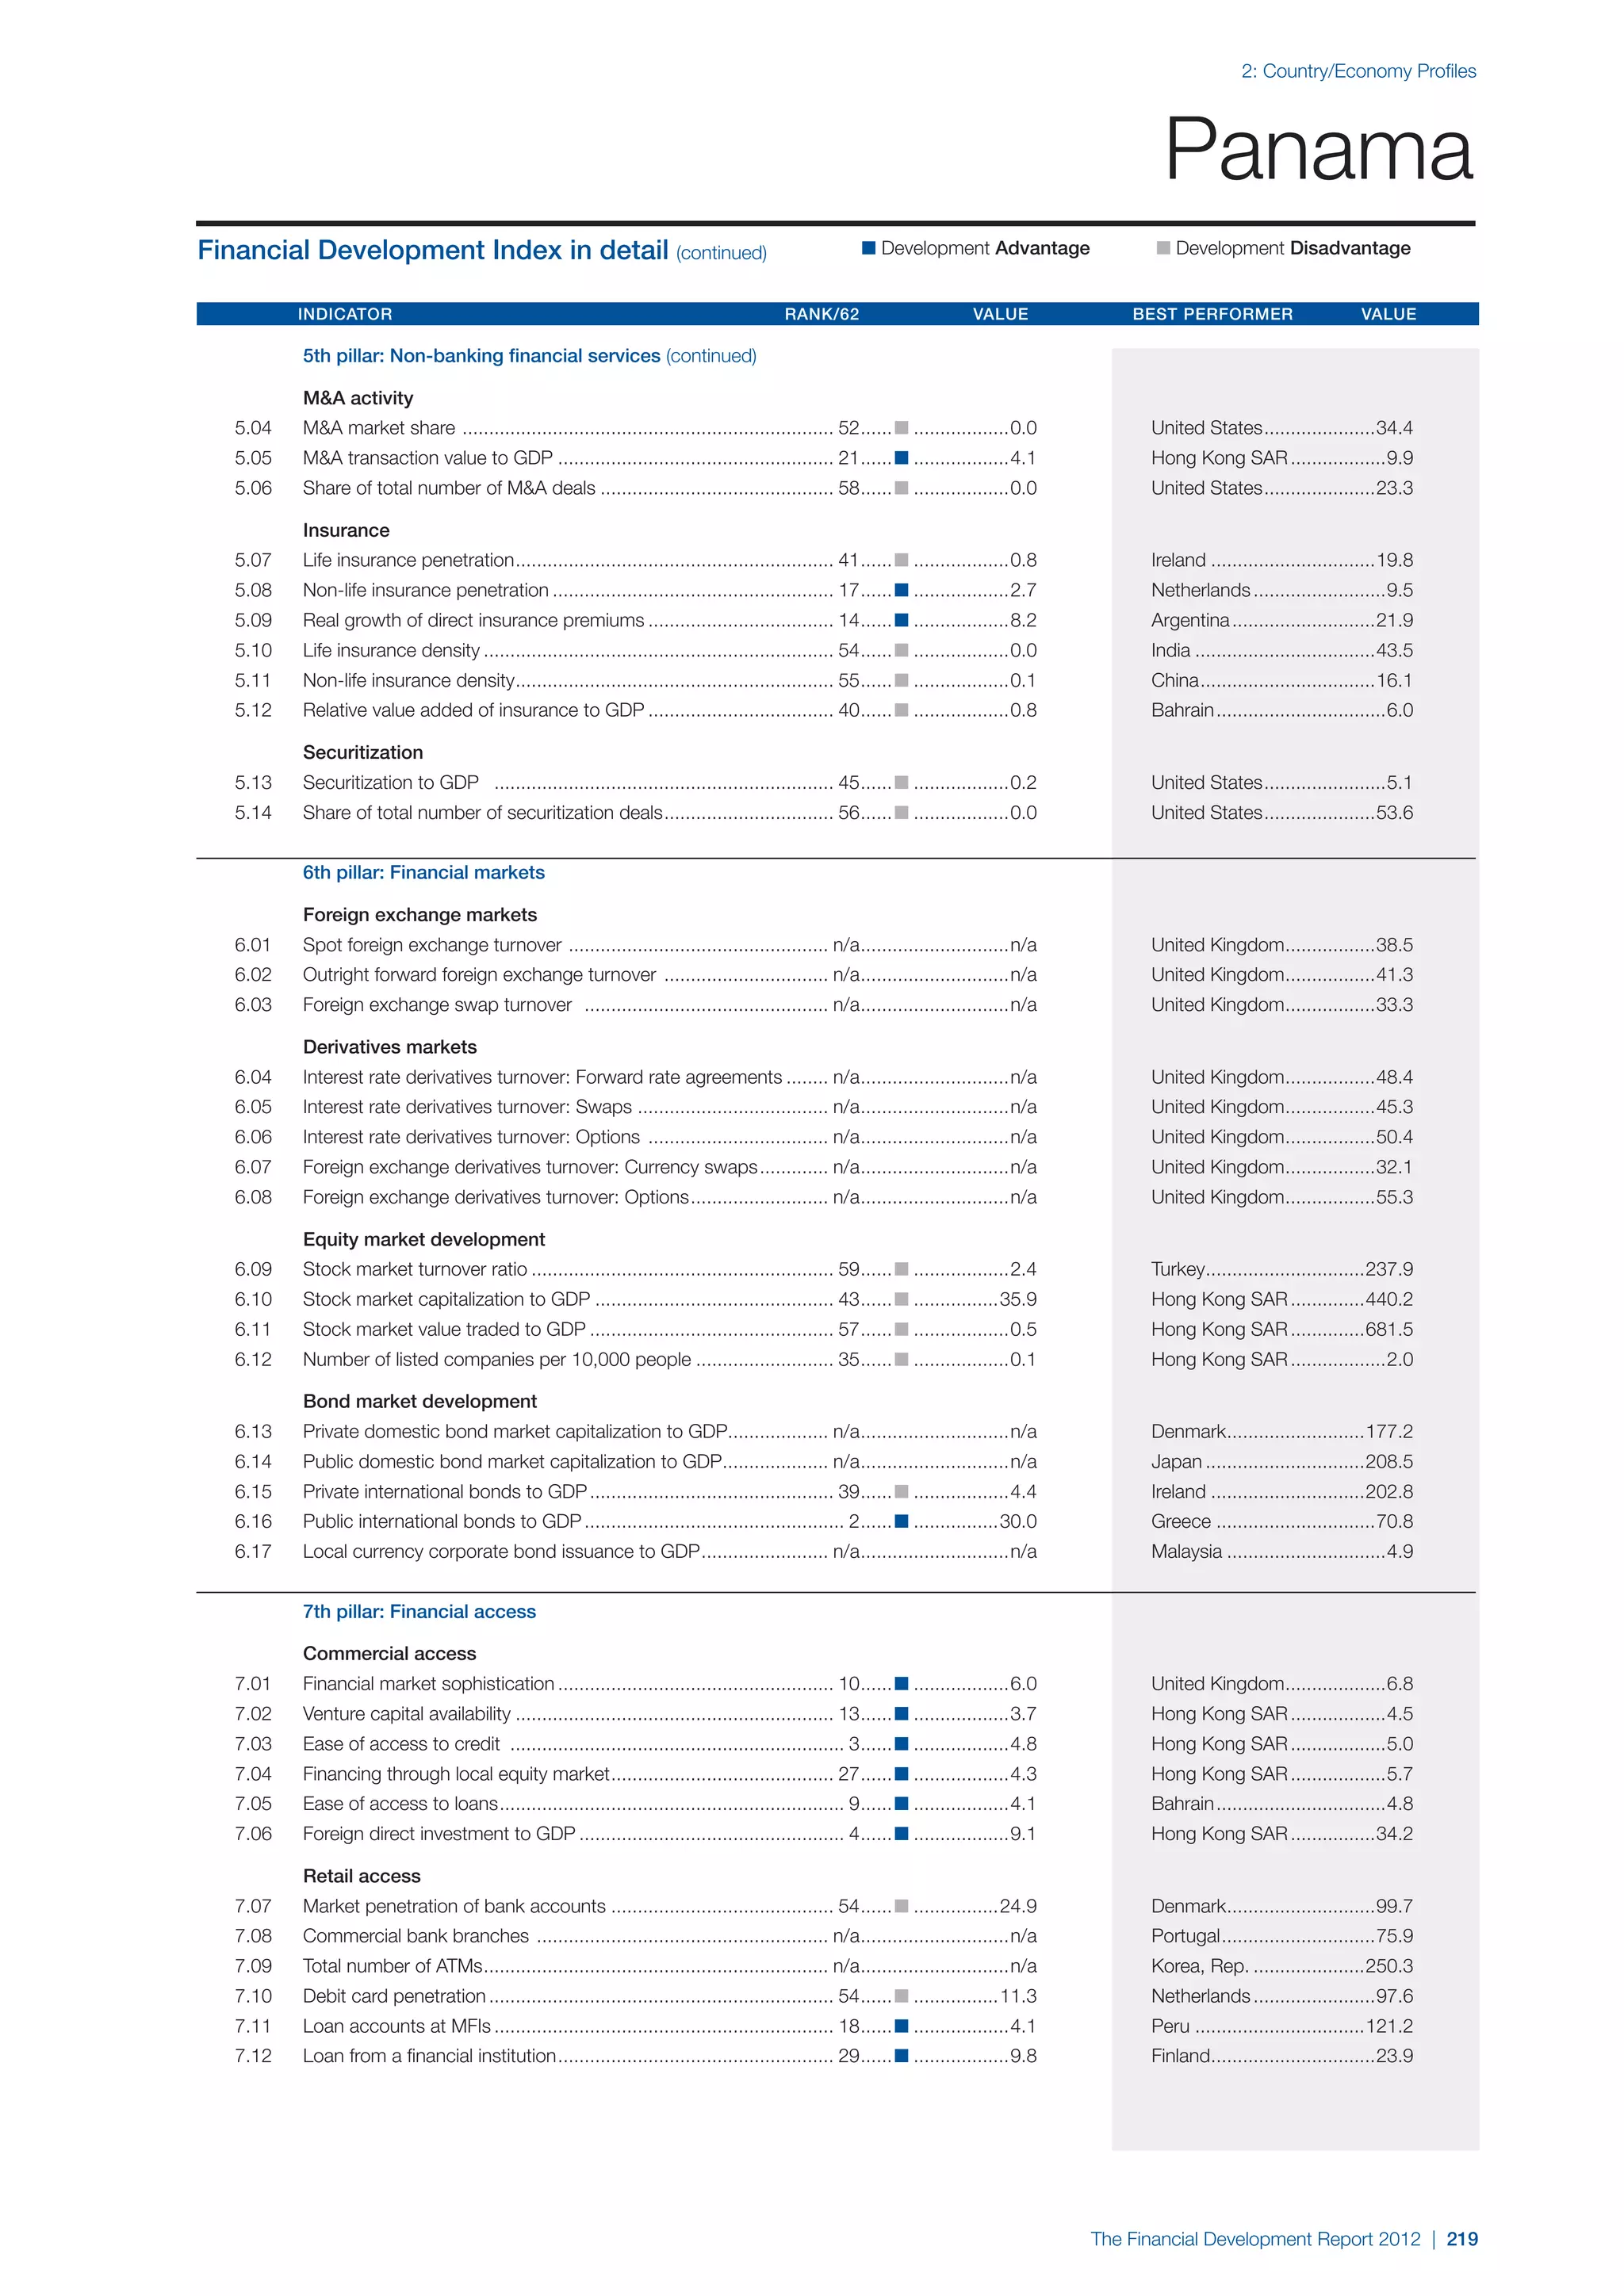
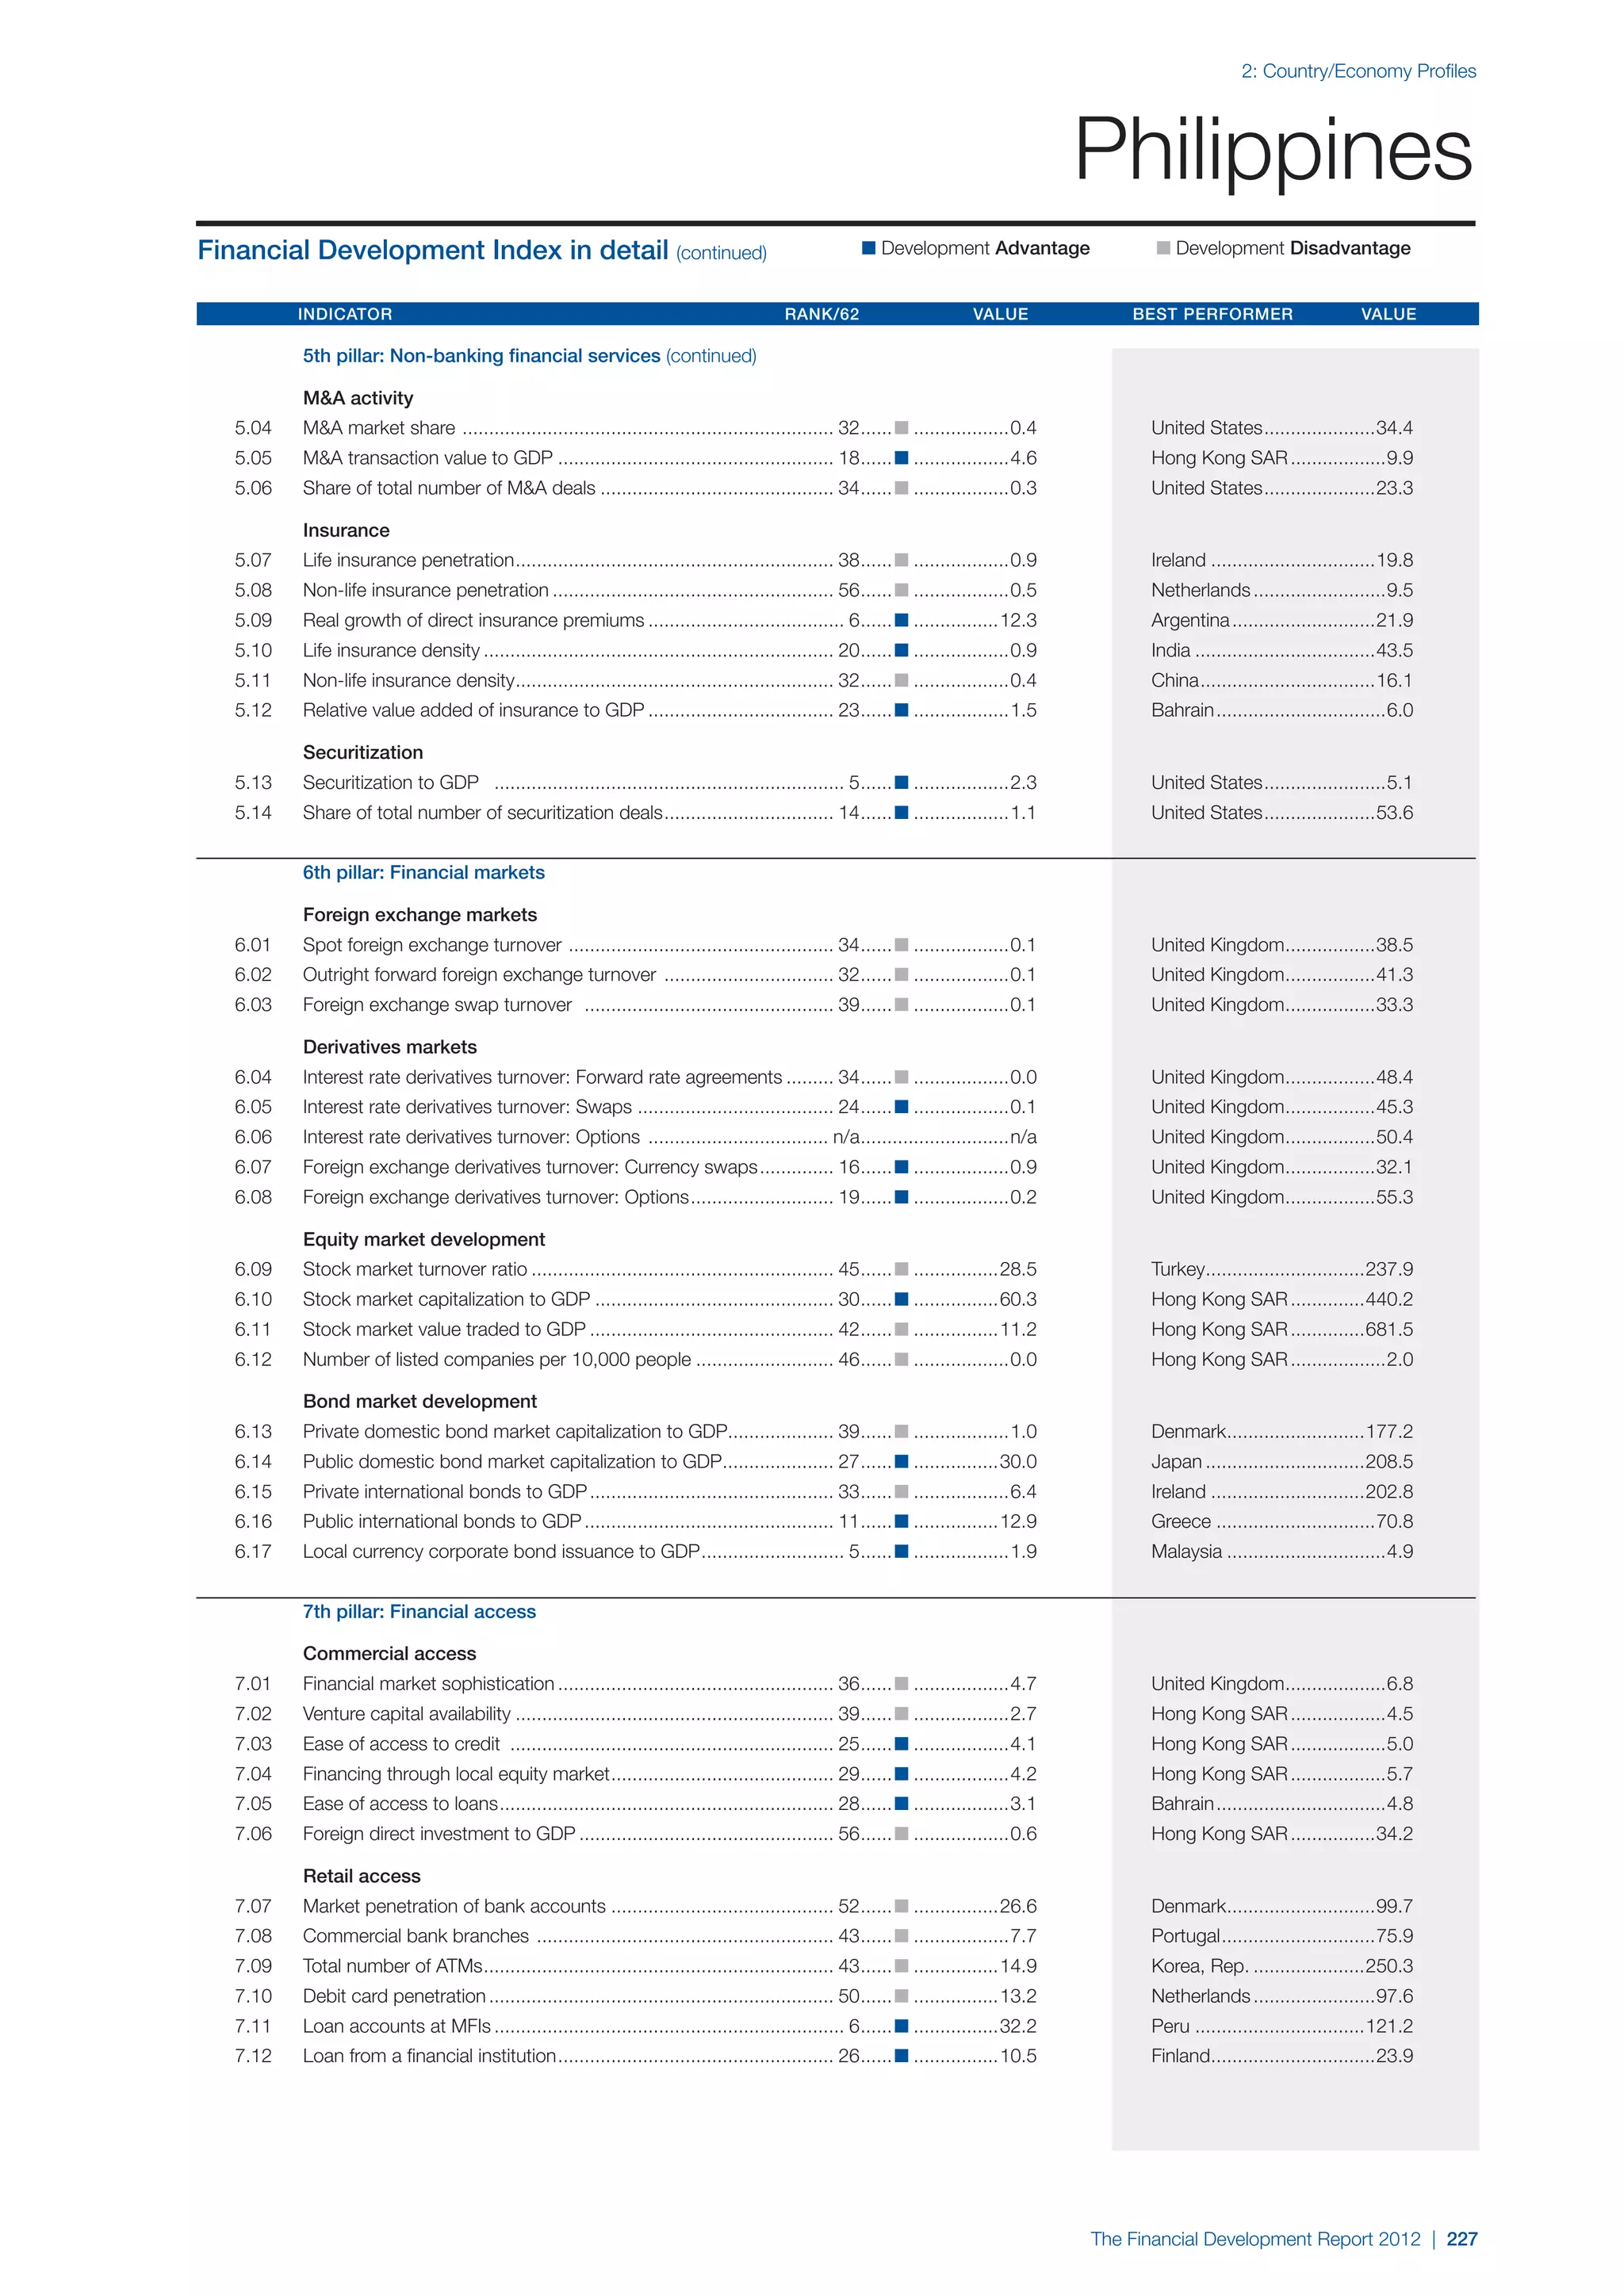
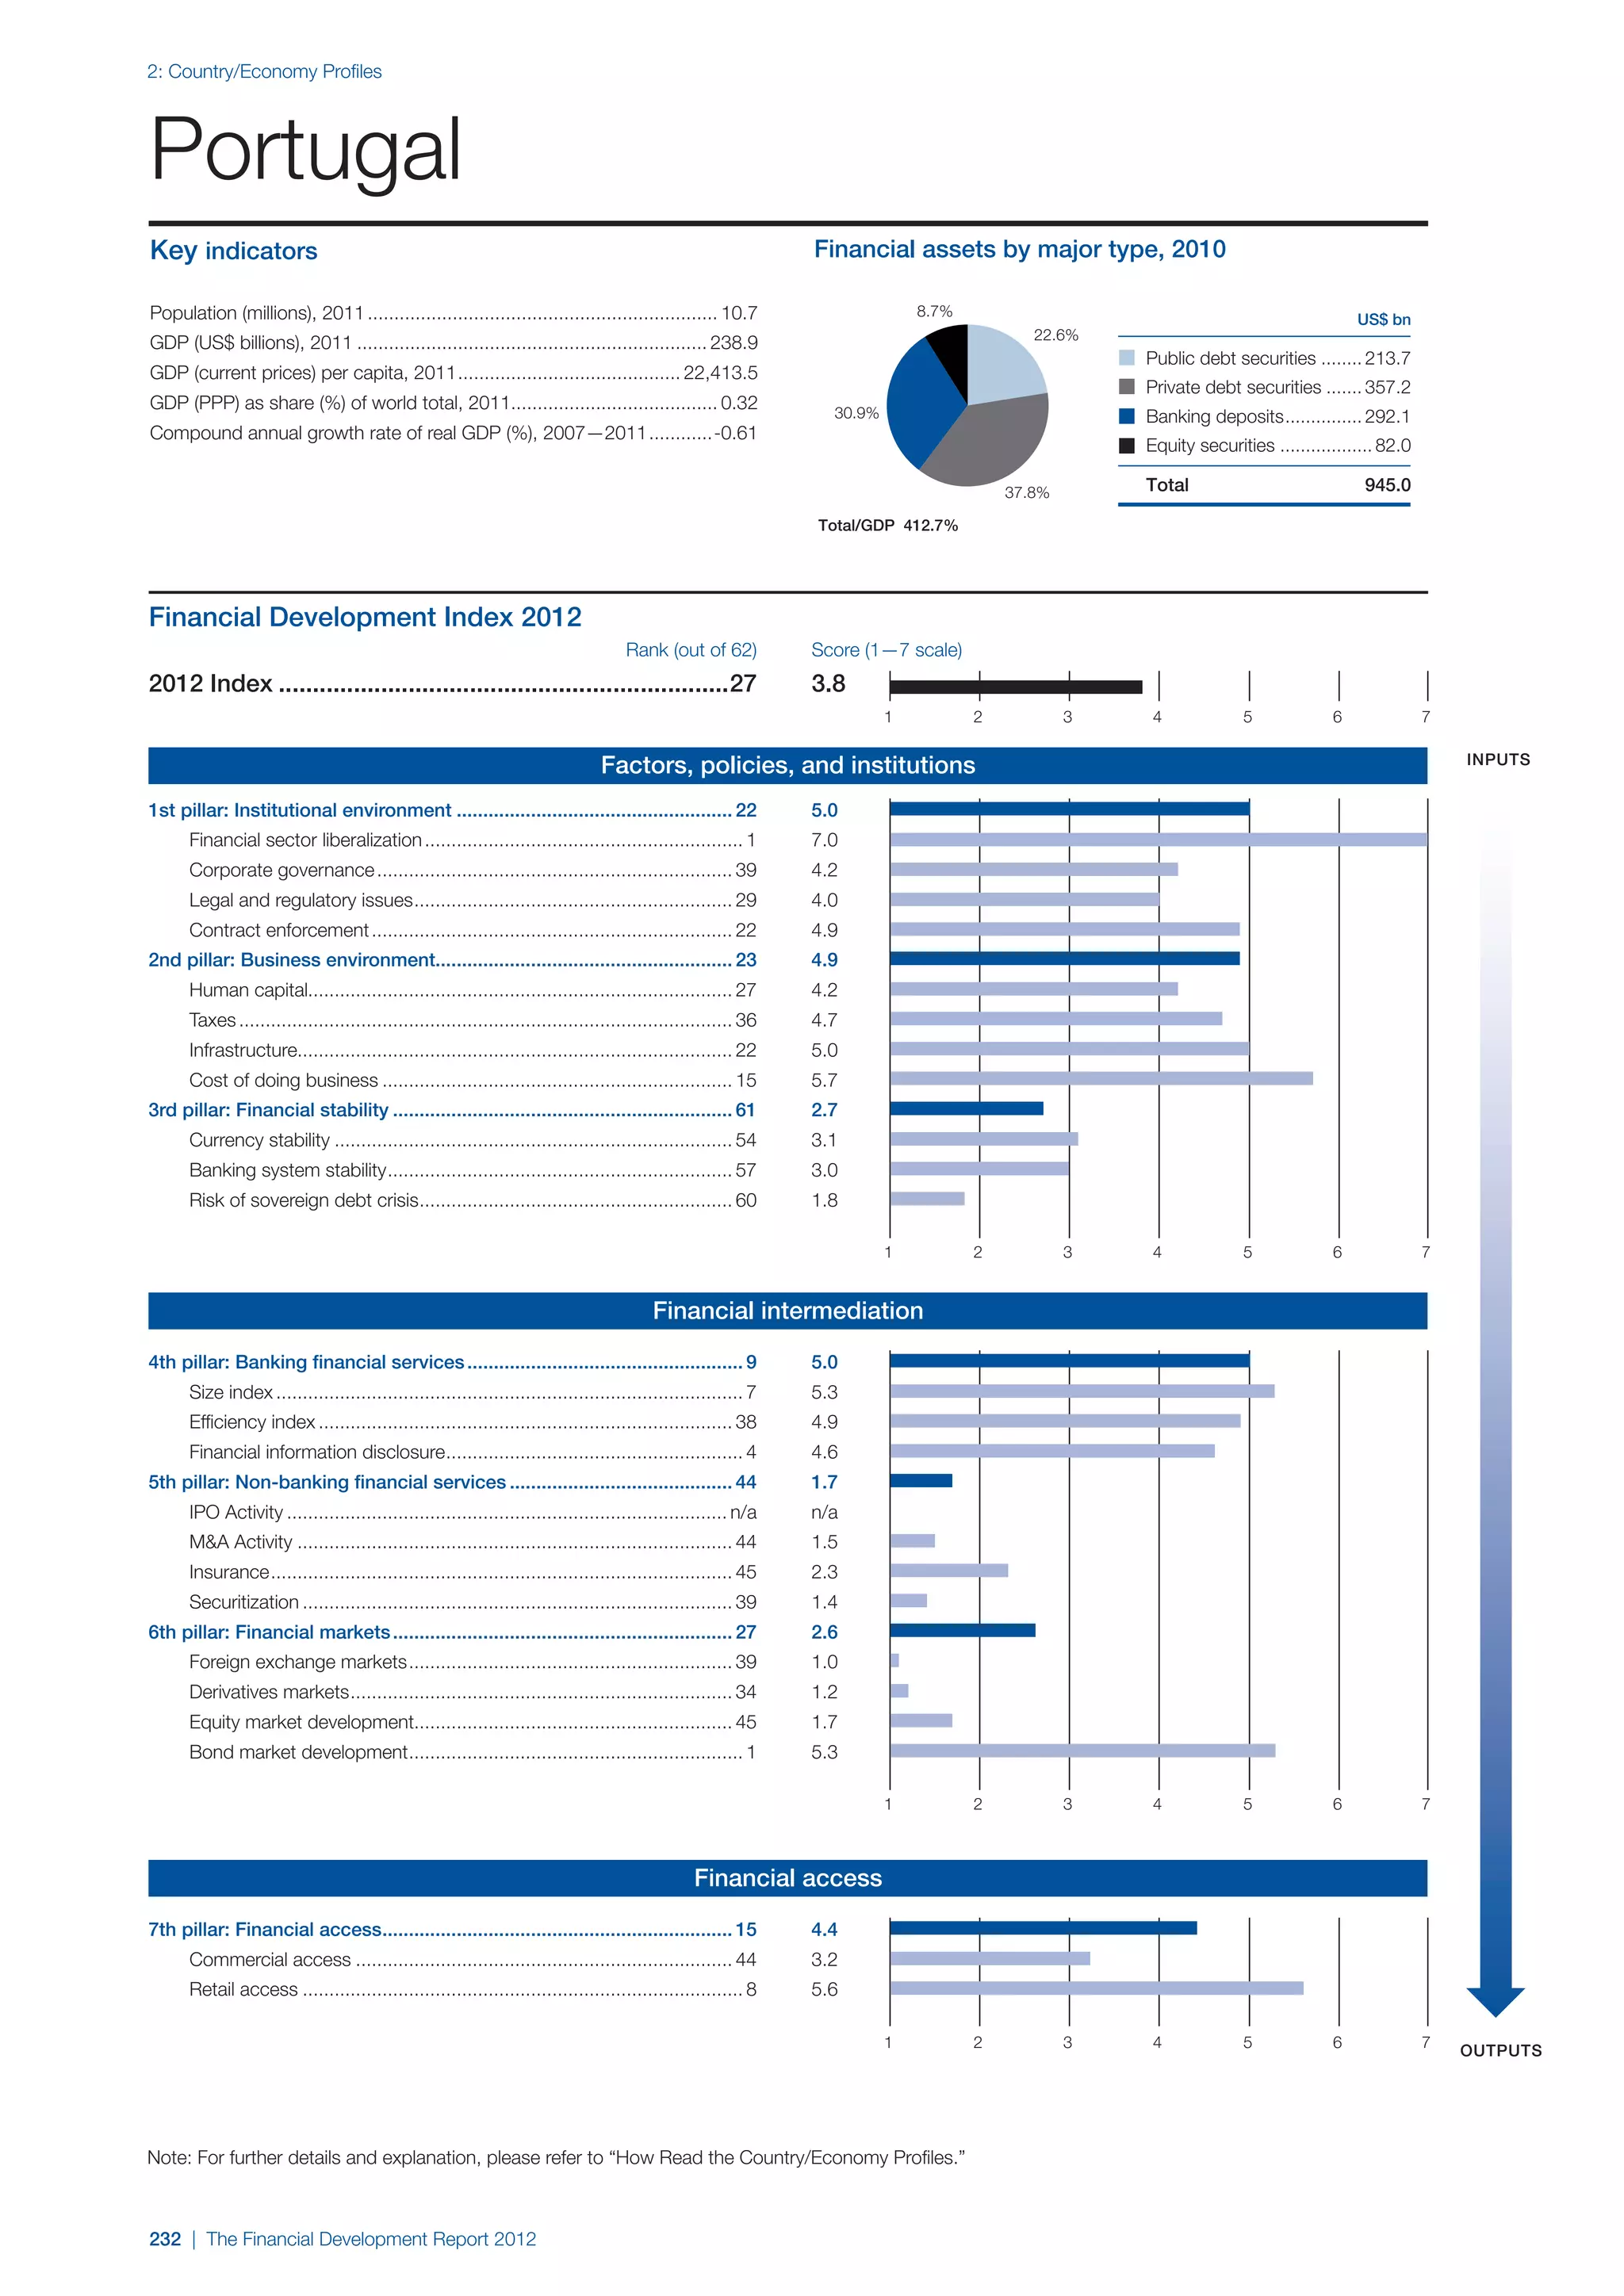
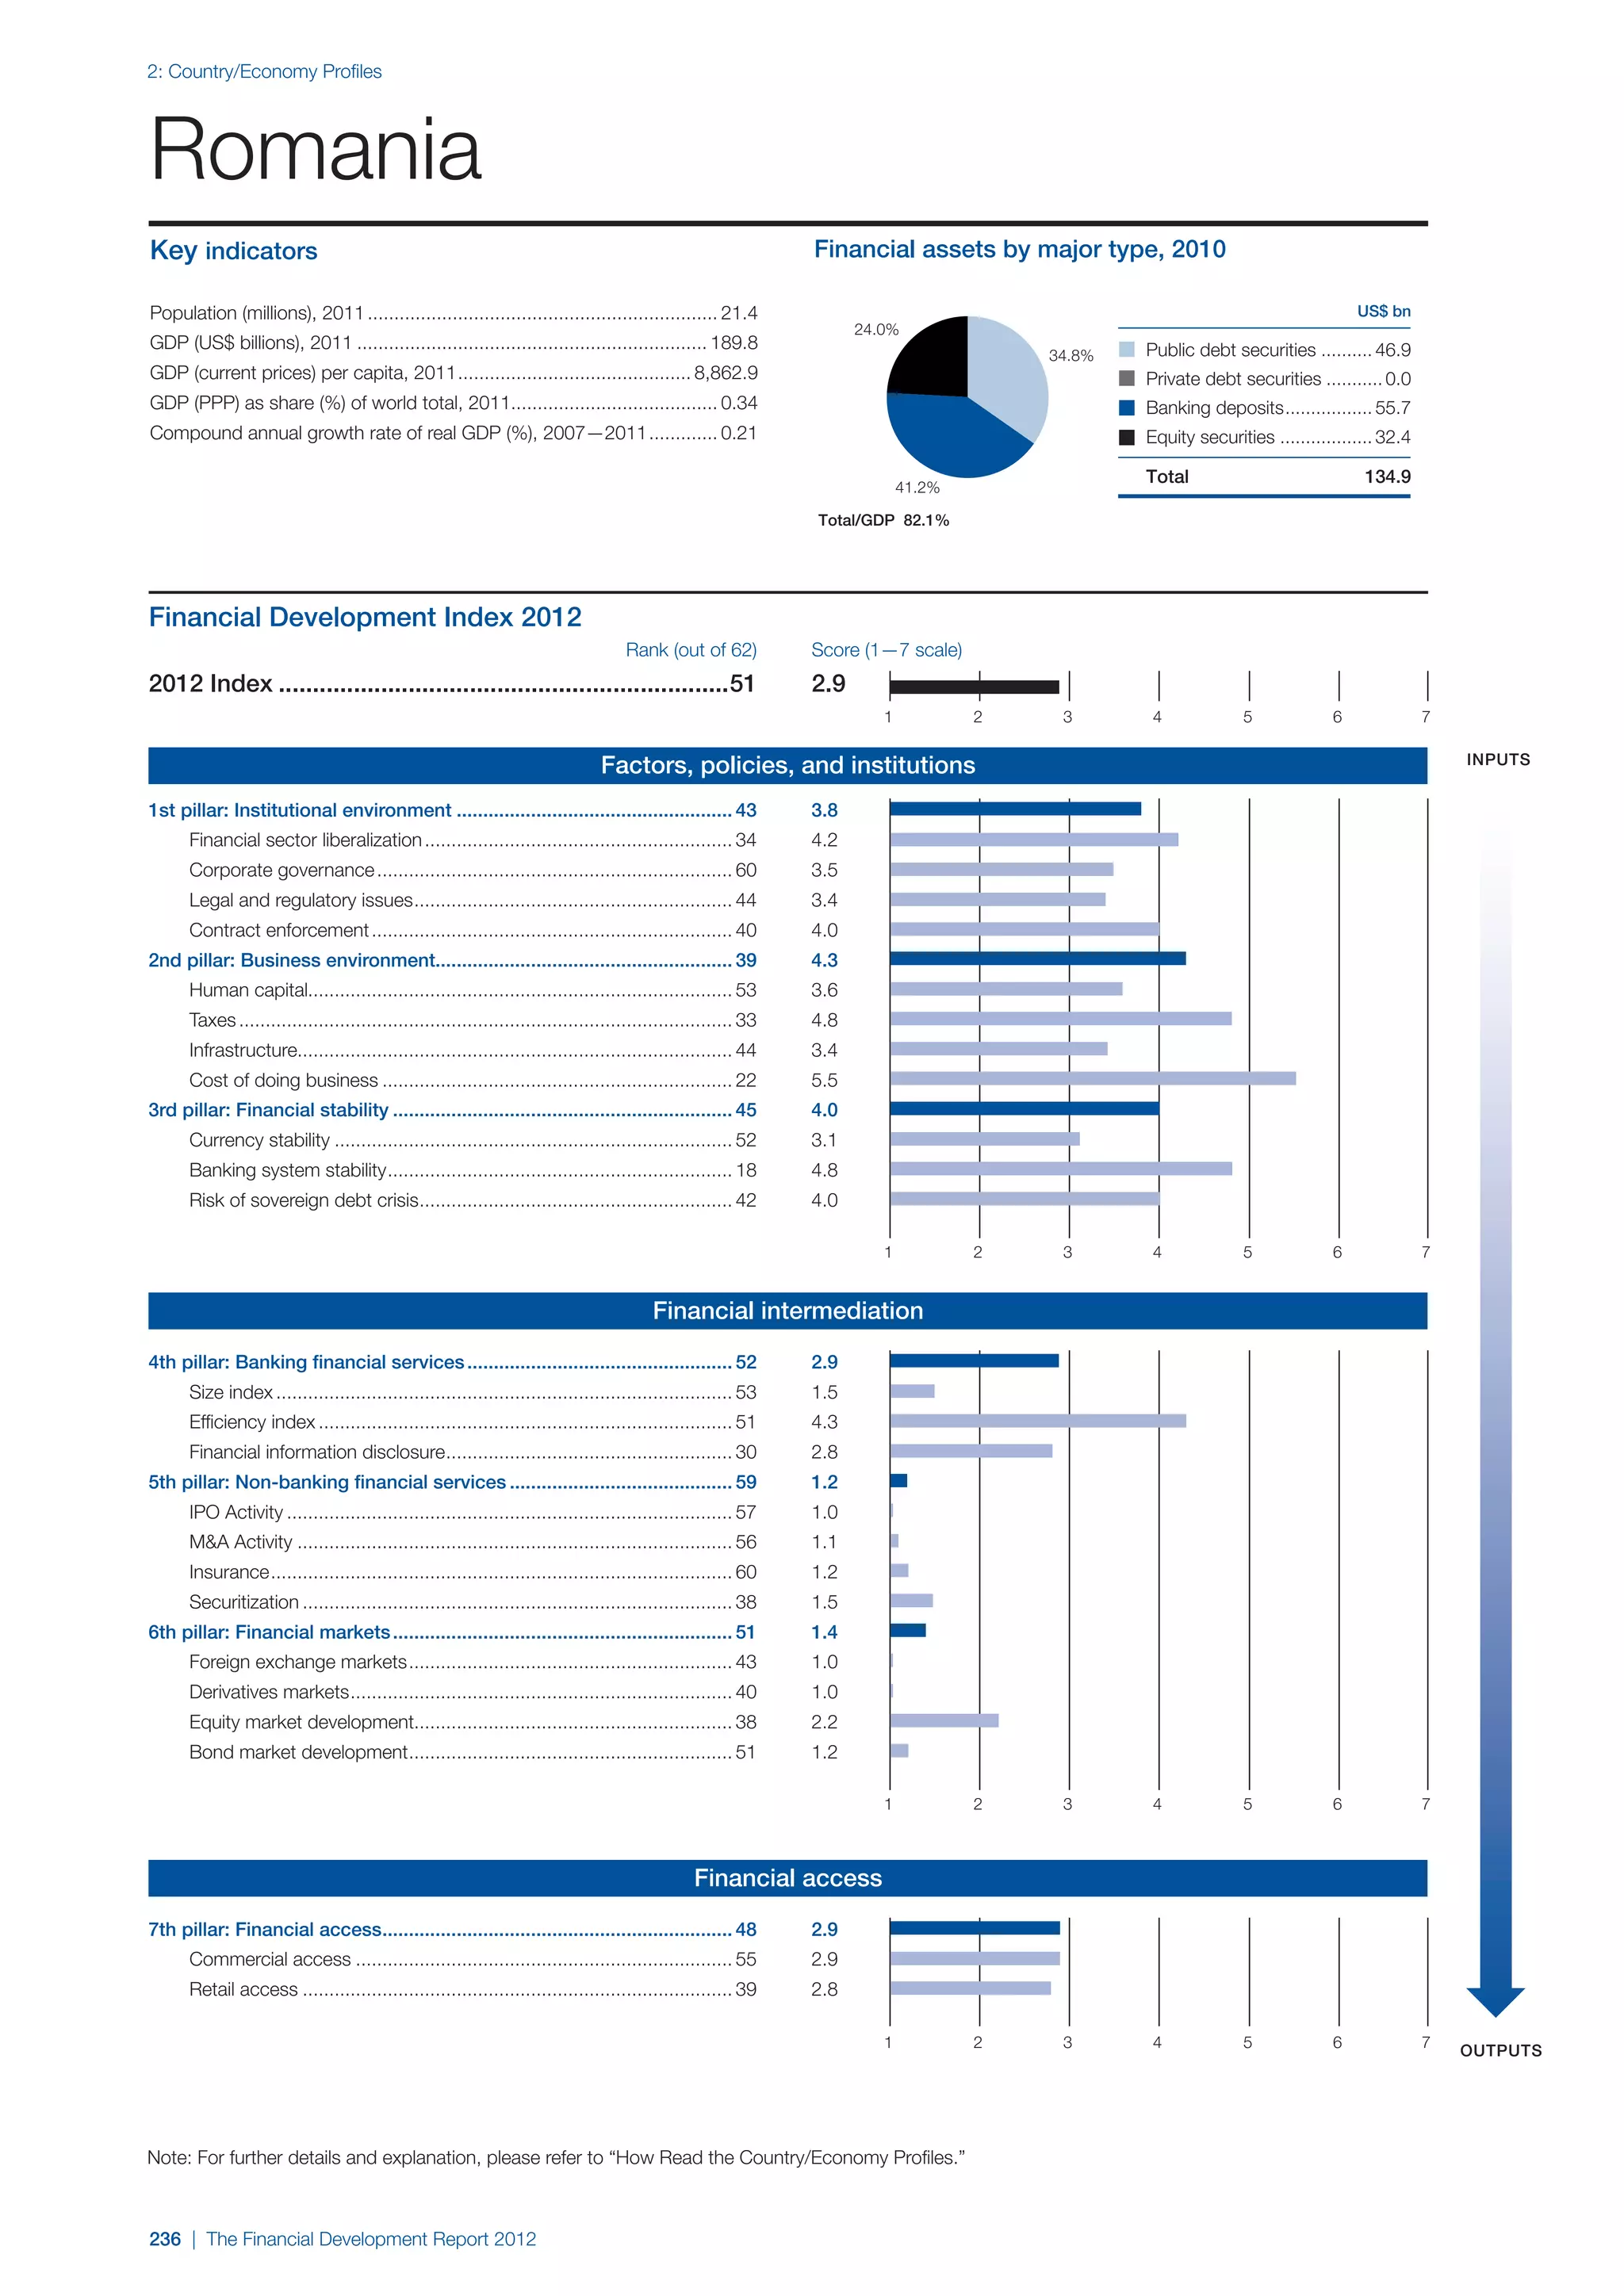
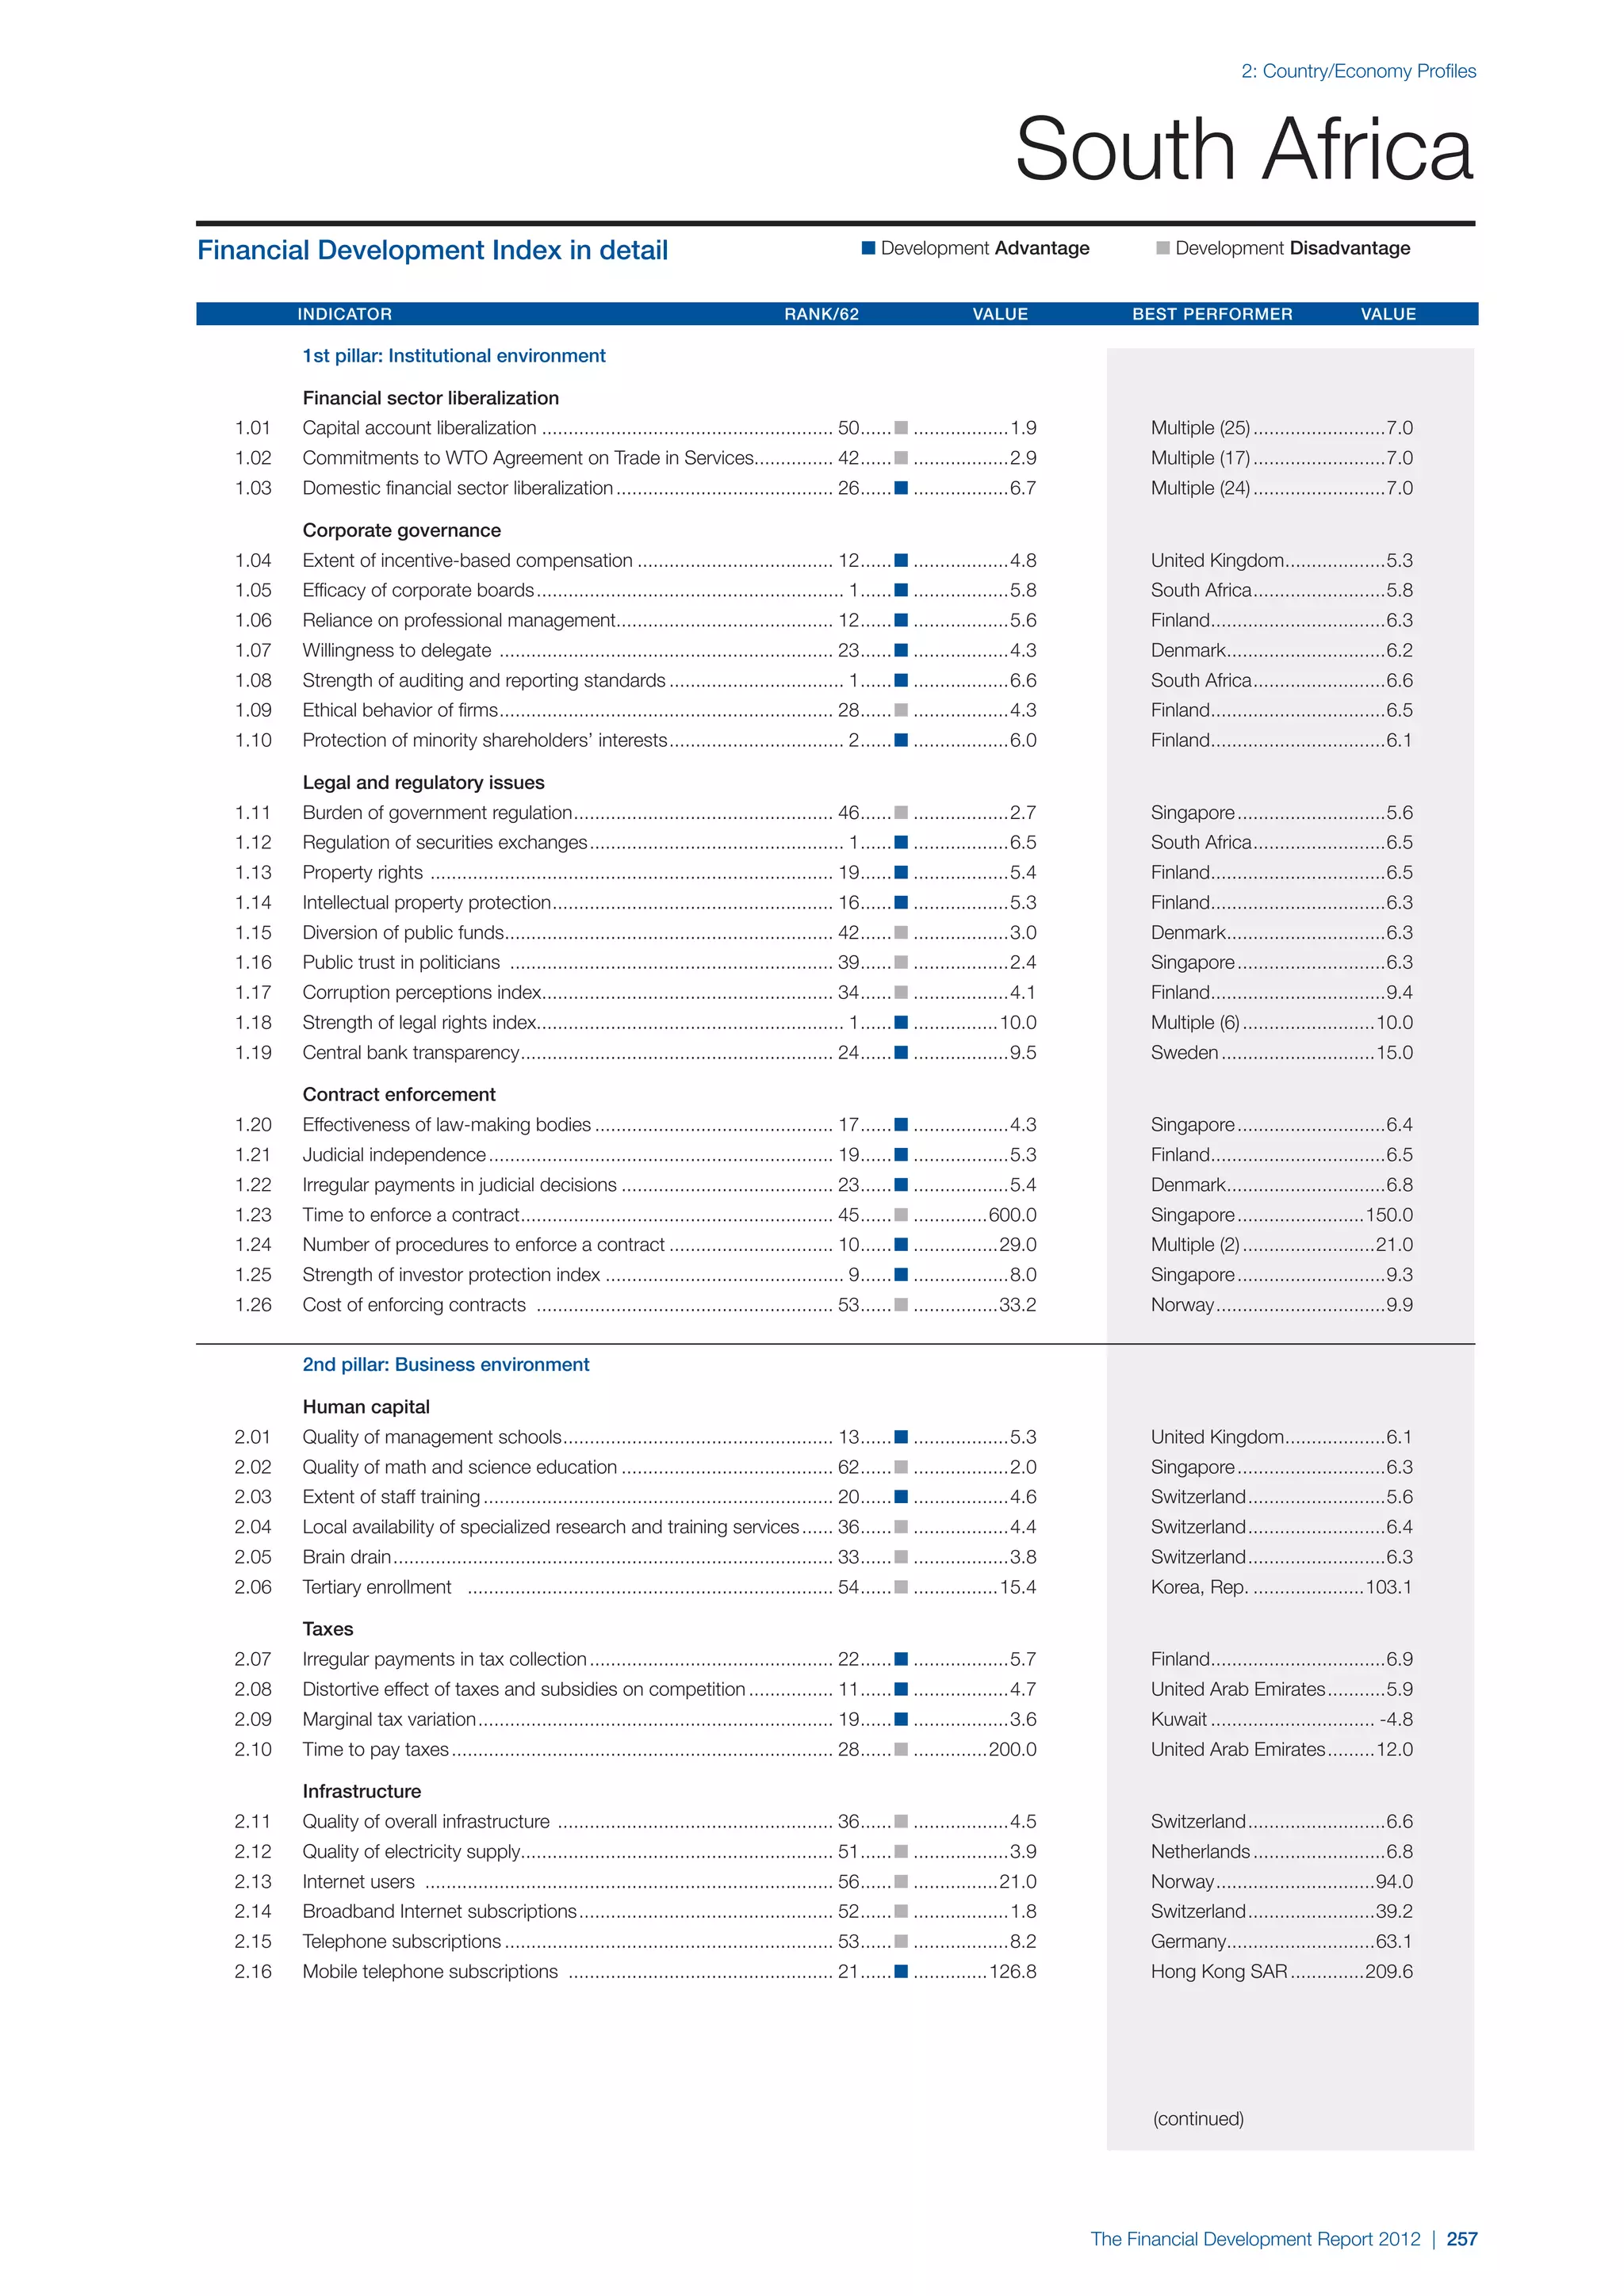
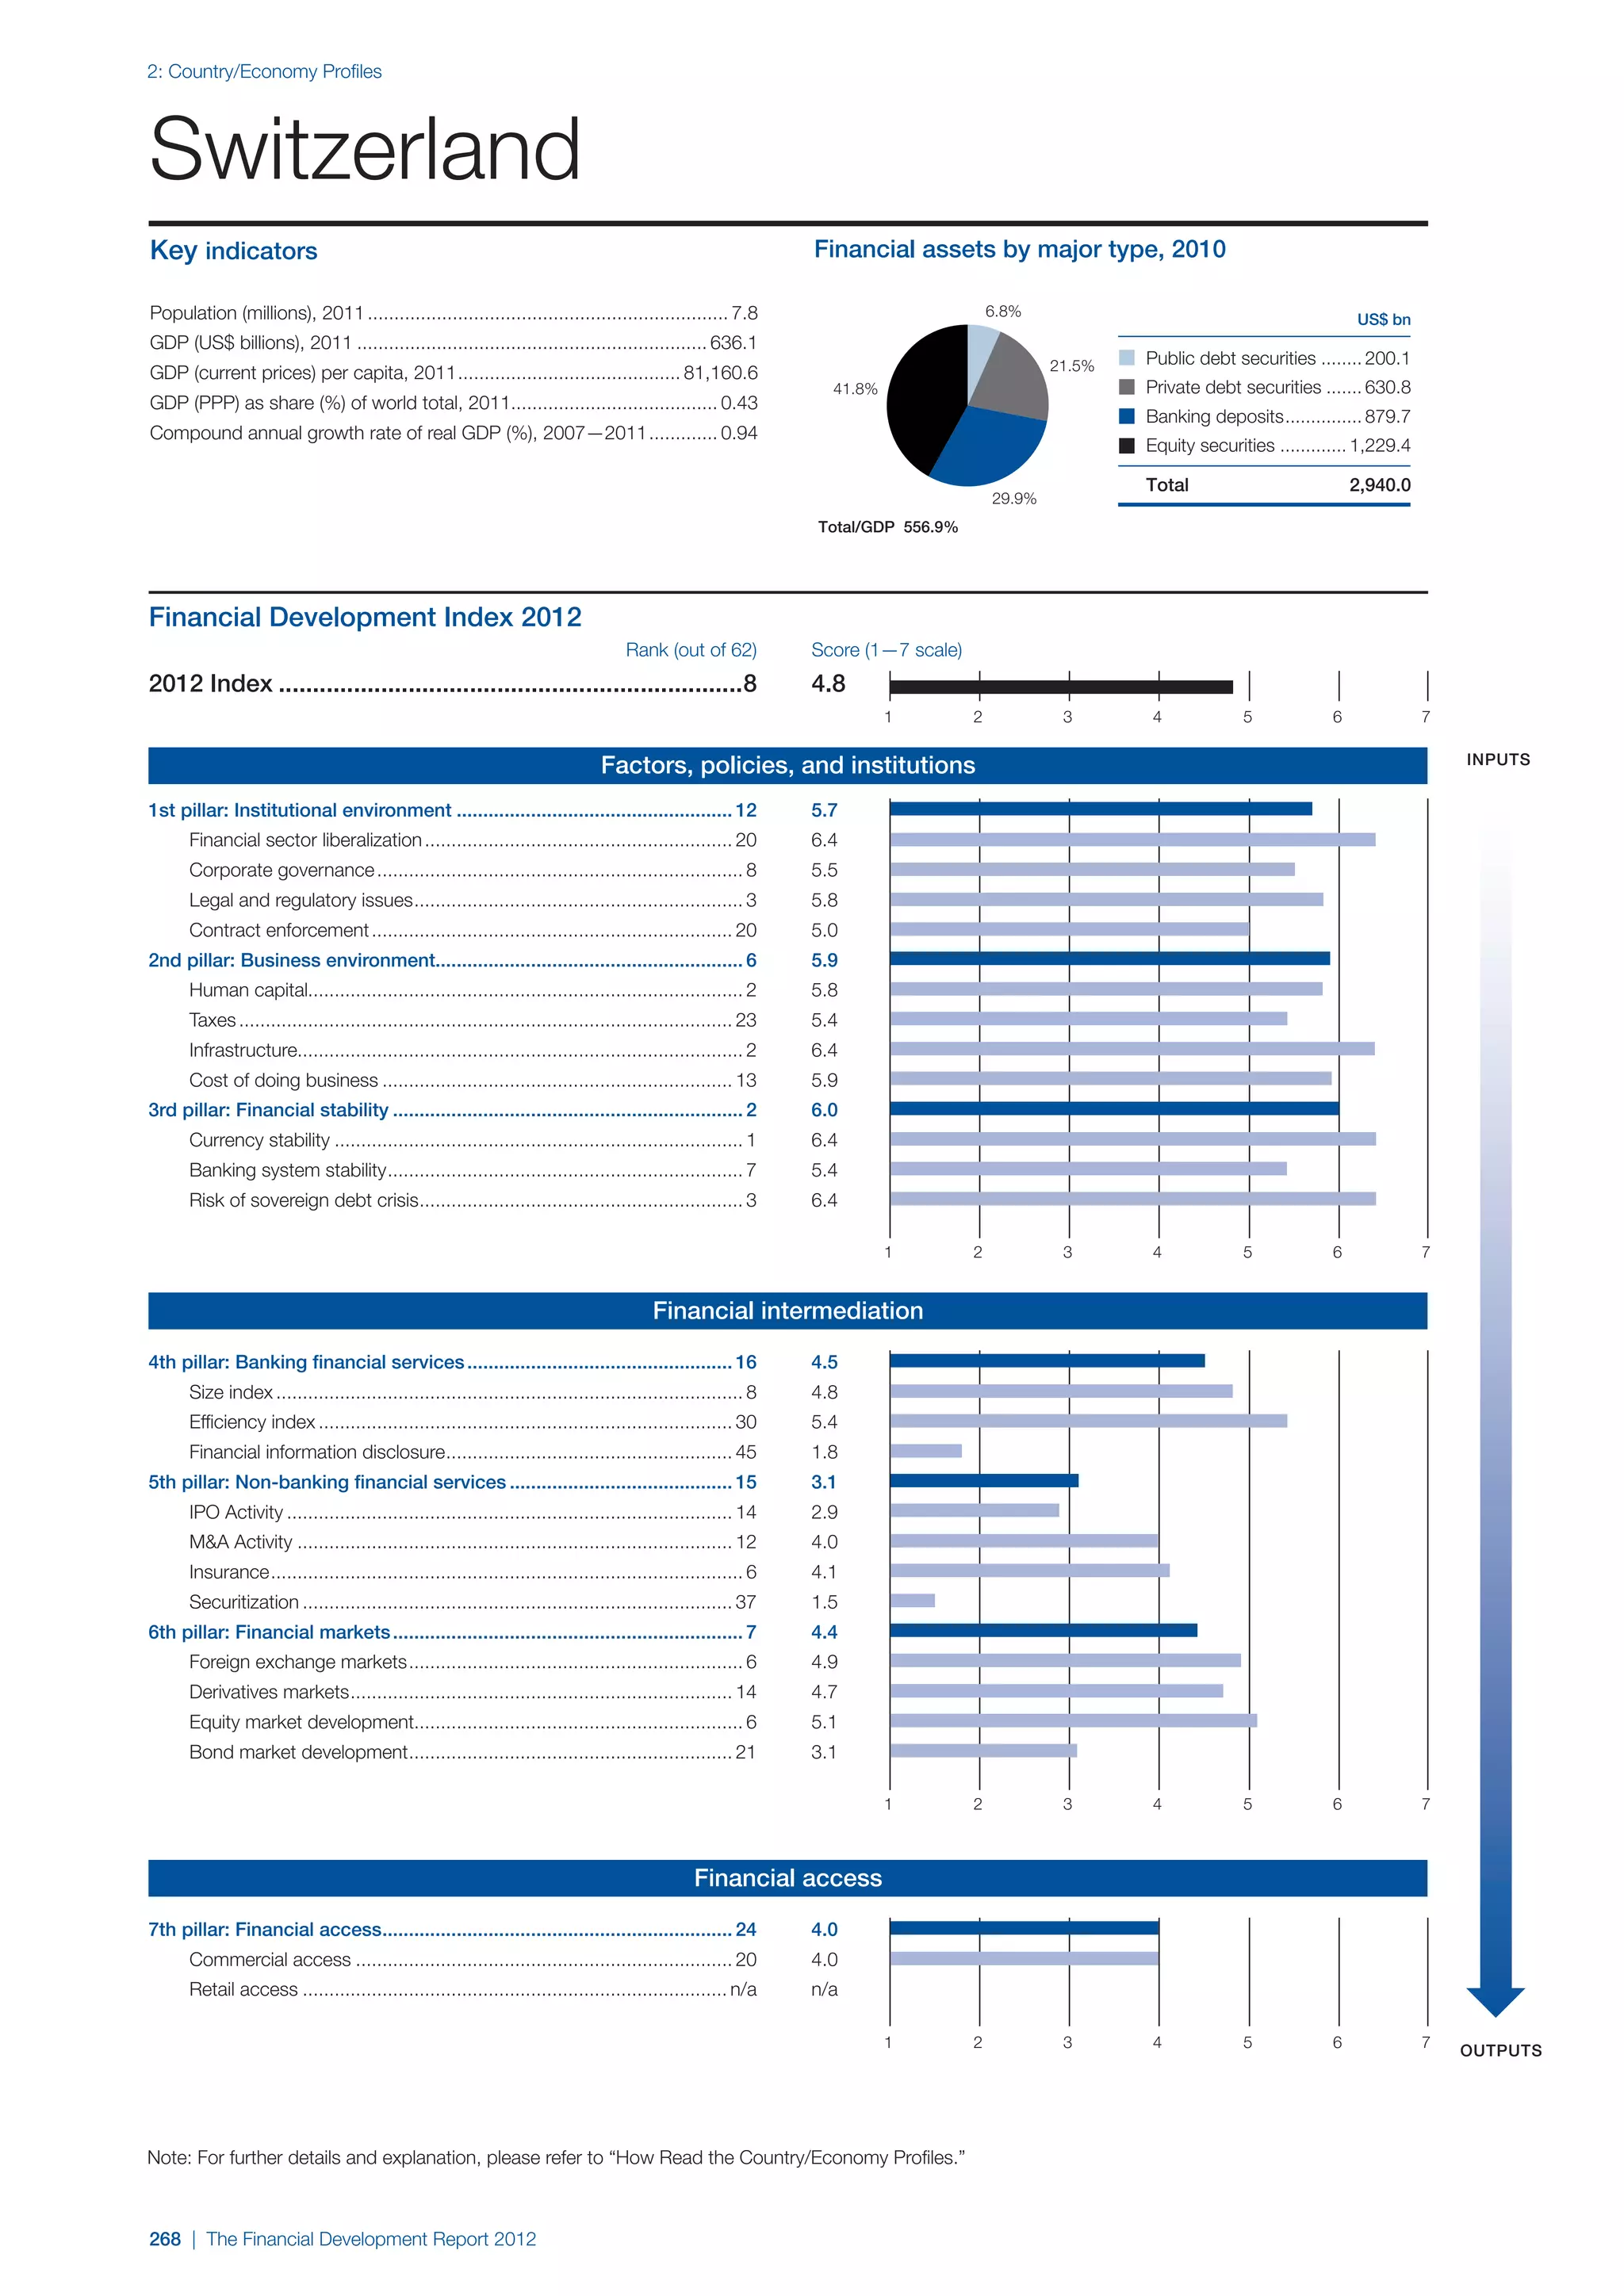
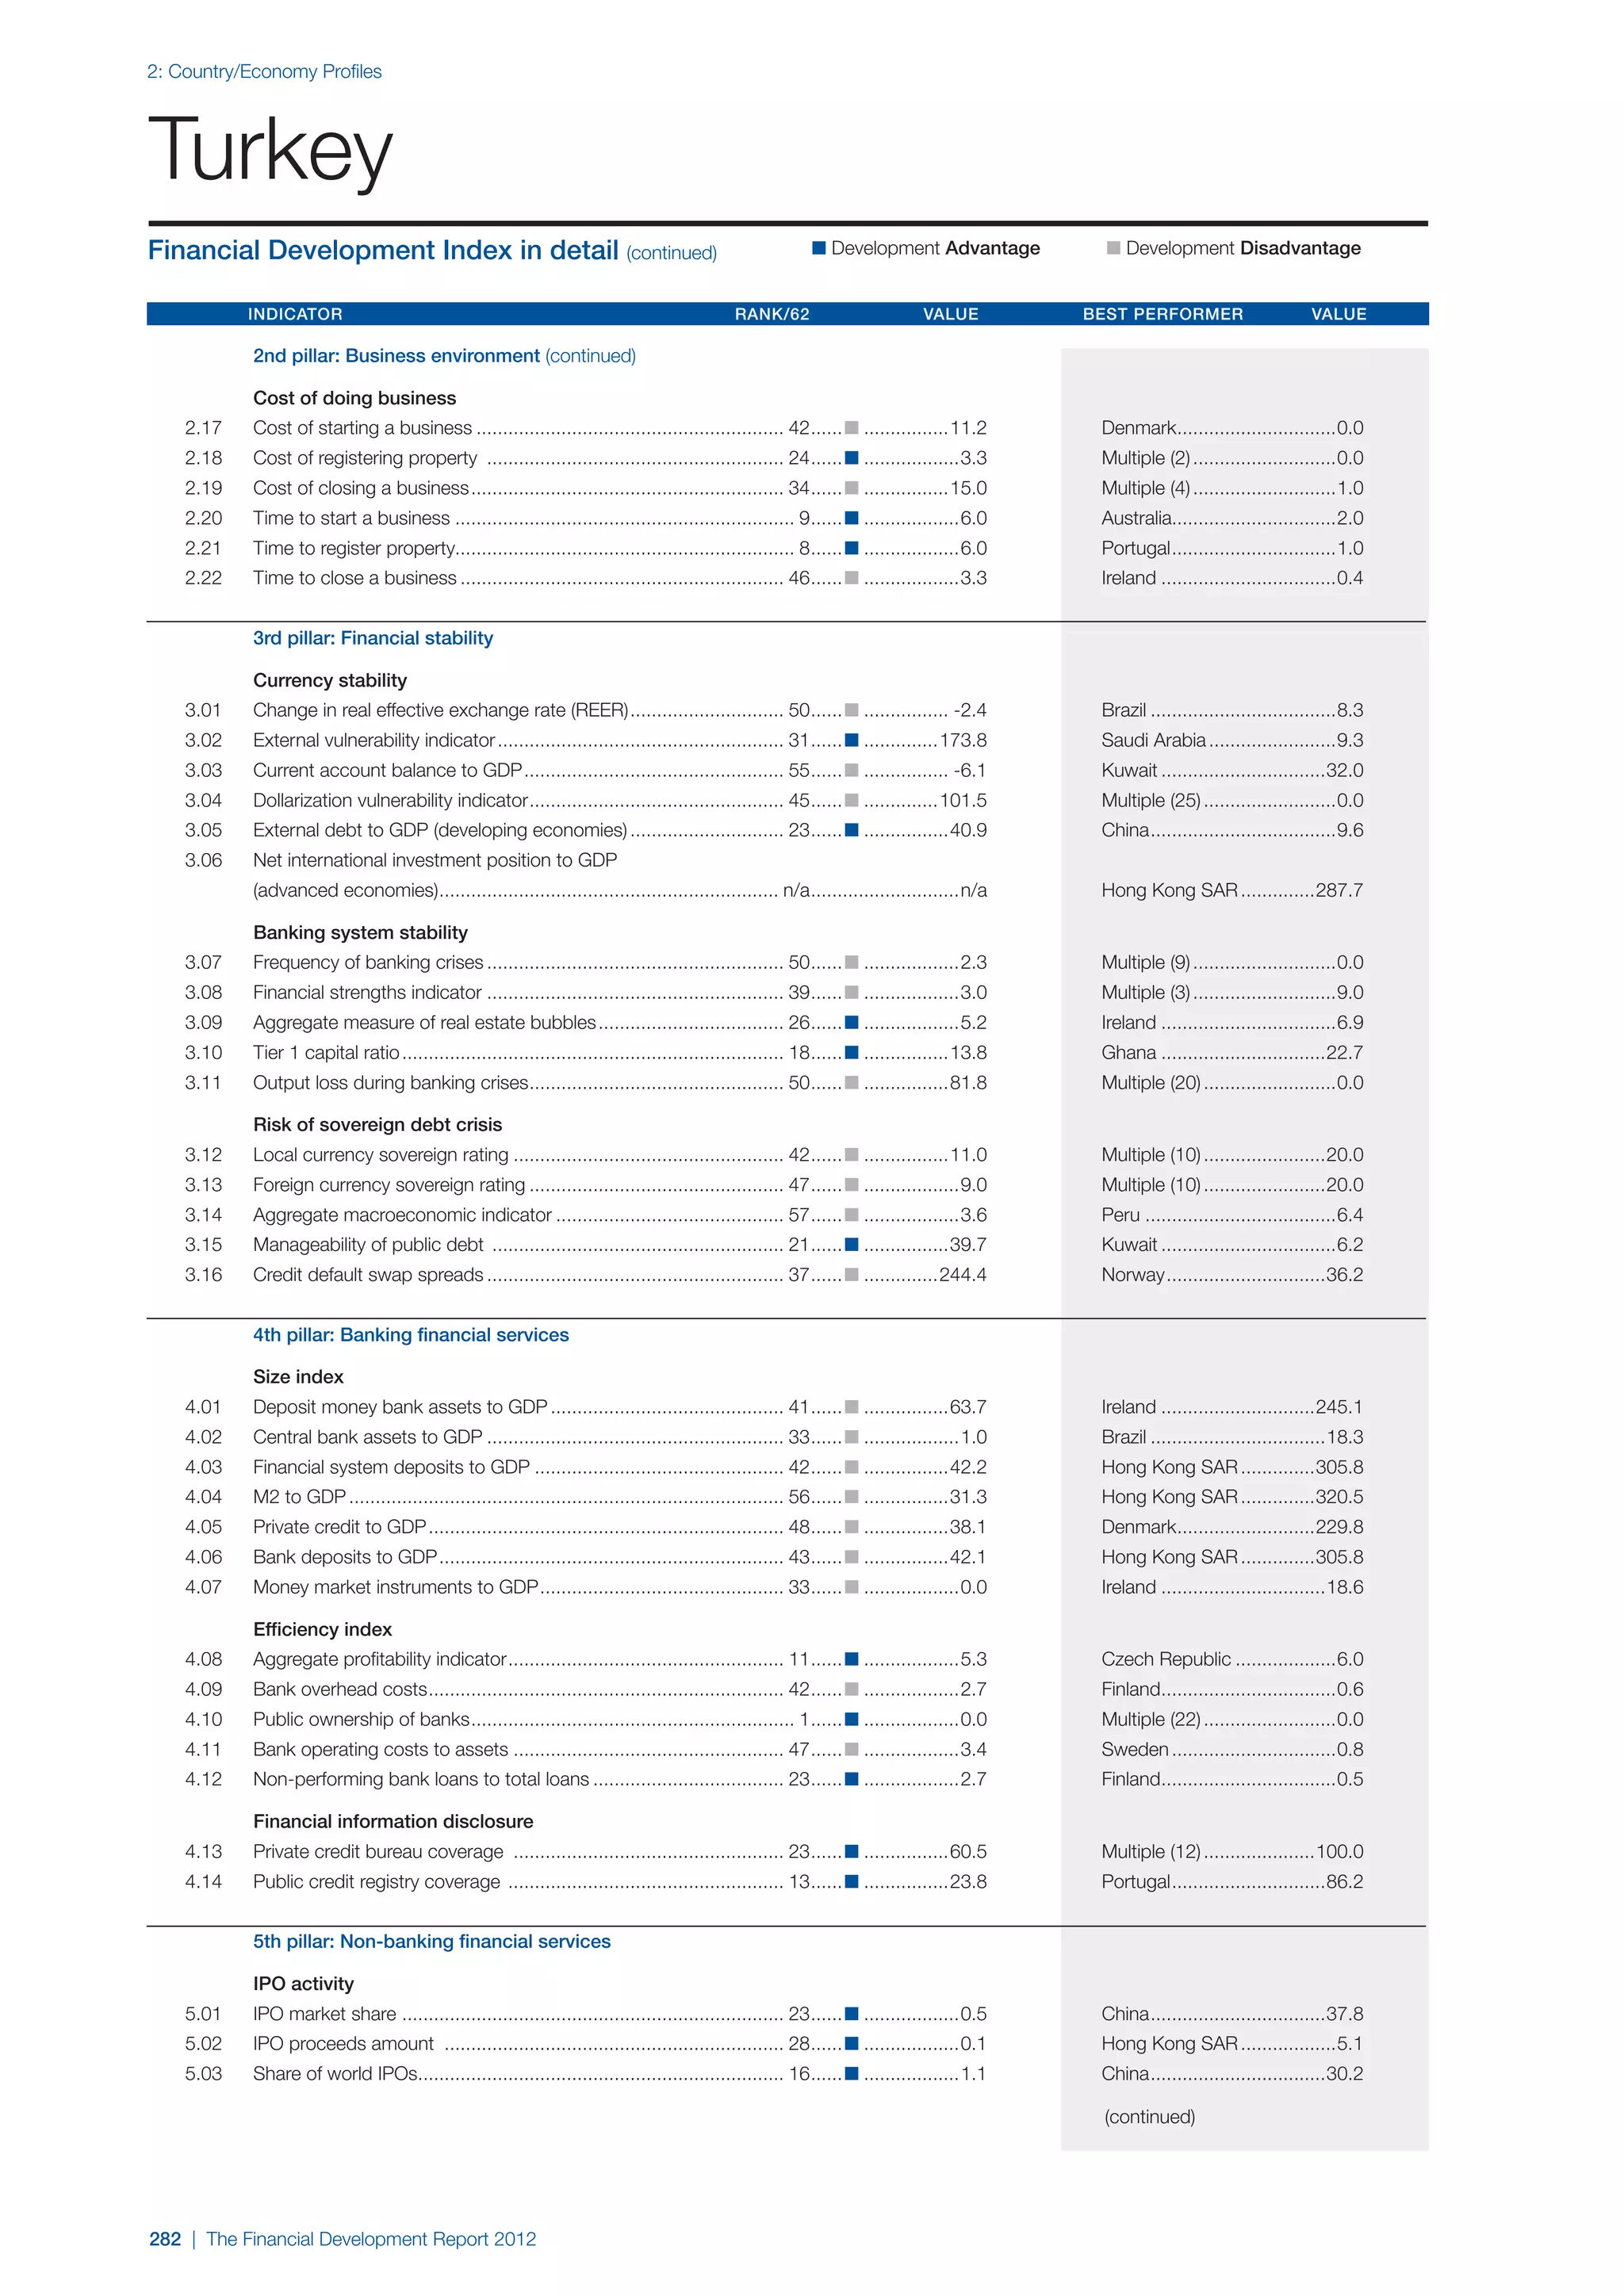
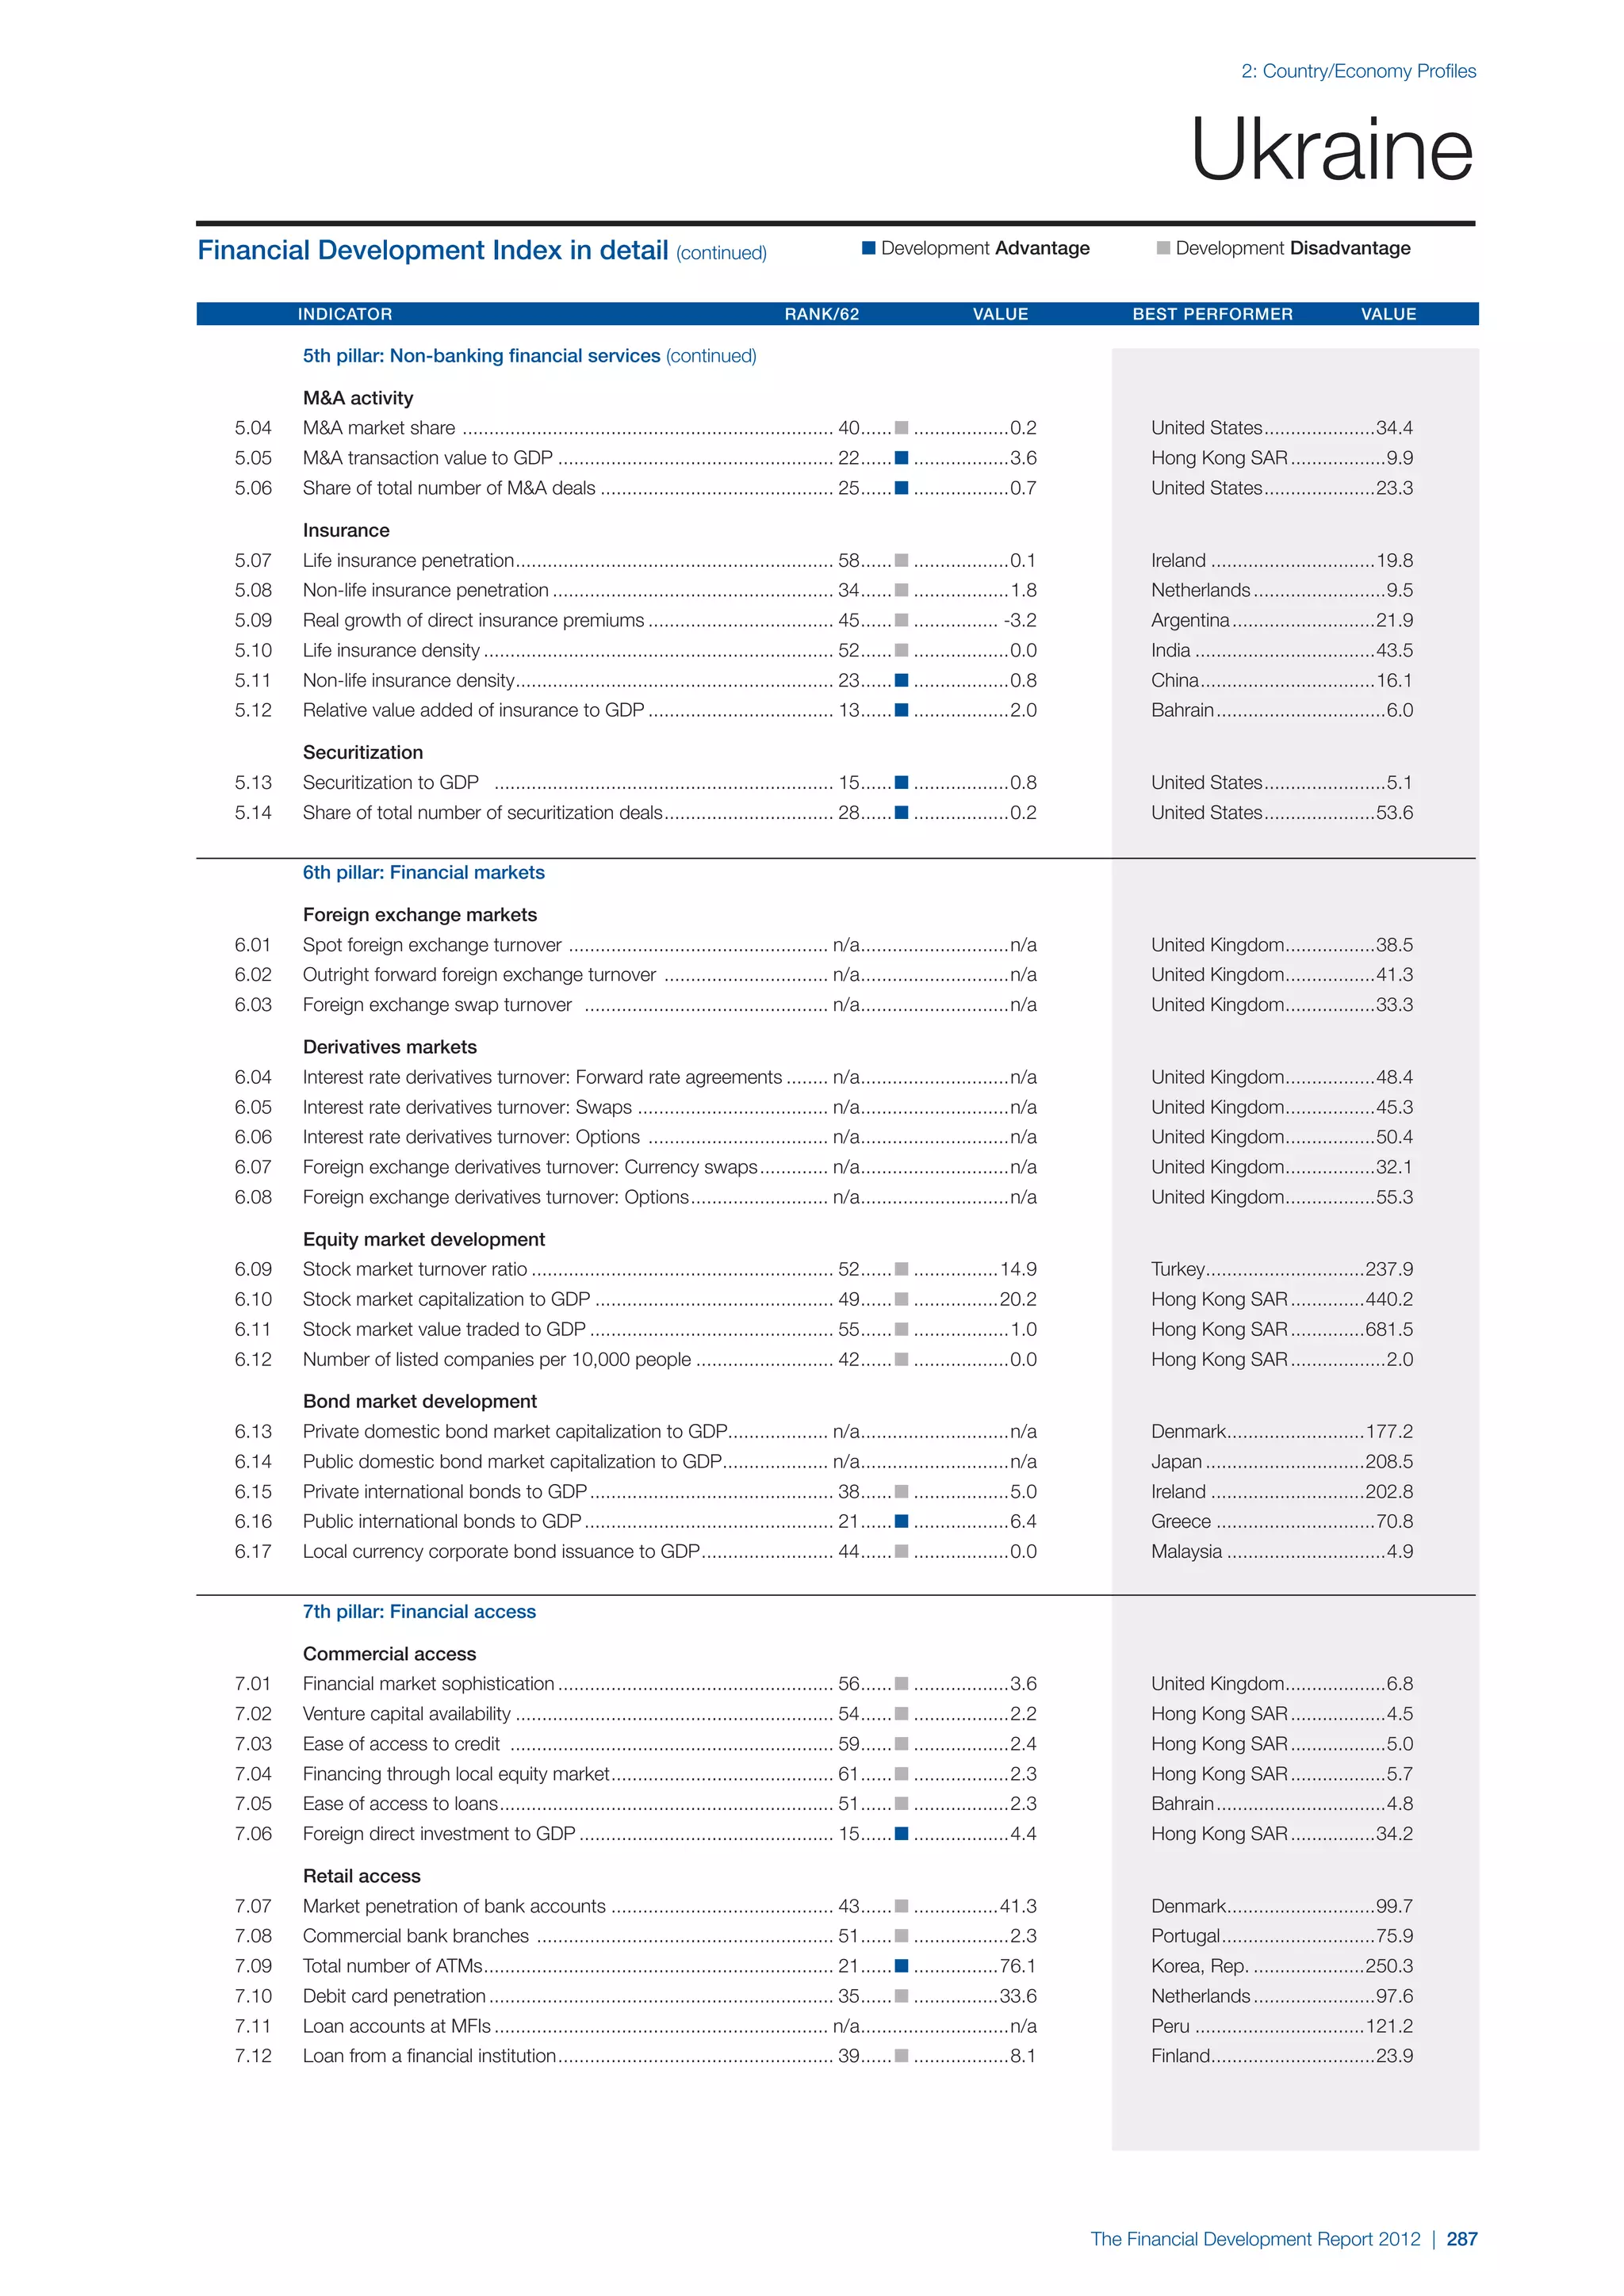
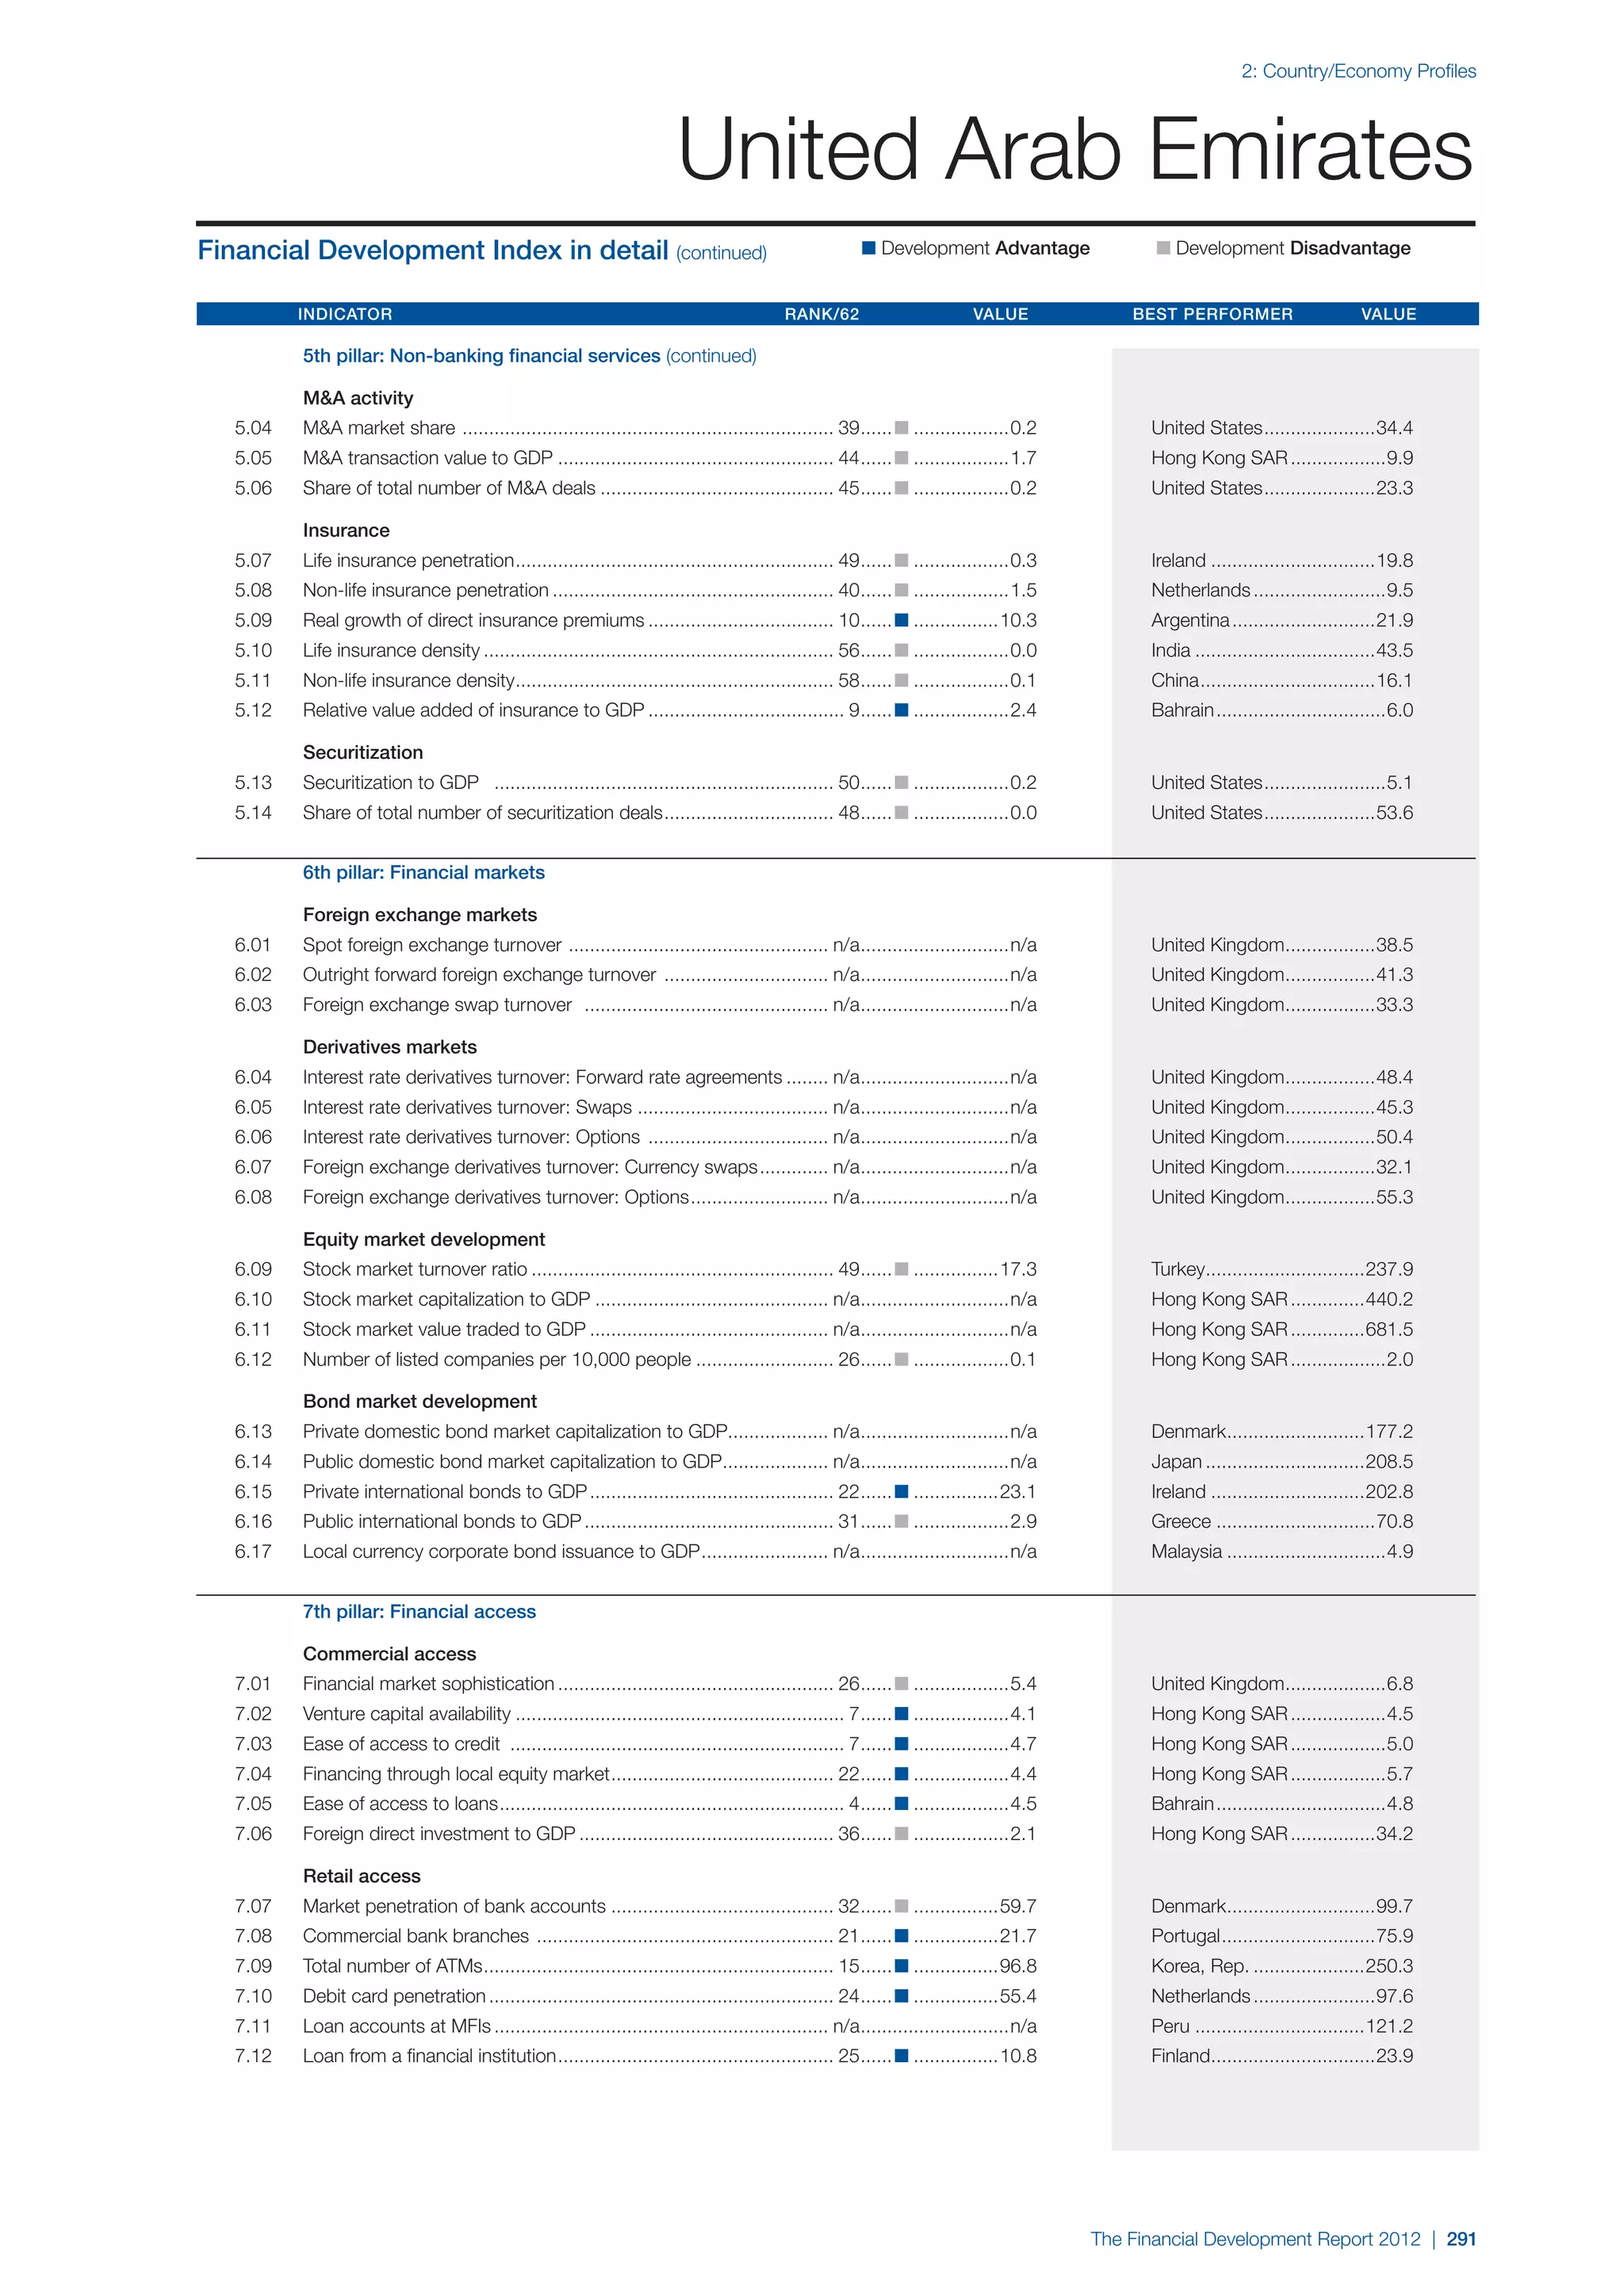
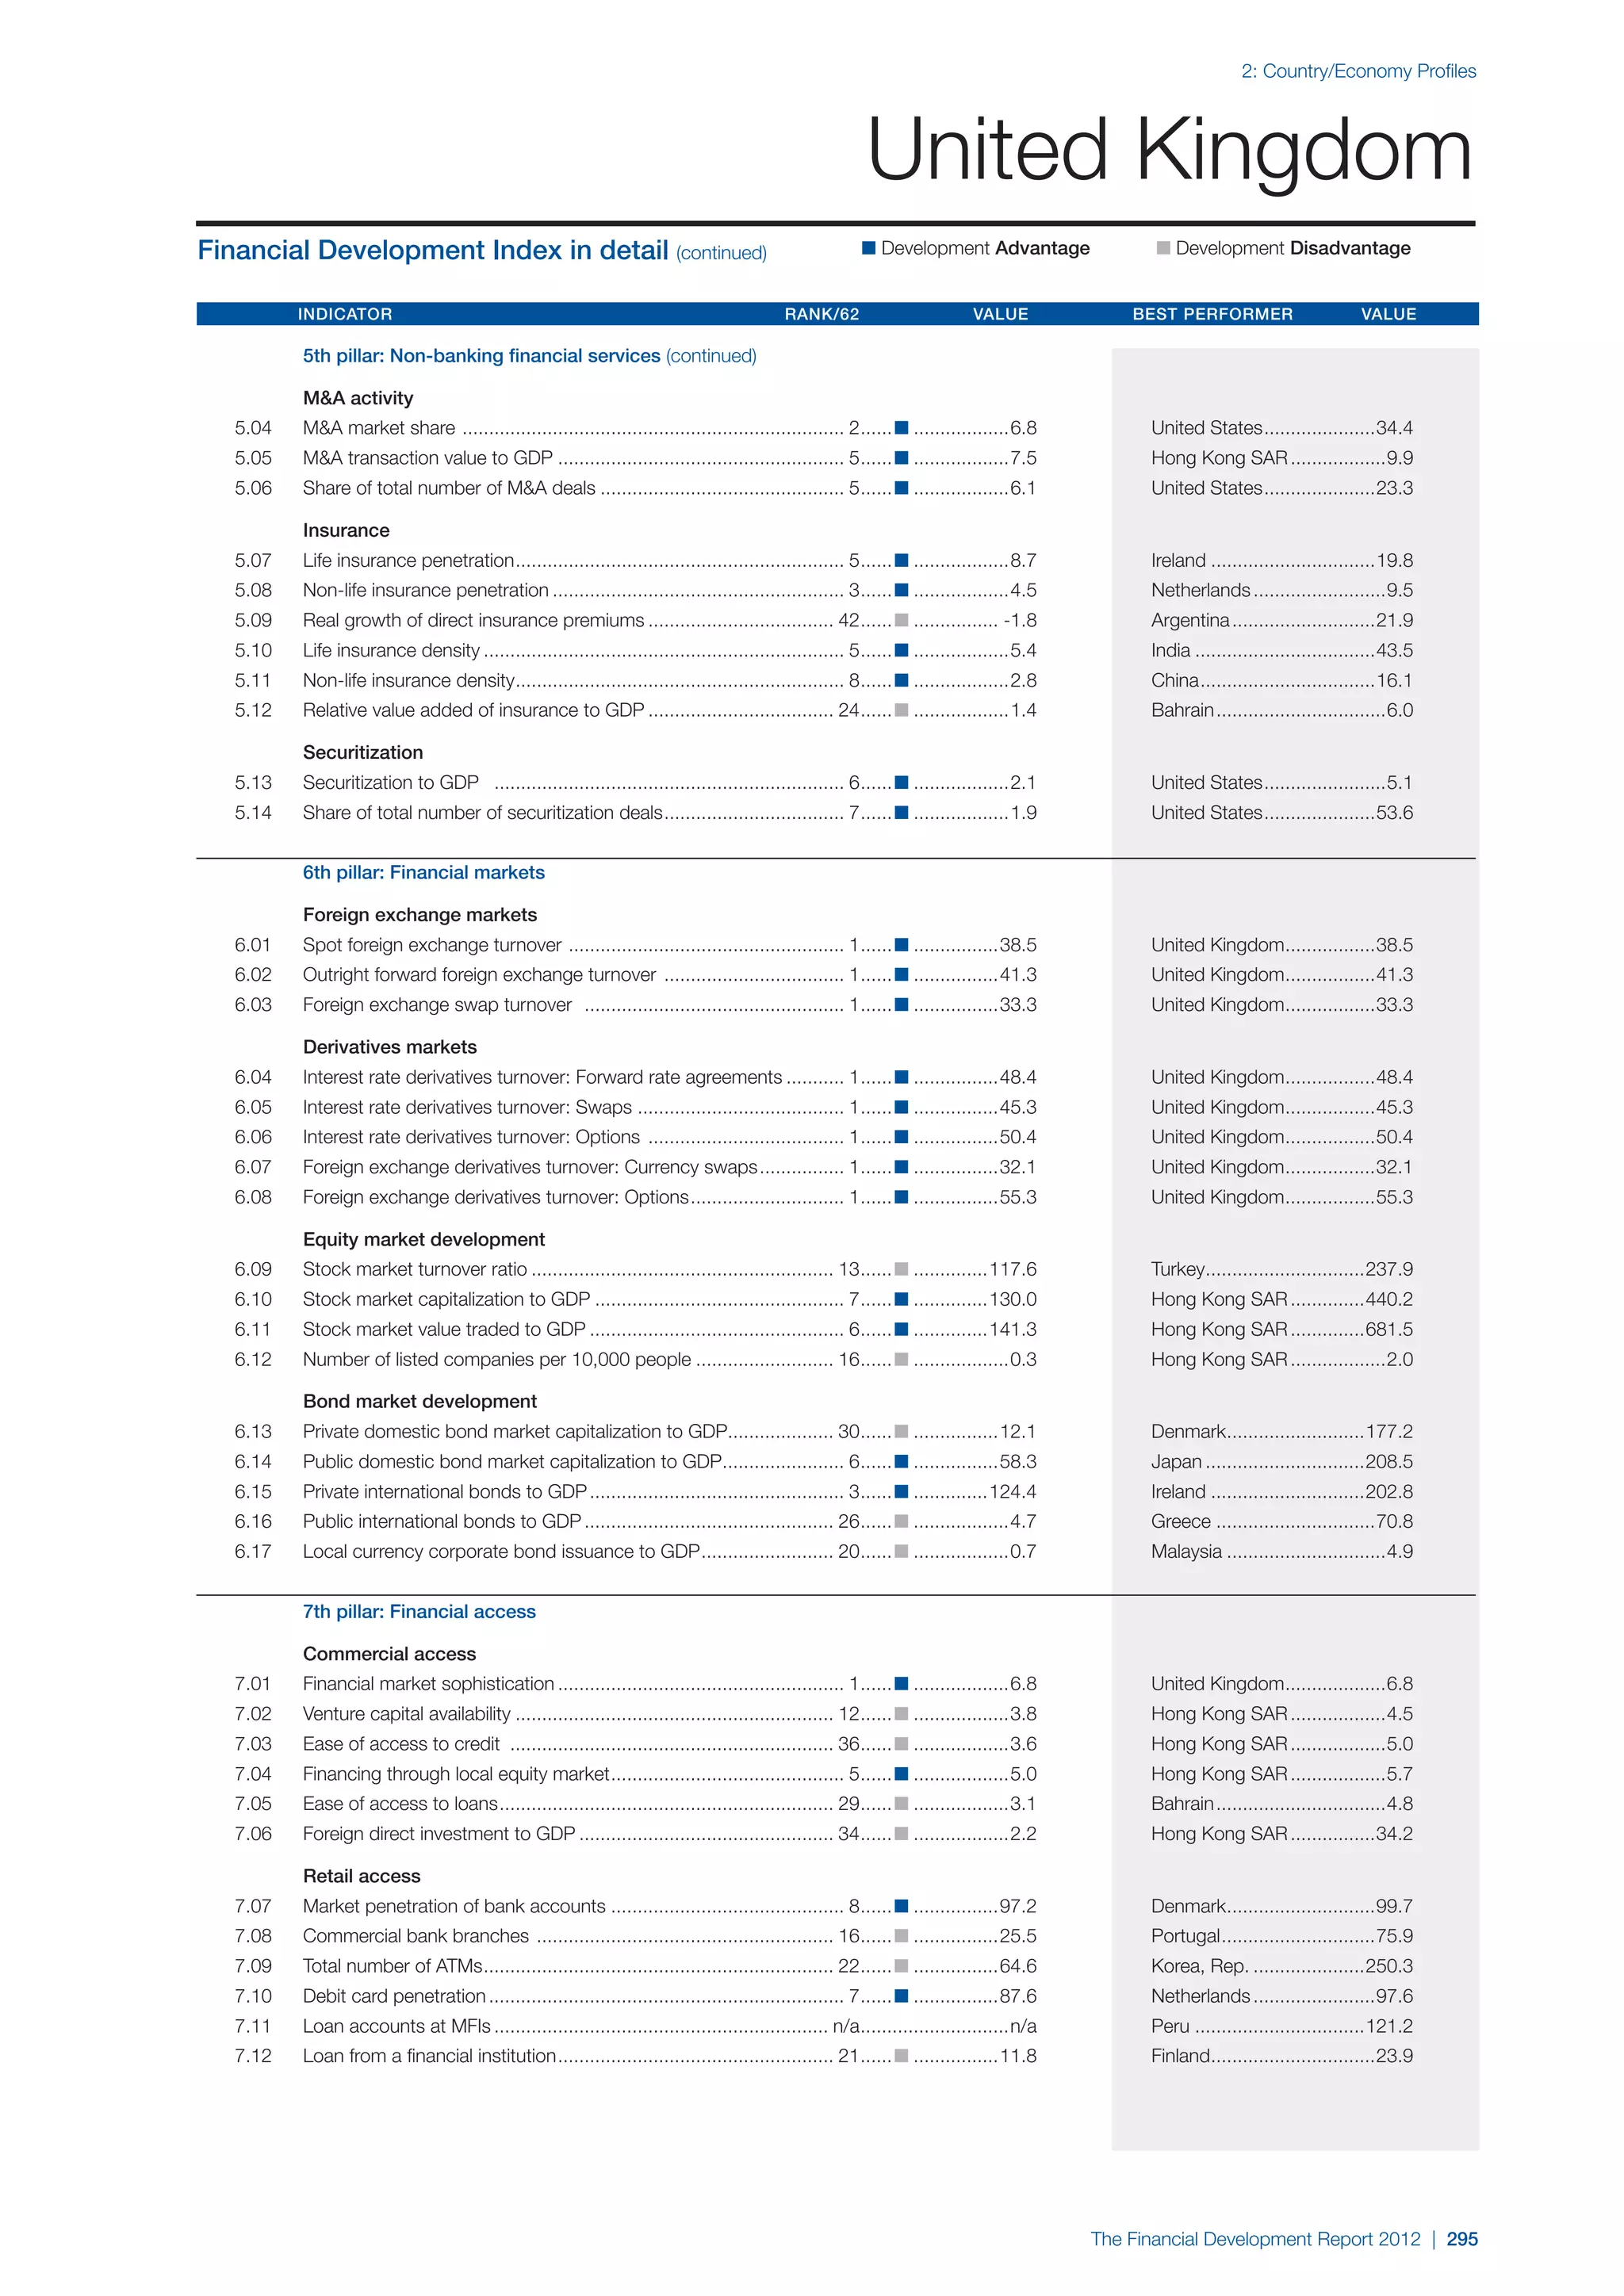
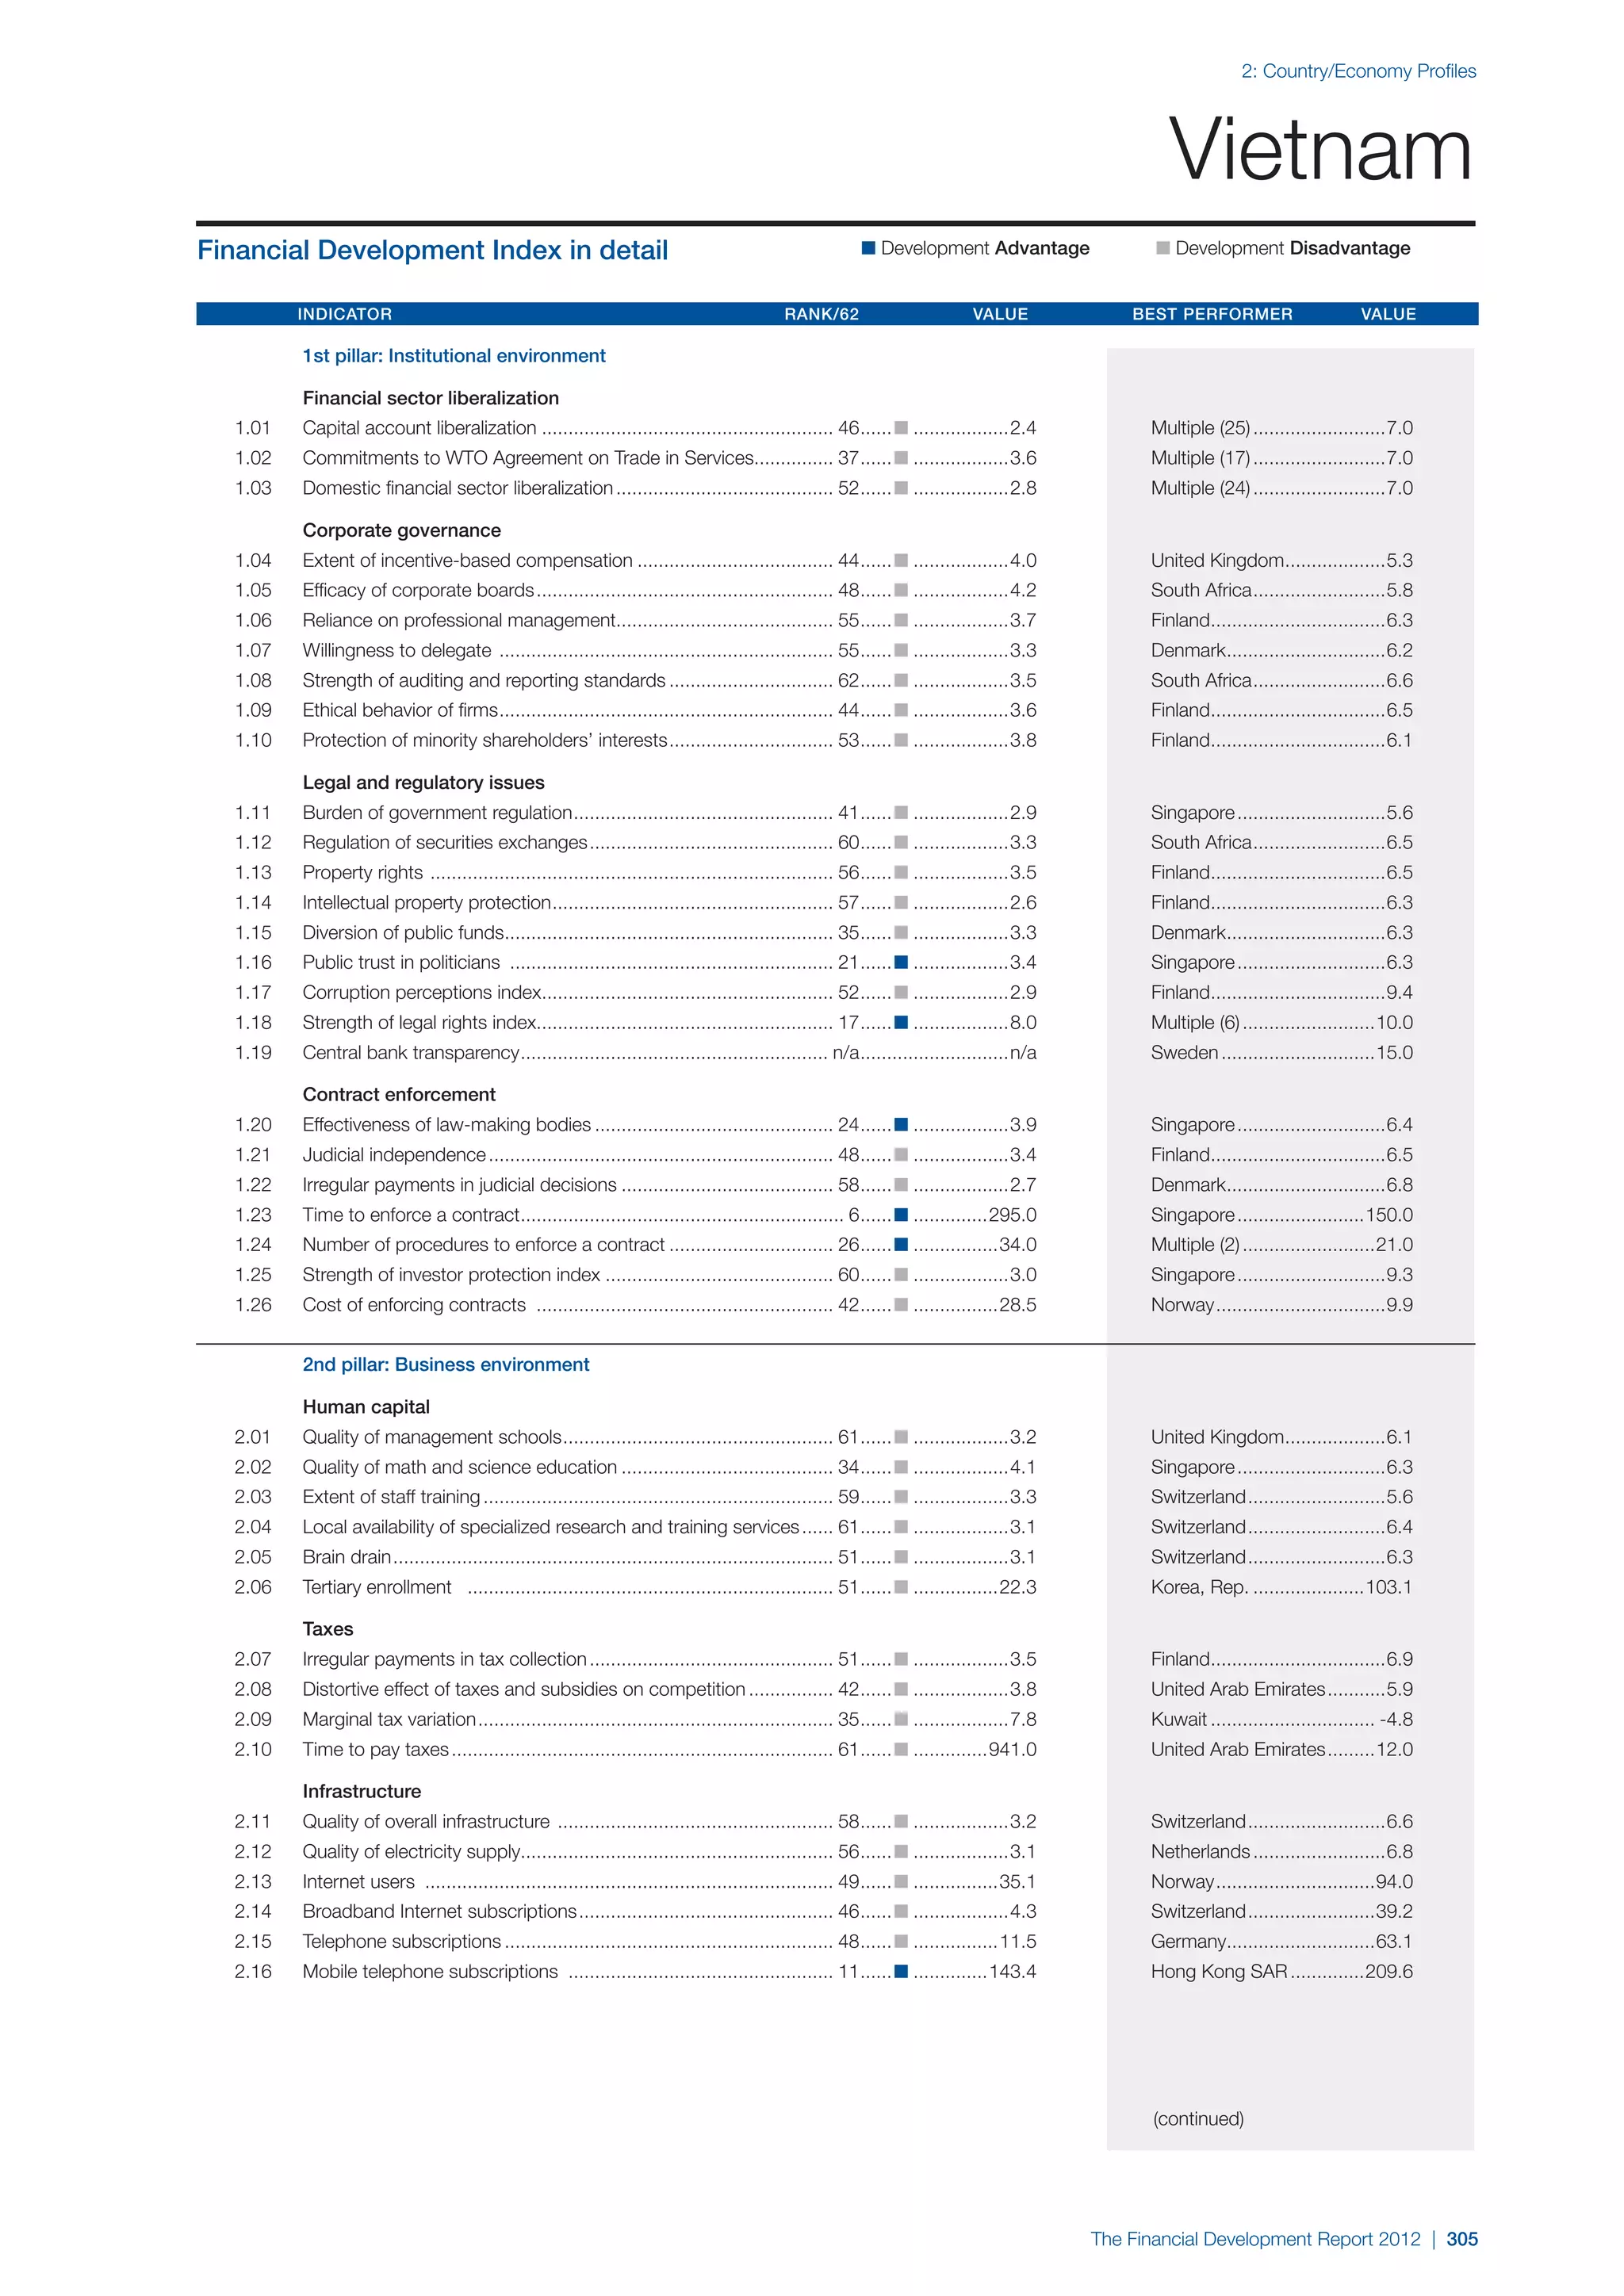
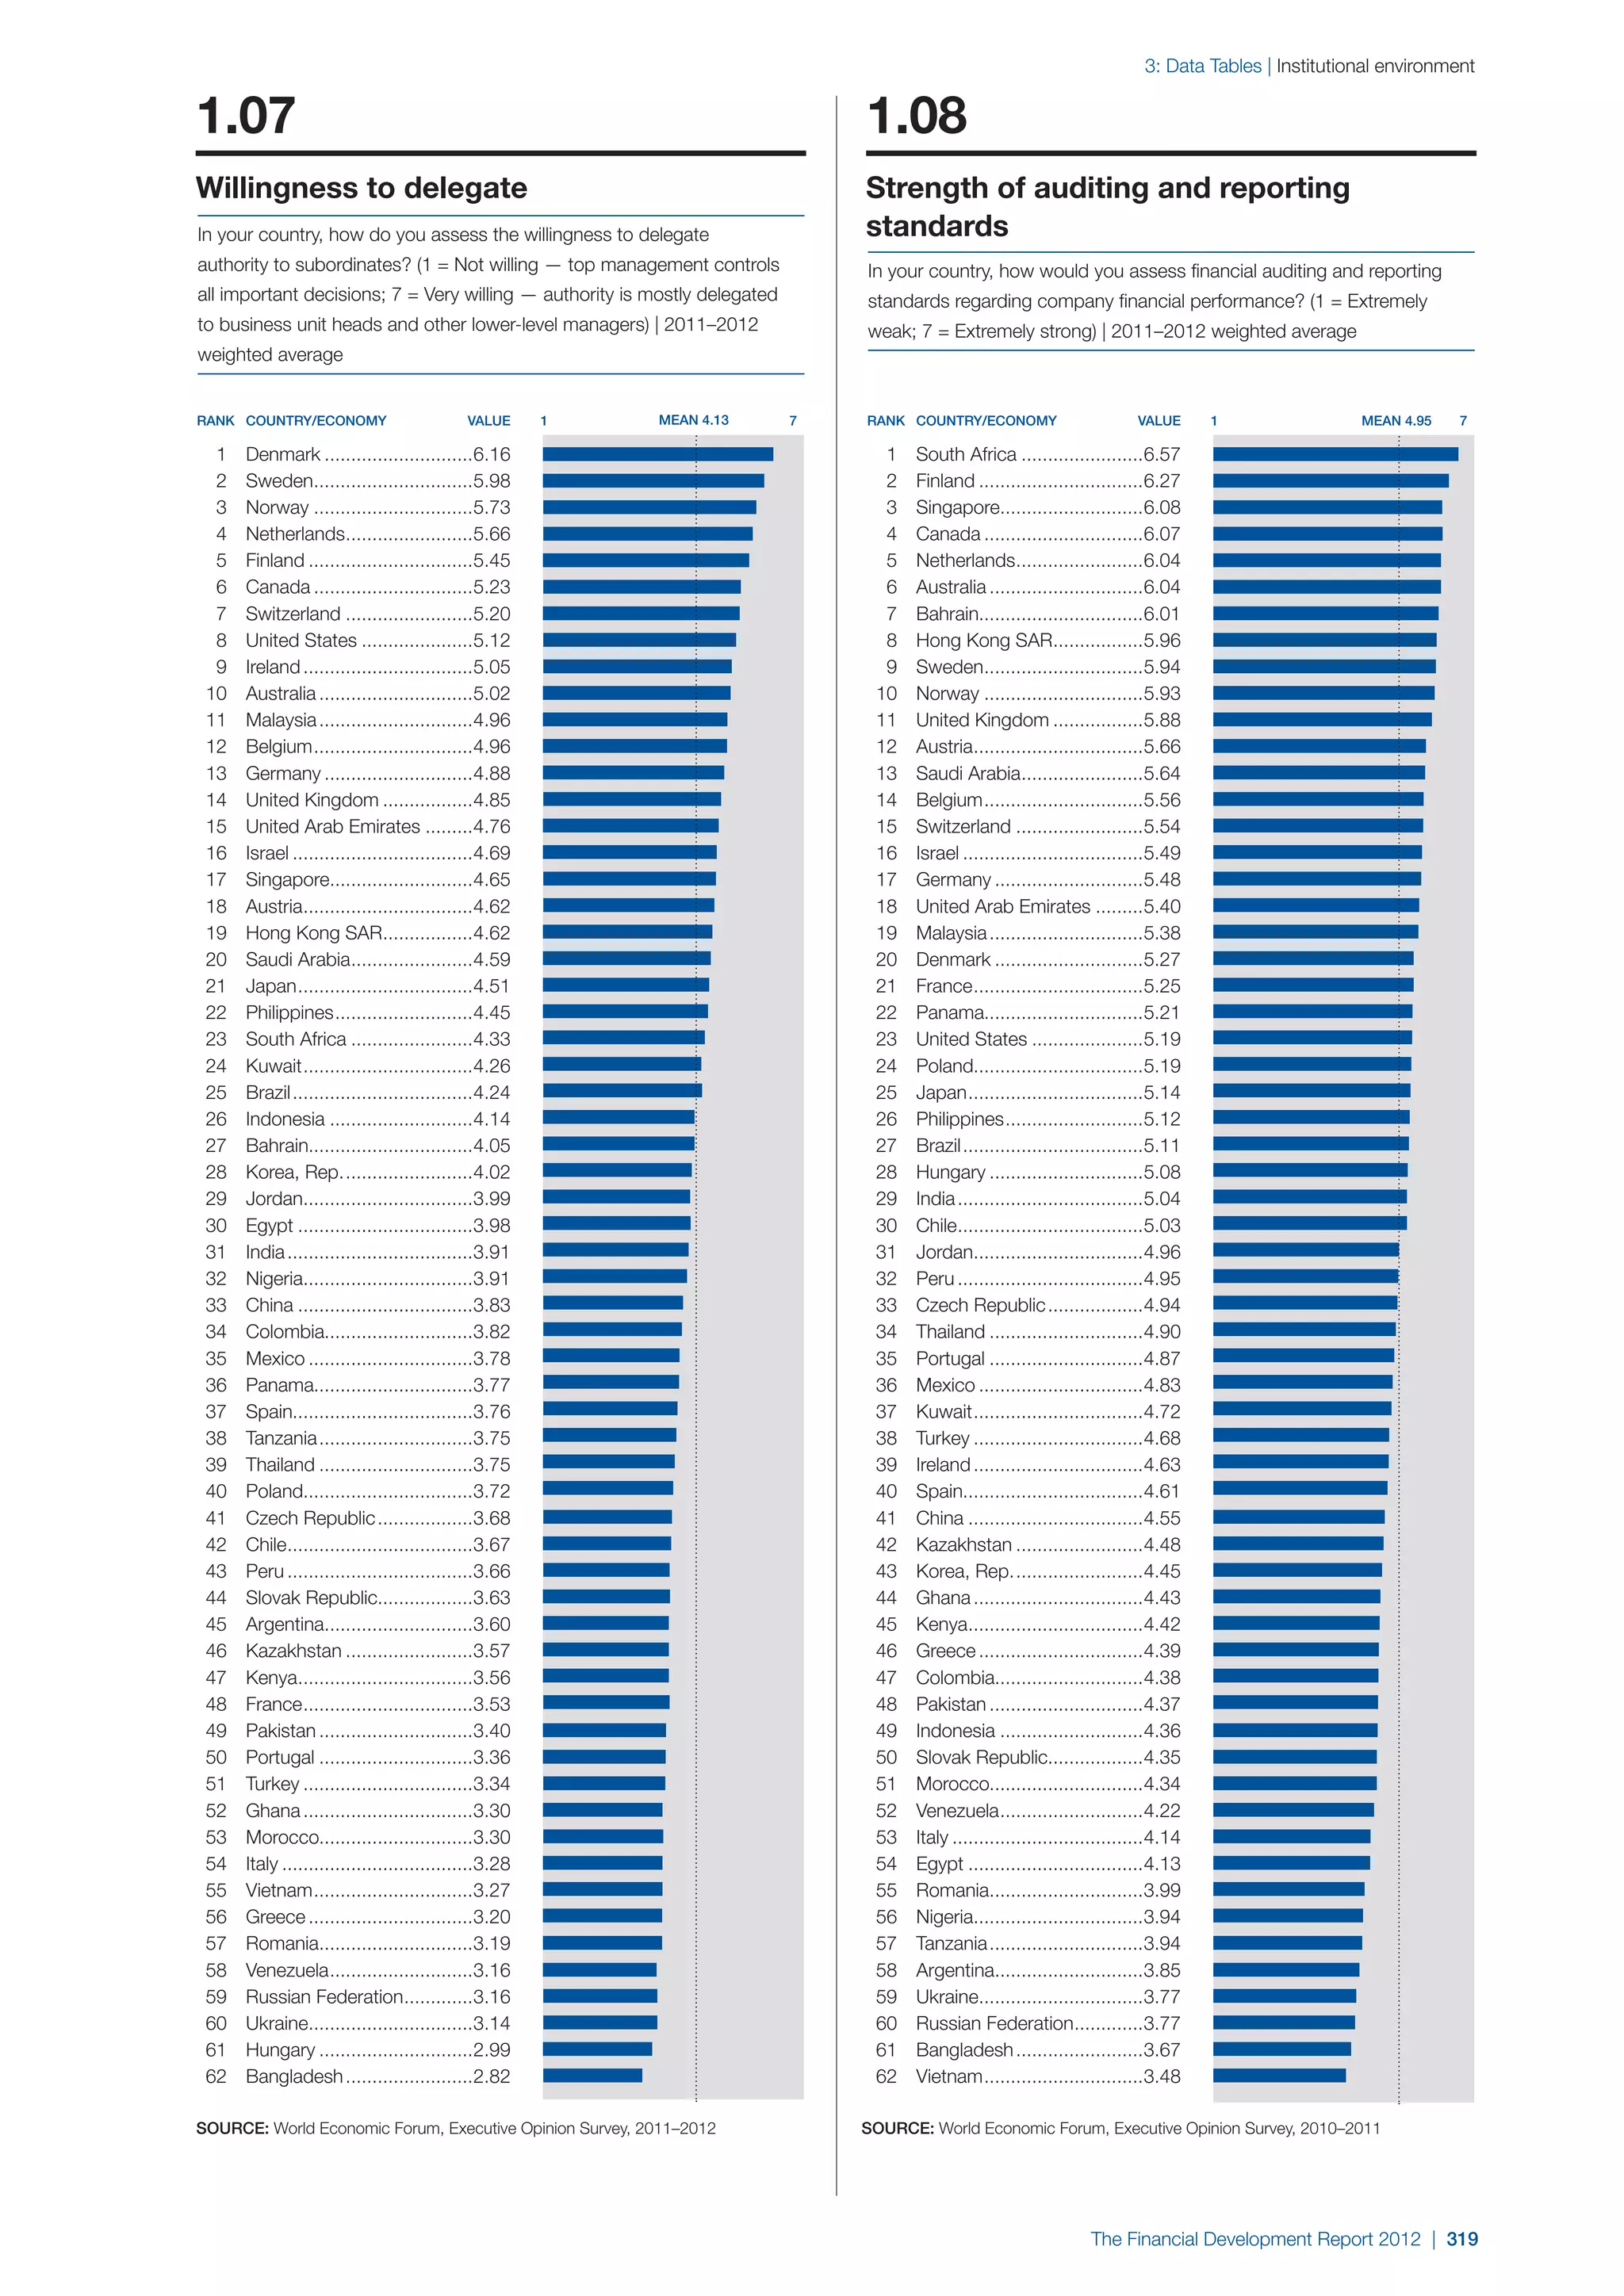
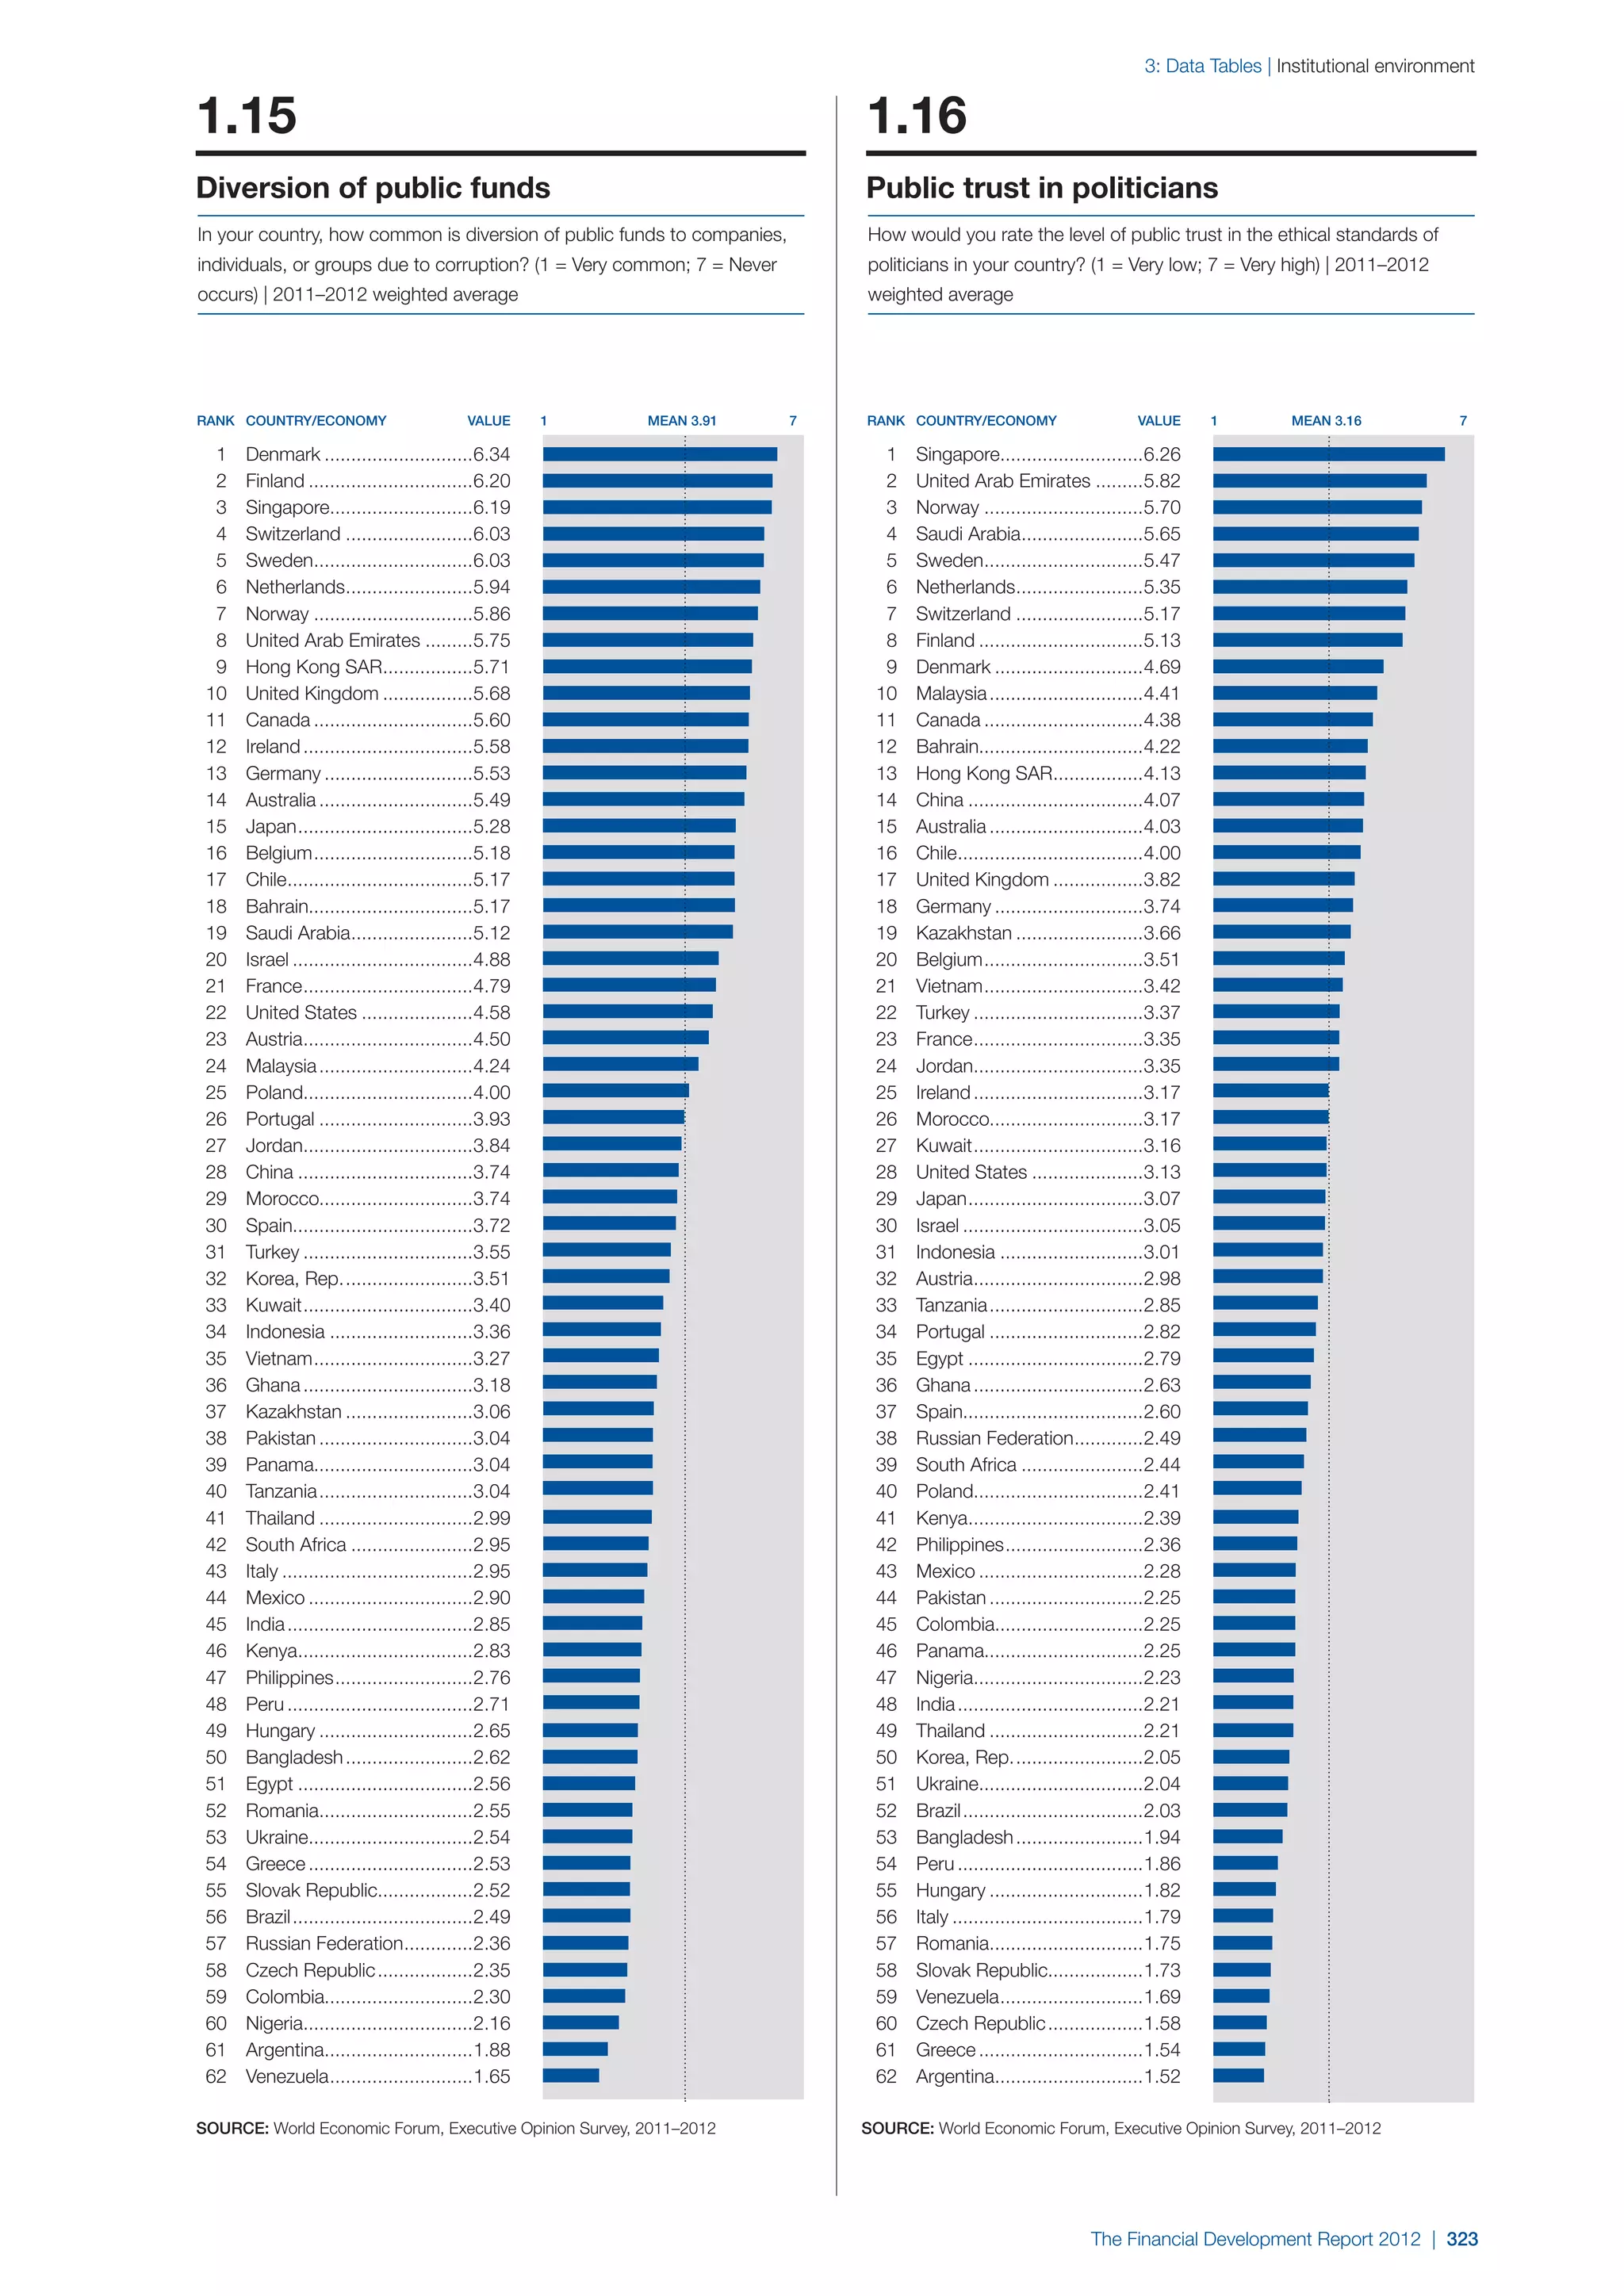
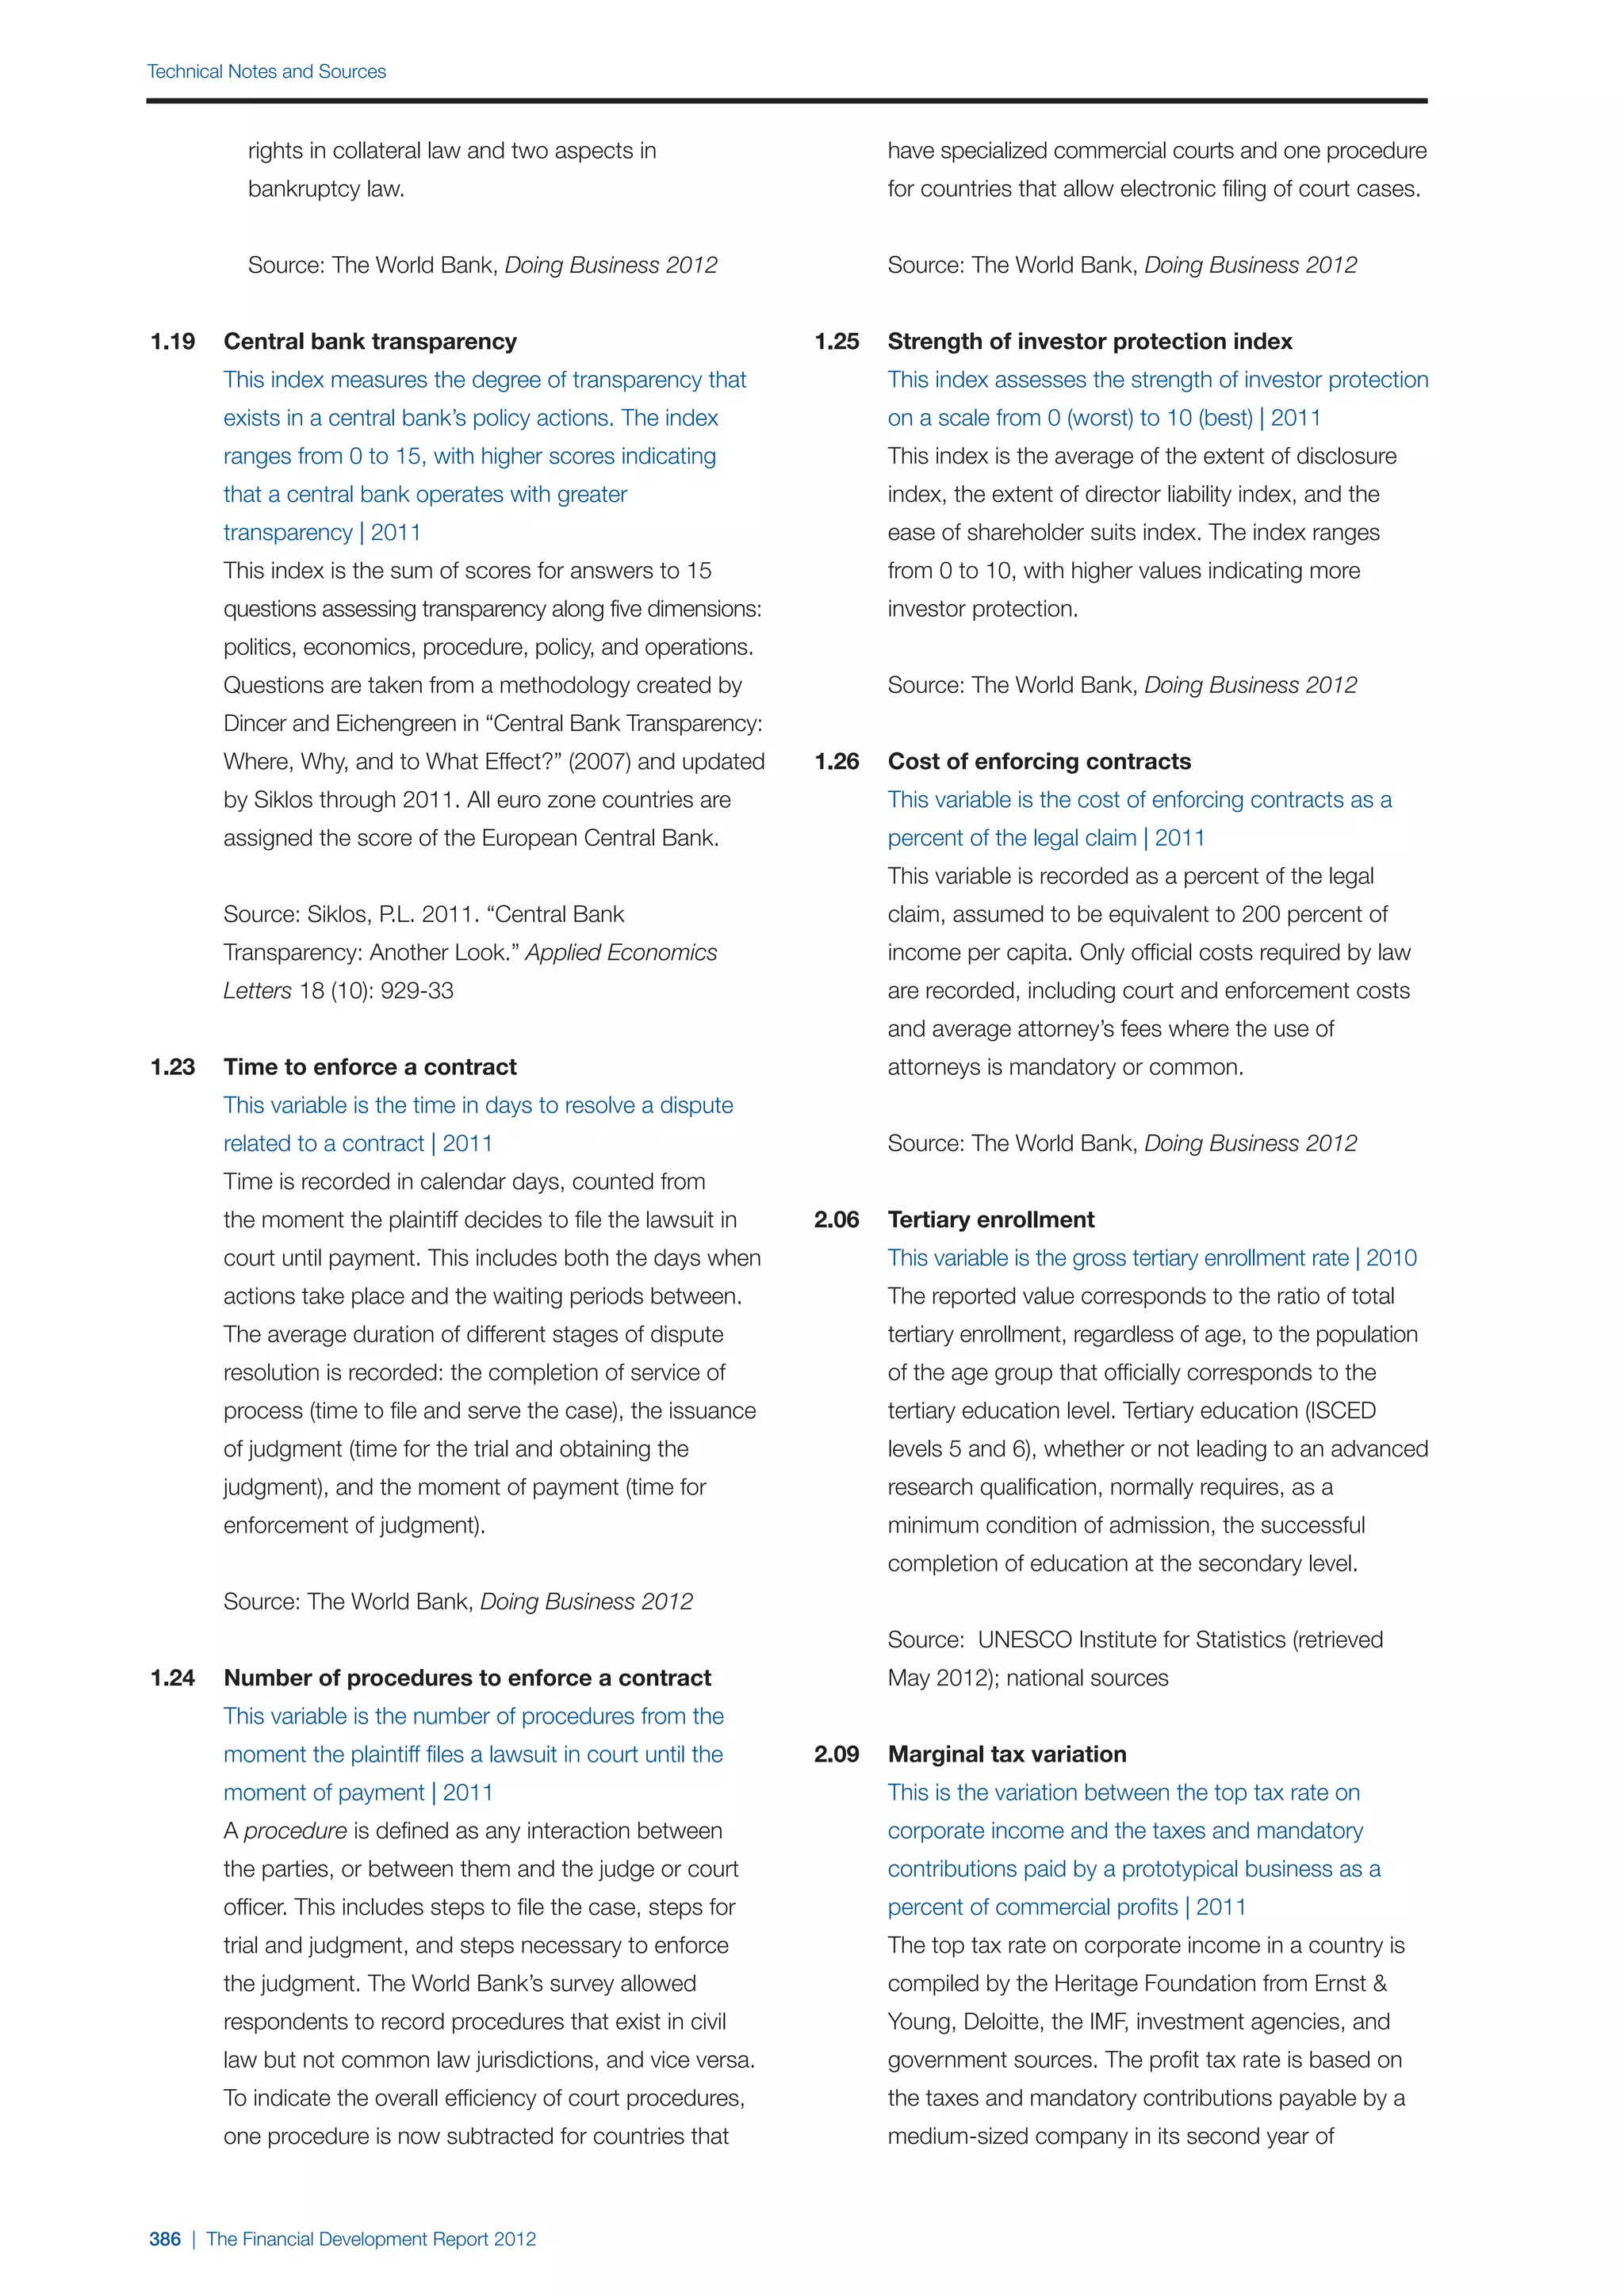
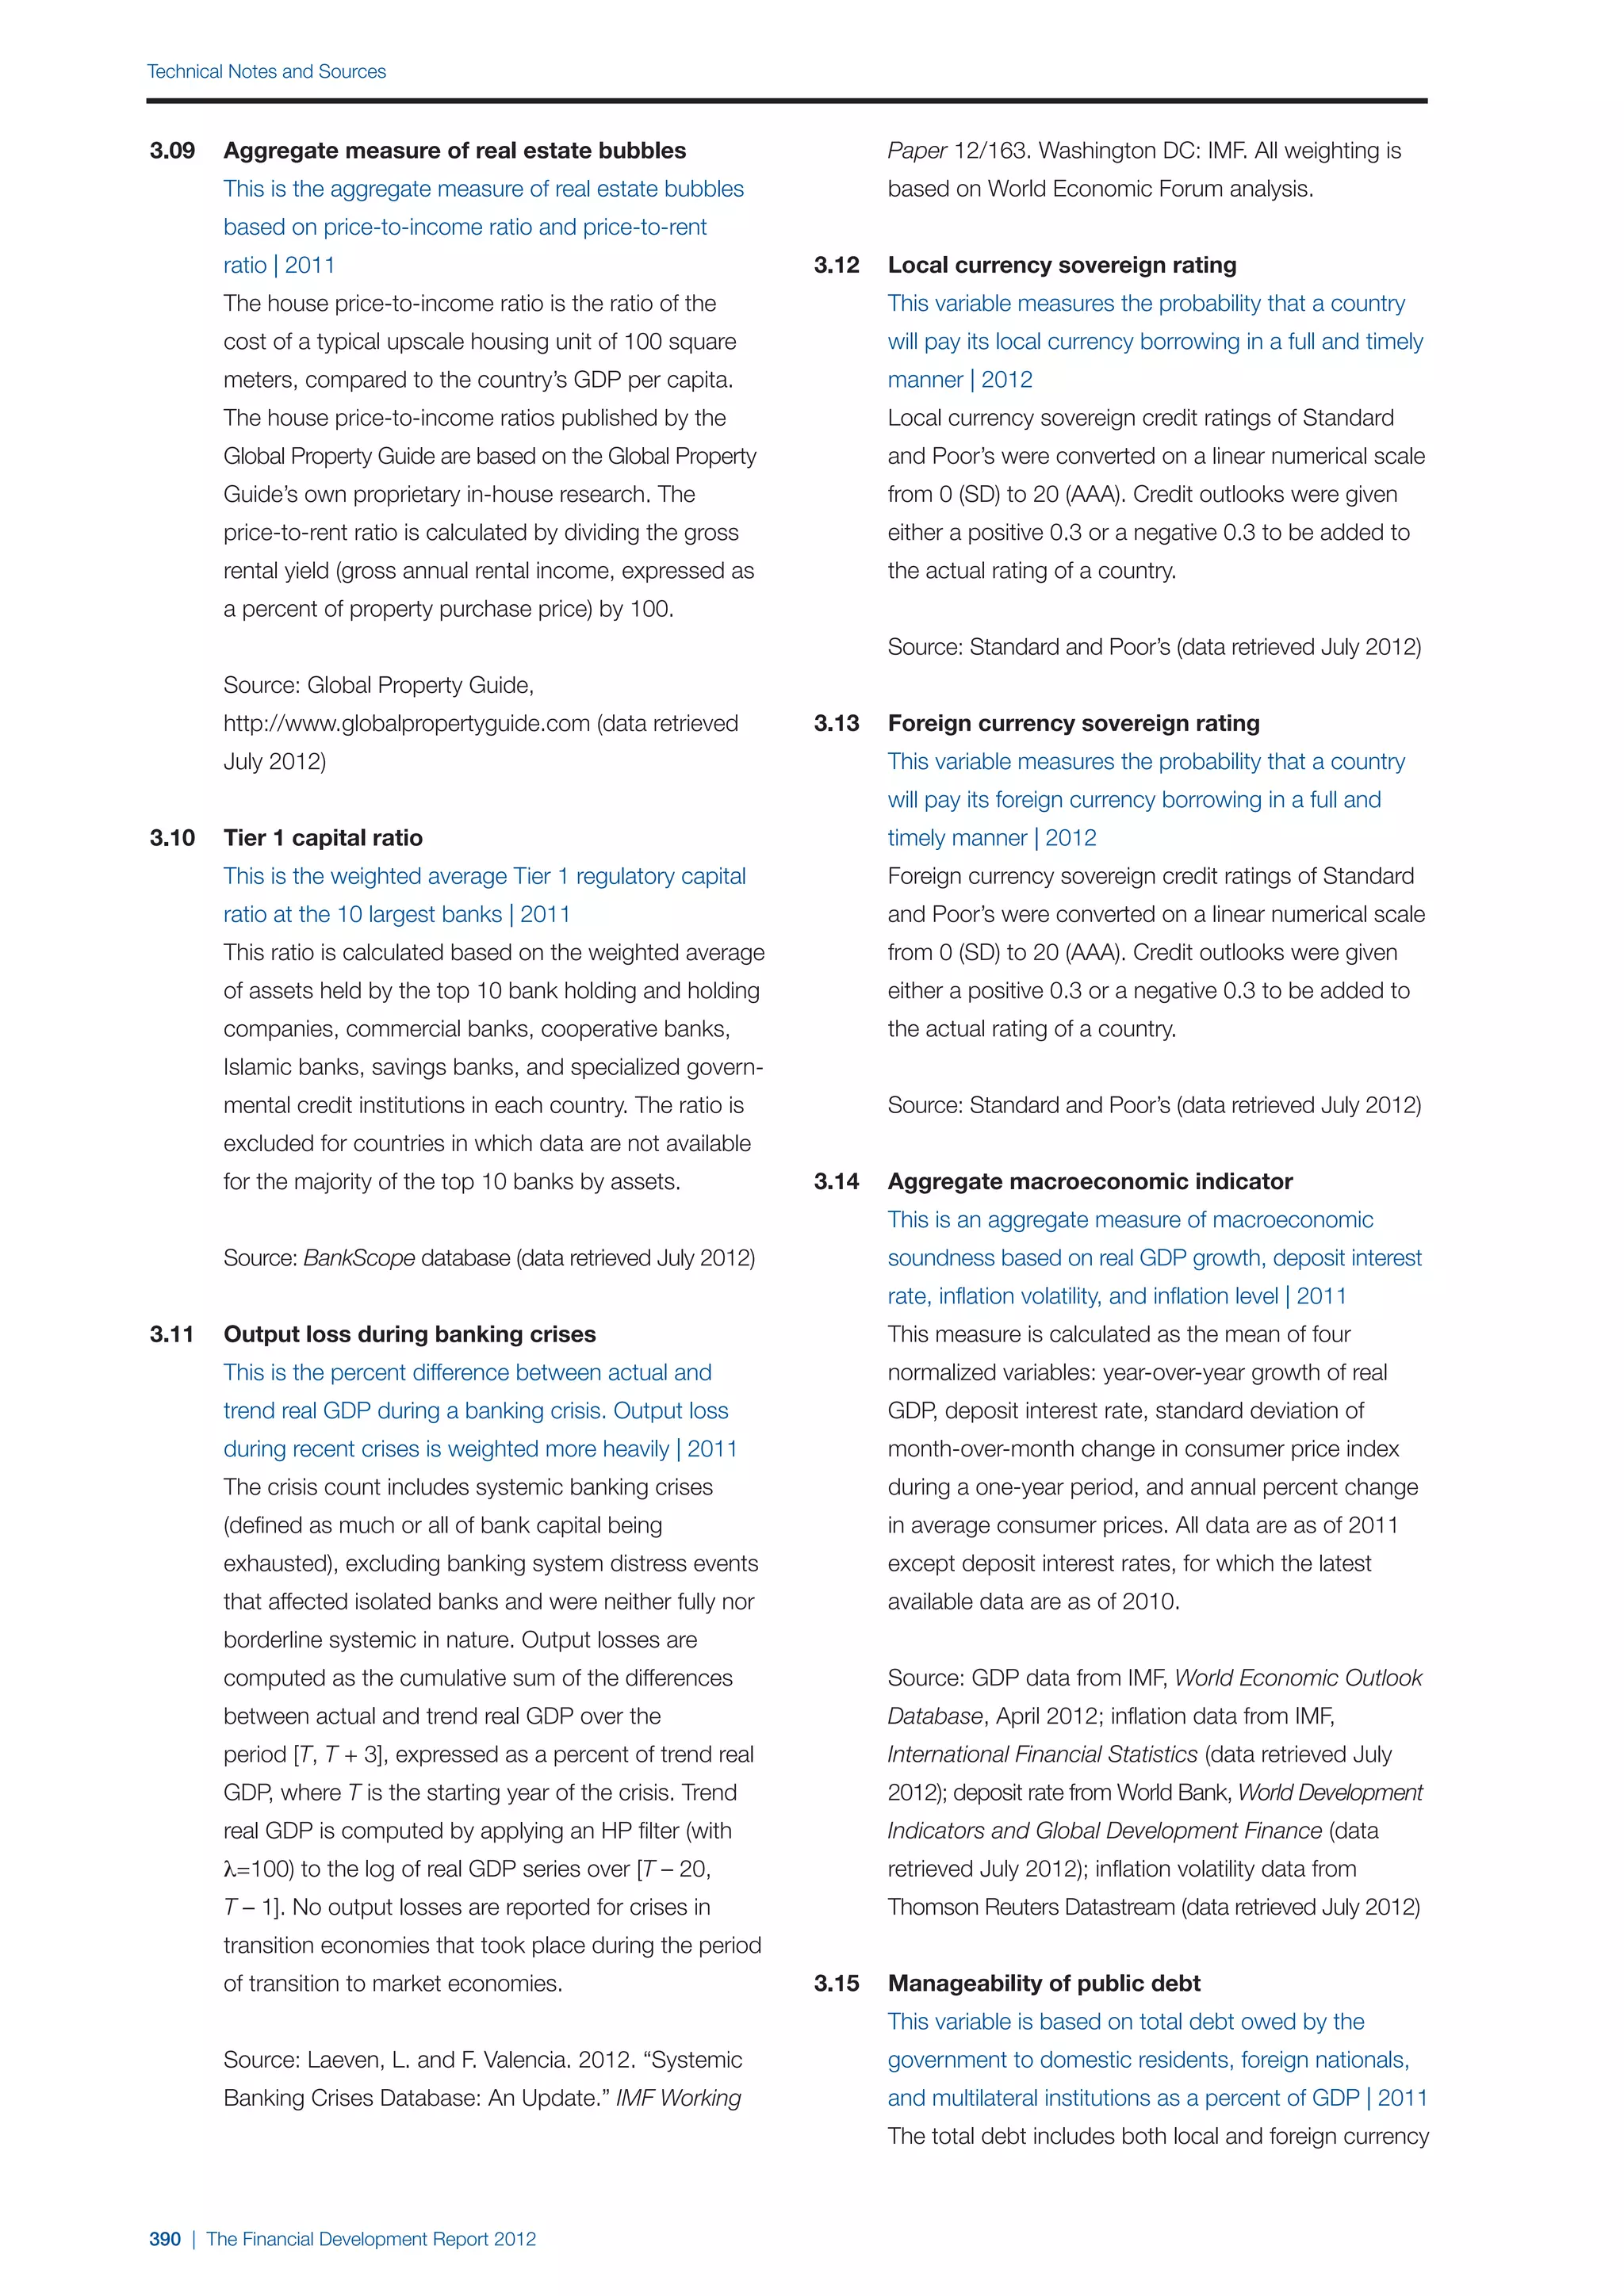
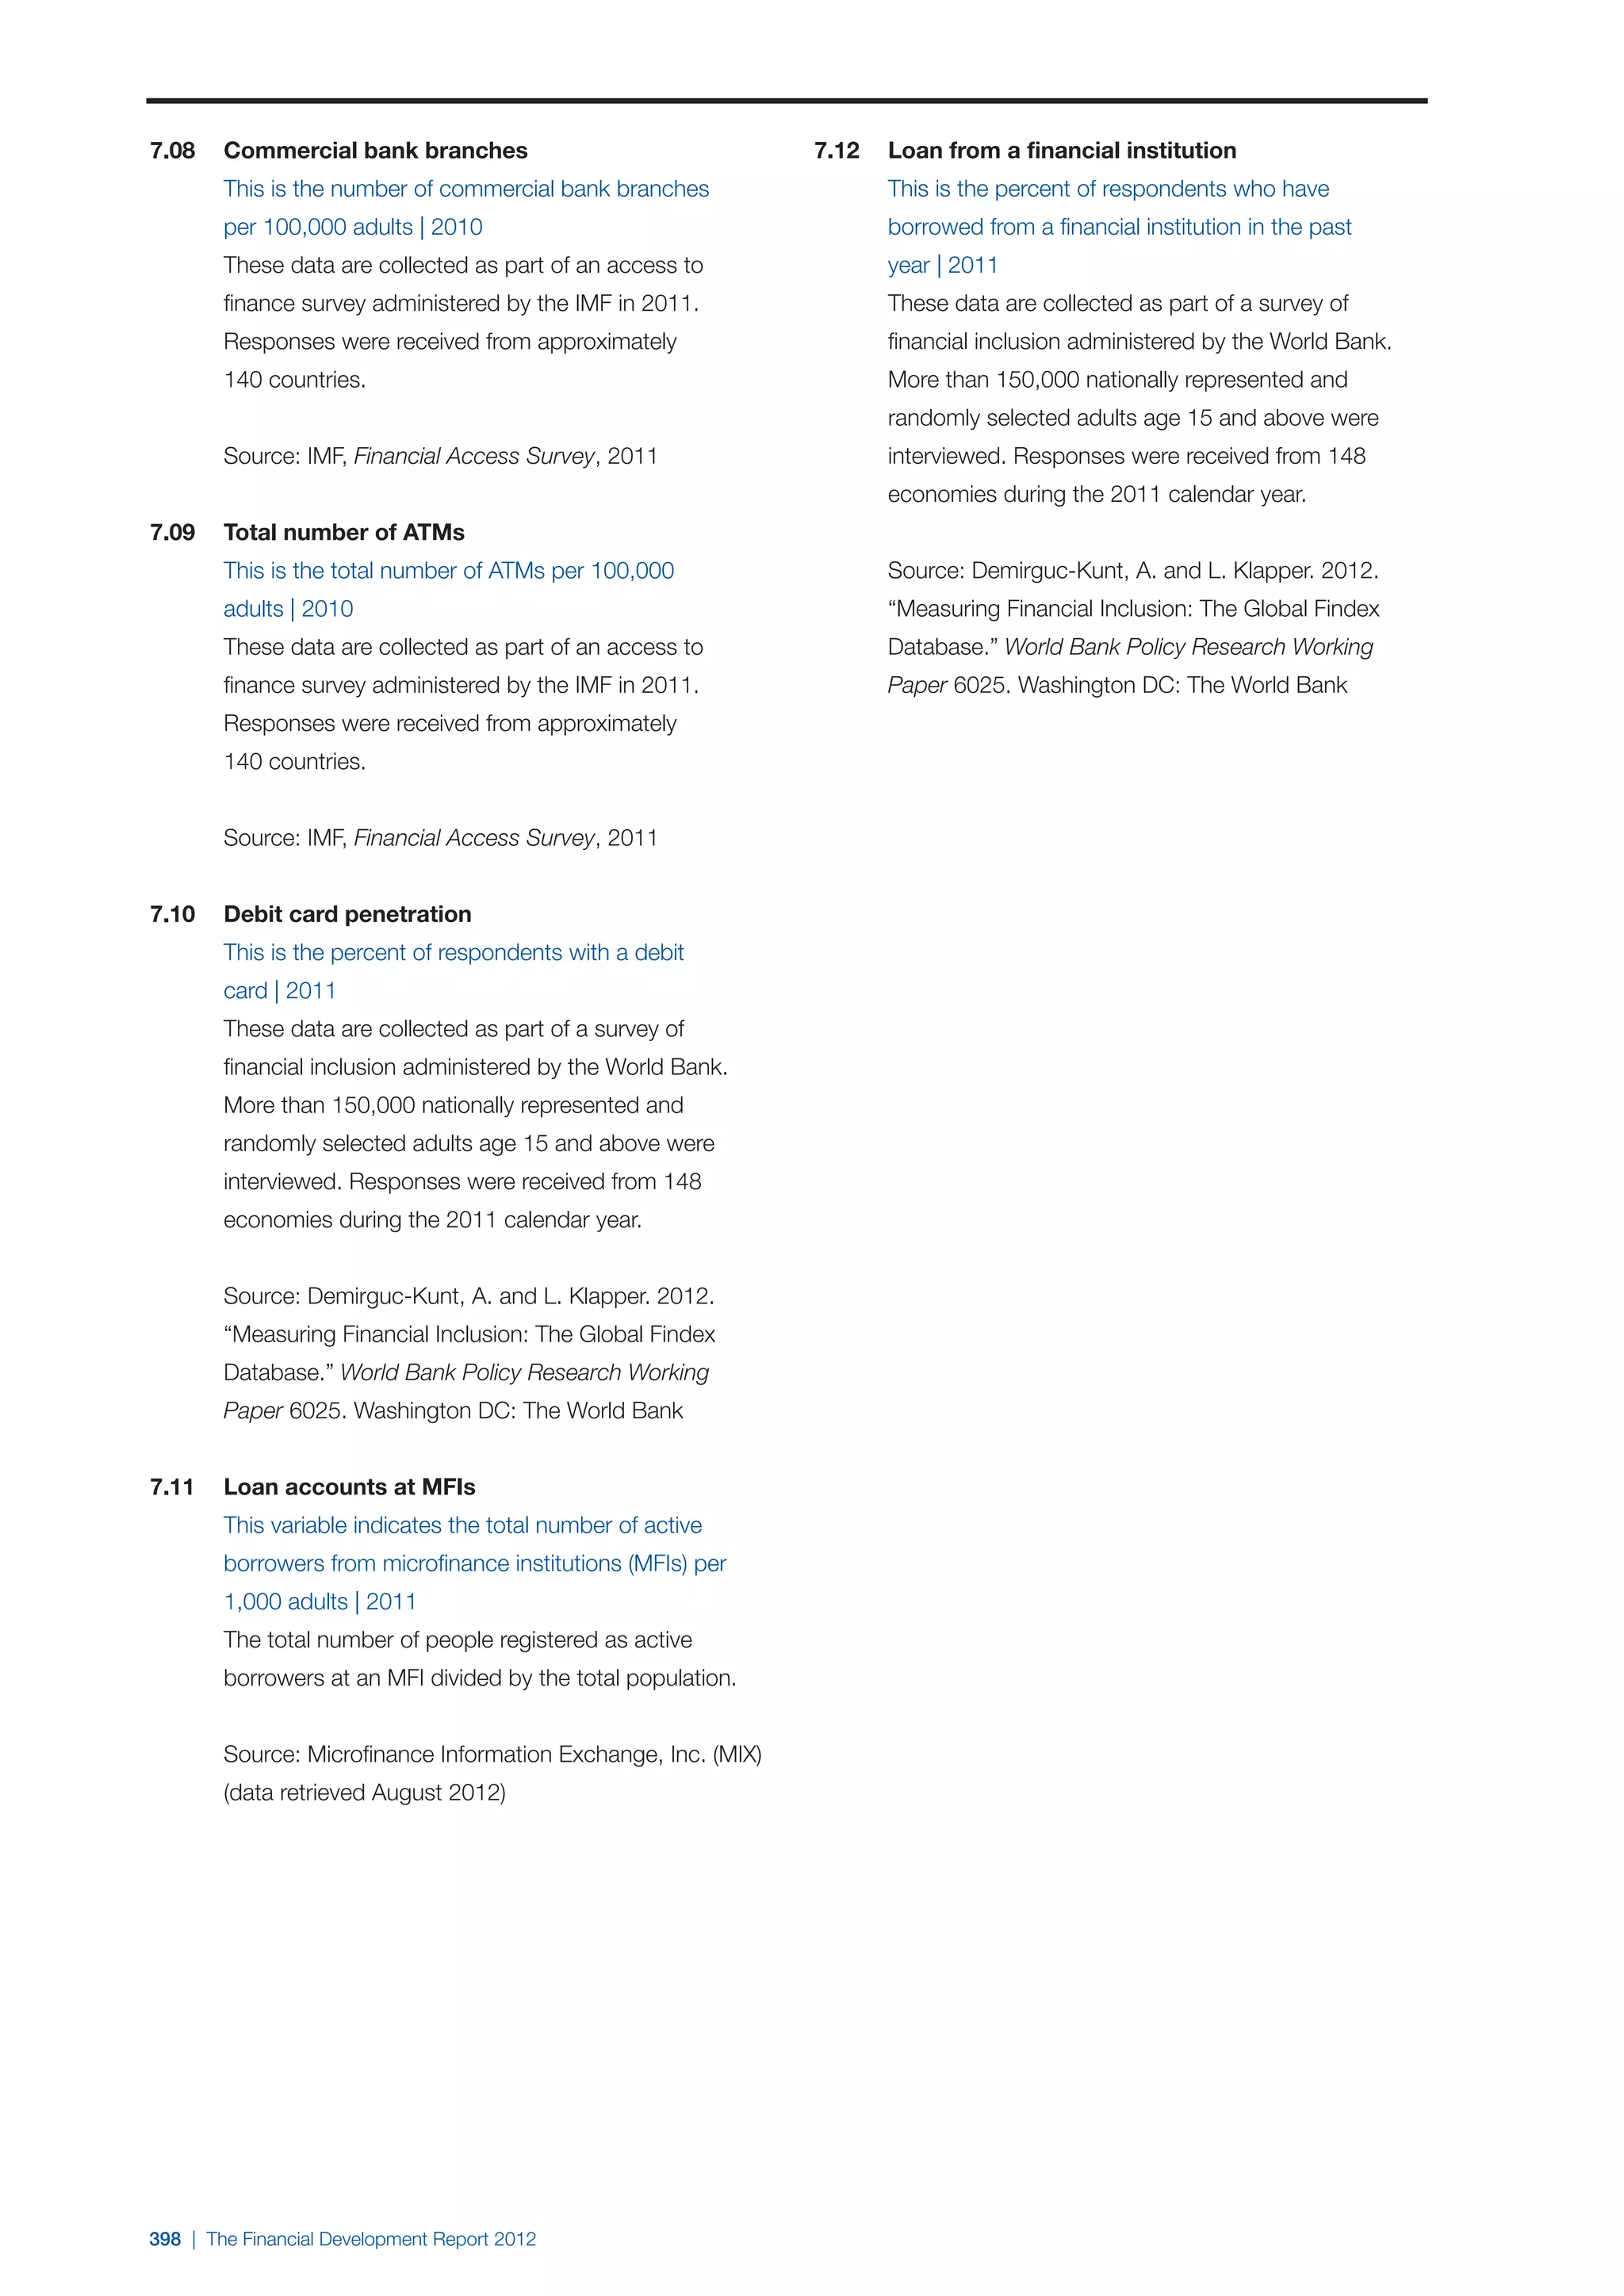
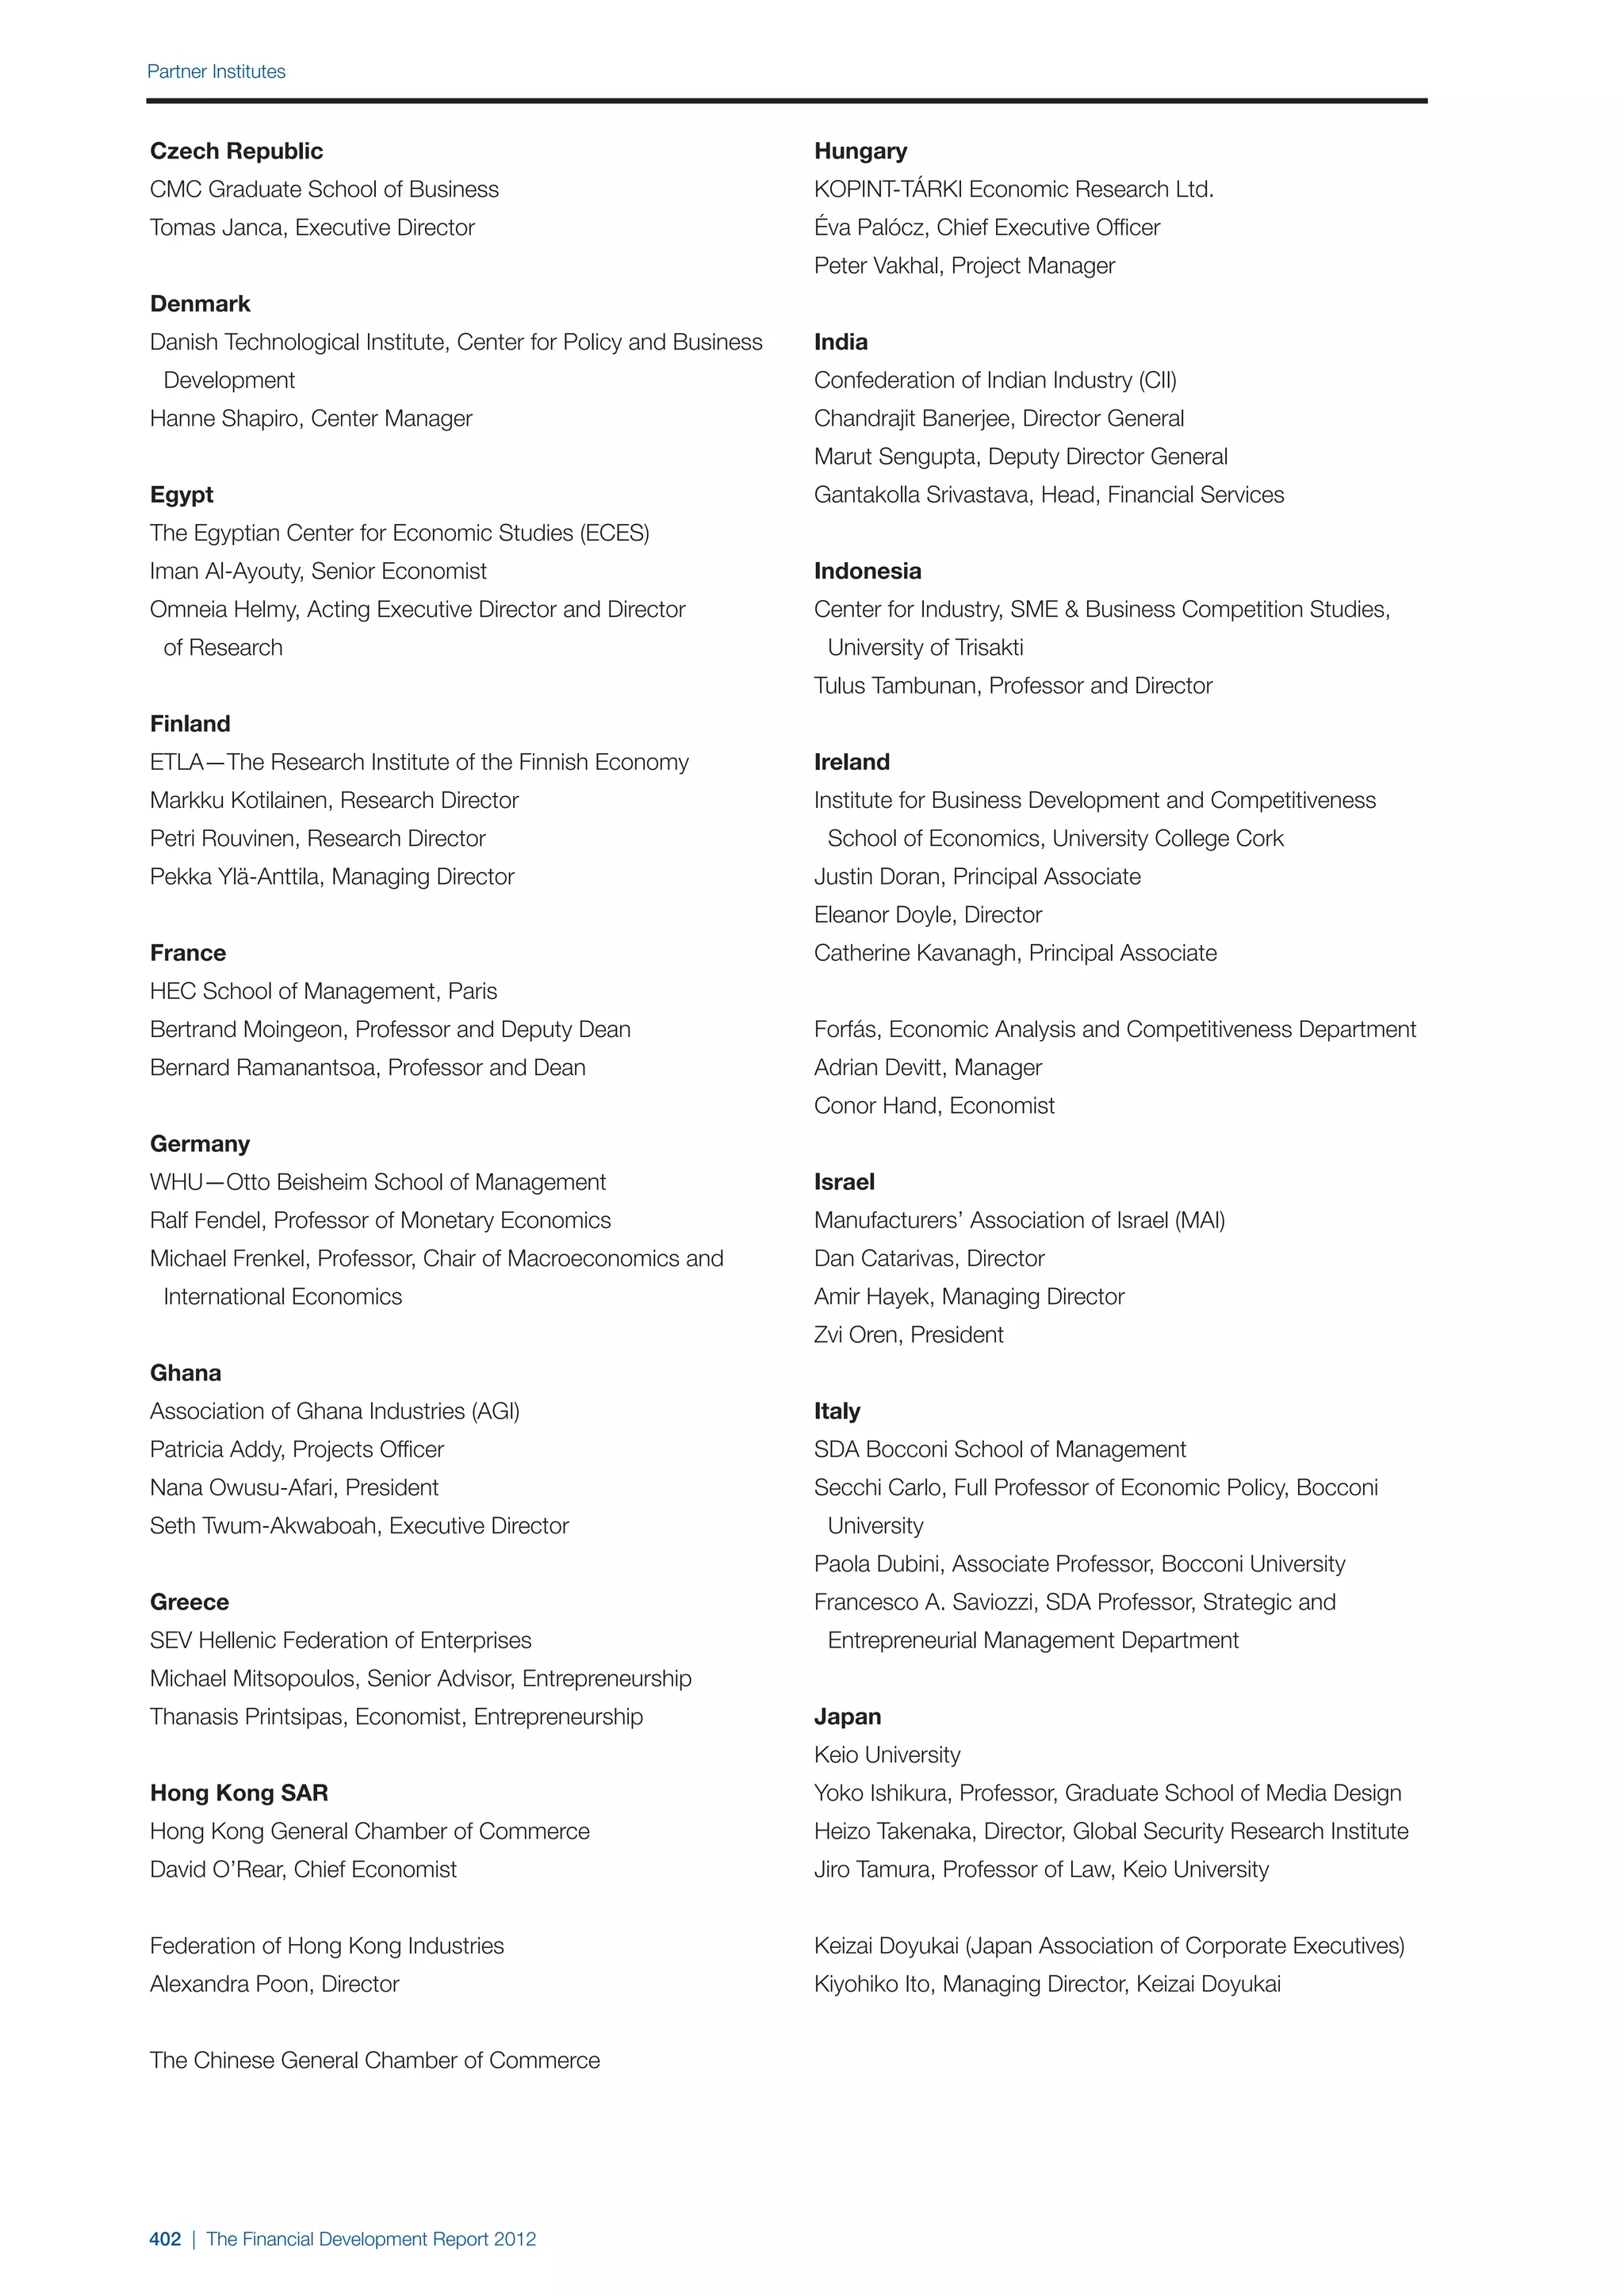
Table 1: Foreign bank penetration, aggregates by income level and region, 2009
Country-based Group-based
Foreign bank Share EM Number of Share EM Total number Total number Foreign bank Share EM Number of Share EM
assets in total foreign bank foreign banks foreign banks of foreign of countries assets in total foreign bank foreign banks foreign banks
bank assets assets in total in total number in total foreign banks bank assets assets in total in total number in total foreign
foreign assets of banks banks foreign assets of banks banks
Income level
Advanced countries 0.23 0.22 0.29 0.17 376 27 0.13 0.05 0.25 0.18
Emerging markets 0.48 0.33 0.47 0.38 958 91 0.14 0.07 0.40 0.30
Middle-income 0.40 0.33 0.44 0.38 698 61 0.11 0.08 0.36 0.29
Low-income 0.65 0.52 0.52 0.48 131 21 0.35 0.45 0.47 0.53
Region (emerging markets only)
East Asia and Pacific 0.19 0.42 0.26 0.46 95 9 0.04 0.11 0.25 0.32
Europe and Central Asia 0.62 0.15 0.59 0.30 371 25 0.39 0.04 0.47 0.21
Latin America and Caribbean 0.42 0.37 0.44 0.32 232 19 0.30 0.04 0.39 0.25
Middle East and North Africa 0.26 0.24 0.27 0.42 57 6 0.16 0.14 0.36 0.46
South Asia 0.18 0.30 0.14 0.24 22 4 0.08 0.04 0.14 0.23
Sub-Saharan Africa 0.63 0.53 0.58 0.47 181 28 0.27 0.17 0.54 0.49
All countries 0.41 0.31 0.43 0.33 1,334 118 0.13 0.05 0.34 0.27
Source: Claessens and Van Horen, 2012.
Notes: Figures reported are ratios of number of foreign banks to total number of banks (in 2009) and foreign bank assets to total bank assets (average over 2007-2009) in each country, and the ratios of the number of
emerging market foreign banks in total number of foreign banks and emerging market foreign bank assets to total foreign bank assets in each country. Income and region classifications follow World Bank definitions as of
2009. Country-based figures are the simple average of the countries within a group ((1/n)Σi[FBi/(DBi+FBi)] for country i), whereas group-based figures are obtained from ΣiFBi/(ΣiDBi+ΣiFBi) for country i within a group. FB
and DB represent foreign bank and domestic bank respectively.
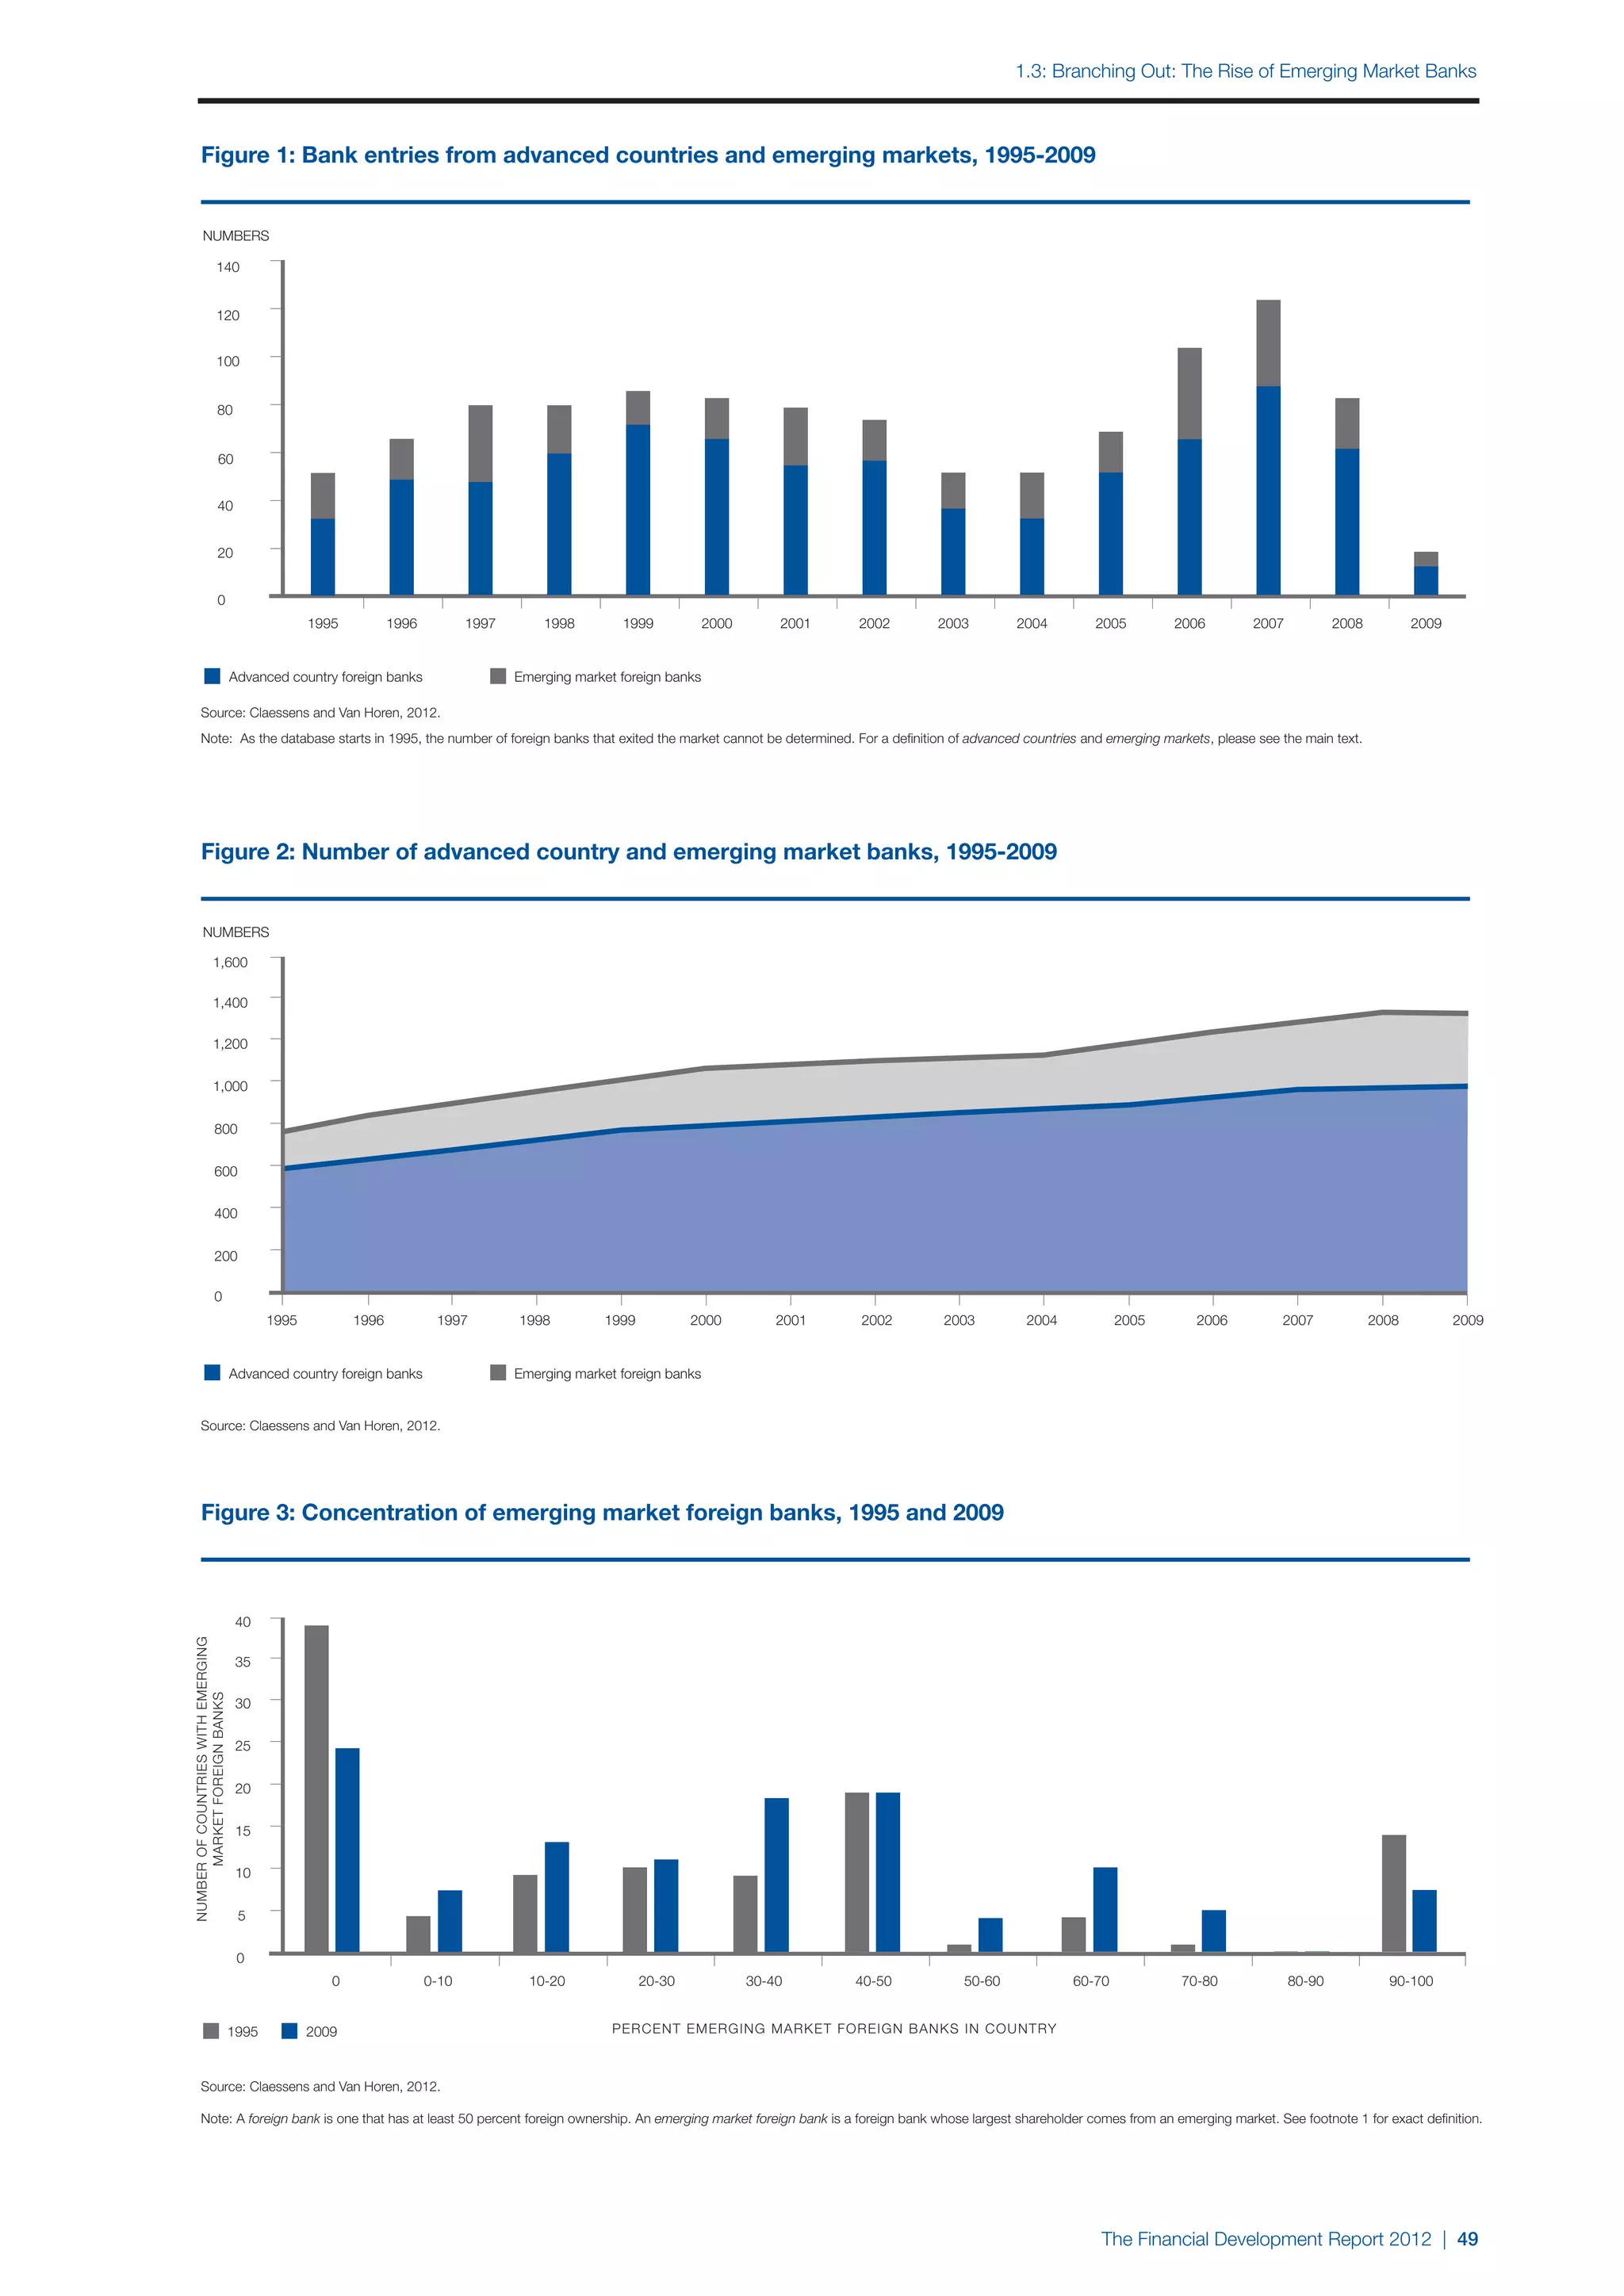
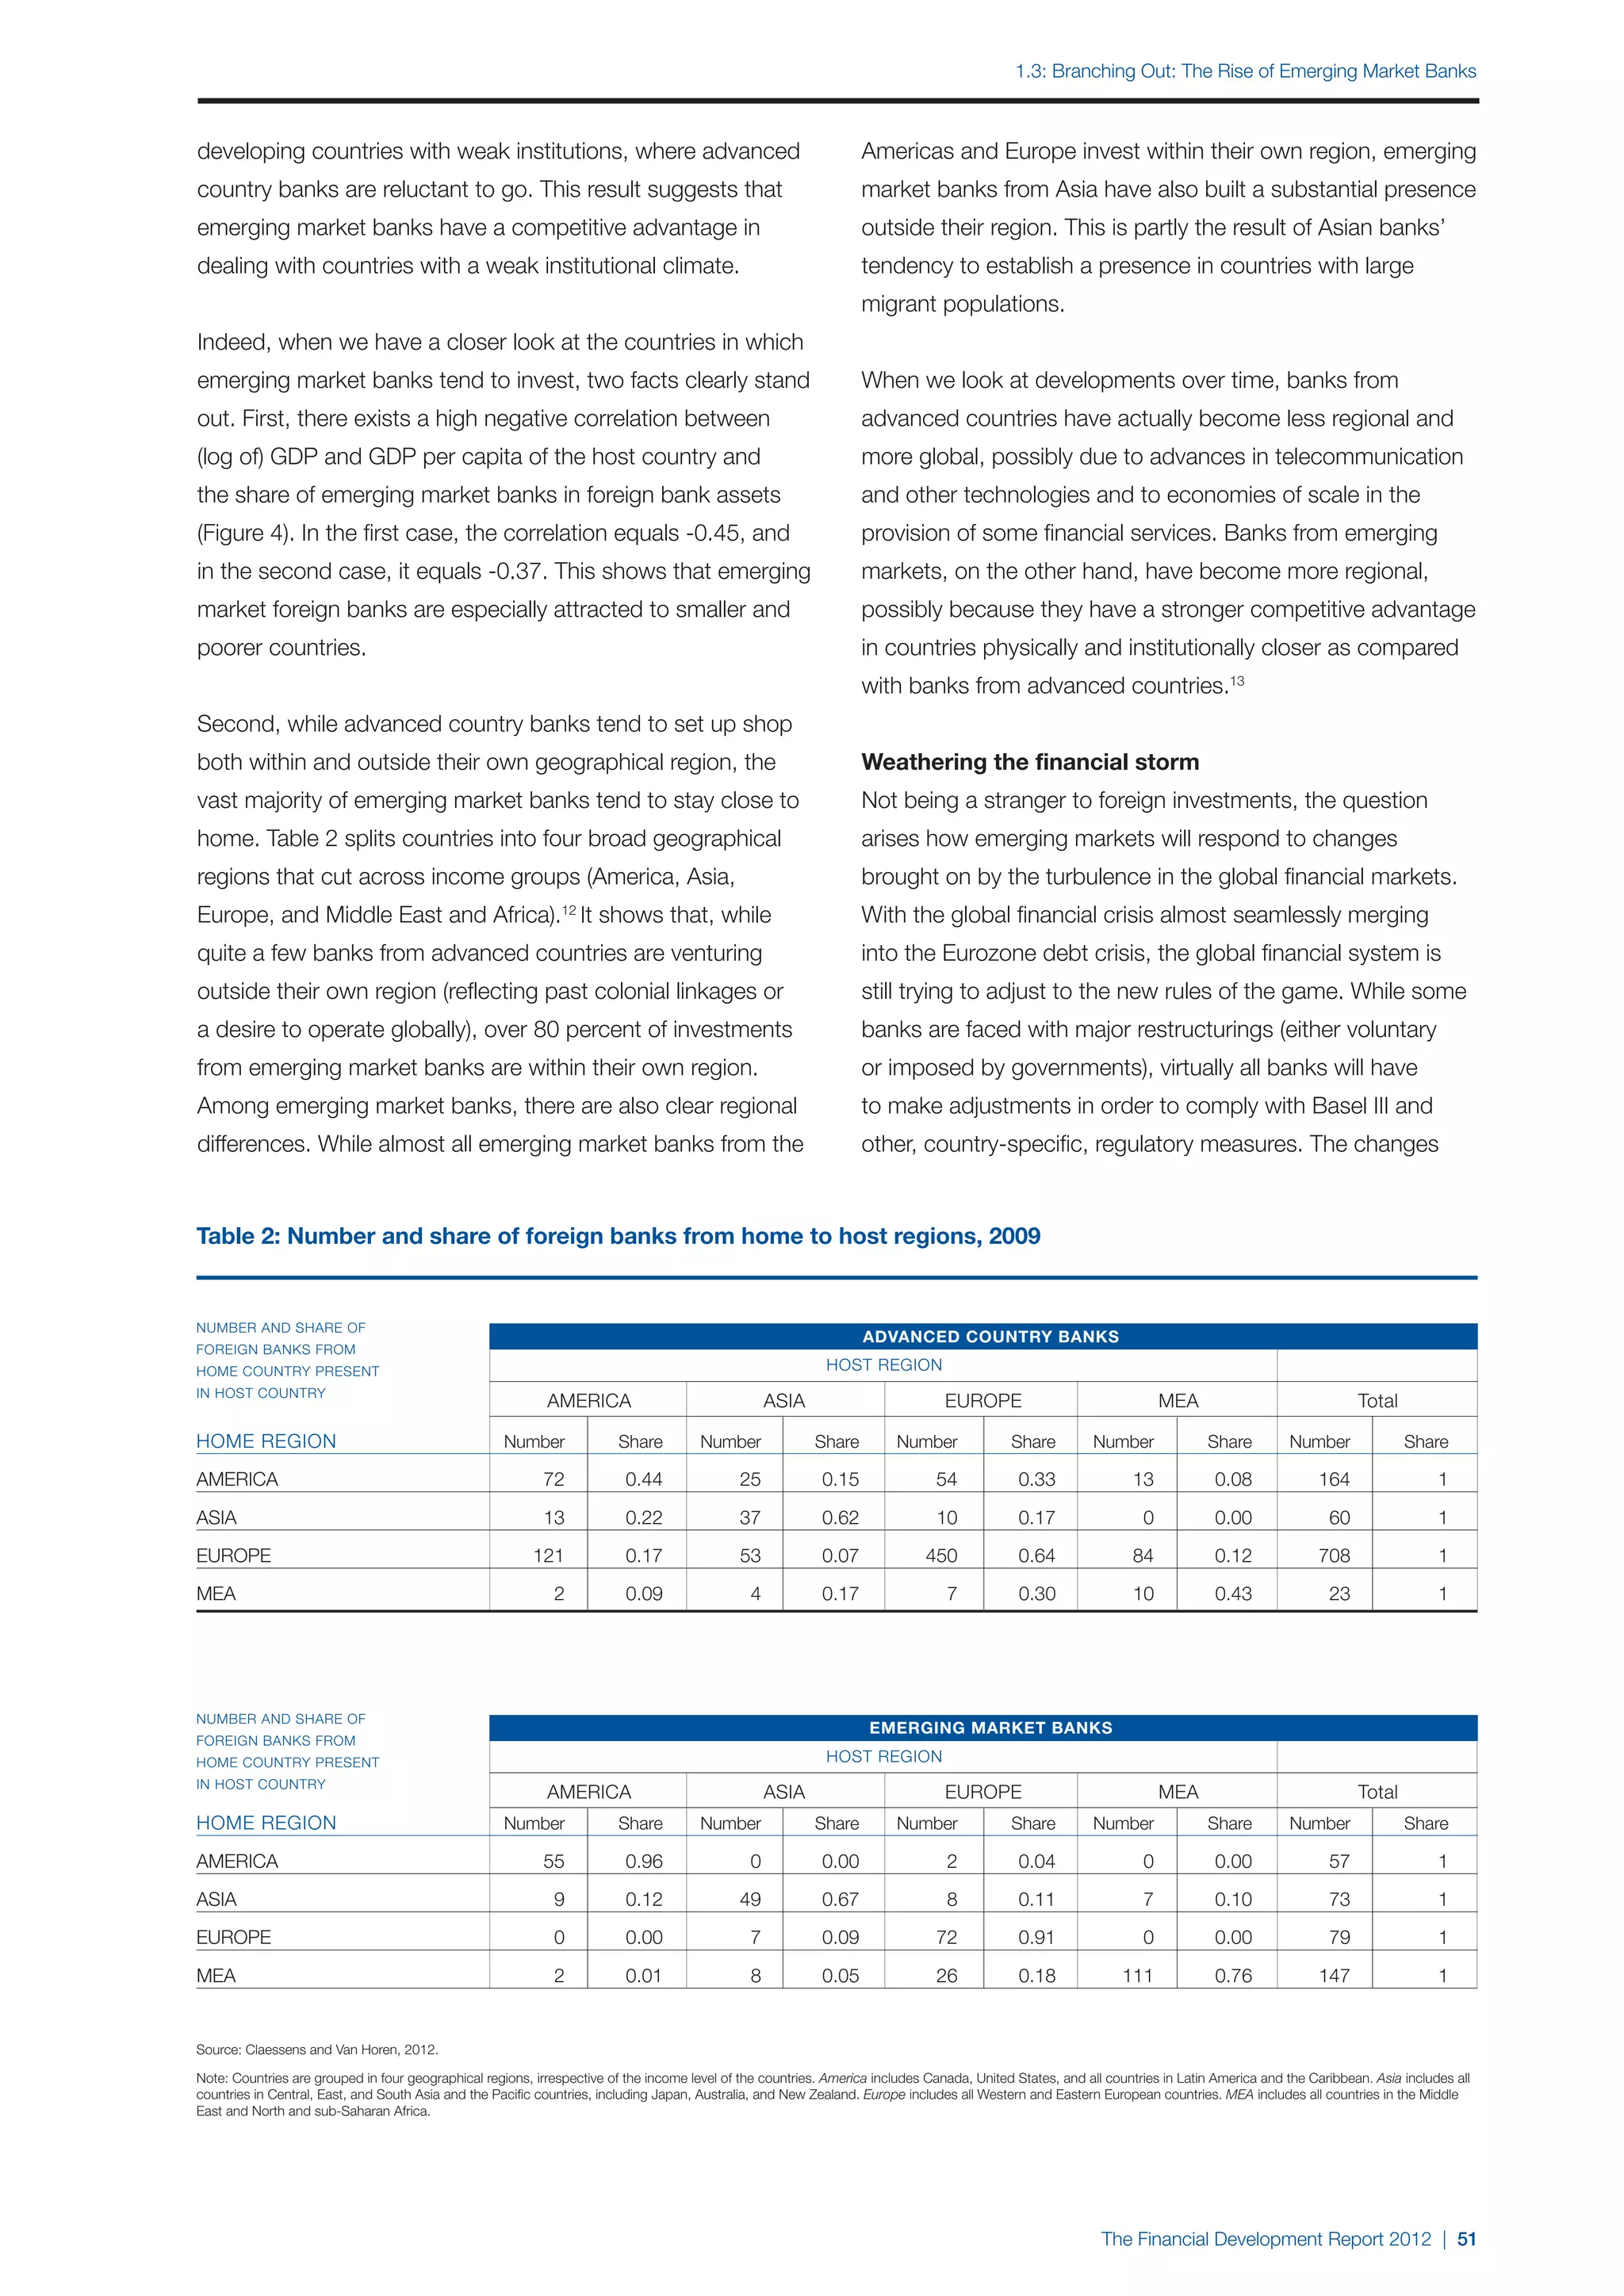
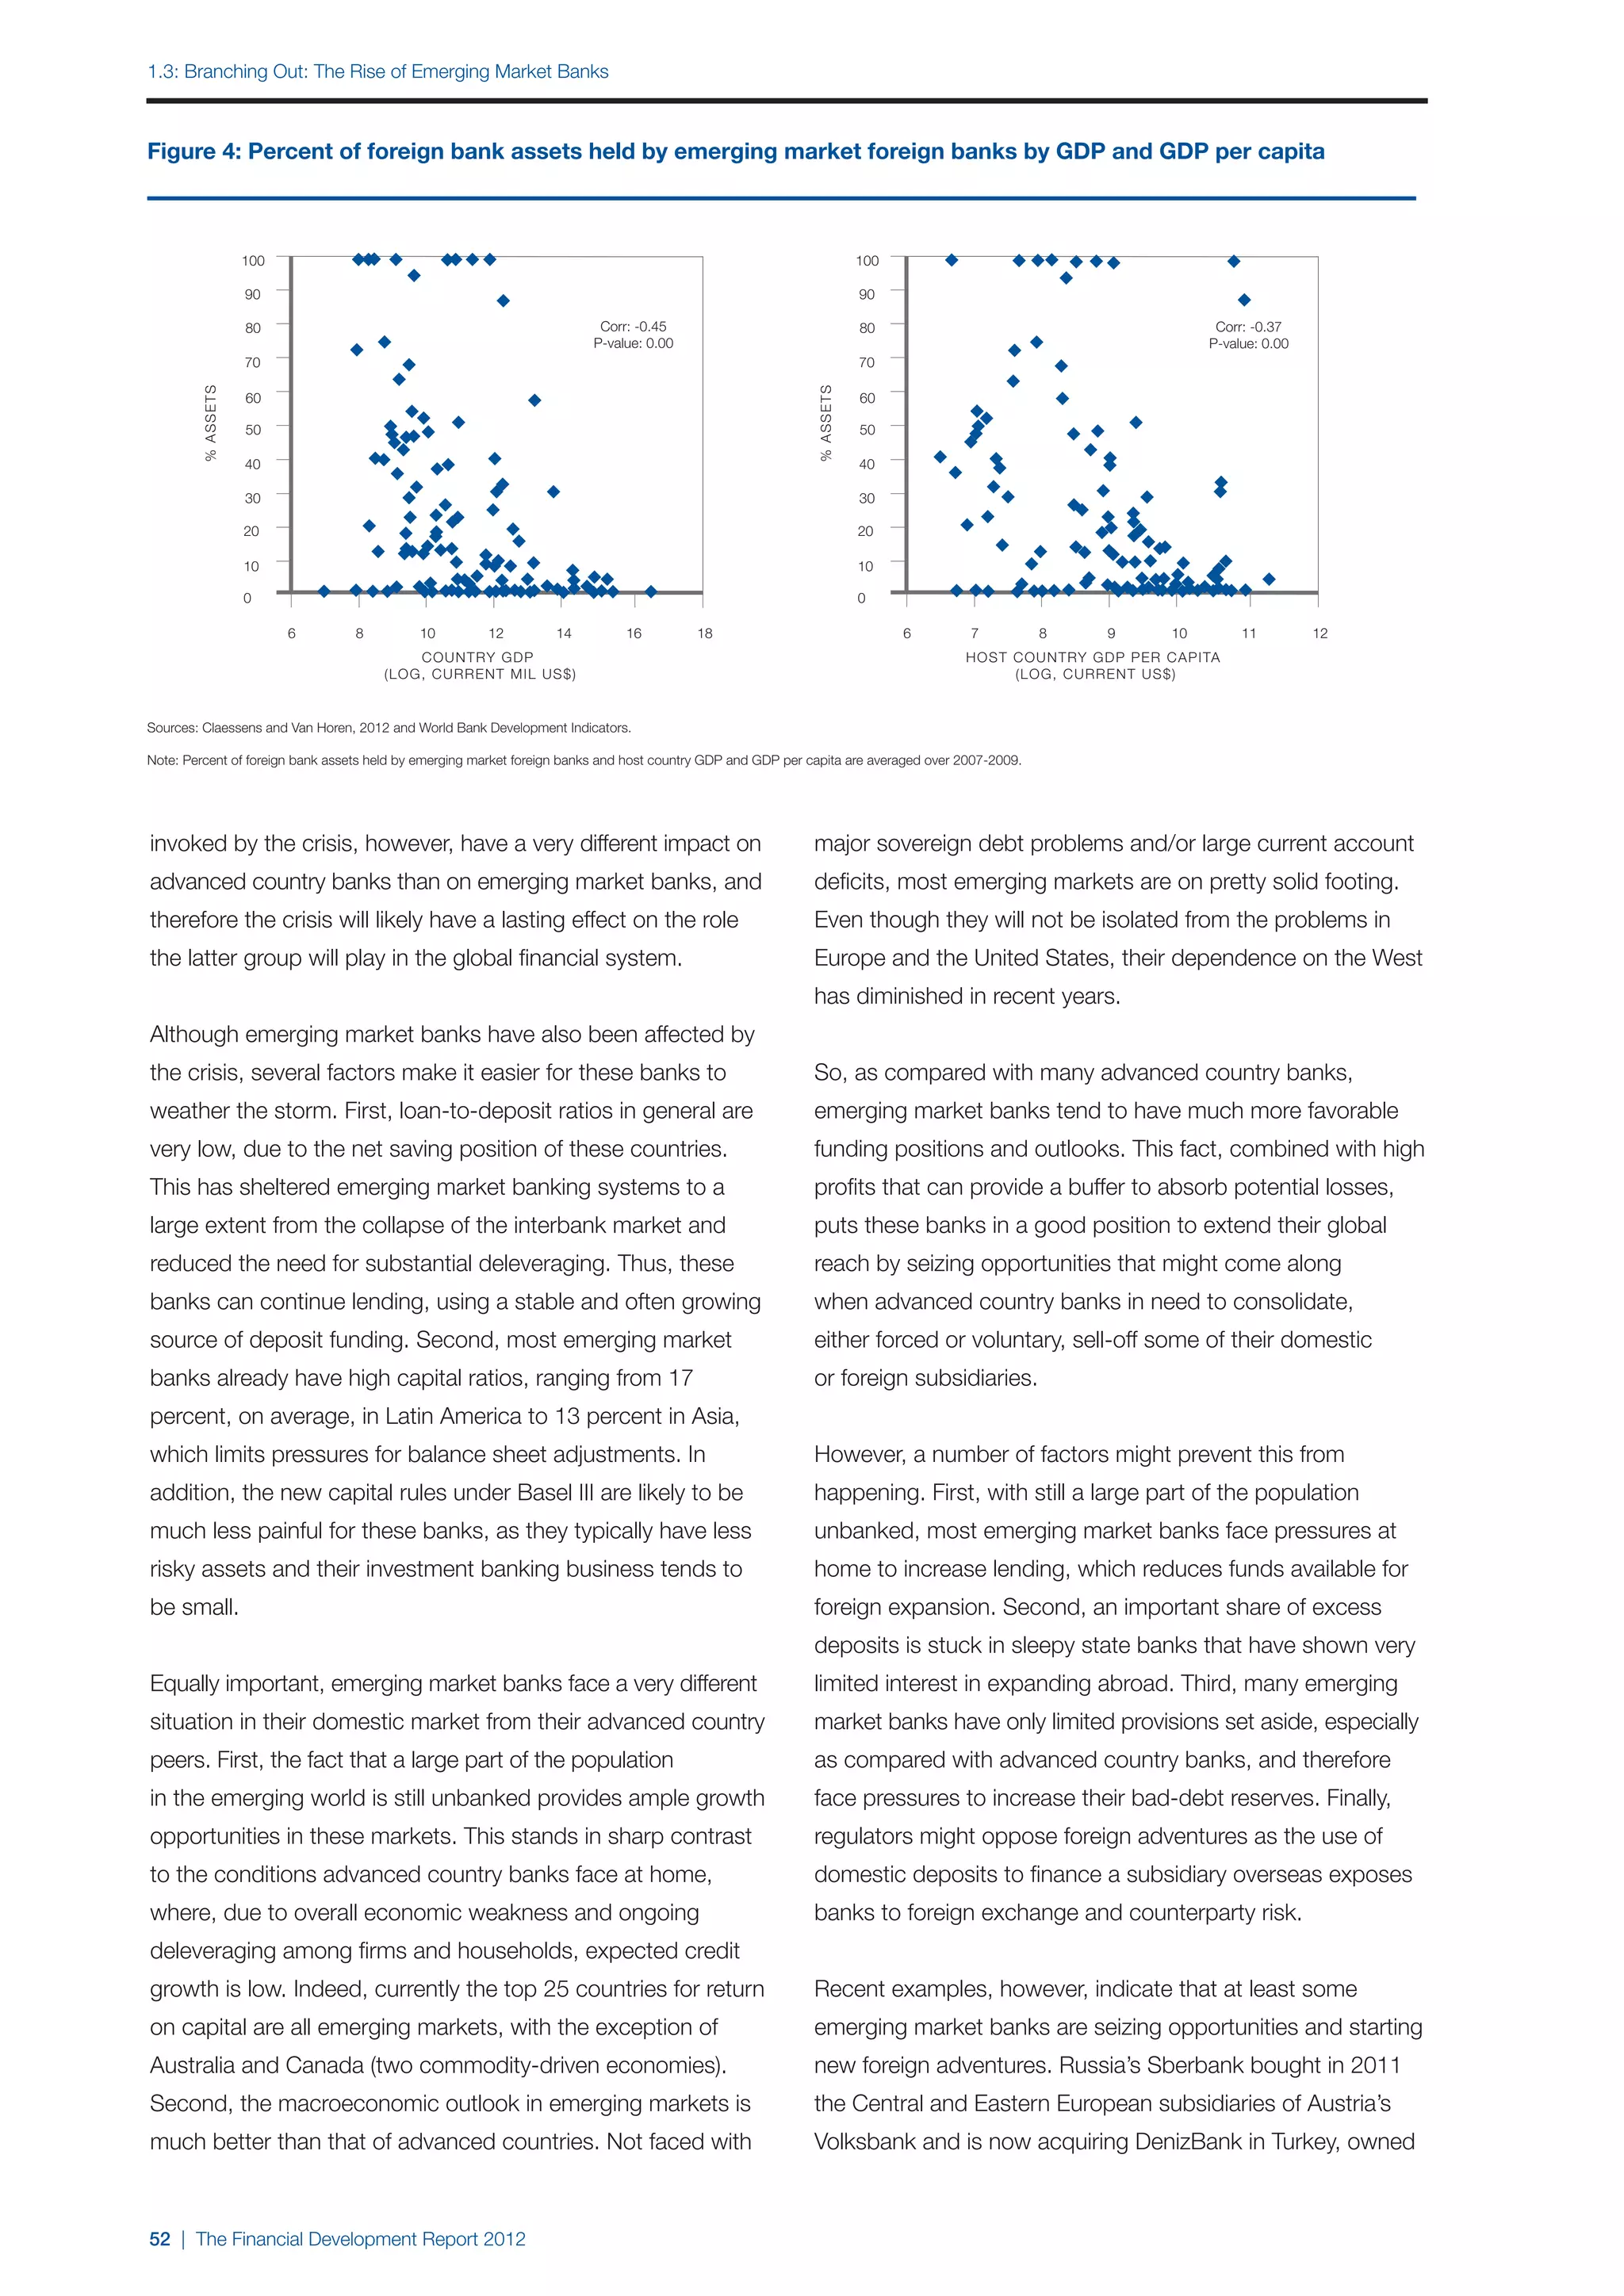
Second, strong regional differences exist. While foreign Differences that count
ownership is especially prevalent in Eastern Europe and Banks engage in foreign investment for several reasons. First,
Central Asia, Latin America, and sub-Saharan Africa, foreign investment provides a possibility for risk diversification.
ownership by emerging market banks is significantly higher Second, entering new markets can increase the bank’s client
in the latter region. In sub-Saharan Africa, 53 percent of base. Third, by following their international customers
foreign assets, on average, are owned by emerging market in order to provide them with financial services, banks can
banks, while in Eastern Europe and Central Asia and in exploit informational advantages derived from long-term
Latin America, these numbers are substantially lower—15 bank-client relationships. Indeed, a number of studies have
and 37 percent, respectively. The difference is even more shown that foreign direct investment in banking is correlated
pronounced when looking at the group-based shares. In with economic integration, as measured by trade and FDI
sub-Saharan Africa, emerging market banks own 49 percent flows between the home country of the parent and the host
of foreign banks and 17 percent of foreign assets. In Eastern country in which it is investing,9 and with proximity, measured
Europe and Central Asia, these numbers are 21 and 4 percent, along several dimensions.10 Fourth, foreign banks tend to be
respectively, and in Latin America, 25 and 4 percent. attracted to countries where expected profits are higher,
owing to higher expected economic growth and the existence
Third, clear differences emerge when comparing the shares of local bank inefficiencies.11
calculated on a group basis with those based on simple averages
of the individual countries, and especially when looking at How do entry decisions of foreign banks from emerging
asset shares. In most cases, the emerging market share for markets compare to those of advanced countries? The
the group-based measure is lower than the country-based characteristics of emerging market bank investment described
measure, indicating that foreign banks owned by banks from above suggest that emerging market banks tend to invest
emerging markets are overrepresented in smaller markets. in different countries than advanced country banks do.
This suggests that advanced country banks are more Research confirms this. Van Horen (2007) shows that foreign
attracted to larger markets, while emerging market banks bank entry by both emerging market and advanced country
tend to invest in the smaller, often poorer, countries, a topic banks is driven by economic integration, common language,
that will be discussed further next. and proximity. However, controlling for these factors, banks
from emerging markets are more likely to invest in small,
50 | The Financial Development Report 2012](https://image.slidesharecdn.com/weffinancialdevelopmentreport2012-121108135403-phpapp01/75/World-Economic-Forum-The-Financial-Development-Report-2012-66-2048.jpg)


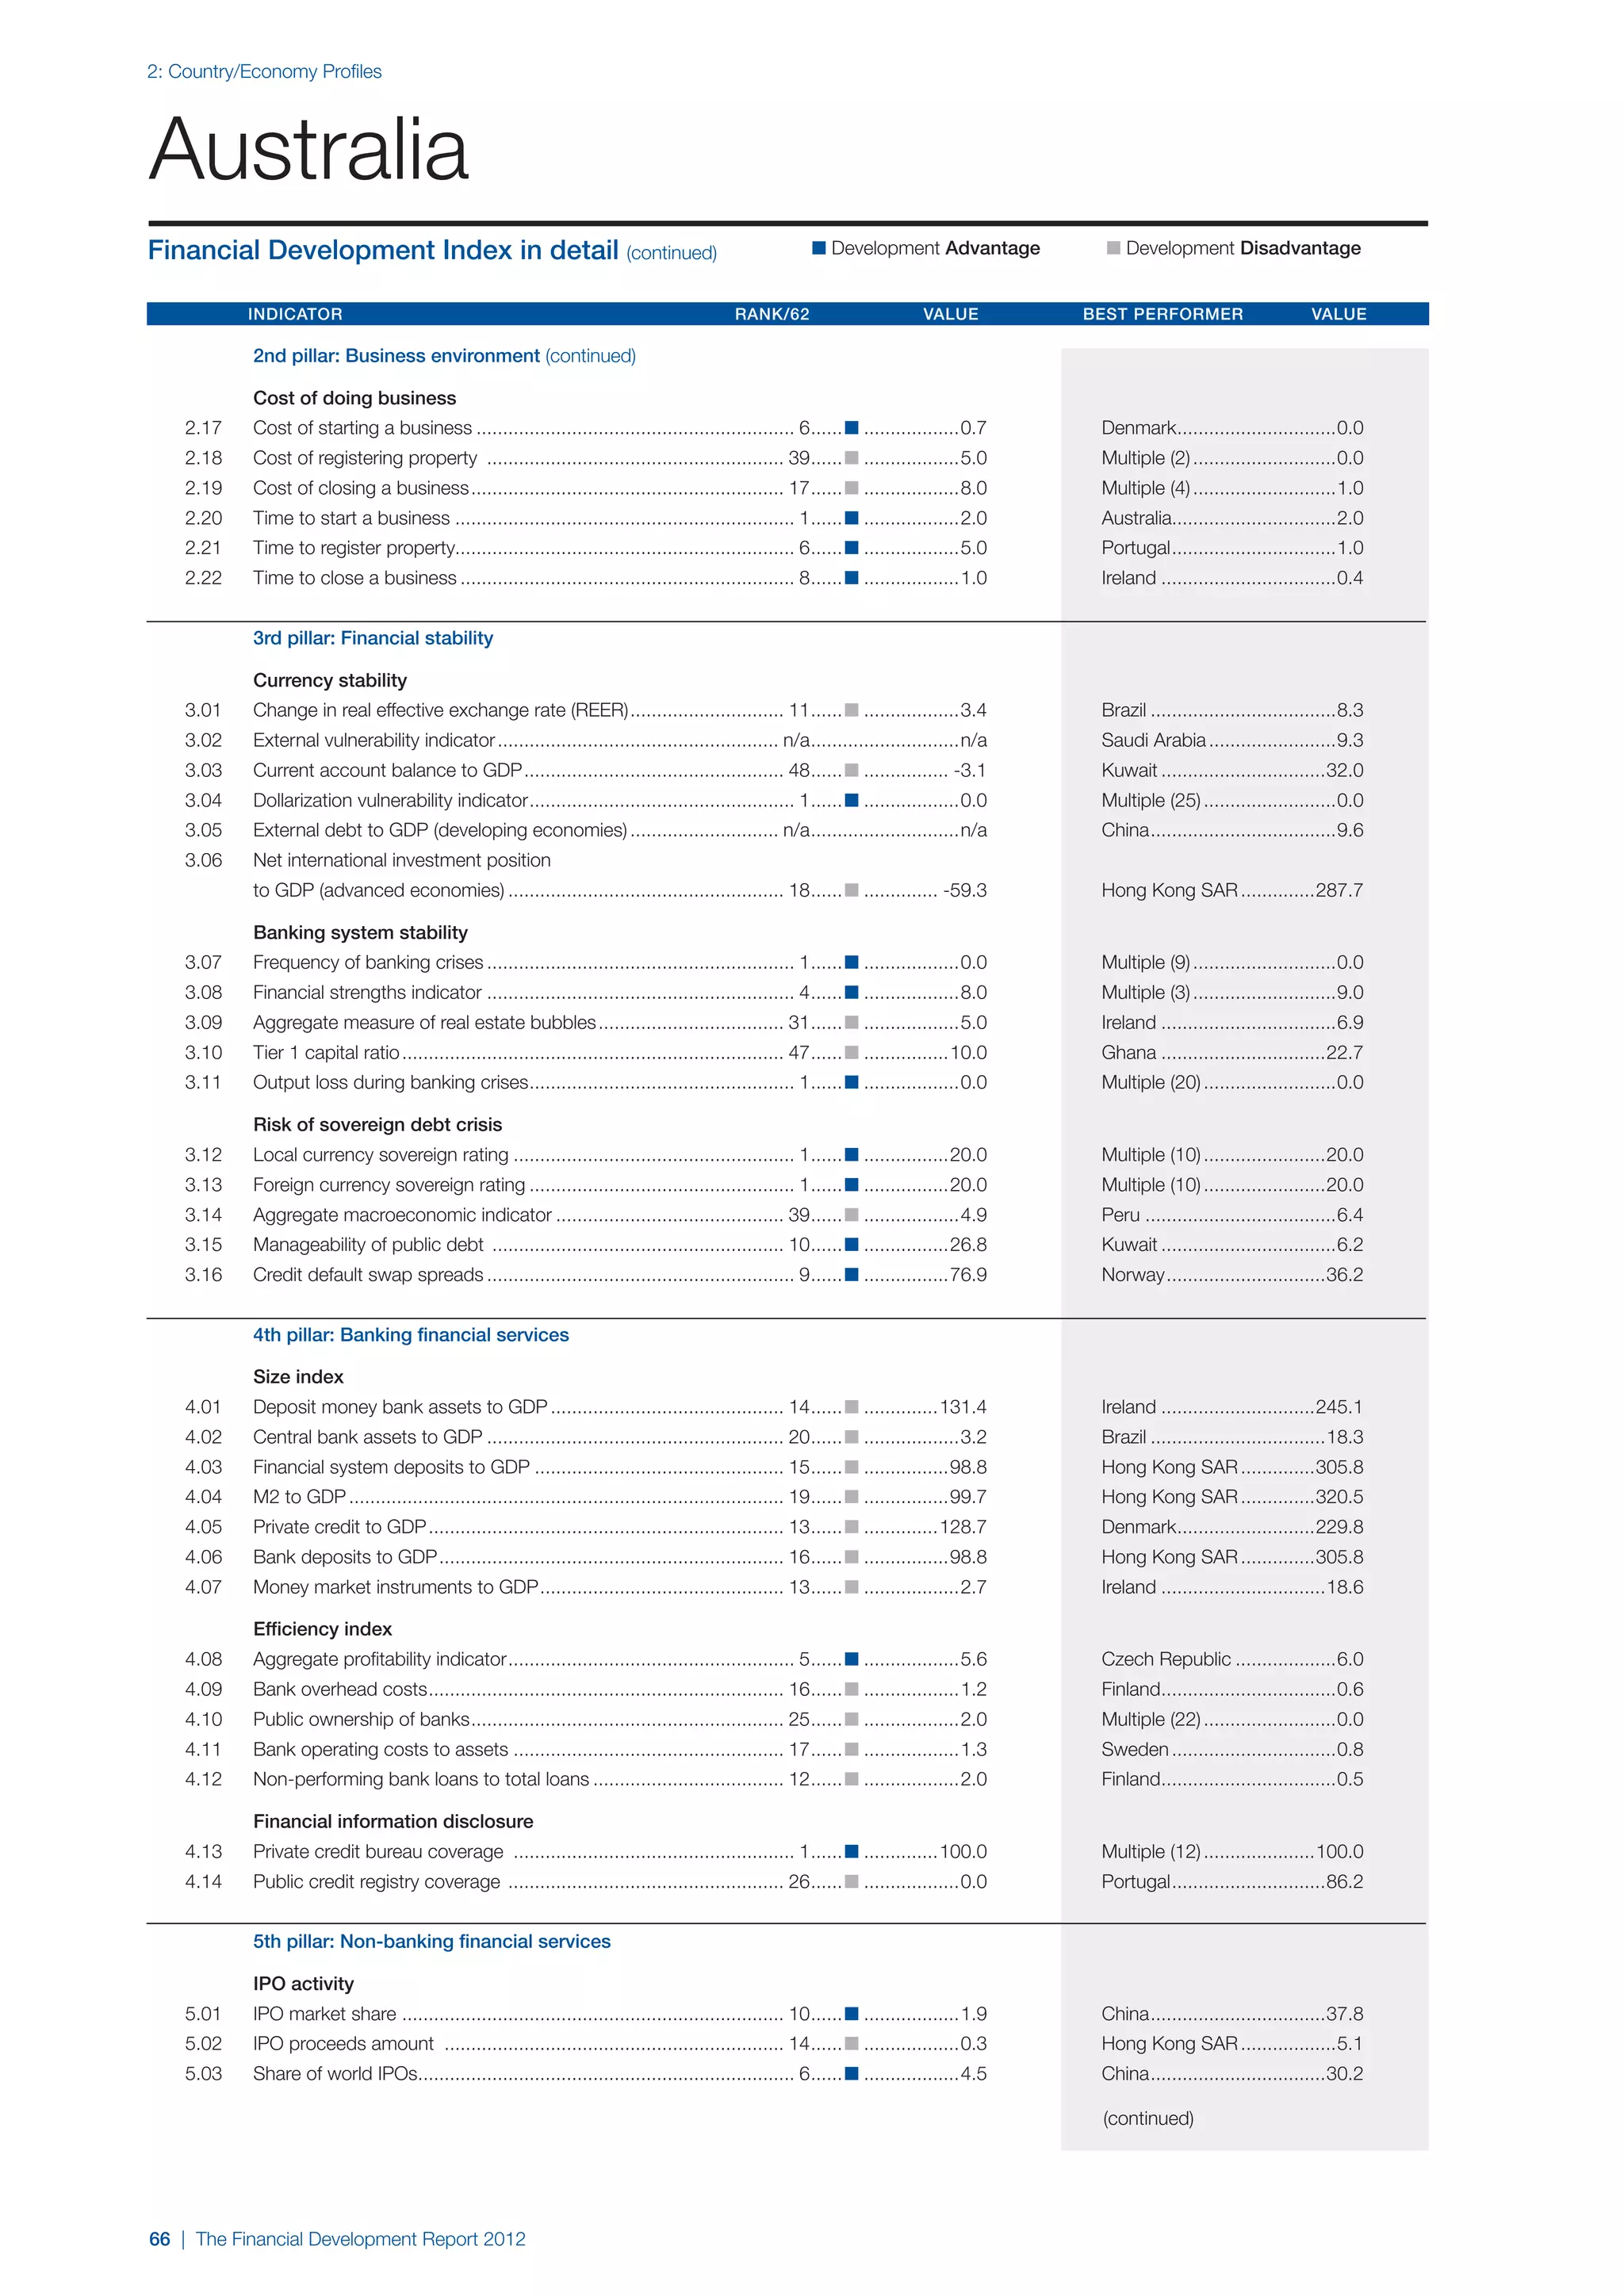


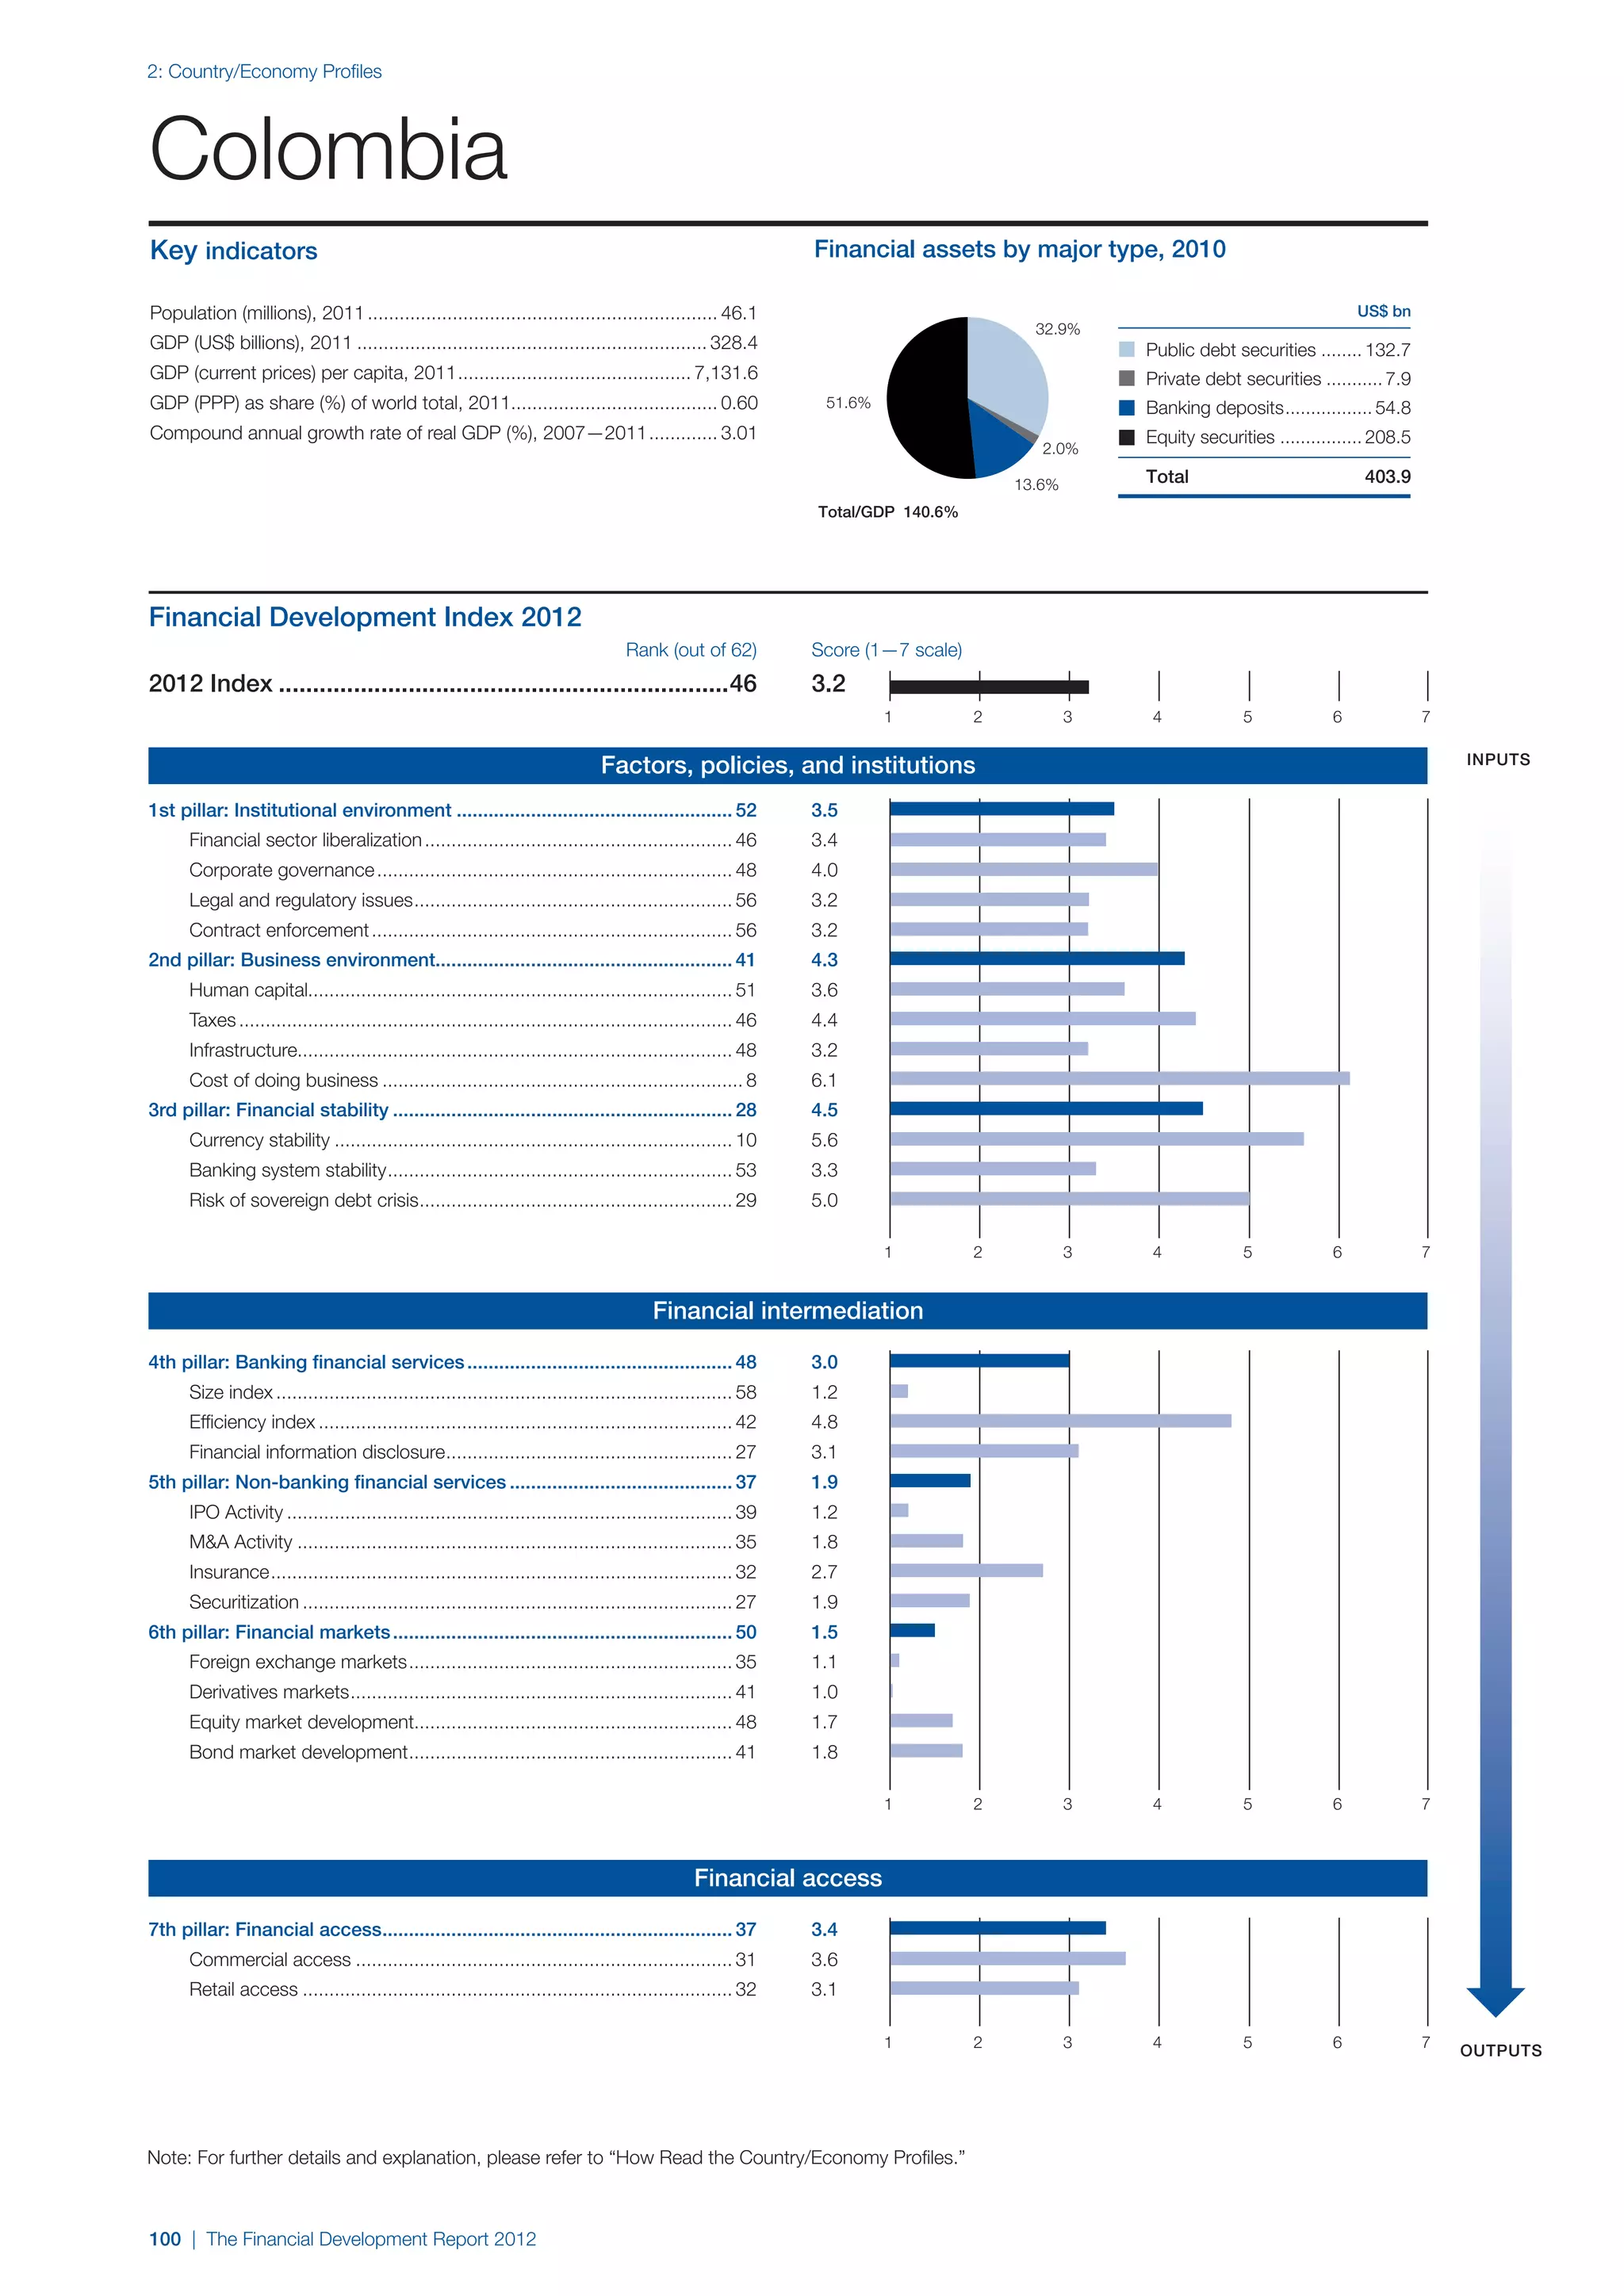


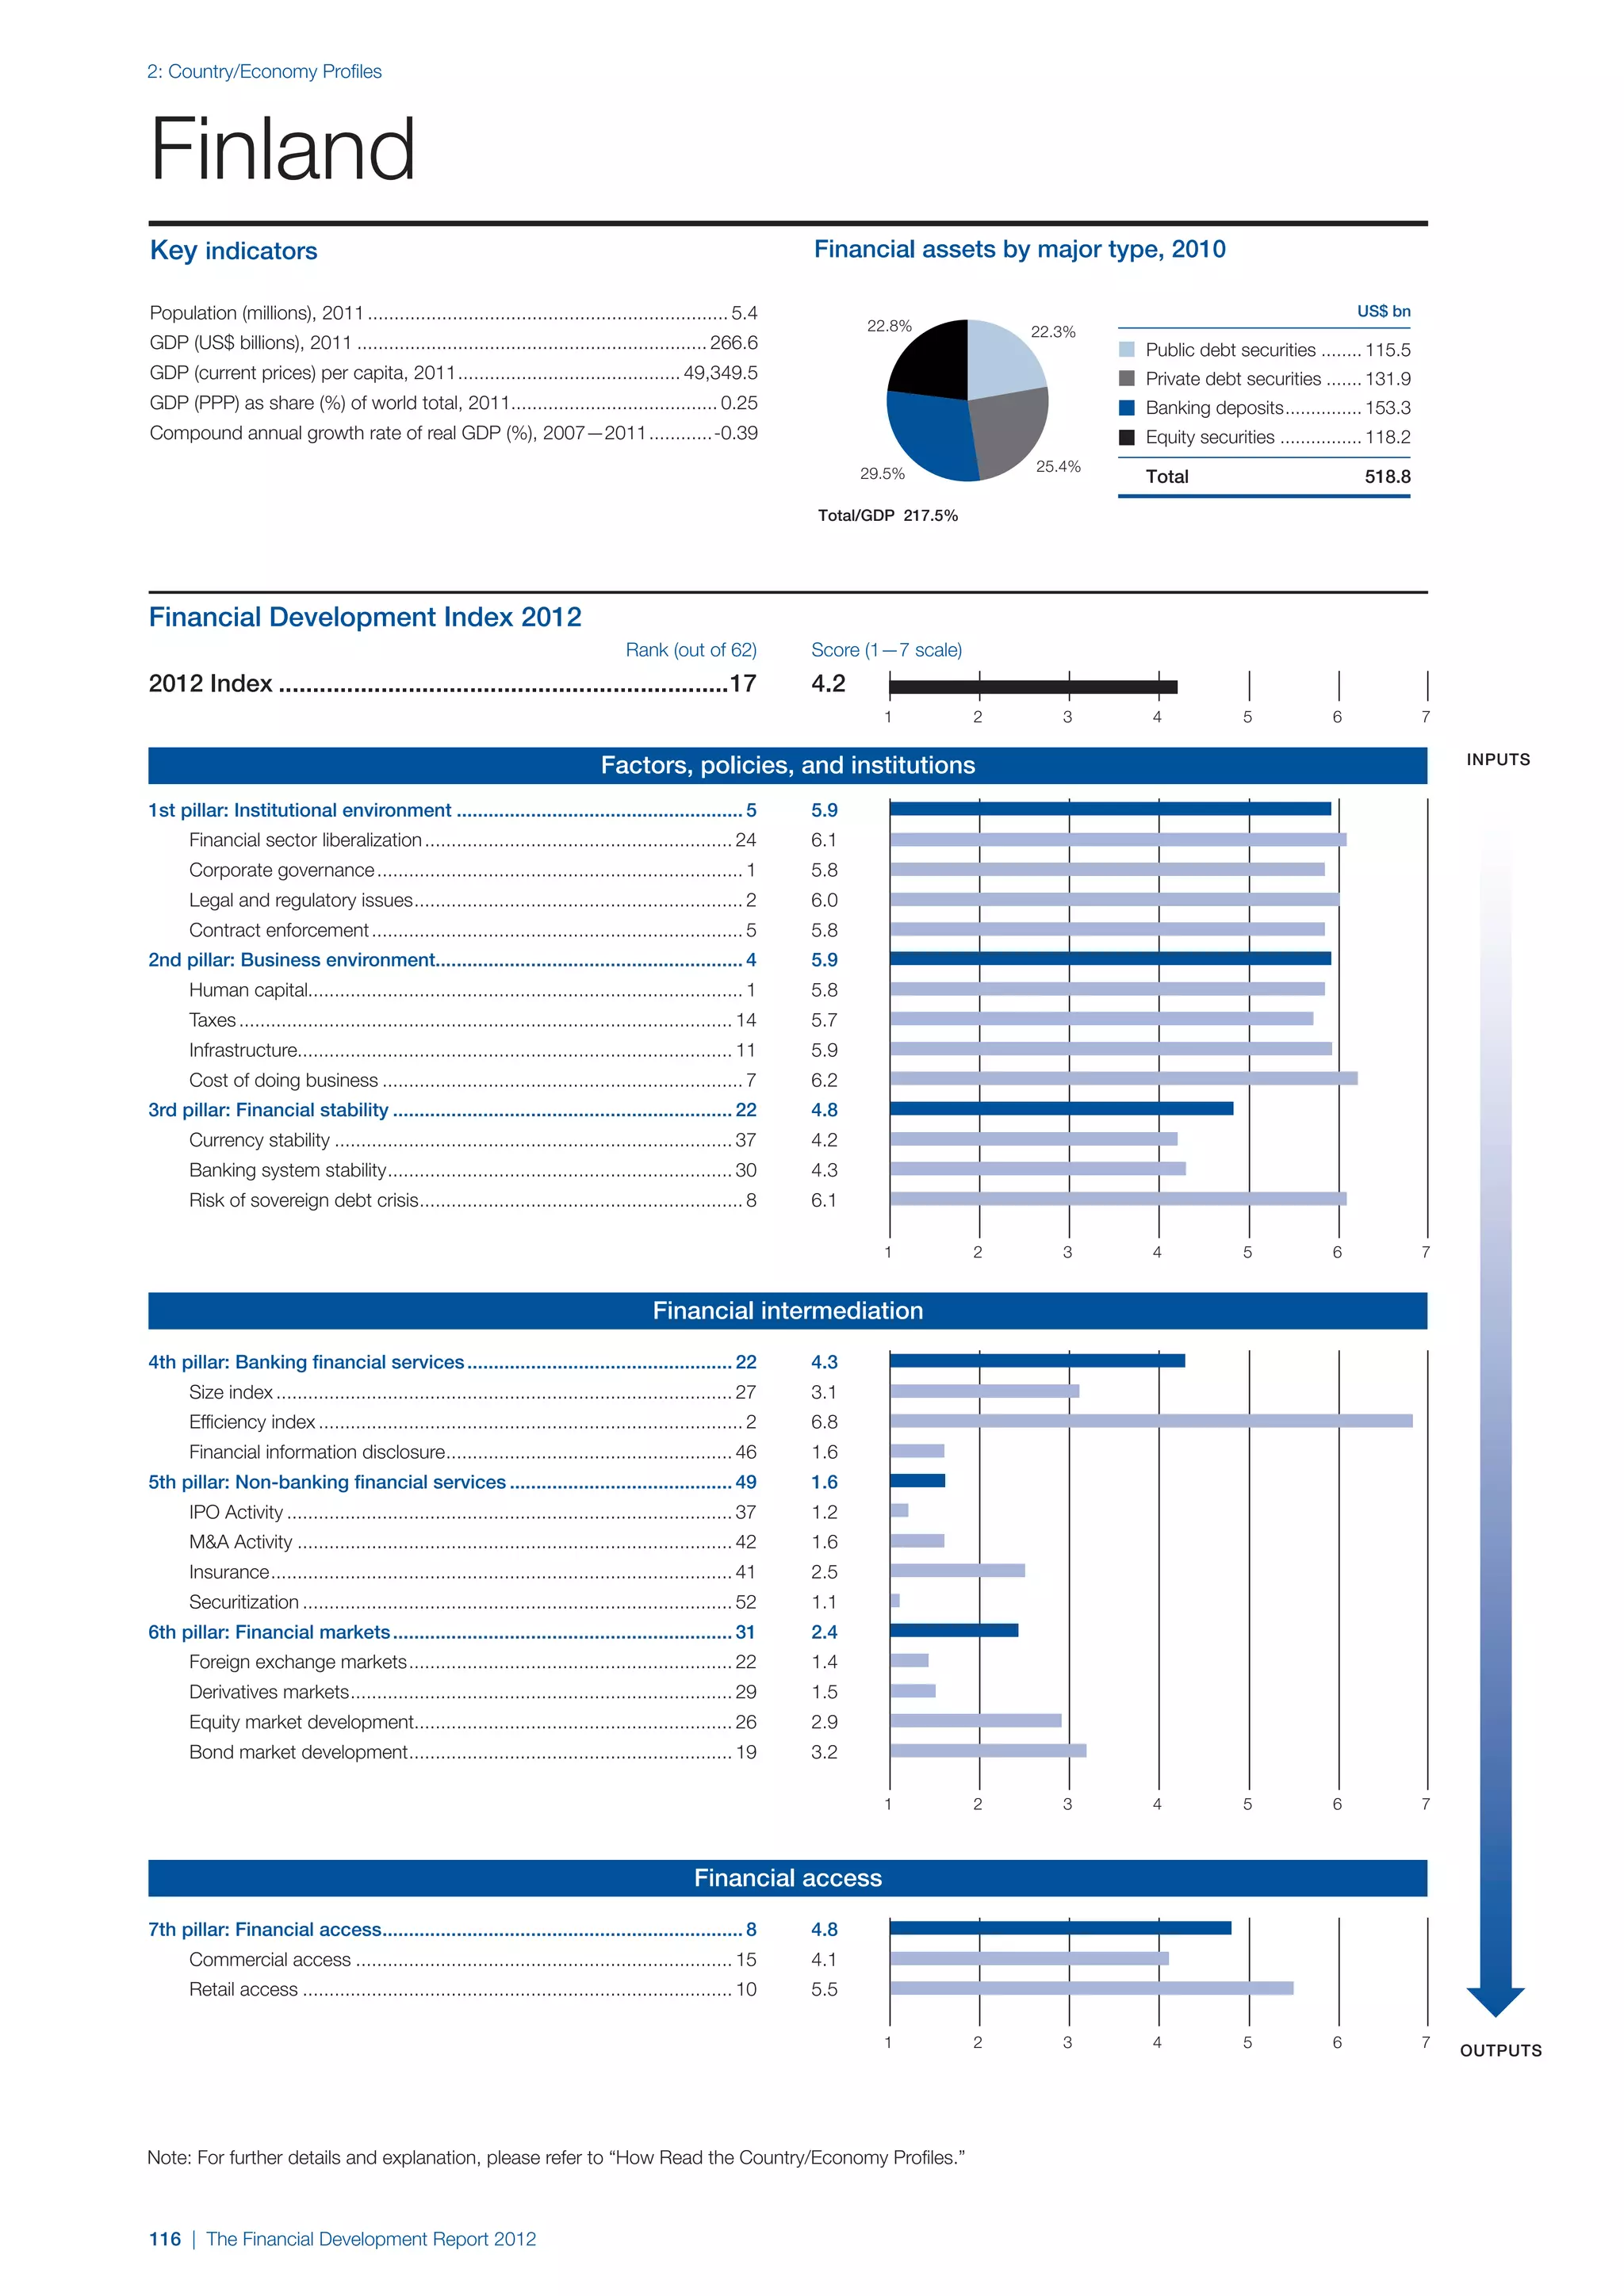
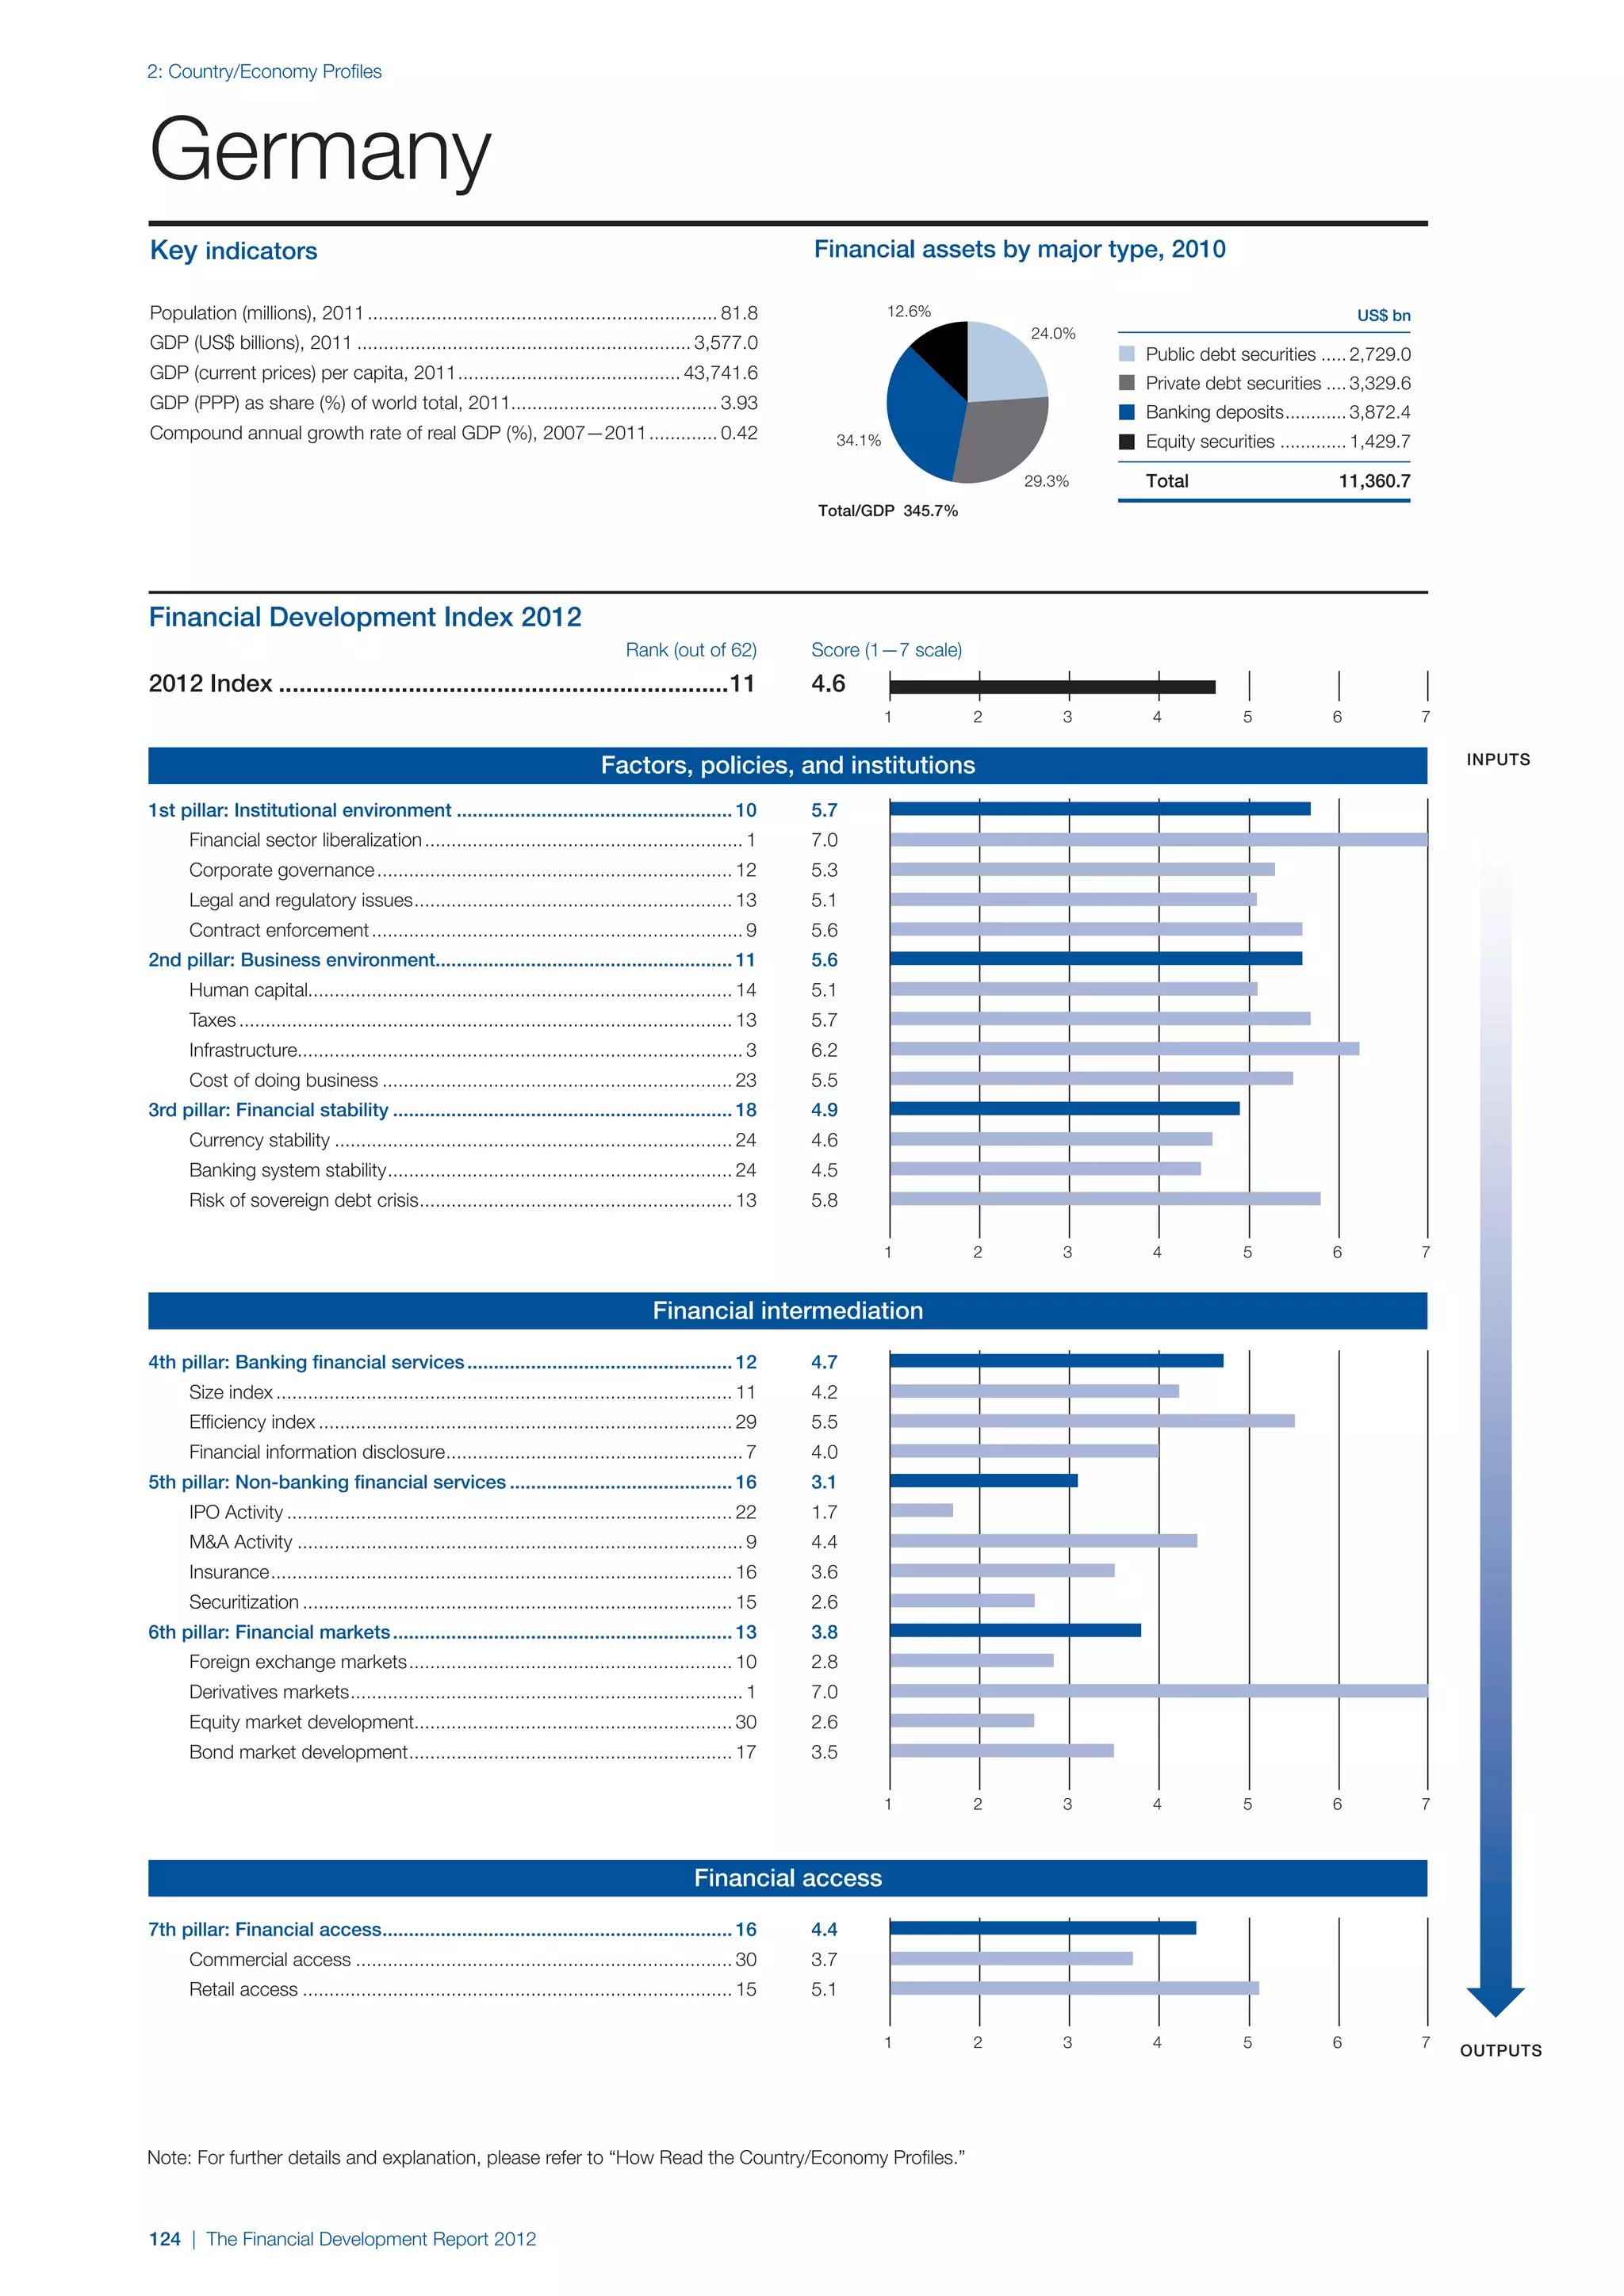

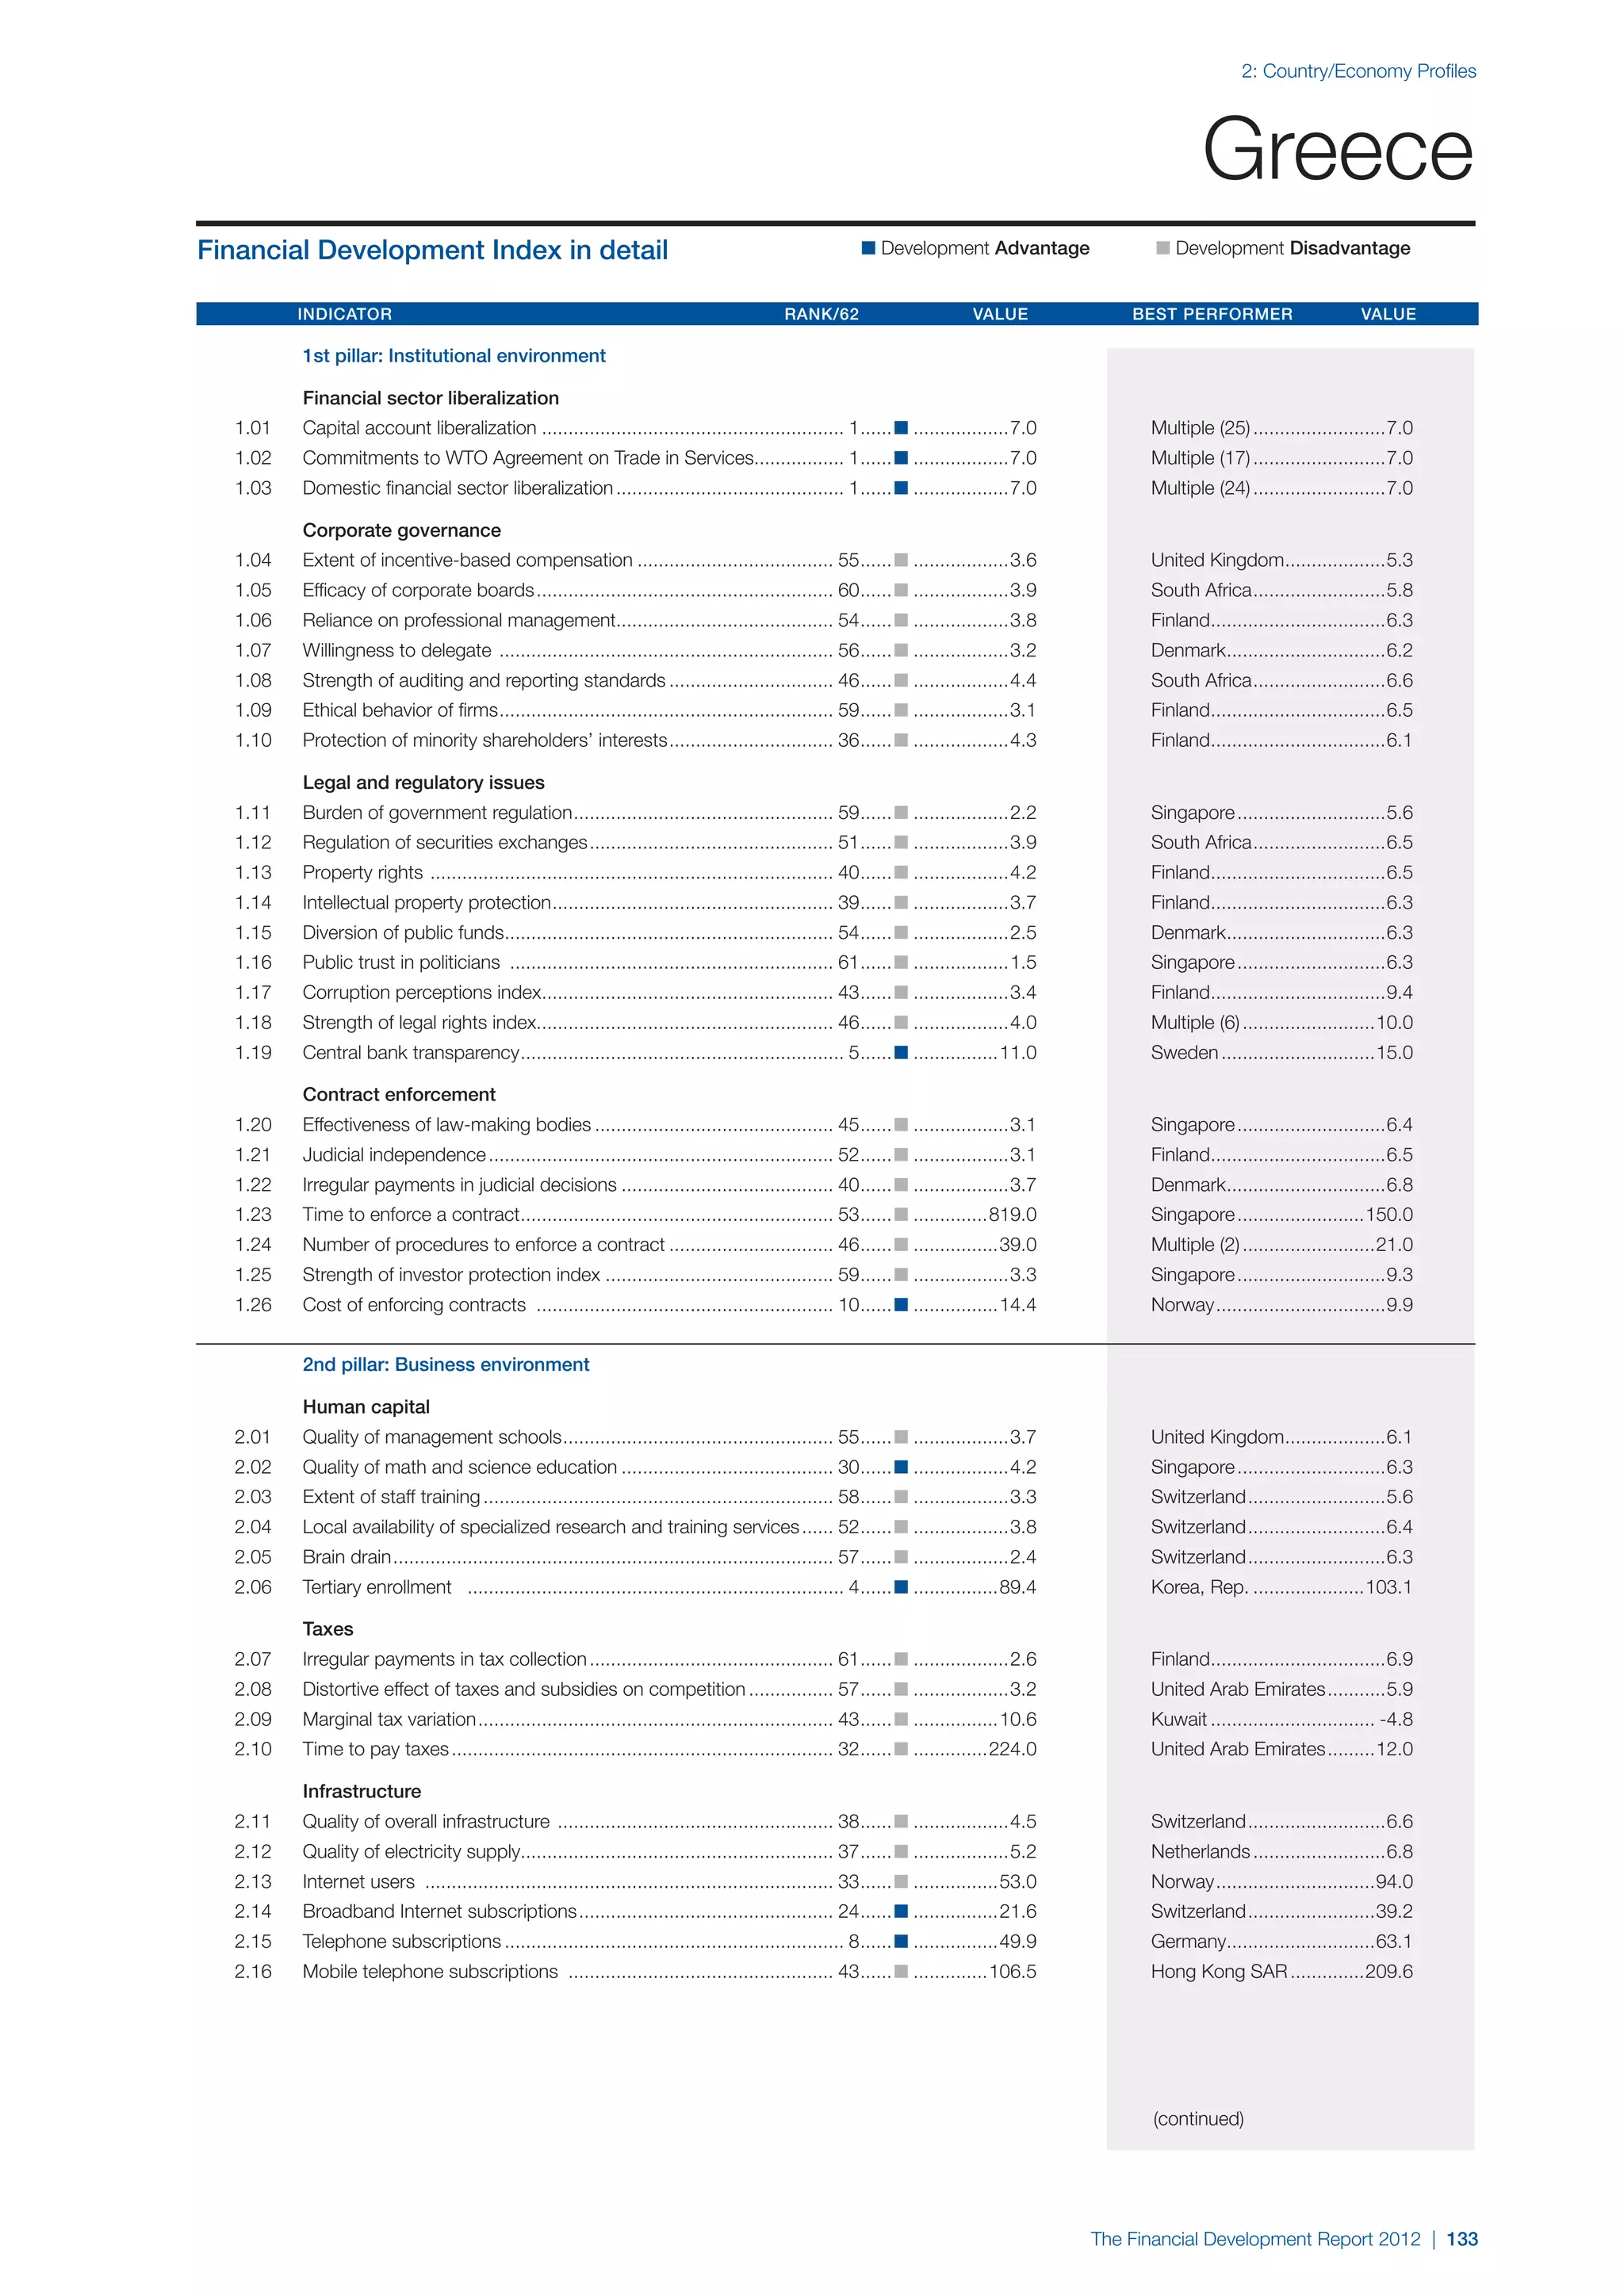

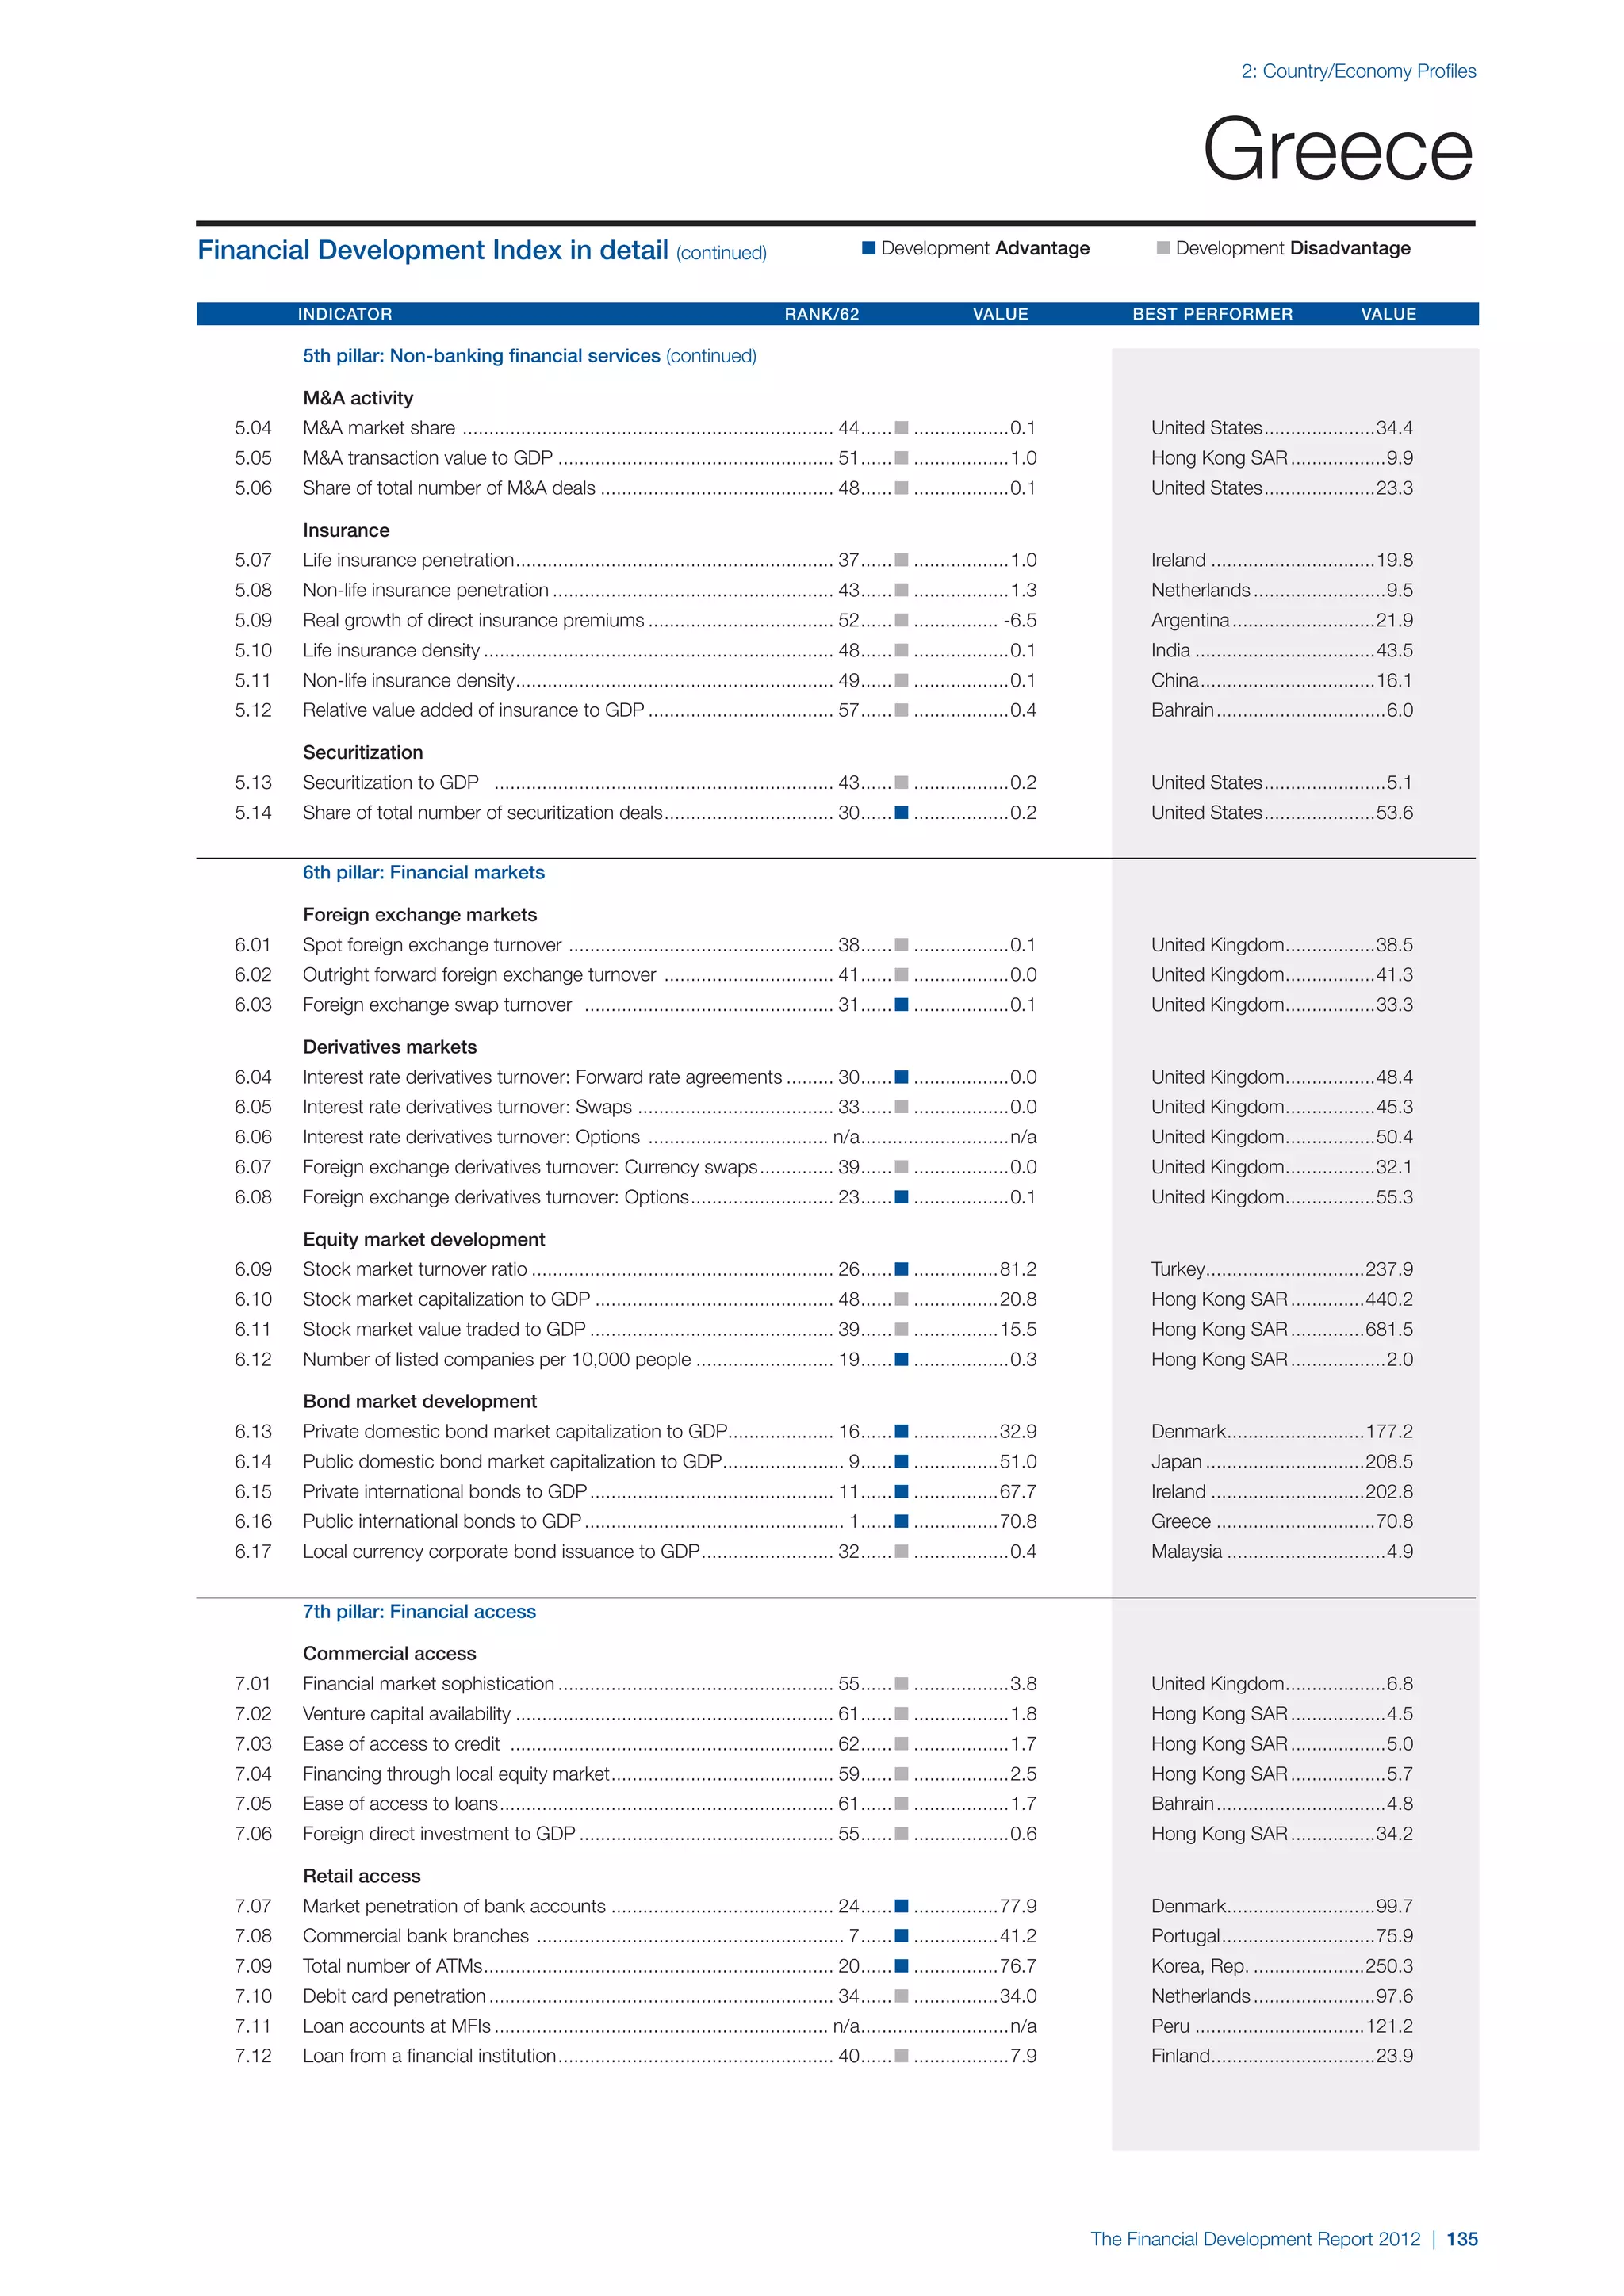
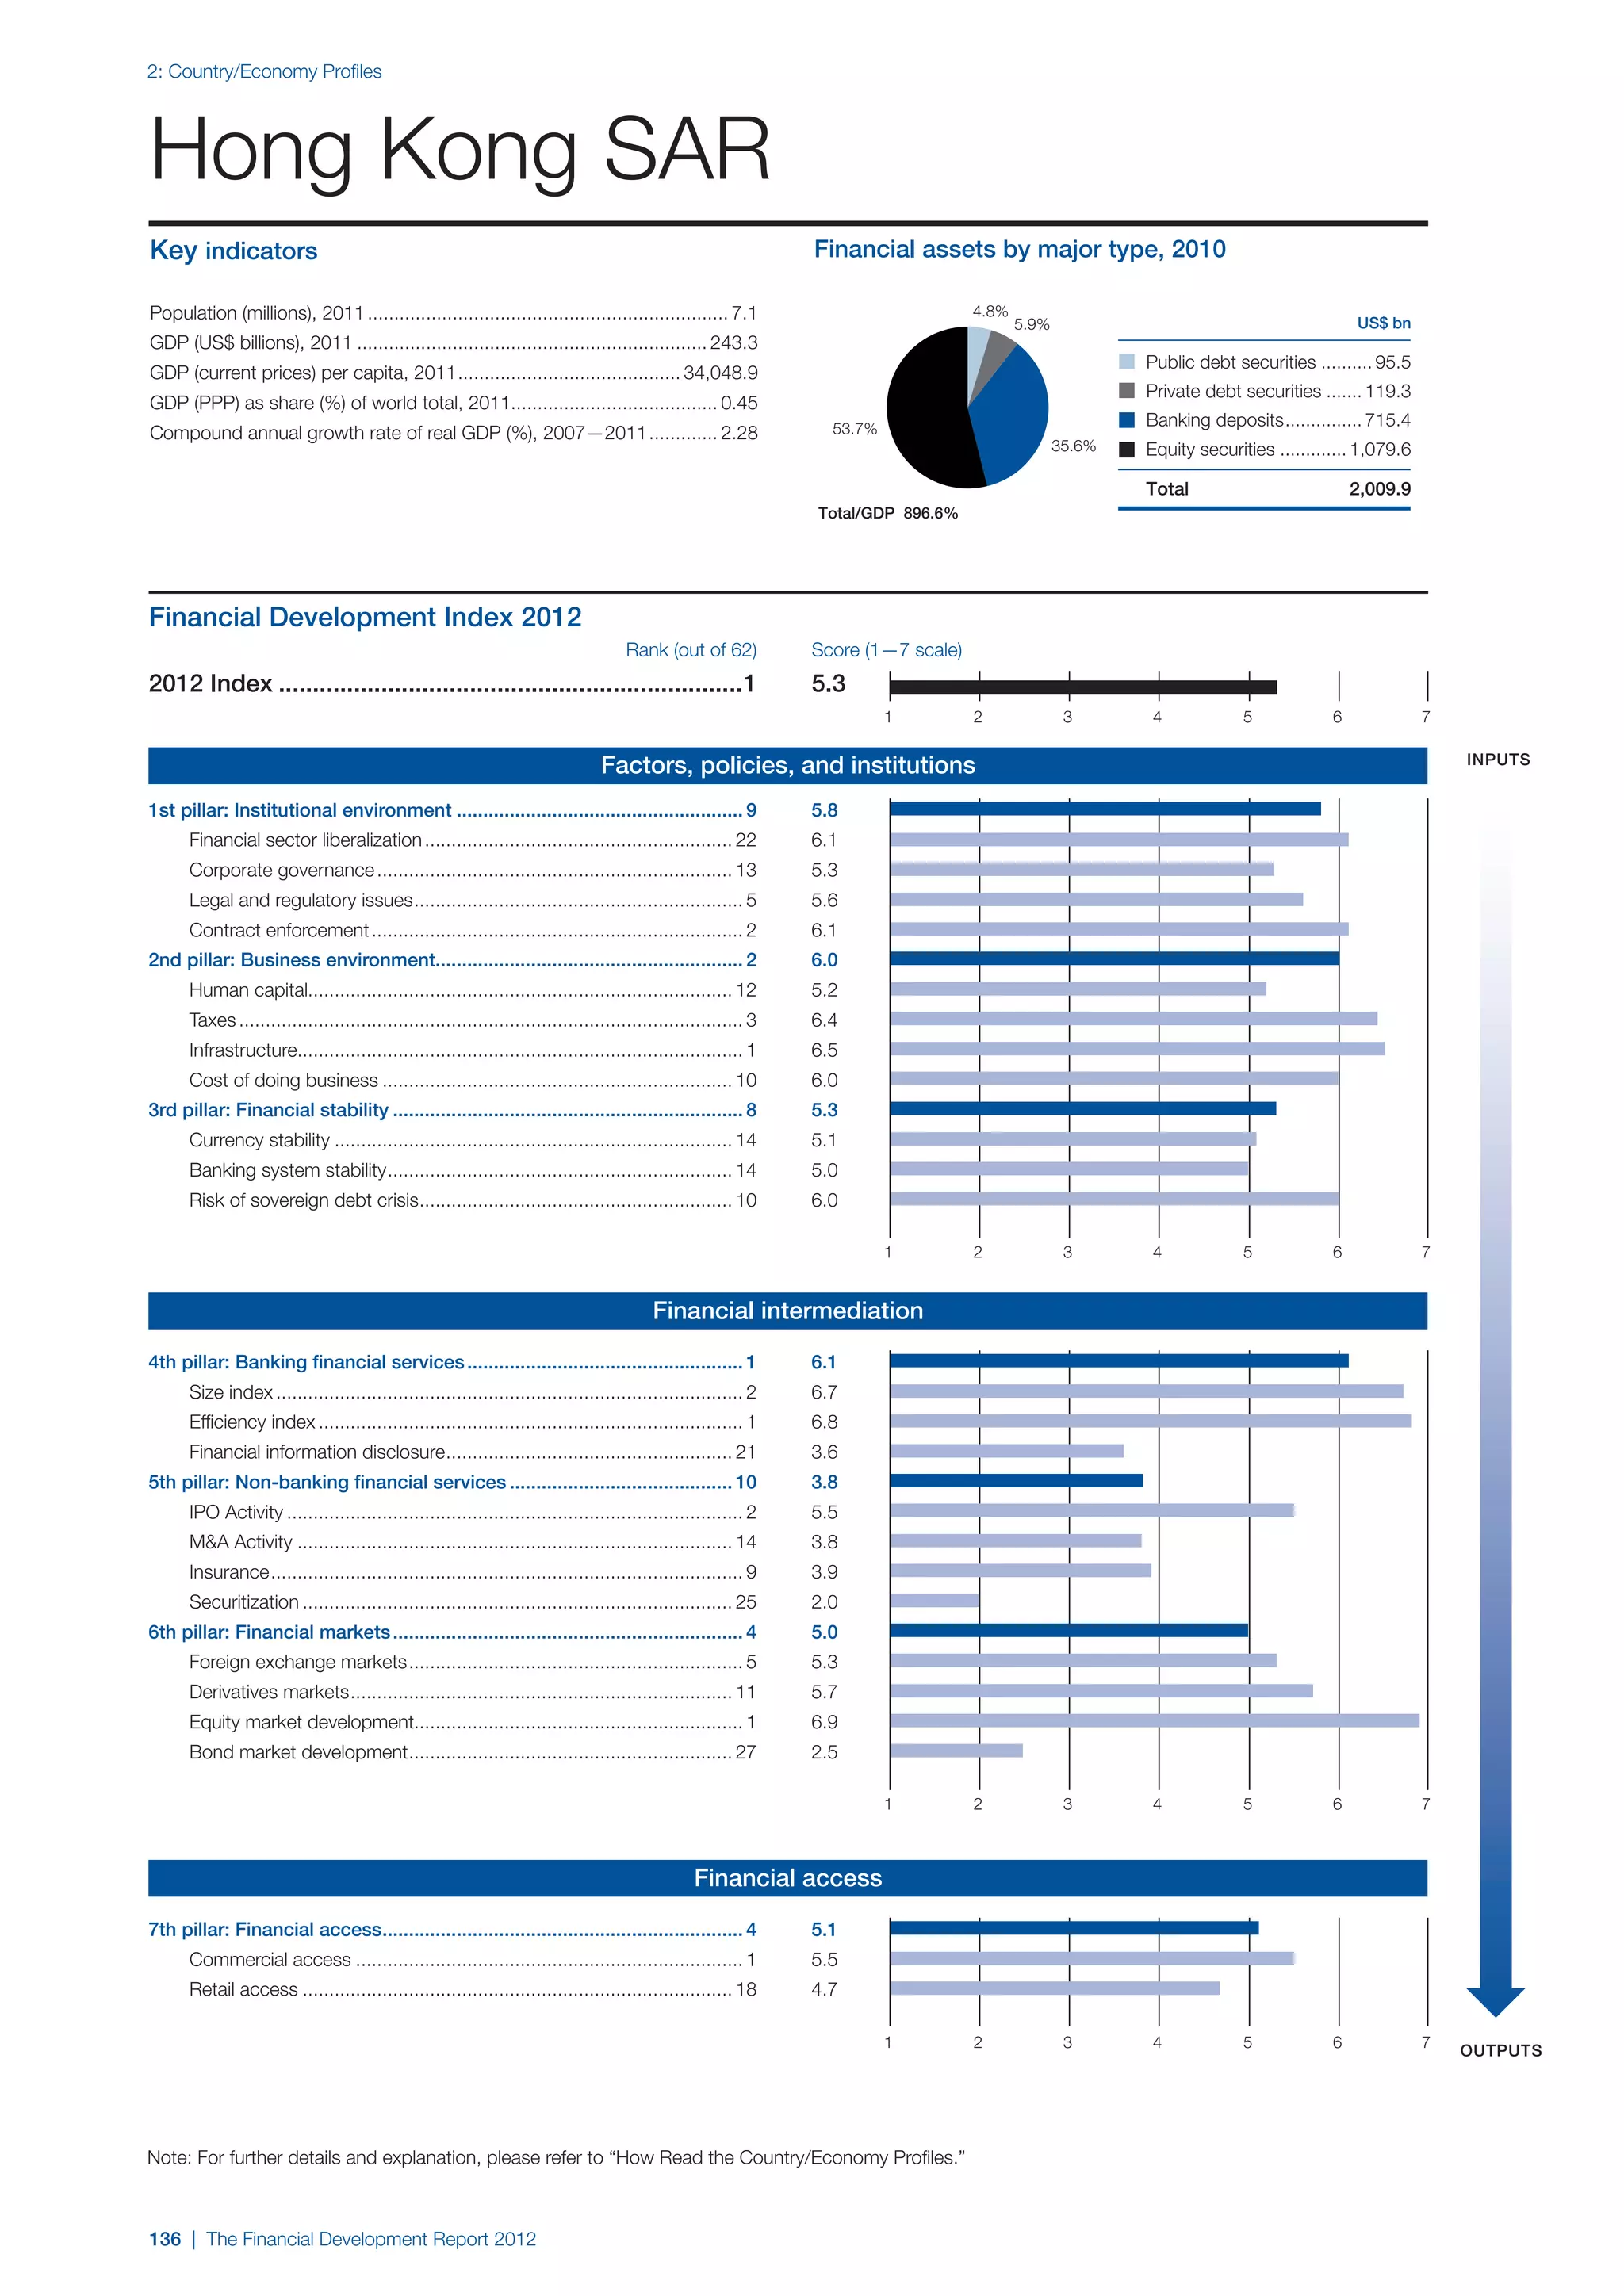


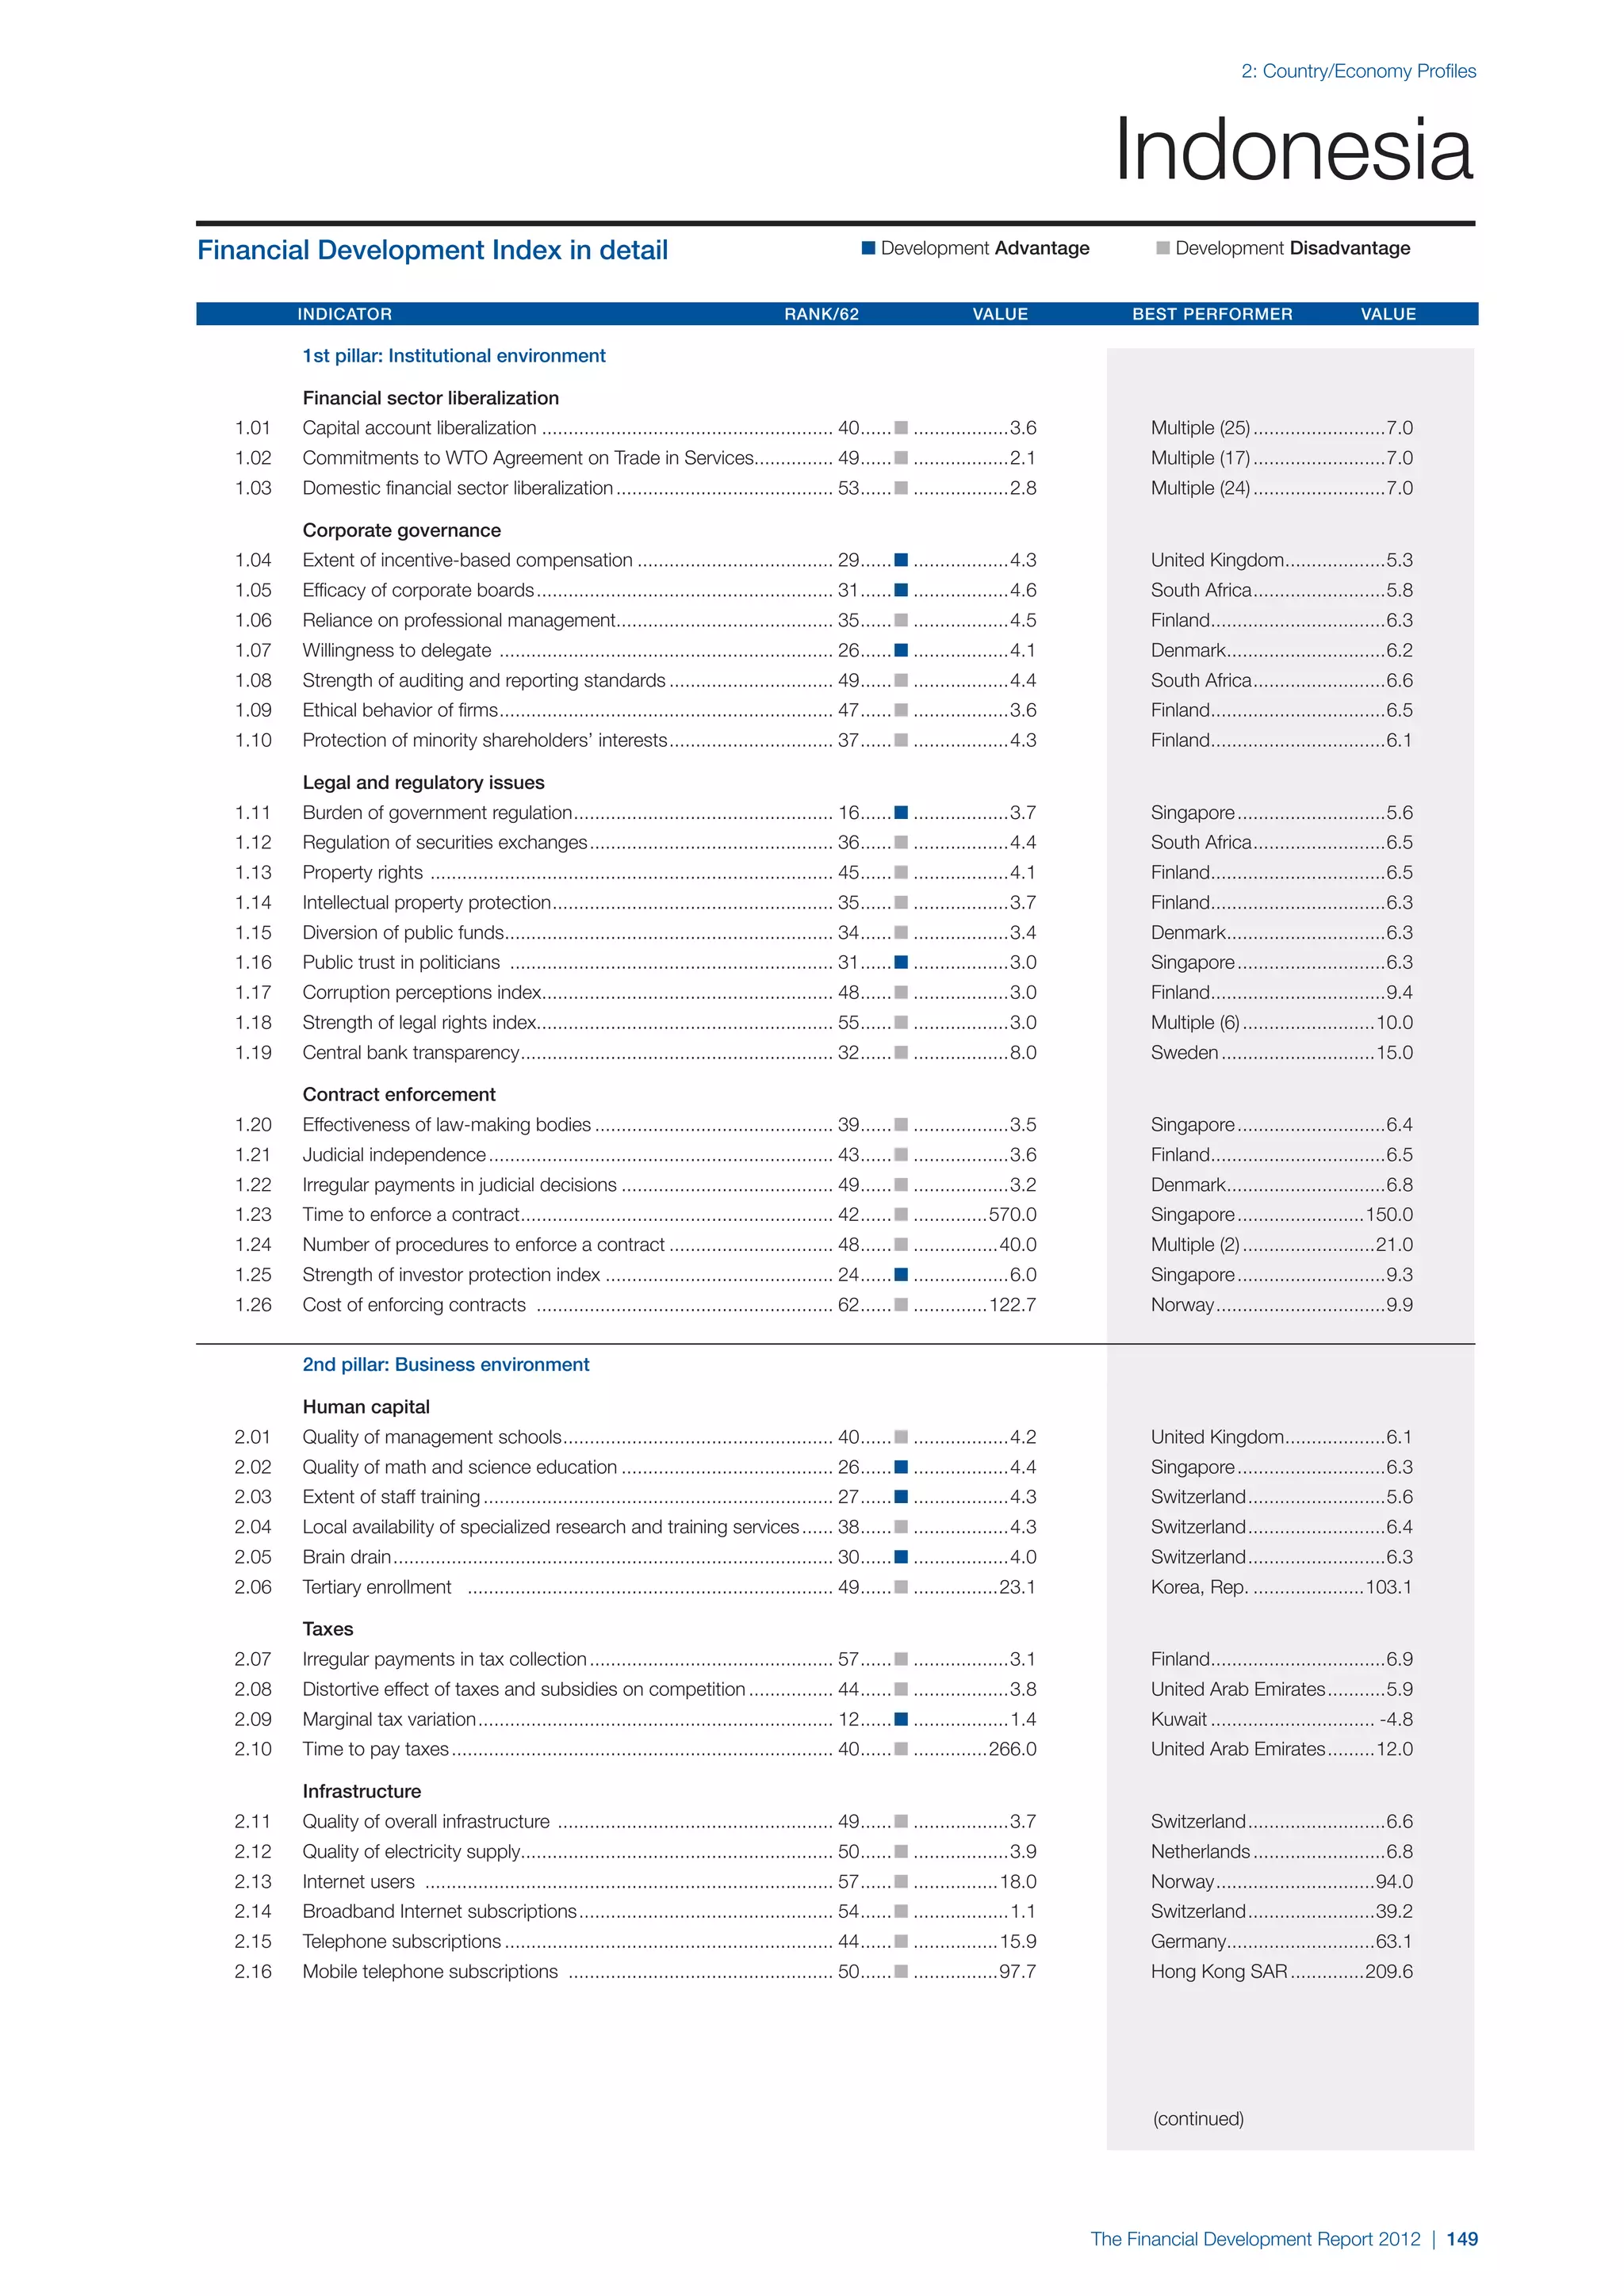


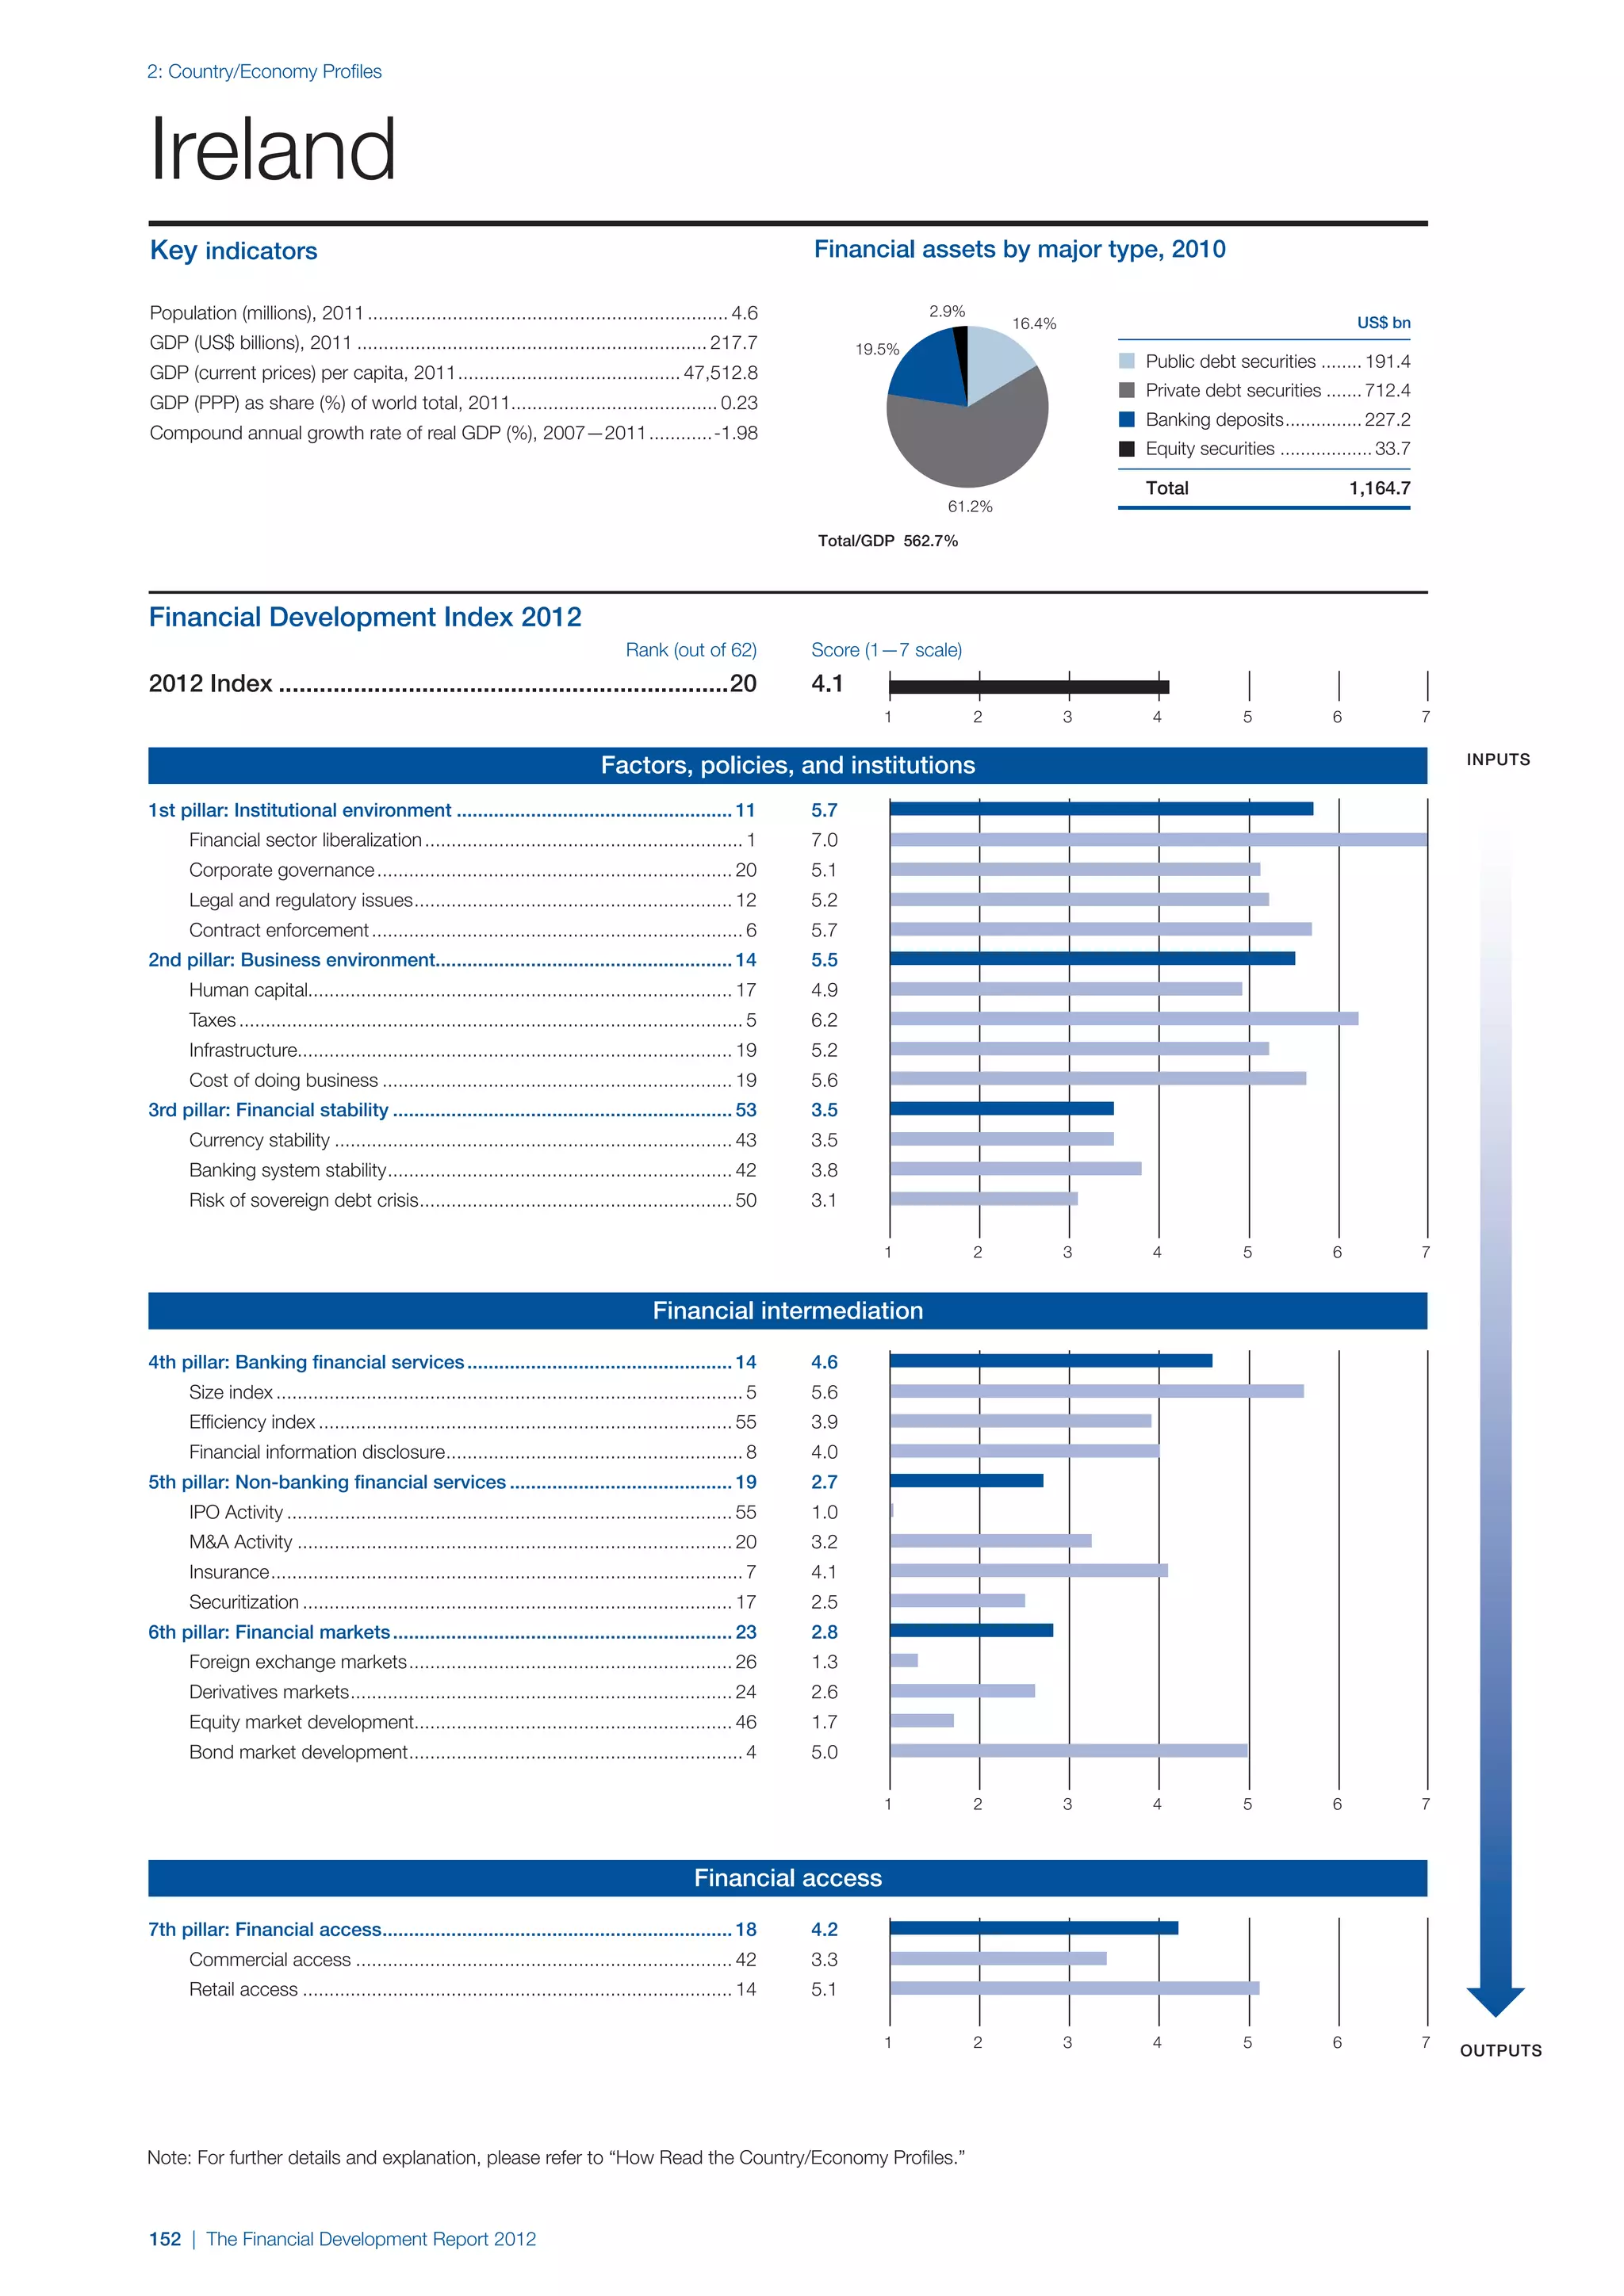


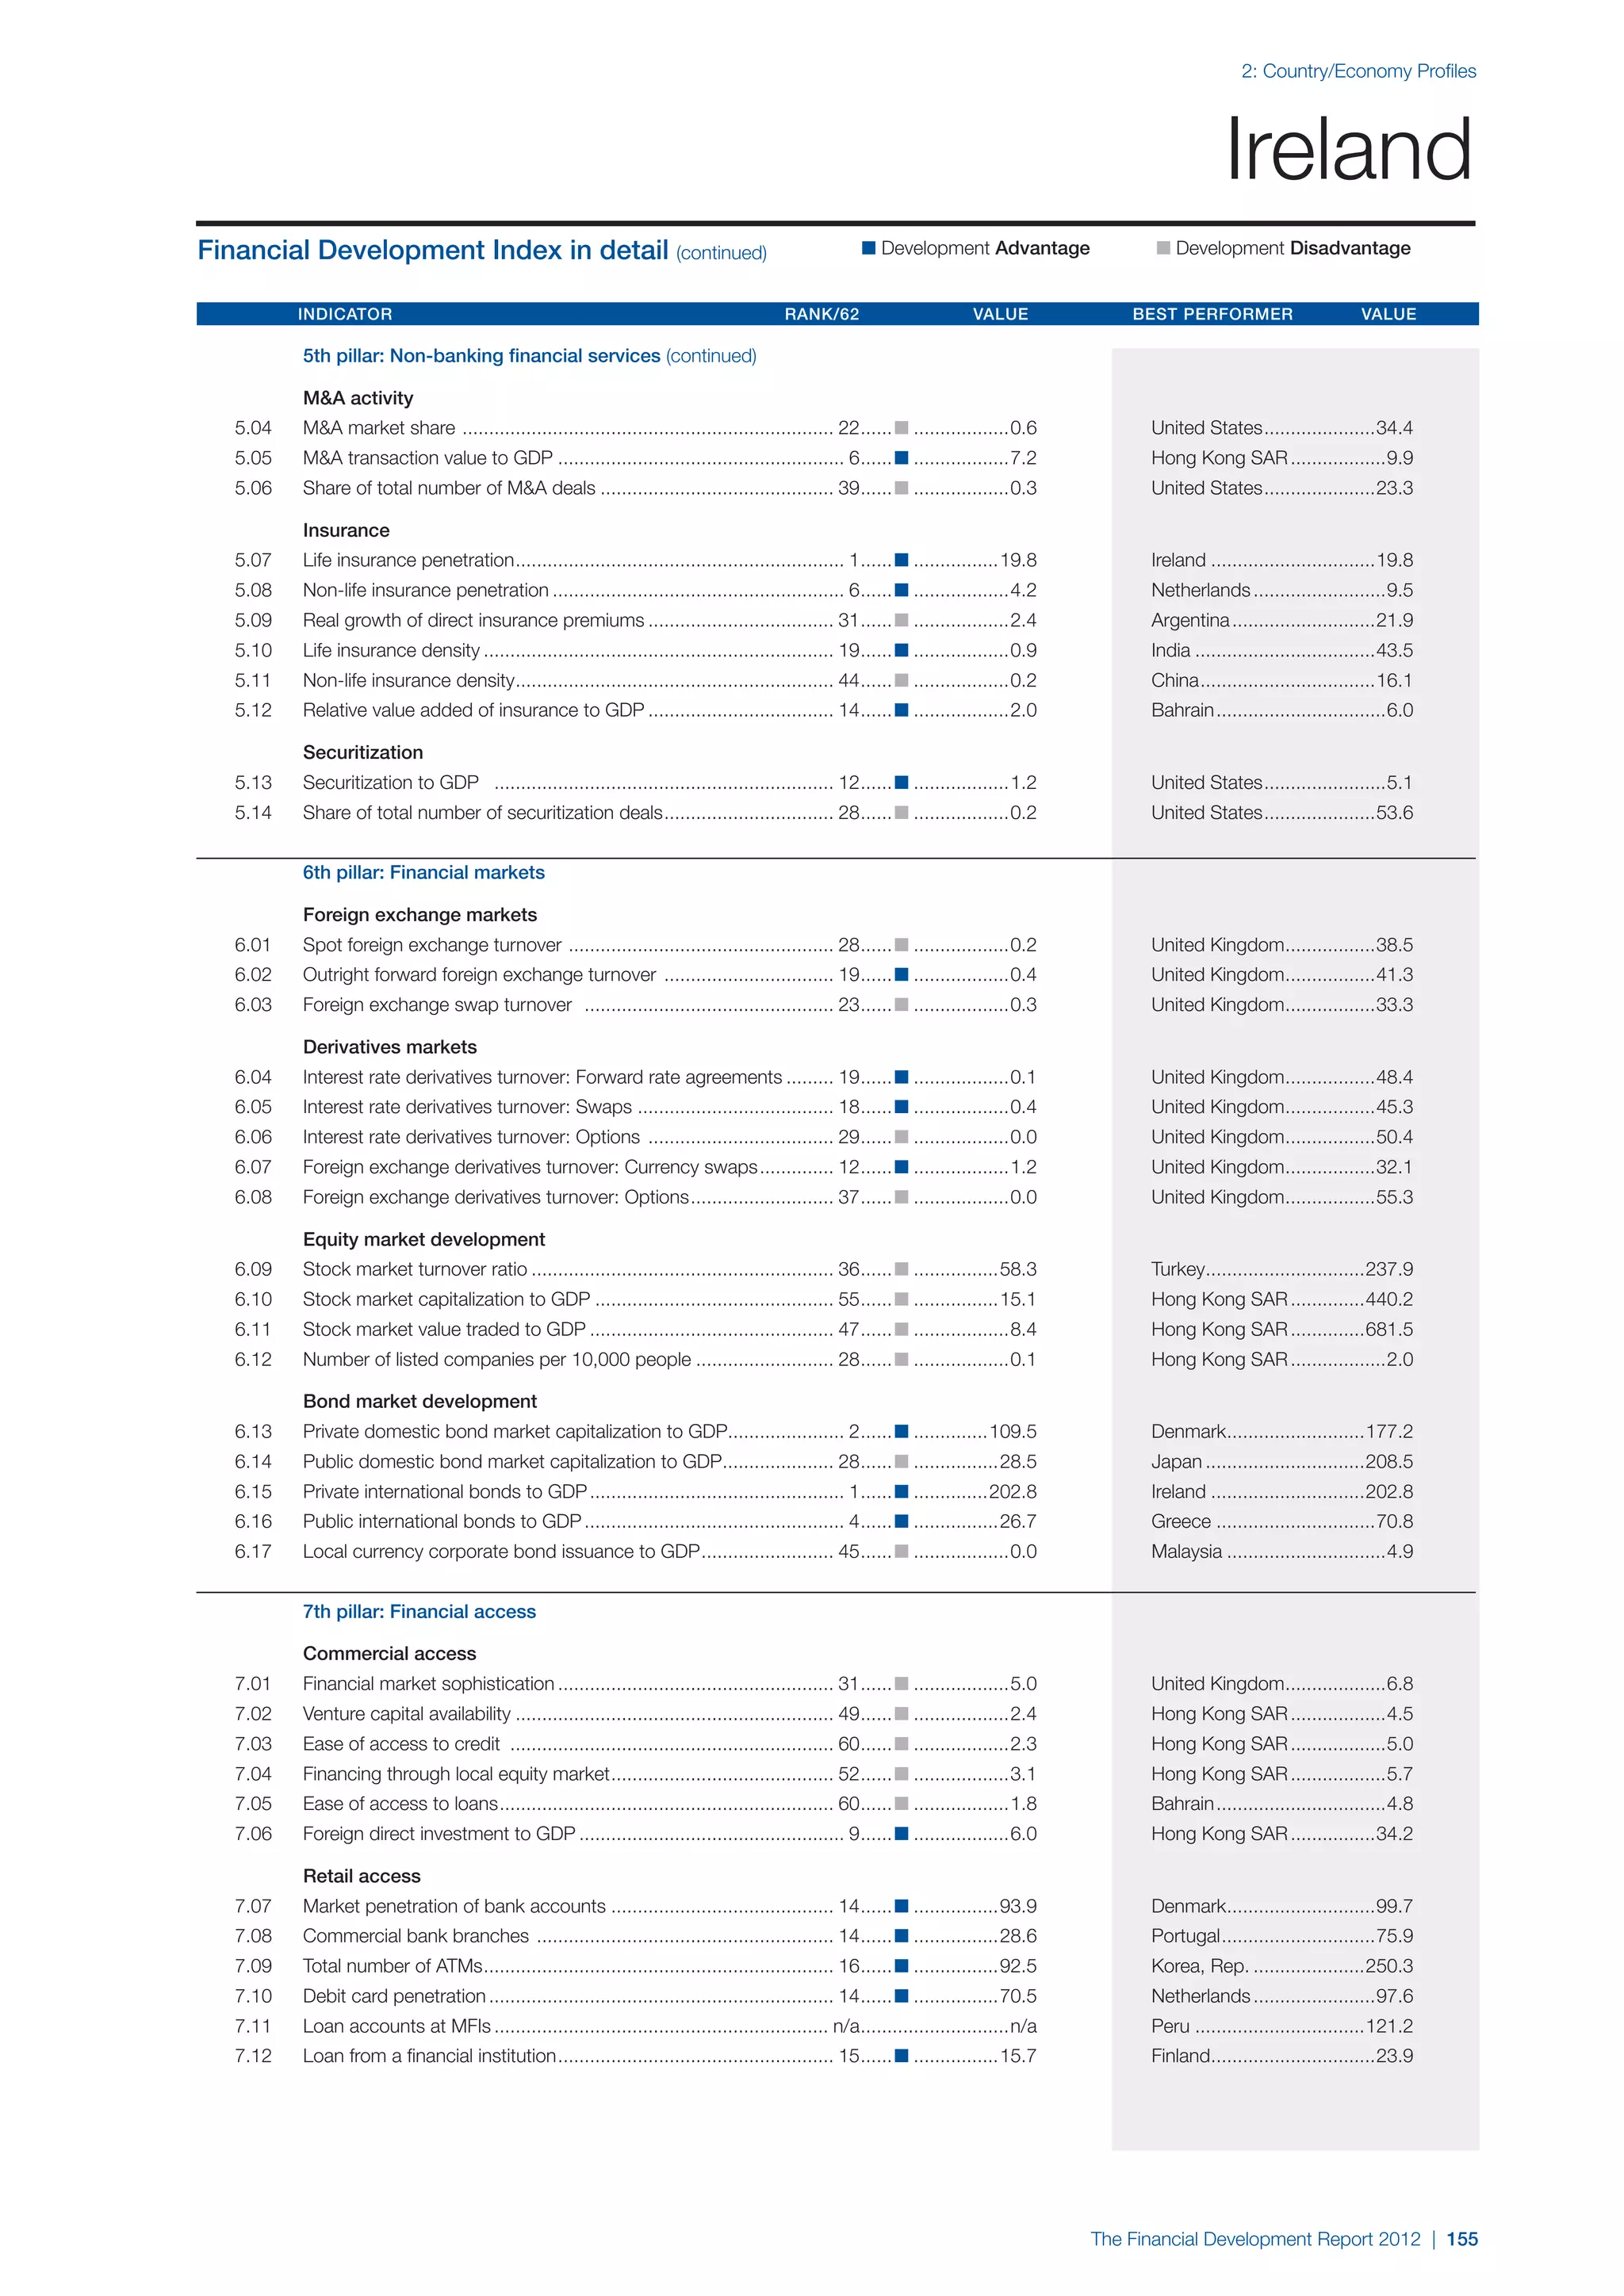
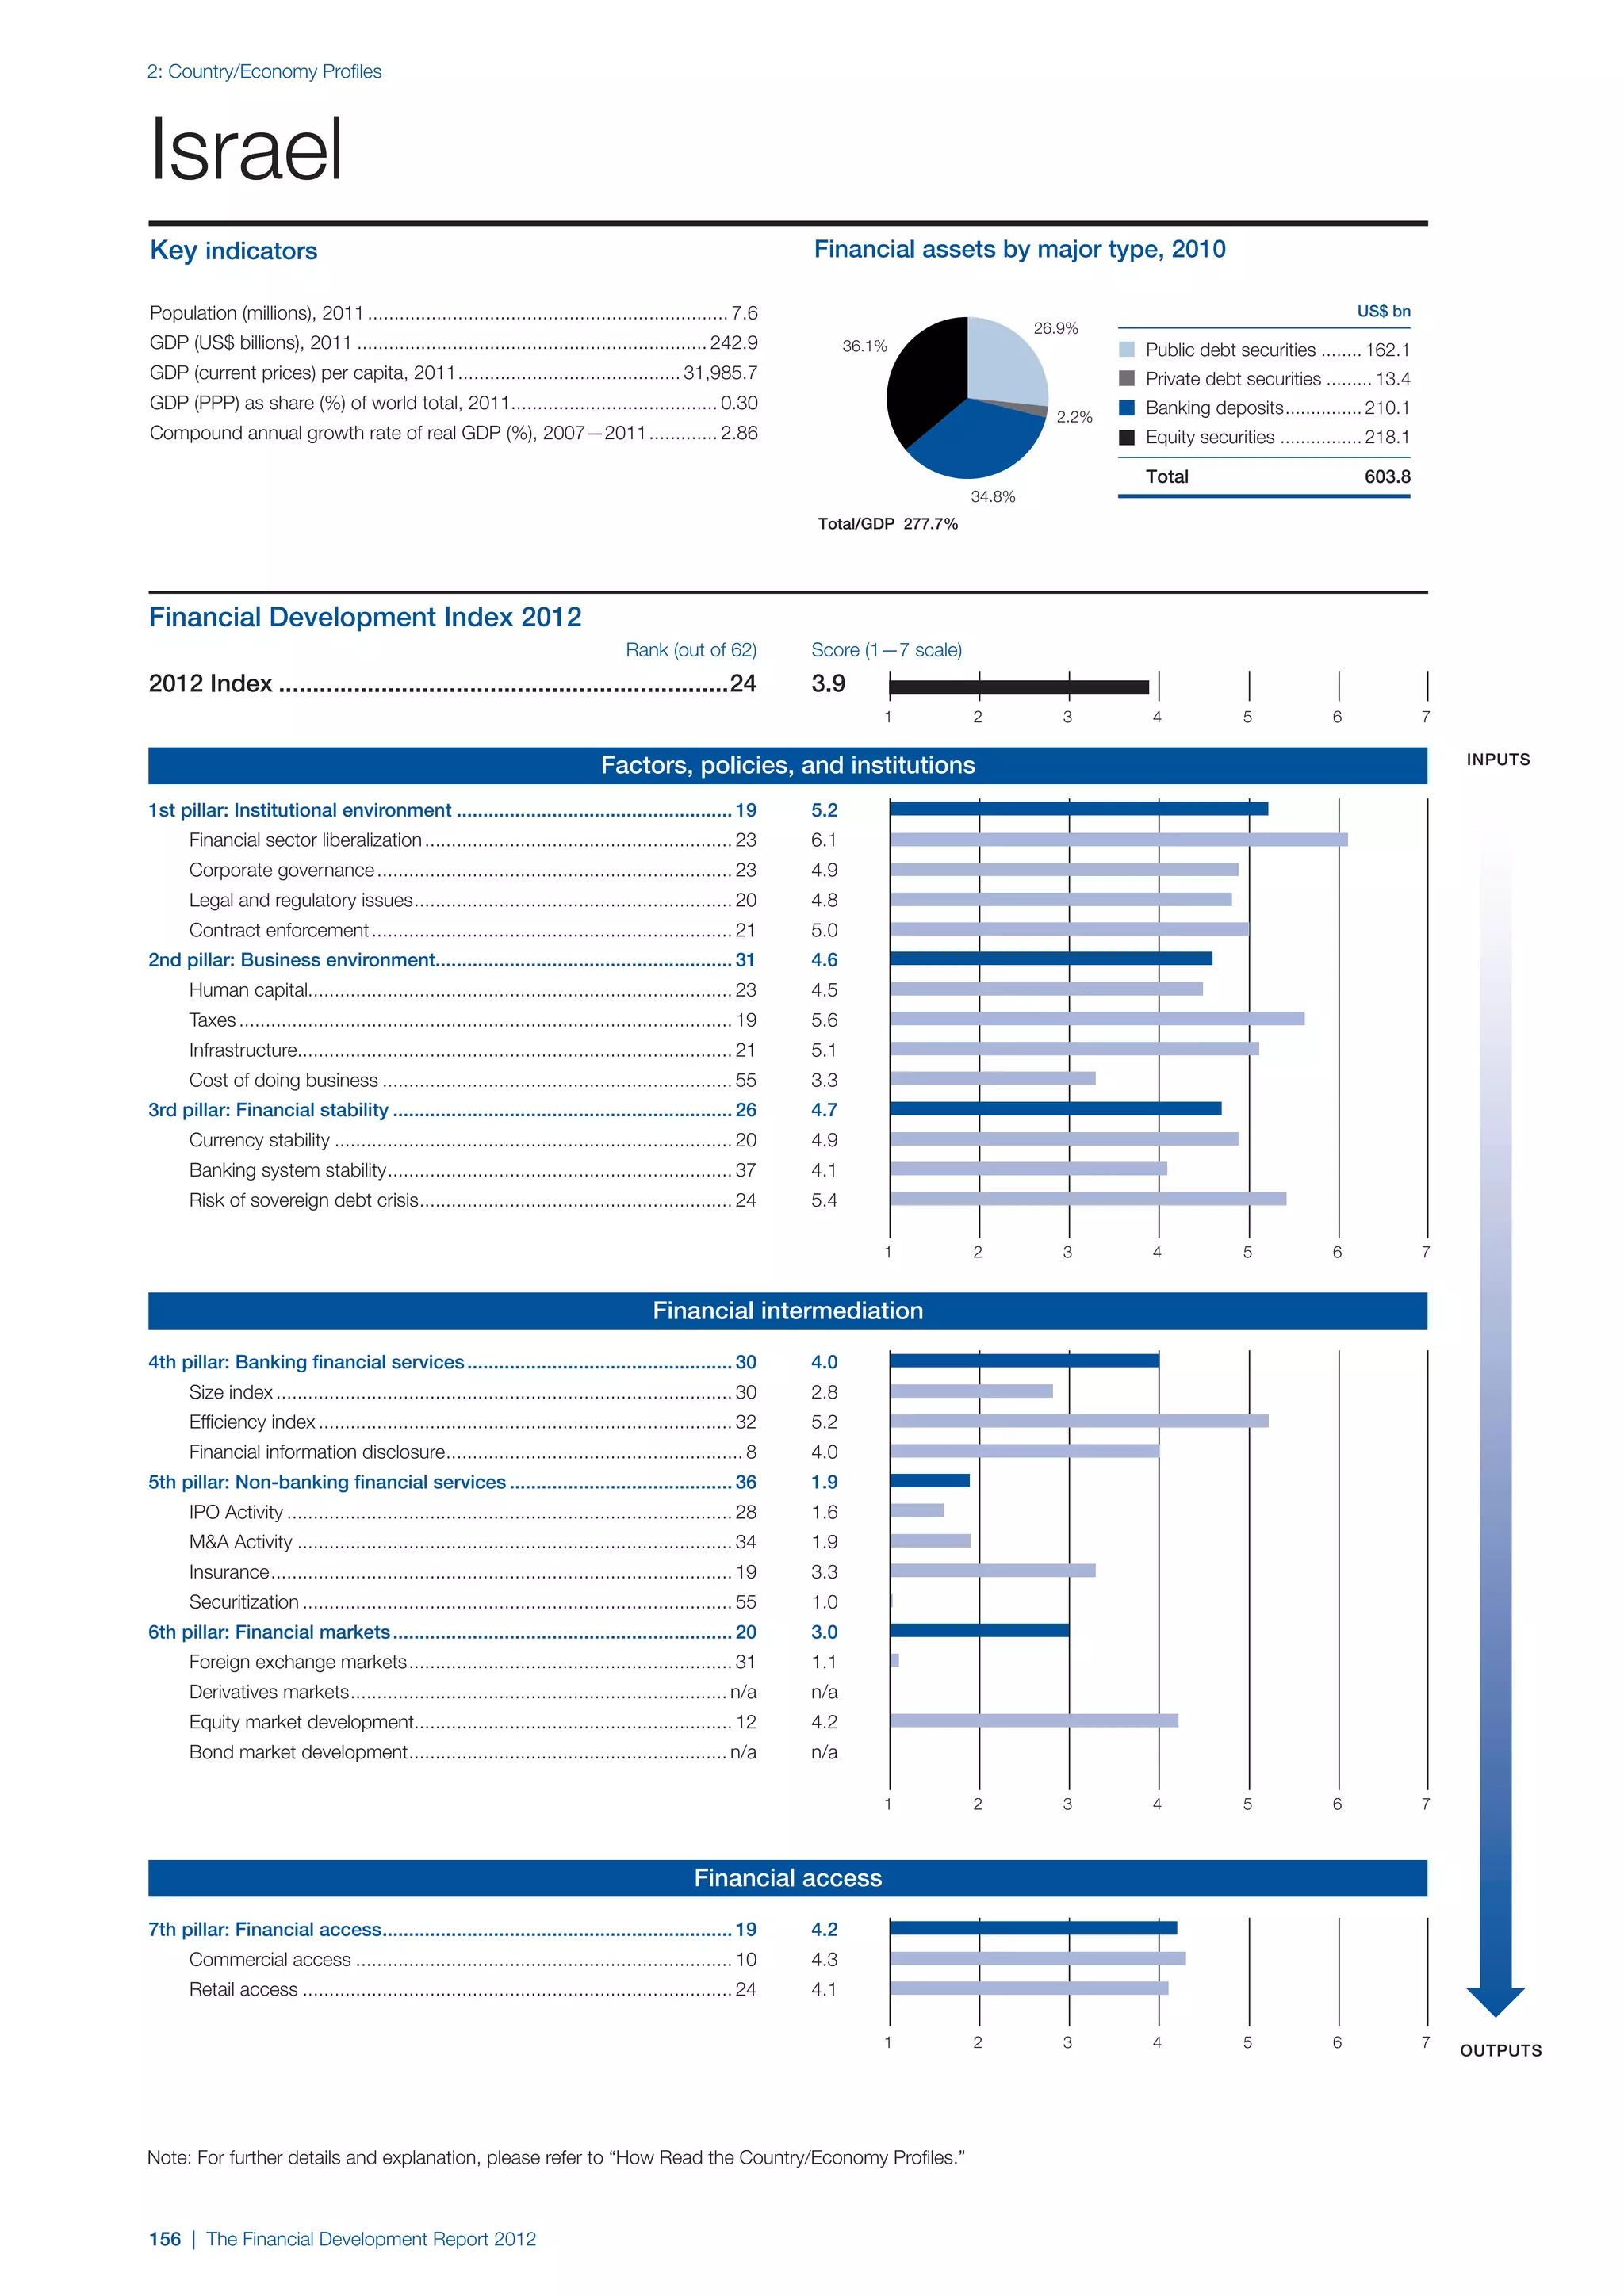


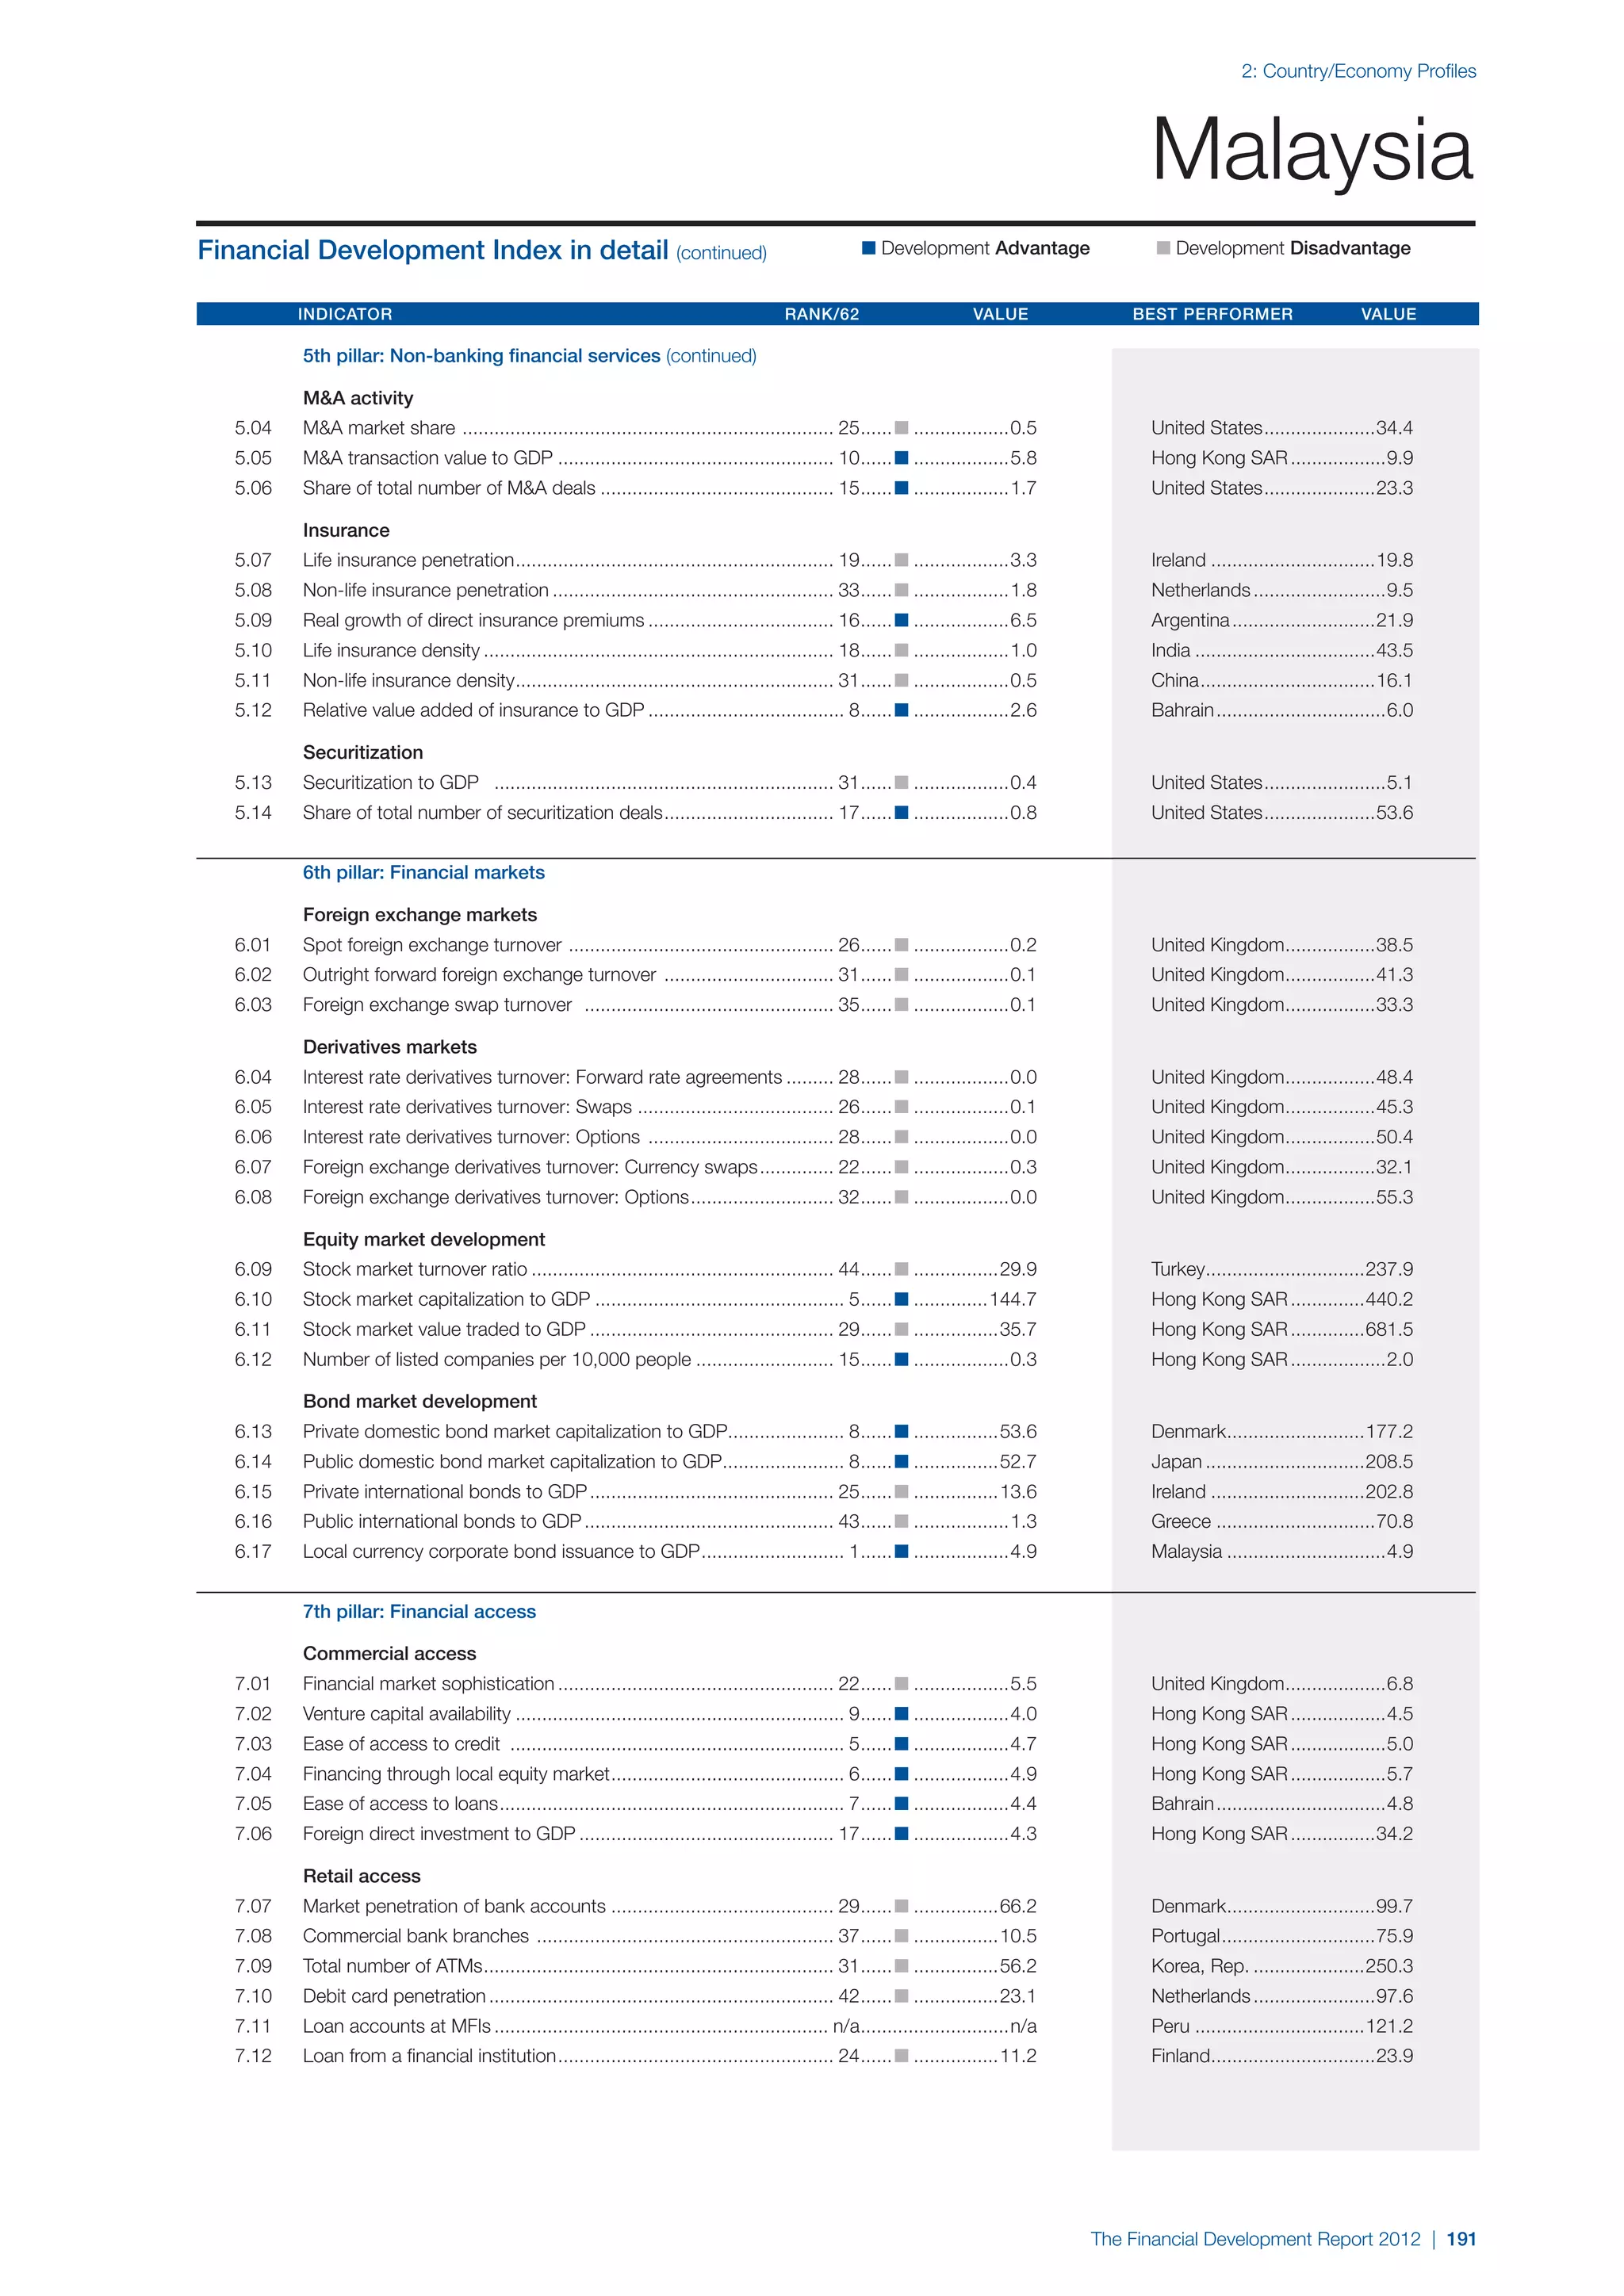
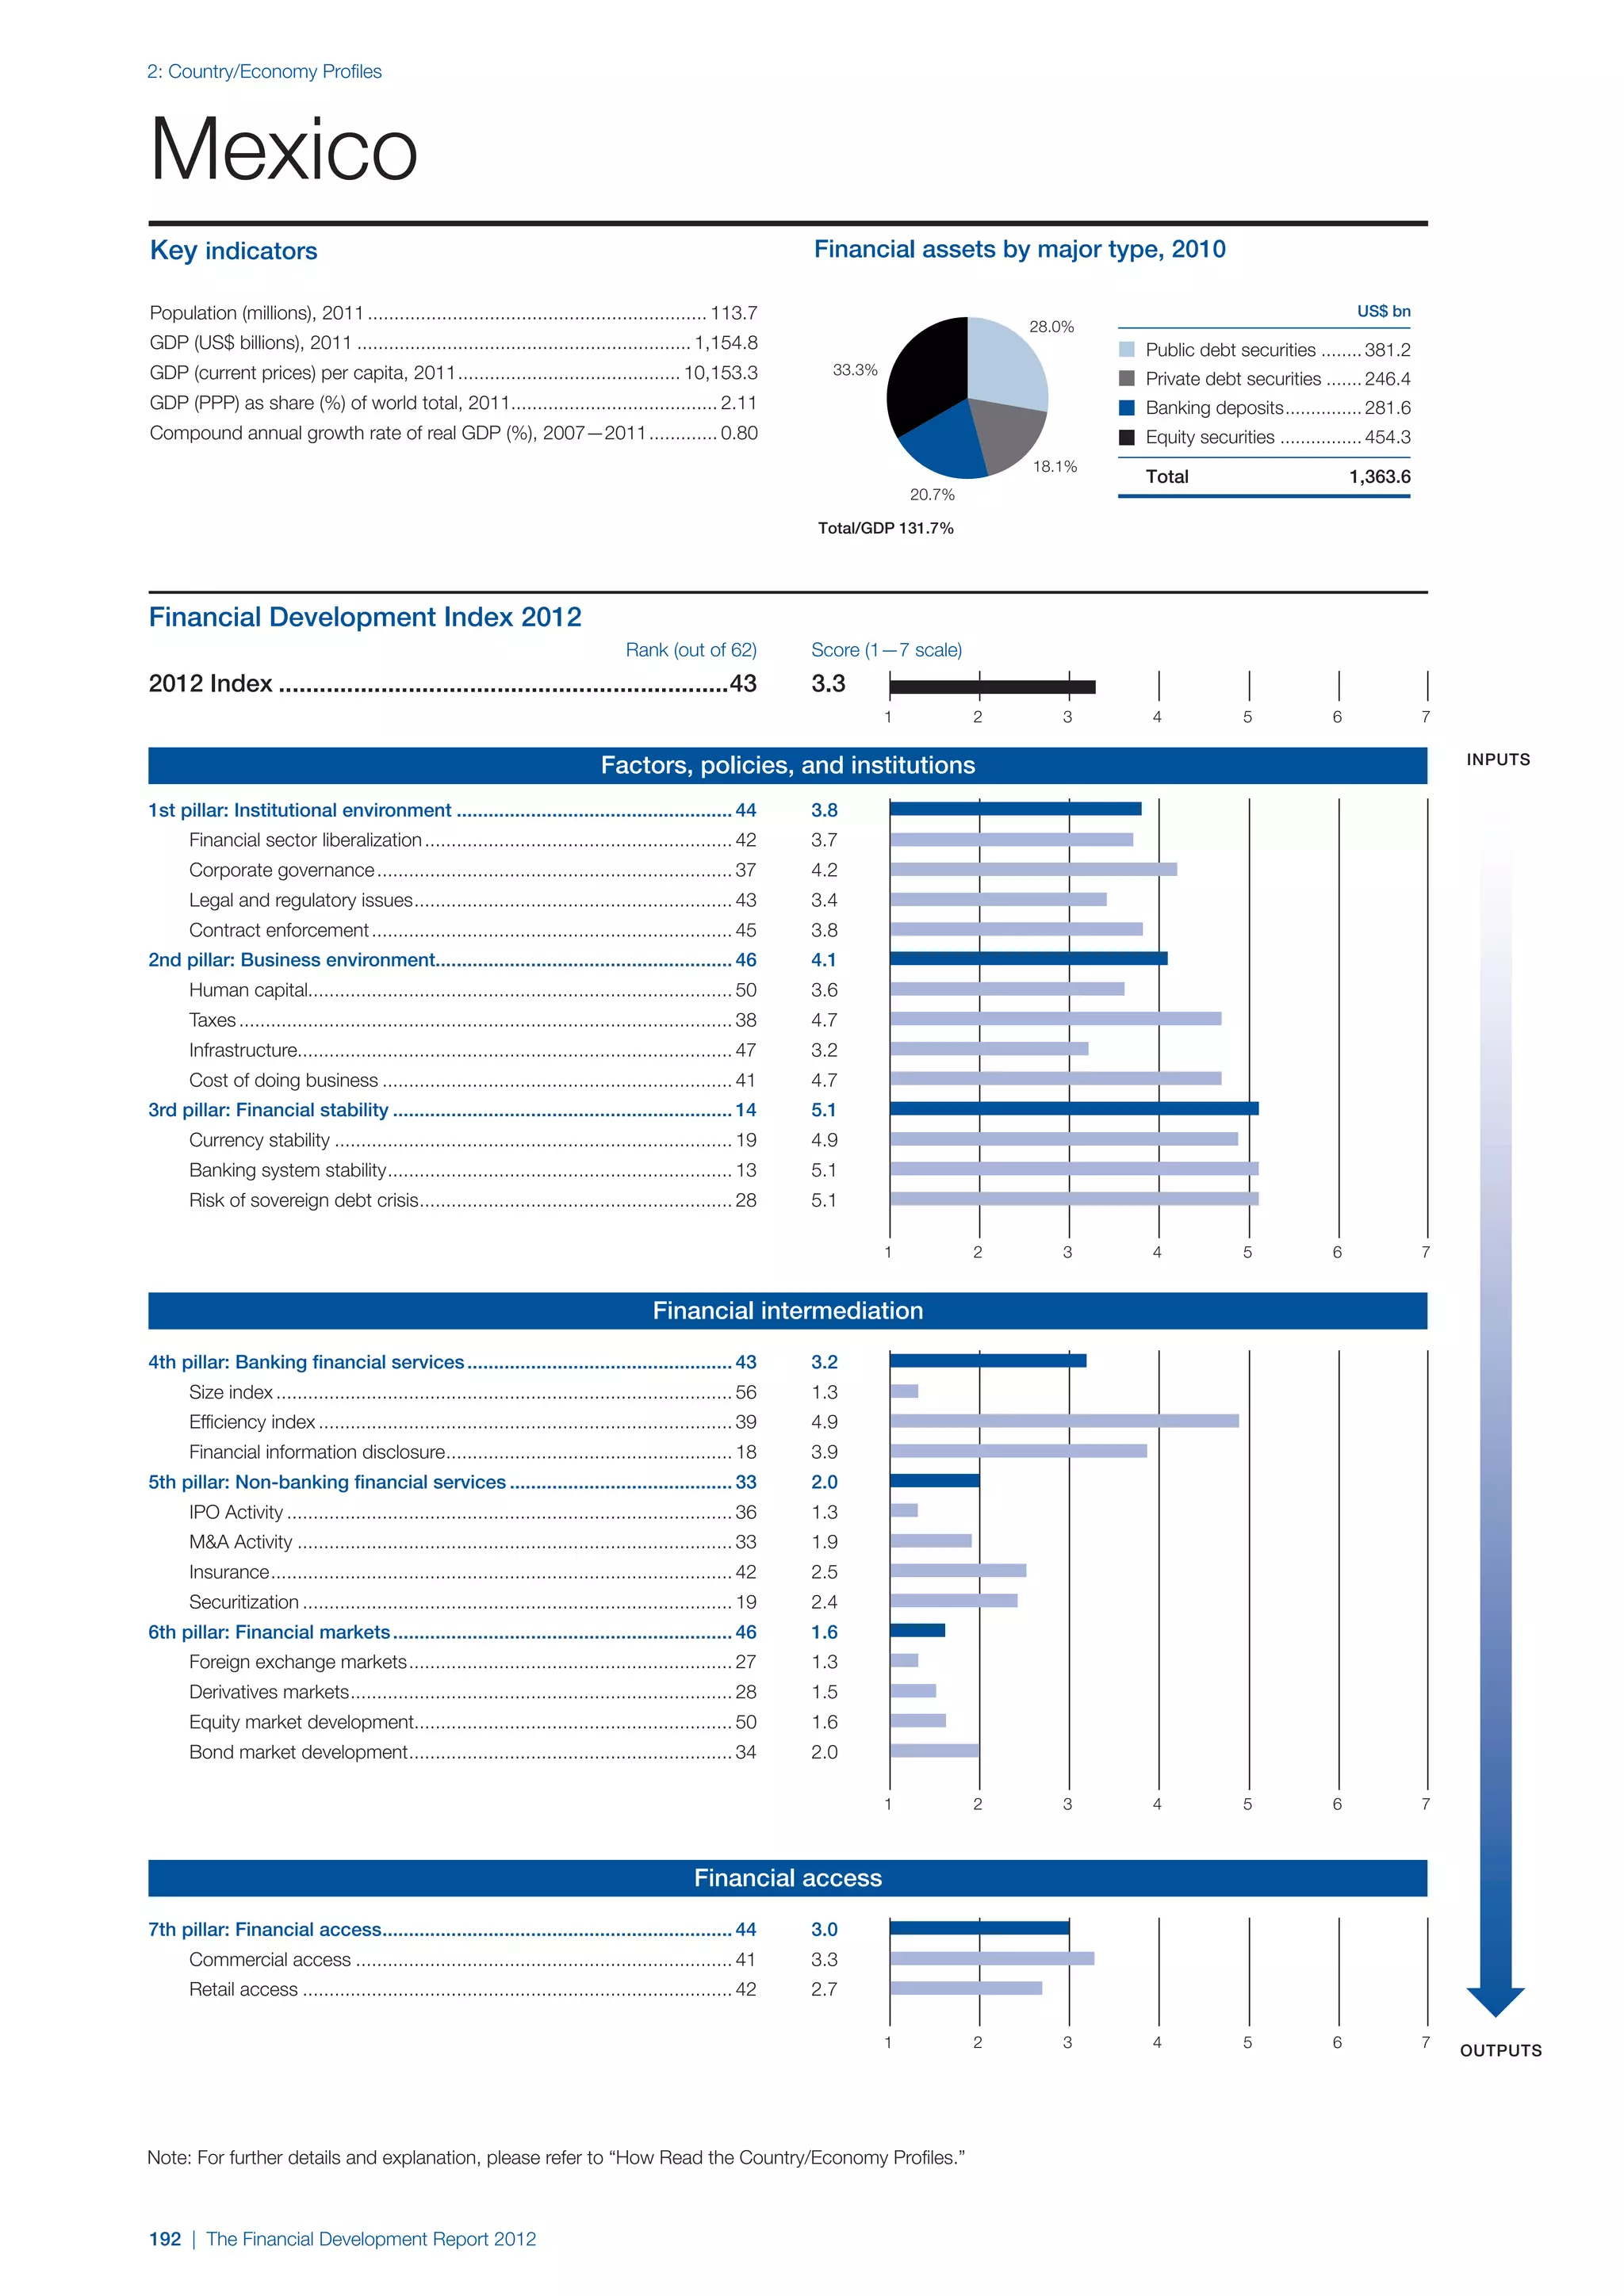


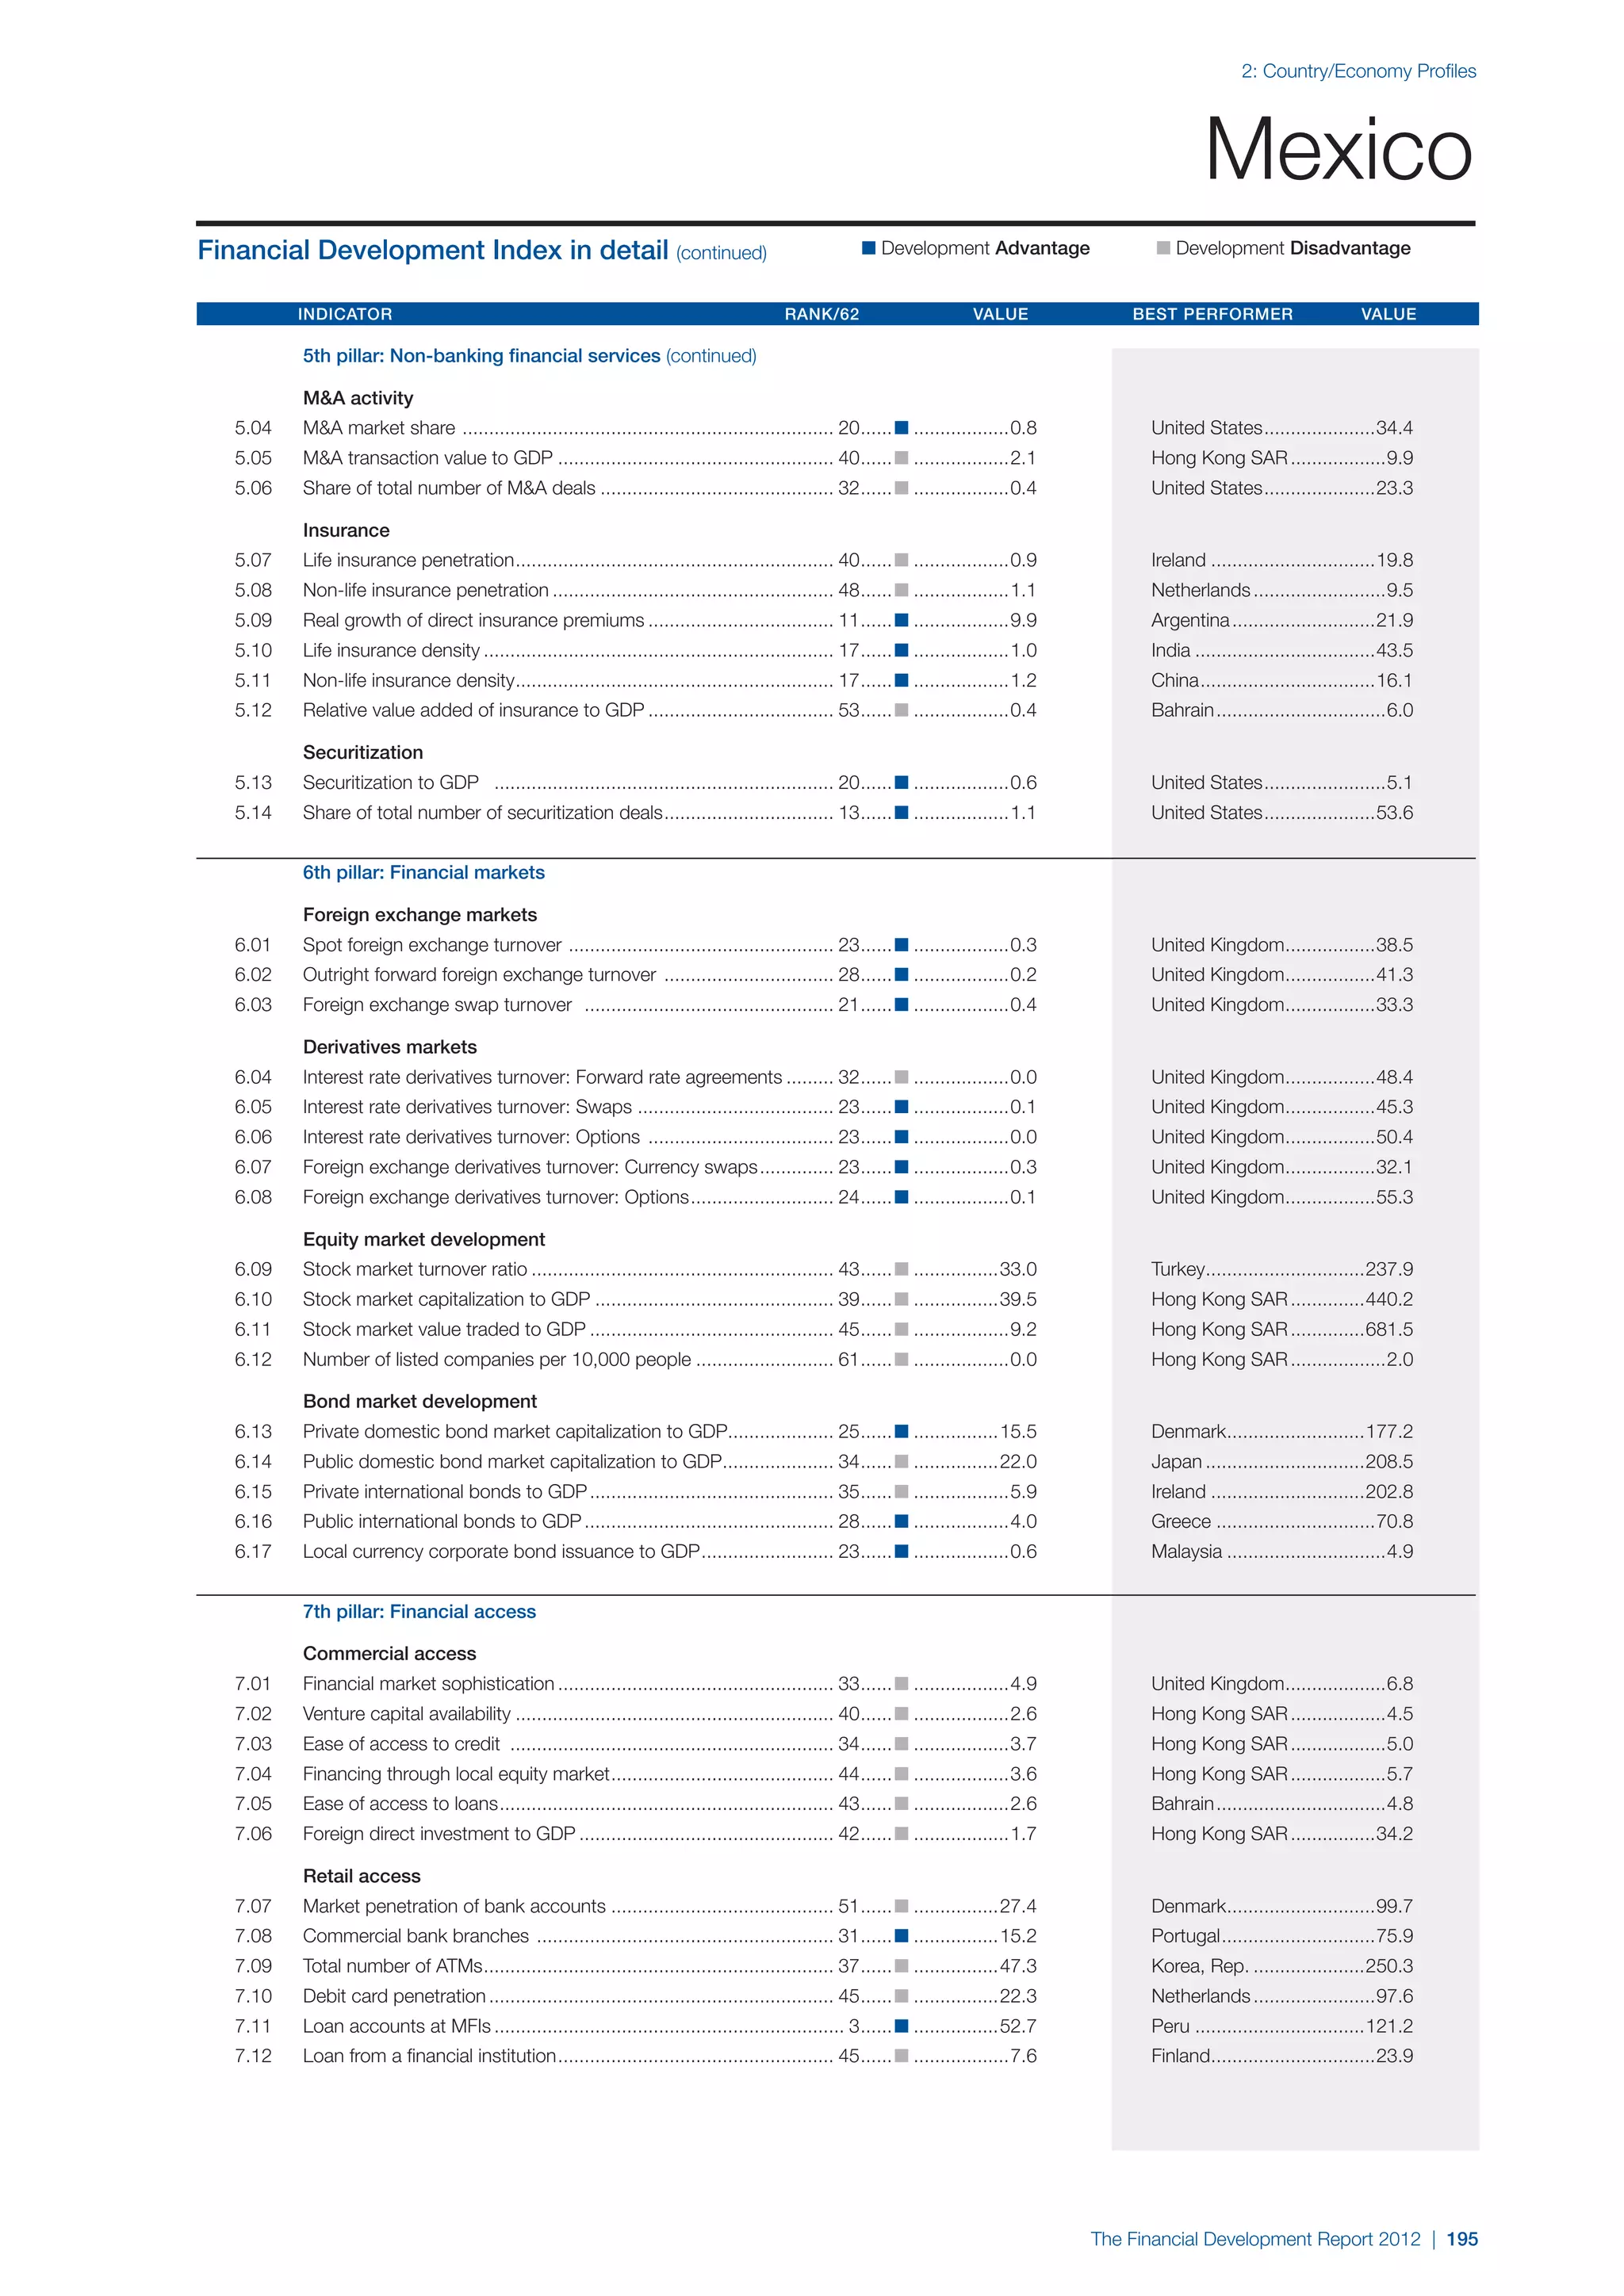


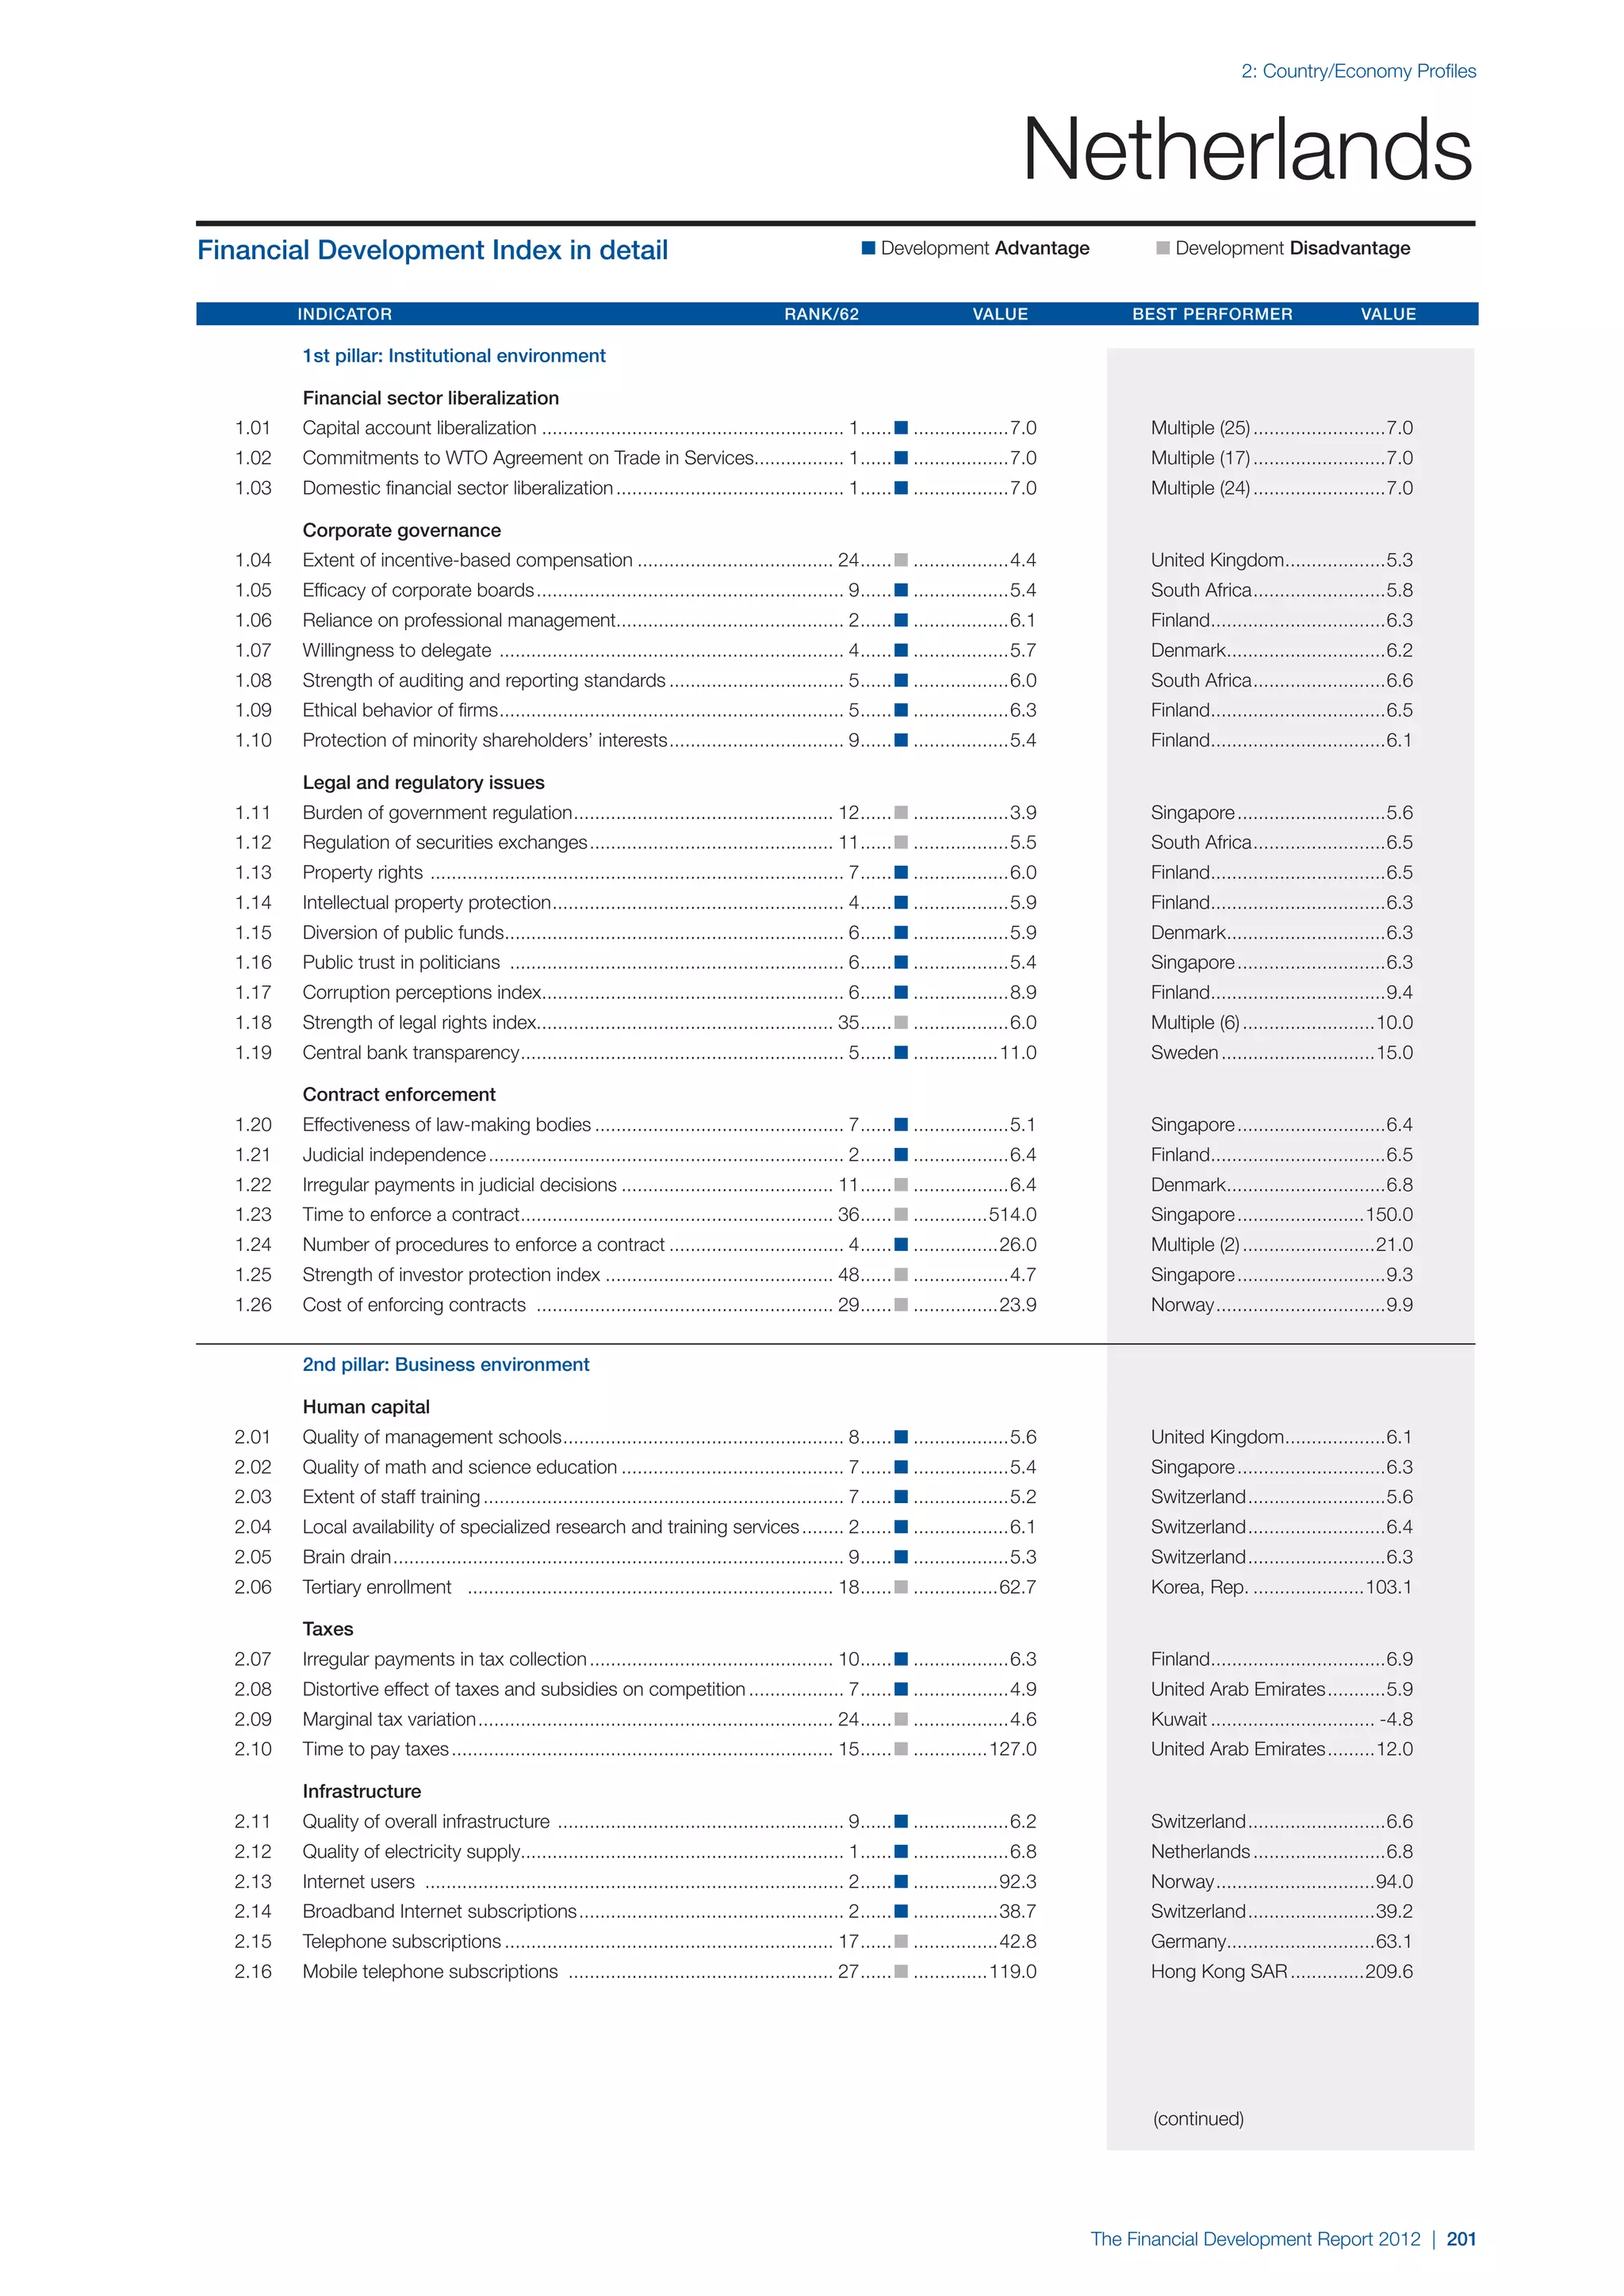


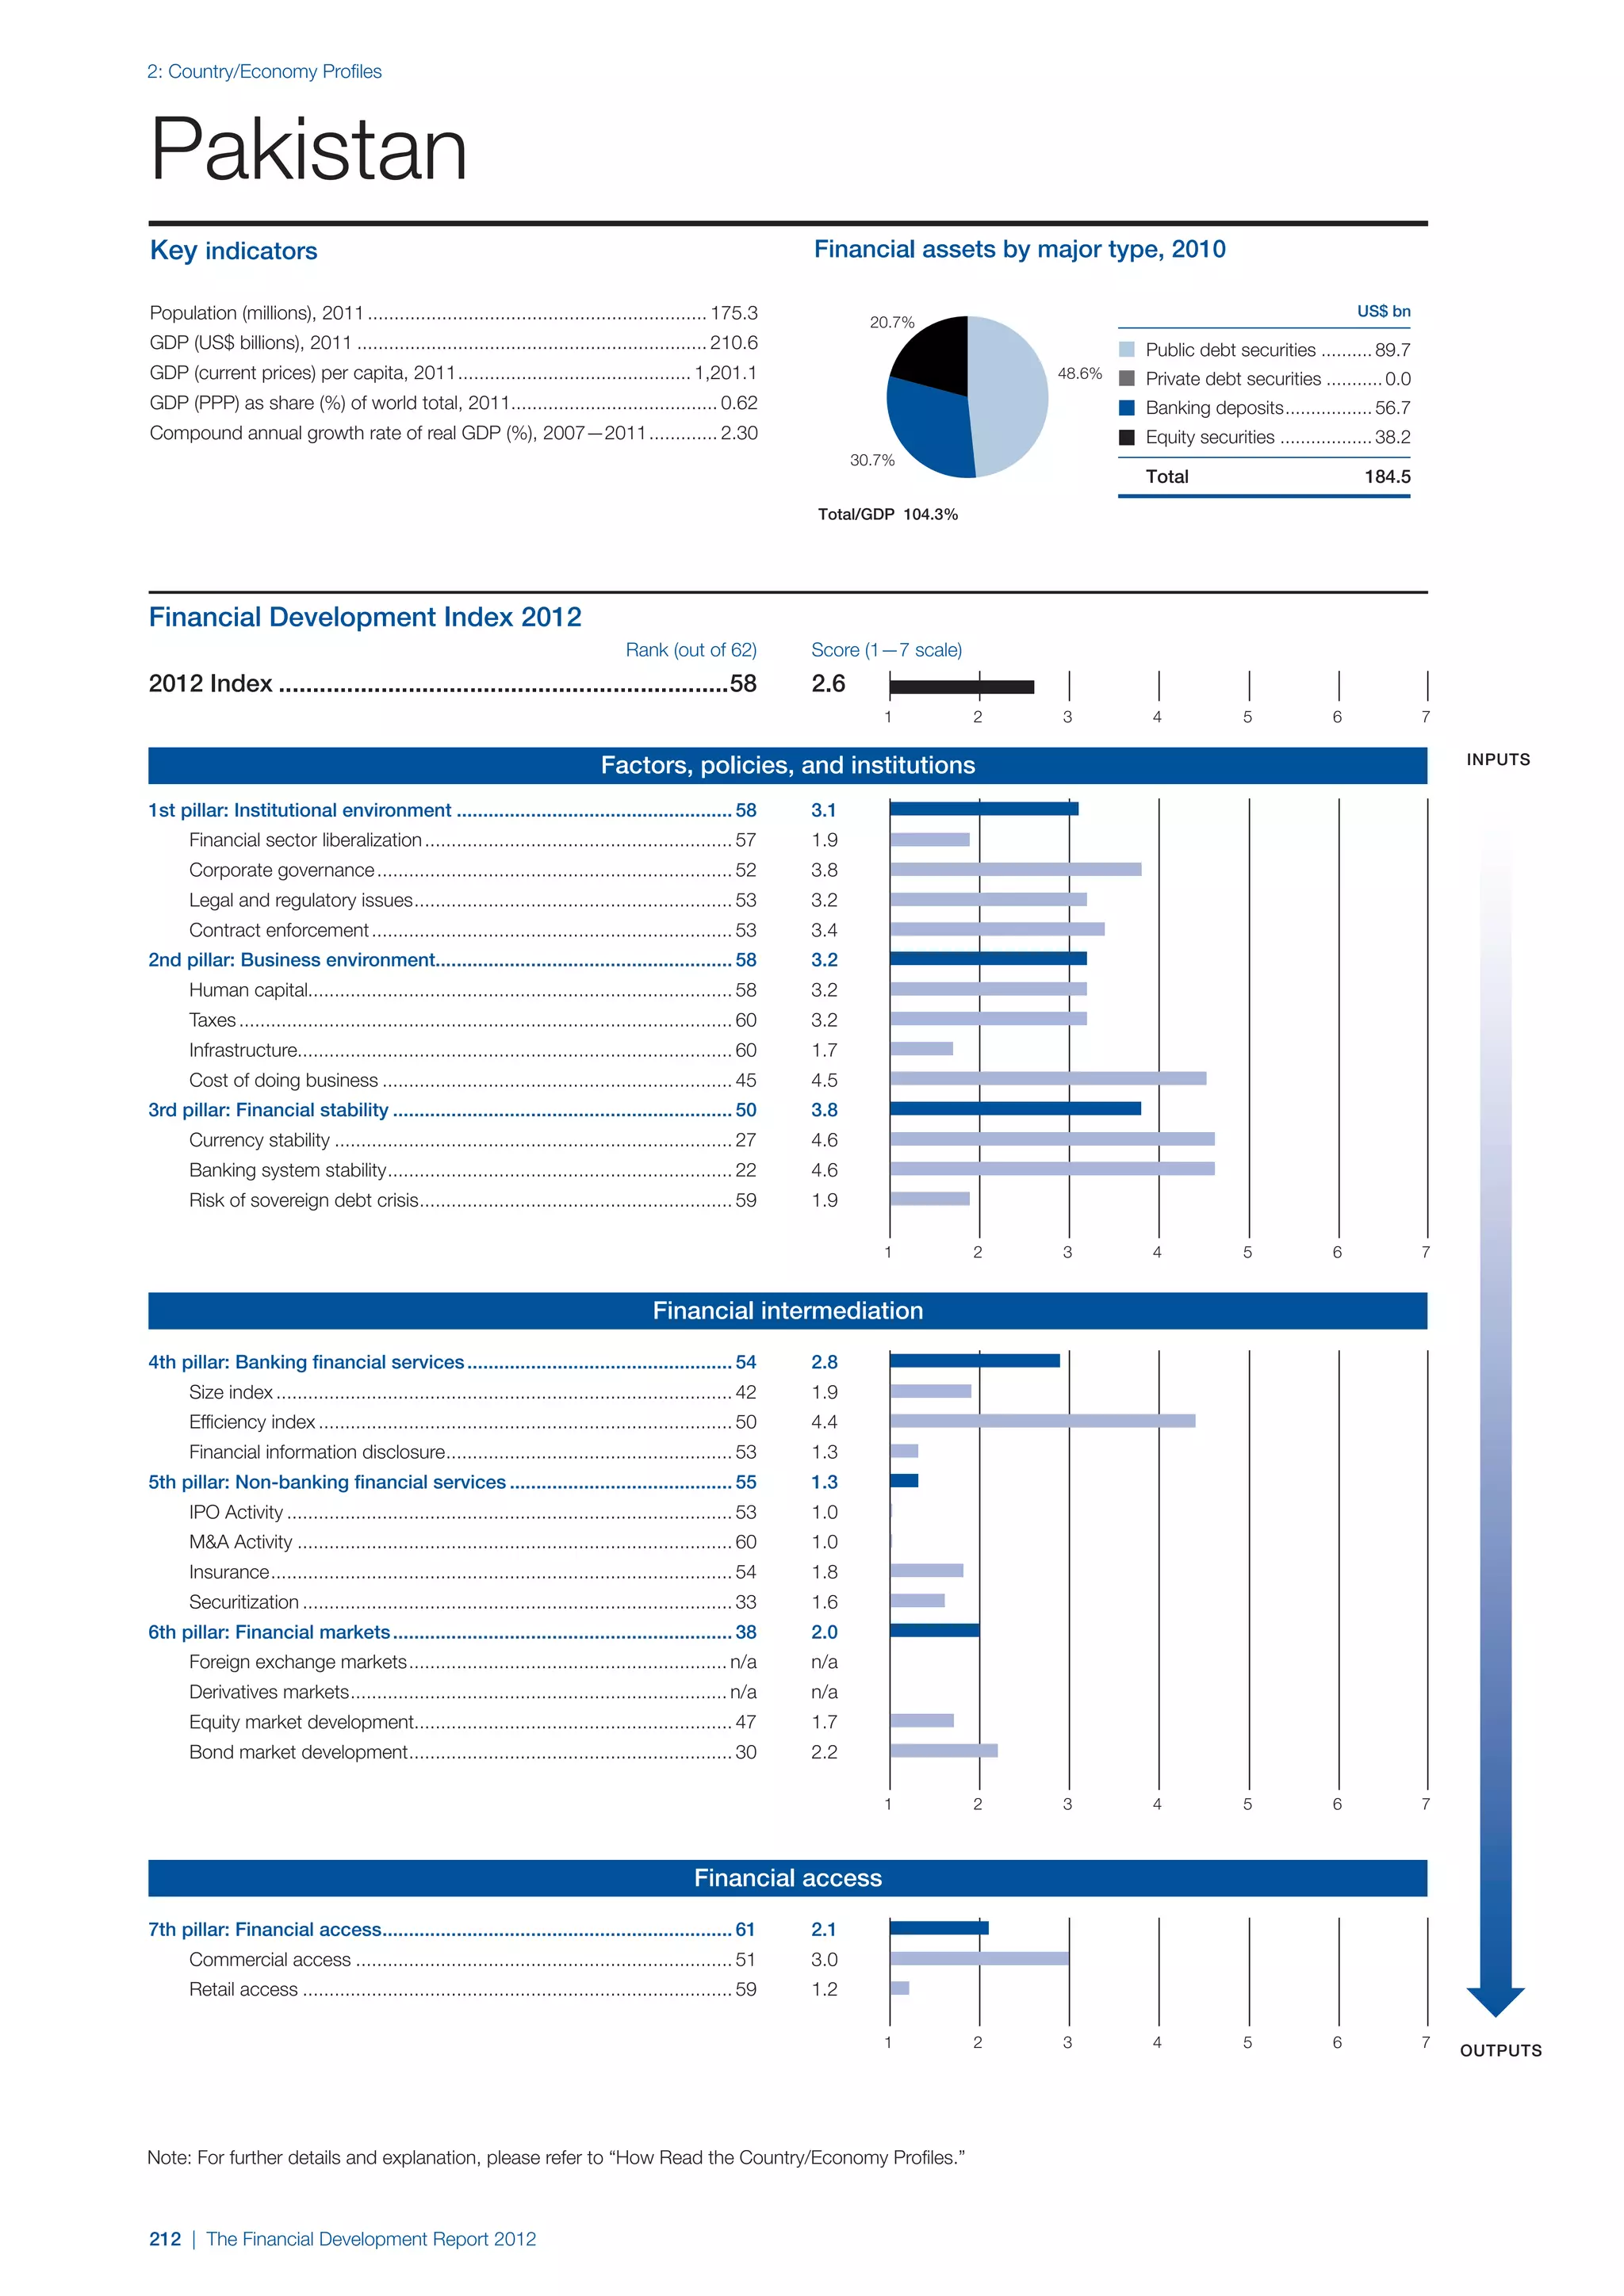


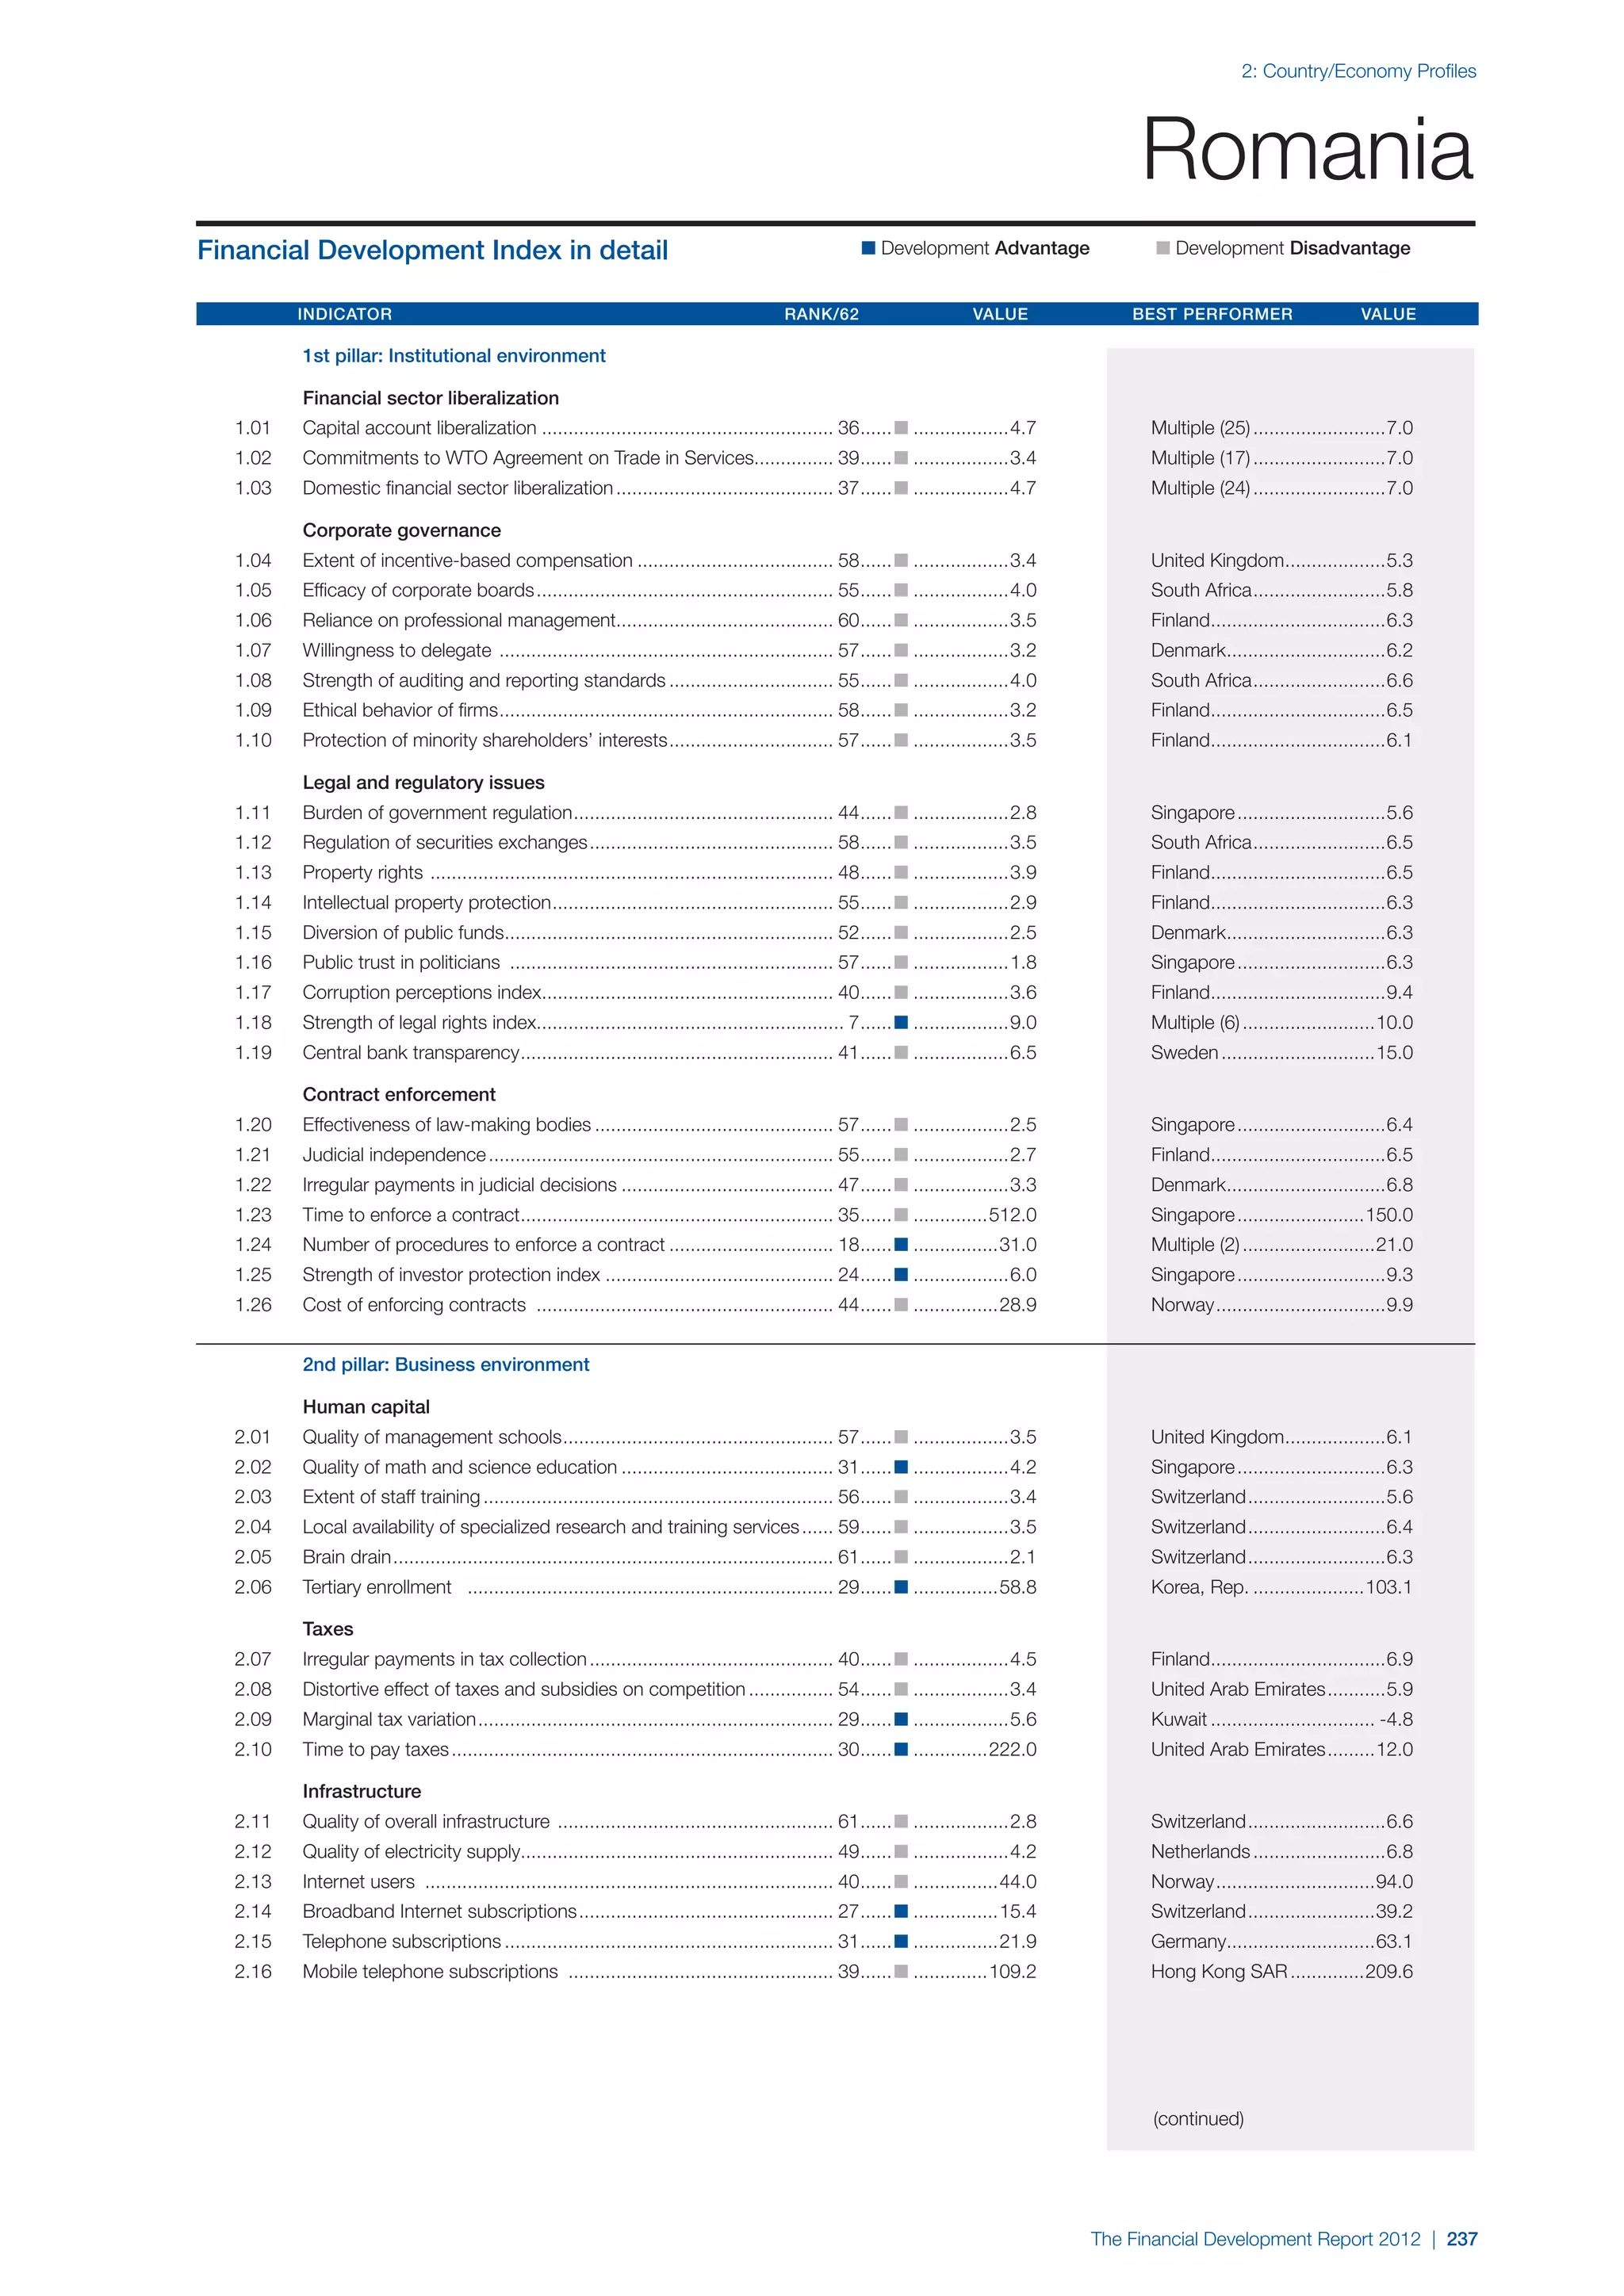


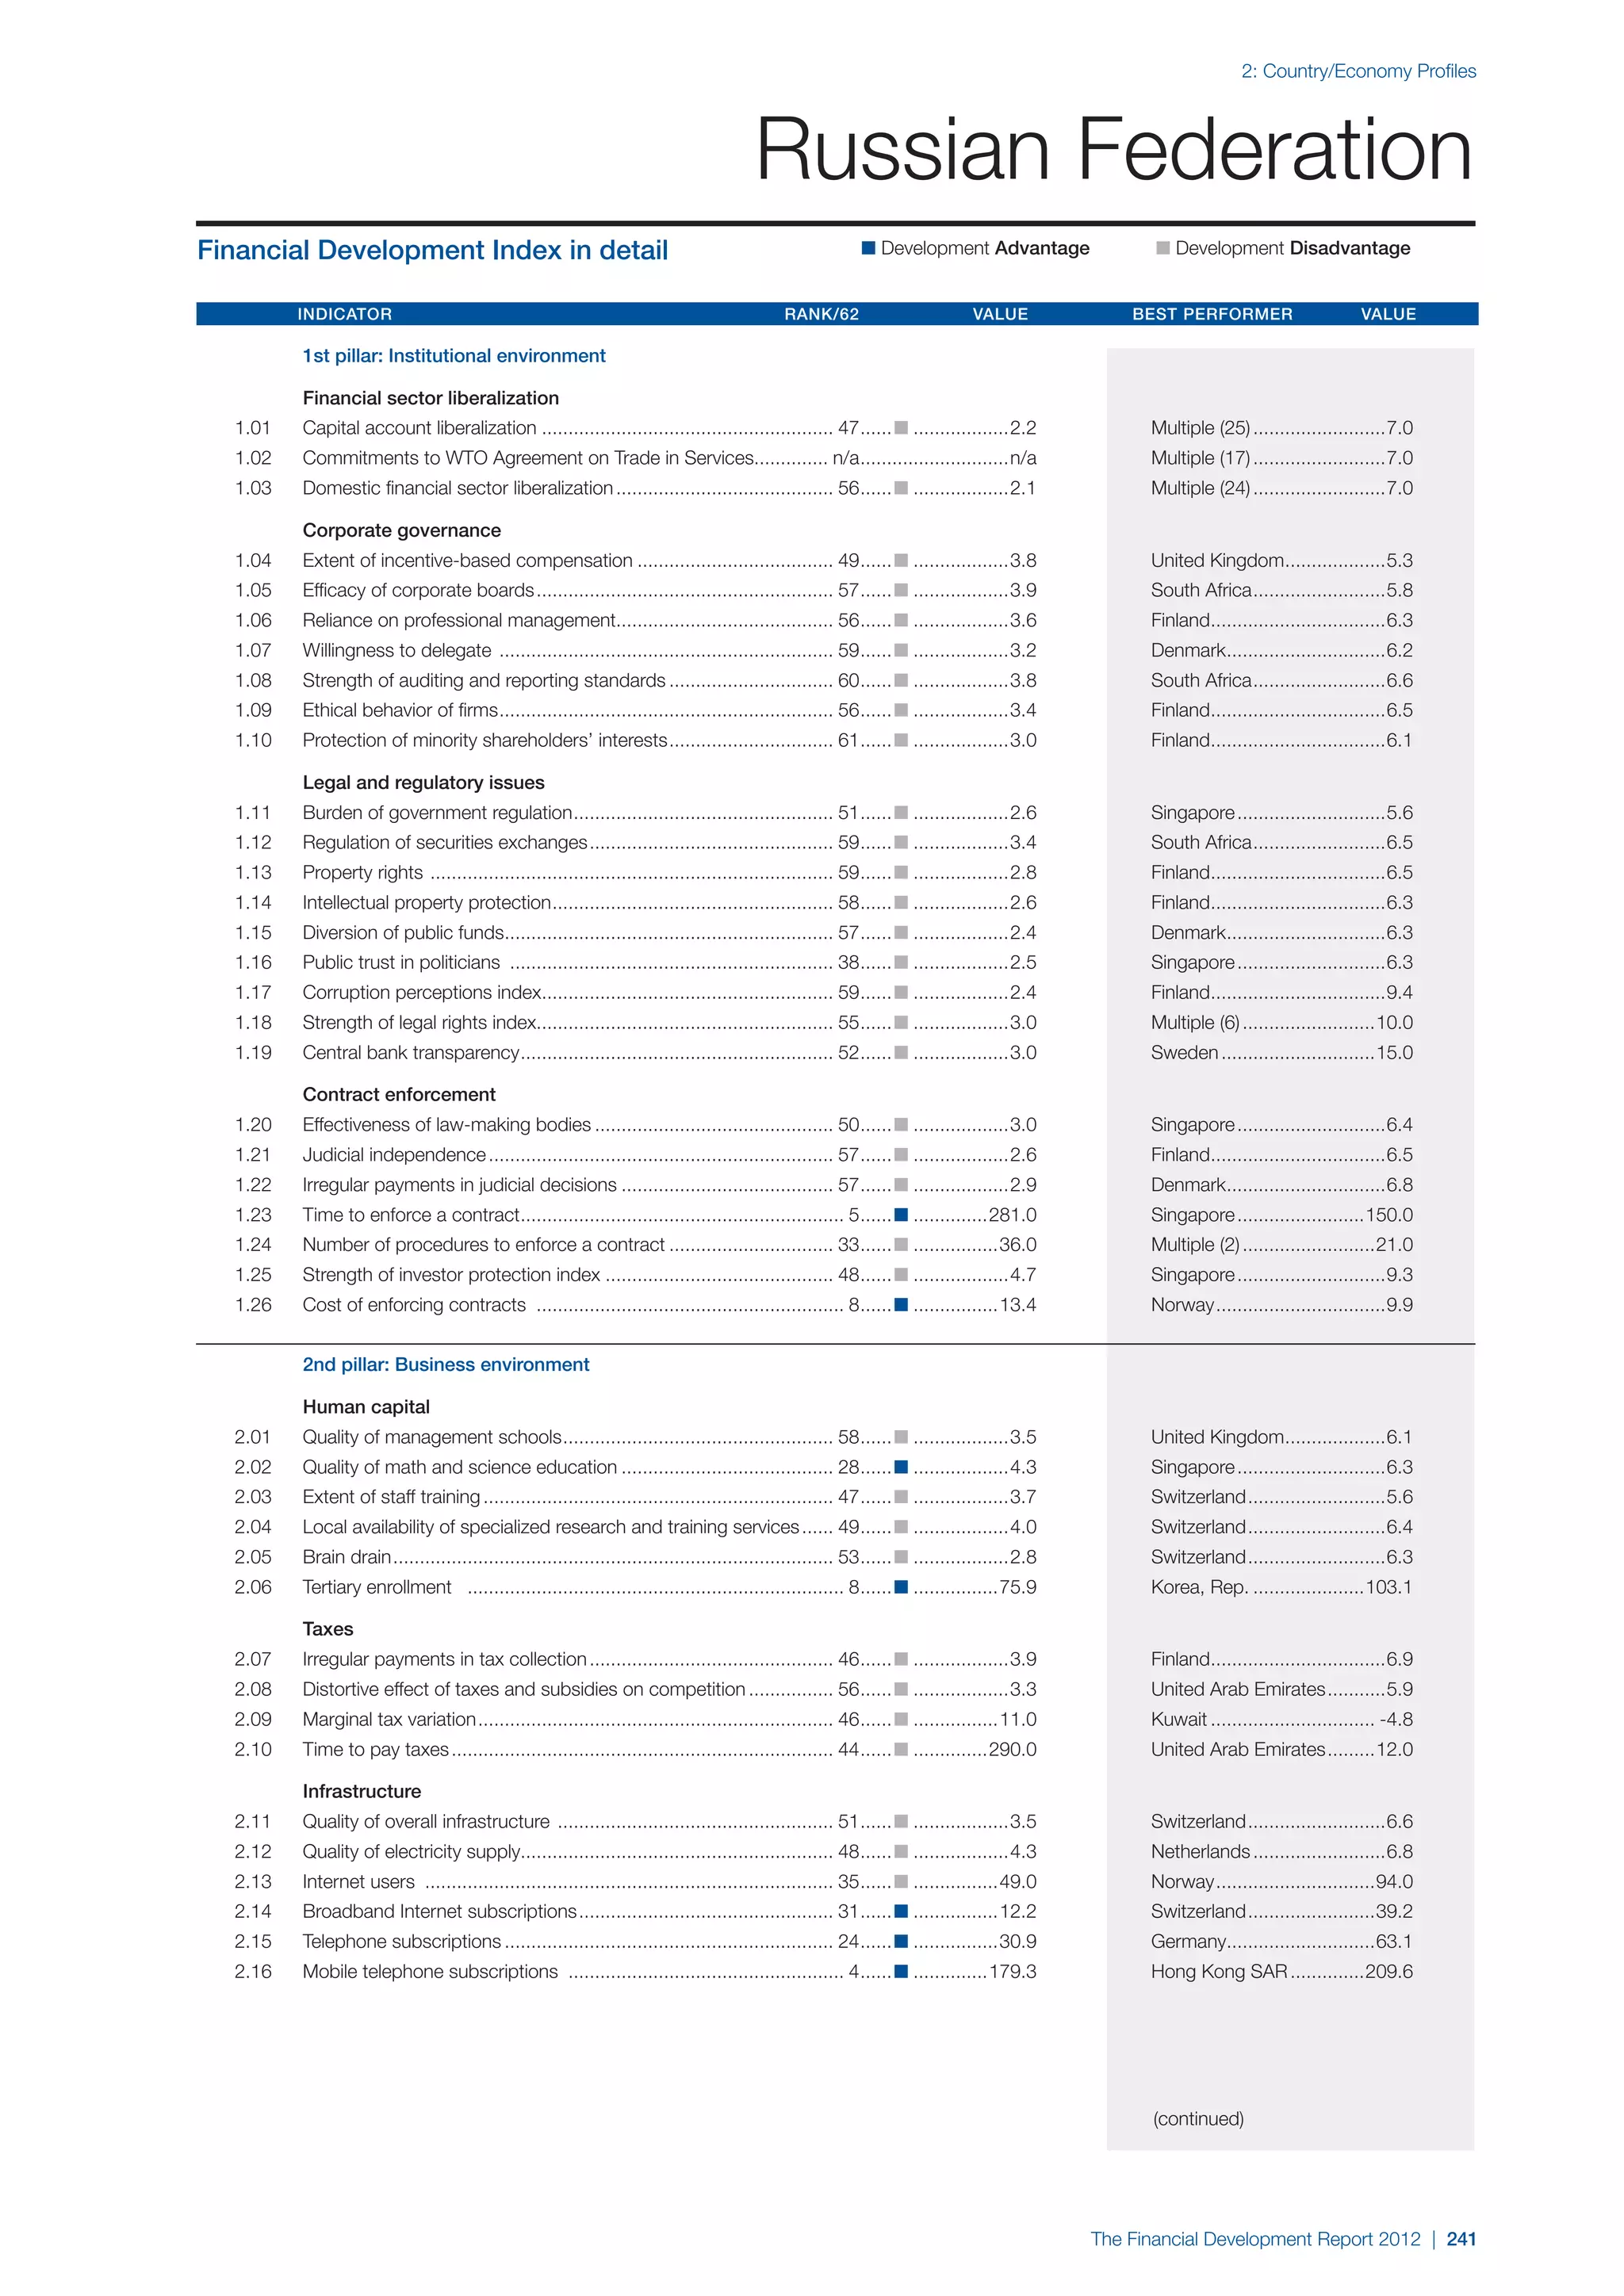
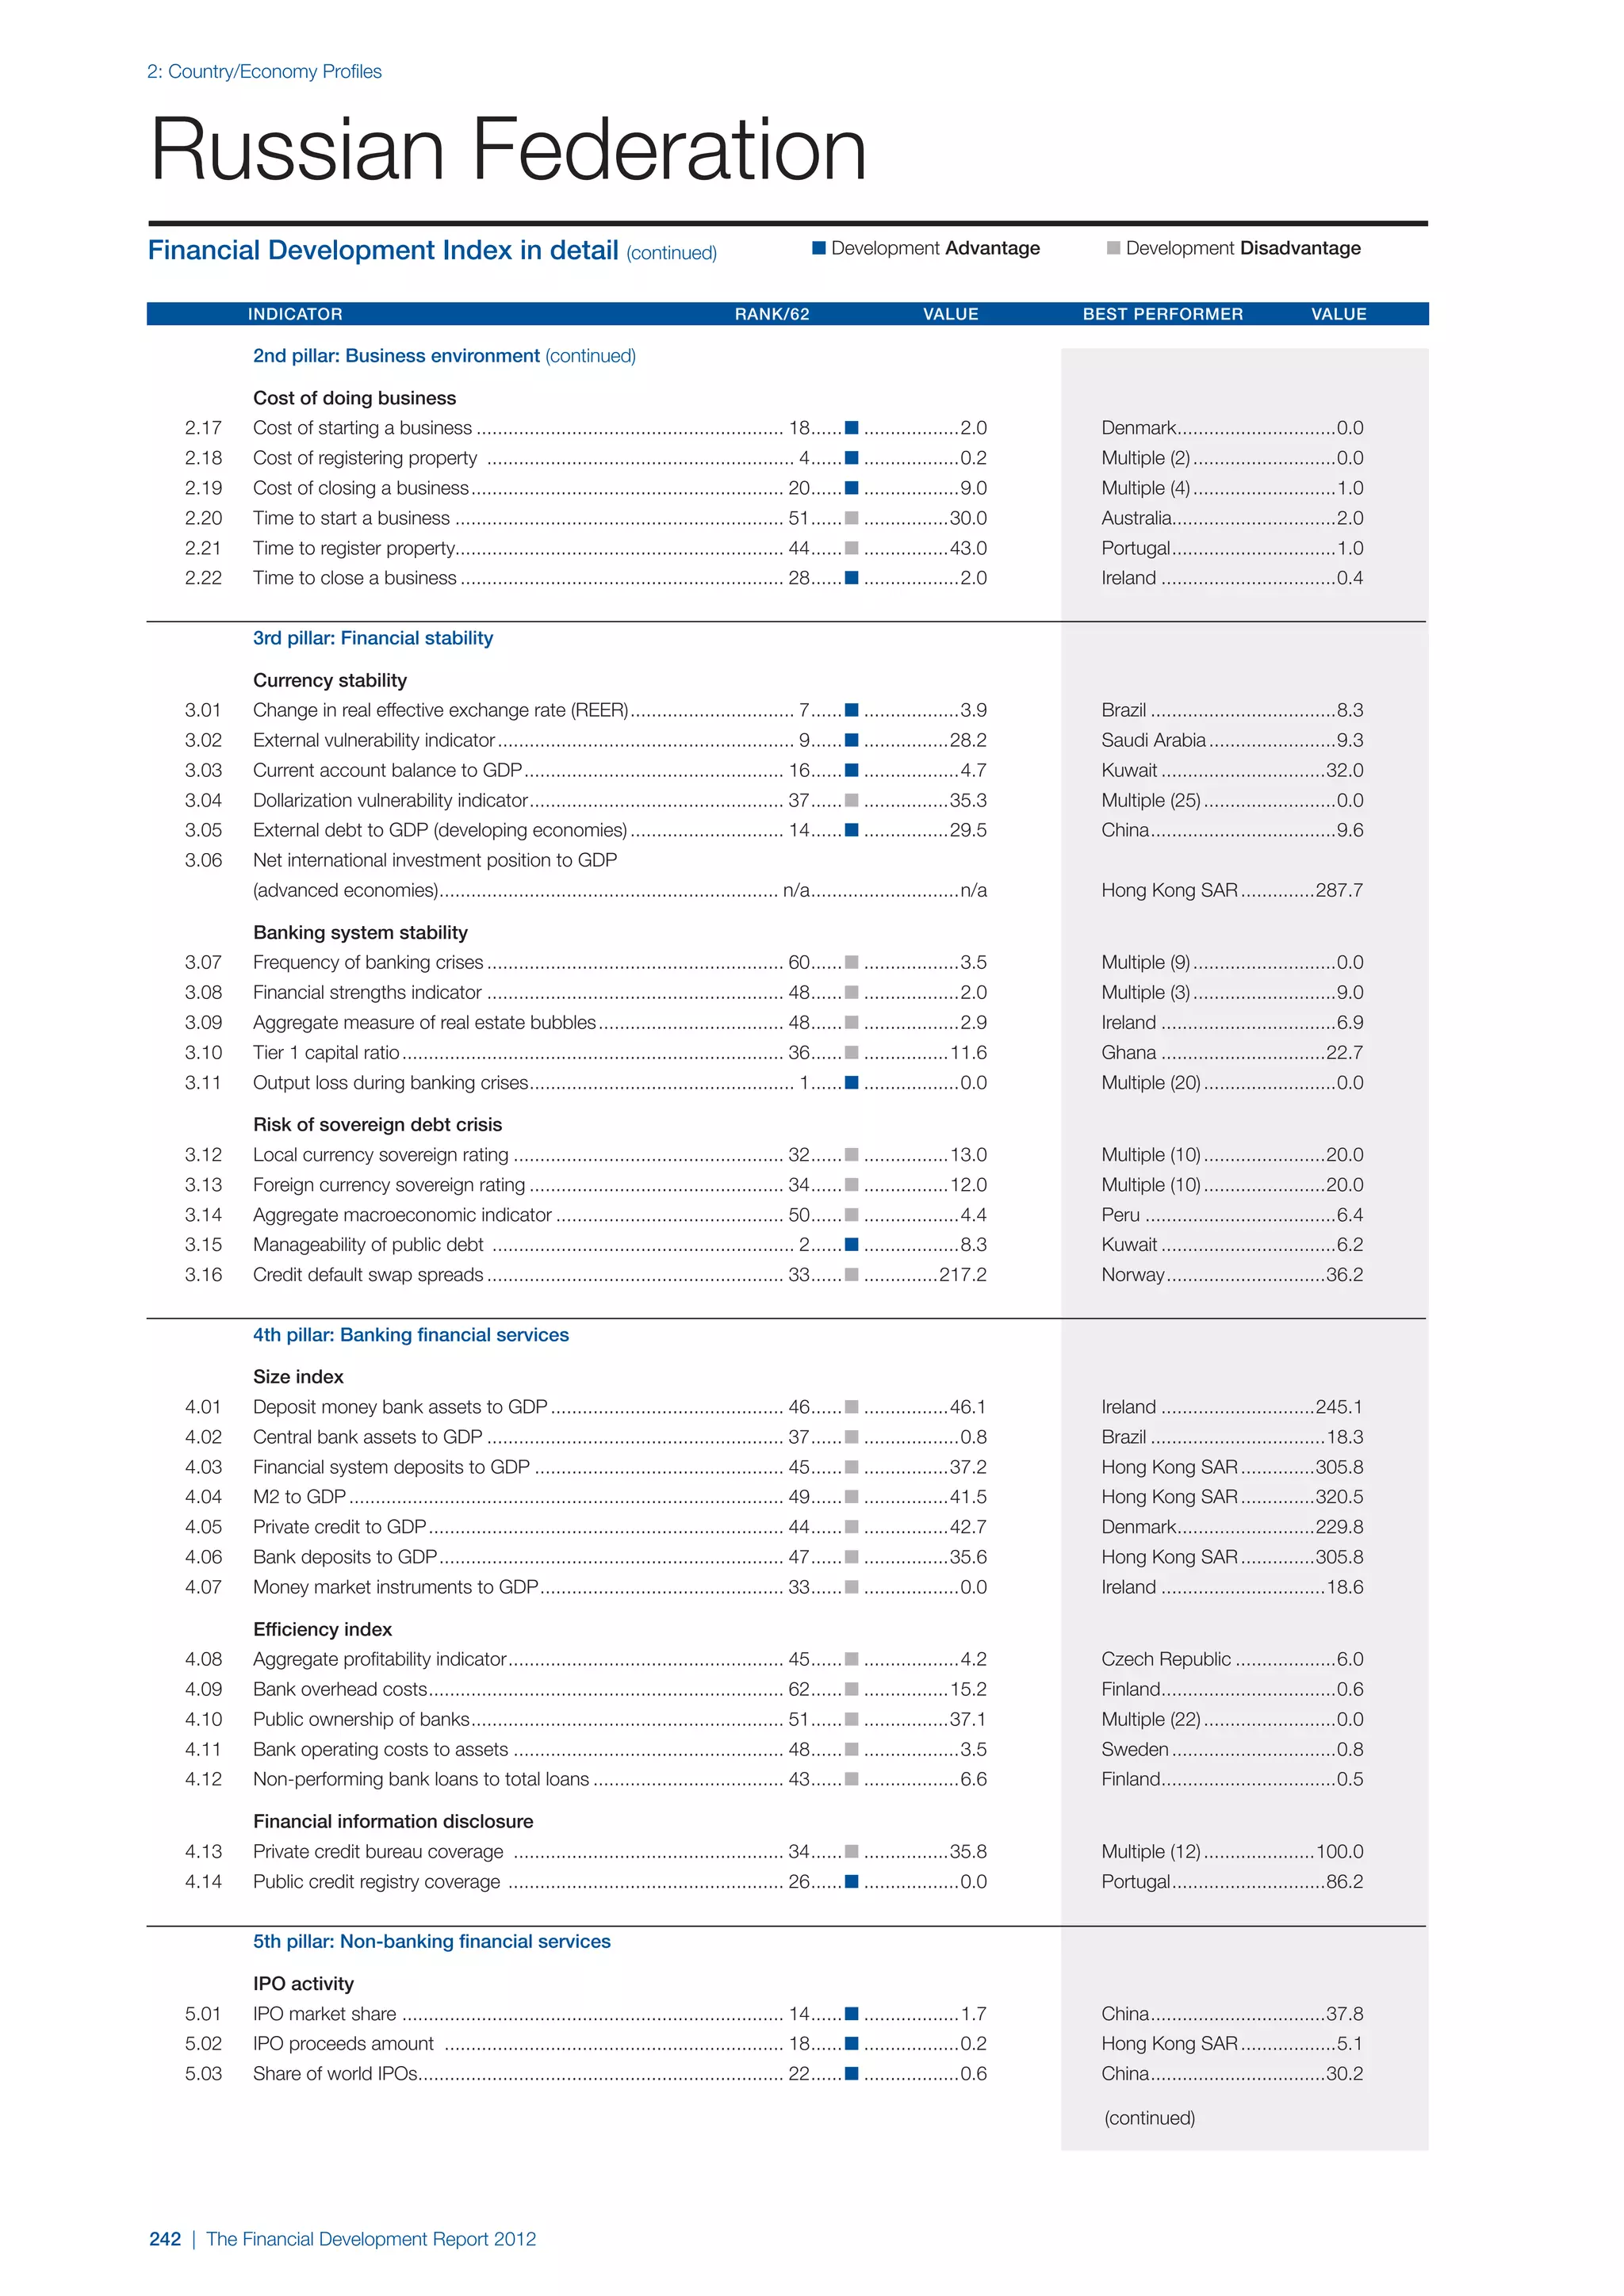
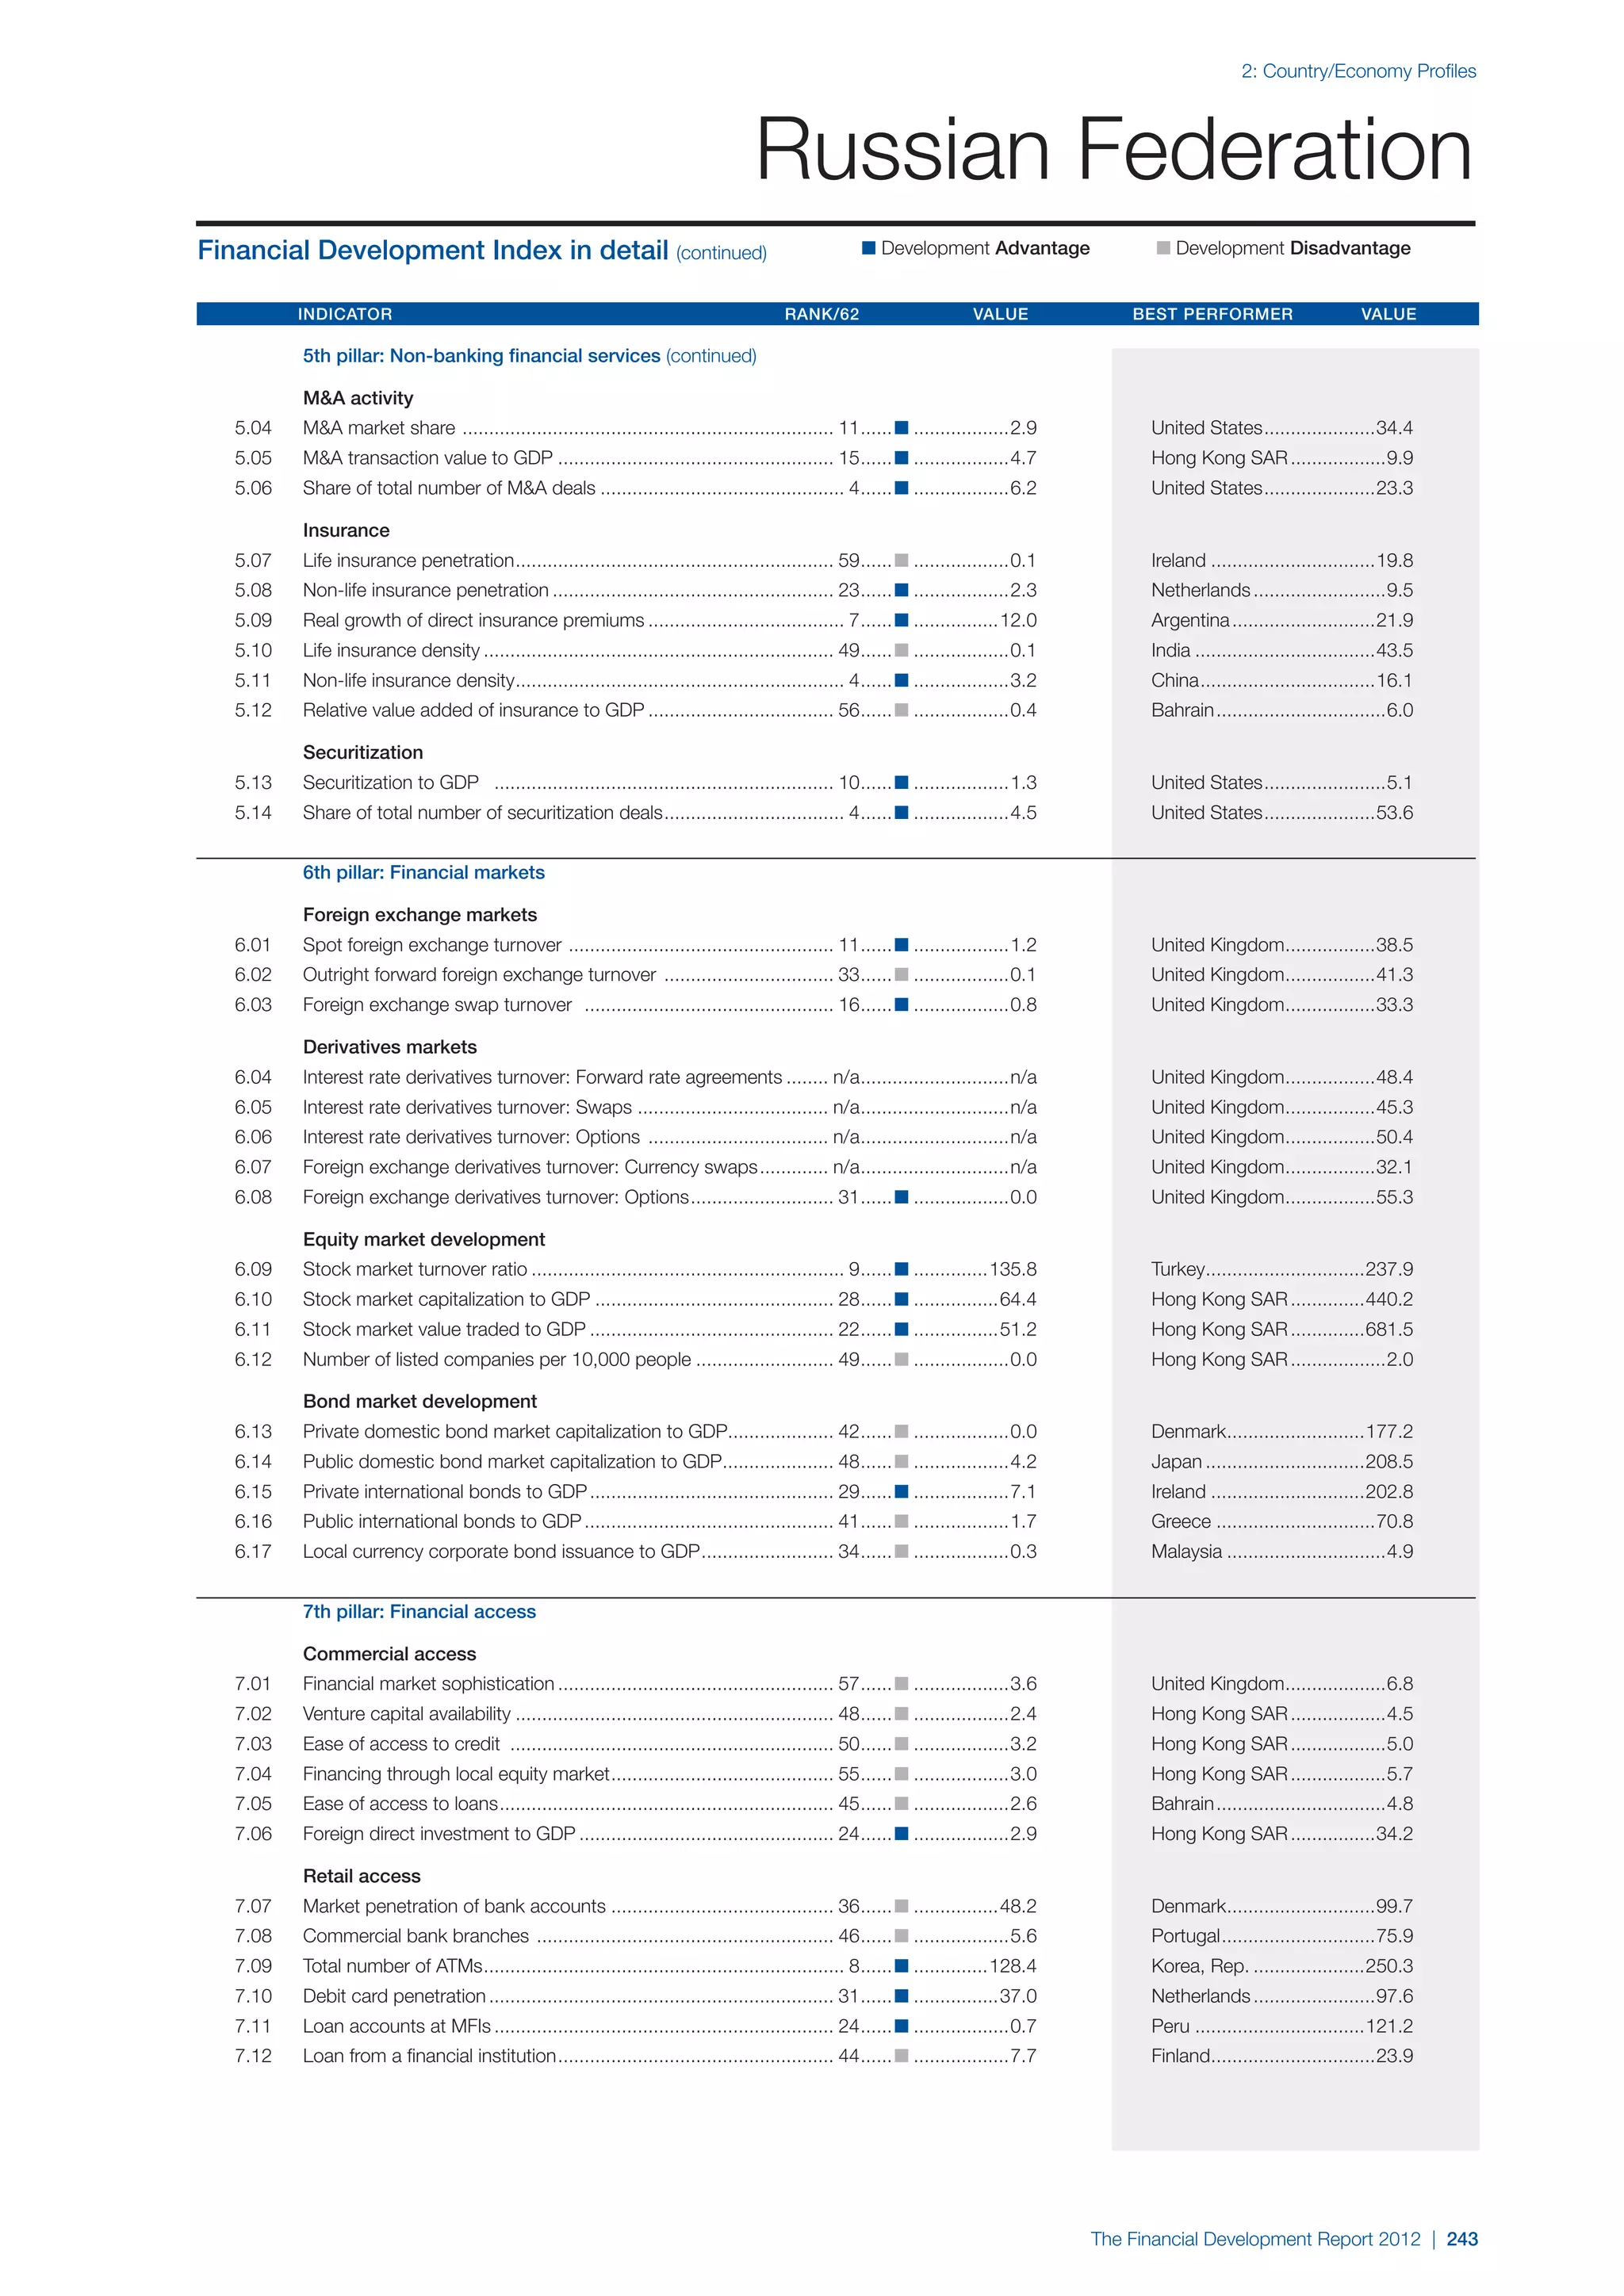
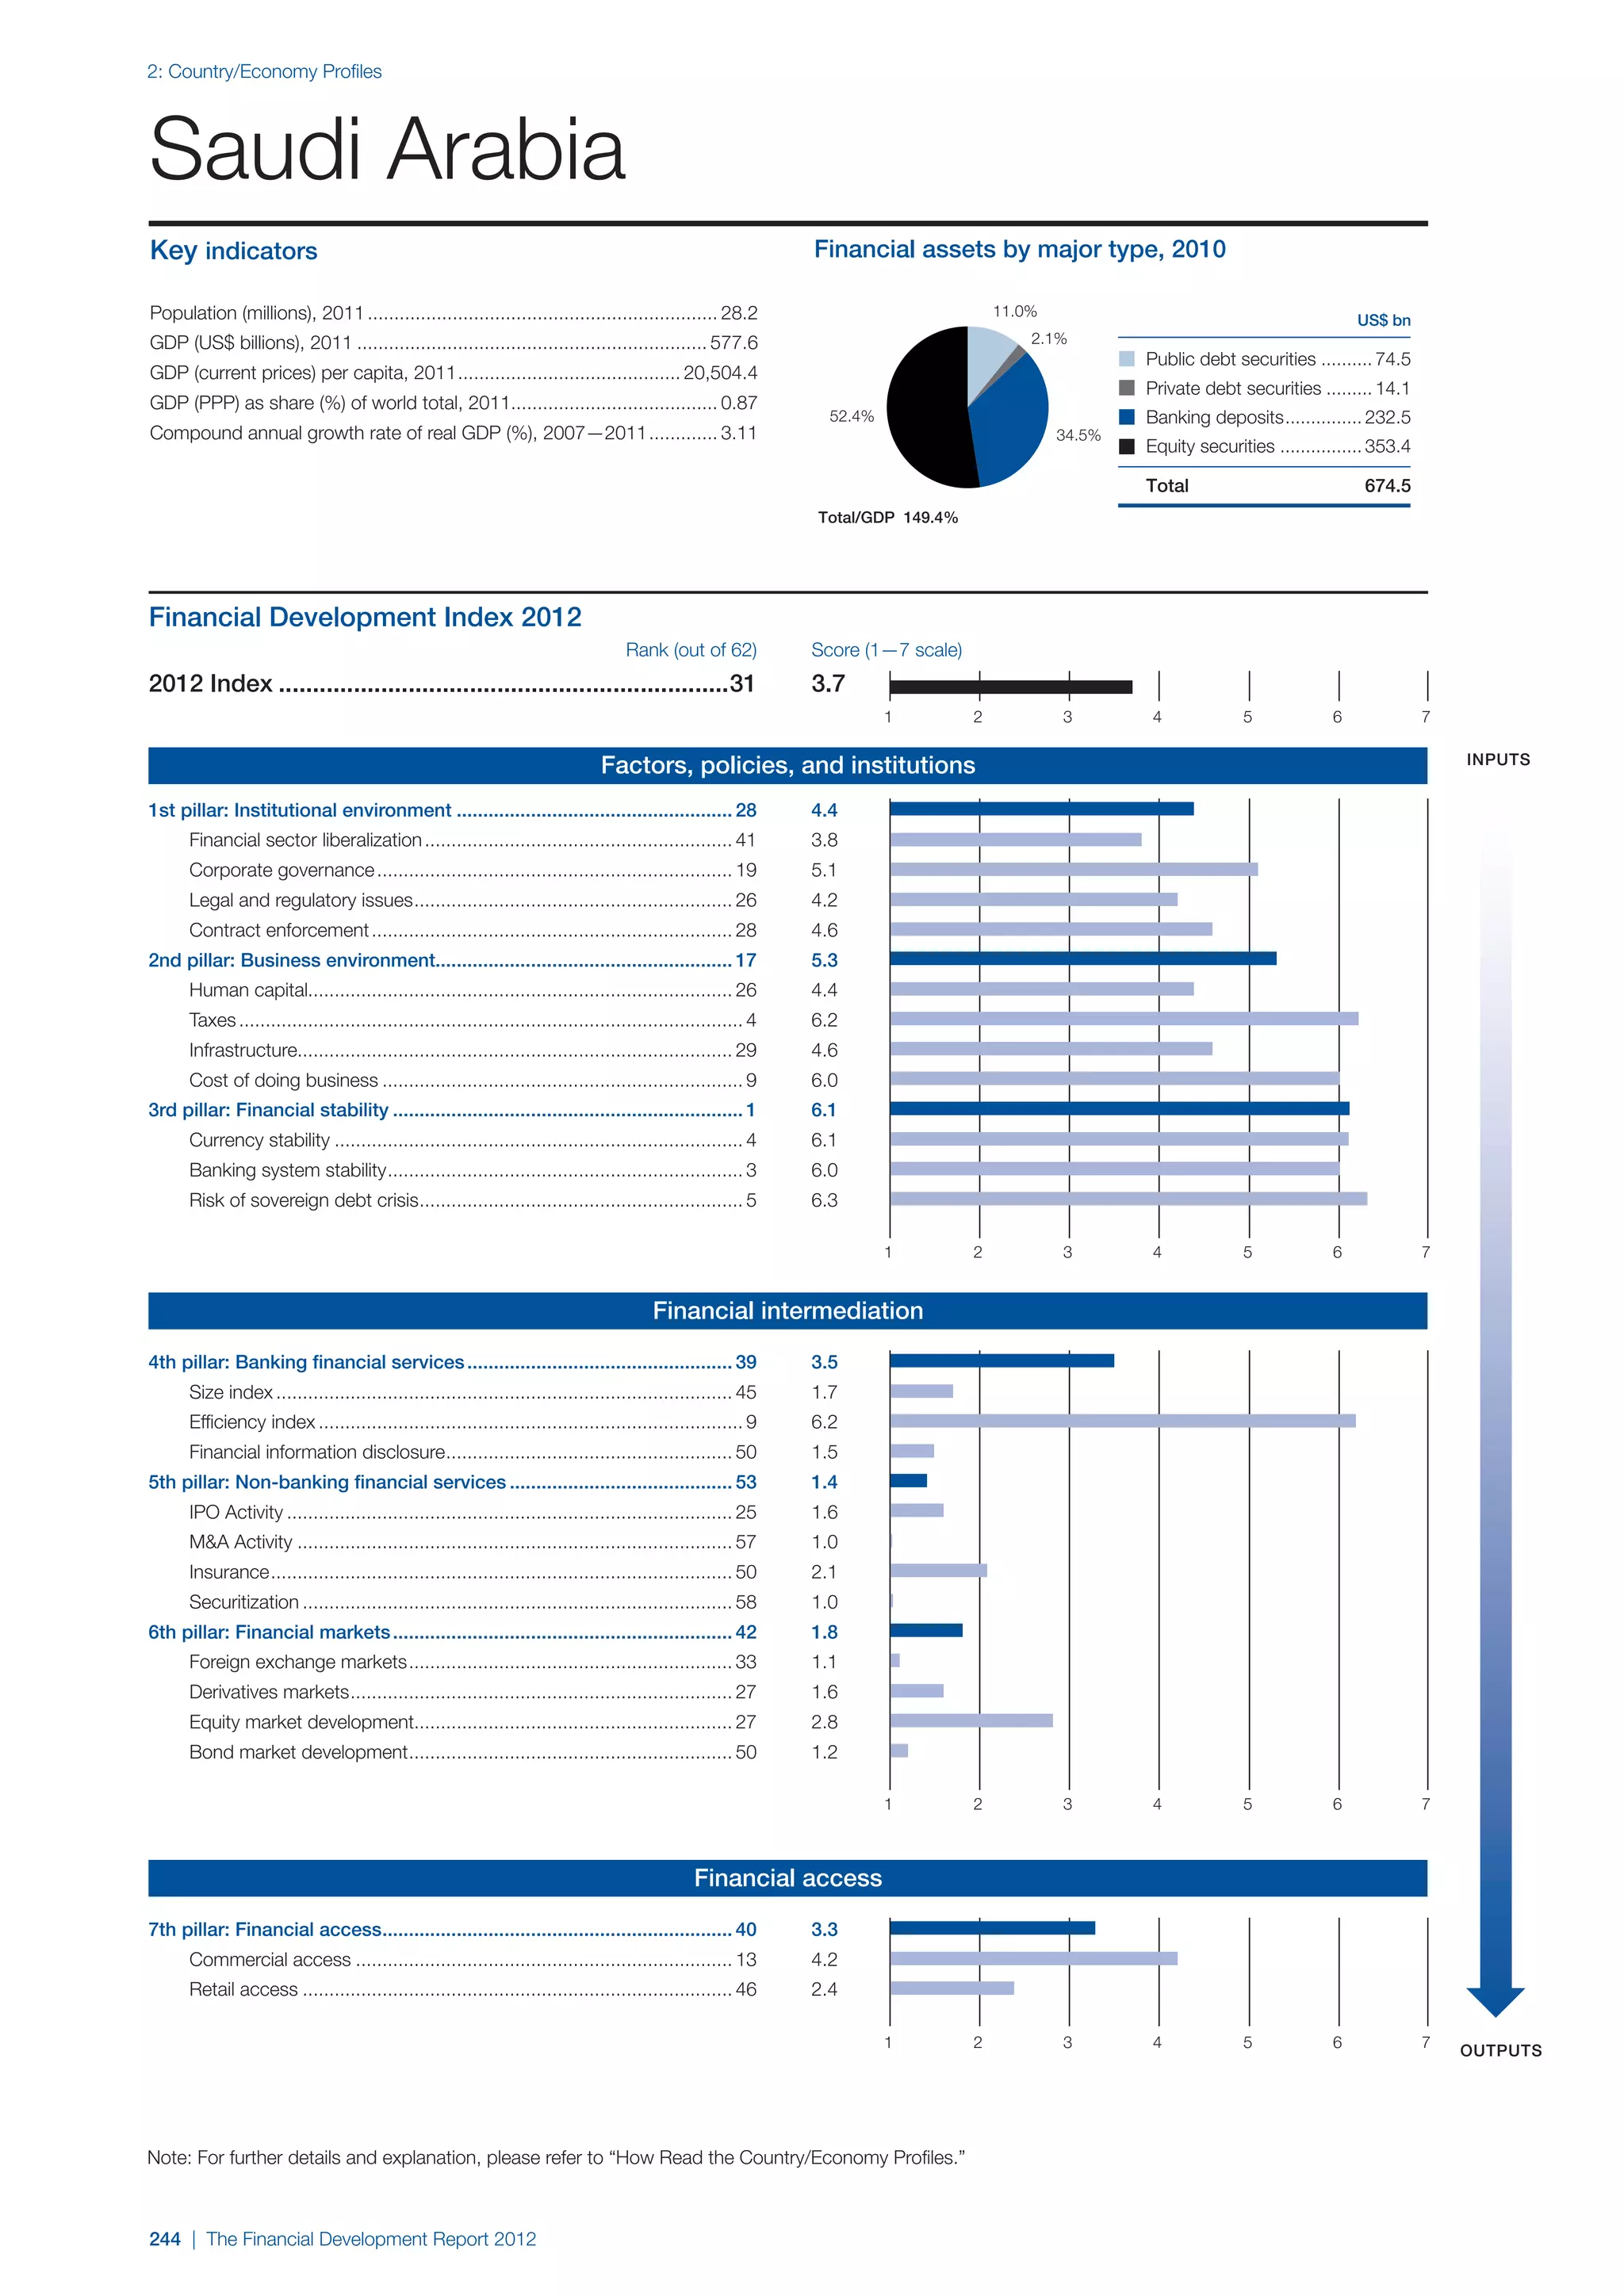


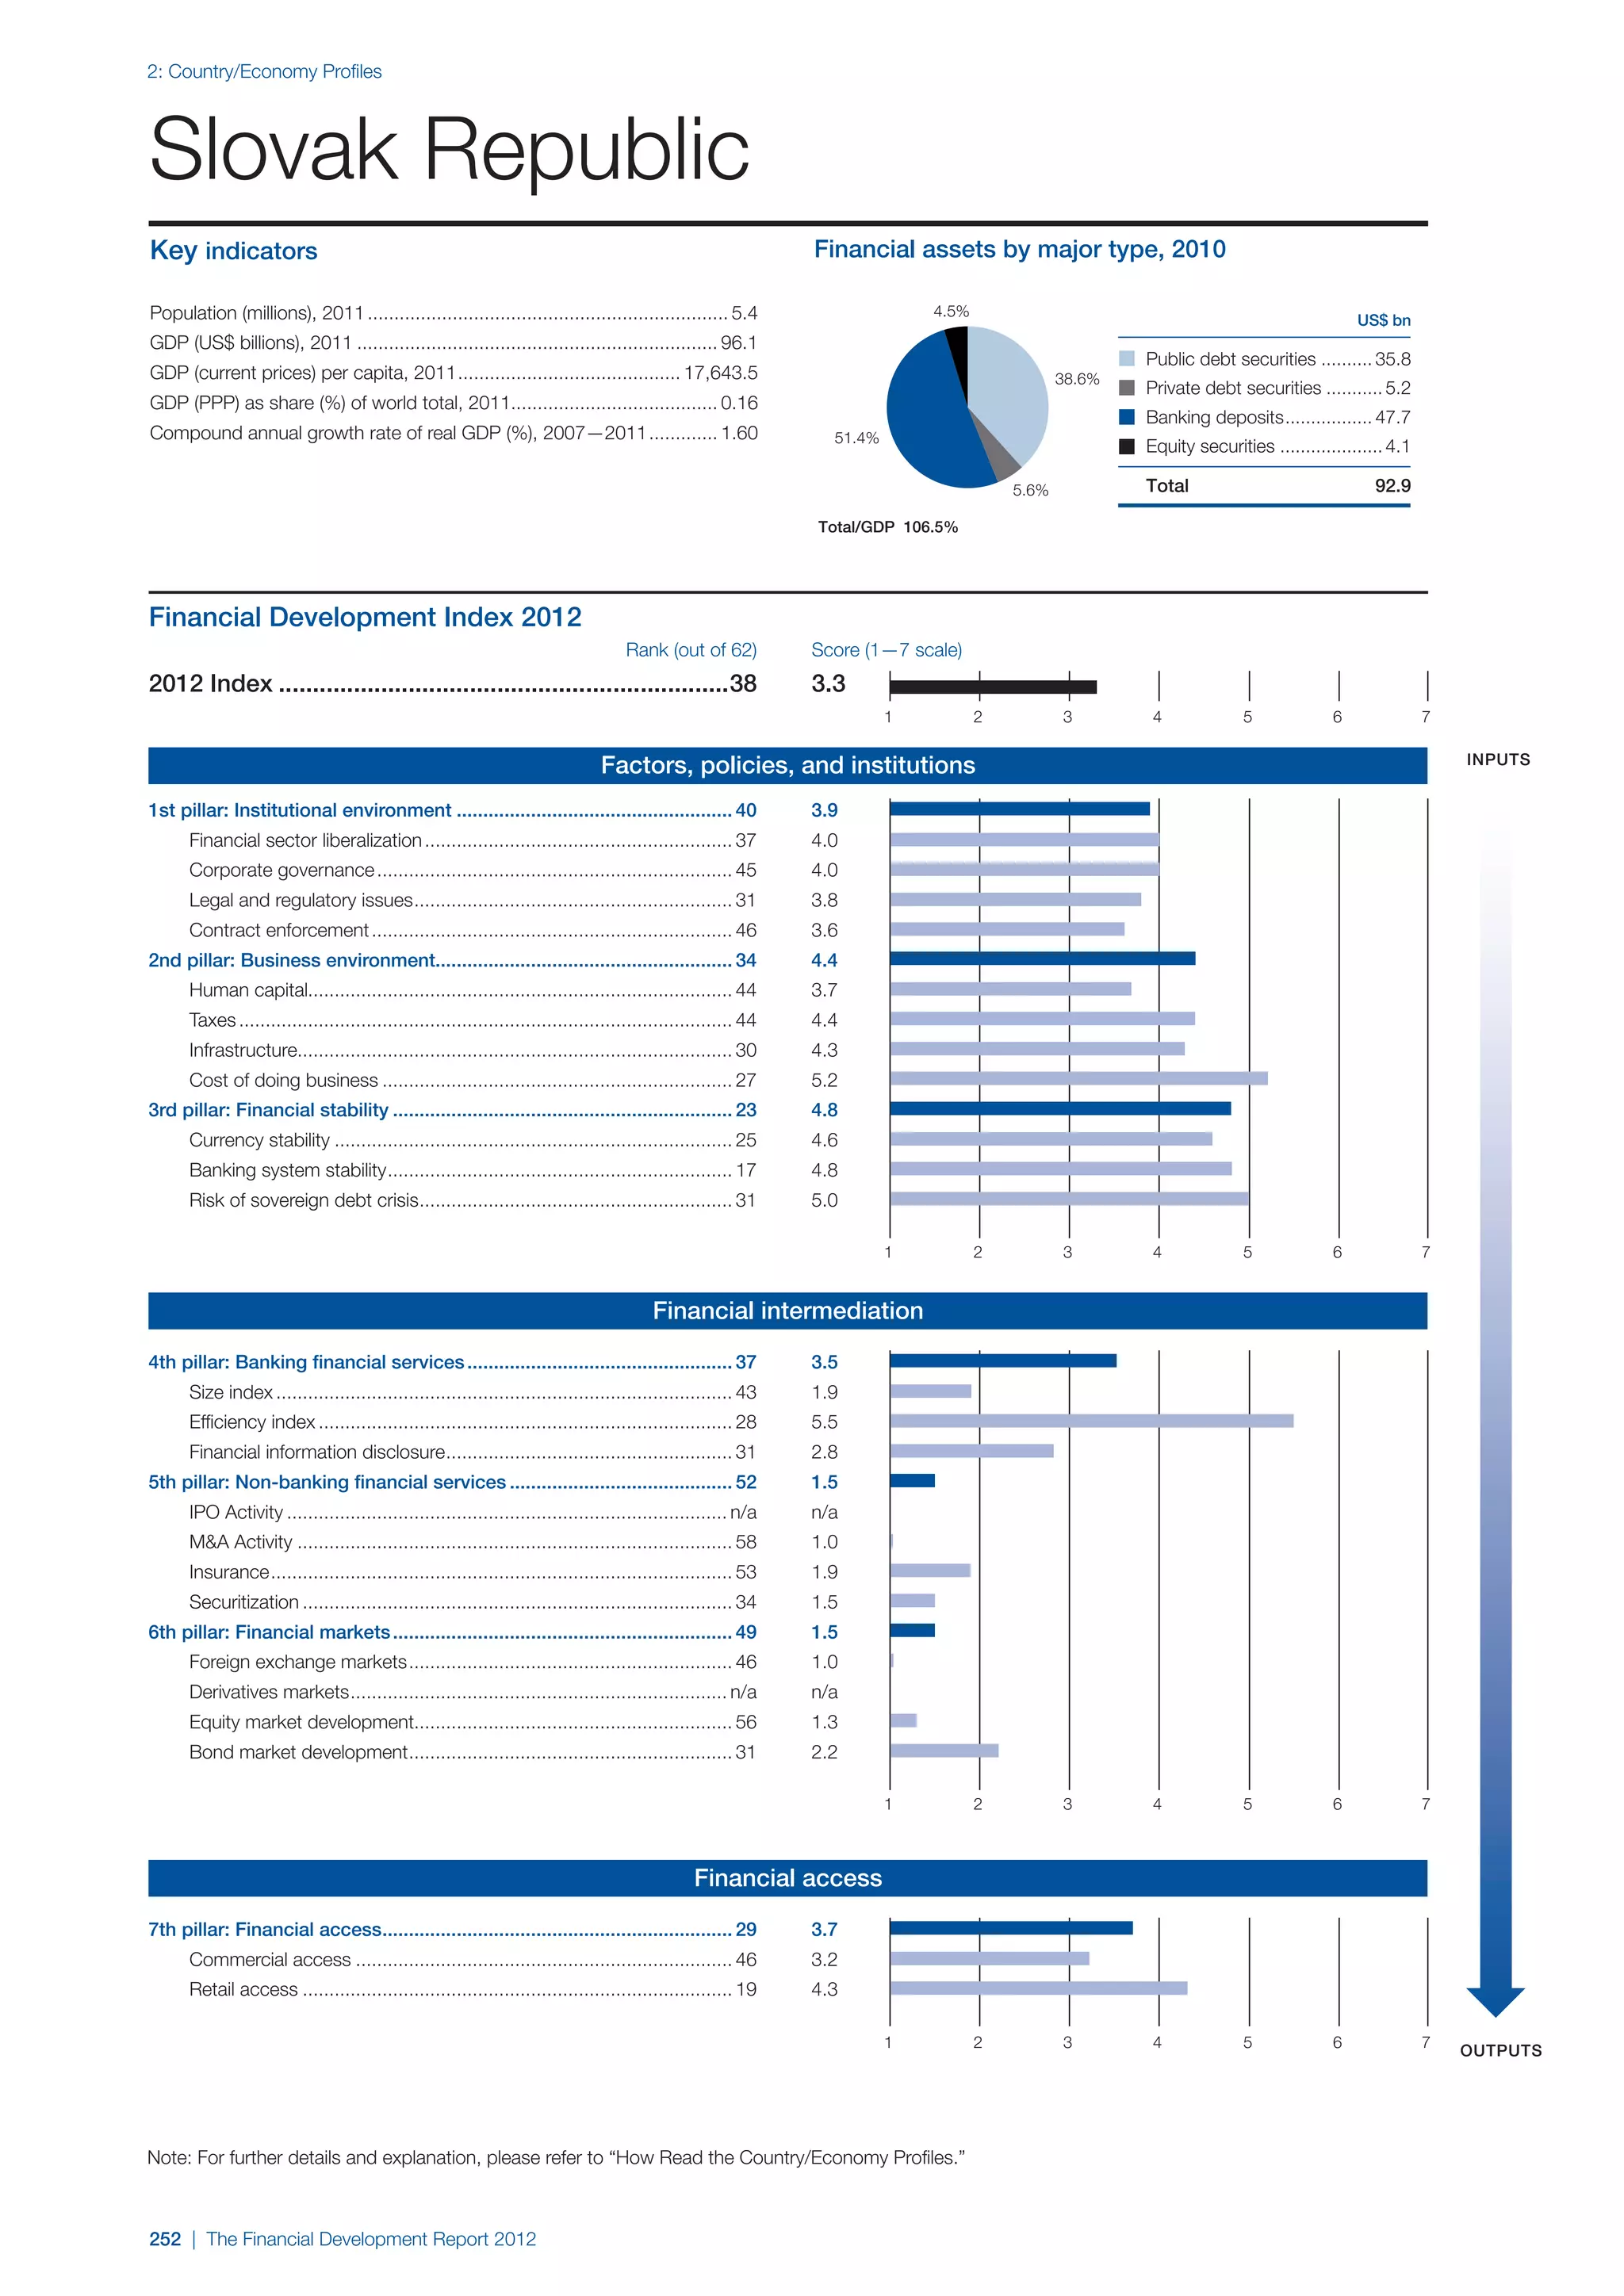
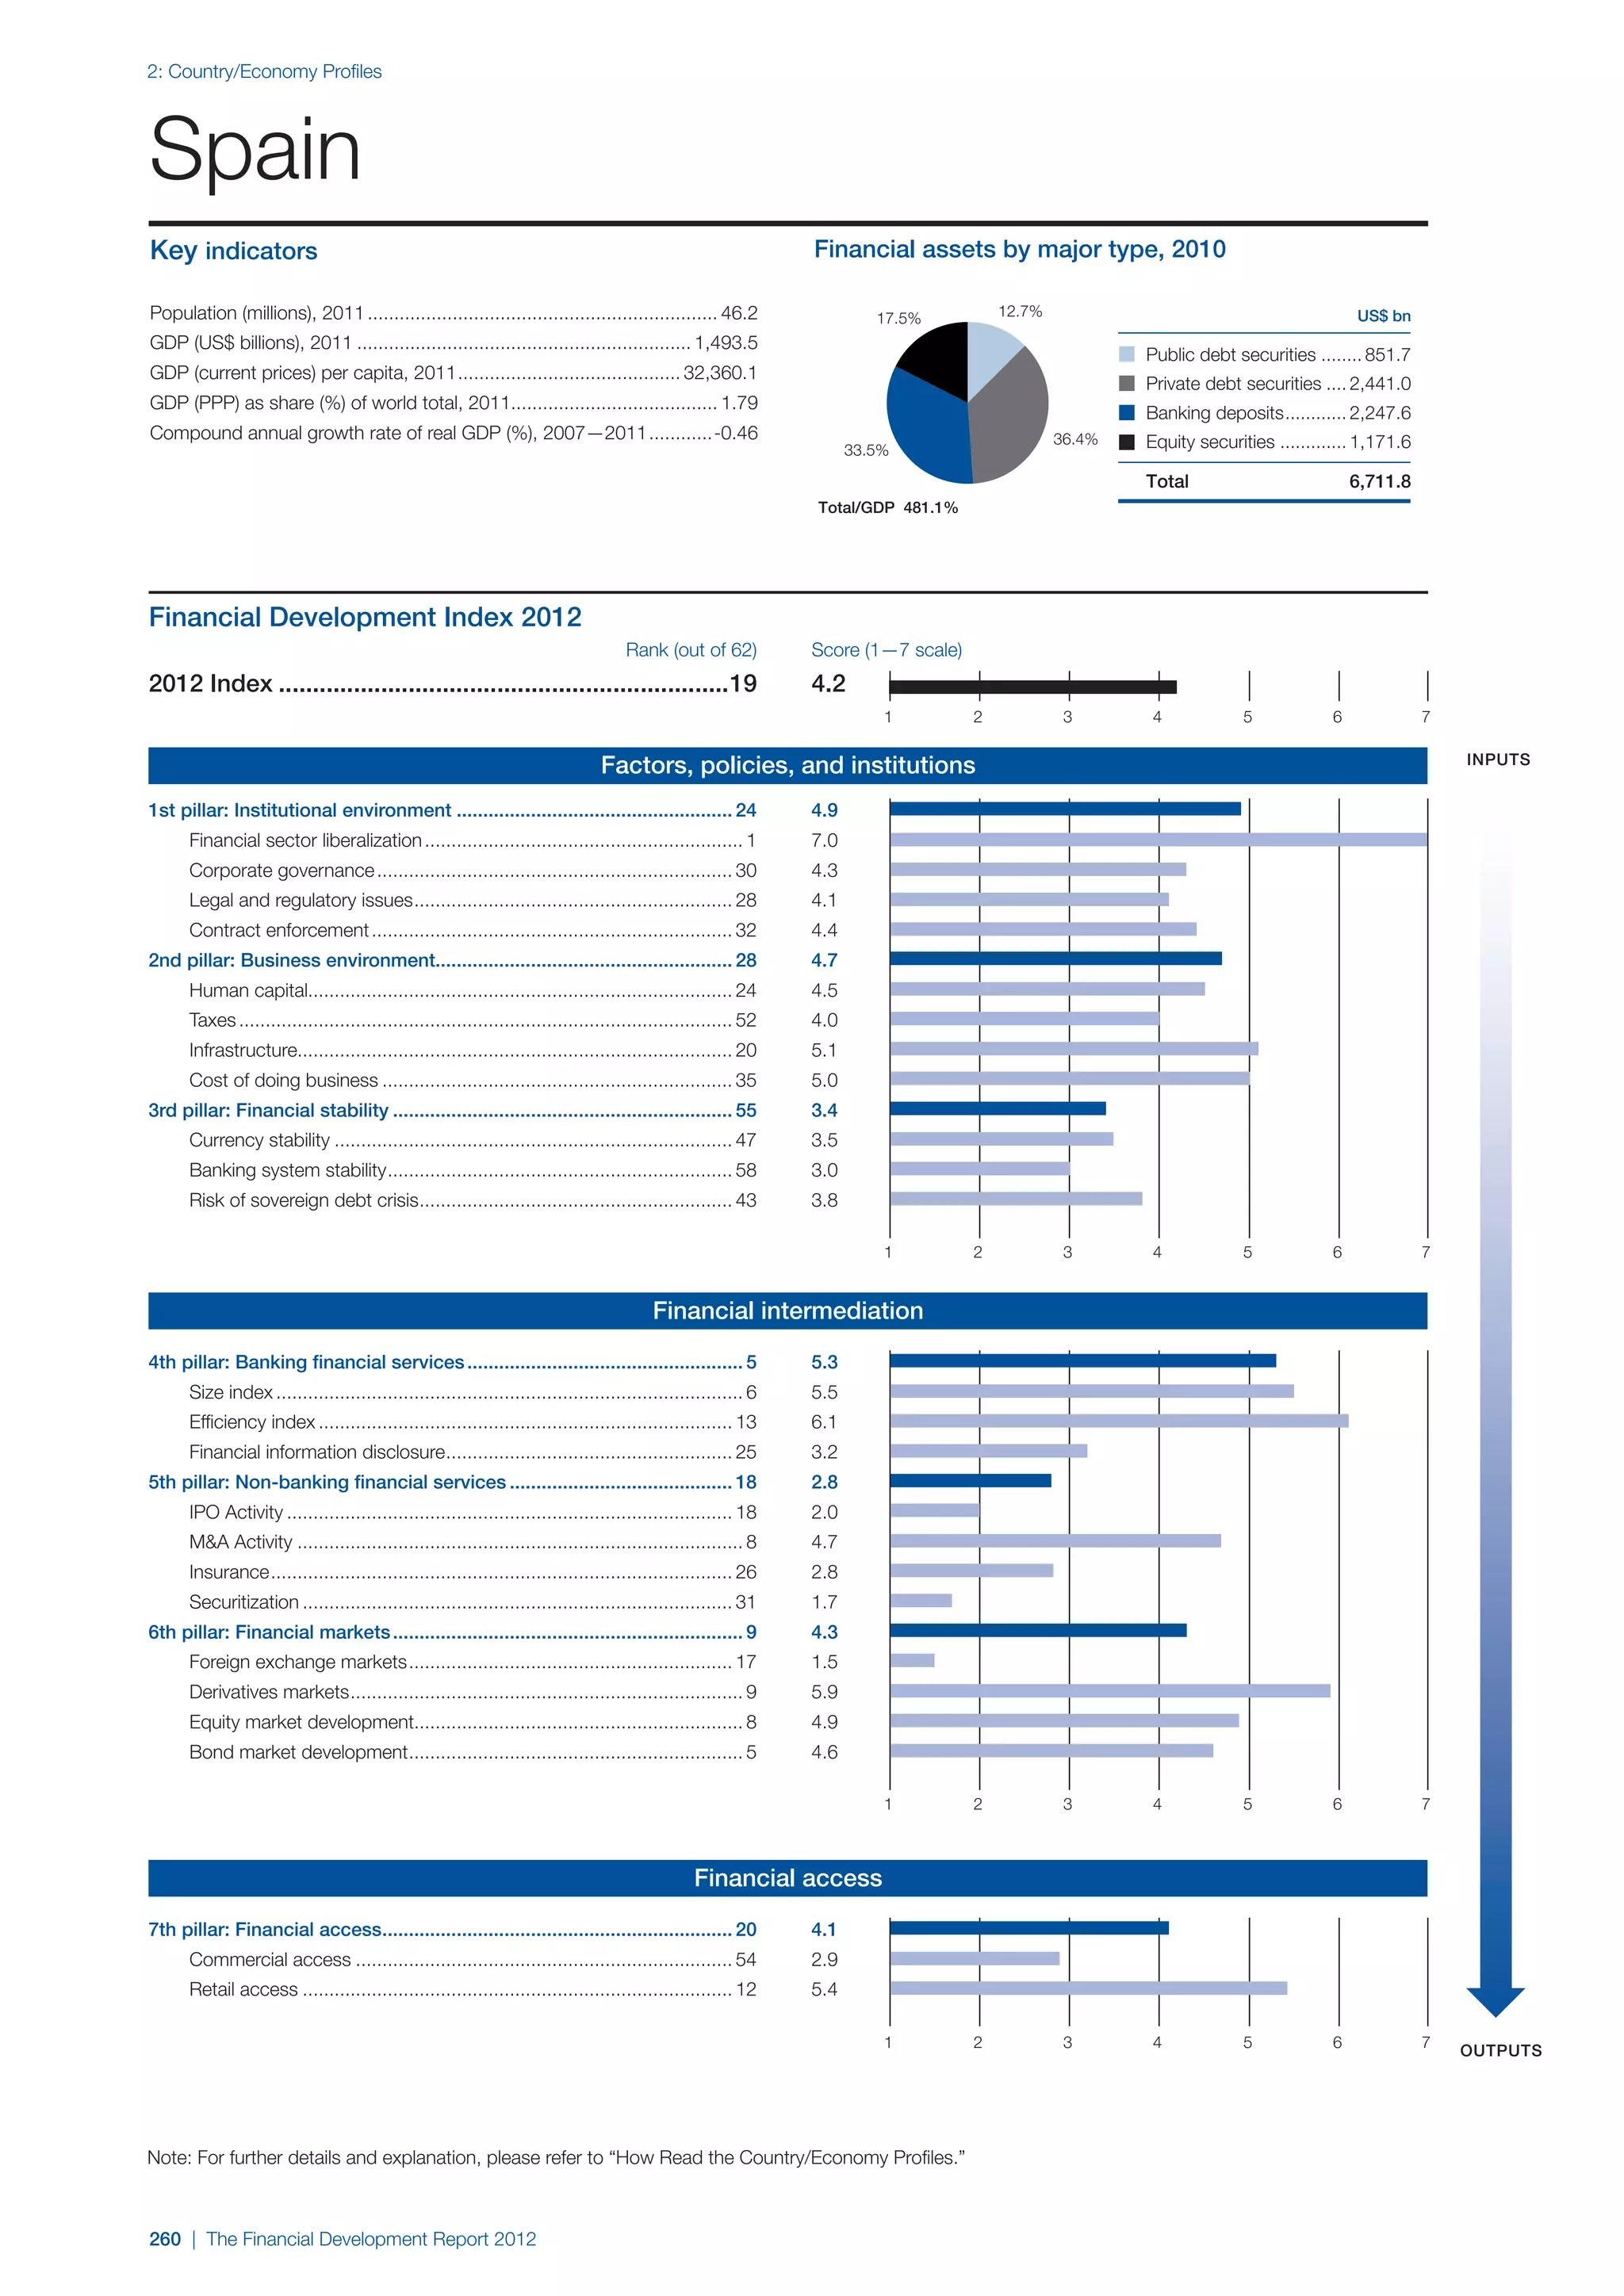


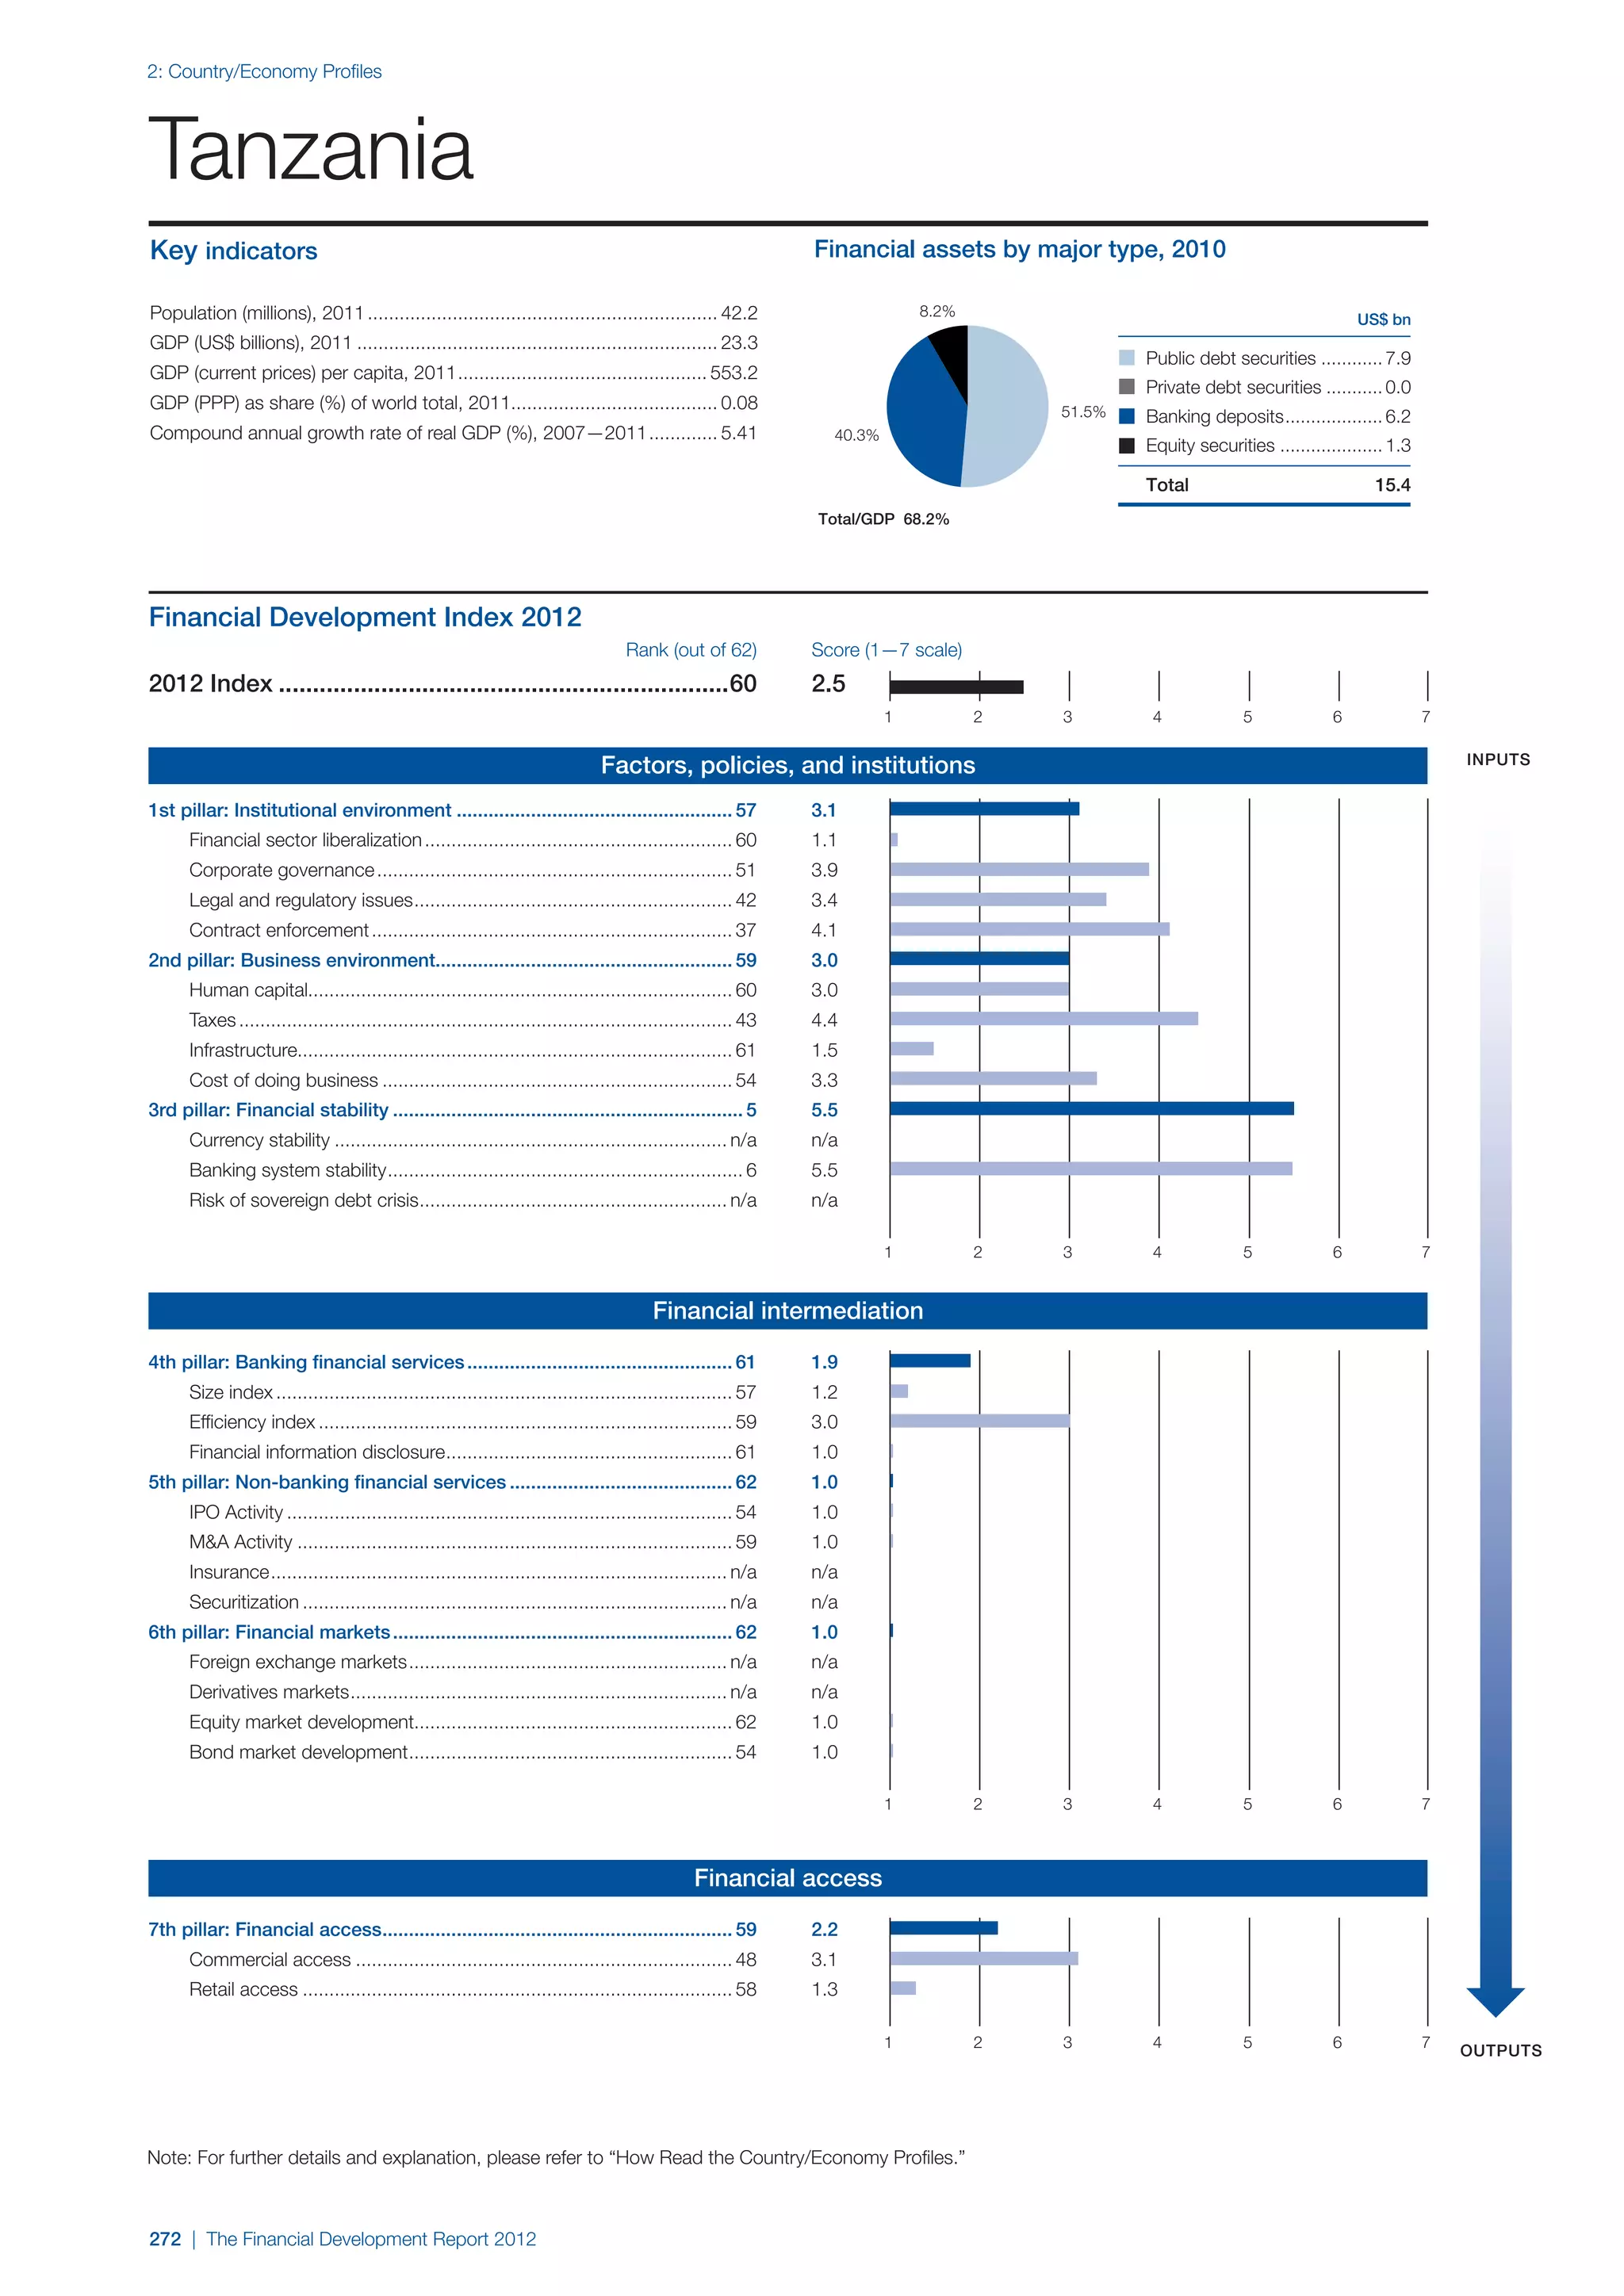
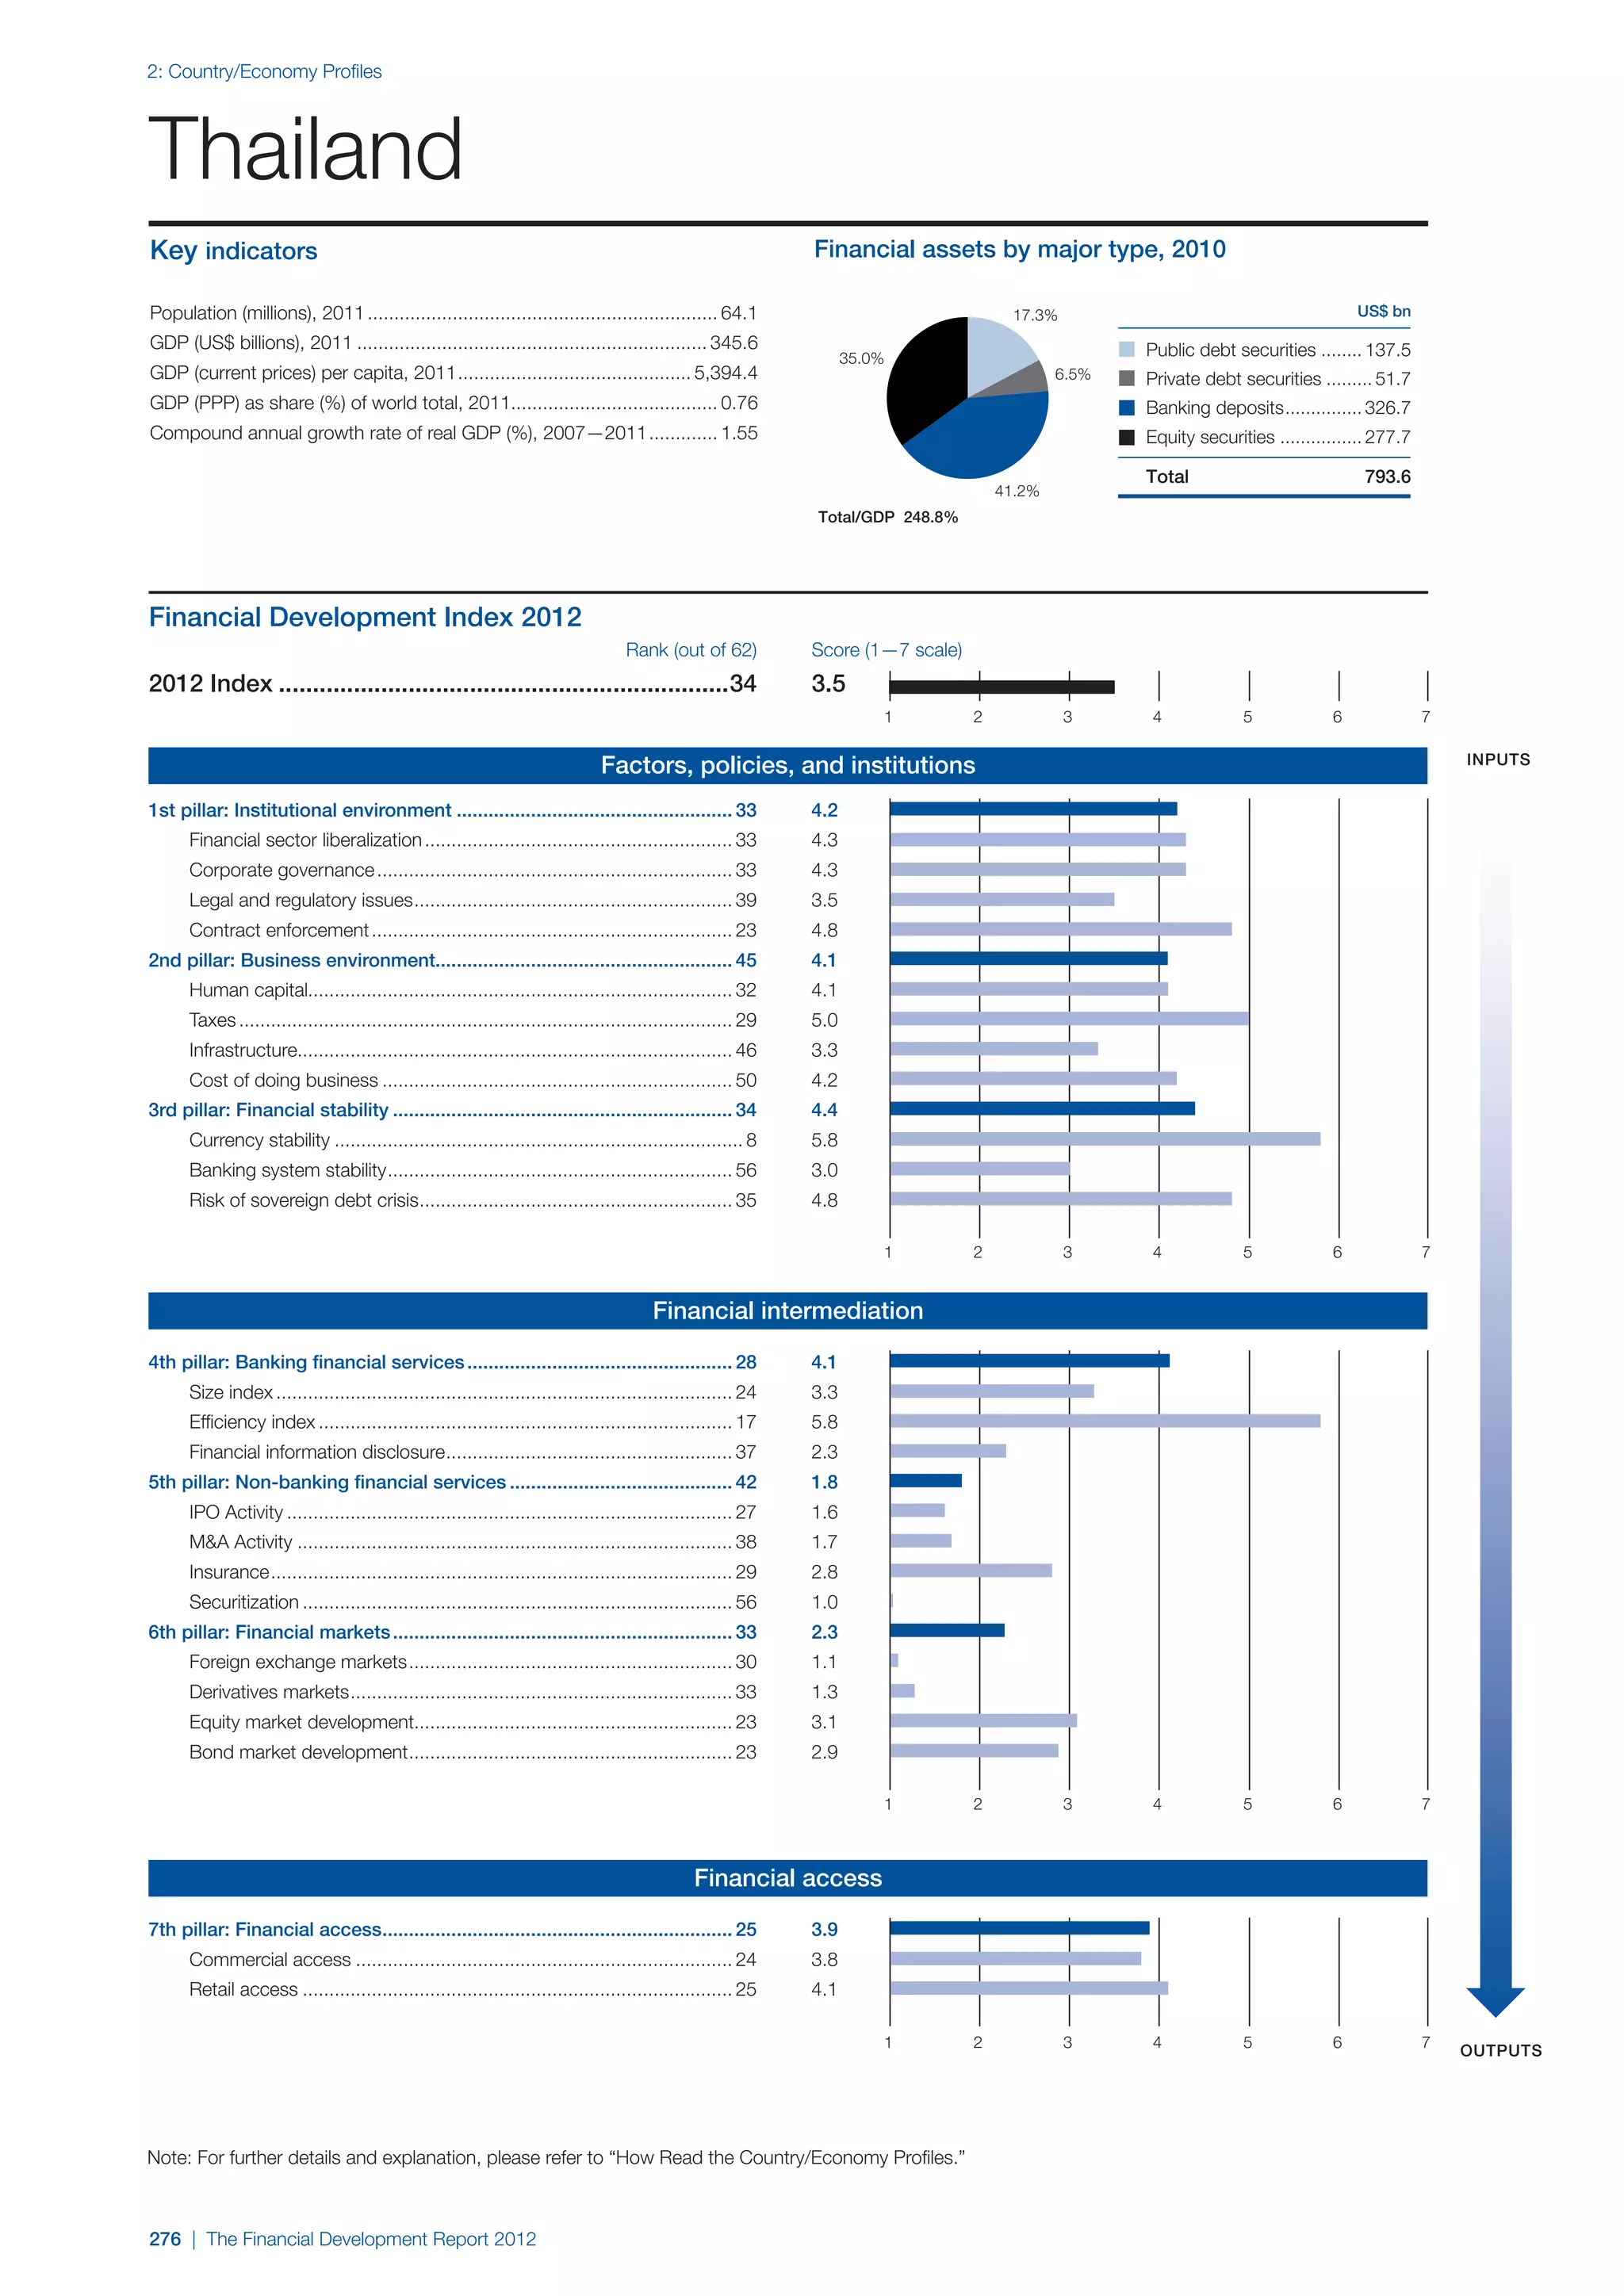


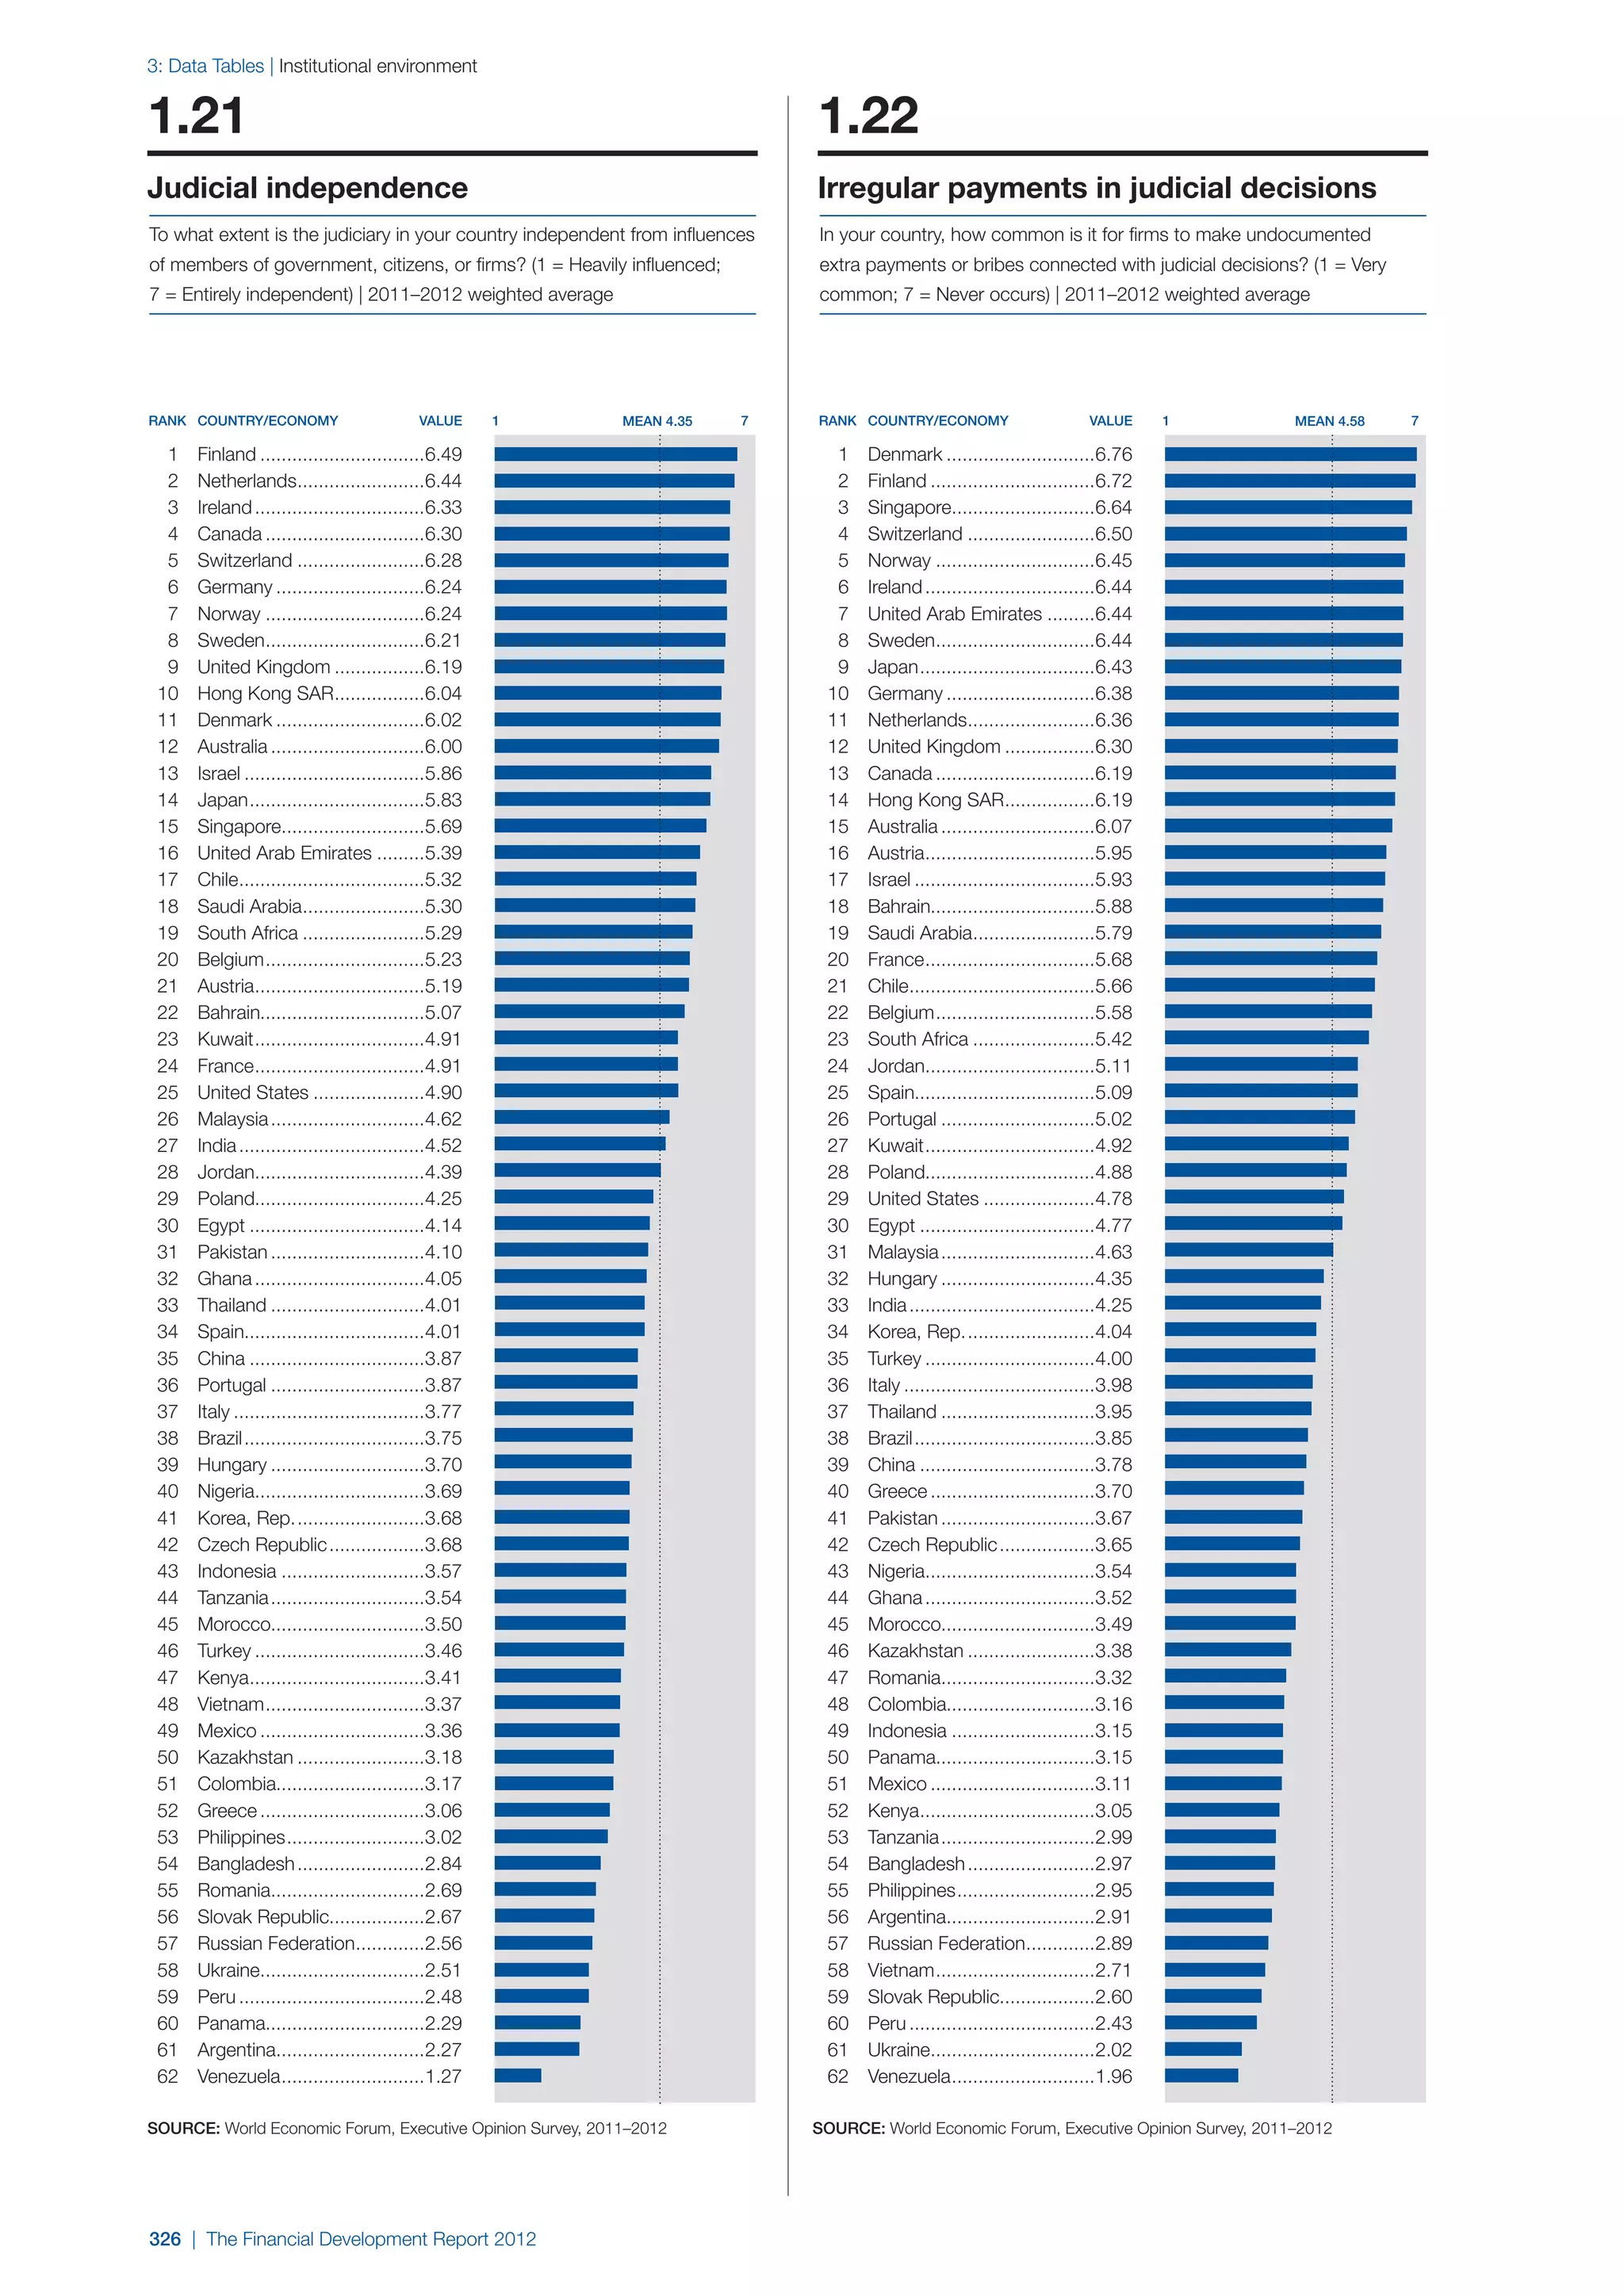
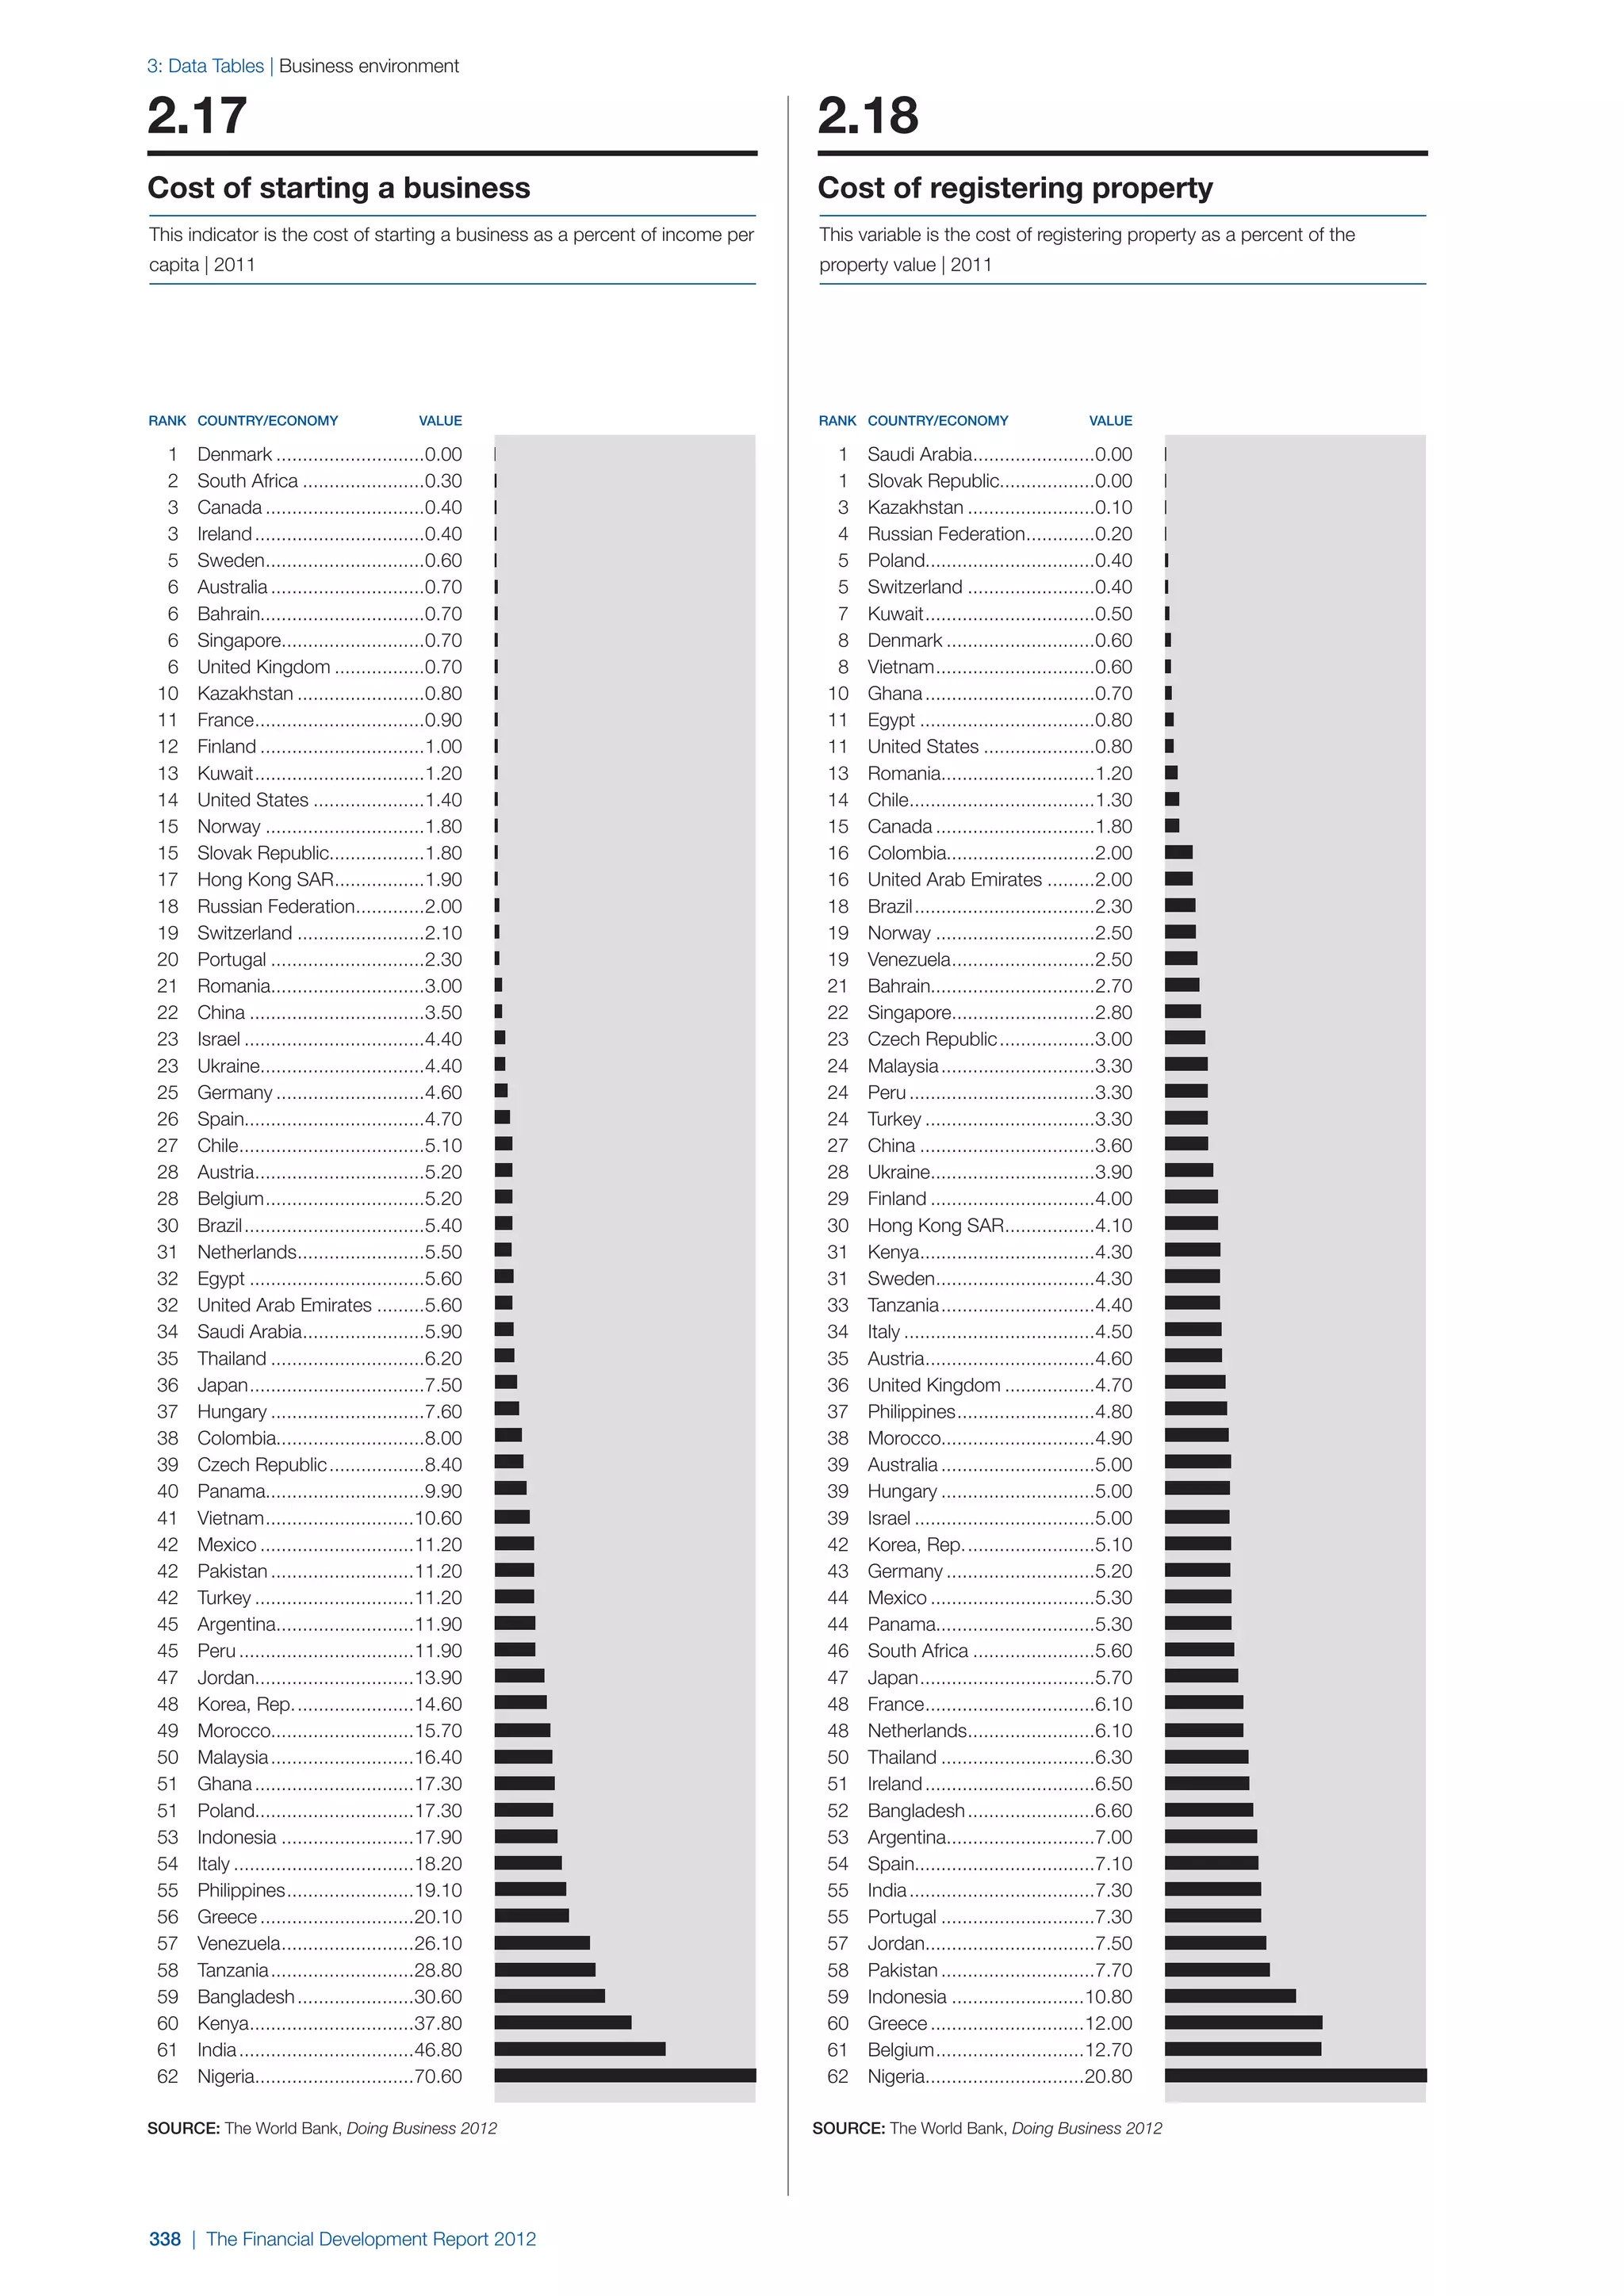
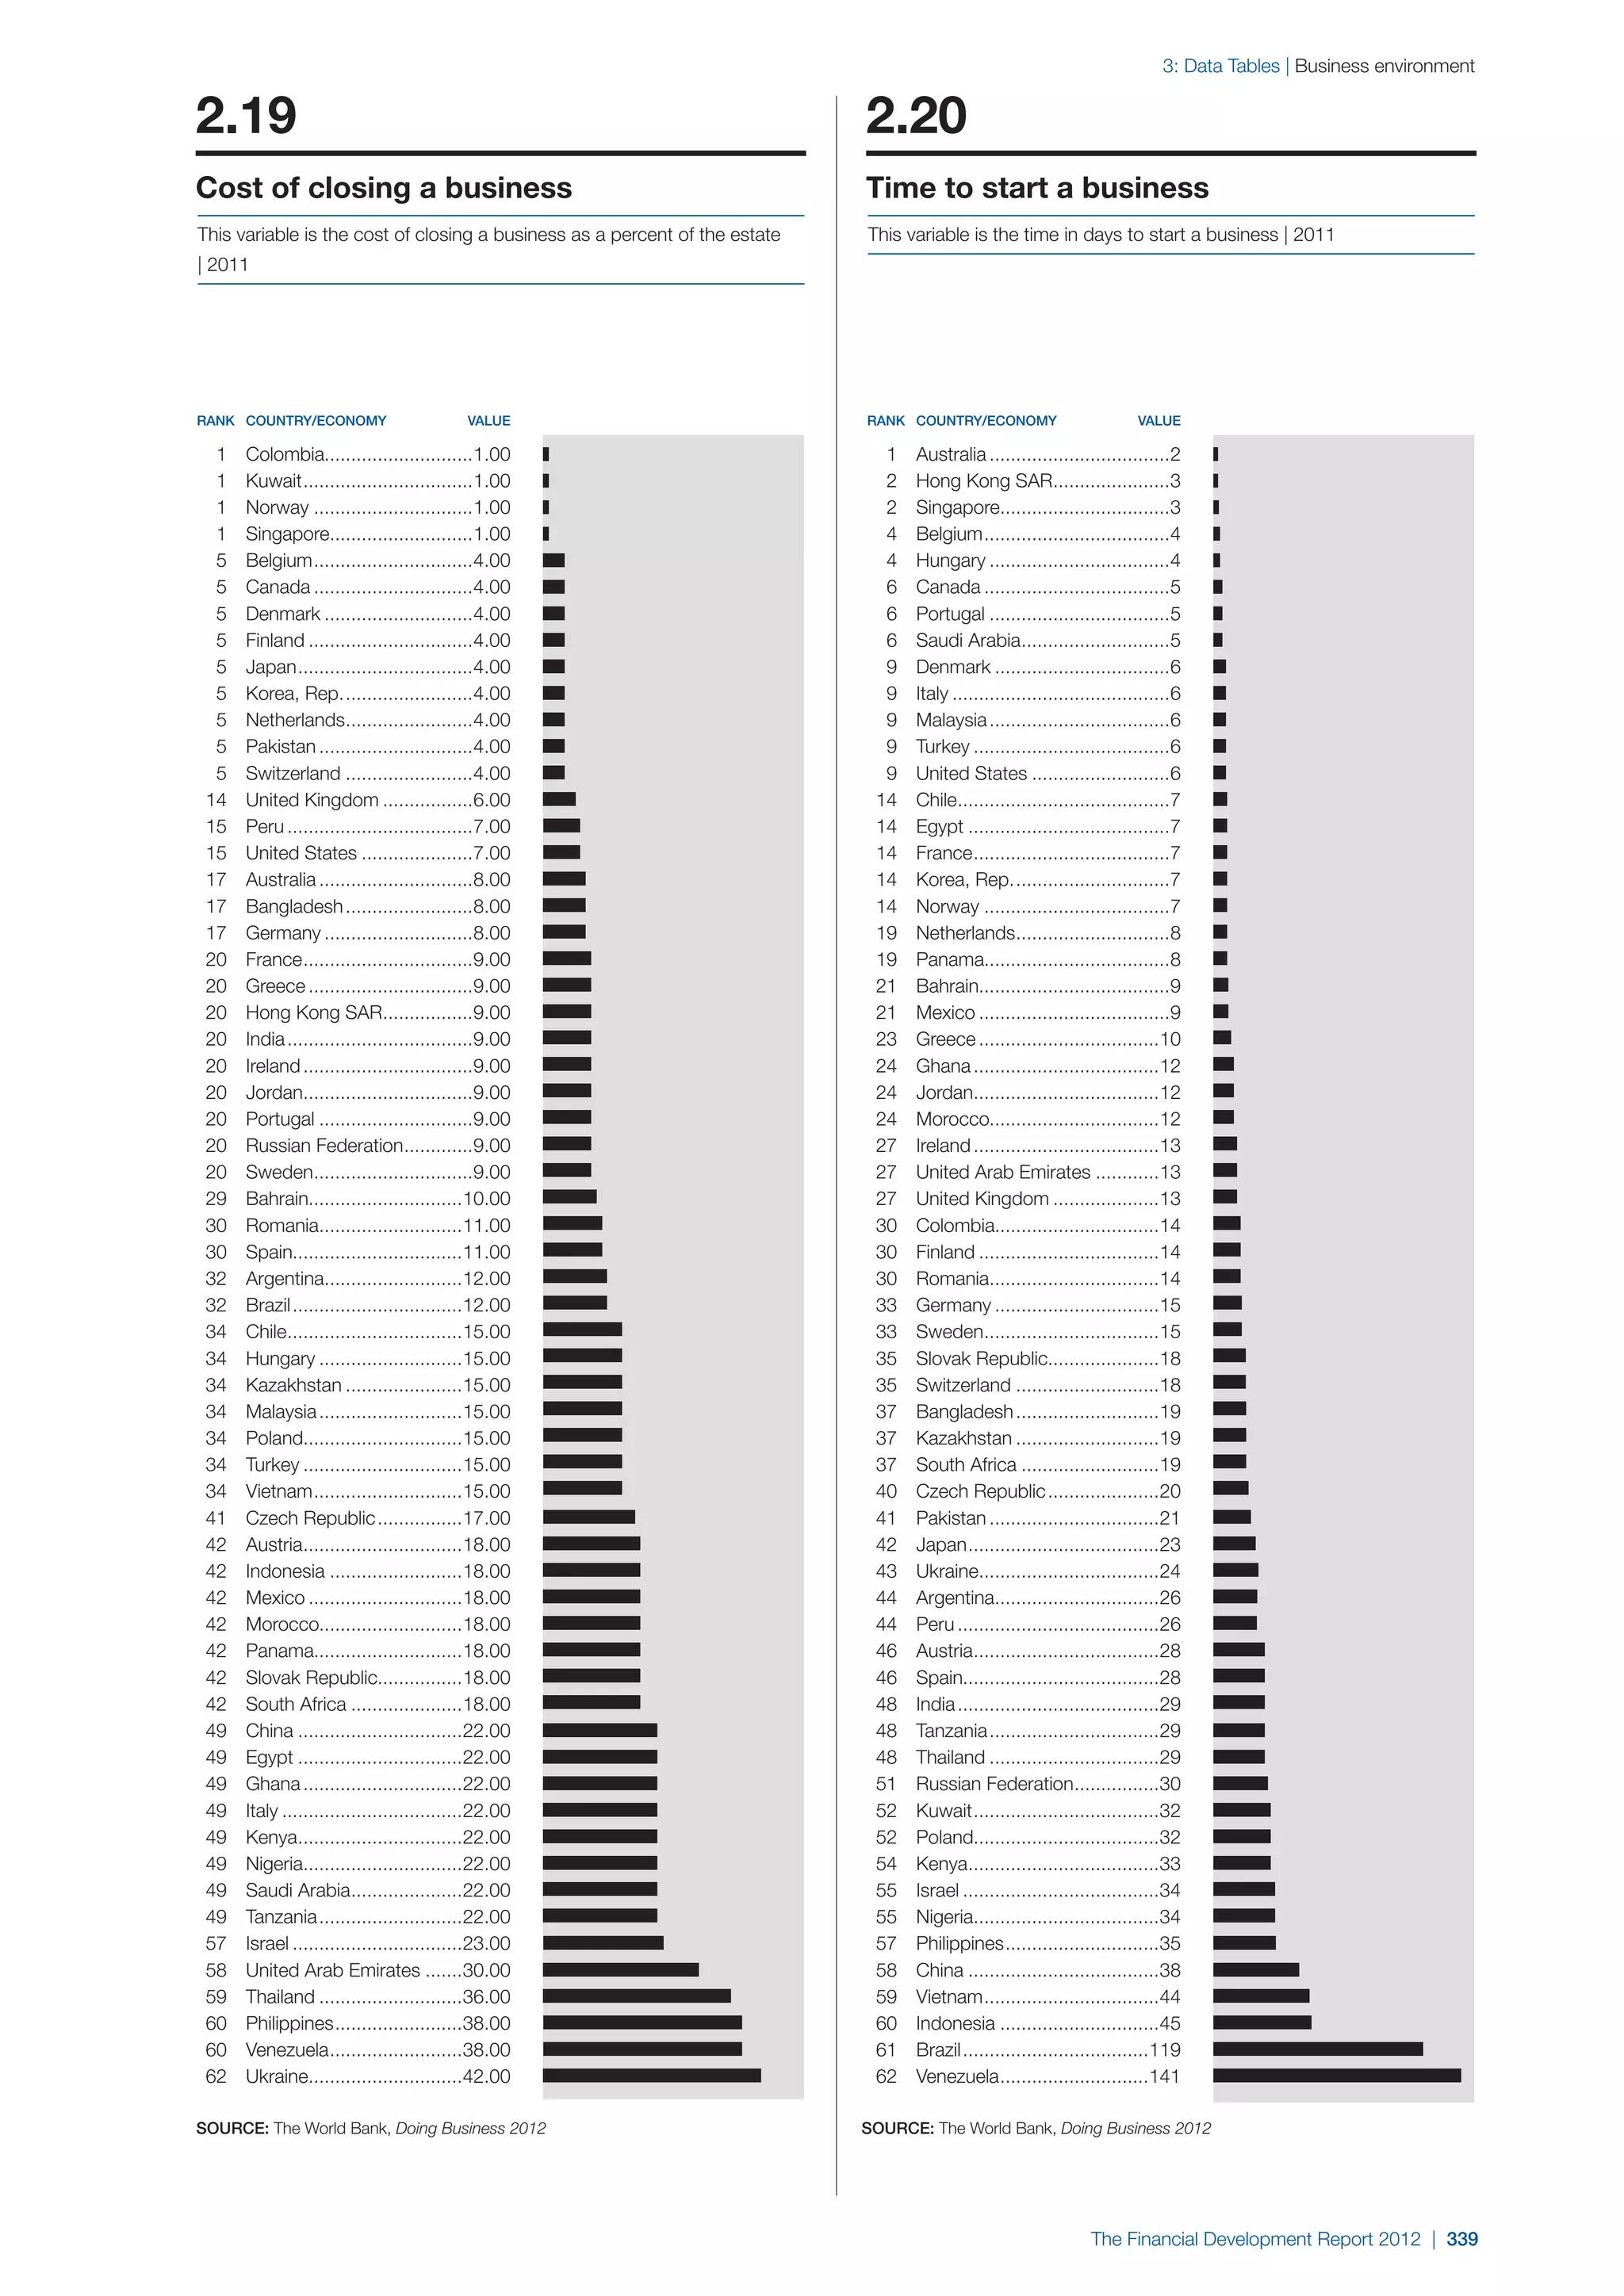
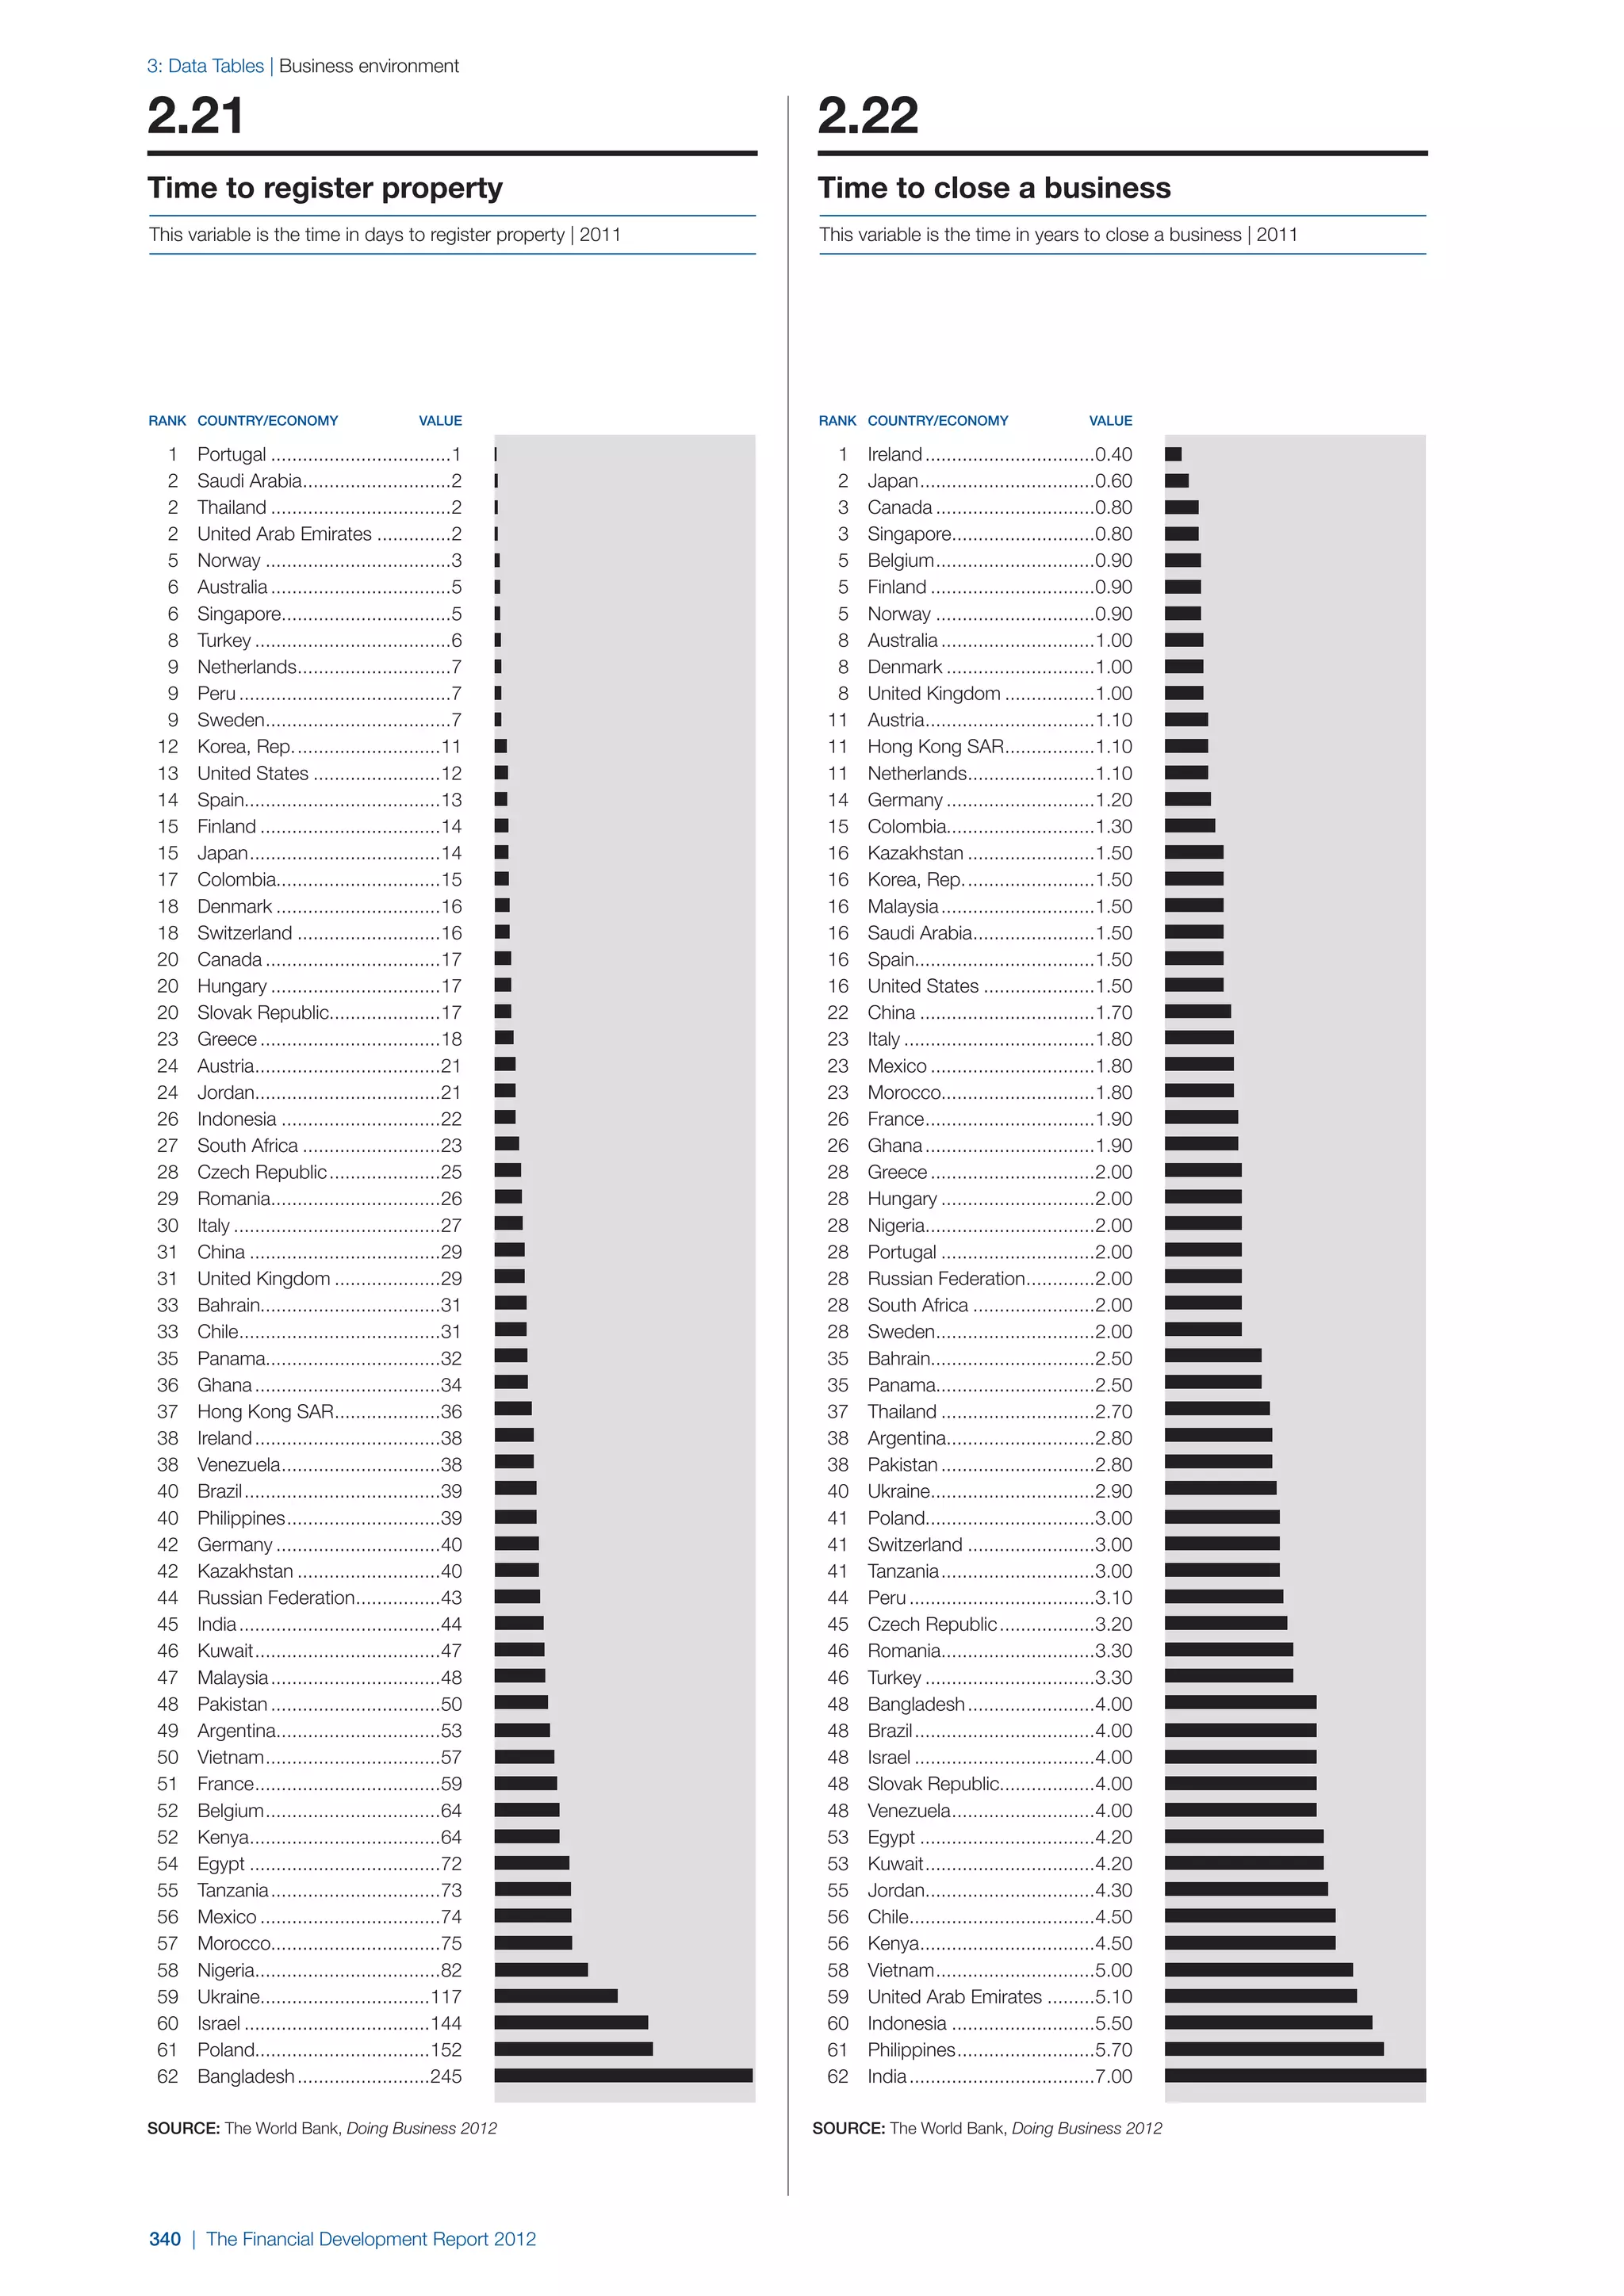


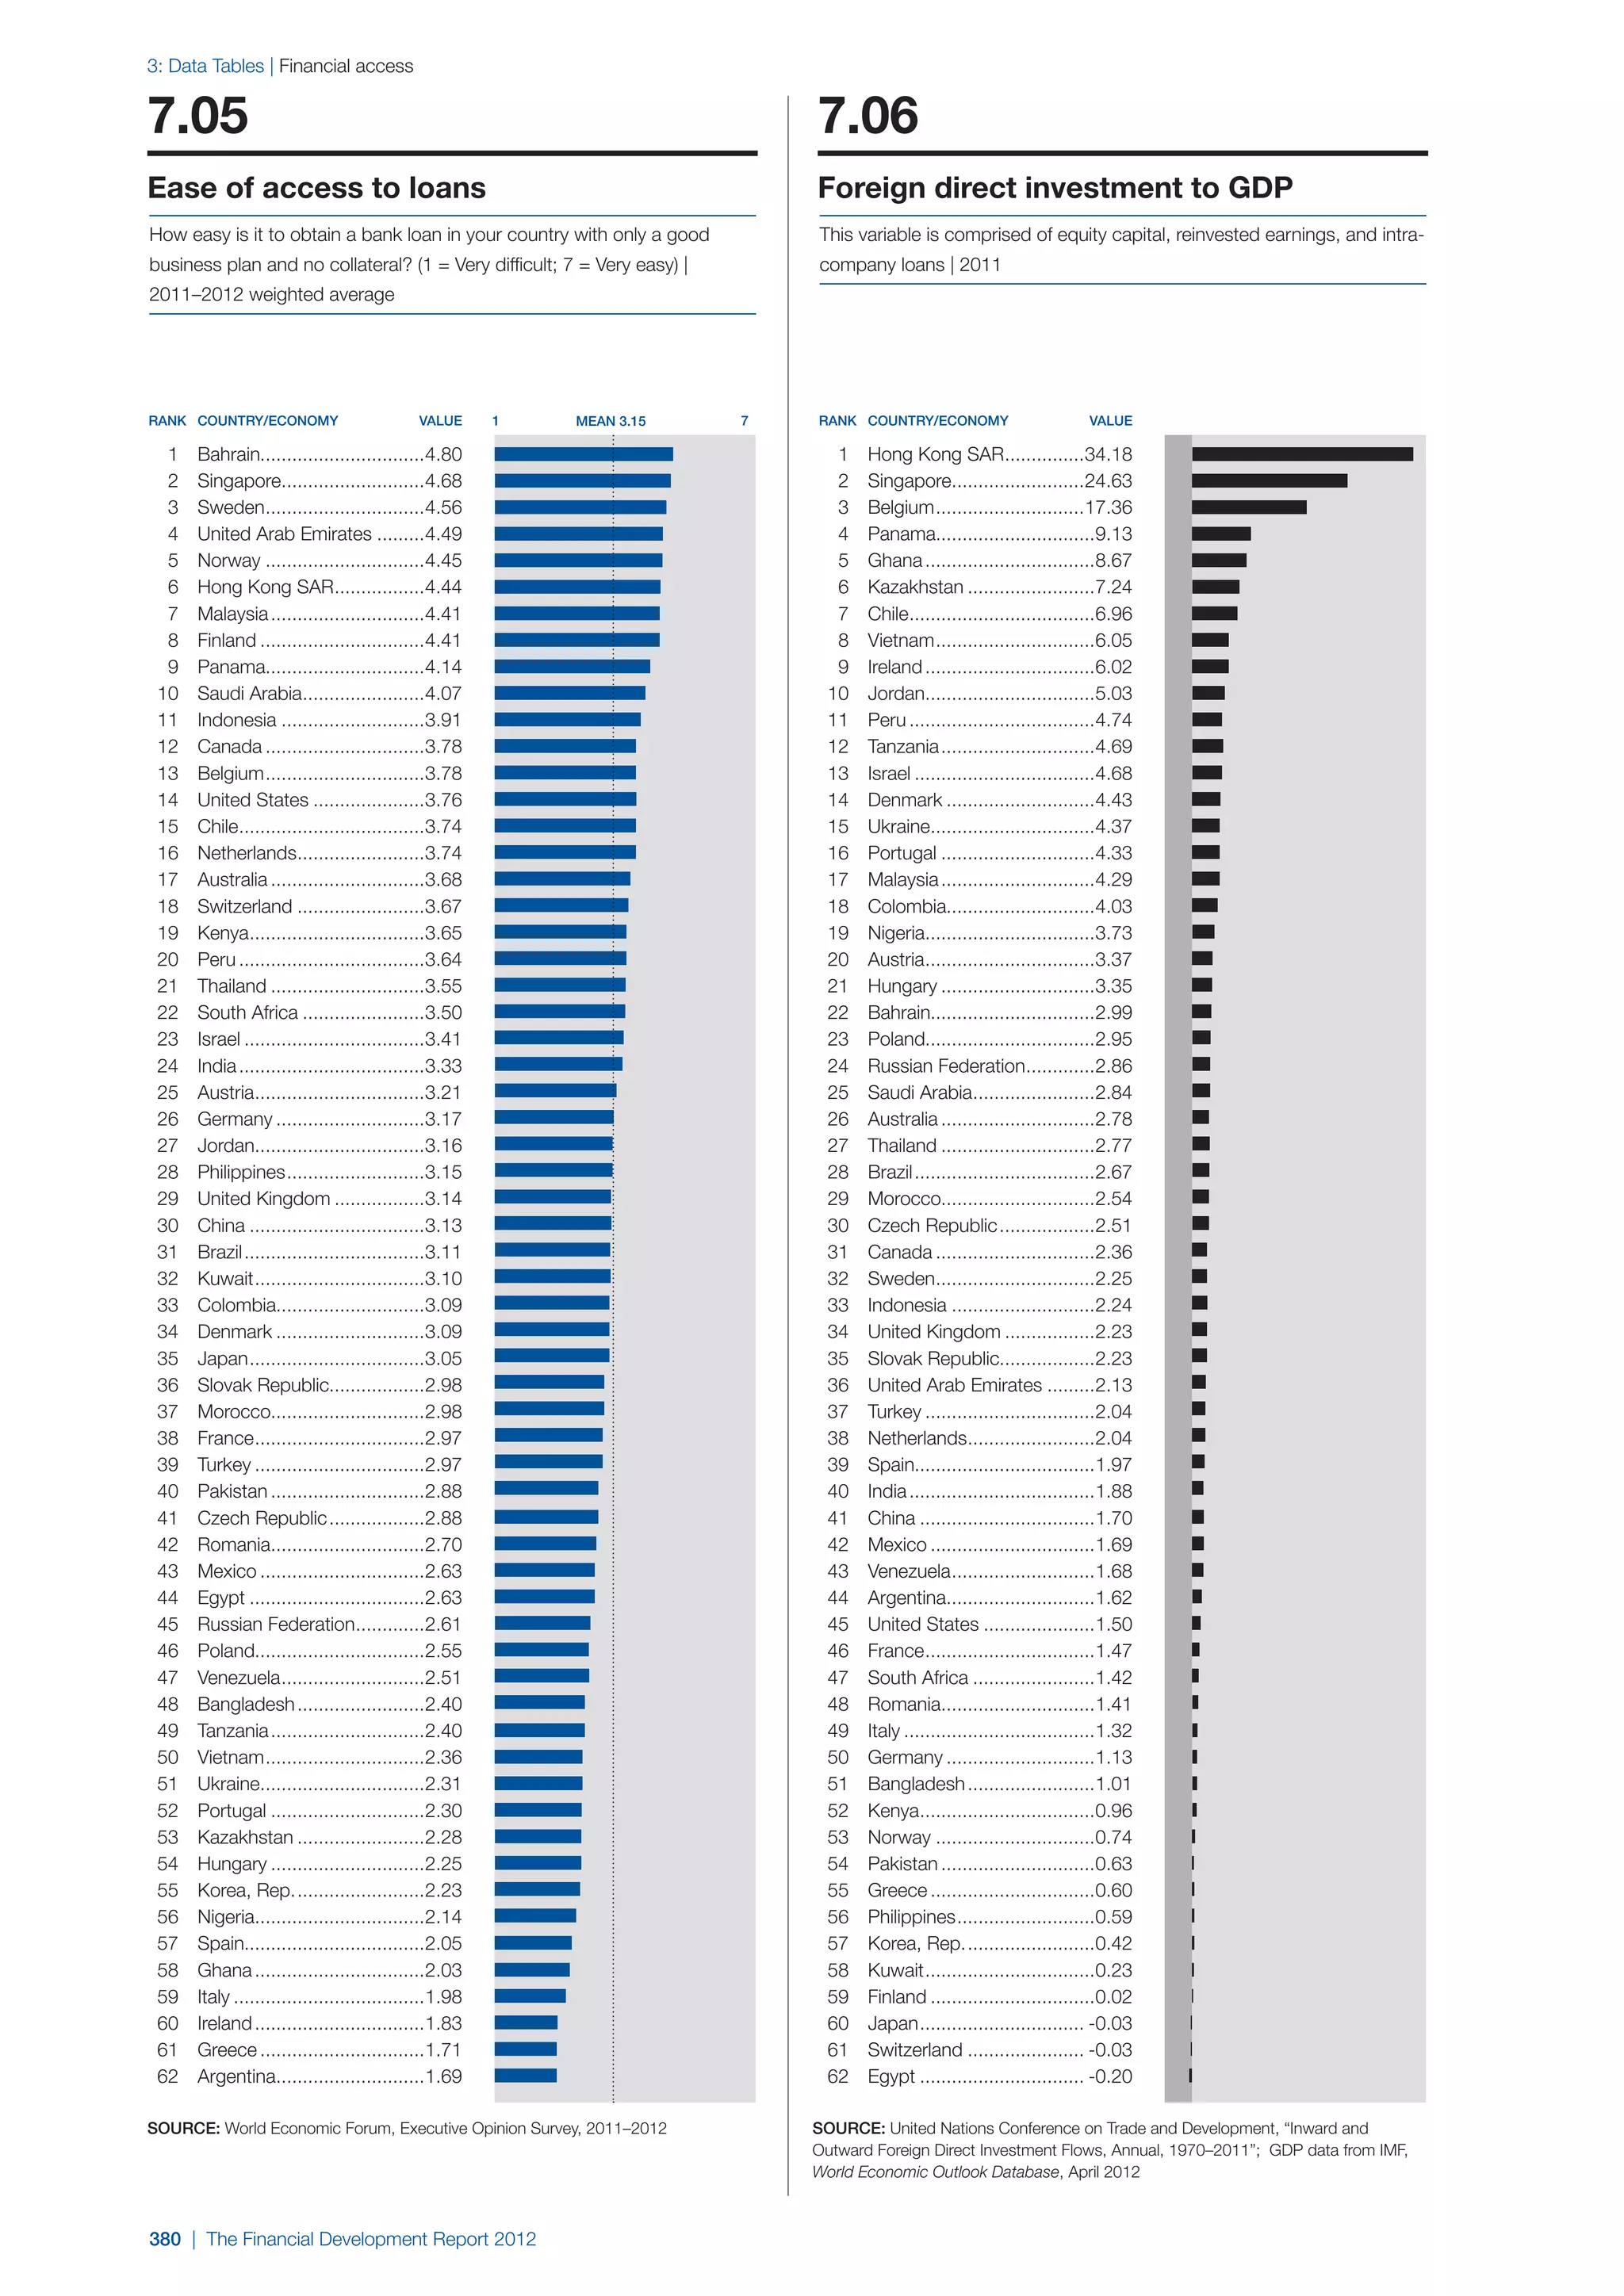
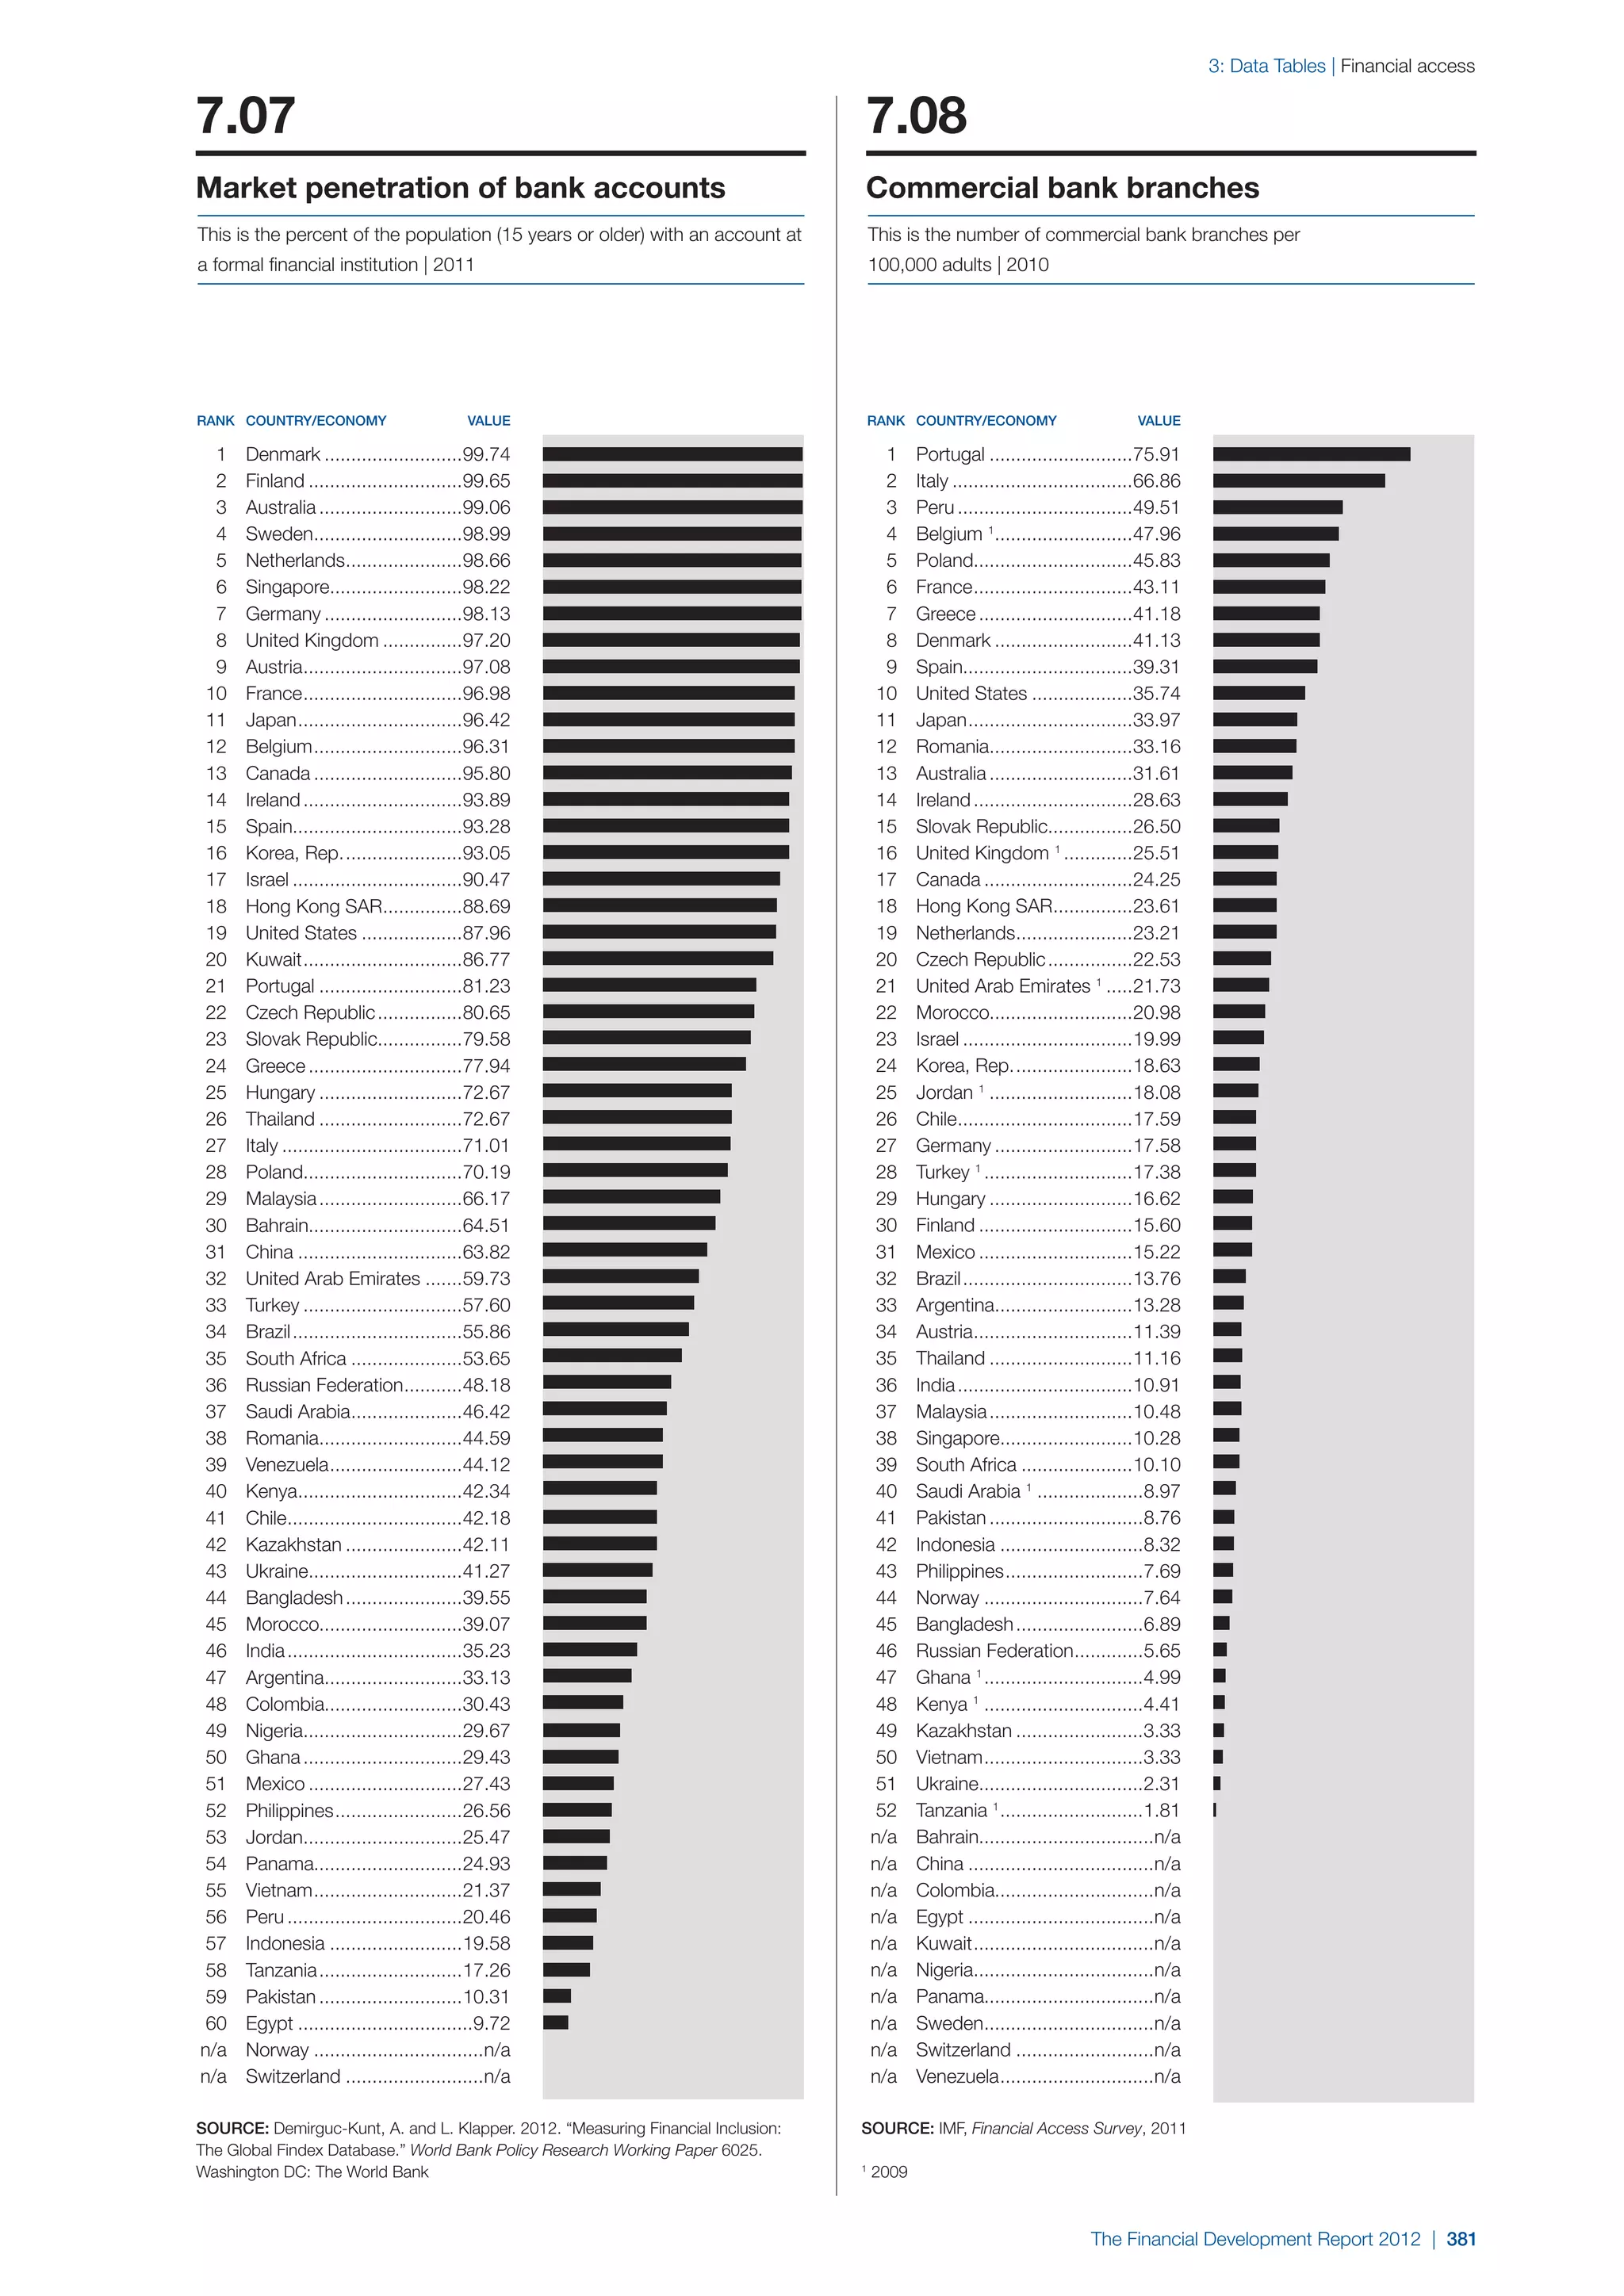
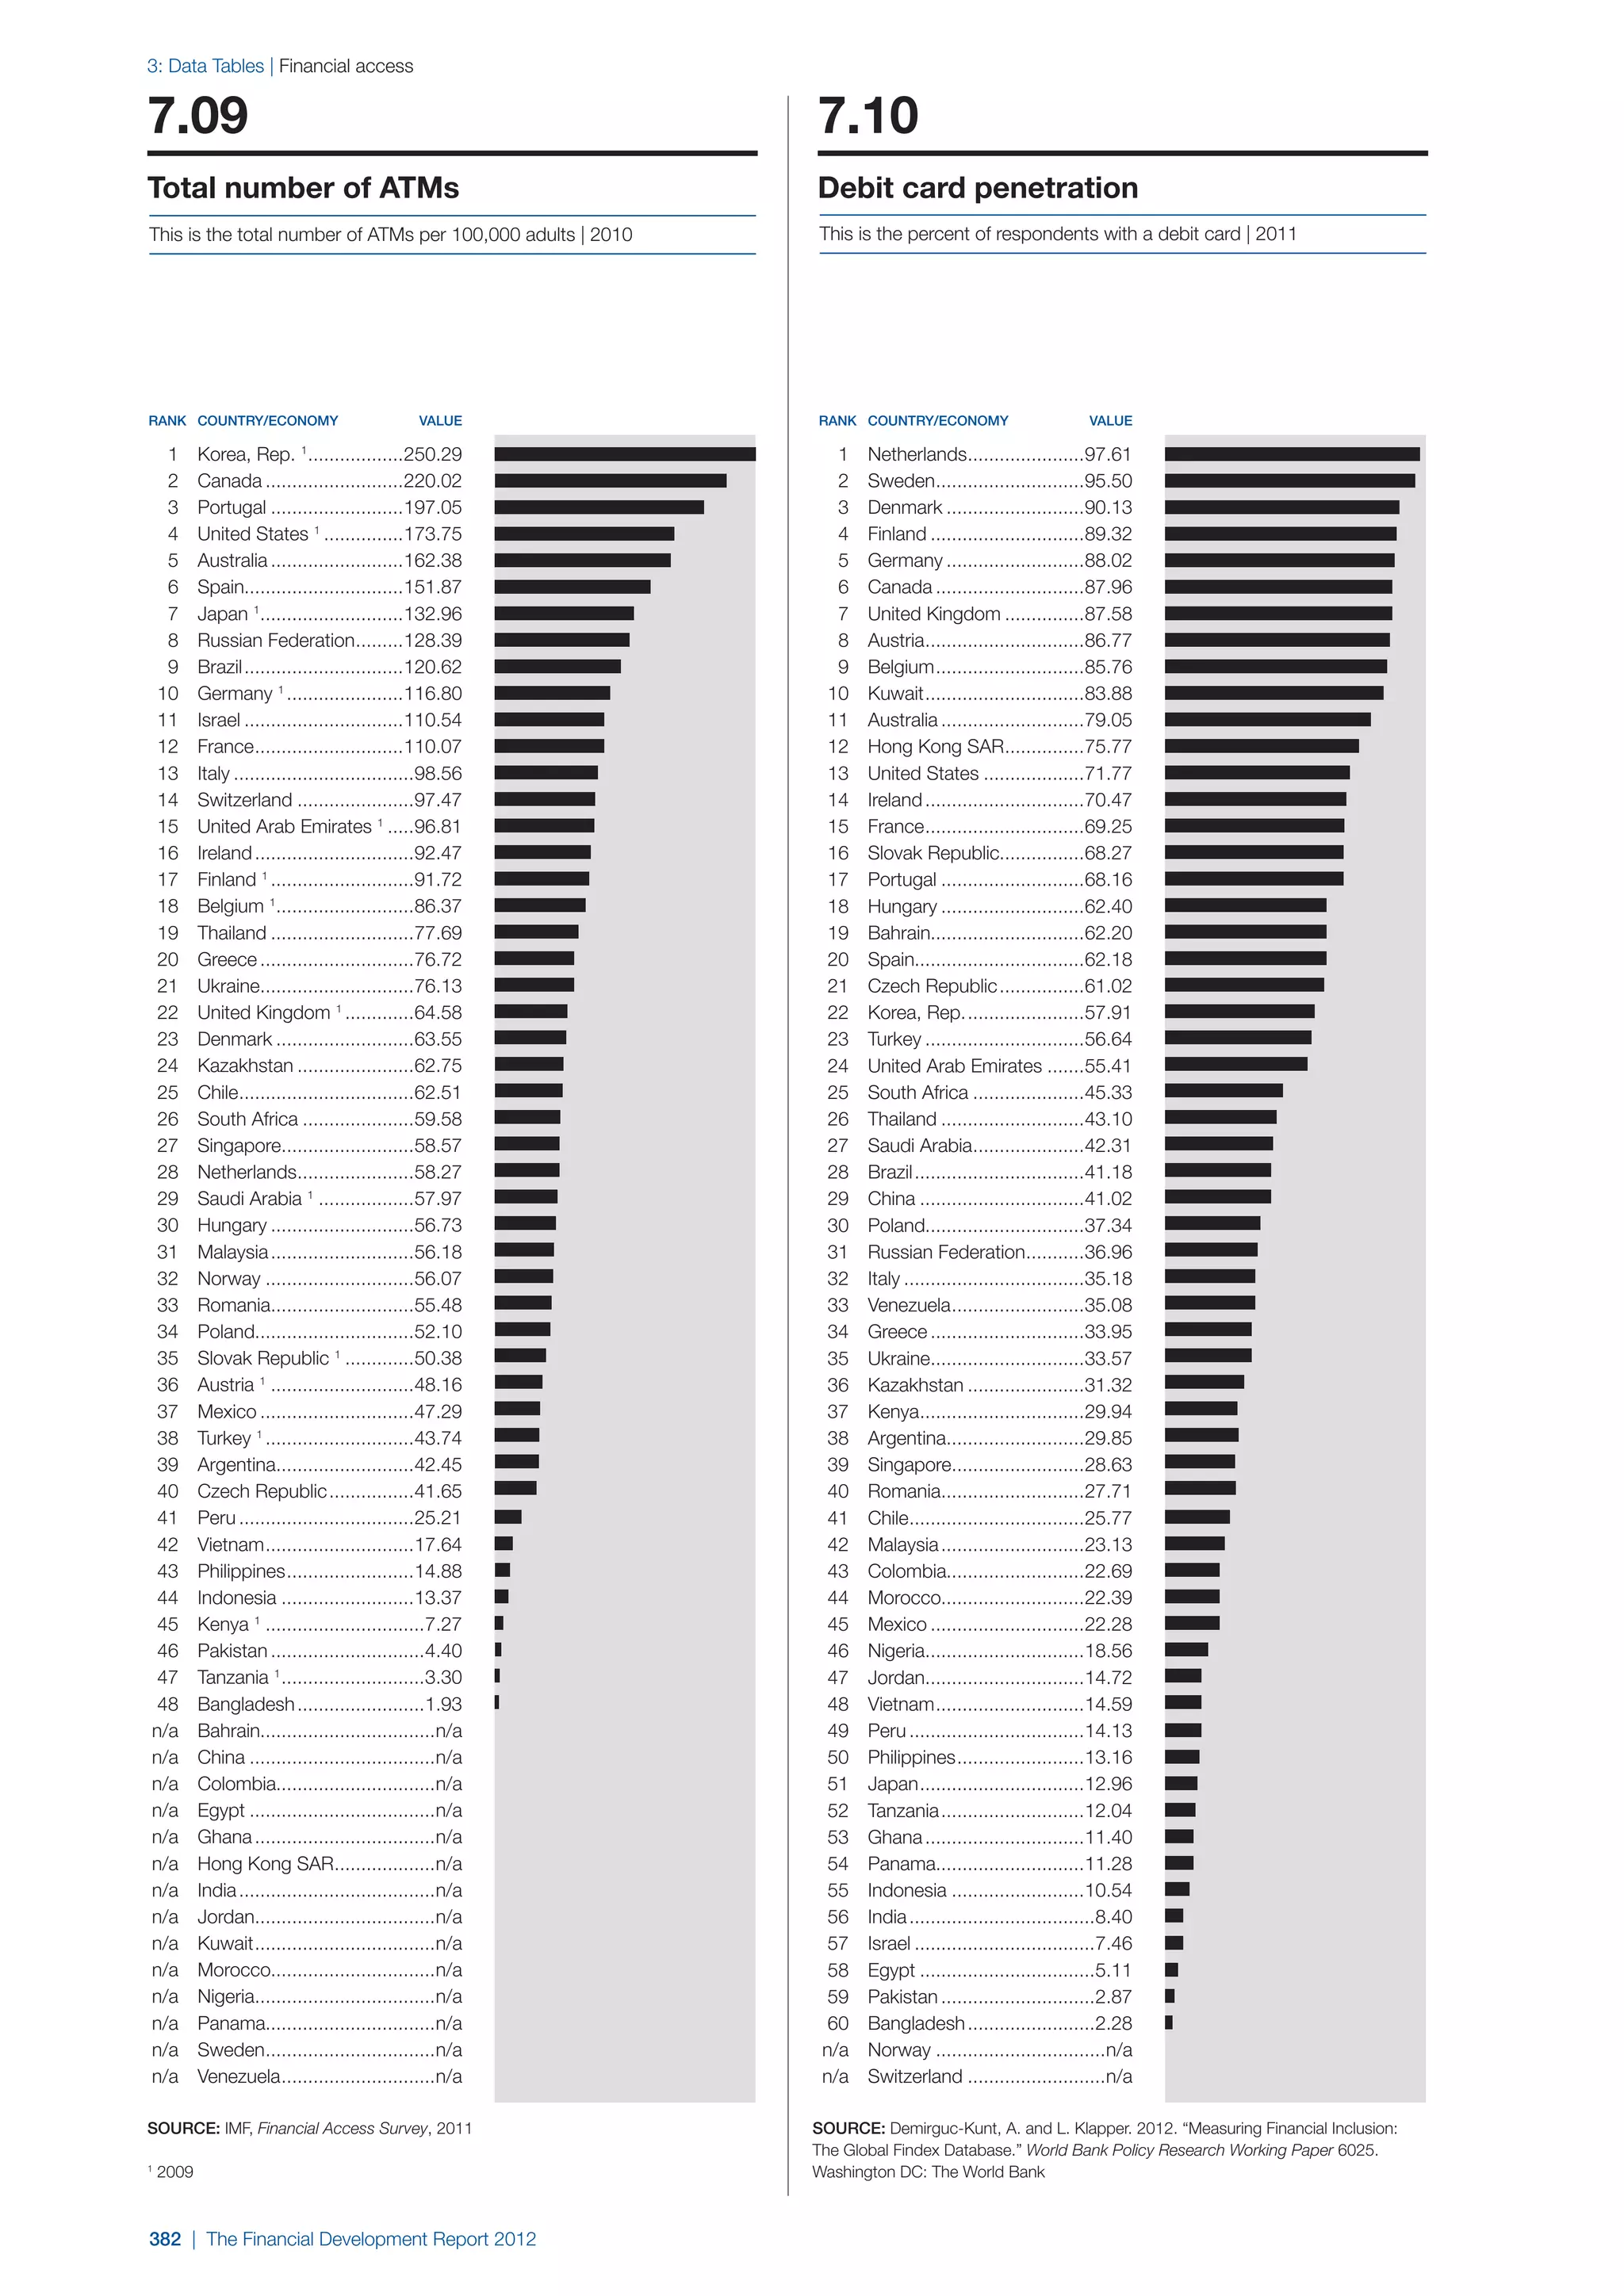
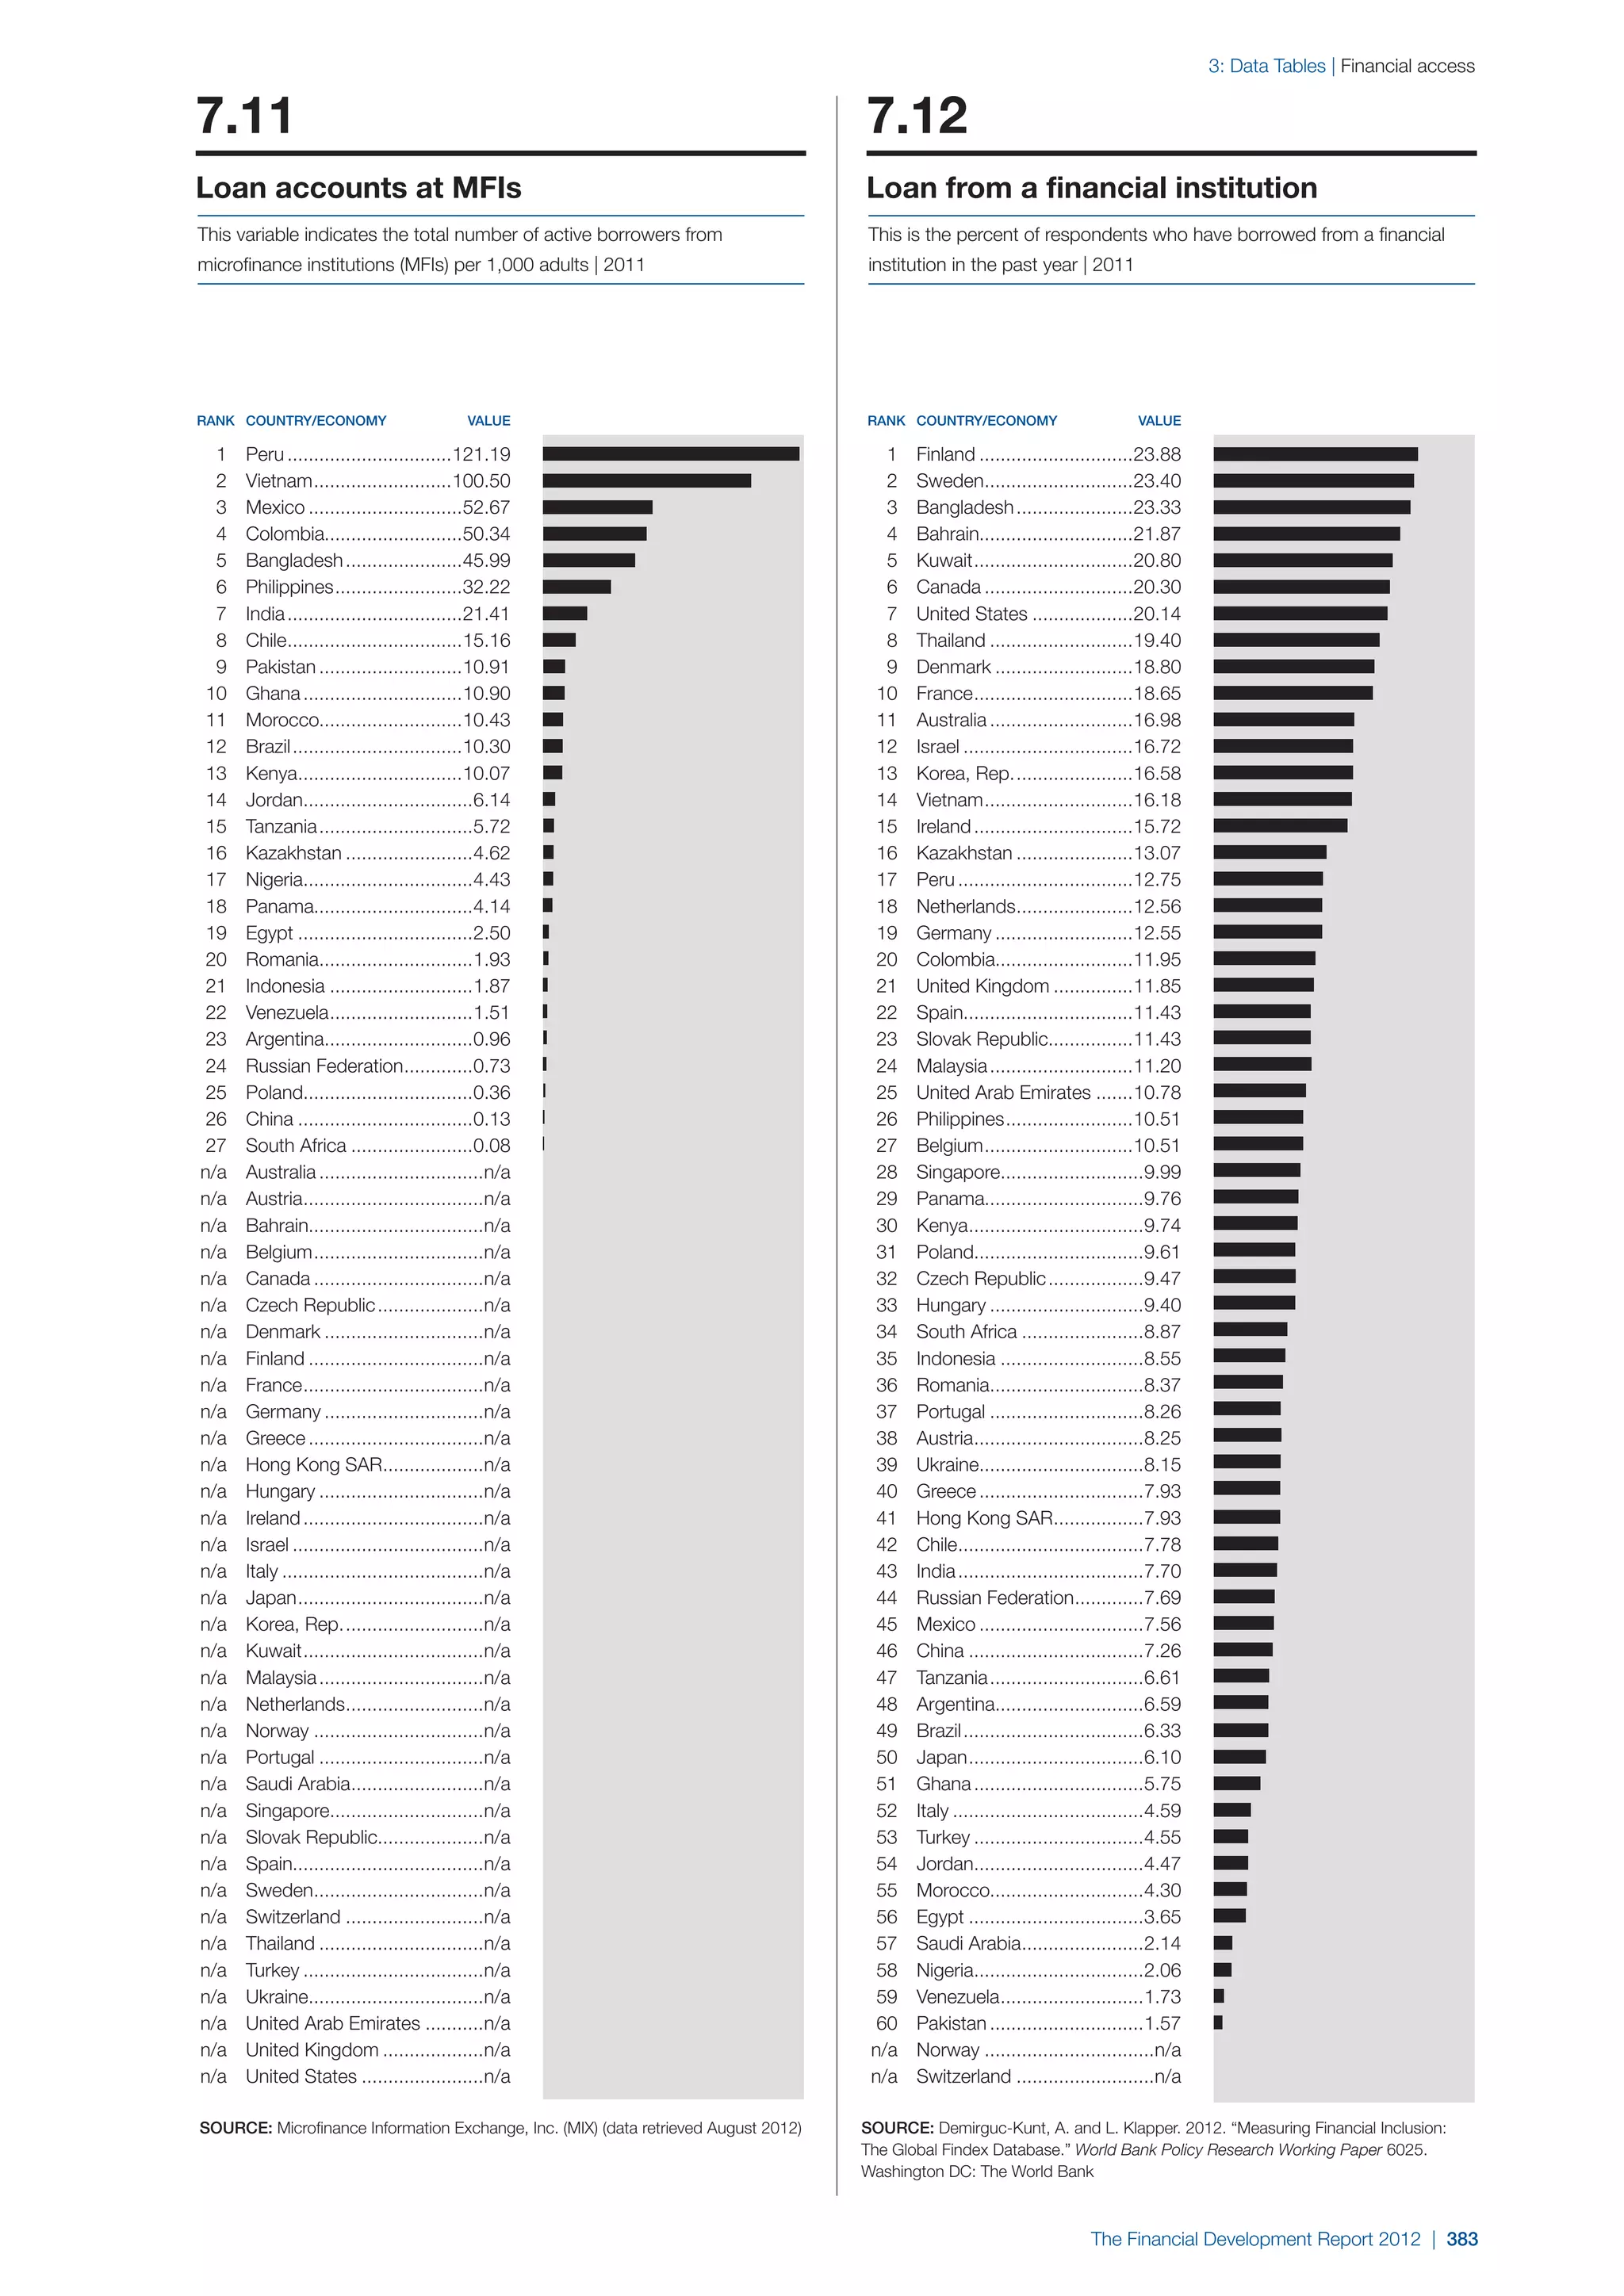

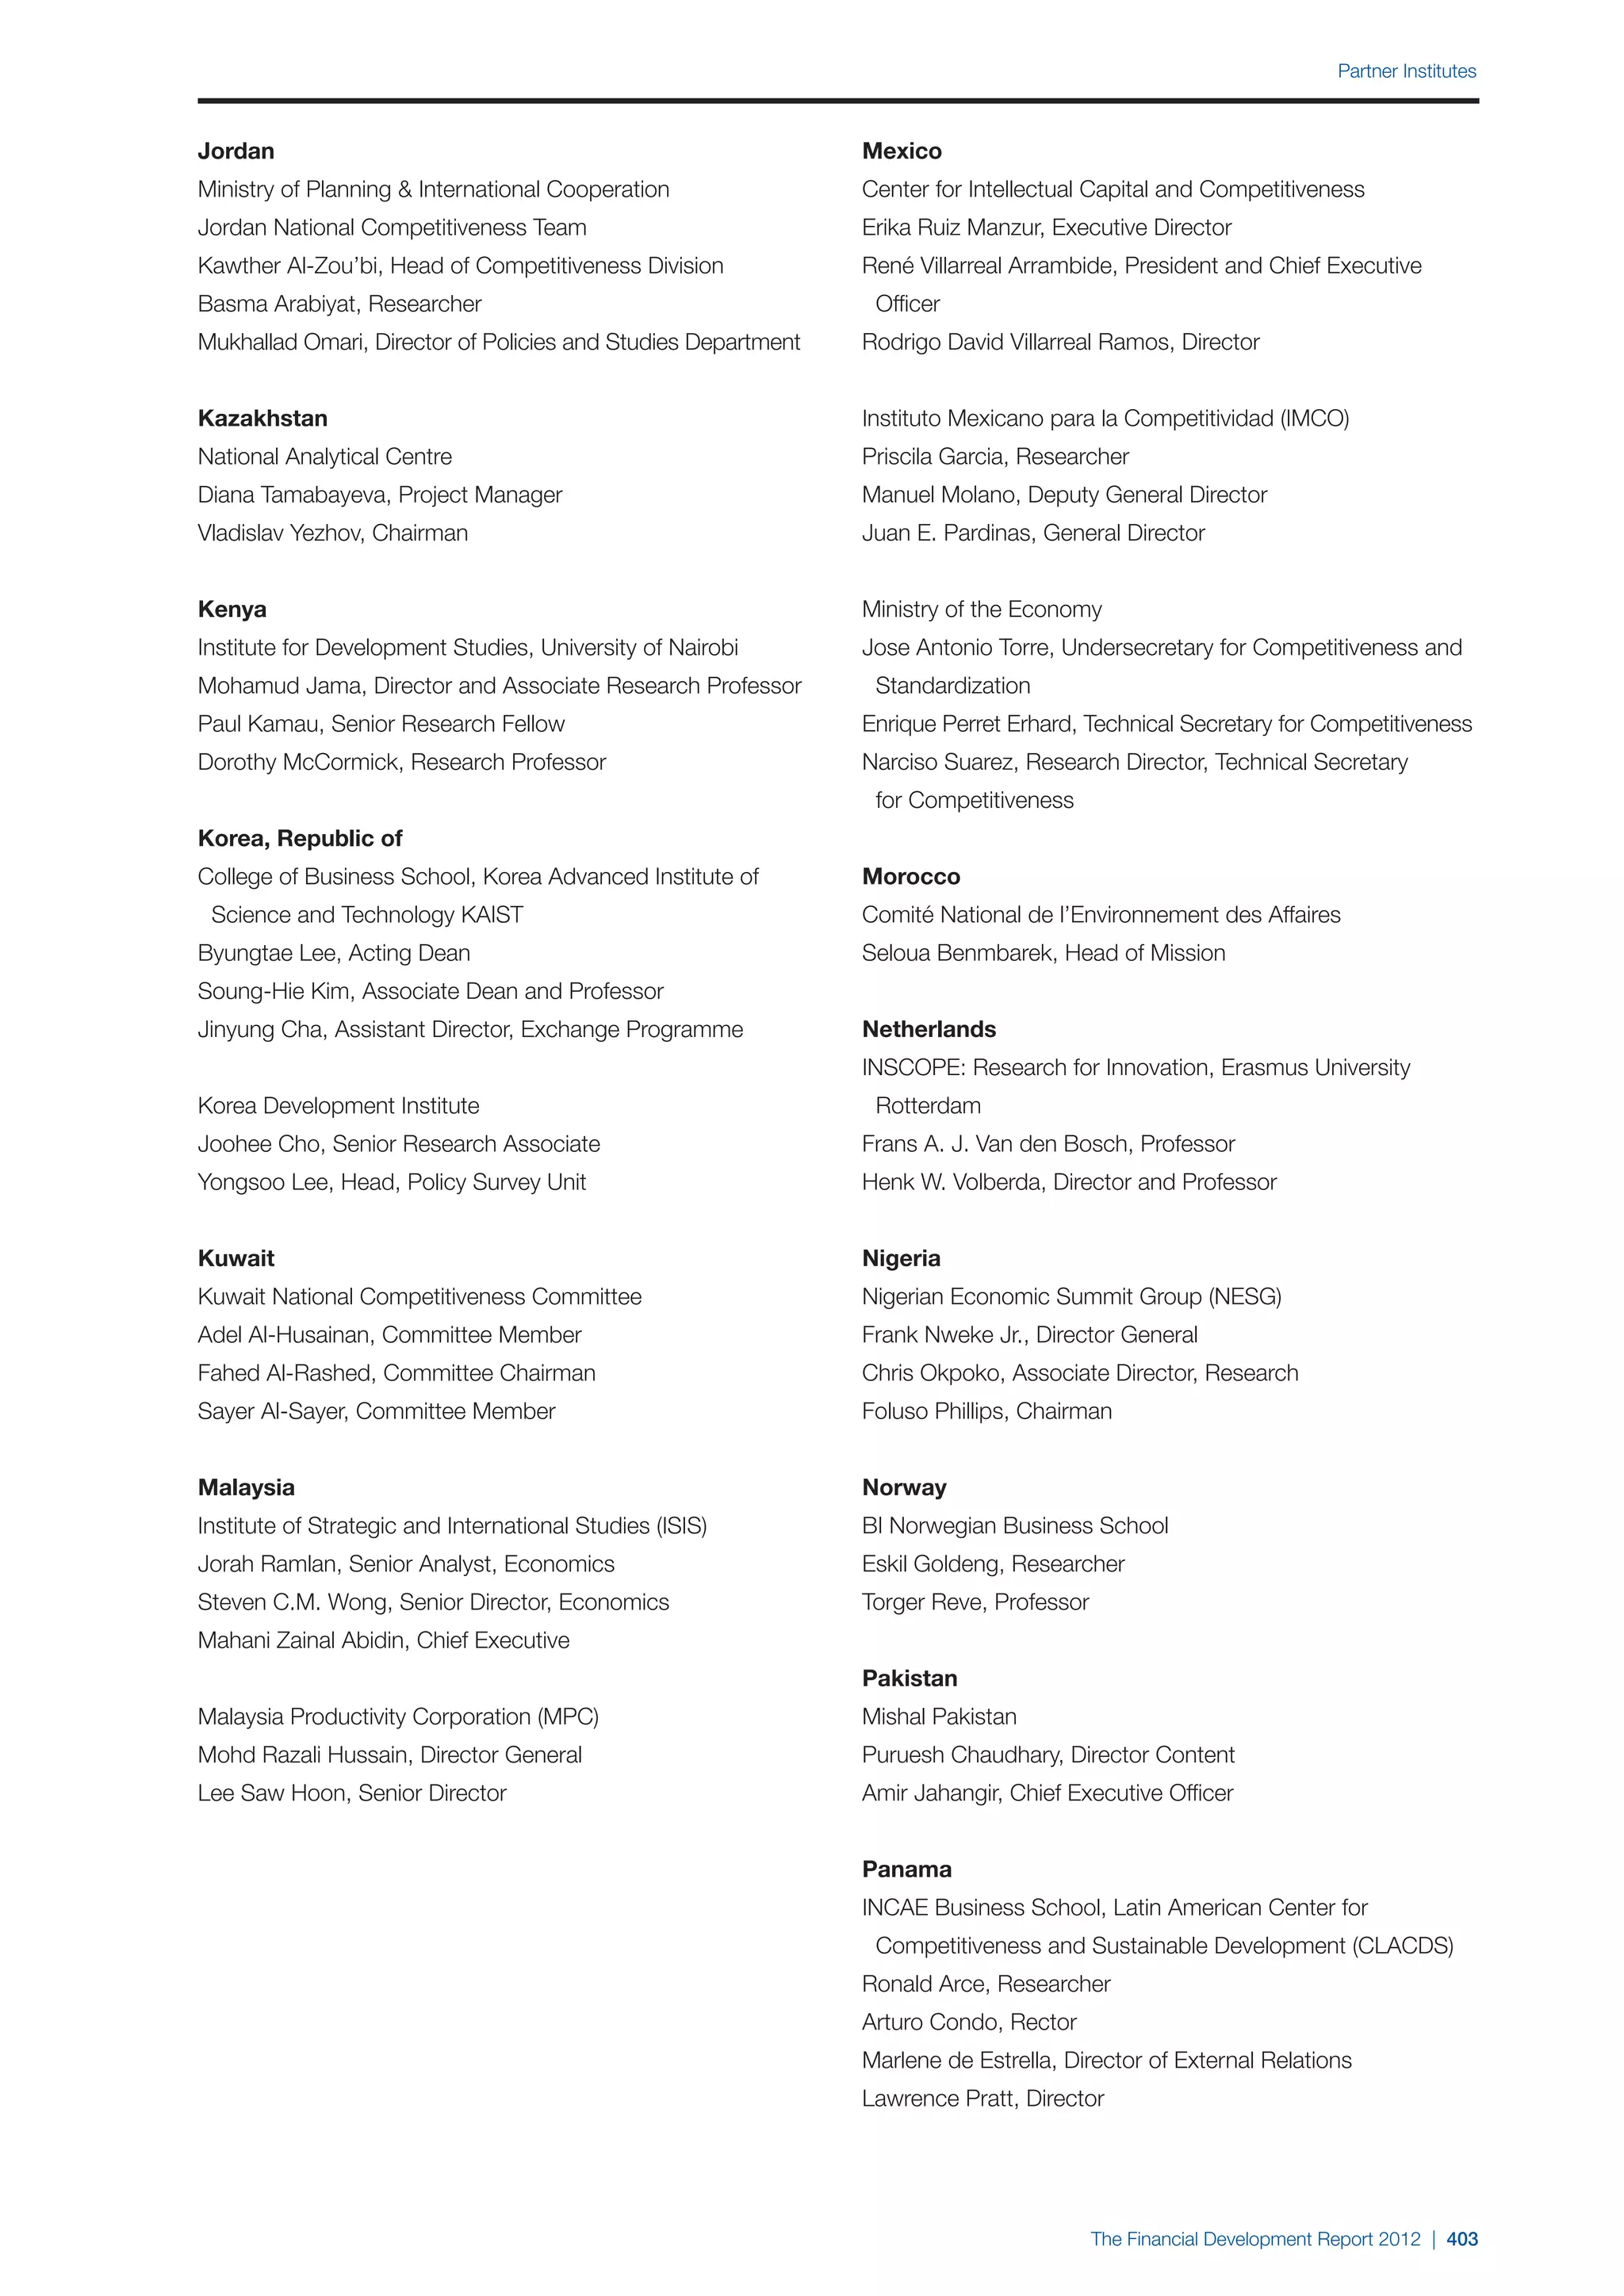


The Financial Development Report 2012 by the World Economic Forum examines the stability and effectiveness of financial systems globally, providing rankings and insights based on the Financial Development Index. Despite some improvement, economic recovery remains fragile, with advanced and emerging markets facing challenges such as high unemployment and debt levels. The report offers a benchmarking tool for identifying areas of weakness and opportunities for reform to foster long-term sustainable growth.


![Wef gcr report_2011-12[1]](https://cdn.slidesharecdn.com/ss_thumbnails/wefgcrreport2011-121-120107061726-phpapp02-thumbnail.jpg?width=640&height=640&fit=bounds)


