Download to read offline


![1.2: Sustainable Competitiveness
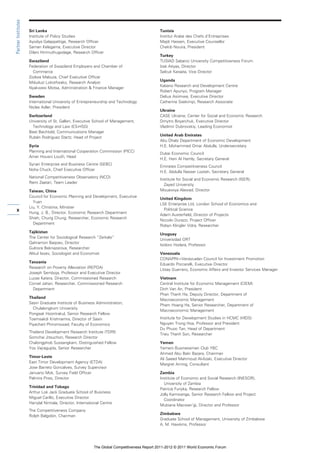
Appendix B: Technical notes and sources for the Sustainable Competitiveness Index variables
This appendix presents the technical descriptions and S01 Gross secondary enrollment rate, males
sources for the additional 19 variables that are specific Gross secondary enrollment rate, males | 2009
The reported value corresponds to the ratio of total secondary
to the Sustainable Competitiveness Index (SCI).These enrollment among boys, regardless of age, to the male popula-
variables are identified by an “S” before the variable tion of the age group that officially corresponds to the second-
ary education level. Secondary education (ISCED levels 2 and
number. They appear here in order, from S01 through 3) completes the provision of basic education that began at the
S19. The numbering indicates only the order of these primary level, and aims to lay the foundations for lifelong learn-
ing and human development, by offering more subject- or skills-
variables in the structure, but not the pillar to which oriented instruction using more specialized teachers.
they belong.
Sources: UNESCO Institute for Statistics (accessed May 4,
The descriptions and sources for the variables 2011); national sources
common to the GCI are available in the Technical
S02 Gross secondary enrollment rate, females
Notes and Sources at the end of the Report.
Gross secondary enrollment rate, females | 2009
The reported value corresponds to the ratio of total second-
ary enrollment among girls, regardless of age, to the female
population of the age group that officially corresponds to the
secondary education level. Secondary education (ISCED levels 2
and 3) completes the provision of basic education that began at
the primary level, and aims at laying the foundations for lifelong
learning and human development, by offering more subject- or
skills-oriented instruction using more specialized teachers.
Sources: UNESCO Institute for Statistics (accessed May 4,
2011); national sources
S03 Expected dependency ratio
Number of dependents (people younger than 15 or older
than 64) to the working-age population (those aged 15–64)
in 2030 | 2010
72 Source: Authors’ calculation based on United Nations World
Population Prospects: The 2010 revision
S04 Gini index
Measure of income inequality [0 = perfect equality; 1 =
perfect inequality] | 2008
This index measures the extent to which the distribution of
income among individuals or households within an economy
deviates from a perfectly equal distribution. A Lorenz curve
plots the cumulative percentages of total income received
against the cumulative number of recipients, starting with the
poorest individual. The Gini index measures the area between
the Lorenz curve and a hypothetical line of absolute equality,
expressed as a percentage of the maximum area under the
line. Thus a Gini index of 0 represents perfect equality, while an
index of 100 implies perfect inequality.
Sources: The World Bank, World Development Indicators
& Global Development Finance Catalog (April 2011 edition);
national sources
S05 Youth unemployment
Unemployment, youth total (percent of total labor force
ages 15–24) | 2009
Youth unemployment refers to the share of the labor force ages
15–24 without work but available for and seeking employment.
Sources: The World Bank, World Development Indicators
& Global Development Finance Catalog (April 2011 edition);
the World Bank in turn sources from the International Labour
Organization, Key Indicators of the Labour Market database;
national sources
S06 Extent of informal economy
How much economic activity in your country would you
estimate to be undeclared or unregistered? [1 = most
economic activity is undeclared or unregistered; 7 = most
economic activity is declared or registered] | 2010–11
weighted average
Source: World Economic Forum, Executive Opinion Survey
The Global Competitiveness Report 2011-2012 © 2011 World Economic Forum](https://image.slidesharecdn.com/wefgcrreport2011-121-120107061726-phpapp02/85/Wef-gcr-report_2011-12-1-87-320.jpg)
![1.2: Sustainable Competitiveness
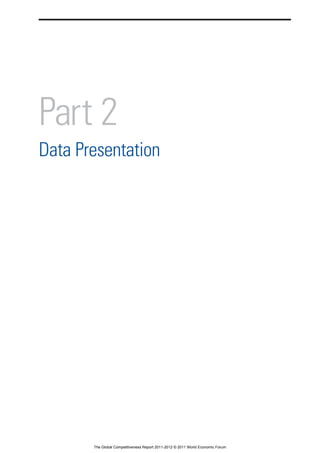
Appendix B: Technical notes and sources for the Sustainable Competitiveness Index variables (cont’d.)
S07 Government budget balance (5-year average) S11 No. of ratified international environmental treaties
General government budget balance as a percentage of Total number of ratified environmental treaties | 2010
GDP (average of the 5 latest years) | 2006–10 This provides the total number of ratified environmental trea-
Government budget balance as a percentage of GDP, calculated ties. This variable measures the total number of international
as a 5-year average of the difference between general govern- treaties from a set of 25 for which a state is a participant. A
ment revenue and general government expenditure. state becomes a “participant” by Ratification, Formal confirma-
tion, Accession, Acceptance, Definitive signature, Approval,
Source: Authors’ calculation based on International Monetary Simplified procedure, Consent to be bound, Succession, and
Fund, World Economic Outlook Database (April 2011 edition) Provisional application (which are here grouped under the
term ratification, for reasons of convenience). The treaties
S08 Stringency of environmental regulation included are: the International Convention for the Regulation
How would you assess the stringency of your country’s of Whaling, 1948 Washington; the International Convention
environmental regulations? [1 = very lax; 7 = among the for the Prevention of Pollution of the Sea by Oil, 1954 London,
world’s most stringent] | 2010–11 weighted average as amended in 1962 and 1969; the Convention on Wetlands
of International Importance especially as Waterfowl Habitat,
Source: World Economic Forum, Executive Opinion Survey 1971 Ramsar; the Convention Concerning the Protection
of the World Cultural and Natural Heritage, 1972 Paris;
S09 Enforcement of environmental regulation the Convention on the Prevention of Marine Pollution by
How would you assess the enforcement of environmental Dumping of Wastes and Other Matter, 1972 London, Mexico
regulations in your country? [1 = very lax; 7 = among the City, Moscow, Washington; the Convention on International
world’s most rigorous] | 2010–11 weighted average Trade in Endangered Species of Wild Fauna and Flora, 1973
Washington; the International Convention for the Prevention
Source: World Economic Forum, Executive Opinion Survey of Pollution from Ships (MARPOL) as modified by the Protocol
of 1978, 1978 London; the Convention on the Conservation
S10 Eco-region protection of Migratory Species of Wild Animals, 1979 Bonn; the United
Terrestrial area and territorial waters protected (in km2 and Nations Convention on the Law of the Sea, 1982 Montego
as a percentage of terrestrial area and territorial waters up Bay; the Convention on the Protection of the Ozone Layer,
to 12 nautical miles) | 2010 1985 Vienna; the Protocol on Substances that Deplete the
This indicator assesses whether a country is protecting at Ozone Layer, 1987 Montreal; the Convention on the Control
least 10 percent of all of its biomes (e.g., deserts, forests, of Transboundary Movements of Hazardous Wastes and
grasslands, aquatic area, and tundra). It is designed to capture their Disposal, 1989 Basel; the International Convention on
the comprehensiveness of a government’s commitment to Oil Pollution Preparedness, Response and Co-operation,
habitat preservation and biodiversity protection. The World 1990 London; the United Nations Framework Convention on
Climate Change, 1992 New York; the Convention on Biological 73
Wildlife Fund provides the underlying biome data, and the
United Nations Environment Programme World Conservation Diversity, 1992 Rio de Janeiro; the International Convention
Monitoring Centre provides the underlying data on protected to Combat Desertification in Those Countries Experiencing
areas. Serious Drought and/or Desertification, particularly Africa, 1994
Paris; the Agreement relating to the Implementation of Part
Sources: IUCN and UNEP-WCMC (2011), The World Database XI of the United Nations Convention on the Law of the Sea of
on Protected Areas (WDPA): January 2011 10 December 1982, 1994 New York; the Agreement relating
to the Provisions of the United Nations Convention on the Lay
of the Sea relating to the Conservation and Management of
Straddling Fish Stocks and Highly Migratory Fish Stocks, 1995
New York; the Kyoto Protocol to the United Nations Framework
Convention on the Climate Change, Kyoto 1997; the Rotterdam
Convention on the Prior Informed Consent Procedure for
Certain Hazardous Chemicals and Pesticides in International
Trade, 1998 Rotterdam; the Cartagena Protocol of Biosafety
to the Convention on Biological Diversity, 2000 Montreal;
the Protocol on Preparedness, Response and Cooperation to
Pollution Incidents by Hazardous and Noxious Substances,
2000 London; the Stockholm Convention on Persistent Organic
Pollutants, 2001 Stockholm; the International Treaty on Plant
Genetic Resources for Food and Agriculture, 2001 Rome; and
the International Tropical Timber Agreement 206, 1994 Geneva.
Source: The International Union for Conservation of Nature
(IUCN) Environmental Law Centre ELIS Treaty Database
S12 Energy intensity
Energy use (kilotonnes TNT [kt] of oil equivalent) per
industry value-added (US$) | 2008
This indicator is calculated as a ratio between the total energy
use (expressed as kt of oil equivalent) to the value-added of the
industry sector (expressed as current US$). Energy use refers
to the use of primary energy before its transformation to other
end-use fuels, which is equal to indigenous production plus
imports and stock changes, minus exports and fuels supplied to
ships and aircraft engaged in international transport. The ratio-
nale for dividing the energy use by the industry value- added is
to obtain a proxy of energy consumption proportional to indus-
trial activity. This is necessary in order to compare countries
characterized by different levels of economic activity.
Sources: Authors’ calculation based on The World Bank, World
Development Indicators & Global Development Finance Catalog
(April 2011 edition); national sources
The Global Competitiveness Report 2011-2012 © 2011 World Economic Forum](https://image.slidesharecdn.com/wefgcrreport2011-121-120107061726-phpapp02/85/Wef-gcr-report_2011-12-1-88-320.jpg)
![1.2: Sustainable Competitiveness
Appendix B: Technical notes and sources for the Sustainable Competitiveness Index variables (cont’d.)
S13 Agricultural water intensity S16 Marine trophic intensity
Agricultural water withdrawal as a percent of total Trend line slope | 2004
renewable water resources | 2002 This indicator measures the slope of the trend line in the
This indicator is calculated as the ratio of (100 × Agricultural Marine Trophic Index (MTI) from 1980 to 2004. If the slope is
water withdrawal) to Total renewable water resources, where 0 or positive, the fishery is either stable or improving. If the
Total renewable water resources = (Total surface renewable slope is negative (below 0), it means the fishery is declining,
water + Total renewable groundwater – Overlap between sur- and that smaller and smaller fish are being caught. Using the
face water and groundwater). Where available, Total renewable Sea Around Us website, data were gathered on the slope of
water resources include the percent of desalinated water used the trend line in the Marine Trophic Index (MTI) from 1980
for agriculture (Kuwait, Saudi Arabia, the United Arab Emirates, to 2004 for a country’s exclusive economic zones (EEZs). For
Qatar, Bahrain, and Spain). They also include renewable fresh- countries with more than one EEZ, a weighted average slope
water resources as well as the potential over-abstraction of was calculated on the basis of the relative size of the EEZs. The
renewable groundwater or the withdrawal of fossil ground- marine trophic level ranges from 1 in plants to 4 or 5 in larger
water, the use of agricultural drainage water, and desalinated predators. It expresses the relative position of fish and other
water and treated wastewater. They include water withdrawn animals in the hierarchical food chain that nourishes them. They
for irrigation purposes and for livestock watering, although— provide food for small fish that have a trophic level of about 3,
depending on the country—this last category sometimes is and the small fish are eaten by slightly larger fish that have a
included in municipal water withdrawal. The value of water trophic level of 4, which, in turn, are what large predators such
withdrawn for irrigation far exceeds the consumptive use of as sharks and marine mammals and humans typically eat (Pauly
irrigation because of water lost in its distribution from its source and MacLean 2003). If the average level at which a country’s
to the crops. The term water requirement ratio (sometimes also fisheries are catching fish declines over time, it means that
called irrigation efficiency) is used to indicate the ratio between
efficiency the overall the trophic structure of the marine ecosystem is
the net irrigation water requirements or crop water require- becoming depleted of larger fish higher up the food chain, and
ments, which is the volume of water needed to compensate is resorting to smaller fish.
for the deficit between potential evapotranspiration and effec-
tive precipitation over the growing period of the crop, and the Sources: Environmental Performance Index (EPI), Yale
amount of water withdrawn for irrigation, including the losses. University; the Sea Around Us Project; the Convention on
In the specific case of paddy rice irrigation, additional water is Biological Diversity
needed for flooding to facilitate land preparation and to protect
plants. In that case, irrigation water requirements are the sum S17 Forest cover change
of rainfall deficit and the water needed to flood paddy fields. At Annual percent change in forest cover between 2000 and
the scheme level, water requirement ratio values can vary from 2010 | 2000–2010
less than 20 percent to more than 95 percent. For livestock
74 watering, the ratio between net consumptive use and water Source: Food and Agriculture Organization of the United
withdrawn is estimated to be between 60 and 90 percent. Nations (FAO), State of the World’s Forests 2011
By default, livestock water use is accounted for in agricultural
water use, although some countries include it in municipal S18 Air pollution
water withdrawal. Annual average PM2.5 (particulate matter with an
aerodynamic diameter less than or equal to 2.5
Sources: Environmental Performance Index (EPI), Yale
micrometers) concentration for 2001–06, population
University; Food and Agricultural Organization of the United
weighted by country | 2010
Nations (FAO), Aquastat
This indicator is based on satellite data that are then converted
to ground-level concentrations using the GEOS-Chem global
S14 CO2 intensity
chemical transport model to account for the meteorological and
CO2 intensity (kg of CO2 per kg of oil equivalent energy use) chemical factors that influence the spatially and temporally vary-
| 2007 ing relationship between column and surface concentrations.
Carbon dioxide emissions from solid fuel consumption refer The 0.1 x 0.1° resolution aerosol optical depth (AOD) values for
mainly to emissions from the use of coal as an energy source. 2001–06 are derived from the NASA Terra MODIS and MISR
sensors, averaged to get a 6-year mean AOD for each grid cell,
Sources: The World Bank, World Development Indicators
and then population-weighted to better represent human expo-
& Global Development Finance Catalog (April 2011 edition);
sure by country.
national sources
Source: NASA MODIS and MISR data, processed by Dalhousie
S15 Access to improved drinking water University (van Donkelaar et al. [2010]), Battelle, and CIESIN
Access to improved drinking water, percentage of
population | 2008 S19 Water stress index
This variable refers to the percentage of the population with Percentage of a country’s territory affected by
reasonable access to an adequate amount of water from an oversubscription of water resources | 1995
improved source, such as a household connection, public stand- Countries can to some extent accommodate oversubscription
pipe, borehole, protected well or spring, or rainwater collection. in one region with inter-basin transfers, but these engender
Unimproved sources include vendors, tanker trucks, and unpro- significant environmental impacts of their own. Thus, the ulti-
tected wells and springs. Reasonable access is defined as the mate target for each country is to have no area of their territory
availability of at least 20 liters per person per day from a source affected by oversubscription. A high degree of oversubscription
within 1 kilometer of the dwelling. is indicated when the water use is more than 40 percent of
available supply. This indicator is calculated as: Total freshwater
Source: World Health Organization, World Health Statistics
withdrawal (surface water + groundwater) + Desalinated water
2011, retrieved May 2011
produced + Treated wastewater reused, as a percent of total
renewable water resources.
Sources: Environmental Performance Index (EPI), Yale
University; University of New Hampshire, Water Systems
Analysis Group
The Global Competitiveness Report 2011-2012 © 2011 World Economic Forum](https://image.slidesharecdn.com/wefgcrreport2011-121-120107061726-phpapp02/85/Wef-gcr-report_2011-12-1-89-320.jpg)


![Wef gcr report_2011-12[1]](https://image.slidesharecdn.com/wefgcrreport2011-121-120107061726-phpapp02/85/Wef-gcr-report_2011-12-1-113-320.jpg)
![Wef gcr report_2011-12[1]](https://image.slidesharecdn.com/wefgcrreport2011-121-120107061726-phpapp02/85/Wef-gcr-report_2011-12-1-114-320.jpg)
![Wef gcr report_2011-12[1]](https://image.slidesharecdn.com/wefgcrreport2011-121-120107061726-phpapp02/85/Wef-gcr-report_2011-12-1-115-320.jpg)
![Wef gcr report_2011-12[1]](https://image.slidesharecdn.com/wefgcrreport2011-121-120107061726-phpapp02/85/Wef-gcr-report_2011-12-1-116-320.jpg)
![Wef gcr report_2011-12[1]](https://image.slidesharecdn.com/wefgcrreport2011-121-120107061726-phpapp02/85/Wef-gcr-report_2011-12-1-117-320.jpg)
![Wef gcr report_2011-12[1]](https://image.slidesharecdn.com/wefgcrreport2011-121-120107061726-phpapp02/85/Wef-gcr-report_2011-12-1-118-320.jpg)
![Wef gcr report_2011-12[1]](https://image.slidesharecdn.com/wefgcrreport2011-121-120107061726-phpapp02/85/Wef-gcr-report_2011-12-1-119-320.jpg)
![Wef gcr report_2011-12[1]](https://image.slidesharecdn.com/wefgcrreport2011-121-120107061726-phpapp02/85/Wef-gcr-report_2011-12-1-120-320.jpg)
![Wef gcr report_2011-12[1]](https://image.slidesharecdn.com/wefgcrreport2011-121-120107061726-phpapp02/85/Wef-gcr-report_2011-12-1-121-320.jpg)
![Wef gcr report_2011-12[1]](https://image.slidesharecdn.com/wefgcrreport2011-121-120107061726-phpapp02/85/Wef-gcr-report_2011-12-1-122-320.jpg)
![Wef gcr report_2011-12[1]](https://image.slidesharecdn.com/wefgcrreport2011-121-120107061726-phpapp02/85/Wef-gcr-report_2011-12-1-123-320.jpg)
![Wef gcr report_2011-12[1]](https://image.slidesharecdn.com/wefgcrreport2011-121-120107061726-phpapp02/85/Wef-gcr-report_2011-12-1-124-320.jpg)
![Wef gcr report_2011-12[1]](https://image.slidesharecdn.com/wefgcrreport2011-121-120107061726-phpapp02/85/Wef-gcr-report_2011-12-1-125-320.jpg)
![Wef gcr report_2011-12[1]](https://image.slidesharecdn.com/wefgcrreport2011-121-120107061726-phpapp02/85/Wef-gcr-report_2011-12-1-126-320.jpg)
![Wef gcr report_2011-12[1]](https://image.slidesharecdn.com/wefgcrreport2011-121-120107061726-phpapp02/85/Wef-gcr-report_2011-12-1-127-320.jpg)
![Wef gcr report_2011-12[1]](https://image.slidesharecdn.com/wefgcrreport2011-121-120107061726-phpapp02/85/Wef-gcr-report_2011-12-1-128-320.jpg)
![Wef gcr report_2011-12[1]](https://image.slidesharecdn.com/wefgcrreport2011-121-120107061726-phpapp02/85/Wef-gcr-report_2011-12-1-129-320.jpg)
![Wef gcr report_2011-12[1]](https://image.slidesharecdn.com/wefgcrreport2011-121-120107061726-phpapp02/85/Wef-gcr-report_2011-12-1-130-320.jpg)
![Wef gcr report_2011-12[1]](https://image.slidesharecdn.com/wefgcrreport2011-121-120107061726-phpapp02/85/Wef-gcr-report_2011-12-1-131-320.jpg)
![Wef gcr report_2011-12[1]](https://image.slidesharecdn.com/wefgcrreport2011-121-120107061726-phpapp02/85/Wef-gcr-report_2011-12-1-132-320.jpg)
![Wef gcr report_2011-12[1]](https://image.slidesharecdn.com/wefgcrreport2011-121-120107061726-phpapp02/85/Wef-gcr-report_2011-12-1-133-320.jpg)
![Wef gcr report_2011-12[1]](https://image.slidesharecdn.com/wefgcrreport2011-121-120107061726-phpapp02/85/Wef-gcr-report_2011-12-1-134-320.jpg)
![Wef gcr report_2011-12[1]](https://image.slidesharecdn.com/wefgcrreport2011-121-120107061726-phpapp02/85/Wef-gcr-report_2011-12-1-135-320.jpg)
![Wef gcr report_2011-12[1]](https://image.slidesharecdn.com/wefgcrreport2011-121-120107061726-phpapp02/85/Wef-gcr-report_2011-12-1-136-320.jpg)
![Wef gcr report_2011-12[1]](https://image.slidesharecdn.com/wefgcrreport2011-121-120107061726-phpapp02/85/Wef-gcr-report_2011-12-1-137-320.jpg)
![Wef gcr report_2011-12[1]](https://image.slidesharecdn.com/wefgcrreport2011-121-120107061726-phpapp02/85/Wef-gcr-report_2011-12-1-138-320.jpg)
![Wef gcr report_2011-12[1]](https://image.slidesharecdn.com/wefgcrreport2011-121-120107061726-phpapp02/85/Wef-gcr-report_2011-12-1-139-320.jpg)
![Wef gcr report_2011-12[1]](https://image.slidesharecdn.com/wefgcrreport2011-121-120107061726-phpapp02/85/Wef-gcr-report_2011-12-1-140-320.jpg)
![Wef gcr report_2011-12[1]](https://image.slidesharecdn.com/wefgcrreport2011-121-120107061726-phpapp02/85/Wef-gcr-report_2011-12-1-141-320.jpg)
![Wef gcr report_2011-12[1]](https://image.slidesharecdn.com/wefgcrreport2011-121-120107061726-phpapp02/85/Wef-gcr-report_2011-12-1-142-320.jpg)
![Wef gcr report_2011-12[1]](https://image.slidesharecdn.com/wefgcrreport2011-121-120107061726-phpapp02/85/Wef-gcr-report_2011-12-1-143-320.jpg)
![Wef gcr report_2011-12[1]](https://image.slidesharecdn.com/wefgcrreport2011-121-120107061726-phpapp02/85/Wef-gcr-report_2011-12-1-144-320.jpg)
![Wef gcr report_2011-12[1]](https://image.slidesharecdn.com/wefgcrreport2011-121-120107061726-phpapp02/85/Wef-gcr-report_2011-12-1-145-320.jpg)
![Wef gcr report_2011-12[1]](https://image.slidesharecdn.com/wefgcrreport2011-121-120107061726-phpapp02/85/Wef-gcr-report_2011-12-1-146-320.jpg)
![Wef gcr report_2011-12[1]](https://image.slidesharecdn.com/wefgcrreport2011-121-120107061726-phpapp02/85/Wef-gcr-report_2011-12-1-147-320.jpg)
![Wef gcr report_2011-12[1]](https://image.slidesharecdn.com/wefgcrreport2011-121-120107061726-phpapp02/85/Wef-gcr-report_2011-12-1-148-320.jpg)
![Wef gcr report_2011-12[1]](https://image.slidesharecdn.com/wefgcrreport2011-121-120107061726-phpapp02/85/Wef-gcr-report_2011-12-1-149-320.jpg)
![Wef gcr report_2011-12[1]](https://image.slidesharecdn.com/wefgcrreport2011-121-120107061726-phpapp02/85/Wef-gcr-report_2011-12-1-150-320.jpg)
![Wef gcr report_2011-12[1]](https://image.slidesharecdn.com/wefgcrreport2011-121-120107061726-phpapp02/85/Wef-gcr-report_2011-12-1-151-320.jpg)
![Wef gcr report_2011-12[1]](https://image.slidesharecdn.com/wefgcrreport2011-121-120107061726-phpapp02/85/Wef-gcr-report_2011-12-1-152-320.jpg)
![Wef gcr report_2011-12[1]](https://image.slidesharecdn.com/wefgcrreport2011-121-120107061726-phpapp02/85/Wef-gcr-report_2011-12-1-153-320.jpg)
![Wef gcr report_2011-12[1]](https://image.slidesharecdn.com/wefgcrreport2011-121-120107061726-phpapp02/85/Wef-gcr-report_2011-12-1-154-320.jpg)
![Wef gcr report_2011-12[1]](https://image.slidesharecdn.com/wefgcrreport2011-121-120107061726-phpapp02/85/Wef-gcr-report_2011-12-1-155-320.jpg)
![Wef gcr report_2011-12[1]](https://image.slidesharecdn.com/wefgcrreport2011-121-120107061726-phpapp02/85/Wef-gcr-report_2011-12-1-156-320.jpg)
![Wef gcr report_2011-12[1]](https://image.slidesharecdn.com/wefgcrreport2011-121-120107061726-phpapp02/85/Wef-gcr-report_2011-12-1-157-320.jpg)
![Wef gcr report_2011-12[1]](https://image.slidesharecdn.com/wefgcrreport2011-121-120107061726-phpapp02/85/Wef-gcr-report_2011-12-1-158-320.jpg)
![Wef gcr report_2011-12[1]](https://image.slidesharecdn.com/wefgcrreport2011-121-120107061726-phpapp02/85/Wef-gcr-report_2011-12-1-159-320.jpg)
![Wef gcr report_2011-12[1]](https://image.slidesharecdn.com/wefgcrreport2011-121-120107061726-phpapp02/85/Wef-gcr-report_2011-12-1-160-320.jpg)
![Wef gcr report_2011-12[1]](https://image.slidesharecdn.com/wefgcrreport2011-121-120107061726-phpapp02/85/Wef-gcr-report_2011-12-1-161-320.jpg)
![Wef gcr report_2011-12[1]](https://image.slidesharecdn.com/wefgcrreport2011-121-120107061726-phpapp02/85/Wef-gcr-report_2011-12-1-162-320.jpg)
![Wef gcr report_2011-12[1]](https://image.slidesharecdn.com/wefgcrreport2011-121-120107061726-phpapp02/85/Wef-gcr-report_2011-12-1-163-320.jpg)
![Wef gcr report_2011-12[1]](https://image.slidesharecdn.com/wefgcrreport2011-121-120107061726-phpapp02/85/Wef-gcr-report_2011-12-1-164-320.jpg)
![Wef gcr report_2011-12[1]](https://image.slidesharecdn.com/wefgcrreport2011-121-120107061726-phpapp02/85/Wef-gcr-report_2011-12-1-165-320.jpg)
![Wef gcr report_2011-12[1]](https://image.slidesharecdn.com/wefgcrreport2011-121-120107061726-phpapp02/85/Wef-gcr-report_2011-12-1-166-320.jpg)
![Wef gcr report_2011-12[1]](https://image.slidesharecdn.com/wefgcrreport2011-121-120107061726-phpapp02/85/Wef-gcr-report_2011-12-1-167-320.jpg)
![Wef gcr report_2011-12[1]](https://image.slidesharecdn.com/wefgcrreport2011-121-120107061726-phpapp02/85/Wef-gcr-report_2011-12-1-168-320.jpg)
![Wef gcr report_2011-12[1]](https://image.slidesharecdn.com/wefgcrreport2011-121-120107061726-phpapp02/85/Wef-gcr-report_2011-12-1-169-320.jpg)
![Wef gcr report_2011-12[1]](https://image.slidesharecdn.com/wefgcrreport2011-121-120107061726-phpapp02/85/Wef-gcr-report_2011-12-1-170-320.jpg)
![Wef gcr report_2011-12[1]](https://image.slidesharecdn.com/wefgcrreport2011-121-120107061726-phpapp02/85/Wef-gcr-report_2011-12-1-171-320.jpg)
![Wef gcr report_2011-12[1]](https://image.slidesharecdn.com/wefgcrreport2011-121-120107061726-phpapp02/85/Wef-gcr-report_2011-12-1-172-320.jpg)
![Wef gcr report_2011-12[1]](https://image.slidesharecdn.com/wefgcrreport2011-121-120107061726-phpapp02/85/Wef-gcr-report_2011-12-1-173-320.jpg)
![Wef gcr report_2011-12[1]](https://image.slidesharecdn.com/wefgcrreport2011-121-120107061726-phpapp02/85/Wef-gcr-report_2011-12-1-174-320.jpg)
![Wef gcr report_2011-12[1]](https://image.slidesharecdn.com/wefgcrreport2011-121-120107061726-phpapp02/85/Wef-gcr-report_2011-12-1-175-320.jpg)
![Wef gcr report_2011-12[1]](https://image.slidesharecdn.com/wefgcrreport2011-121-120107061726-phpapp02/85/Wef-gcr-report_2011-12-1-176-320.jpg)
![Wef gcr report_2011-12[1]](https://image.slidesharecdn.com/wefgcrreport2011-121-120107061726-phpapp02/85/Wef-gcr-report_2011-12-1-177-320.jpg)
![Wef gcr report_2011-12[1]](https://image.slidesharecdn.com/wefgcrreport2011-121-120107061726-phpapp02/85/Wef-gcr-report_2011-12-1-178-320.jpg)
![Wef gcr report_2011-12[1]](https://image.slidesharecdn.com/wefgcrreport2011-121-120107061726-phpapp02/85/Wef-gcr-report_2011-12-1-179-320.jpg)
![Wef gcr report_2011-12[1]](https://image.slidesharecdn.com/wefgcrreport2011-121-120107061726-phpapp02/85/Wef-gcr-report_2011-12-1-180-320.jpg)
![Wef gcr report_2011-12[1]](https://image.slidesharecdn.com/wefgcrreport2011-121-120107061726-phpapp02/85/Wef-gcr-report_2011-12-1-181-320.jpg)
![Wef gcr report_2011-12[1]](https://image.slidesharecdn.com/wefgcrreport2011-121-120107061726-phpapp02/85/Wef-gcr-report_2011-12-1-182-320.jpg)
![Wef gcr report_2011-12[1]](https://image.slidesharecdn.com/wefgcrreport2011-121-120107061726-phpapp02/85/Wef-gcr-report_2011-12-1-183-320.jpg)
![Wef gcr report_2011-12[1]](https://image.slidesharecdn.com/wefgcrreport2011-121-120107061726-phpapp02/85/Wef-gcr-report_2011-12-1-184-320.jpg)
![Wef gcr report_2011-12[1]](https://image.slidesharecdn.com/wefgcrreport2011-121-120107061726-phpapp02/85/Wef-gcr-report_2011-12-1-185-320.jpg)
![Wef gcr report_2011-12[1]](https://image.slidesharecdn.com/wefgcrreport2011-121-120107061726-phpapp02/85/Wef-gcr-report_2011-12-1-186-320.jpg)
![Wef gcr report_2011-12[1]](https://image.slidesharecdn.com/wefgcrreport2011-121-120107061726-phpapp02/85/Wef-gcr-report_2011-12-1-187-320.jpg)
![Wef gcr report_2011-12[1]](https://image.slidesharecdn.com/wefgcrreport2011-121-120107061726-phpapp02/85/Wef-gcr-report_2011-12-1-188-320.jpg)
![Wef gcr report_2011-12[1]](https://image.slidesharecdn.com/wefgcrreport2011-121-120107061726-phpapp02/85/Wef-gcr-report_2011-12-1-189-320.jpg)
![Wef gcr report_2011-12[1]](https://image.slidesharecdn.com/wefgcrreport2011-121-120107061726-phpapp02/85/Wef-gcr-report_2011-12-1-190-320.jpg)
![Wef gcr report_2011-12[1]](https://image.slidesharecdn.com/wefgcrreport2011-121-120107061726-phpapp02/85/Wef-gcr-report_2011-12-1-191-320.jpg)
![Wef gcr report_2011-12[1]](https://image.slidesharecdn.com/wefgcrreport2011-121-120107061726-phpapp02/85/Wef-gcr-report_2011-12-1-192-320.jpg)
![Wef gcr report_2011-12[1]](https://image.slidesharecdn.com/wefgcrreport2011-121-120107061726-phpapp02/85/Wef-gcr-report_2011-12-1-193-320.jpg)
![Wef gcr report_2011-12[1]](https://image.slidesharecdn.com/wefgcrreport2011-121-120107061726-phpapp02/85/Wef-gcr-report_2011-12-1-194-320.jpg)
![Wef gcr report_2011-12[1]](https://image.slidesharecdn.com/wefgcrreport2011-121-120107061726-phpapp02/85/Wef-gcr-report_2011-12-1-195-320.jpg)
![Wef gcr report_2011-12[1]](https://image.slidesharecdn.com/wefgcrreport2011-121-120107061726-phpapp02/85/Wef-gcr-report_2011-12-1-196-320.jpg)
![Wef gcr report_2011-12[1]](https://image.slidesharecdn.com/wefgcrreport2011-121-120107061726-phpapp02/85/Wef-gcr-report_2011-12-1-197-320.jpg)
![Wef gcr report_2011-12[1]](https://image.slidesharecdn.com/wefgcrreport2011-121-120107061726-phpapp02/85/Wef-gcr-report_2011-12-1-198-320.jpg)
![Wef gcr report_2011-12[1]](https://image.slidesharecdn.com/wefgcrreport2011-121-120107061726-phpapp02/85/Wef-gcr-report_2011-12-1-199-320.jpg)
![Wef gcr report_2011-12[1]](https://image.slidesharecdn.com/wefgcrreport2011-121-120107061726-phpapp02/85/Wef-gcr-report_2011-12-1-200-320.jpg)
![Wef gcr report_2011-12[1]](https://image.slidesharecdn.com/wefgcrreport2011-121-120107061726-phpapp02/85/Wef-gcr-report_2011-12-1-201-320.jpg)
![Wef gcr report_2011-12[1]](https://image.slidesharecdn.com/wefgcrreport2011-121-120107061726-phpapp02/85/Wef-gcr-report_2011-12-1-202-320.jpg)
![Wef gcr report_2011-12[1]](https://image.slidesharecdn.com/wefgcrreport2011-121-120107061726-phpapp02/85/Wef-gcr-report_2011-12-1-203-320.jpg)
![Wef gcr report_2011-12[1]](https://image.slidesharecdn.com/wefgcrreport2011-121-120107061726-phpapp02/85/Wef-gcr-report_2011-12-1-204-320.jpg)
![Wef gcr report_2011-12[1]](https://image.slidesharecdn.com/wefgcrreport2011-121-120107061726-phpapp02/85/Wef-gcr-report_2011-12-1-205-320.jpg)
![Wef gcr report_2011-12[1]](https://image.slidesharecdn.com/wefgcrreport2011-121-120107061726-phpapp02/85/Wef-gcr-report_2011-12-1-206-320.jpg)
![Wef gcr report_2011-12[1]](https://image.slidesharecdn.com/wefgcrreport2011-121-120107061726-phpapp02/85/Wef-gcr-report_2011-12-1-207-320.jpg)
![Wef gcr report_2011-12[1]](https://image.slidesharecdn.com/wefgcrreport2011-121-120107061726-phpapp02/85/Wef-gcr-report_2011-12-1-208-320.jpg)
![Wef gcr report_2011-12[1]](https://image.slidesharecdn.com/wefgcrreport2011-121-120107061726-phpapp02/85/Wef-gcr-report_2011-12-1-209-320.jpg)
![Wef gcr report_2011-12[1]](https://image.slidesharecdn.com/wefgcrreport2011-121-120107061726-phpapp02/85/Wef-gcr-report_2011-12-1-210-320.jpg)
![Wef gcr report_2011-12[1]](https://image.slidesharecdn.com/wefgcrreport2011-121-120107061726-phpapp02/85/Wef-gcr-report_2011-12-1-211-320.jpg)
![Wef gcr report_2011-12[1]](https://image.slidesharecdn.com/wefgcrreport2011-121-120107061726-phpapp02/85/Wef-gcr-report_2011-12-1-212-320.jpg)
![Wef gcr report_2011-12[1]](https://image.slidesharecdn.com/wefgcrreport2011-121-120107061726-phpapp02/85/Wef-gcr-report_2011-12-1-213-320.jpg)
![Wef gcr report_2011-12[1]](https://image.slidesharecdn.com/wefgcrreport2011-121-120107061726-phpapp02/85/Wef-gcr-report_2011-12-1-214-320.jpg)
![Wef gcr report_2011-12[1]](https://image.slidesharecdn.com/wefgcrreport2011-121-120107061726-phpapp02/85/Wef-gcr-report_2011-12-1-215-320.jpg)
![Wef gcr report_2011-12[1]](https://image.slidesharecdn.com/wefgcrreport2011-121-120107061726-phpapp02/85/Wef-gcr-report_2011-12-1-216-320.jpg)
![Wef gcr report_2011-12[1]](https://image.slidesharecdn.com/wefgcrreport2011-121-120107061726-phpapp02/85/Wef-gcr-report_2011-12-1-217-320.jpg)
![Wef gcr report_2011-12[1]](https://image.slidesharecdn.com/wefgcrreport2011-121-120107061726-phpapp02/85/Wef-gcr-report_2011-12-1-218-320.jpg)
![Wef gcr report_2011-12[1]](https://image.slidesharecdn.com/wefgcrreport2011-121-120107061726-phpapp02/85/Wef-gcr-report_2011-12-1-219-320.jpg)
![Wef gcr report_2011-12[1]](https://image.slidesharecdn.com/wefgcrreport2011-121-120107061726-phpapp02/85/Wef-gcr-report_2011-12-1-220-320.jpg)
![Wef gcr report_2011-12[1]](https://image.slidesharecdn.com/wefgcrreport2011-121-120107061726-phpapp02/85/Wef-gcr-report_2011-12-1-221-320.jpg)
![Wef gcr report_2011-12[1]](https://image.slidesharecdn.com/wefgcrreport2011-121-120107061726-phpapp02/85/Wef-gcr-report_2011-12-1-222-320.jpg)
![Wef gcr report_2011-12[1]](https://image.slidesharecdn.com/wefgcrreport2011-121-120107061726-phpapp02/85/Wef-gcr-report_2011-12-1-223-320.jpg)
![Wef gcr report_2011-12[1]](https://image.slidesharecdn.com/wefgcrreport2011-121-120107061726-phpapp02/85/Wef-gcr-report_2011-12-1-224-320.jpg)
![Wef gcr report_2011-12[1]](https://image.slidesharecdn.com/wefgcrreport2011-121-120107061726-phpapp02/85/Wef-gcr-report_2011-12-1-225-320.jpg)
![Wef gcr report_2011-12[1]](https://image.slidesharecdn.com/wefgcrreport2011-121-120107061726-phpapp02/85/Wef-gcr-report_2011-12-1-226-320.jpg)
![Wef gcr report_2011-12[1]](https://image.slidesharecdn.com/wefgcrreport2011-121-120107061726-phpapp02/85/Wef-gcr-report_2011-12-1-227-320.jpg)
![Wef gcr report_2011-12[1]](https://image.slidesharecdn.com/wefgcrreport2011-121-120107061726-phpapp02/85/Wef-gcr-report_2011-12-1-228-320.jpg)
![Wef gcr report_2011-12[1]](https://image.slidesharecdn.com/wefgcrreport2011-121-120107061726-phpapp02/85/Wef-gcr-report_2011-12-1-229-320.jpg)
![Wef gcr report_2011-12[1]](https://image.slidesharecdn.com/wefgcrreport2011-121-120107061726-phpapp02/85/Wef-gcr-report_2011-12-1-230-320.jpg)
![Wef gcr report_2011-12[1]](https://image.slidesharecdn.com/wefgcrreport2011-121-120107061726-phpapp02/85/Wef-gcr-report_2011-12-1-231-320.jpg)
![Wef gcr report_2011-12[1]](https://image.slidesharecdn.com/wefgcrreport2011-121-120107061726-phpapp02/85/Wef-gcr-report_2011-12-1-232-320.jpg)
![Wef gcr report_2011-12[1]](https://image.slidesharecdn.com/wefgcrreport2011-121-120107061726-phpapp02/85/Wef-gcr-report_2011-12-1-233-320.jpg)
![Wef gcr report_2011-12[1]](https://image.slidesharecdn.com/wefgcrreport2011-121-120107061726-phpapp02/85/Wef-gcr-report_2011-12-1-234-320.jpg)
![Wef gcr report_2011-12[1]](https://image.slidesharecdn.com/wefgcrreport2011-121-120107061726-phpapp02/85/Wef-gcr-report_2011-12-1-235-320.jpg)
![Wef gcr report_2011-12[1]](https://image.slidesharecdn.com/wefgcrreport2011-121-120107061726-phpapp02/85/Wef-gcr-report_2011-12-1-236-320.jpg)
![Wef gcr report_2011-12[1]](https://image.slidesharecdn.com/wefgcrreport2011-121-120107061726-phpapp02/85/Wef-gcr-report_2011-12-1-237-320.jpg)
![Wef gcr report_2011-12[1]](https://image.slidesharecdn.com/wefgcrreport2011-121-120107061726-phpapp02/85/Wef-gcr-report_2011-12-1-238-320.jpg)
![Wef gcr report_2011-12[1]](https://image.slidesharecdn.com/wefgcrreport2011-121-120107061726-phpapp02/85/Wef-gcr-report_2011-12-1-239-320.jpg)
![Wef gcr report_2011-12[1]](https://image.slidesharecdn.com/wefgcrreport2011-121-120107061726-phpapp02/85/Wef-gcr-report_2011-12-1-240-320.jpg)
![Wef gcr report_2011-12[1]](https://image.slidesharecdn.com/wefgcrreport2011-121-120107061726-phpapp02/85/Wef-gcr-report_2011-12-1-241-320.jpg)
![Wef gcr report_2011-12[1]](https://image.slidesharecdn.com/wefgcrreport2011-121-120107061726-phpapp02/85/Wef-gcr-report_2011-12-1-242-320.jpg)
![Wef gcr report_2011-12[1]](https://image.slidesharecdn.com/wefgcrreport2011-121-120107061726-phpapp02/85/Wef-gcr-report_2011-12-1-243-320.jpg)
![Wef gcr report_2011-12[1]](https://image.slidesharecdn.com/wefgcrreport2011-121-120107061726-phpapp02/85/Wef-gcr-report_2011-12-1-244-320.jpg)
![Wef gcr report_2011-12[1]](https://image.slidesharecdn.com/wefgcrreport2011-121-120107061726-phpapp02/85/Wef-gcr-report_2011-12-1-245-320.jpg)
![Wef gcr report_2011-12[1]](https://image.slidesharecdn.com/wefgcrreport2011-121-120107061726-phpapp02/85/Wef-gcr-report_2011-12-1-246-320.jpg)
![Wef gcr report_2011-12[1]](https://image.slidesharecdn.com/wefgcrreport2011-121-120107061726-phpapp02/85/Wef-gcr-report_2011-12-1-247-320.jpg)
![Wef gcr report_2011-12[1]](https://image.slidesharecdn.com/wefgcrreport2011-121-120107061726-phpapp02/85/Wef-gcr-report_2011-12-1-248-320.jpg)
![Wef gcr report_2011-12[1]](https://image.slidesharecdn.com/wefgcrreport2011-121-120107061726-phpapp02/85/Wef-gcr-report_2011-12-1-249-320.jpg)
![Wef gcr report_2011-12[1]](https://image.slidesharecdn.com/wefgcrreport2011-121-120107061726-phpapp02/85/Wef-gcr-report_2011-12-1-250-320.jpg)
![Wef gcr report_2011-12[1]](https://image.slidesharecdn.com/wefgcrreport2011-121-120107061726-phpapp02/85/Wef-gcr-report_2011-12-1-251-320.jpg)
![Wef gcr report_2011-12[1]](https://image.slidesharecdn.com/wefgcrreport2011-121-120107061726-phpapp02/85/Wef-gcr-report_2011-12-1-252-320.jpg)
![Wef gcr report_2011-12[1]](https://image.slidesharecdn.com/wefgcrreport2011-121-120107061726-phpapp02/85/Wef-gcr-report_2011-12-1-253-320.jpg)
![Wef gcr report_2011-12[1]](https://image.slidesharecdn.com/wefgcrreport2011-121-120107061726-phpapp02/85/Wef-gcr-report_2011-12-1-254-320.jpg)
![Wef gcr report_2011-12[1]](https://image.slidesharecdn.com/wefgcrreport2011-121-120107061726-phpapp02/85/Wef-gcr-report_2011-12-1-255-320.jpg)
![Wef gcr report_2011-12[1]](https://image.slidesharecdn.com/wefgcrreport2011-121-120107061726-phpapp02/85/Wef-gcr-report_2011-12-1-256-320.jpg)
![Wef gcr report_2011-12[1]](https://image.slidesharecdn.com/wefgcrreport2011-121-120107061726-phpapp02/85/Wef-gcr-report_2011-12-1-257-320.jpg)
![Wef gcr report_2011-12[1]](https://image.slidesharecdn.com/wefgcrreport2011-121-120107061726-phpapp02/85/Wef-gcr-report_2011-12-1-258-320.jpg)
![Wef gcr report_2011-12[1]](https://image.slidesharecdn.com/wefgcrreport2011-121-120107061726-phpapp02/85/Wef-gcr-report_2011-12-1-259-320.jpg)
![Wef gcr report_2011-12[1]](https://image.slidesharecdn.com/wefgcrreport2011-121-120107061726-phpapp02/85/Wef-gcr-report_2011-12-1-260-320.jpg)
![Wef gcr report_2011-12[1]](https://image.slidesharecdn.com/wefgcrreport2011-121-120107061726-phpapp02/85/Wef-gcr-report_2011-12-1-261-320.jpg)
![Wef gcr report_2011-12[1]](https://image.slidesharecdn.com/wefgcrreport2011-121-120107061726-phpapp02/85/Wef-gcr-report_2011-12-1-262-320.jpg)
![Wef gcr report_2011-12[1]](https://image.slidesharecdn.com/wefgcrreport2011-121-120107061726-phpapp02/85/Wef-gcr-report_2011-12-1-263-320.jpg)
![Wef gcr report_2011-12[1]](https://image.slidesharecdn.com/wefgcrreport2011-121-120107061726-phpapp02/85/Wef-gcr-report_2011-12-1-264-320.jpg)
![Wef gcr report_2011-12[1]](https://image.slidesharecdn.com/wefgcrreport2011-121-120107061726-phpapp02/85/Wef-gcr-report_2011-12-1-265-320.jpg)
![Wef gcr report_2011-12[1]](https://image.slidesharecdn.com/wefgcrreport2011-121-120107061726-phpapp02/85/Wef-gcr-report_2011-12-1-266-320.jpg)
![Wef gcr report_2011-12[1]](https://image.slidesharecdn.com/wefgcrreport2011-121-120107061726-phpapp02/85/Wef-gcr-report_2011-12-1-267-320.jpg)
![Wef gcr report_2011-12[1]](https://image.slidesharecdn.com/wefgcrreport2011-121-120107061726-phpapp02/85/Wef-gcr-report_2011-12-1-268-320.jpg)
![Wef gcr report_2011-12[1]](https://image.slidesharecdn.com/wefgcrreport2011-121-120107061726-phpapp02/85/Wef-gcr-report_2011-12-1-269-320.jpg)
![Wef gcr report_2011-12[1]](https://image.slidesharecdn.com/wefgcrreport2011-121-120107061726-phpapp02/85/Wef-gcr-report_2011-12-1-270-320.jpg)
![Wef gcr report_2011-12[1]](https://image.slidesharecdn.com/wefgcrreport2011-121-120107061726-phpapp02/85/Wef-gcr-report_2011-12-1-271-320.jpg)
![Wef gcr report_2011-12[1]](https://image.slidesharecdn.com/wefgcrreport2011-121-120107061726-phpapp02/85/Wef-gcr-report_2011-12-1-272-320.jpg)
![Wef gcr report_2011-12[1]](https://image.slidesharecdn.com/wefgcrreport2011-121-120107061726-phpapp02/85/Wef-gcr-report_2011-12-1-273-320.jpg)
![Wef gcr report_2011-12[1]](https://image.slidesharecdn.com/wefgcrreport2011-121-120107061726-phpapp02/85/Wef-gcr-report_2011-12-1-274-320.jpg)
![Wef gcr report_2011-12[1]](https://image.slidesharecdn.com/wefgcrreport2011-121-120107061726-phpapp02/85/Wef-gcr-report_2011-12-1-275-320.jpg)
![Wef gcr report_2011-12[1]](https://image.slidesharecdn.com/wefgcrreport2011-121-120107061726-phpapp02/85/Wef-gcr-report_2011-12-1-276-320.jpg)
![Wef gcr report_2011-12[1]](https://image.slidesharecdn.com/wefgcrreport2011-121-120107061726-phpapp02/85/Wef-gcr-report_2011-12-1-277-320.jpg)
![Wef gcr report_2011-12[1]](https://image.slidesharecdn.com/wefgcrreport2011-121-120107061726-phpapp02/85/Wef-gcr-report_2011-12-1-278-320.jpg)
![Wef gcr report_2011-12[1]](https://image.slidesharecdn.com/wefgcrreport2011-121-120107061726-phpapp02/85/Wef-gcr-report_2011-12-1-279-320.jpg)
![Wef gcr report_2011-12[1]](https://image.slidesharecdn.com/wefgcrreport2011-121-120107061726-phpapp02/85/Wef-gcr-report_2011-12-1-280-320.jpg)
![Wef gcr report_2011-12[1]](https://image.slidesharecdn.com/wefgcrreport2011-121-120107061726-phpapp02/85/Wef-gcr-report_2011-12-1-281-320.jpg)
![Wef gcr report_2011-12[1]](https://image.slidesharecdn.com/wefgcrreport2011-121-120107061726-phpapp02/85/Wef-gcr-report_2011-12-1-282-320.jpg)
![Wef gcr report_2011-12[1]](https://image.slidesharecdn.com/wefgcrreport2011-121-120107061726-phpapp02/85/Wef-gcr-report_2011-12-1-283-320.jpg)
![Wef gcr report_2011-12[1]](https://image.slidesharecdn.com/wefgcrreport2011-121-120107061726-phpapp02/85/Wef-gcr-report_2011-12-1-284-320.jpg)
![Wef gcr report_2011-12[1]](https://image.slidesharecdn.com/wefgcrreport2011-121-120107061726-phpapp02/85/Wef-gcr-report_2011-12-1-285-320.jpg)
![Wef gcr report_2011-12[1]](https://image.slidesharecdn.com/wefgcrreport2011-121-120107061726-phpapp02/85/Wef-gcr-report_2011-12-1-286-320.jpg)
![Wef gcr report_2011-12[1]](https://image.slidesharecdn.com/wefgcrreport2011-121-120107061726-phpapp02/85/Wef-gcr-report_2011-12-1-287-320.jpg)
![Wef gcr report_2011-12[1]](https://image.slidesharecdn.com/wefgcrreport2011-121-120107061726-phpapp02/85/Wef-gcr-report_2011-12-1-288-320.jpg)
![Wef gcr report_2011-12[1]](https://image.slidesharecdn.com/wefgcrreport2011-121-120107061726-phpapp02/85/Wef-gcr-report_2011-12-1-289-320.jpg)
![Wef gcr report_2011-12[1]](https://image.slidesharecdn.com/wefgcrreport2011-121-120107061726-phpapp02/85/Wef-gcr-report_2011-12-1-290-320.jpg)
![Wef gcr report_2011-12[1]](https://image.slidesharecdn.com/wefgcrreport2011-121-120107061726-phpapp02/85/Wef-gcr-report_2011-12-1-291-320.jpg)
![Wef gcr report_2011-12[1]](https://image.slidesharecdn.com/wefgcrreport2011-121-120107061726-phpapp02/85/Wef-gcr-report_2011-12-1-292-320.jpg)
![Wef gcr report_2011-12[1]](https://image.slidesharecdn.com/wefgcrreport2011-121-120107061726-phpapp02/85/Wef-gcr-report_2011-12-1-293-320.jpg)
![Wef gcr report_2011-12[1]](https://image.slidesharecdn.com/wefgcrreport2011-121-120107061726-phpapp02/85/Wef-gcr-report_2011-12-1-294-320.jpg)
![Wef gcr report_2011-12[1]](https://image.slidesharecdn.com/wefgcrreport2011-121-120107061726-phpapp02/85/Wef-gcr-report_2011-12-1-295-320.jpg)
![Wef gcr report_2011-12[1]](https://image.slidesharecdn.com/wefgcrreport2011-121-120107061726-phpapp02/85/Wef-gcr-report_2011-12-1-296-320.jpg)
![Wef gcr report_2011-12[1]](https://image.slidesharecdn.com/wefgcrreport2011-121-120107061726-phpapp02/85/Wef-gcr-report_2011-12-1-297-320.jpg)
![Wef gcr report_2011-12[1]](https://image.slidesharecdn.com/wefgcrreport2011-121-120107061726-phpapp02/85/Wef-gcr-report_2011-12-1-298-320.jpg)
![Wef gcr report_2011-12[1]](https://image.slidesharecdn.com/wefgcrreport2011-121-120107061726-phpapp02/85/Wef-gcr-report_2011-12-1-299-320.jpg)
![Wef gcr report_2011-12[1]](https://image.slidesharecdn.com/wefgcrreport2011-121-120107061726-phpapp02/85/Wef-gcr-report_2011-12-1-300-320.jpg)
![Wef gcr report_2011-12[1]](https://image.slidesharecdn.com/wefgcrreport2011-121-120107061726-phpapp02/85/Wef-gcr-report_2011-12-1-301-320.jpg)
![Wef gcr report_2011-12[1]](https://image.slidesharecdn.com/wefgcrreport2011-121-120107061726-phpapp02/85/Wef-gcr-report_2011-12-1-302-320.jpg)
![Wef gcr report_2011-12[1]](https://image.slidesharecdn.com/wefgcrreport2011-121-120107061726-phpapp02/85/Wef-gcr-report_2011-12-1-303-320.jpg)
![Wef gcr report_2011-12[1]](https://image.slidesharecdn.com/wefgcrreport2011-121-120107061726-phpapp02/85/Wef-gcr-report_2011-12-1-304-320.jpg)
![Wef gcr report_2011-12[1]](https://image.slidesharecdn.com/wefgcrreport2011-121-120107061726-phpapp02/85/Wef-gcr-report_2011-12-1-305-320.jpg)
![Wef gcr report_2011-12[1]](https://image.slidesharecdn.com/wefgcrreport2011-121-120107061726-phpapp02/85/Wef-gcr-report_2011-12-1-306-320.jpg)
![Wef gcr report_2011-12[1]](https://image.slidesharecdn.com/wefgcrreport2011-121-120107061726-phpapp02/85/Wef-gcr-report_2011-12-1-307-320.jpg)
![Wef gcr report_2011-12[1]](https://image.slidesharecdn.com/wefgcrreport2011-121-120107061726-phpapp02/85/Wef-gcr-report_2011-12-1-308-320.jpg)
![Wef gcr report_2011-12[1]](https://image.slidesharecdn.com/wefgcrreport2011-121-120107061726-phpapp02/85/Wef-gcr-report_2011-12-1-309-320.jpg)
![Wef gcr report_2011-12[1]](https://image.slidesharecdn.com/wefgcrreport2011-121-120107061726-phpapp02/85/Wef-gcr-report_2011-12-1-310-320.jpg)
![Wef gcr report_2011-12[1]](https://image.slidesharecdn.com/wefgcrreport2011-121-120107061726-phpapp02/85/Wef-gcr-report_2011-12-1-311-320.jpg)
![Wef gcr report_2011-12[1]](https://image.slidesharecdn.com/wefgcrreport2011-121-120107061726-phpapp02/85/Wef-gcr-report_2011-12-1-312-320.jpg)
![Wef gcr report_2011-12[1]](https://image.slidesharecdn.com/wefgcrreport2011-121-120107061726-phpapp02/85/Wef-gcr-report_2011-12-1-313-320.jpg)
![Wef gcr report_2011-12[1]](https://image.slidesharecdn.com/wefgcrreport2011-121-120107061726-phpapp02/85/Wef-gcr-report_2011-12-1-314-320.jpg)
![Wef gcr report_2011-12[1]](https://image.slidesharecdn.com/wefgcrreport2011-121-120107061726-phpapp02/85/Wef-gcr-report_2011-12-1-315-320.jpg)
![Wef gcr report_2011-12[1]](https://image.slidesharecdn.com/wefgcrreport2011-121-120107061726-phpapp02/85/Wef-gcr-report_2011-12-1-316-320.jpg)
![Wef gcr report_2011-12[1]](https://image.slidesharecdn.com/wefgcrreport2011-121-120107061726-phpapp02/85/Wef-gcr-report_2011-12-1-317-320.jpg)
![Wef gcr report_2011-12[1]](https://image.slidesharecdn.com/wefgcrreport2011-121-120107061726-phpapp02/85/Wef-gcr-report_2011-12-1-318-320.jpg)
![Wef gcr report_2011-12[1]](https://image.slidesharecdn.com/wefgcrreport2011-121-120107061726-phpapp02/85/Wef-gcr-report_2011-12-1-319-320.jpg)
![Wef gcr report_2011-12[1]](https://image.slidesharecdn.com/wefgcrreport2011-121-120107061726-phpapp02/85/Wef-gcr-report_2011-12-1-320-320.jpg)
![Wef gcr report_2011-12[1]](https://image.slidesharecdn.com/wefgcrreport2011-121-120107061726-phpapp02/85/Wef-gcr-report_2011-12-1-321-320.jpg)
![Wef gcr report_2011-12[1]](https://image.slidesharecdn.com/wefgcrreport2011-121-120107061726-phpapp02/85/Wef-gcr-report_2011-12-1-322-320.jpg)
![Wef gcr report_2011-12[1]](https://image.slidesharecdn.com/wefgcrreport2011-121-120107061726-phpapp02/85/Wef-gcr-report_2011-12-1-323-320.jpg)
![Wef gcr report_2011-12[1]](https://image.slidesharecdn.com/wefgcrreport2011-121-120107061726-phpapp02/85/Wef-gcr-report_2011-12-1-324-320.jpg)
![Wef gcr report_2011-12[1]](https://image.slidesharecdn.com/wefgcrreport2011-121-120107061726-phpapp02/85/Wef-gcr-report_2011-12-1-325-320.jpg)
![Wef gcr report_2011-12[1]](https://image.slidesharecdn.com/wefgcrreport2011-121-120107061726-phpapp02/85/Wef-gcr-report_2011-12-1-326-320.jpg)
![Wef gcr report_2011-12[1]](https://image.slidesharecdn.com/wefgcrreport2011-121-120107061726-phpapp02/85/Wef-gcr-report_2011-12-1-327-320.jpg)
![Wef gcr report_2011-12[1]](https://image.slidesharecdn.com/wefgcrreport2011-121-120107061726-phpapp02/85/Wef-gcr-report_2011-12-1-328-320.jpg)
![Wef gcr report_2011-12[1]](https://image.slidesharecdn.com/wefgcrreport2011-121-120107061726-phpapp02/85/Wef-gcr-report_2011-12-1-329-320.jpg)
![Wef gcr report_2011-12[1]](https://image.slidesharecdn.com/wefgcrreport2011-121-120107061726-phpapp02/85/Wef-gcr-report_2011-12-1-330-320.jpg)
![Wef gcr report_2011-12[1]](https://image.slidesharecdn.com/wefgcrreport2011-121-120107061726-phpapp02/85/Wef-gcr-report_2011-12-1-331-320.jpg)
![Wef gcr report_2011-12[1]](https://image.slidesharecdn.com/wefgcrreport2011-121-120107061726-phpapp02/85/Wef-gcr-report_2011-12-1-332-320.jpg)
![Wef gcr report_2011-12[1]](https://image.slidesharecdn.com/wefgcrreport2011-121-120107061726-phpapp02/85/Wef-gcr-report_2011-12-1-333-320.jpg)
![Wef gcr report_2011-12[1]](https://image.slidesharecdn.com/wefgcrreport2011-121-120107061726-phpapp02/85/Wef-gcr-report_2011-12-1-334-320.jpg)
![Wef gcr report_2011-12[1]](https://image.slidesharecdn.com/wefgcrreport2011-121-120107061726-phpapp02/85/Wef-gcr-report_2011-12-1-335-320.jpg)
![Wef gcr report_2011-12[1]](https://image.slidesharecdn.com/wefgcrreport2011-121-120107061726-phpapp02/85/Wef-gcr-report_2011-12-1-336-320.jpg)
![Wef gcr report_2011-12[1]](https://image.slidesharecdn.com/wefgcrreport2011-121-120107061726-phpapp02/85/Wef-gcr-report_2011-12-1-337-320.jpg)
![Wef gcr report_2011-12[1]](https://image.slidesharecdn.com/wefgcrreport2011-121-120107061726-phpapp02/85/Wef-gcr-report_2011-12-1-338-320.jpg)
![Wef gcr report_2011-12[1]](https://image.slidesharecdn.com/wefgcrreport2011-121-120107061726-phpapp02/85/Wef-gcr-report_2011-12-1-339-320.jpg)
![Wef gcr report_2011-12[1]](https://image.slidesharecdn.com/wefgcrreport2011-121-120107061726-phpapp02/85/Wef-gcr-report_2011-12-1-340-320.jpg)
![Wef gcr report_2011-12[1]](https://image.slidesharecdn.com/wefgcrreport2011-121-120107061726-phpapp02/85/Wef-gcr-report_2011-12-1-341-320.jpg)
![Wef gcr report_2011-12[1]](https://image.slidesharecdn.com/wefgcrreport2011-121-120107061726-phpapp02/85/Wef-gcr-report_2011-12-1-342-320.jpg)
![Wef gcr report_2011-12[1]](https://image.slidesharecdn.com/wefgcrreport2011-121-120107061726-phpapp02/85/Wef-gcr-report_2011-12-1-343-320.jpg)
![Wef gcr report_2011-12[1]](https://image.slidesharecdn.com/wefgcrreport2011-121-120107061726-phpapp02/85/Wef-gcr-report_2011-12-1-344-320.jpg)
![Wef gcr report_2011-12[1]](https://image.slidesharecdn.com/wefgcrreport2011-121-120107061726-phpapp02/85/Wef-gcr-report_2011-12-1-345-320.jpg)
![Wef gcr report_2011-12[1]](https://image.slidesharecdn.com/wefgcrreport2011-121-120107061726-phpapp02/85/Wef-gcr-report_2011-12-1-346-320.jpg)
![Wef gcr report_2011-12[1]](https://image.slidesharecdn.com/wefgcrreport2011-121-120107061726-phpapp02/85/Wef-gcr-report_2011-12-1-347-320.jpg)
![Wef gcr report_2011-12[1]](https://image.slidesharecdn.com/wefgcrreport2011-121-120107061726-phpapp02/85/Wef-gcr-report_2011-12-1-348-320.jpg)
![Wef gcr report_2011-12[1]](https://image.slidesharecdn.com/wefgcrreport2011-121-120107061726-phpapp02/85/Wef-gcr-report_2011-12-1-349-320.jpg)
![Wef gcr report_2011-12[1]](https://image.slidesharecdn.com/wefgcrreport2011-121-120107061726-phpapp02/85/Wef-gcr-report_2011-12-1-350-320.jpg)
![Wef gcr report_2011-12[1]](https://image.slidesharecdn.com/wefgcrreport2011-121-120107061726-phpapp02/85/Wef-gcr-report_2011-12-1-351-320.jpg)
![Wef gcr report_2011-12[1]](https://image.slidesharecdn.com/wefgcrreport2011-121-120107061726-phpapp02/85/Wef-gcr-report_2011-12-1-352-320.jpg)
![Wef gcr report_2011-12[1]](https://image.slidesharecdn.com/wefgcrreport2011-121-120107061726-phpapp02/85/Wef-gcr-report_2011-12-1-353-320.jpg)
![Wef gcr report_2011-12[1]](https://image.slidesharecdn.com/wefgcrreport2011-121-120107061726-phpapp02/85/Wef-gcr-report_2011-12-1-354-320.jpg)
![Wef gcr report_2011-12[1]](https://image.slidesharecdn.com/wefgcrreport2011-121-120107061726-phpapp02/85/Wef-gcr-report_2011-12-1-355-320.jpg)
![Wef gcr report_2011-12[1]](https://image.slidesharecdn.com/wefgcrreport2011-121-120107061726-phpapp02/85/Wef-gcr-report_2011-12-1-356-320.jpg)
![Wef gcr report_2011-12[1]](https://image.slidesharecdn.com/wefgcrreport2011-121-120107061726-phpapp02/85/Wef-gcr-report_2011-12-1-357-320.jpg)
![Wef gcr report_2011-12[1]](https://image.slidesharecdn.com/wefgcrreport2011-121-120107061726-phpapp02/85/Wef-gcr-report_2011-12-1-358-320.jpg)
![Wef gcr report_2011-12[1]](https://image.slidesharecdn.com/wefgcrreport2011-121-120107061726-phpapp02/85/Wef-gcr-report_2011-12-1-359-320.jpg)
![Wef gcr report_2011-12[1]](https://image.slidesharecdn.com/wefgcrreport2011-121-120107061726-phpapp02/85/Wef-gcr-report_2011-12-1-360-320.jpg)
![Wef gcr report_2011-12[1]](https://image.slidesharecdn.com/wefgcrreport2011-121-120107061726-phpapp02/85/Wef-gcr-report_2011-12-1-361-320.jpg)
![Wef gcr report_2011-12[1]](https://image.slidesharecdn.com/wefgcrreport2011-121-120107061726-phpapp02/85/Wef-gcr-report_2011-12-1-362-320.jpg)
![Wef gcr report_2011-12[1]](https://image.slidesharecdn.com/wefgcrreport2011-121-120107061726-phpapp02/85/Wef-gcr-report_2011-12-1-363-320.jpg)
![Wef gcr report_2011-12[1]](https://image.slidesharecdn.com/wefgcrreport2011-121-120107061726-phpapp02/85/Wef-gcr-report_2011-12-1-364-320.jpg)
![Wef gcr report_2011-12[1]](https://image.slidesharecdn.com/wefgcrreport2011-121-120107061726-phpapp02/85/Wef-gcr-report_2011-12-1-365-320.jpg)
![Wef gcr report_2011-12[1]](https://image.slidesharecdn.com/wefgcrreport2011-121-120107061726-phpapp02/85/Wef-gcr-report_2011-12-1-366-320.jpg)
![Wef gcr report_2011-12[1]](https://image.slidesharecdn.com/wefgcrreport2011-121-120107061726-phpapp02/85/Wef-gcr-report_2011-12-1-367-320.jpg)
![Wef gcr report_2011-12[1]](https://image.slidesharecdn.com/wefgcrreport2011-121-120107061726-phpapp02/85/Wef-gcr-report_2011-12-1-368-320.jpg)
![Wef gcr report_2011-12[1]](https://image.slidesharecdn.com/wefgcrreport2011-121-120107061726-phpapp02/85/Wef-gcr-report_2011-12-1-369-320.jpg)
![Wef gcr report_2011-12[1]](https://image.slidesharecdn.com/wefgcrreport2011-121-120107061726-phpapp02/85/Wef-gcr-report_2011-12-1-370-320.jpg)
![Wef gcr report_2011-12[1]](https://image.slidesharecdn.com/wefgcrreport2011-121-120107061726-phpapp02/85/Wef-gcr-report_2011-12-1-371-320.jpg)
![Wef gcr report_2011-12[1]](https://image.slidesharecdn.com/wefgcrreport2011-121-120107061726-phpapp02/85/Wef-gcr-report_2011-12-1-372-320.jpg)
![Wef gcr report_2011-12[1]](https://image.slidesharecdn.com/wefgcrreport2011-121-120107061726-phpapp02/85/Wef-gcr-report_2011-12-1-373-320.jpg)
![Wef gcr report_2011-12[1]](https://image.slidesharecdn.com/wefgcrreport2011-121-120107061726-phpapp02/85/Wef-gcr-report_2011-12-1-374-320.jpg)
![Wef gcr report_2011-12[1]](https://image.slidesharecdn.com/wefgcrreport2011-121-120107061726-phpapp02/85/Wef-gcr-report_2011-12-1-375-320.jpg)
![Wef gcr report_2011-12[1]](https://image.slidesharecdn.com/wefgcrreport2011-121-120107061726-phpapp02/85/Wef-gcr-report_2011-12-1-376-320.jpg)
![Wef gcr report_2011-12[1]](https://image.slidesharecdn.com/wefgcrreport2011-121-120107061726-phpapp02/85/Wef-gcr-report_2011-12-1-377-320.jpg)
![Wef gcr report_2011-12[1]](https://image.slidesharecdn.com/wefgcrreport2011-121-120107061726-phpapp02/85/Wef-gcr-report_2011-12-1-378-320.jpg)
![Wef gcr report_2011-12[1]](https://image.slidesharecdn.com/wefgcrreport2011-121-120107061726-phpapp02/85/Wef-gcr-report_2011-12-1-379-320.jpg)
![Wef gcr report_2011-12[1]](https://image.slidesharecdn.com/wefgcrreport2011-121-120107061726-phpapp02/85/Wef-gcr-report_2011-12-1-380-320.jpg)
![Wef gcr report_2011-12[1]](https://image.slidesharecdn.com/wefgcrreport2011-121-120107061726-phpapp02/85/Wef-gcr-report_2011-12-1-381-320.jpg)
![Wef gcr report_2011-12[1]](https://image.slidesharecdn.com/wefgcrreport2011-121-120107061726-phpapp02/85/Wef-gcr-report_2011-12-1-382-320.jpg)
![Wef gcr report_2011-12[1]](https://image.slidesharecdn.com/wefgcrreport2011-121-120107061726-phpapp02/85/Wef-gcr-report_2011-12-1-383-320.jpg)
![Wef gcr report_2011-12[1]](https://image.slidesharecdn.com/wefgcrreport2011-121-120107061726-phpapp02/85/Wef-gcr-report_2011-12-1-384-320.jpg)
![Wef gcr report_2011-12[1]](https://image.slidesharecdn.com/wefgcrreport2011-121-120107061726-phpapp02/85/Wef-gcr-report_2011-12-1-385-320.jpg)
![Wef gcr report_2011-12[1]](https://image.slidesharecdn.com/wefgcrreport2011-121-120107061726-phpapp02/85/Wef-gcr-report_2011-12-1-386-320.jpg)
![Wef gcr report_2011-12[1]](https://image.slidesharecdn.com/wefgcrreport2011-121-120107061726-phpapp02/85/Wef-gcr-report_2011-12-1-387-320.jpg)
![Wef gcr report_2011-12[1]](https://image.slidesharecdn.com/wefgcrreport2011-121-120107061726-phpapp02/85/Wef-gcr-report_2011-12-1-388-320.jpg)
![Wef gcr report_2011-12[1]](https://image.slidesharecdn.com/wefgcrreport2011-121-120107061726-phpapp02/85/Wef-gcr-report_2011-12-1-389-320.jpg)
![Wef gcr report_2011-12[1]](https://image.slidesharecdn.com/wefgcrreport2011-121-120107061726-phpapp02/85/Wef-gcr-report_2011-12-1-390-320.jpg)
![Wef gcr report_2011-12[1]](https://image.slidesharecdn.com/wefgcrreport2011-121-120107061726-phpapp02/85/Wef-gcr-report_2011-12-1-391-320.jpg)
![Wef gcr report_2011-12[1]](https://image.slidesharecdn.com/wefgcrreport2011-121-120107061726-phpapp02/85/Wef-gcr-report_2011-12-1-392-320.jpg)
![Wef gcr report_2011-12[1]](https://image.slidesharecdn.com/wefgcrreport2011-121-120107061726-phpapp02/85/Wef-gcr-report_2011-12-1-393-320.jpg)
![Wef gcr report_2011-12[1]](https://image.slidesharecdn.com/wefgcrreport2011-121-120107061726-phpapp02/85/Wef-gcr-report_2011-12-1-394-320.jpg)
![Wef gcr report_2011-12[1]](https://image.slidesharecdn.com/wefgcrreport2011-121-120107061726-phpapp02/85/Wef-gcr-report_2011-12-1-395-320.jpg)
![Wef gcr report_2011-12[1]](https://image.slidesharecdn.com/wefgcrreport2011-121-120107061726-phpapp02/85/Wef-gcr-report_2011-12-1-396-320.jpg)
![Wef gcr report_2011-12[1]](https://image.slidesharecdn.com/wefgcrreport2011-121-120107061726-phpapp02/85/Wef-gcr-report_2011-12-1-397-320.jpg)
![Wef gcr report_2011-12[1]](https://image.slidesharecdn.com/wefgcrreport2011-121-120107061726-phpapp02/85/Wef-gcr-report_2011-12-1-398-320.jpg)
![Wef gcr report_2011-12[1]](https://image.slidesharecdn.com/wefgcrreport2011-121-120107061726-phpapp02/85/Wef-gcr-report_2011-12-1-399-320.jpg)
![Wef gcr report_2011-12[1]](https://image.slidesharecdn.com/wefgcrreport2011-121-120107061726-phpapp02/85/Wef-gcr-report_2011-12-1-400-320.jpg)
![Wef gcr report_2011-12[1]](https://image.slidesharecdn.com/wefgcrreport2011-121-120107061726-phpapp02/85/Wef-gcr-report_2011-12-1-401-320.jpg)
![Wef gcr report_2011-12[1]](https://image.slidesharecdn.com/wefgcrreport2011-121-120107061726-phpapp02/85/Wef-gcr-report_2011-12-1-402-320.jpg)
![Wef gcr report_2011-12[1]](https://image.slidesharecdn.com/wefgcrreport2011-121-120107061726-phpapp02/85/Wef-gcr-report_2011-12-1-403-320.jpg)
![Wef gcr report_2011-12[1]](https://image.slidesharecdn.com/wefgcrreport2011-121-120107061726-phpapp02/85/Wef-gcr-report_2011-12-1-404-320.jpg)
![Wef gcr report_2011-12[1]](https://image.slidesharecdn.com/wefgcrreport2011-121-120107061726-phpapp02/85/Wef-gcr-report_2011-12-1-405-320.jpg)
![Wef gcr report_2011-12[1]](https://image.slidesharecdn.com/wefgcrreport2011-121-120107061726-phpapp02/85/Wef-gcr-report_2011-12-1-406-320.jpg)
![Wef gcr report_2011-12[1]](https://image.slidesharecdn.com/wefgcrreport2011-121-120107061726-phpapp02/85/Wef-gcr-report_2011-12-1-407-320.jpg)
![Wef gcr report_2011-12[1]](https://image.slidesharecdn.com/wefgcrreport2011-121-120107061726-phpapp02/85/Wef-gcr-report_2011-12-1-408-320.jpg)
![Wef gcr report_2011-12[1]](https://image.slidesharecdn.com/wefgcrreport2011-121-120107061726-phpapp02/85/Wef-gcr-report_2011-12-1-409-320.jpg)
![Wef gcr report_2011-12[1]](https://image.slidesharecdn.com/wefgcrreport2011-121-120107061726-phpapp02/85/Wef-gcr-report_2011-12-1-410-320.jpg)
![Wef gcr report_2011-12[1]](https://image.slidesharecdn.com/wefgcrreport2011-121-120107061726-phpapp02/85/Wef-gcr-report_2011-12-1-411-320.jpg)
![Wef gcr report_2011-12[1]](https://image.slidesharecdn.com/wefgcrreport2011-121-120107061726-phpapp02/85/Wef-gcr-report_2011-12-1-412-320.jpg)
![Wef gcr report_2011-12[1]](https://image.slidesharecdn.com/wefgcrreport2011-121-120107061726-phpapp02/85/Wef-gcr-report_2011-12-1-413-320.jpg)
![Wef gcr report_2011-12[1]](https://image.slidesharecdn.com/wefgcrreport2011-121-120107061726-phpapp02/85/Wef-gcr-report_2011-12-1-414-320.jpg)
![Wef gcr report_2011-12[1]](https://image.slidesharecdn.com/wefgcrreport2011-121-120107061726-phpapp02/85/Wef-gcr-report_2011-12-1-415-320.jpg)
![Wef gcr report_2011-12[1]](https://image.slidesharecdn.com/wefgcrreport2011-121-120107061726-phpapp02/85/Wef-gcr-report_2011-12-1-416-320.jpg)
![Wef gcr report_2011-12[1]](https://image.slidesharecdn.com/wefgcrreport2011-121-120107061726-phpapp02/85/Wef-gcr-report_2011-12-1-417-320.jpg)
![Wef gcr report_2011-12[1]](https://image.slidesharecdn.com/wefgcrreport2011-121-120107061726-phpapp02/85/Wef-gcr-report_2011-12-1-418-320.jpg)
![Wef gcr report_2011-12[1]](https://image.slidesharecdn.com/wefgcrreport2011-121-120107061726-phpapp02/85/Wef-gcr-report_2011-12-1-419-320.jpg)
![Wef gcr report_2011-12[1]](https://image.slidesharecdn.com/wefgcrreport2011-121-120107061726-phpapp02/85/Wef-gcr-report_2011-12-1-420-320.jpg)
![Wef gcr report_2011-12[1]](https://image.slidesharecdn.com/wefgcrreport2011-121-120107061726-phpapp02/85/Wef-gcr-report_2011-12-1-421-320.jpg)
![Wef gcr report_2011-12[1]](https://image.slidesharecdn.com/wefgcrreport2011-121-120107061726-phpapp02/85/Wef-gcr-report_2011-12-1-422-320.jpg)
![Wef gcr report_2011-12[1]](https://image.slidesharecdn.com/wefgcrreport2011-121-120107061726-phpapp02/85/Wef-gcr-report_2011-12-1-423-320.jpg)
![Wef gcr report_2011-12[1]](https://image.slidesharecdn.com/wefgcrreport2011-121-120107061726-phpapp02/85/Wef-gcr-report_2011-12-1-424-320.jpg)
![Wef gcr report_2011-12[1]](https://image.slidesharecdn.com/wefgcrreport2011-121-120107061726-phpapp02/85/Wef-gcr-report_2011-12-1-425-320.jpg)
![Wef gcr report_2011-12[1]](https://image.slidesharecdn.com/wefgcrreport2011-121-120107061726-phpapp02/85/Wef-gcr-report_2011-12-1-426-320.jpg)
![Wef gcr report_2011-12[1]](https://image.slidesharecdn.com/wefgcrreport2011-121-120107061726-phpapp02/85/Wef-gcr-report_2011-12-1-427-320.jpg)
![Wef gcr report_2011-12[1]](https://image.slidesharecdn.com/wefgcrreport2011-121-120107061726-phpapp02/85/Wef-gcr-report_2011-12-1-428-320.jpg)
![Wef gcr report_2011-12[1]](https://image.slidesharecdn.com/wefgcrreport2011-121-120107061726-phpapp02/85/Wef-gcr-report_2011-12-1-429-320.jpg)
![Wef gcr report_2011-12[1]](https://image.slidesharecdn.com/wefgcrreport2011-121-120107061726-phpapp02/85/Wef-gcr-report_2011-12-1-430-320.jpg)
![Wef gcr report_2011-12[1]](https://image.slidesharecdn.com/wefgcrreport2011-121-120107061726-phpapp02/85/Wef-gcr-report_2011-12-1-431-320.jpg)
![Wef gcr report_2011-12[1]](https://image.slidesharecdn.com/wefgcrreport2011-121-120107061726-phpapp02/85/Wef-gcr-report_2011-12-1-432-320.jpg)
![Wef gcr report_2011-12[1]](https://image.slidesharecdn.com/wefgcrreport2011-121-120107061726-phpapp02/85/Wef-gcr-report_2011-12-1-433-320.jpg)
![Wef gcr report_2011-12[1]](https://image.slidesharecdn.com/wefgcrreport2011-121-120107061726-phpapp02/85/Wef-gcr-report_2011-12-1-434-320.jpg)
![Wef gcr report_2011-12[1]](https://image.slidesharecdn.com/wefgcrreport2011-121-120107061726-phpapp02/85/Wef-gcr-report_2011-12-1-435-320.jpg)
![Wef gcr report_2011-12[1]](https://image.slidesharecdn.com/wefgcrreport2011-121-120107061726-phpapp02/85/Wef-gcr-report_2011-12-1-436-320.jpg)
![Wef gcr report_2011-12[1]](https://image.slidesharecdn.com/wefgcrreport2011-121-120107061726-phpapp02/85/Wef-gcr-report_2011-12-1-437-320.jpg)
![Wef gcr report_2011-12[1]](https://image.slidesharecdn.com/wefgcrreport2011-121-120107061726-phpapp02/85/Wef-gcr-report_2011-12-1-438-320.jpg)
![Wef gcr report_2011-12[1]](https://image.slidesharecdn.com/wefgcrreport2011-121-120107061726-phpapp02/85/Wef-gcr-report_2011-12-1-439-320.jpg)
![Wef gcr report_2011-12[1]](https://image.slidesharecdn.com/wefgcrreport2011-121-120107061726-phpapp02/85/Wef-gcr-report_2011-12-1-440-320.jpg)
![Wef gcr report_2011-12[1]](https://image.slidesharecdn.com/wefgcrreport2011-121-120107061726-phpapp02/85/Wef-gcr-report_2011-12-1-441-320.jpg)
![Wef gcr report_2011-12[1]](https://image.slidesharecdn.com/wefgcrreport2011-121-120107061726-phpapp02/85/Wef-gcr-report_2011-12-1-442-320.jpg)
![Wef gcr report_2011-12[1]](https://image.slidesharecdn.com/wefgcrreport2011-121-120107061726-phpapp02/85/Wef-gcr-report_2011-12-1-443-320.jpg)
![Wef gcr report_2011-12[1]](https://image.slidesharecdn.com/wefgcrreport2011-121-120107061726-phpapp02/85/Wef-gcr-report_2011-12-1-444-320.jpg)
![Wef gcr report_2011-12[1]](https://image.slidesharecdn.com/wefgcrreport2011-121-120107061726-phpapp02/85/Wef-gcr-report_2011-12-1-445-320.jpg)
![Wef gcr report_2011-12[1]](https://image.slidesharecdn.com/wefgcrreport2011-121-120107061726-phpapp02/85/Wef-gcr-report_2011-12-1-446-320.jpg)
![Wef gcr report_2011-12[1]](https://image.slidesharecdn.com/wefgcrreport2011-121-120107061726-phpapp02/85/Wef-gcr-report_2011-12-1-447-320.jpg)
![Wef gcr report_2011-12[1]](https://image.slidesharecdn.com/wefgcrreport2011-121-120107061726-phpapp02/85/Wef-gcr-report_2011-12-1-448-320.jpg)
![Wef gcr report_2011-12[1]](https://image.slidesharecdn.com/wefgcrreport2011-121-120107061726-phpapp02/85/Wef-gcr-report_2011-12-1-449-320.jpg)
![Wef gcr report_2011-12[1]](https://image.slidesharecdn.com/wefgcrreport2011-121-120107061726-phpapp02/85/Wef-gcr-report_2011-12-1-450-320.jpg)
![Wef gcr report_2011-12[1]](https://image.slidesharecdn.com/wefgcrreport2011-121-120107061726-phpapp02/85/Wef-gcr-report_2011-12-1-451-320.jpg)
![Wef gcr report_2011-12[1]](https://image.slidesharecdn.com/wefgcrreport2011-121-120107061726-phpapp02/85/Wef-gcr-report_2011-12-1-452-320.jpg)
![Wef gcr report_2011-12[1]](https://image.slidesharecdn.com/wefgcrreport2011-121-120107061726-phpapp02/85/Wef-gcr-report_2011-12-1-453-320.jpg)
![Wef gcr report_2011-12[1]](https://image.slidesharecdn.com/wefgcrreport2011-121-120107061726-phpapp02/85/Wef-gcr-report_2011-12-1-454-320.jpg)
![Wef gcr report_2011-12[1]](https://image.slidesharecdn.com/wefgcrreport2011-121-120107061726-phpapp02/85/Wef-gcr-report_2011-12-1-455-320.jpg)
![Wef gcr report_2011-12[1]](https://image.slidesharecdn.com/wefgcrreport2011-121-120107061726-phpapp02/85/Wef-gcr-report_2011-12-1-456-320.jpg)
![Wef gcr report_2011-12[1]](https://image.slidesharecdn.com/wefgcrreport2011-121-120107061726-phpapp02/85/Wef-gcr-report_2011-12-1-457-320.jpg)
![Wef gcr report_2011-12[1]](https://image.slidesharecdn.com/wefgcrreport2011-121-120107061726-phpapp02/85/Wef-gcr-report_2011-12-1-458-320.jpg)
![Wef gcr report_2011-12[1]](https://image.slidesharecdn.com/wefgcrreport2011-121-120107061726-phpapp02/85/Wef-gcr-report_2011-12-1-459-320.jpg)
![Wef gcr report_2011-12[1]](https://image.slidesharecdn.com/wefgcrreport2011-121-120107061726-phpapp02/85/Wef-gcr-report_2011-12-1-460-320.jpg)
![Wef gcr report_2011-12[1]](https://image.slidesharecdn.com/wefgcrreport2011-121-120107061726-phpapp02/85/Wef-gcr-report_2011-12-1-461-320.jpg)
![Wef gcr report_2011-12[1]](https://image.slidesharecdn.com/wefgcrreport2011-121-120107061726-phpapp02/85/Wef-gcr-report_2011-12-1-462-320.jpg)
![Wef gcr report_2011-12[1]](https://image.slidesharecdn.com/wefgcrreport2011-121-120107061726-phpapp02/85/Wef-gcr-report_2011-12-1-463-320.jpg)
![Wef gcr report_2011-12[1]](https://image.slidesharecdn.com/wefgcrreport2011-121-120107061726-phpapp02/85/Wef-gcr-report_2011-12-1-464-320.jpg)
![Wef gcr report_2011-12[1]](https://image.slidesharecdn.com/wefgcrreport2011-121-120107061726-phpapp02/85/Wef-gcr-report_2011-12-1-465-320.jpg)
![Wef gcr report_2011-12[1]](https://image.slidesharecdn.com/wefgcrreport2011-121-120107061726-phpapp02/85/Wef-gcr-report_2011-12-1-466-320.jpg)
![Wef gcr report_2011-12[1]](https://image.slidesharecdn.com/wefgcrreport2011-121-120107061726-phpapp02/85/Wef-gcr-report_2011-12-1-467-320.jpg)
![Wef gcr report_2011-12[1]](https://image.slidesharecdn.com/wefgcrreport2011-121-120107061726-phpapp02/85/Wef-gcr-report_2011-12-1-468-320.jpg)
![Wef gcr report_2011-12[1]](https://image.slidesharecdn.com/wefgcrreport2011-121-120107061726-phpapp02/85/Wef-gcr-report_2011-12-1-469-320.jpg)
![Wef gcr report_2011-12[1]](https://image.slidesharecdn.com/wefgcrreport2011-121-120107061726-phpapp02/85/Wef-gcr-report_2011-12-1-470-320.jpg)
![Wef gcr report_2011-12[1]](https://image.slidesharecdn.com/wefgcrreport2011-121-120107061726-phpapp02/85/Wef-gcr-report_2011-12-1-471-320.jpg)
![Wef gcr report_2011-12[1]](https://image.slidesharecdn.com/wefgcrreport2011-121-120107061726-phpapp02/85/Wef-gcr-report_2011-12-1-472-320.jpg)
![Wef gcr report_2011-12[1]](https://image.slidesharecdn.com/wefgcrreport2011-121-120107061726-phpapp02/85/Wef-gcr-report_2011-12-1-473-320.jpg)
![Wef gcr report_2011-12[1]](https://image.slidesharecdn.com/wefgcrreport2011-121-120107061726-phpapp02/85/Wef-gcr-report_2011-12-1-474-320.jpg)
![Wef gcr report_2011-12[1]](https://image.slidesharecdn.com/wefgcrreport2011-121-120107061726-phpapp02/85/Wef-gcr-report_2011-12-1-475-320.jpg)
![Wef gcr report_2011-12[1]](https://image.slidesharecdn.com/wefgcrreport2011-121-120107061726-phpapp02/85/Wef-gcr-report_2011-12-1-476-320.jpg)
![Wef gcr report_2011-12[1]](https://image.slidesharecdn.com/wefgcrreport2011-121-120107061726-phpapp02/85/Wef-gcr-report_2011-12-1-477-320.jpg)
![Wef gcr report_2011-12[1]](https://image.slidesharecdn.com/wefgcrreport2011-121-120107061726-phpapp02/85/Wef-gcr-report_2011-12-1-478-320.jpg)
![Wef gcr report_2011-12[1]](https://image.slidesharecdn.com/wefgcrreport2011-121-120107061726-phpapp02/85/Wef-gcr-report_2011-12-1-479-320.jpg)
![Wef gcr report_2011-12[1]](https://image.slidesharecdn.com/wefgcrreport2011-121-120107061726-phpapp02/85/Wef-gcr-report_2011-12-1-480-320.jpg)
![Wef gcr report_2011-12[1]](https://image.slidesharecdn.com/wefgcrreport2011-121-120107061726-phpapp02/85/Wef-gcr-report_2011-12-1-481-320.jpg)
![Wef gcr report_2011-12[1]](https://image.slidesharecdn.com/wefgcrreport2011-121-120107061726-phpapp02/85/Wef-gcr-report_2011-12-1-482-320.jpg)
![Wef gcr report_2011-12[1]](https://image.slidesharecdn.com/wefgcrreport2011-121-120107061726-phpapp02/85/Wef-gcr-report_2011-12-1-483-320.jpg)
![Wef gcr report_2011-12[1]](https://image.slidesharecdn.com/wefgcrreport2011-121-120107061726-phpapp02/85/Wef-gcr-report_2011-12-1-484-320.jpg)
![Wef gcr report_2011-12[1]](https://image.slidesharecdn.com/wefgcrreport2011-121-120107061726-phpapp02/85/Wef-gcr-report_2011-12-1-485-320.jpg)
![Wef gcr report_2011-12[1]](https://image.slidesharecdn.com/wefgcrreport2011-121-120107061726-phpapp02/85/Wef-gcr-report_2011-12-1-486-320.jpg)
![Wef gcr report_2011-12[1]](https://image.slidesharecdn.com/wefgcrreport2011-121-120107061726-phpapp02/85/Wef-gcr-report_2011-12-1-487-320.jpg)
![Wef gcr report_2011-12[1]](https://image.slidesharecdn.com/wefgcrreport2011-121-120107061726-phpapp02/85/Wef-gcr-report_2011-12-1-488-320.jpg)
![Wef gcr report_2011-12[1]](https://image.slidesharecdn.com/wefgcrreport2011-121-120107061726-phpapp02/85/Wef-gcr-report_2011-12-1-489-320.jpg)
![Wef gcr report_2011-12[1]](https://image.slidesharecdn.com/wefgcrreport2011-121-120107061726-phpapp02/85/Wef-gcr-report_2011-12-1-490-320.jpg)
![Wef gcr report_2011-12[1]](https://image.slidesharecdn.com/wefgcrreport2011-121-120107061726-phpapp02/85/Wef-gcr-report_2011-12-1-491-320.jpg)
![Wef gcr report_2011-12[1]](https://image.slidesharecdn.com/wefgcrreport2011-121-120107061726-phpapp02/85/Wef-gcr-report_2011-12-1-492-320.jpg)
![Wef gcr report_2011-12[1]](https://image.slidesharecdn.com/wefgcrreport2011-121-120107061726-phpapp02/85/Wef-gcr-report_2011-12-1-493-320.jpg)
![Wef gcr report_2011-12[1]](https://image.slidesharecdn.com/wefgcrreport2011-121-120107061726-phpapp02/85/Wef-gcr-report_2011-12-1-494-320.jpg)
![Wef gcr report_2011-12[1]](https://image.slidesharecdn.com/wefgcrreport2011-121-120107061726-phpapp02/85/Wef-gcr-report_2011-12-1-495-320.jpg)
![Wef gcr report_2011-12[1]](https://image.slidesharecdn.com/wefgcrreport2011-121-120107061726-phpapp02/85/Wef-gcr-report_2011-12-1-496-320.jpg)
![Wef gcr report_2011-12[1]](https://image.slidesharecdn.com/wefgcrreport2011-121-120107061726-phpapp02/85/Wef-gcr-report_2011-12-1-497-320.jpg)
![Wef gcr report_2011-12[1]](https://image.slidesharecdn.com/wefgcrreport2011-121-120107061726-phpapp02/85/Wef-gcr-report_2011-12-1-498-320.jpg)
![Wef gcr report_2011-12[1]](https://image.slidesharecdn.com/wefgcrreport2011-121-120107061726-phpapp02/85/Wef-gcr-report_2011-12-1-499-320.jpg)
![Wef gcr report_2011-12[1]](https://image.slidesharecdn.com/wefgcrreport2011-121-120107061726-phpapp02/85/Wef-gcr-report_2011-12-1-500-320.jpg)
![Wef gcr report_2011-12[1]](https://image.slidesharecdn.com/wefgcrreport2011-121-120107061726-phpapp02/85/Wef-gcr-report_2011-12-1-501-320.jpg)
![Wef gcr report_2011-12[1]](https://image.slidesharecdn.com/wefgcrreport2011-121-120107061726-phpapp02/85/Wef-gcr-report_2011-12-1-502-320.jpg)
![Wef gcr report_2011-12[1]](https://image.slidesharecdn.com/wefgcrreport2011-121-120107061726-phpapp02/85/Wef-gcr-report_2011-12-1-503-320.jpg)
![Wef gcr report_2011-12[1]](https://image.slidesharecdn.com/wefgcrreport2011-121-120107061726-phpapp02/85/Wef-gcr-report_2011-12-1-504-320.jpg)
![Wef gcr report_2011-12[1]](https://image.slidesharecdn.com/wefgcrreport2011-121-120107061726-phpapp02/85/Wef-gcr-report_2011-12-1-505-320.jpg)
![Wef gcr report_2011-12[1]](https://image.slidesharecdn.com/wefgcrreport2011-121-120107061726-phpapp02/85/Wef-gcr-report_2011-12-1-506-320.jpg)
![Wef gcr report_2011-12[1]](https://image.slidesharecdn.com/wefgcrreport2011-121-120107061726-phpapp02/85/Wef-gcr-report_2011-12-1-507-320.jpg)
![Wef gcr report_2011-12[1]](https://image.slidesharecdn.com/wefgcrreport2011-121-120107061726-phpapp02/85/Wef-gcr-report_2011-12-1-508-320.jpg)
![Wef gcr report_2011-12[1]](https://image.slidesharecdn.com/wefgcrreport2011-121-120107061726-phpapp02/85/Wef-gcr-report_2011-12-1-509-320.jpg)
![Wef gcr report_2011-12[1]](https://image.slidesharecdn.com/wefgcrreport2011-121-120107061726-phpapp02/85/Wef-gcr-report_2011-12-1-510-320.jpg)
![Wef gcr report_2011-12[1]](https://image.slidesharecdn.com/wefgcrreport2011-121-120107061726-phpapp02/85/Wef-gcr-report_2011-12-1-511-320.jpg)
![Wef gcr report_2011-12[1]](https://image.slidesharecdn.com/wefgcrreport2011-121-120107061726-phpapp02/85/Wef-gcr-report_2011-12-1-512-320.jpg)
![Wef gcr report_2011-12[1]](https://image.slidesharecdn.com/wefgcrreport2011-121-120107061726-phpapp02/85/Wef-gcr-report_2011-12-1-513-320.jpg)
![Wef gcr report_2011-12[1]](https://image.slidesharecdn.com/wefgcrreport2011-121-120107061726-phpapp02/85/Wef-gcr-report_2011-12-1-514-320.jpg)
![Wef gcr report_2011-12[1]](https://image.slidesharecdn.com/wefgcrreport2011-121-120107061726-phpapp02/85/Wef-gcr-report_2011-12-1-515-320.jpg)
![Wef gcr report_2011-12[1]](https://image.slidesharecdn.com/wefgcrreport2011-121-120107061726-phpapp02/85/Wef-gcr-report_2011-12-1-516-320.jpg)
![Wef gcr report_2011-12[1]](https://image.slidesharecdn.com/wefgcrreport2011-121-120107061726-phpapp02/85/Wef-gcr-report_2011-12-1-517-320.jpg)
![Wef gcr report_2011-12[1]](https://image.slidesharecdn.com/wefgcrreport2011-121-120107061726-phpapp02/85/Wef-gcr-report_2011-12-1-518-320.jpg)
![Wef gcr report_2011-12[1]](https://image.slidesharecdn.com/wefgcrreport2011-121-120107061726-phpapp02/85/Wef-gcr-report_2011-12-1-519-320.jpg)
![Wef gcr report_2011-12[1]](https://image.slidesharecdn.com/wefgcrreport2011-121-120107061726-phpapp02/85/Wef-gcr-report_2011-12-1-520-320.jpg)
![Wef gcr report_2011-12[1]](https://image.slidesharecdn.com/wefgcrreport2011-121-120107061726-phpapp02/85/Wef-gcr-report_2011-12-1-521-320.jpg)
![Wef gcr report_2011-12[1]](https://image.slidesharecdn.com/wefgcrreport2011-121-120107061726-phpapp02/85/Wef-gcr-report_2011-12-1-522-320.jpg)
![Wef gcr report_2011-12[1]](https://image.slidesharecdn.com/wefgcrreport2011-121-120107061726-phpapp02/85/Wef-gcr-report_2011-12-1-523-320.jpg)
![Wef gcr report_2011-12[1]](https://image.slidesharecdn.com/wefgcrreport2011-121-120107061726-phpapp02/85/Wef-gcr-report_2011-12-1-524-320.jpg)
![Wef gcr report_2011-12[1]](https://image.slidesharecdn.com/wefgcrreport2011-121-120107061726-phpapp02/85/Wef-gcr-report_2011-12-1-525-320.jpg)
![Wef gcr report_2011-12[1]](https://image.slidesharecdn.com/wefgcrreport2011-121-120107061726-phpapp02/85/Wef-gcr-report_2011-12-1-526-320.jpg)
![Wef gcr report_2011-12[1]](https://image.slidesharecdn.com/wefgcrreport2011-121-120107061726-phpapp02/85/Wef-gcr-report_2011-12-1-527-320.jpg)
![Wef gcr report_2011-12[1]](https://image.slidesharecdn.com/wefgcrreport2011-121-120107061726-phpapp02/85/Wef-gcr-report_2011-12-1-528-320.jpg)
![Wef gcr report_2011-12[1]](https://image.slidesharecdn.com/wefgcrreport2011-121-120107061726-phpapp02/85/Wef-gcr-report_2011-12-1-529-320.jpg)
![Wef gcr report_2011-12[1]](https://image.slidesharecdn.com/wefgcrreport2011-121-120107061726-phpapp02/85/Wef-gcr-report_2011-12-1-530-320.jpg)
![Wef gcr report_2011-12[1]](https://image.slidesharecdn.com/wefgcrreport2011-121-120107061726-phpapp02/85/Wef-gcr-report_2011-12-1-531-320.jpg)
![Wef gcr report_2011-12[1]](https://image.slidesharecdn.com/wefgcrreport2011-121-120107061726-phpapp02/85/Wef-gcr-report_2011-12-1-532-320.jpg)
![Wef gcr report_2011-12[1]](https://image.slidesharecdn.com/wefgcrreport2011-121-120107061726-phpapp02/85/Wef-gcr-report_2011-12-1-533-320.jpg)
![Wef gcr report_2011-12[1]](https://image.slidesharecdn.com/wefgcrreport2011-121-120107061726-phpapp02/85/Wef-gcr-report_2011-12-1-534-320.jpg)
![Wef gcr report_2011-12[1]](https://image.slidesharecdn.com/wefgcrreport2011-121-120107061726-phpapp02/85/Wef-gcr-report_2011-12-1-535-320.jpg)
![Wef gcr report_2011-12[1]](https://image.slidesharecdn.com/wefgcrreport2011-121-120107061726-phpapp02/85/Wef-gcr-report_2011-12-1-536-320.jpg)
![Wef gcr report_2011-12[1]](https://image.slidesharecdn.com/wefgcrreport2011-121-120107061726-phpapp02/85/Wef-gcr-report_2011-12-1-537-320.jpg)
![Wef gcr report_2011-12[1]](https://image.slidesharecdn.com/wefgcrreport2011-121-120107061726-phpapp02/85/Wef-gcr-report_2011-12-1-538-320.jpg)
![Wef gcr report_2011-12[1]](https://image.slidesharecdn.com/wefgcrreport2011-121-120107061726-phpapp02/85/Wef-gcr-report_2011-12-1-539-320.jpg)
![Wef gcr report_2011-12[1]](https://image.slidesharecdn.com/wefgcrreport2011-121-120107061726-phpapp02/85/Wef-gcr-report_2011-12-1-540-320.jpg)
![Wef gcr report_2011-12[1]](https://image.slidesharecdn.com/wefgcrreport2011-121-120107061726-phpapp02/85/Wef-gcr-report_2011-12-1-541-320.jpg)
![Wef gcr report_2011-12[1]](https://image.slidesharecdn.com/wefgcrreport2011-121-120107061726-phpapp02/85/Wef-gcr-report_2011-12-1-542-320.jpg)
![Wef gcr report_2011-12[1]](https://image.slidesharecdn.com/wefgcrreport2011-121-120107061726-phpapp02/85/Wef-gcr-report_2011-12-1-543-320.jpg)
![Wef gcr report_2011-12[1]](https://image.slidesharecdn.com/wefgcrreport2011-121-120107061726-phpapp02/85/Wef-gcr-report_2011-12-1-544-320.jpg)

Tatevik Vardanyan Botswana Institute for Development Policy Analysis (BIDPA) Keith Jefferis, Senior Research Fellow Australia Tebogo B. Seleka, Senior Research Fellow Melbourne Institute of Applied Economic and Social Research, Masedi Seleka, Research Fellow University of Melbourne John P. Martin, Director Brazil John Oster, Research Fellow IBRE/FGV—Fundação Getulio Vargas Peter Whiteford, Professor Carlos Ari Sundfeld, Professor Marcos Jank, Professor Austria João Moutinho dos Santos, Researcher WIFO—Austrian Institute of Economic Research Pedro da Motta Ve


![Koluni white-paper[1]](https://cdn.slidesharecdn.com/ss_thumbnails/koluni-white-paper1-111217171155-phpapp02-thumbnail.jpg?width=640&height=640&fit=bounds)
![Forkosh hershkovitz[1]](https://cdn.slidesharecdn.com/ss_thumbnails/forkoshhershkovitz1-111217171619-phpapp02-thumbnail.jpg?width=640&height=640&fit=bounds)


![Los%20jo%cc%81venes%20y%20las%20nuevas%20tecnologias[1]](https://cdn.slidesharecdn.com/ss_thumbnails/los20jocc81venes20y20las20nuevas20tecnologias1-100705080327-phpapp02-thumbnail.jpg?width=640&height=640&fit=bounds)


![Consideracionesentornoalactodeestudiar[1]](https://cdn.slidesharecdn.com/ss_thumbnails/consideracionesentornoalactodeestudiar1-111217172246-phpapp01-thumbnail.jpg?width=640&height=640&fit=bounds)


![Roberto aparici[1]](https://cdn.slidesharecdn.com/ss_thumbnails/robertoaparici1-111217172455-phpapp02-thumbnail.jpg?width=640&height=640&fit=bounds)

![Informe escuelas[1]](https://cdn.slidesharecdn.com/ss_thumbnails/informeescuelas1-120107073142-phpapp02-thumbnail.jpg?width=640&height=640&fit=bounds)


![Science a tsspanish-dec09[1]](https://cdn.slidesharecdn.com/ss_thumbnails/scienceatsspanish-dec091-120107135319-phpapp01-thumbnail.jpg?width=640&height=640&fit=bounds)


![Claudia%20 mar%c3%a da%20ram%c3%adrez%20culebro[1]](https://cdn.slidesharecdn.com/ss_thumbnails/claudia20marc3ada20ramc3adrez20culebro1-120107064732-phpapp02-thumbnail.jpg?width=640&height=640&fit=bounds)


![01 pre-12378[1]](https://cdn.slidesharecdn.com/ss_thumbnails/01-pre-123781-120104135358-phpapp02-thumbnail.jpg?width=640&height=640&fit=bounds)


