World Economic Forum
Geneva,Switzerland 2010
Professor Klaus Schwab
World Economic Forum
Editor
The Global
Competitiveness Report
2010–2011
Professor Xavier Sala-i-Martin
Columbia University
Chief Advisor of the Centre for Global Competitiveness and Performance
Members of the Global Competitiveness Report Advisory Board
Dr Kemal Dervis
Brookings Institution
Vice-President and Director, Global Economy and Development
Professor Ricardo Hausmann
Harvard University
Director, Center for International Development, John F. Kennedy School of Government
H.E. Dr Felipe Larraín Bascuñán
Minister of Finance of Chile
H.E. Dr Mari Elka Pangestu
Minister of Trade of Indonesia
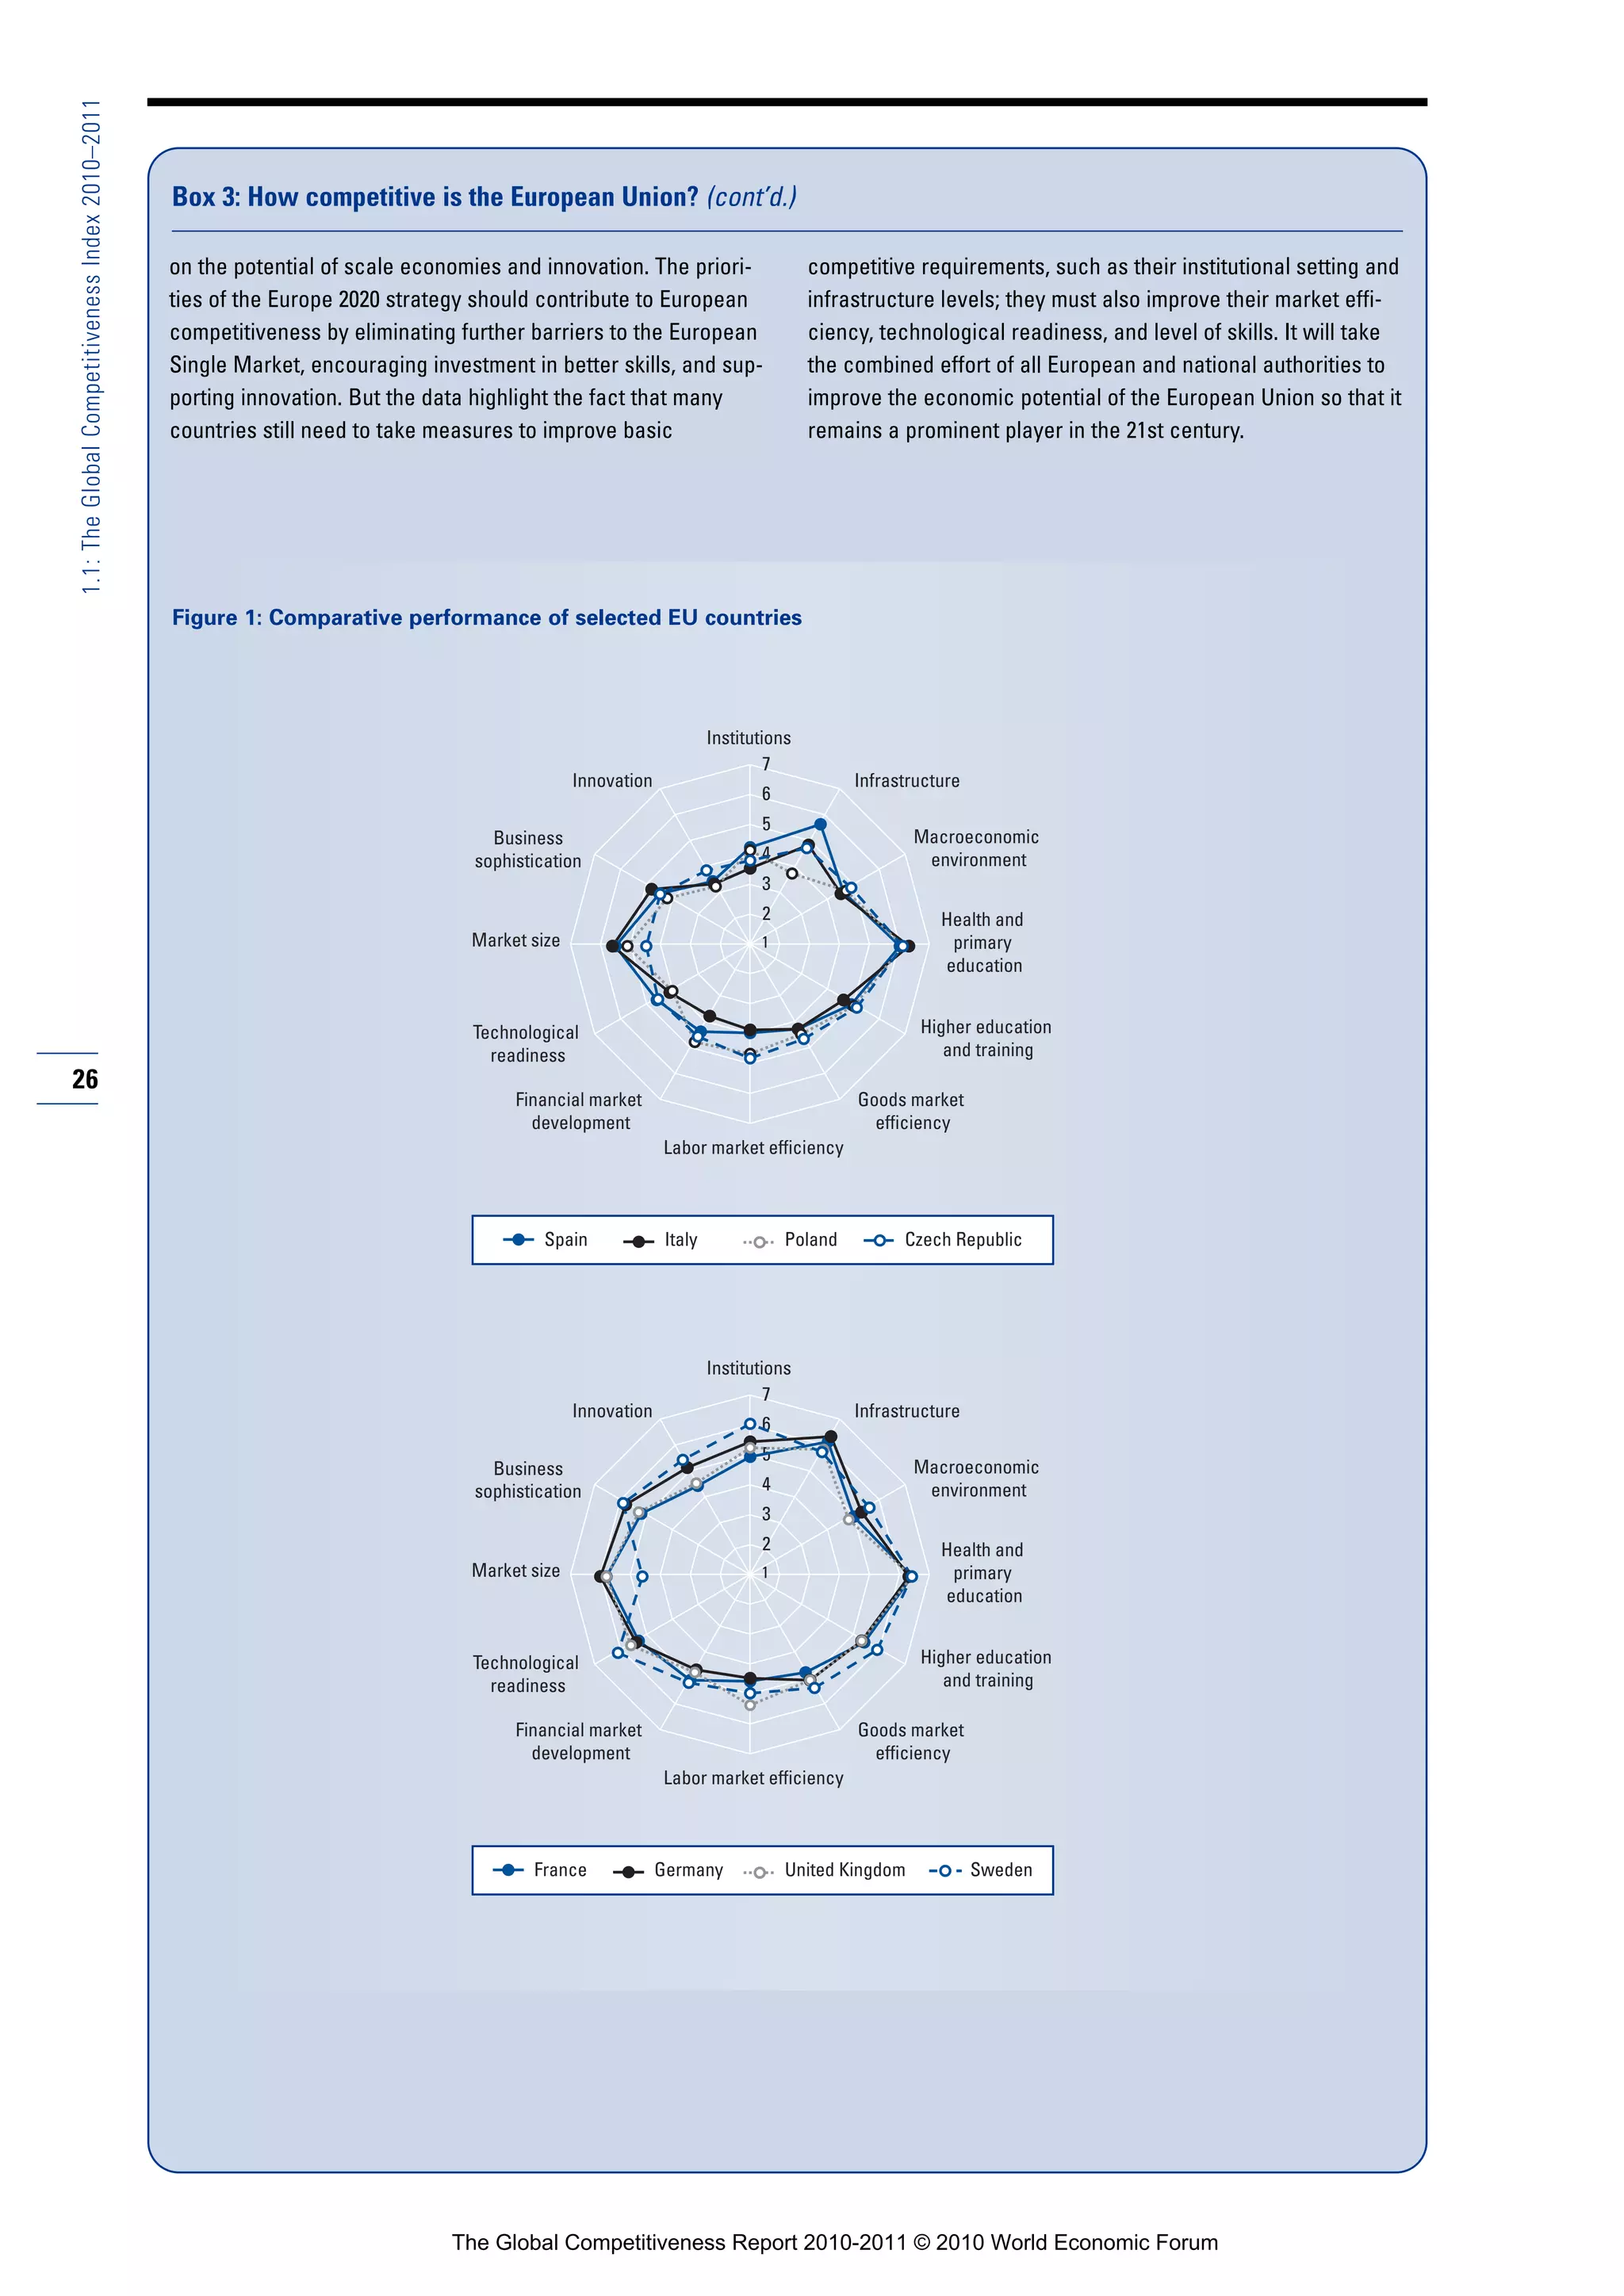
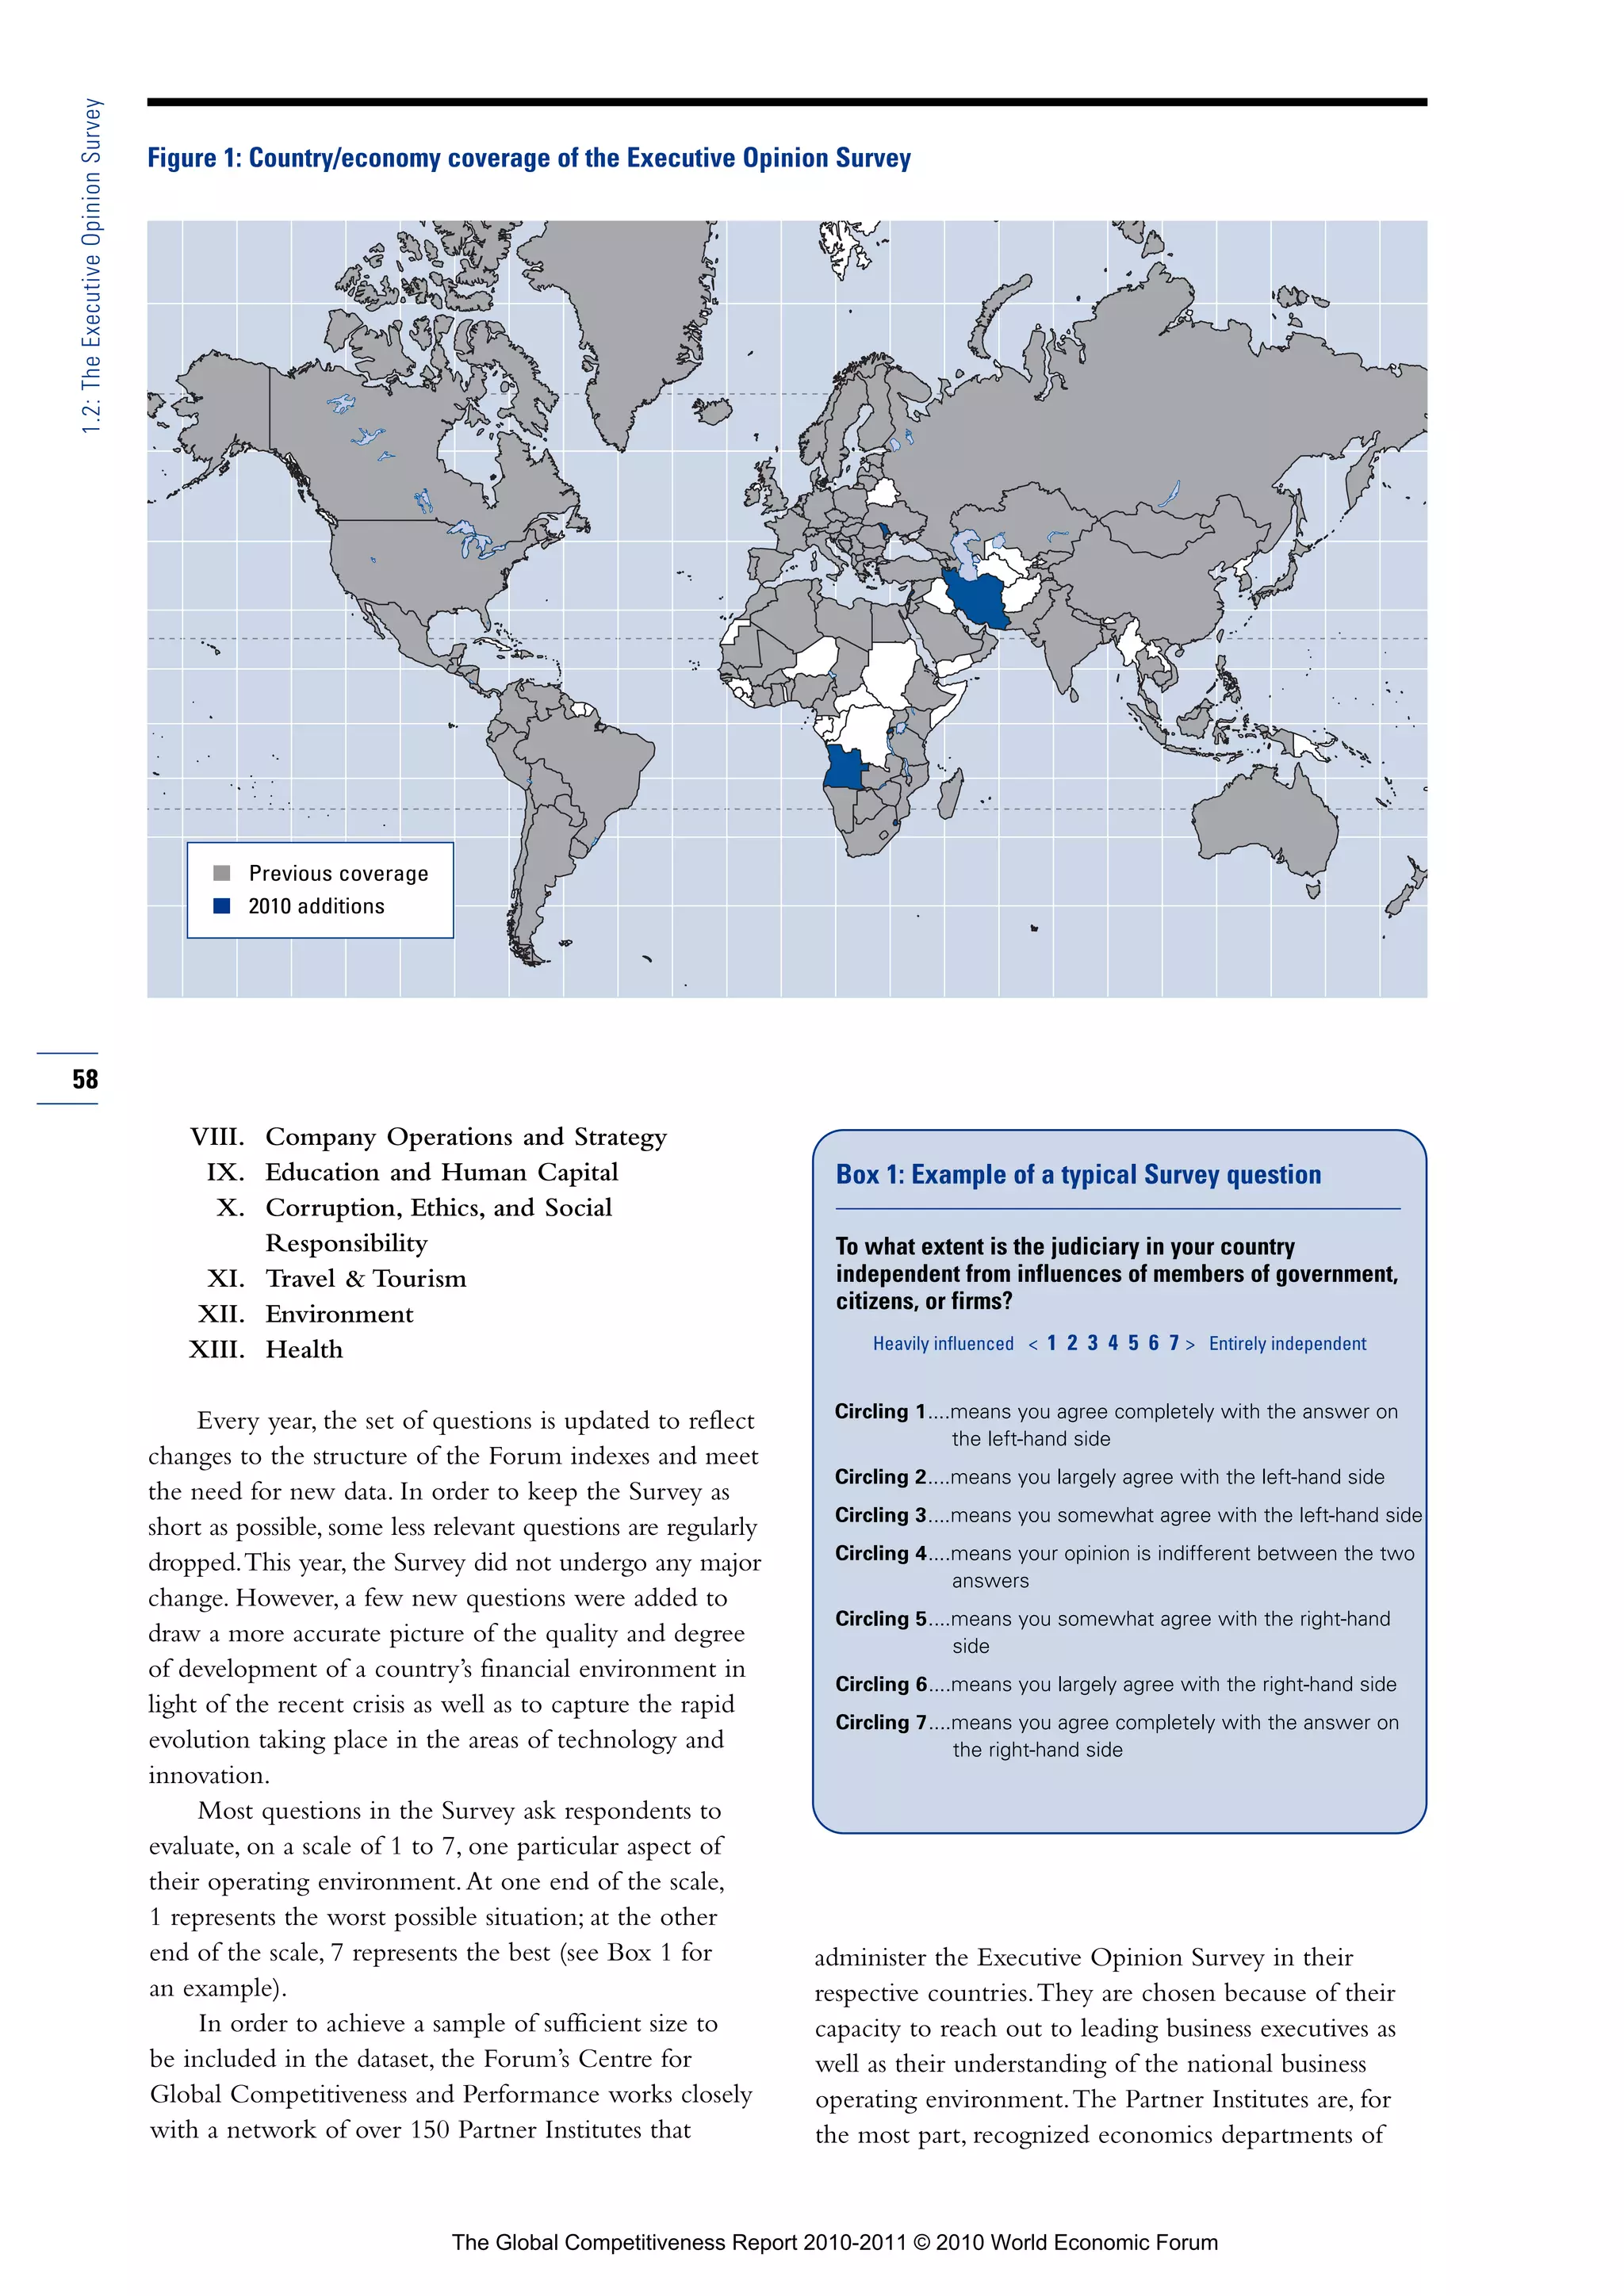
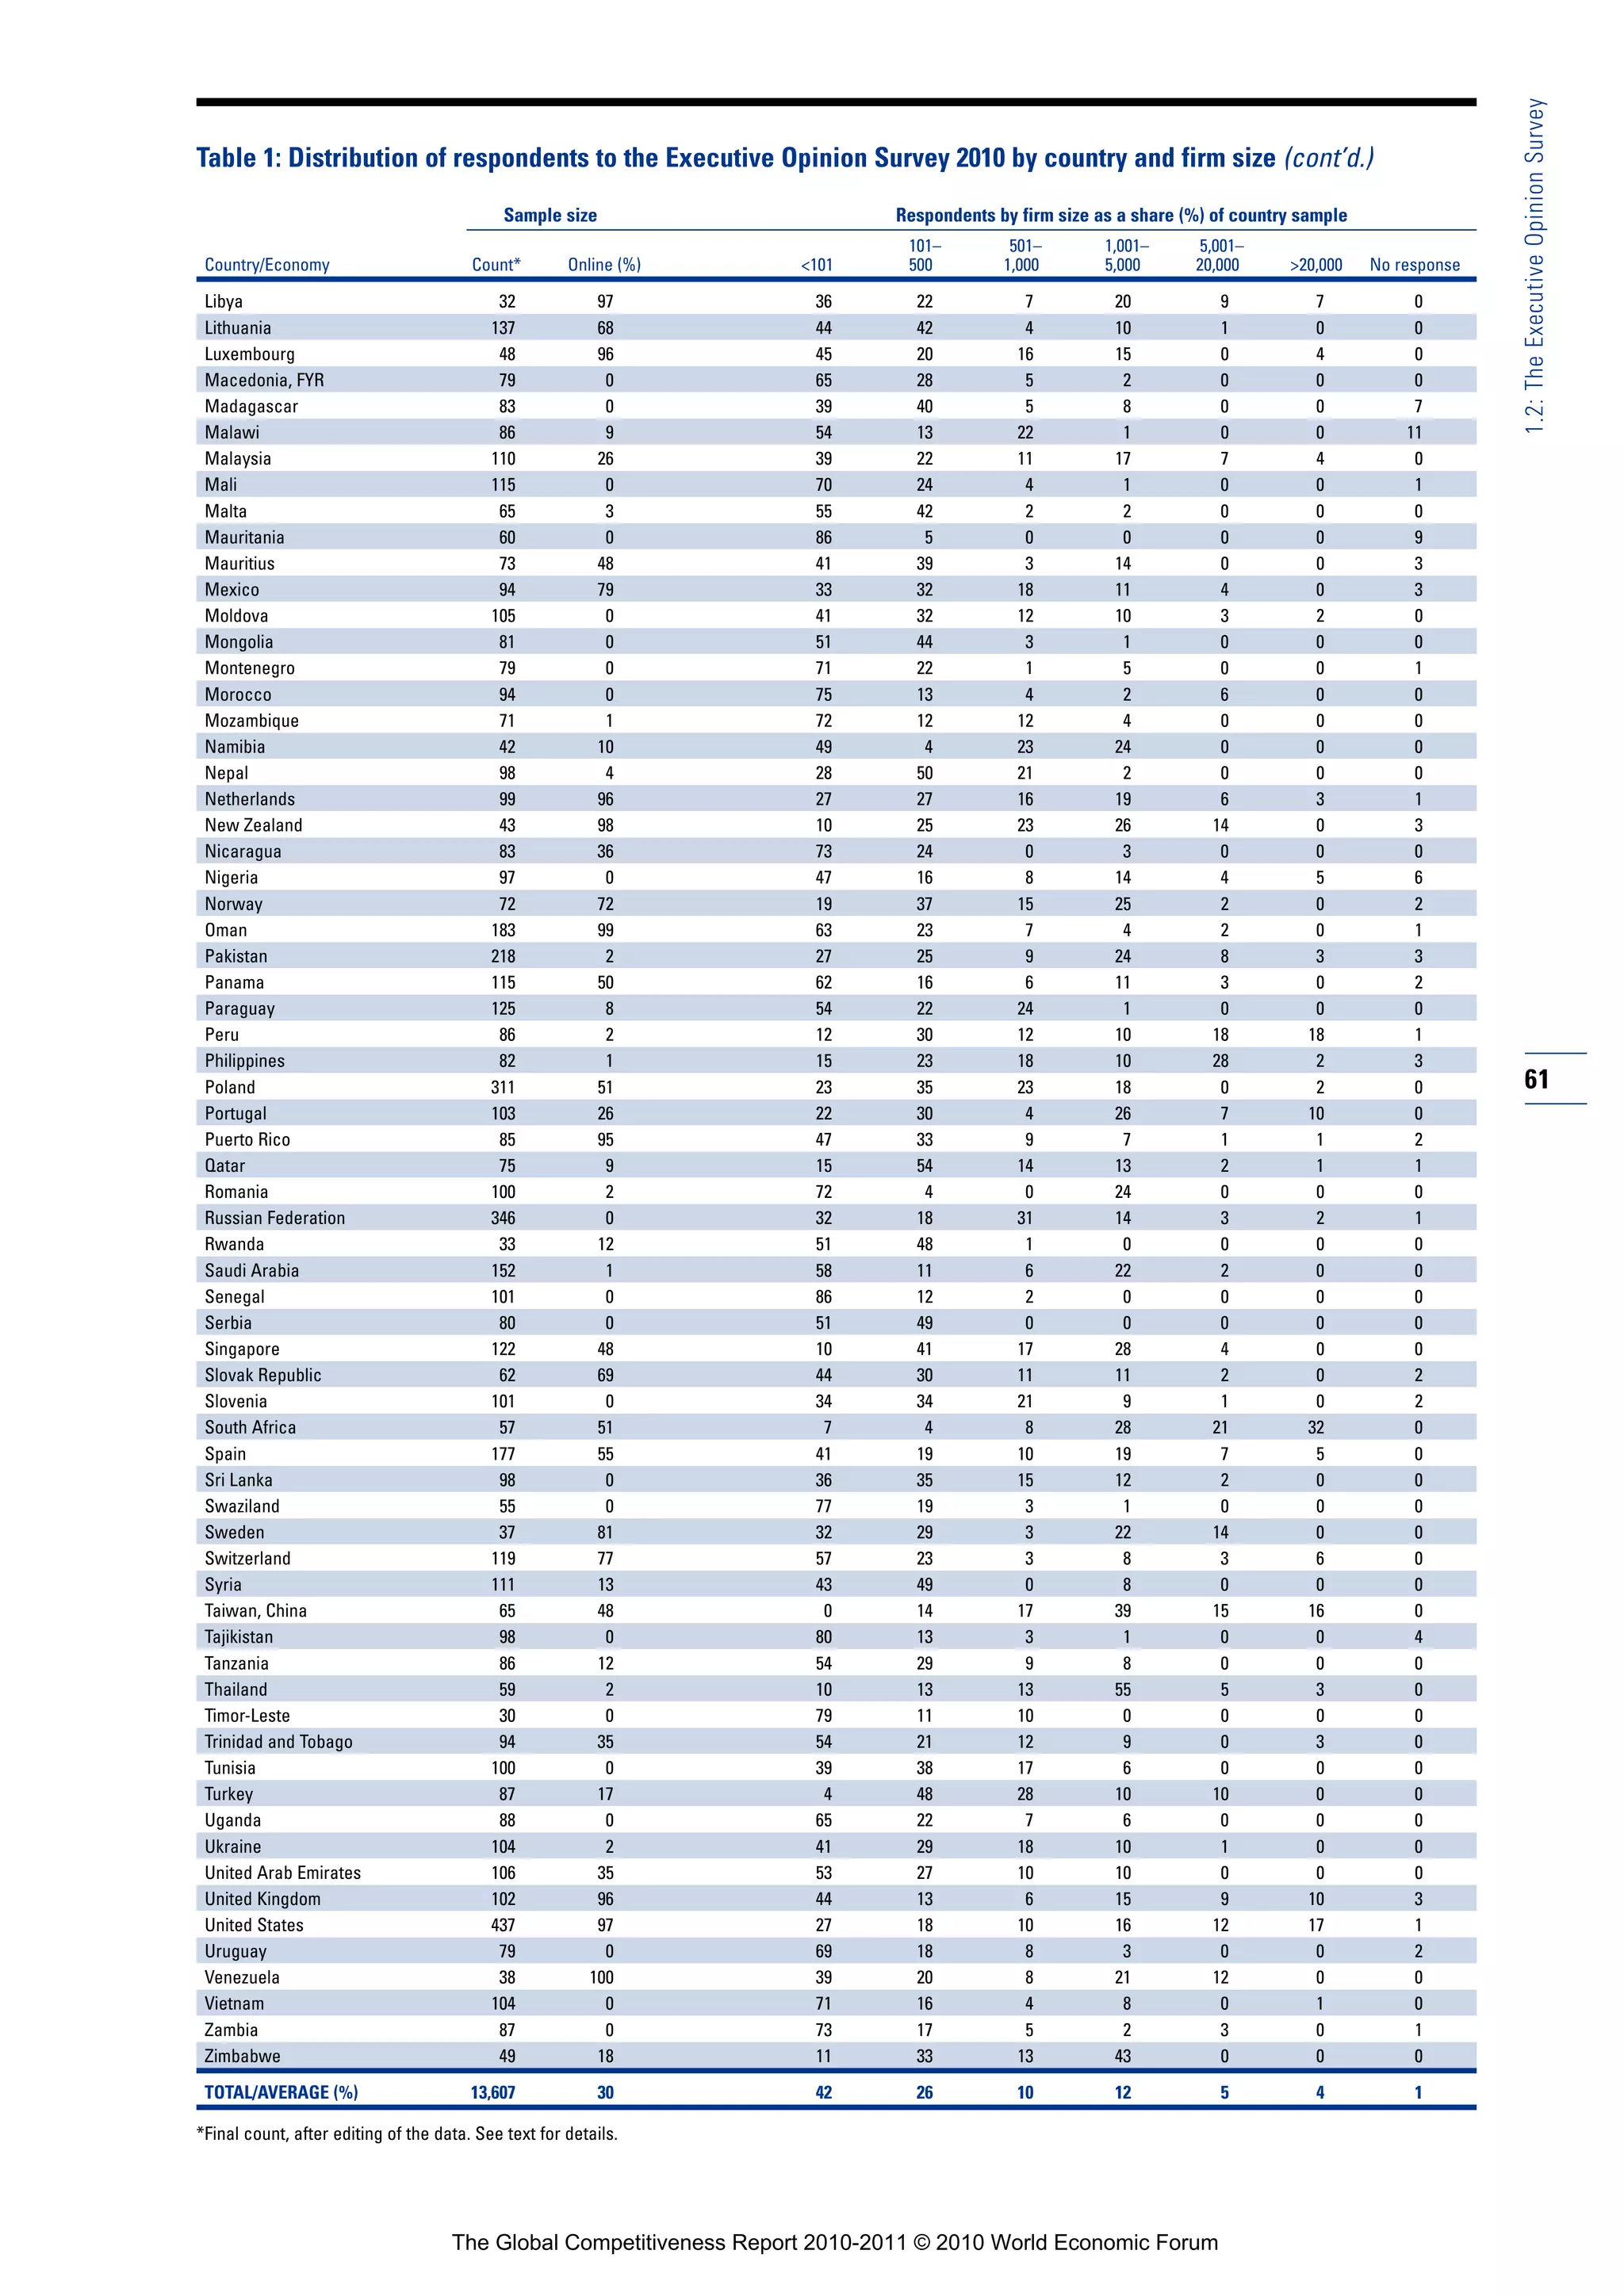
More than threedecades after its first publication in 1979, The Global Competitiveness
Report series continues to provide the world’s most respected assessment of national
competitiveness. This year’s Report is being released at a time of great uncertainty
about the global economy and a shift in the balance of economic activity away from
advanced economies and toward emerging markets. Policymakers are increasingly
struggling to manage new challenges while preparing their economies to perform
well in a rapidly changing global environment.
The present context makes it more important than ever for countries to put into place
the fundamentals underpinning growth and development. The Global Competitiveness
Report 2010–2011 facilitates this process by providing detailed analysis of the productive
potential of nations worldwide. The Report offers policymakers, business executives,
and academics, as well as the public at large, valuable insights into the policies,
institutions, and factors that enable robust economic development and long-term
prosperity.
Produced in collaboration with leading academics and a global network of Partner
Institutes, The Global Competitiveness Report 2010–2011 offers users a unique dataset
on a broad array of competitiveness indicators for a record number of 139 economies.
The data used in the Report come from leading international sources as well as from the
World Economic Forum’s annual Executive Opinion Survey, which provides a distinctive
source capturing the perceptions of several thousand business leaders on topics related
to national competitiveness.
The Report presents the rankings of the Global Competitiveness Index (GCI), developed
by Professor Xavier Sala-i-Martin and introduced in 2005. The GCI is based on 12 pillars
of competitiveness, providing a comprehensive picture of the competitiveness landscape
in countries around the world at different stages of economic development. The Report
also contains detailed profiles highlighting competitive strengths and weaknesses for
each of the 139 economies featured, as well as an extensive section of data tables
displaying relative rankings for more than 100 variables.
Cover design: Neil Weinberg
Cover art: Getty Images;
Getty Images; iStock
Photography; Getty Images
ISBN-13: 978-92-95044-87-6


![1.1: The Global Competitiveness Index 2010–2011
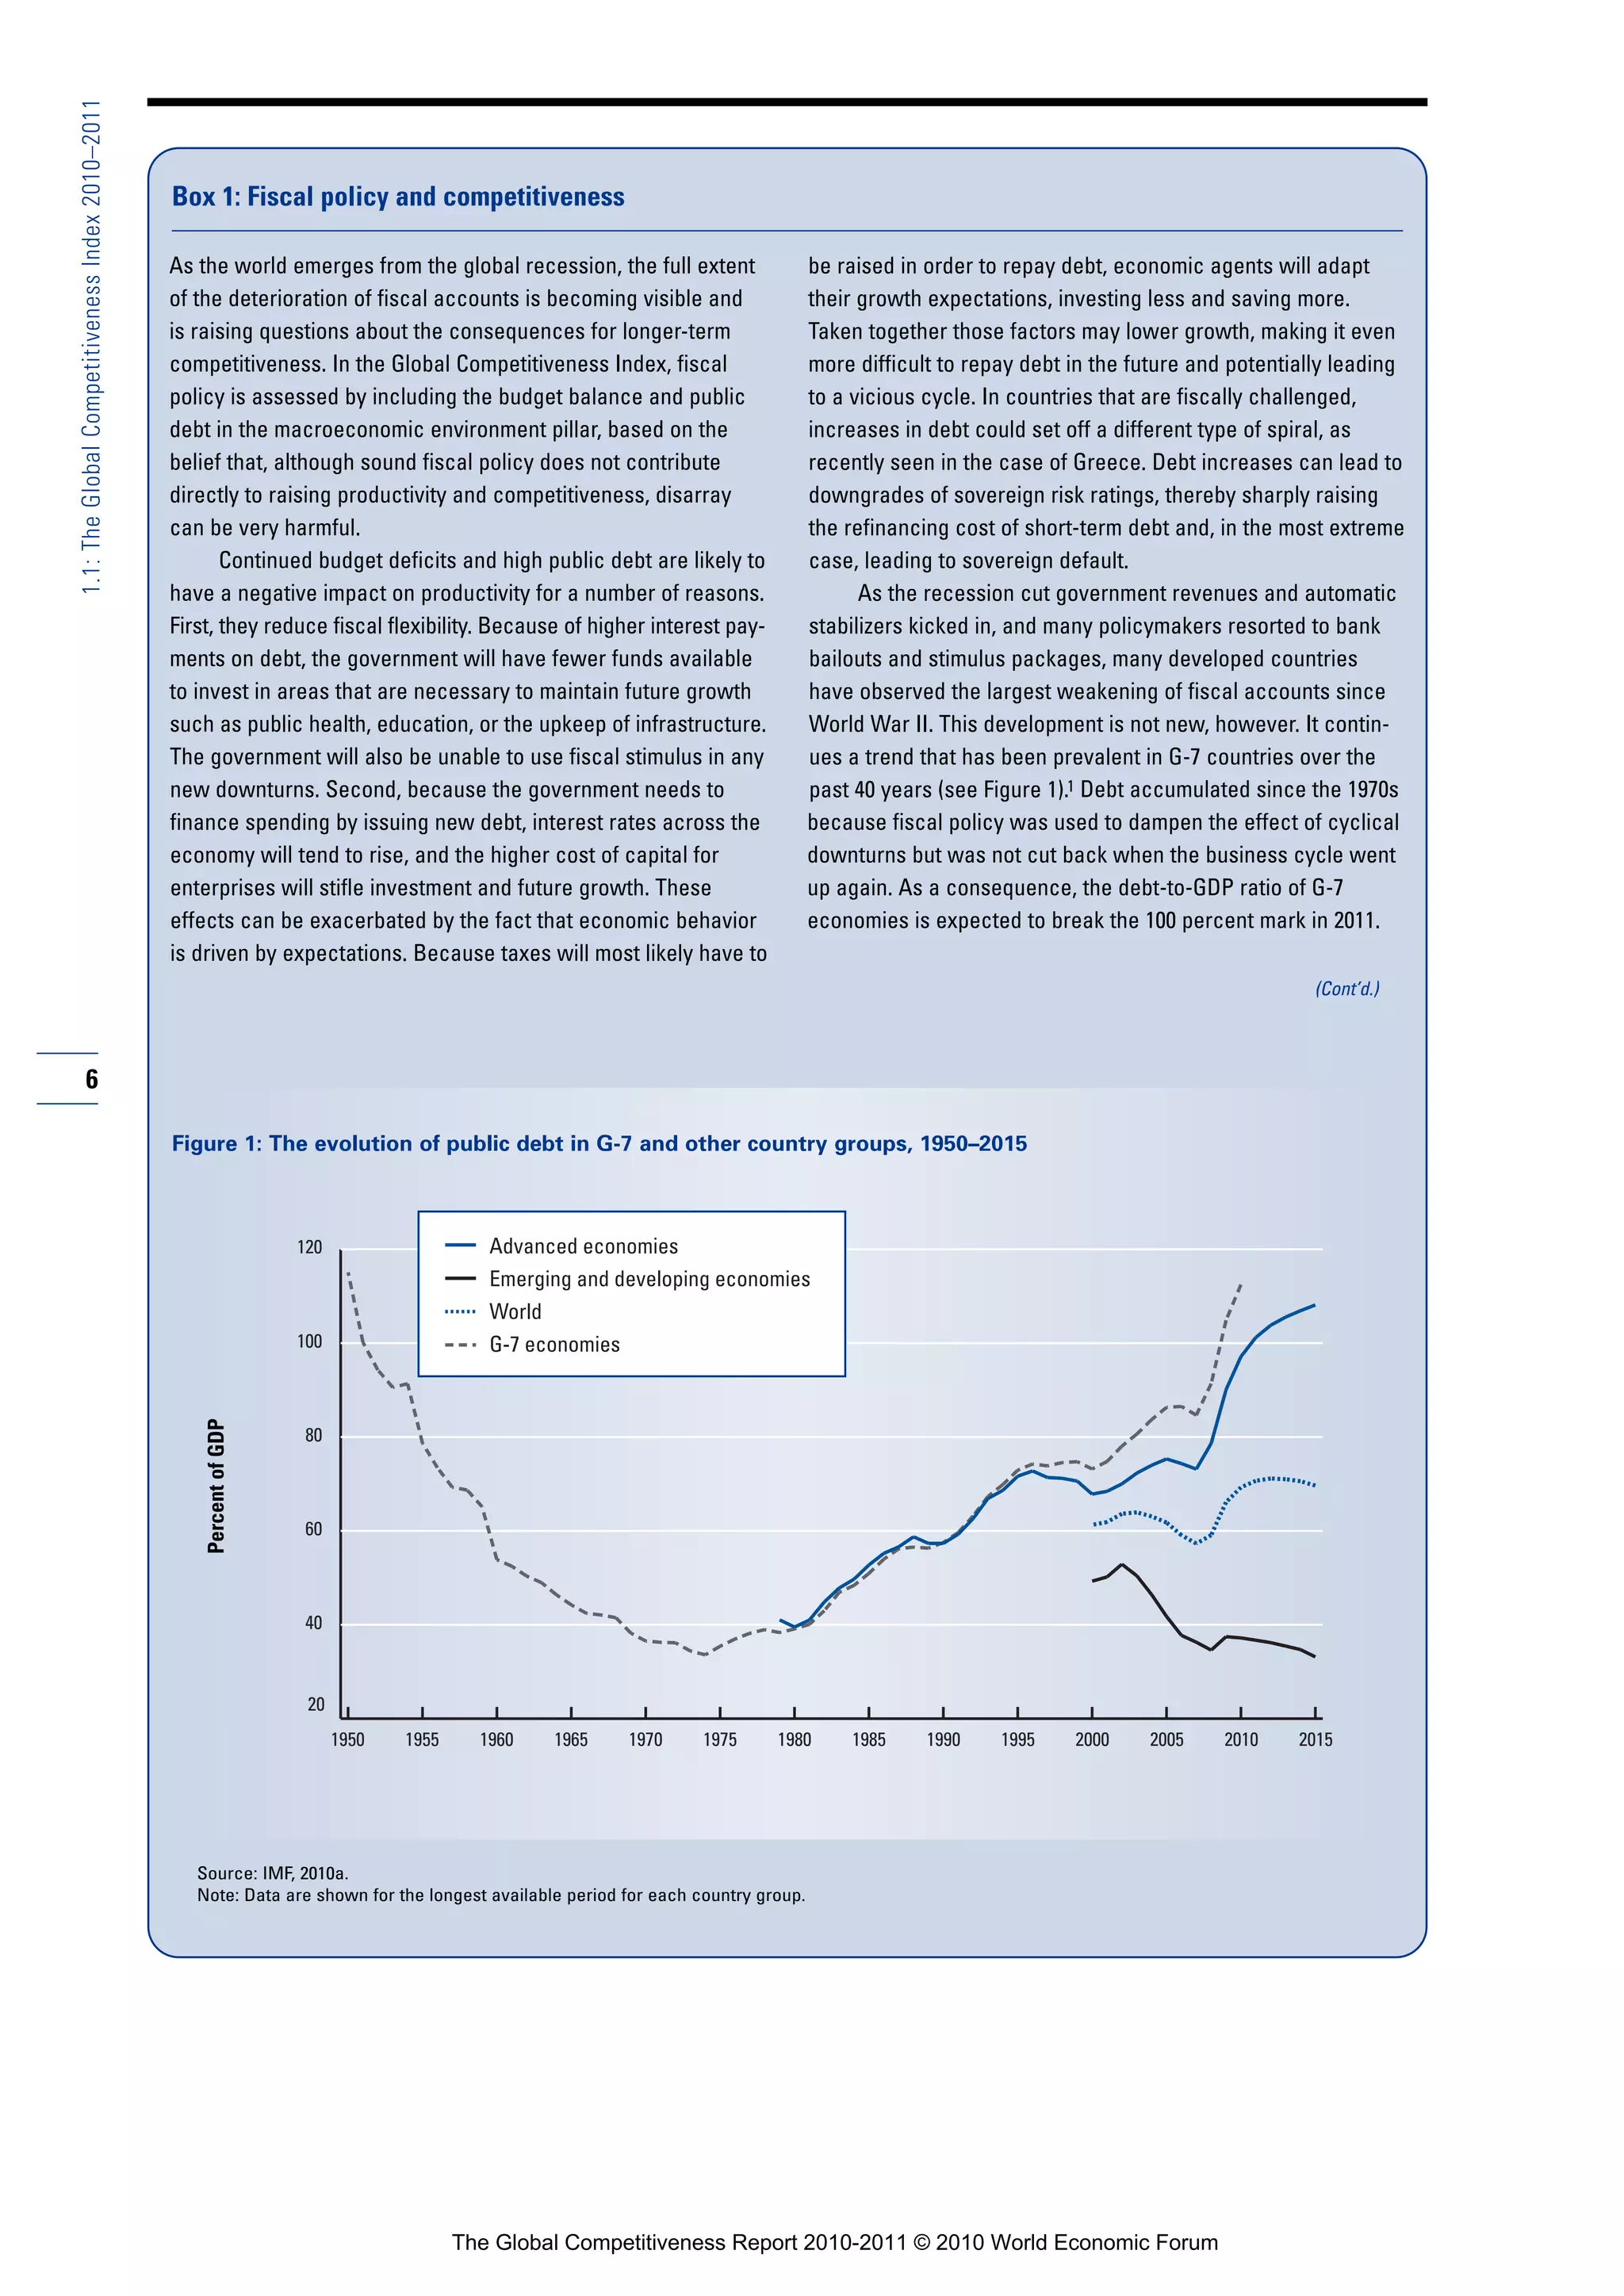
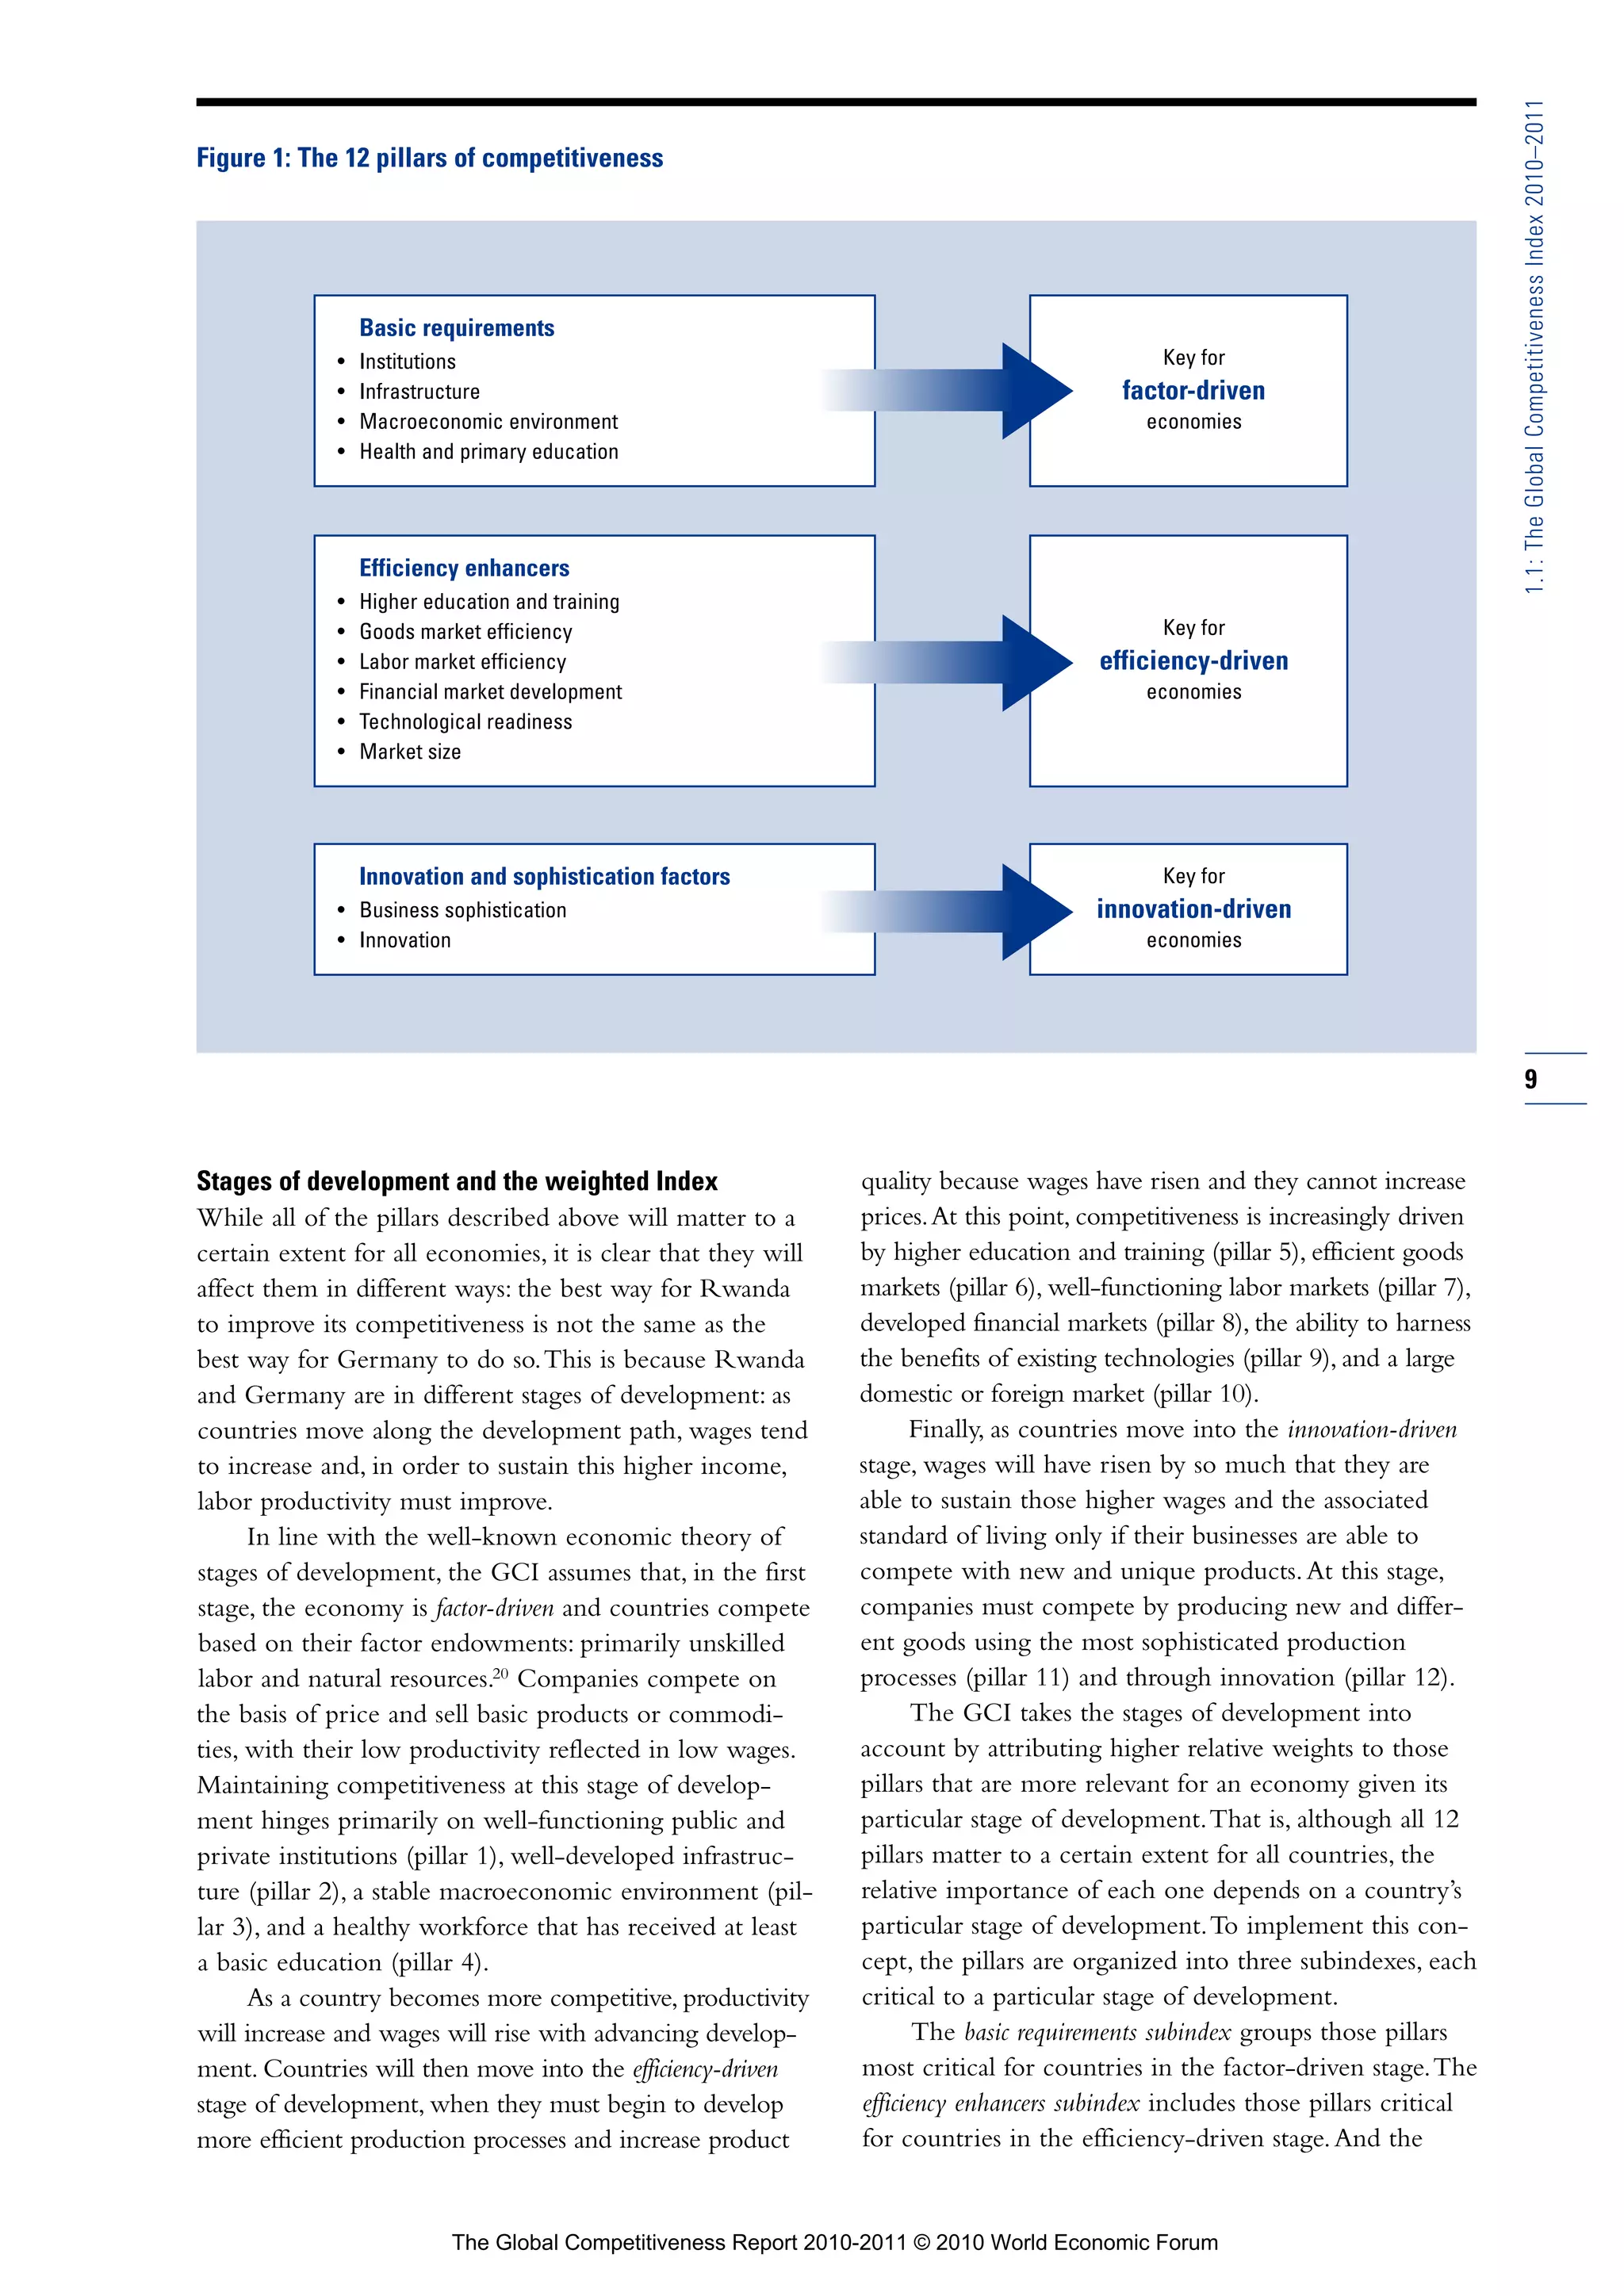
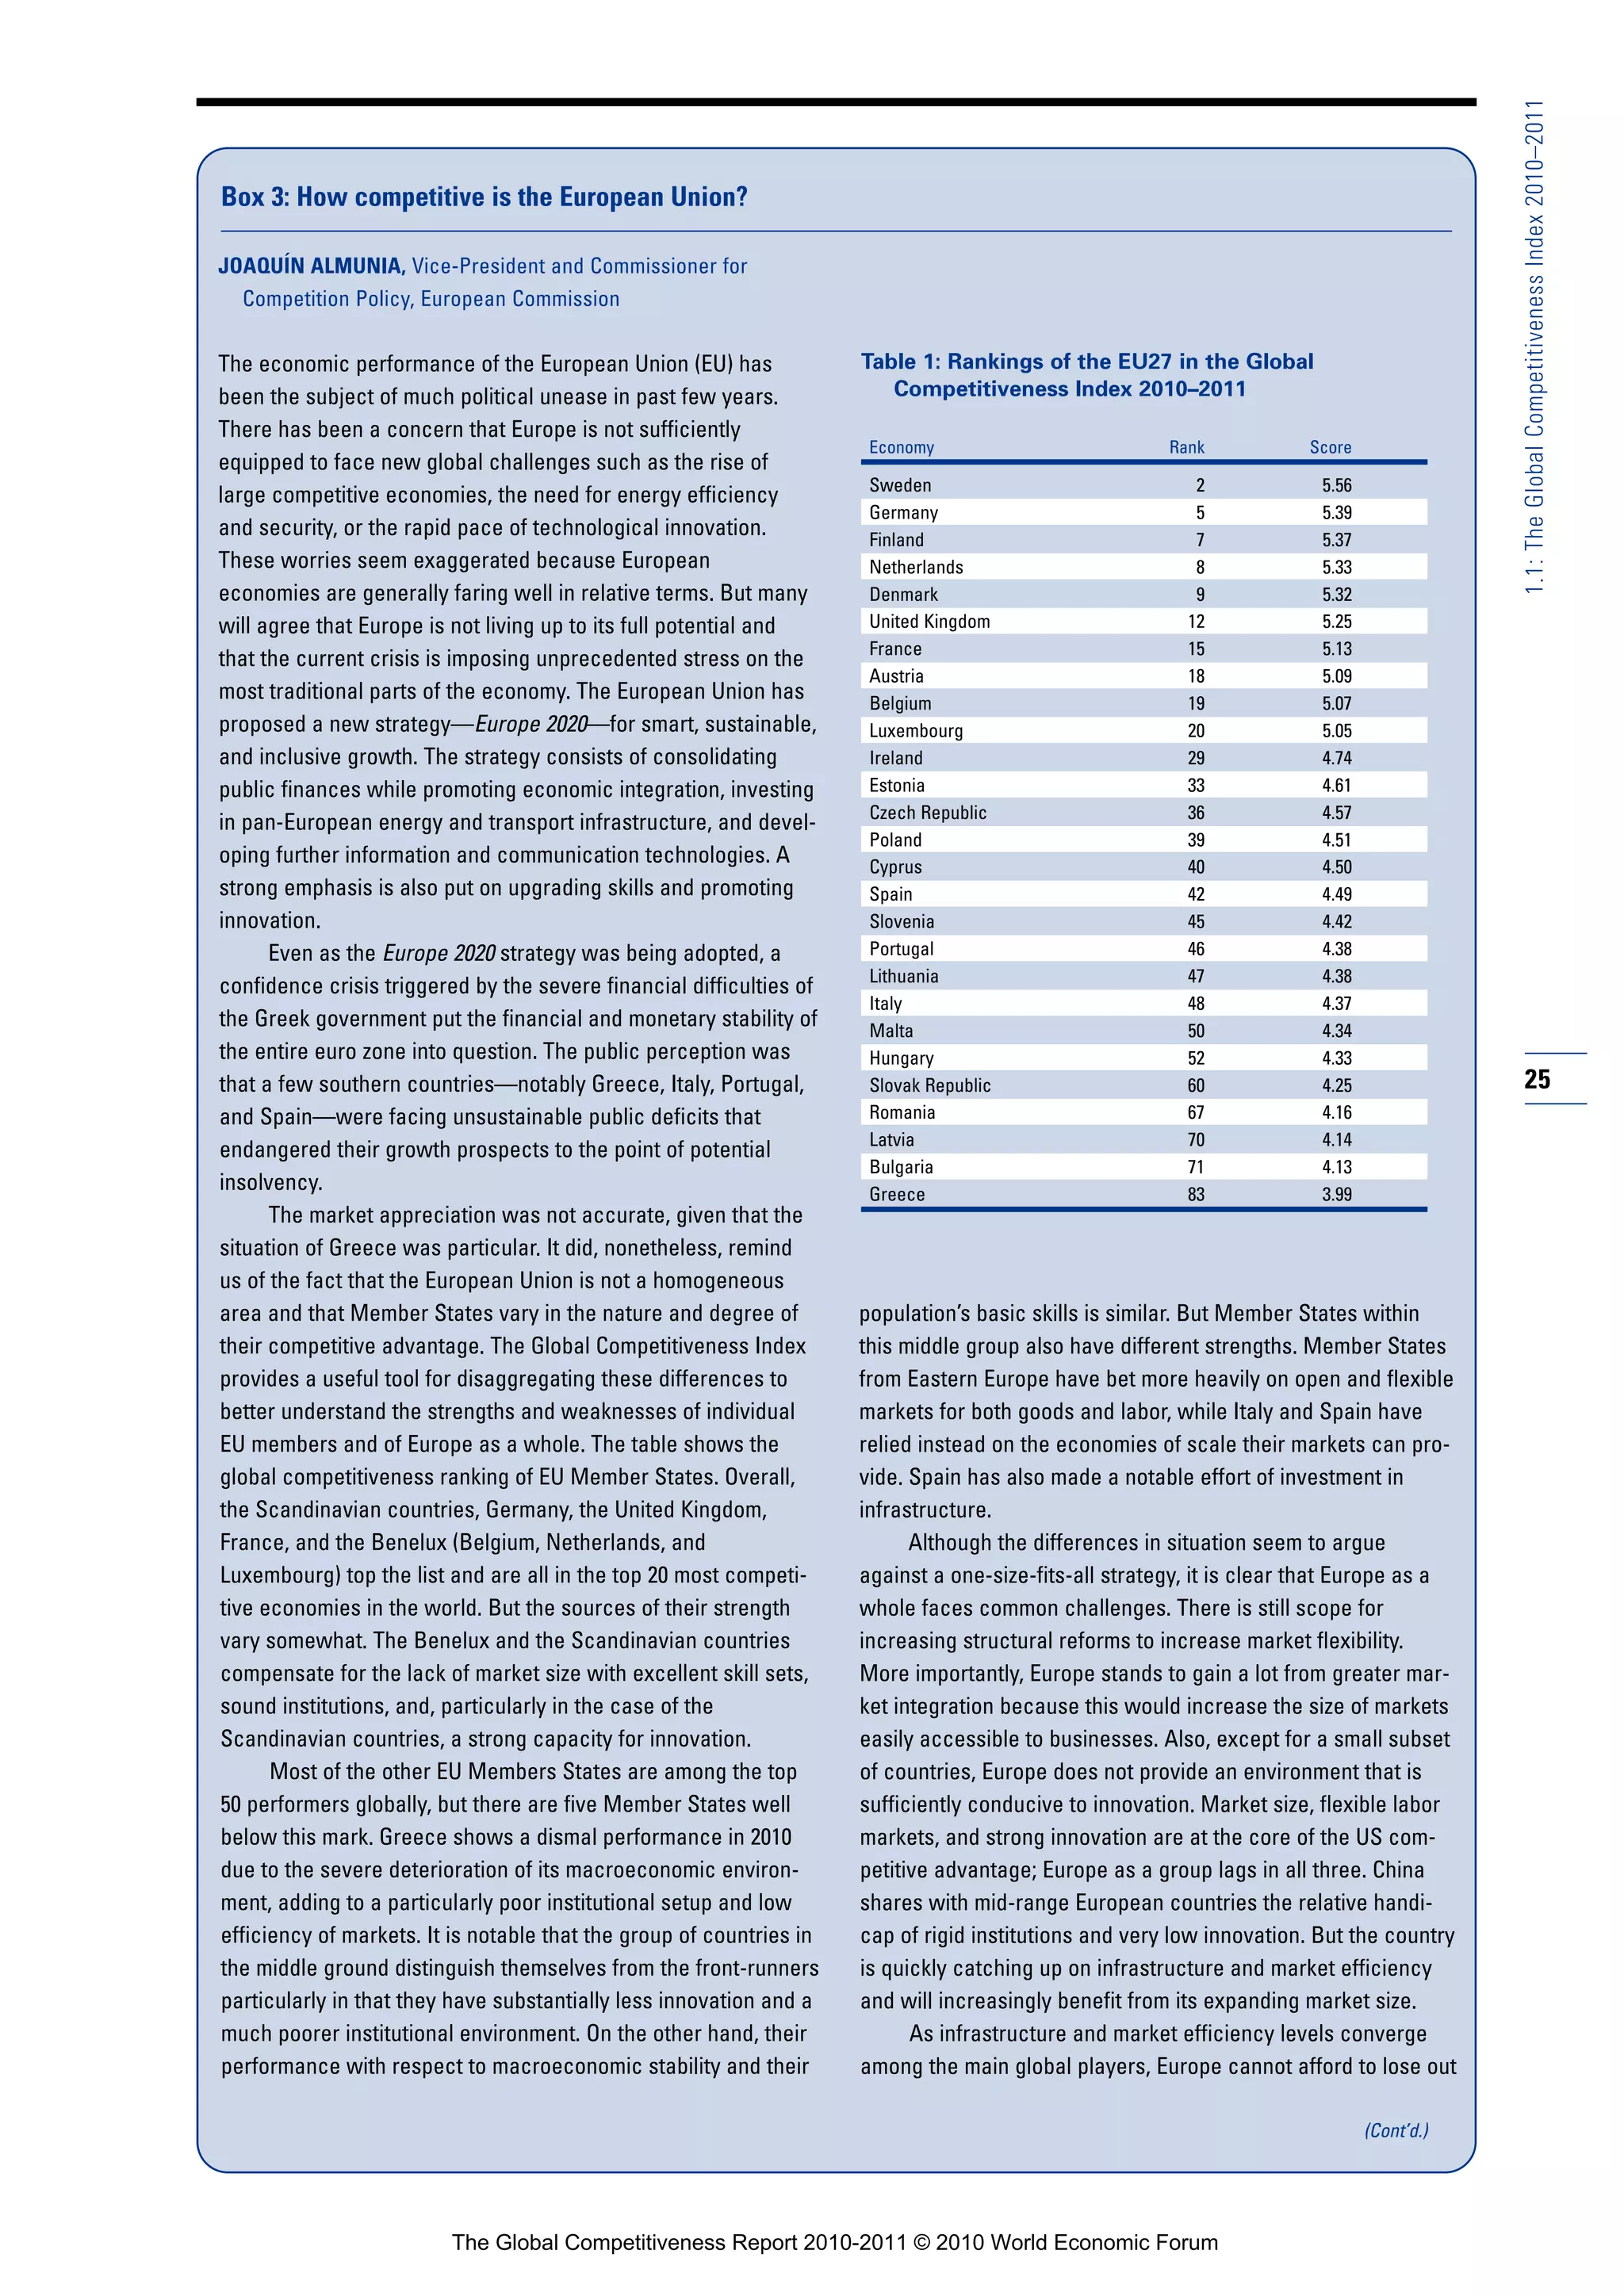
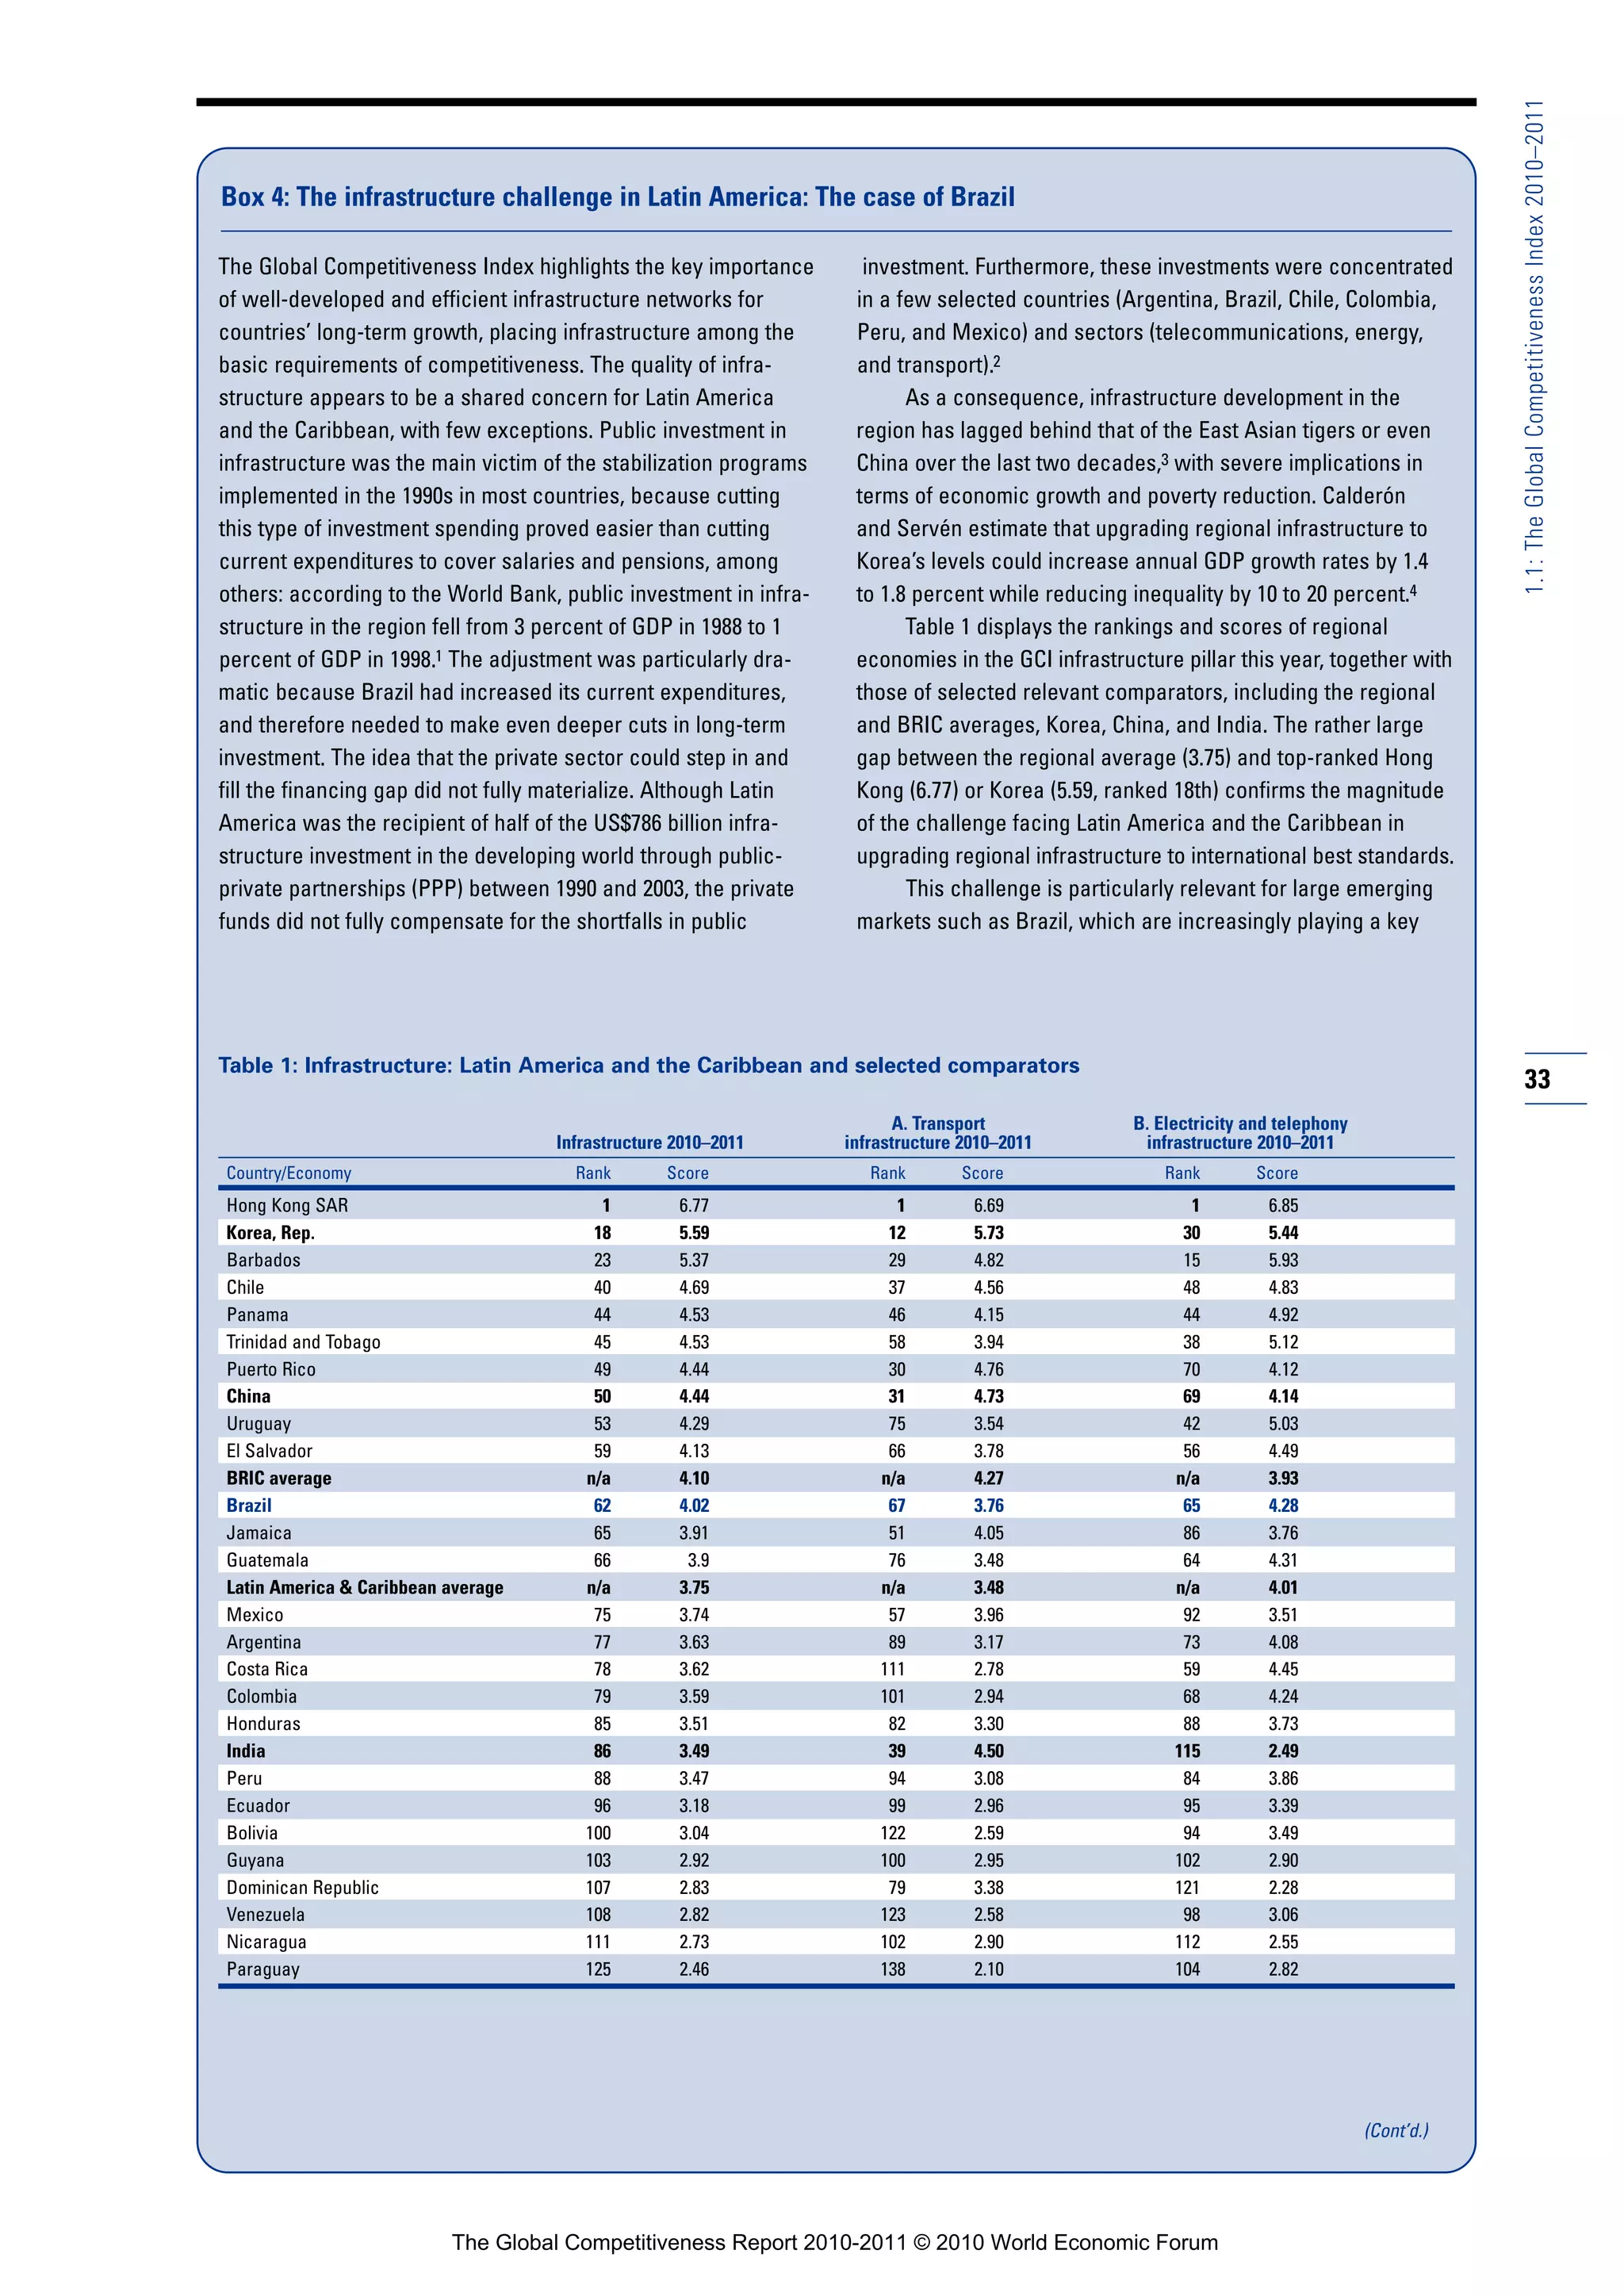
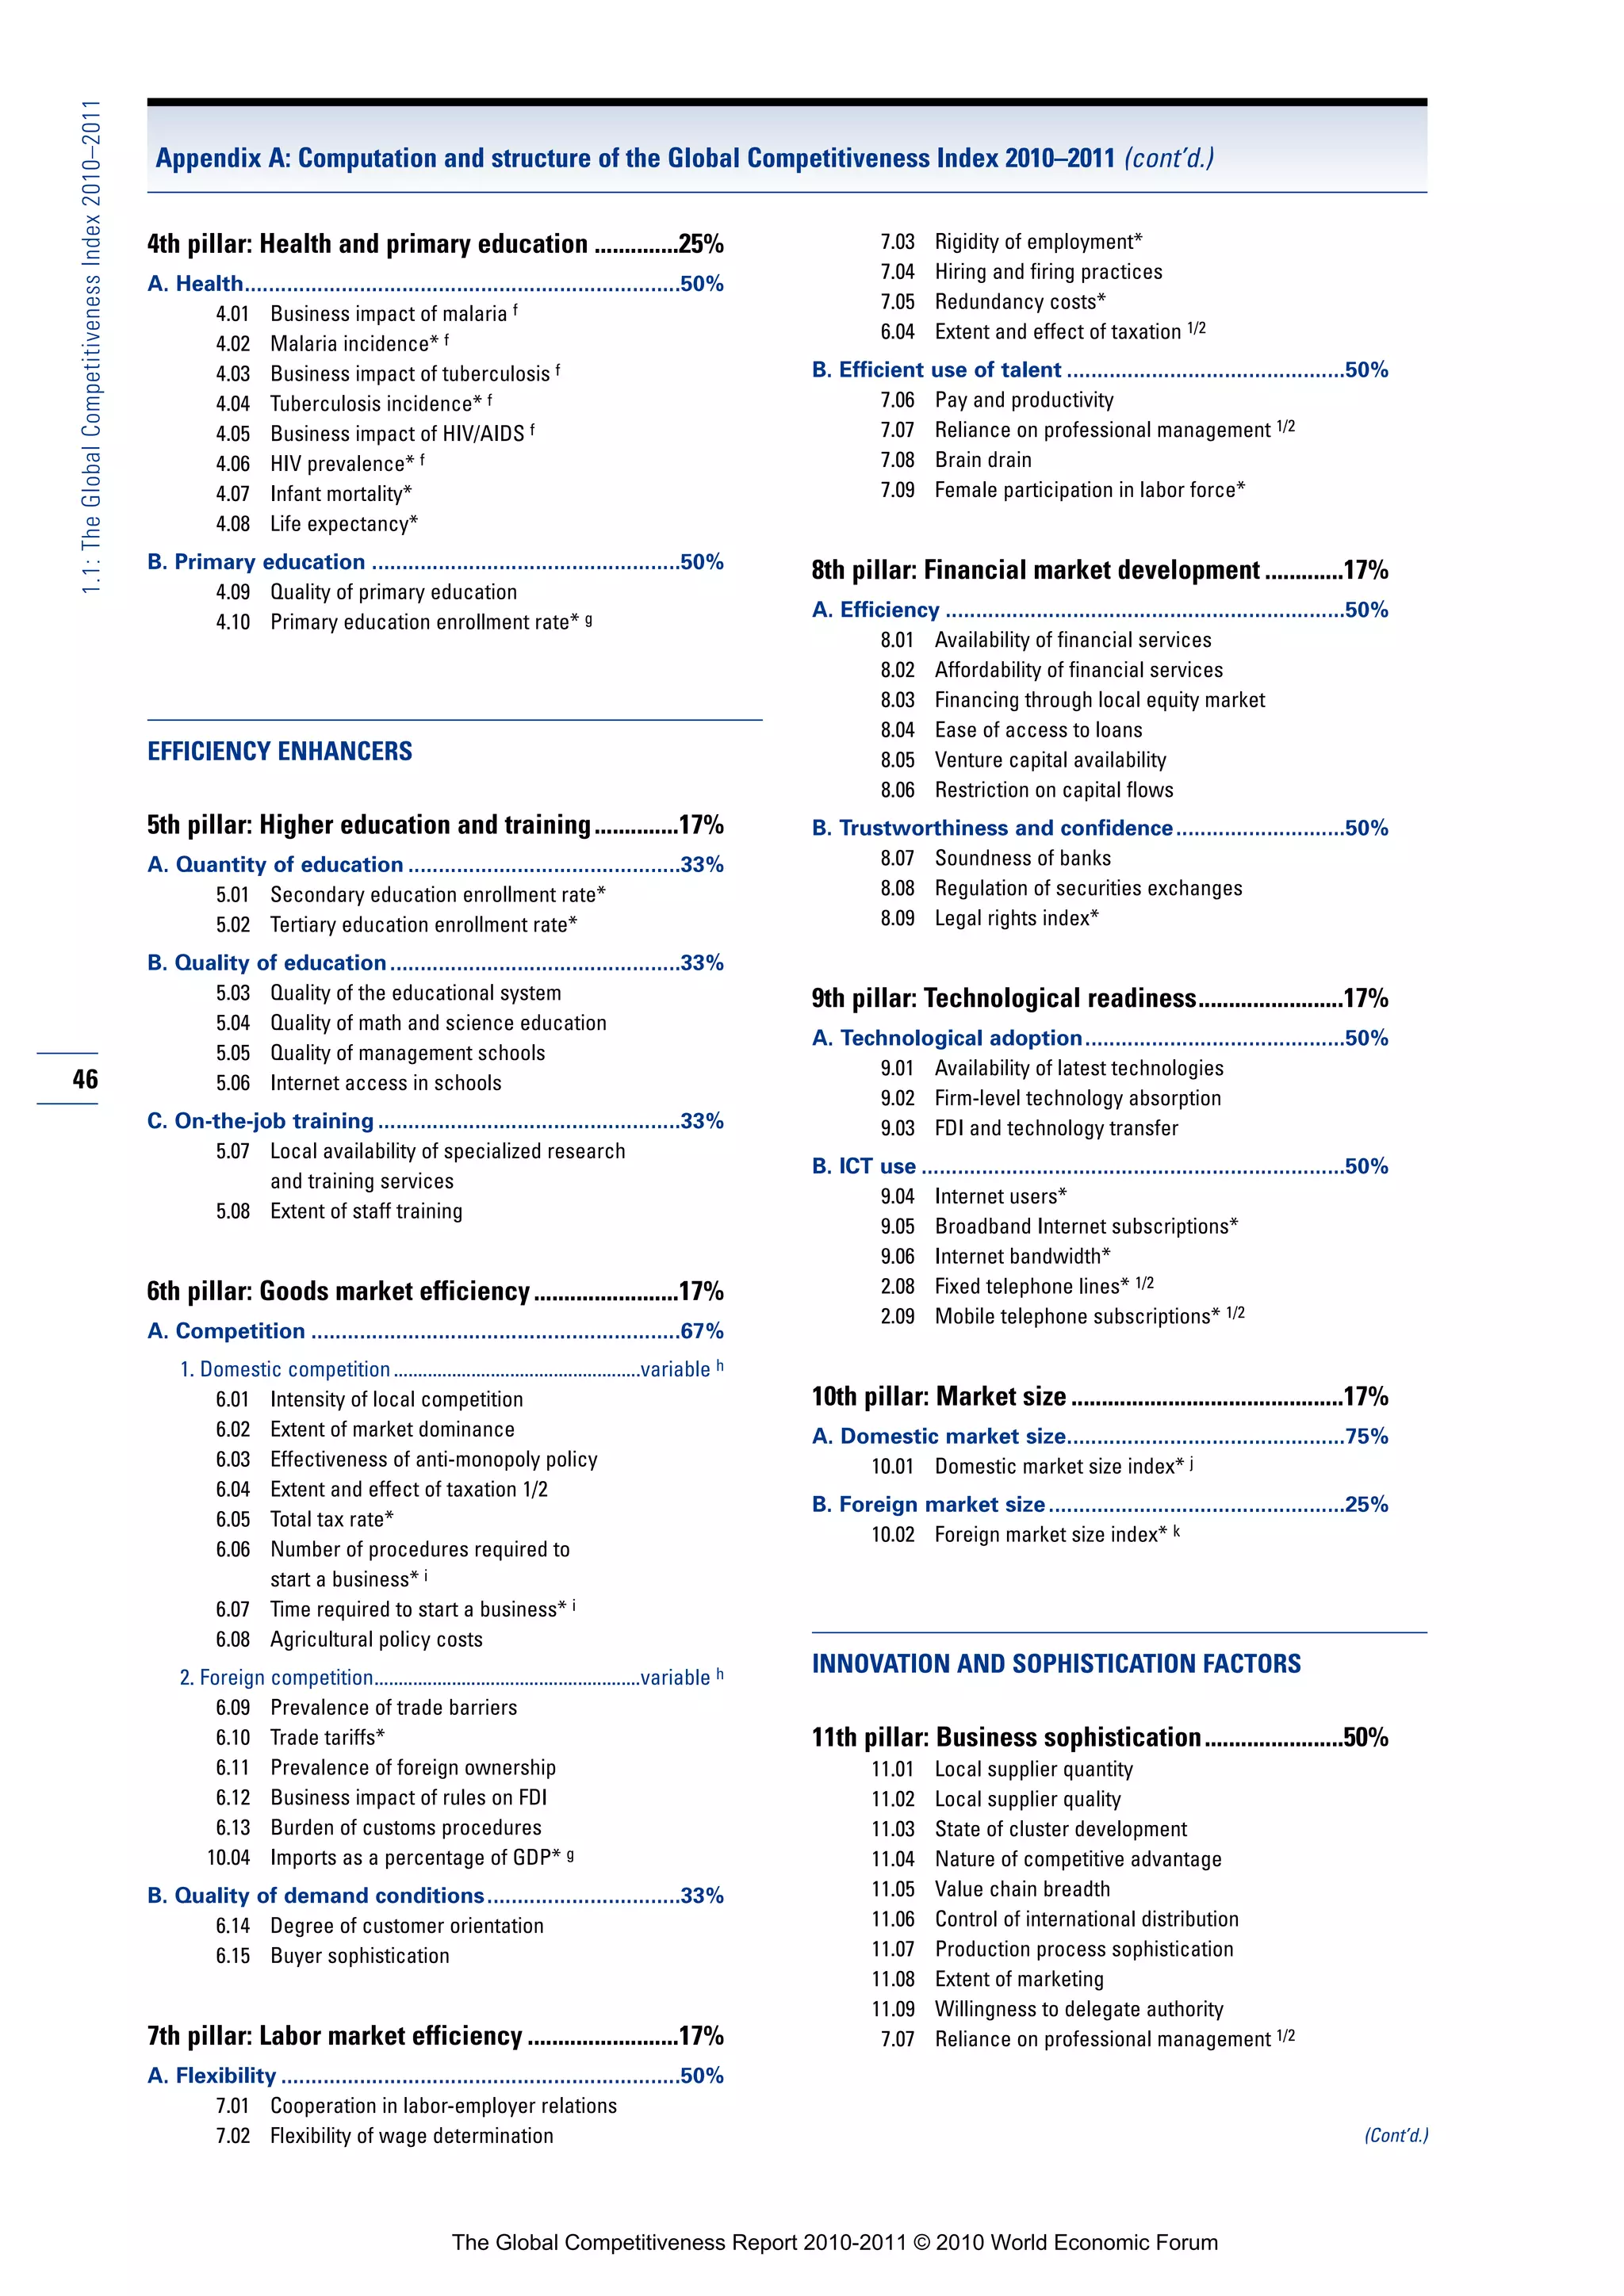
Box 2: Testing the robustness of the Global Competitiveness Index
MICHELA NARDO and PAOLA ANNONI,
European Commission Joint Research Centre
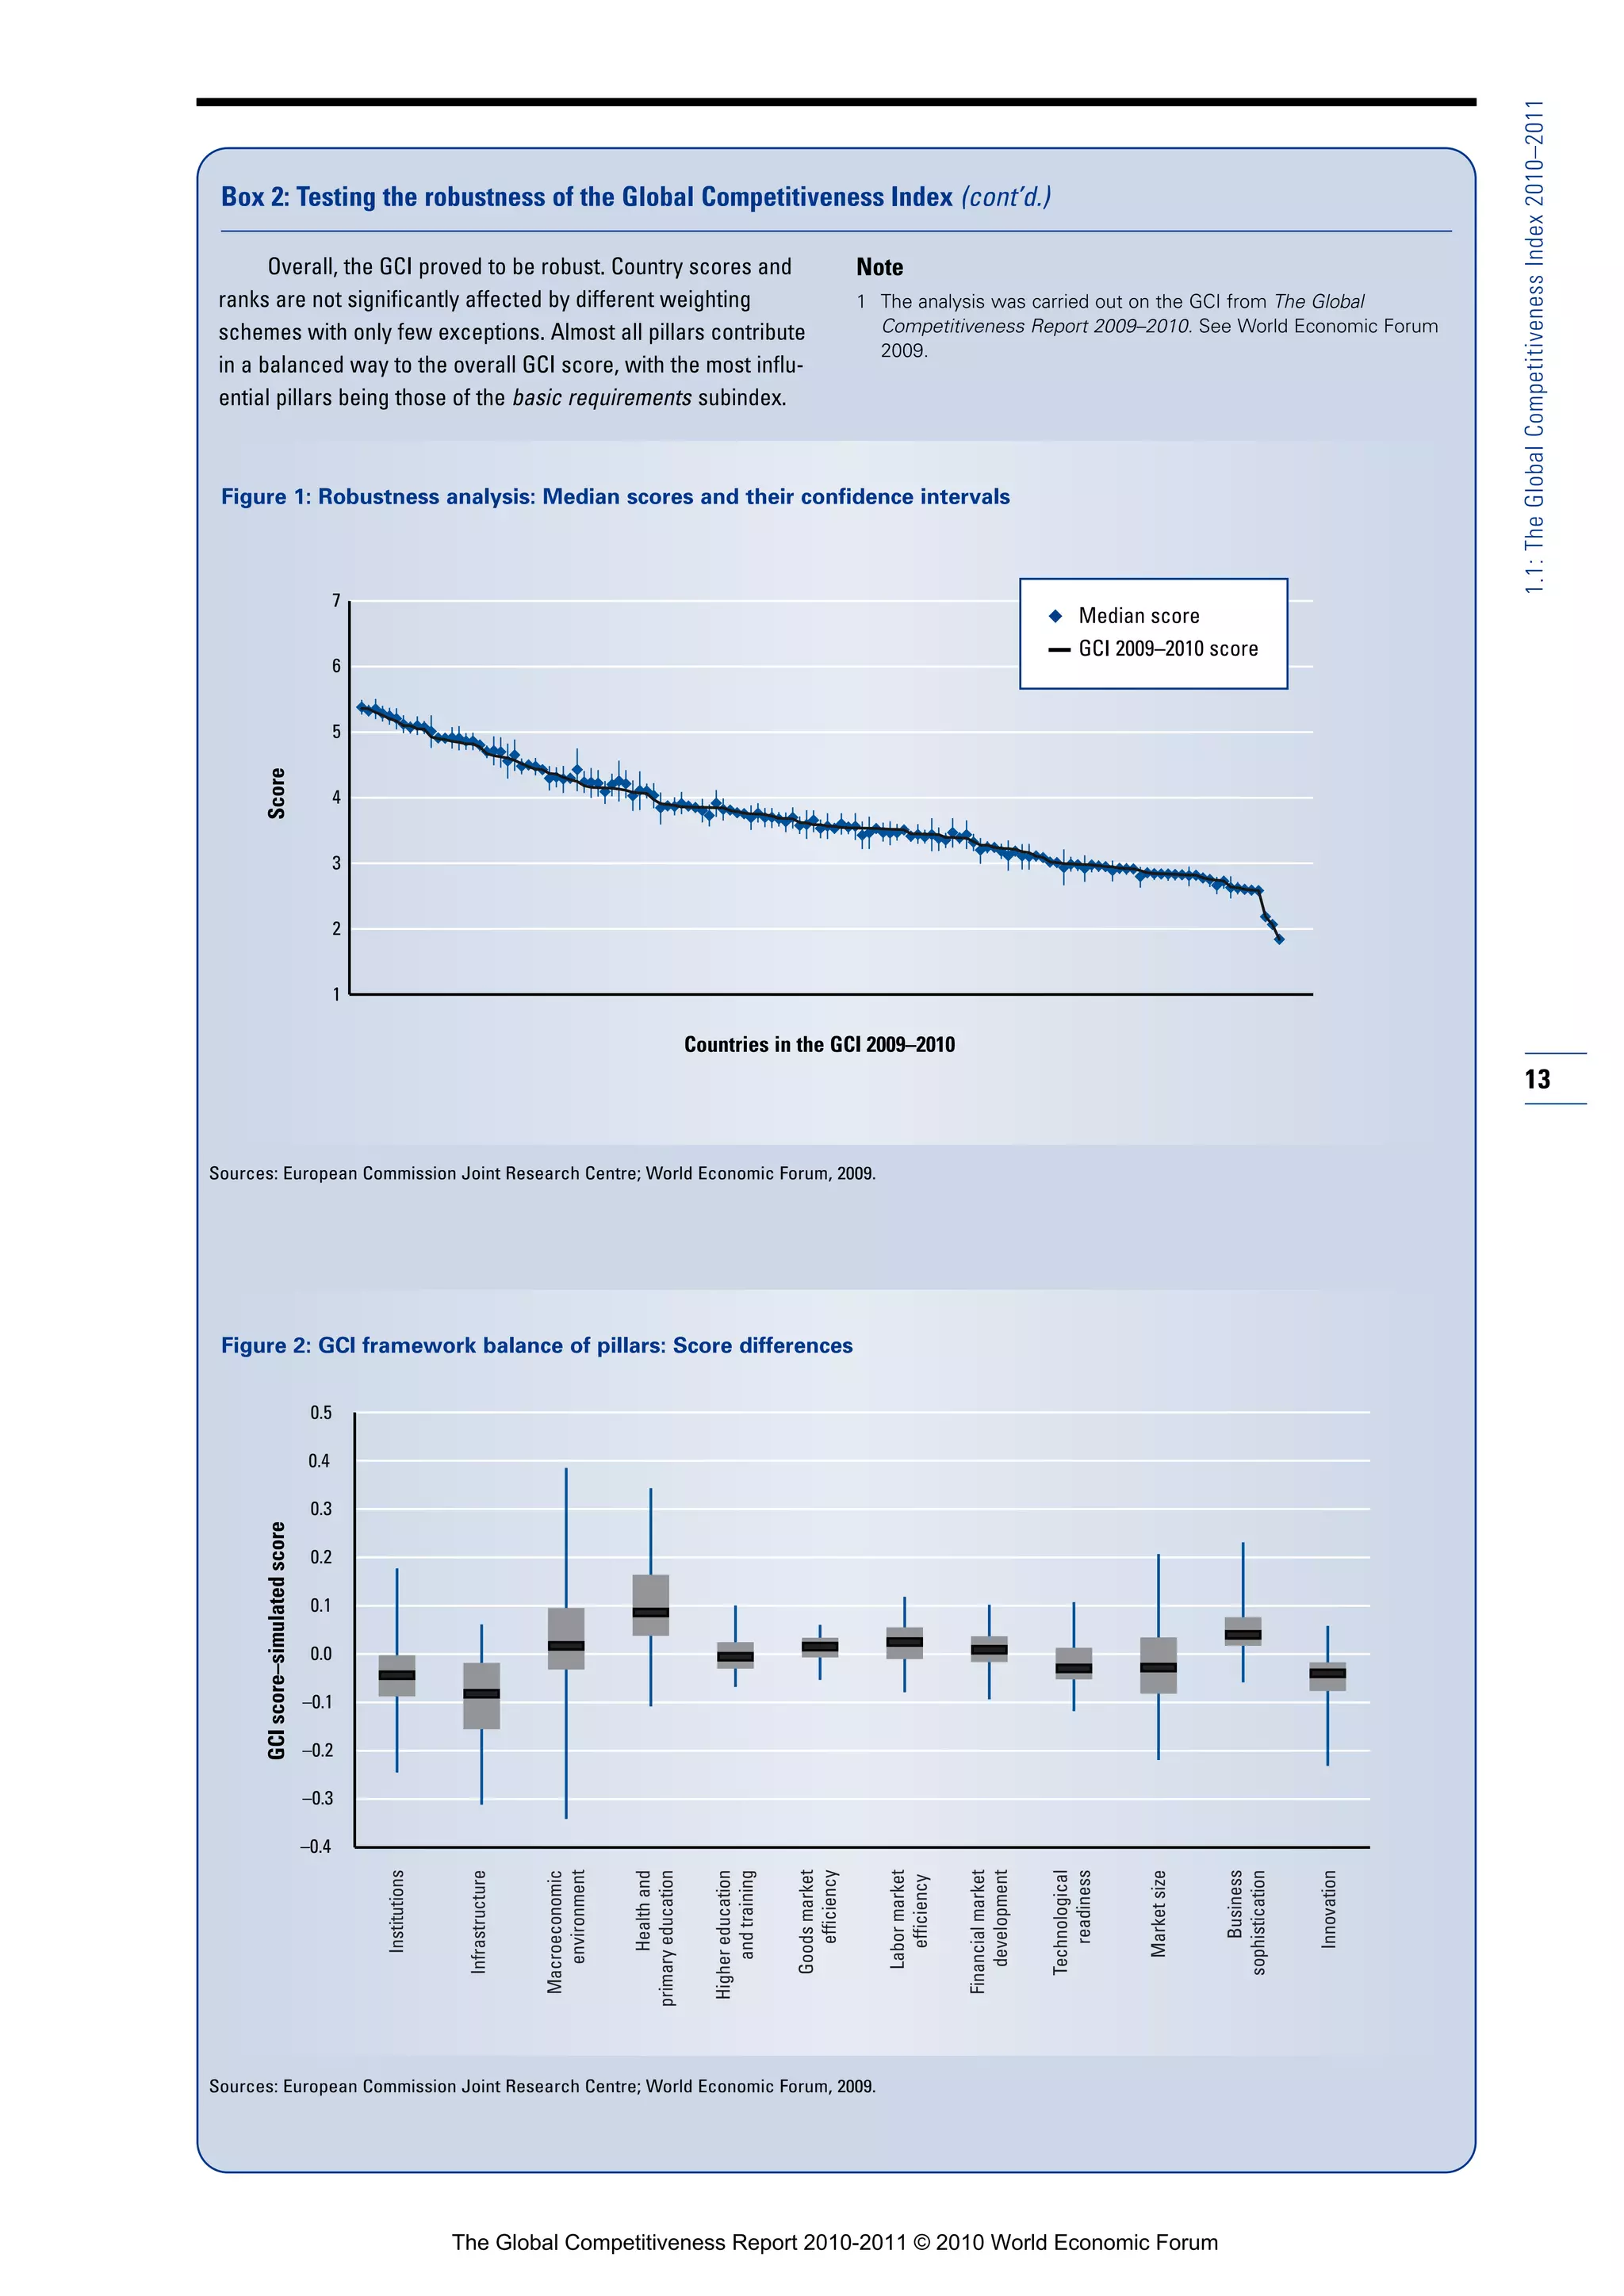
Analyzing the robustness of the Global Competitiveness Index Table 1: Uncertainty intervals of GCI weights
(GCI) and identifying how a country’s performance improves or
Distribution
deteriorates under certain assumptions are necessary steps Stage of Reference assigned for the
development Weight value robustness analysis
for ensuring the transparency and reliability of the Index and
putting the results into a contextual framework. Every model Stage 1: Factor-driven w11 0.6 U[0.4,0.8]
depends on a set of assumptions. Changing these assumptions w12 0.35 U[0.2,0.5]
is likely to affect the inferences drawn from the model. w13 0.05 U[0.0,0.1]
Robustness analysis assesses the major drivers of uncertainty Stage 2: Efficiency-driven w21 0.4 U[0.2,0.6]
in model predictions, enabling policymakers to derive more w22 0.5 U[0.3,0.7]
accurate and meaningful conclusions. The Unit of Econometrics w23 0.1 U[0.05,0.3]
and Applied Statistics at the European Commission Joint Stage 3: Innovation-driven w31 0.2 U[0.1,0.4]
Research Centre has longstanding experience in construc- w32 0.5 U[0.3,0.7]
ting and testing composite indicators. Together with the w33 0.3 U[0.1,0.4]
Organisation for Economic Co-operation and Development Sources: European Commission Joint Research Centre; World Economic
(OECD), the Unit developed the Handbook on Constructing Forum, 2009.
Composite Indicators: Methodology and User Guide, which
has become the international reference in the field. The main outcome of the robustness analysis is shown in
The robustness analysis performed for the GCI challenges Figure 1 with median scores and 90 percent confidence intervals
some of its key assumptions: the differentiated weighting computed across the 1,200 Monte Carlo simulations. Countries
scheme adjusted to the countries’ development stage and the are ordered from best to worst according to their GCI reference
contribution to the final score of each of the 12 pillars, often score (black line), the blue dot being the median score. Error
populated by a different number of indicators.1 bars represent, for each country, the 90 percent confidence
12 interval. GCI scores are rather robust: the median score is
always close to the reference score. For only 7 countries out of
The robustness of the GCI with respect to its 133 is the width of confidence interval slightly higher than 10
weighting scheme percent of the GCI reference value—these are Algeria, Bahrain,
As described in the main text of this chapter, the final GCI Brunei Darussalam, Namibia, Oman, Suriname, and Syria.
scores are computed as a weighted average of three subindex- Relatively higher volatility (longer error bars) is present in the
es, which describe basic requirements, efficiency enhancers, middle part of the graph, where the black line of the reference
and innovation and sophistication factors as follows: score is less steep, meaning that higher volatility is associated
with countries with similar scores. More on the robustness
GCIij = wj1Basici + wj2Effciencyi analysis of the weighting scheme is discussed in Appendix B.
+ (1 − wj1 − wj2)Innovation
where i is the country index and j is the country development Evaluating each pillar's contribution to the final
stage. The robustness of the GCI weighting scheme is tested score
by randomly sampling the set of weights wjk, where k = 1,2,3 Is the GCI framework well balanced across the 12 different
from uniform continuous distributions centered in the corre- dimensions that define country competitiveness? This is tested
sponding GCI reference value (see Table 1 in the main text of by assigning a zero weight to one pillar at a time and comparing
this chapter). The Monte Carlo simulation comprises 1,200 runs, the resulting score with the GCI values. The main results are
each corresponding to a different set of weights of the three shown in Figure 2. The black line is the median across all coun-
subindexes. For technical reasons, only the three major devel- tries and the boxes include 75 percent of the cases. The whole
opment stages (stages 1, 2, and 3) are considered for the distribution of the score differences is displayed by the vertical
robustness analysis. Countries in transition are assigned to the blue lines. A median close to zero with a small box and a short
nearest development stage. The range of variation of the set of blue line indicates a pillar whose exclusion does not affect the
weights takes into account this simplification by overlapping final score in a significant manner. The most influential pillars
uncertainty intervals (see Table 1). The choice of the range of are institutions, infrastructure, macroeconomic environment,
variation has been driven by two opposite needs: on the one health and primary education, and market size. All but the last
hand, the need to ensure a wide enough interval to have mean- belong to the basic requirements subindex. The influence is,
ingful robustness checks; on the other hand, the need to keep however, moderate in absolute terms. Looking at the shift in ranks
the rationale of the GCI weighting scheme, originally designed (see Appendix B), the maximum shift of a country is up to 5
to take into account intrinsic differences across countries. positions for 75 percent of the cases. This demonstrates that
Considering this trade-off, limit values of uncertainty intervals almost all of the 12 pillars contribute to the GCI score in a
have been defined as shown in Table 1. balanced way.
(Cont’d.)
The Global Competitiveness Report 2010-2011 © 2010 World Economic Forum](https://image.slidesharecdn.com/globalcompetitivenessreportwef2010-11-100928142139-phpapp02/75/Global-competitiveness-report-wef-2010-11-25-2048.jpg)

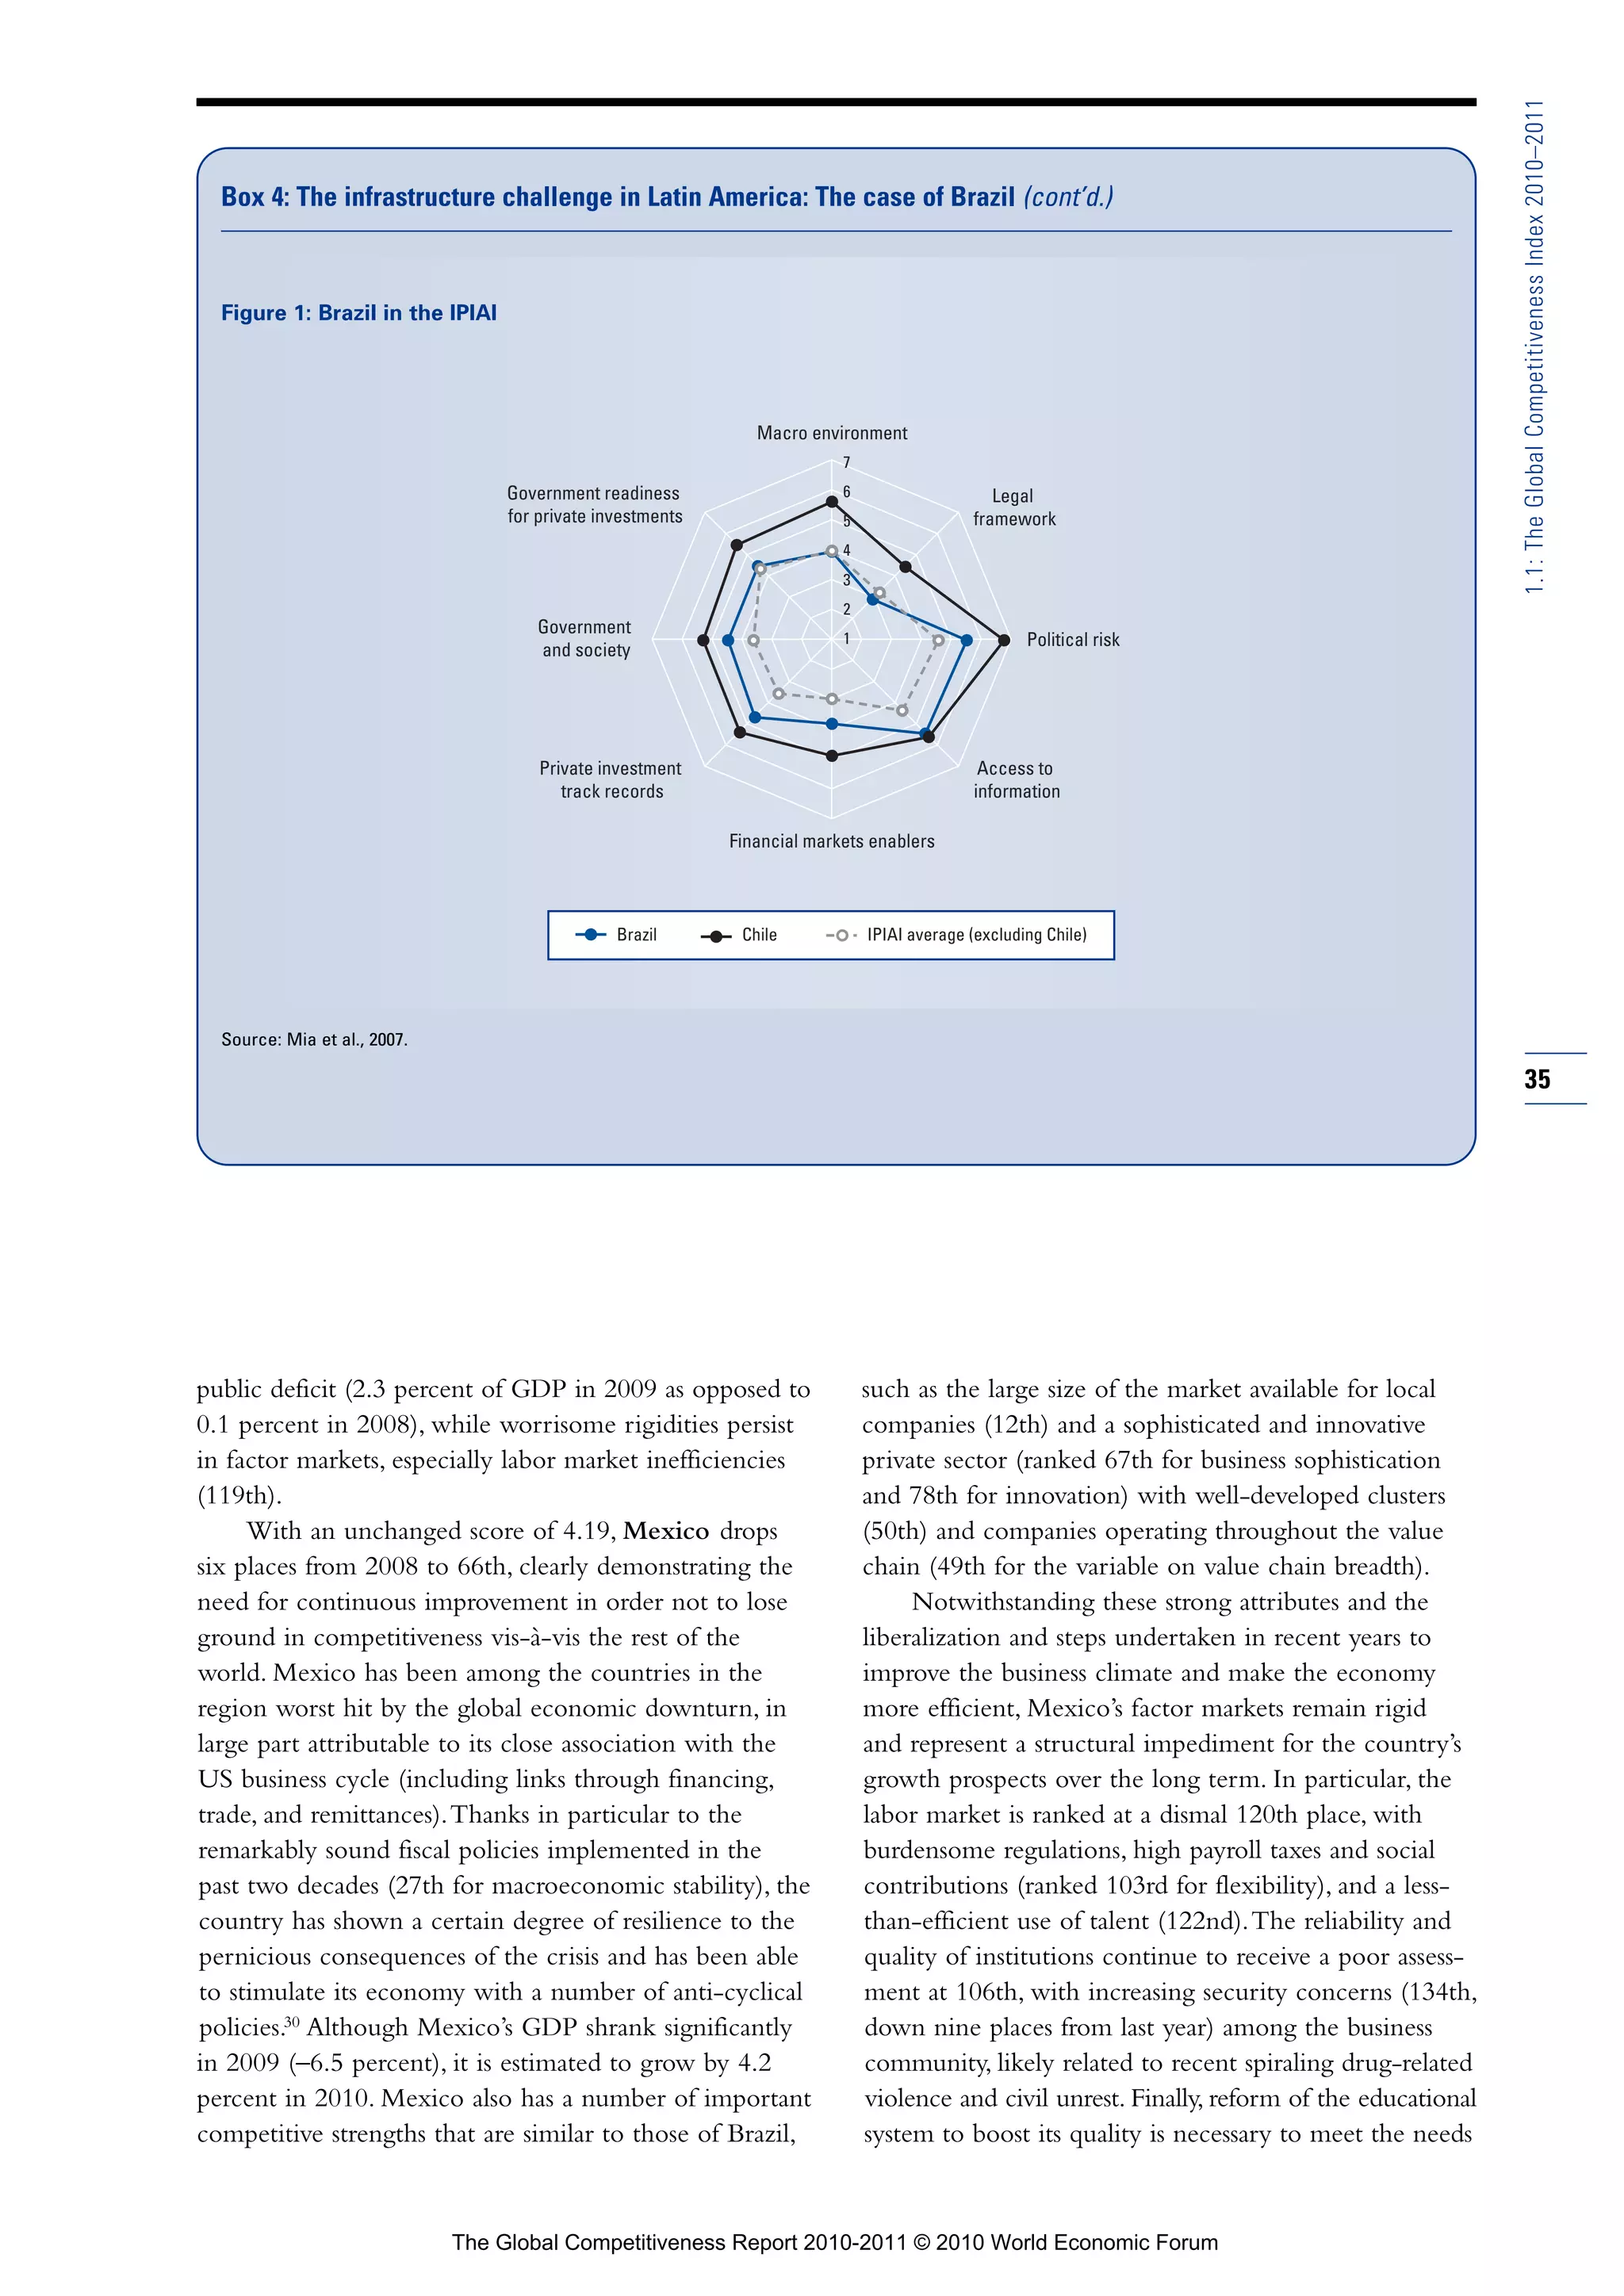
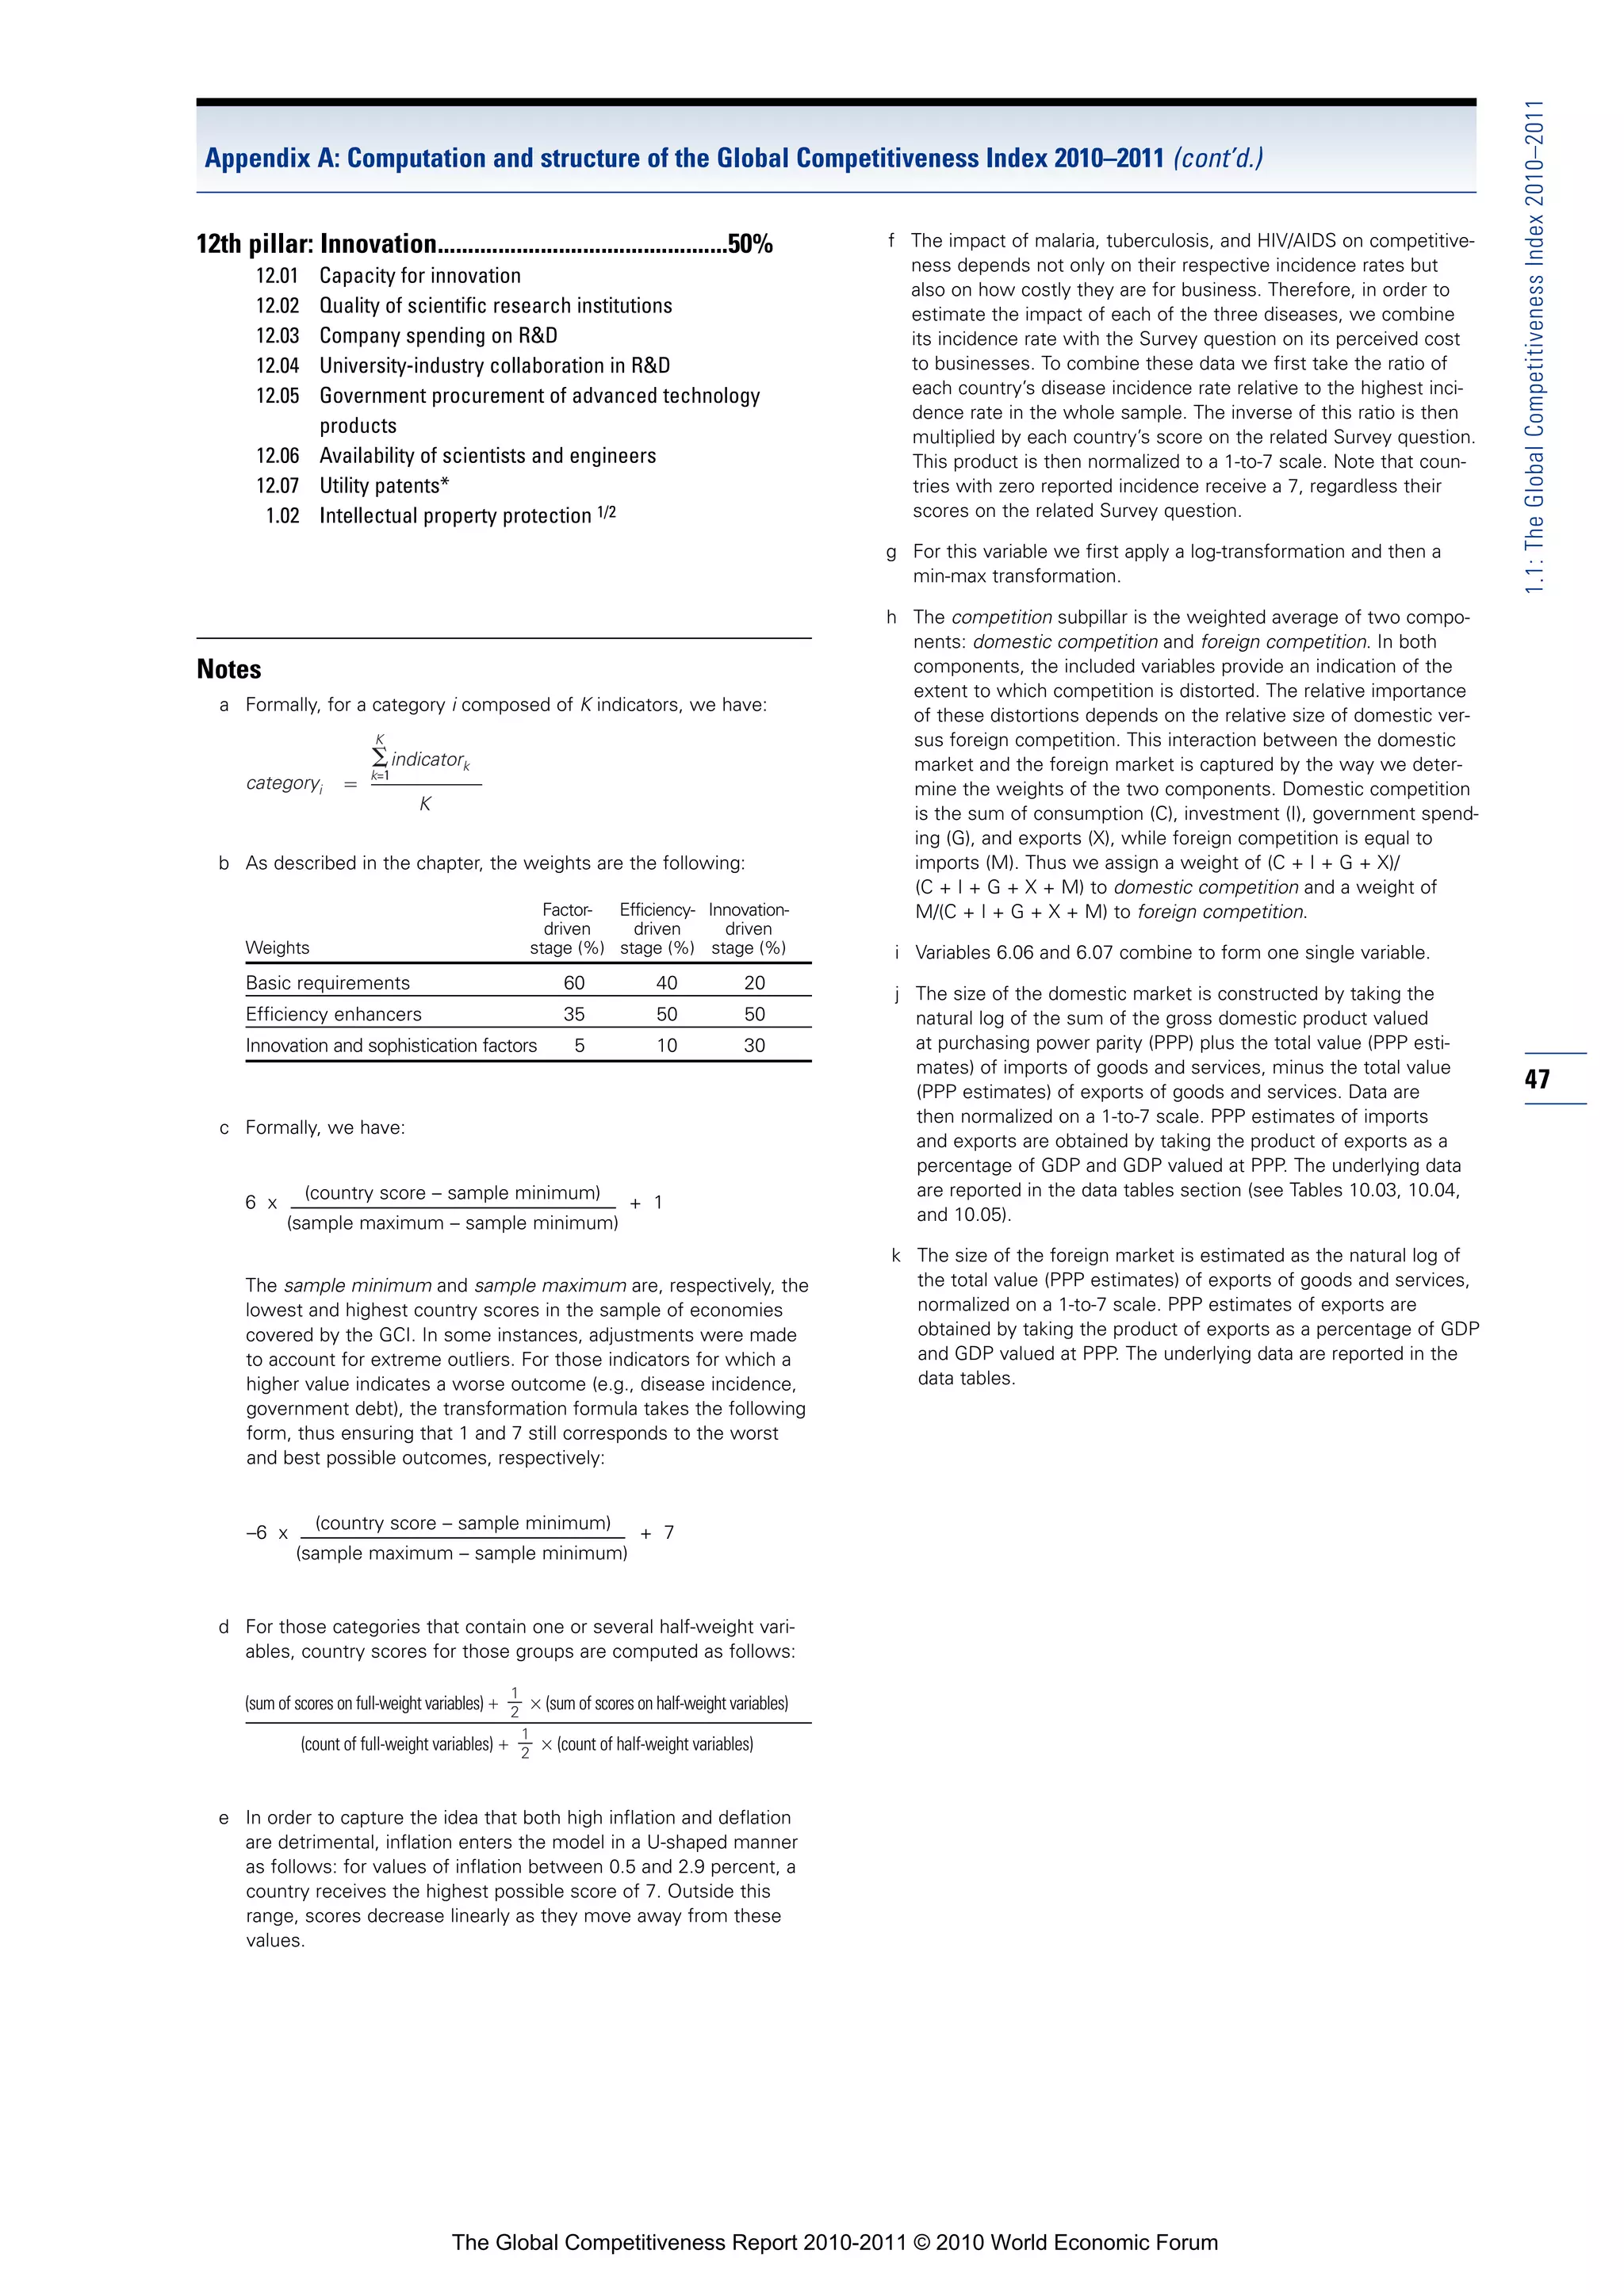

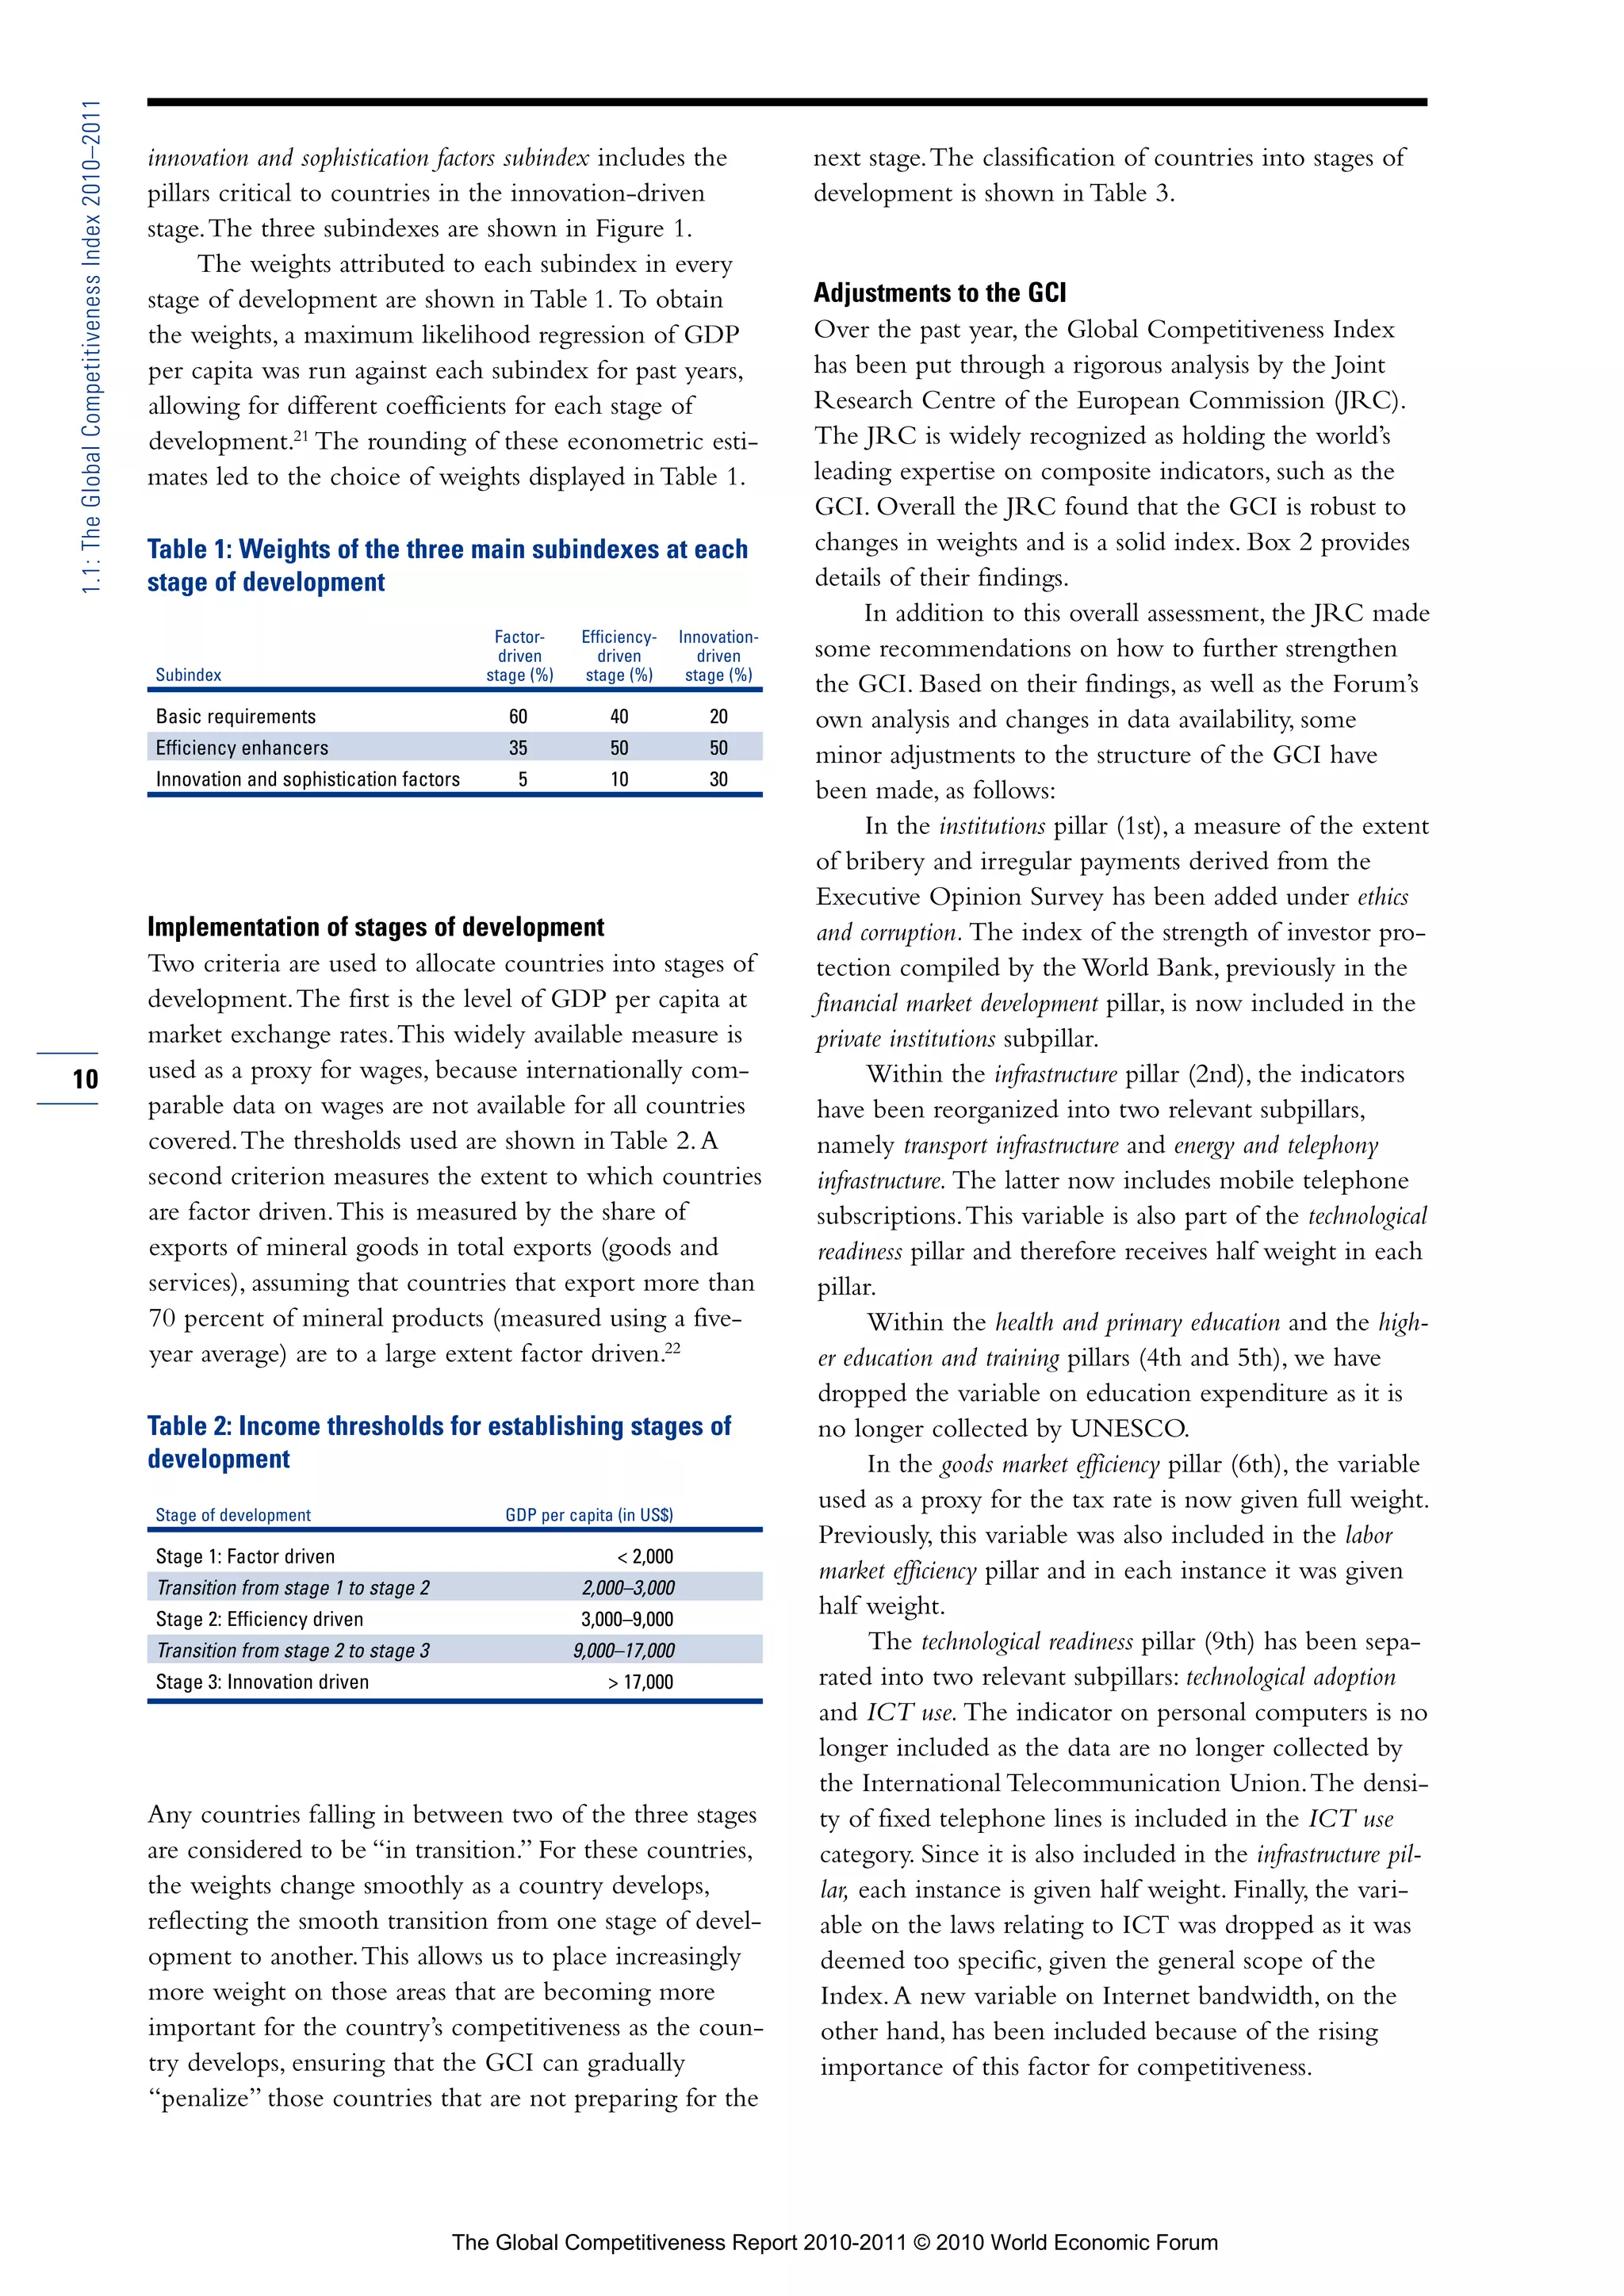
![1.1: The Global Competitiveness Index 2010–2011
Appendix B: The Joint Research Centre assessment of the Global Competitiveness Index (cont’d.)
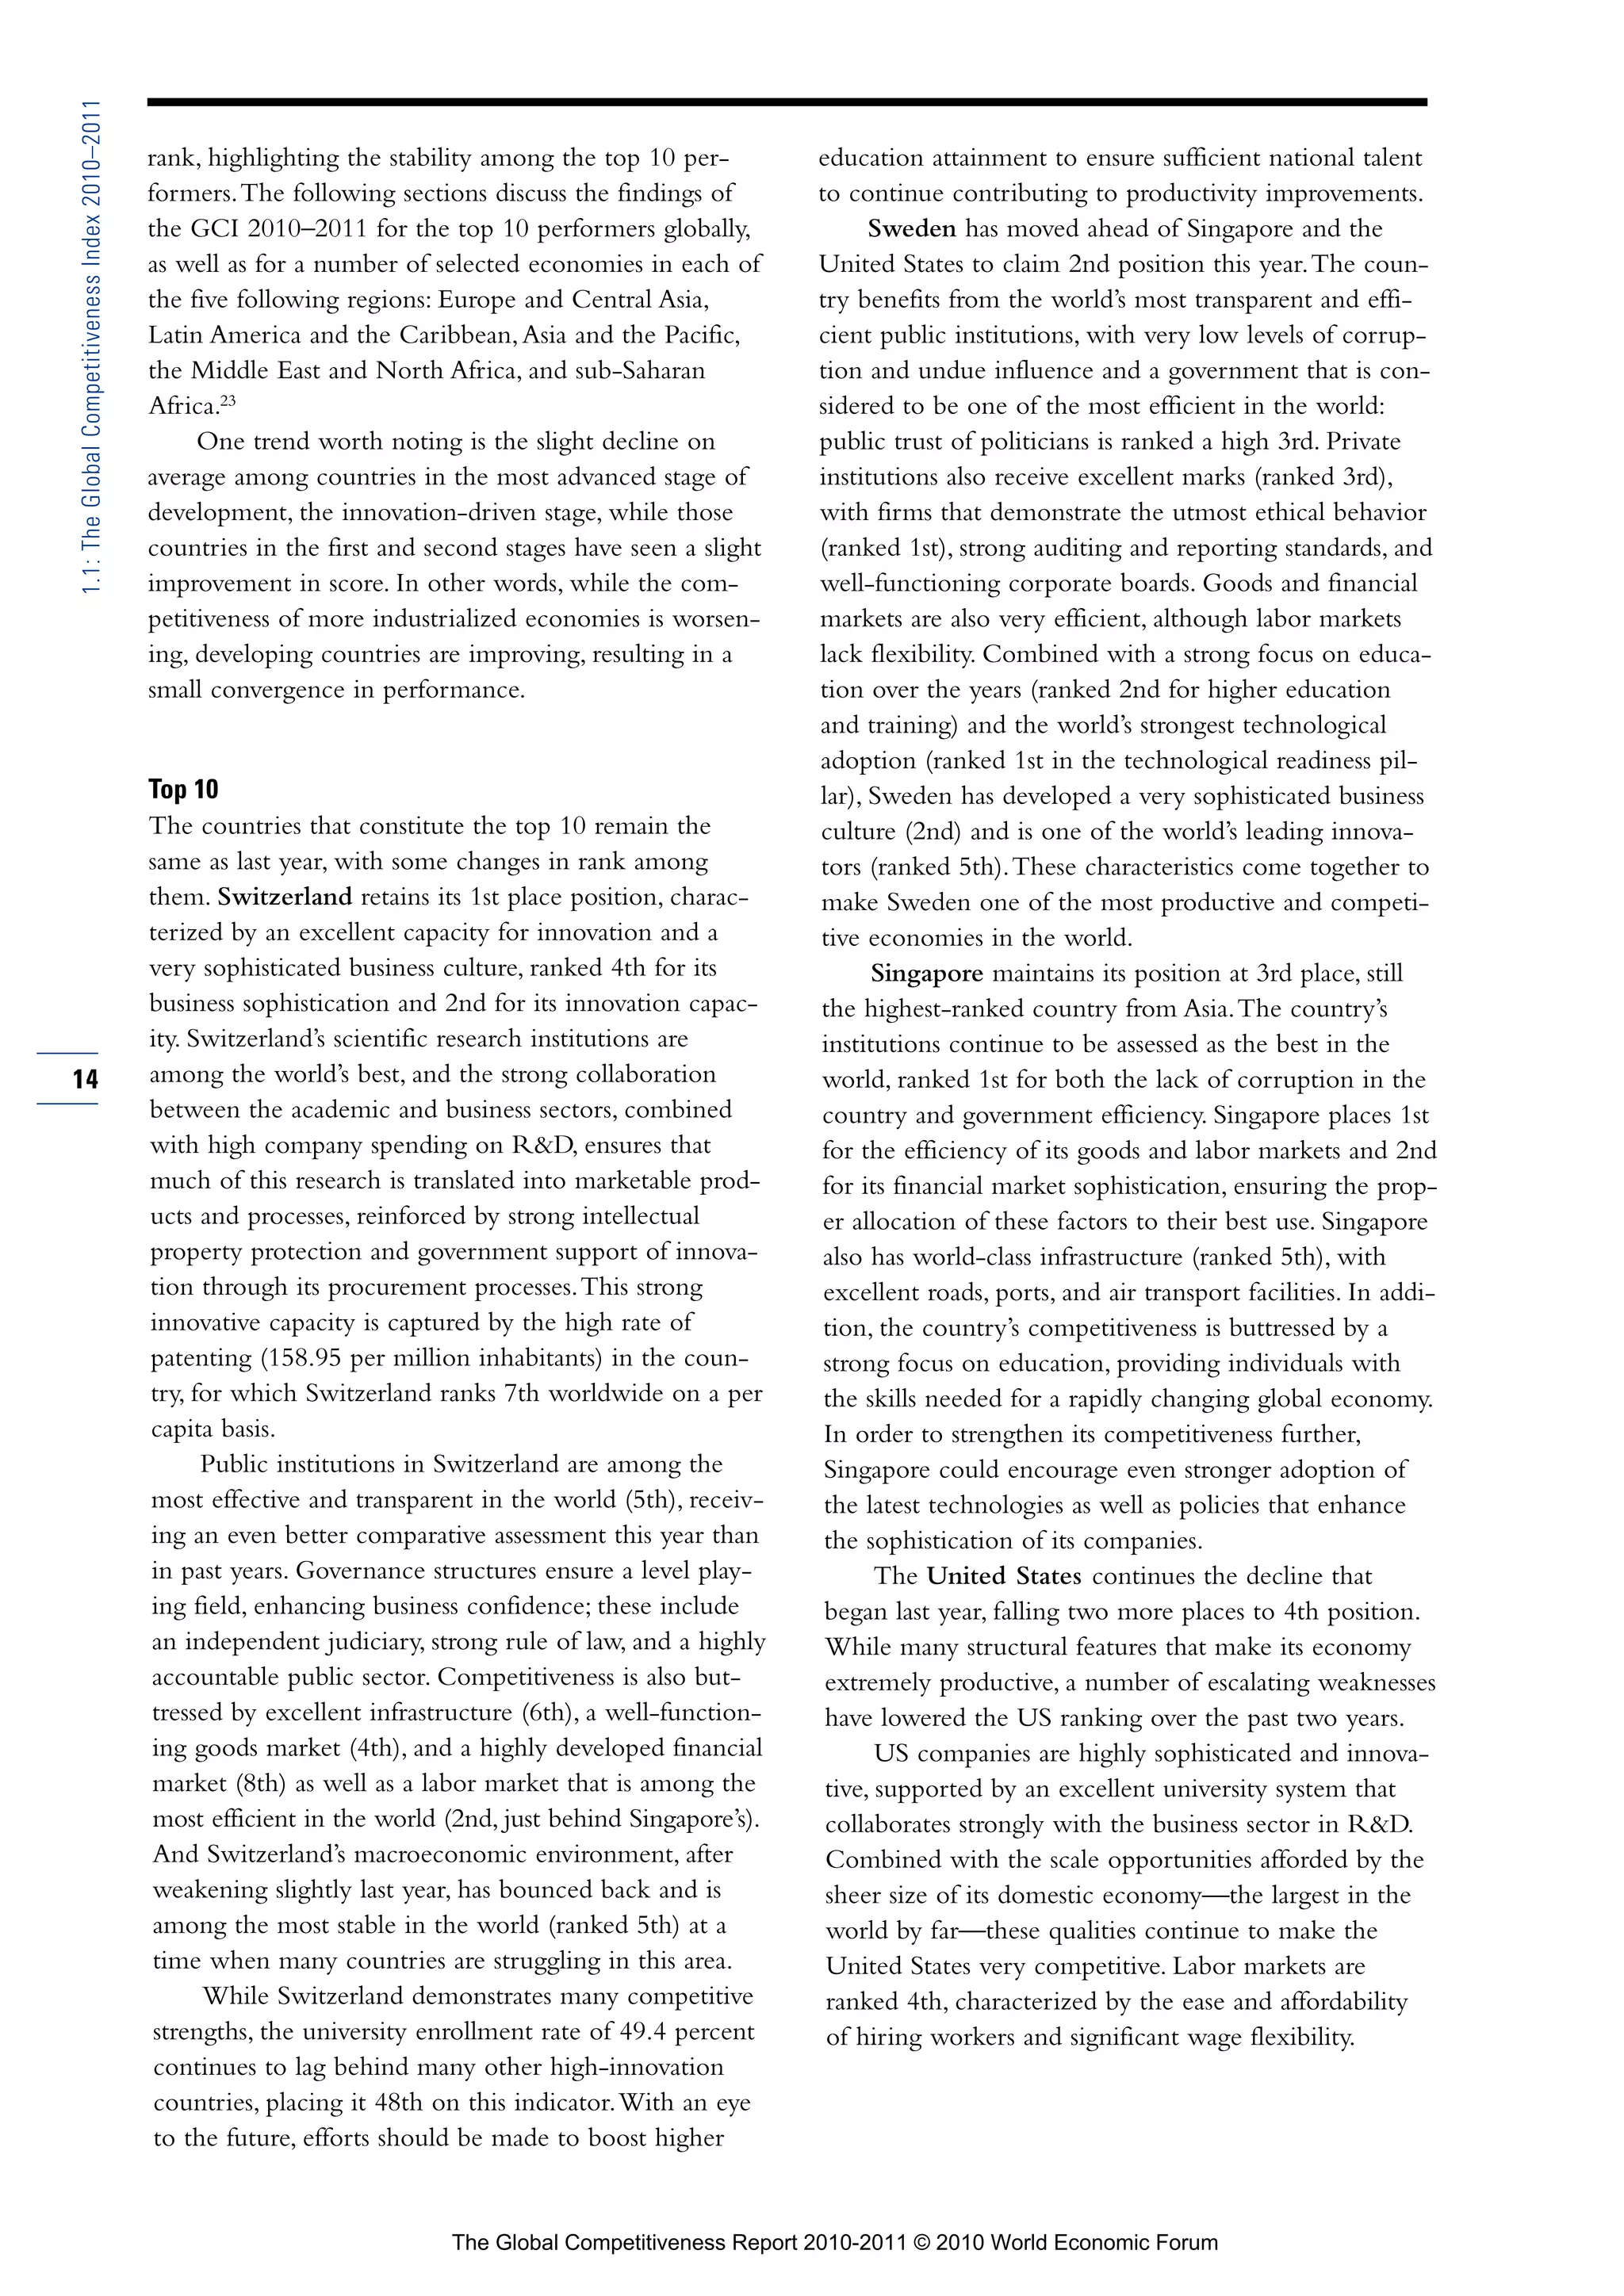
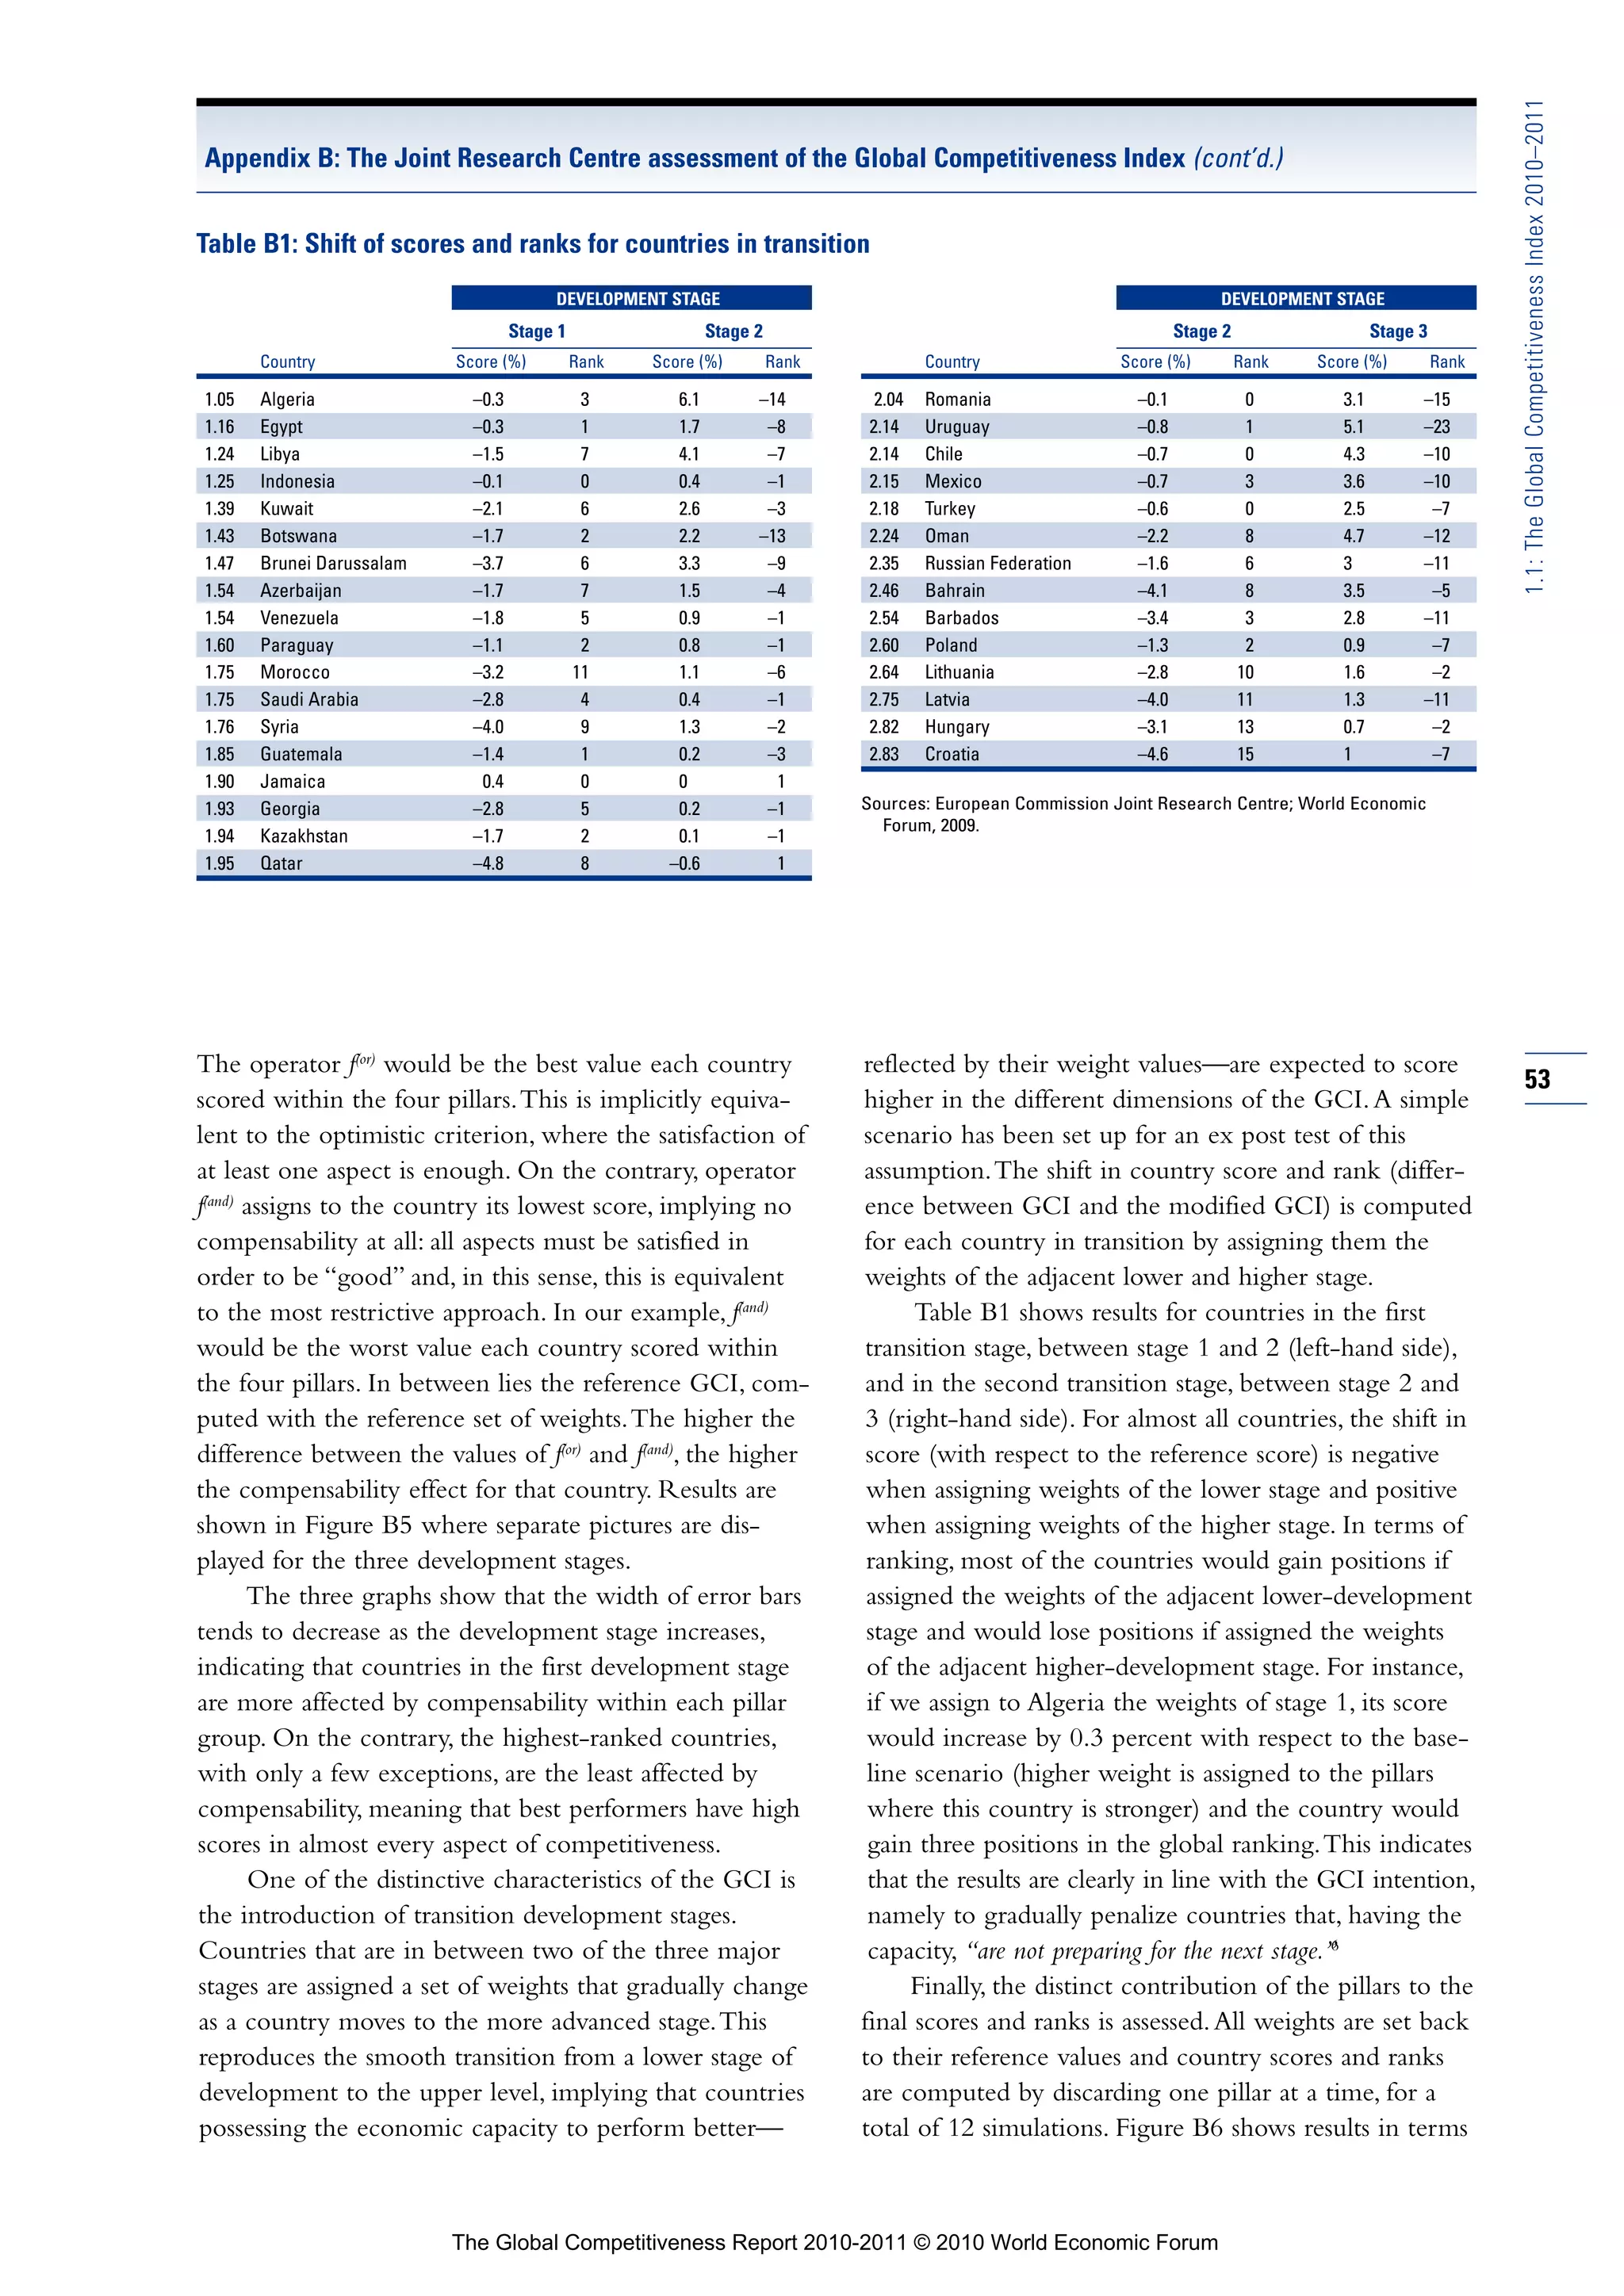
account by the World Economic Forum in the formula- Figure B4 shows the median rank (blue dot) and
tion of the 2010–2011 GCI release, and the relevant the 90 percent confidence interval across all the Monte
adjustments to the model are described in the main text Carlo simulations for all the countries reordered from
of this chapter. best to worst according to their GCI rank (black line).
The second objective is addressed by a detailed At the extreme ends of the ranking there are two
robustness analysis. In every composite indicator analysis, groups of very stable countries: regardless of the weights
the final index is the outcome of a number of choices: they are assigned, the top performers—Switzerland, the
the framework (usually driven by theoretical models and United States, Singapore, Sweden, Denmark, and
experts’ opinions), the indicators to be included, their Finland—and the bottom performers—Timor-Leste,
normalization, the weights assigned to each indicator, Mauritania, Burkina Faso, Mozambique, Mali, Chad,
and the aggregation method, among other elements. Zimbabwe, and Burundi—remain the same. As expect-
Some of these choices are subjective; others are driven ed, the most unstable countries are located in the mid-
by statistical analysis, mathematical simplicity, experts’ dle-to-low area of the competitiveness ladders: these
opinions, or common practice. The aim of the robust- countries are characterized by very similar scores, so that
ness analysis is to assess to what extent all these choices, even a small variation in their score causes a compara-
some of them considered crucial, might affect the final tively large variation in their rank.
score and ranking of the index.3 Together with the classical uncertainty analysis,
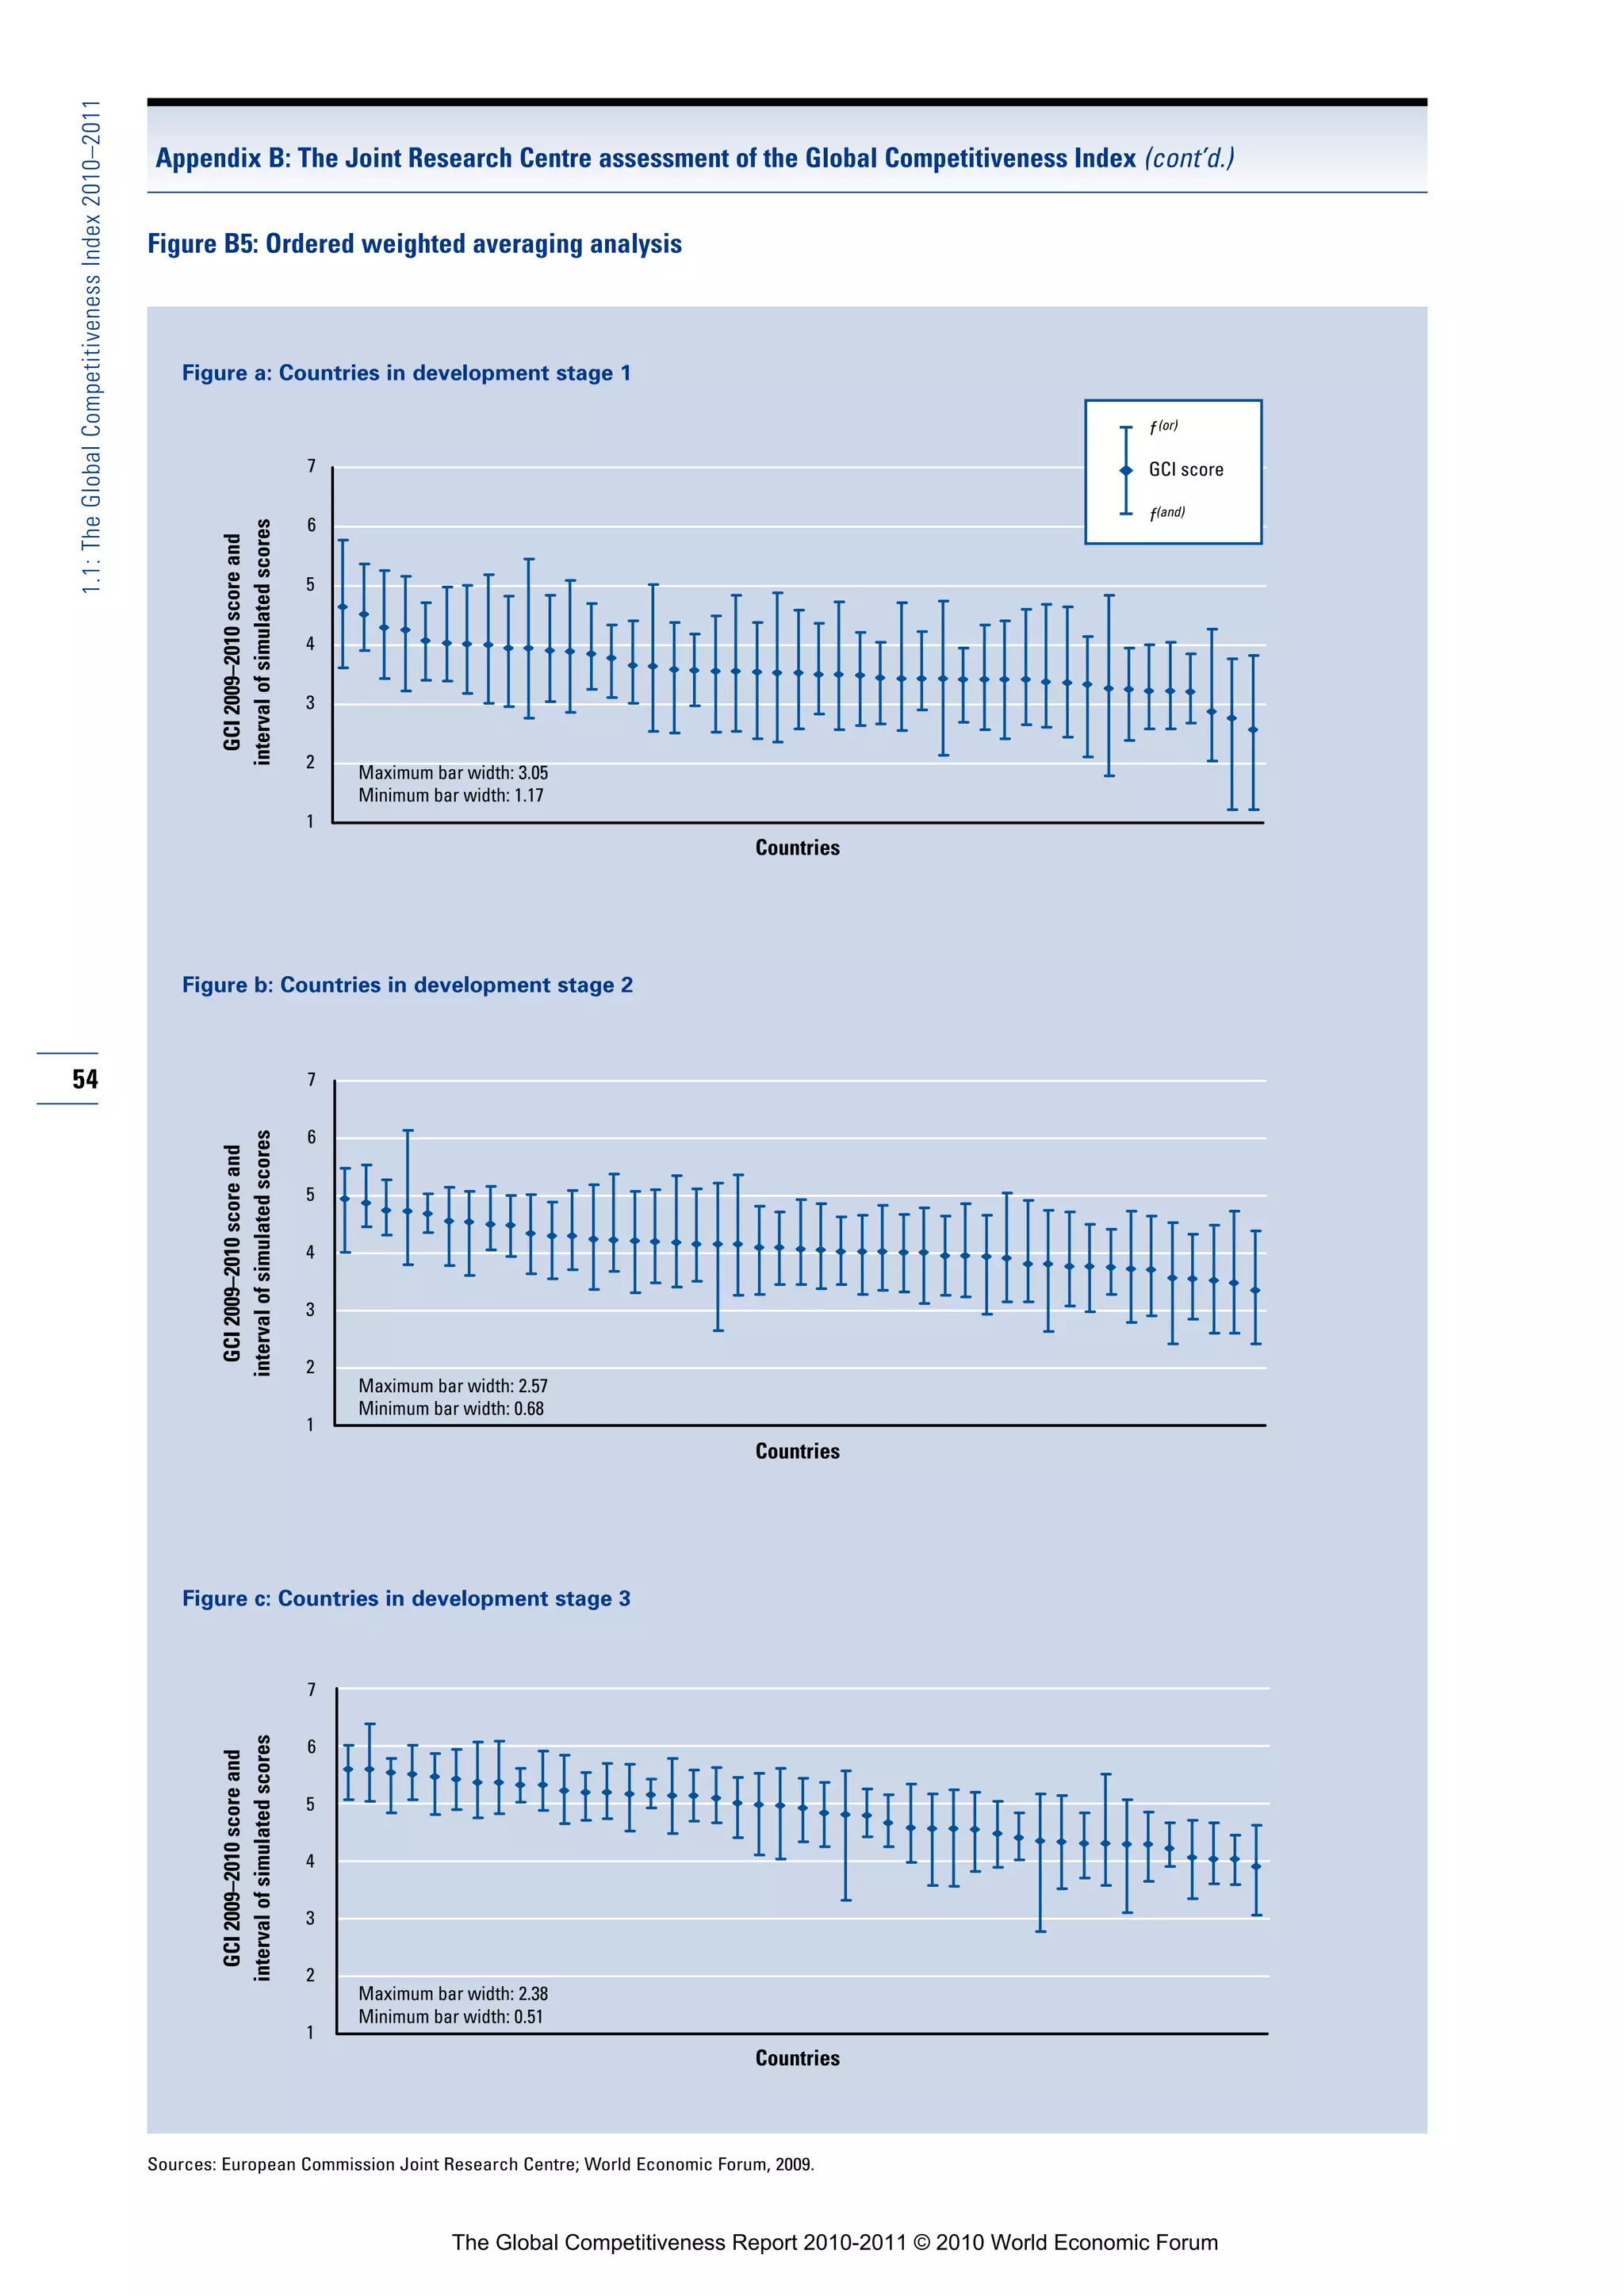
In the case of the GCI, we decided not to explore other tests have been carried out to examine the GCI
all uncertainties in order to check their simultaneous under different conditions. Alternative scenarios have
and joint influence on the final score. The complexity of been simulated: (1) to evaluate the compensability effect
the GCI would indeed have made it difficult to disen- intrinsically embedded in the linear structure of the
tangle influential factors and fully understand the impli- GCI, (2) to test the assumption of smooth transitions in
cation of their variability. Instead, the GCI robustness the definition of development stages, and (3) to assess
analysis focused on some critical key points and checked whether the pillars play a balanced role in the GCI
50
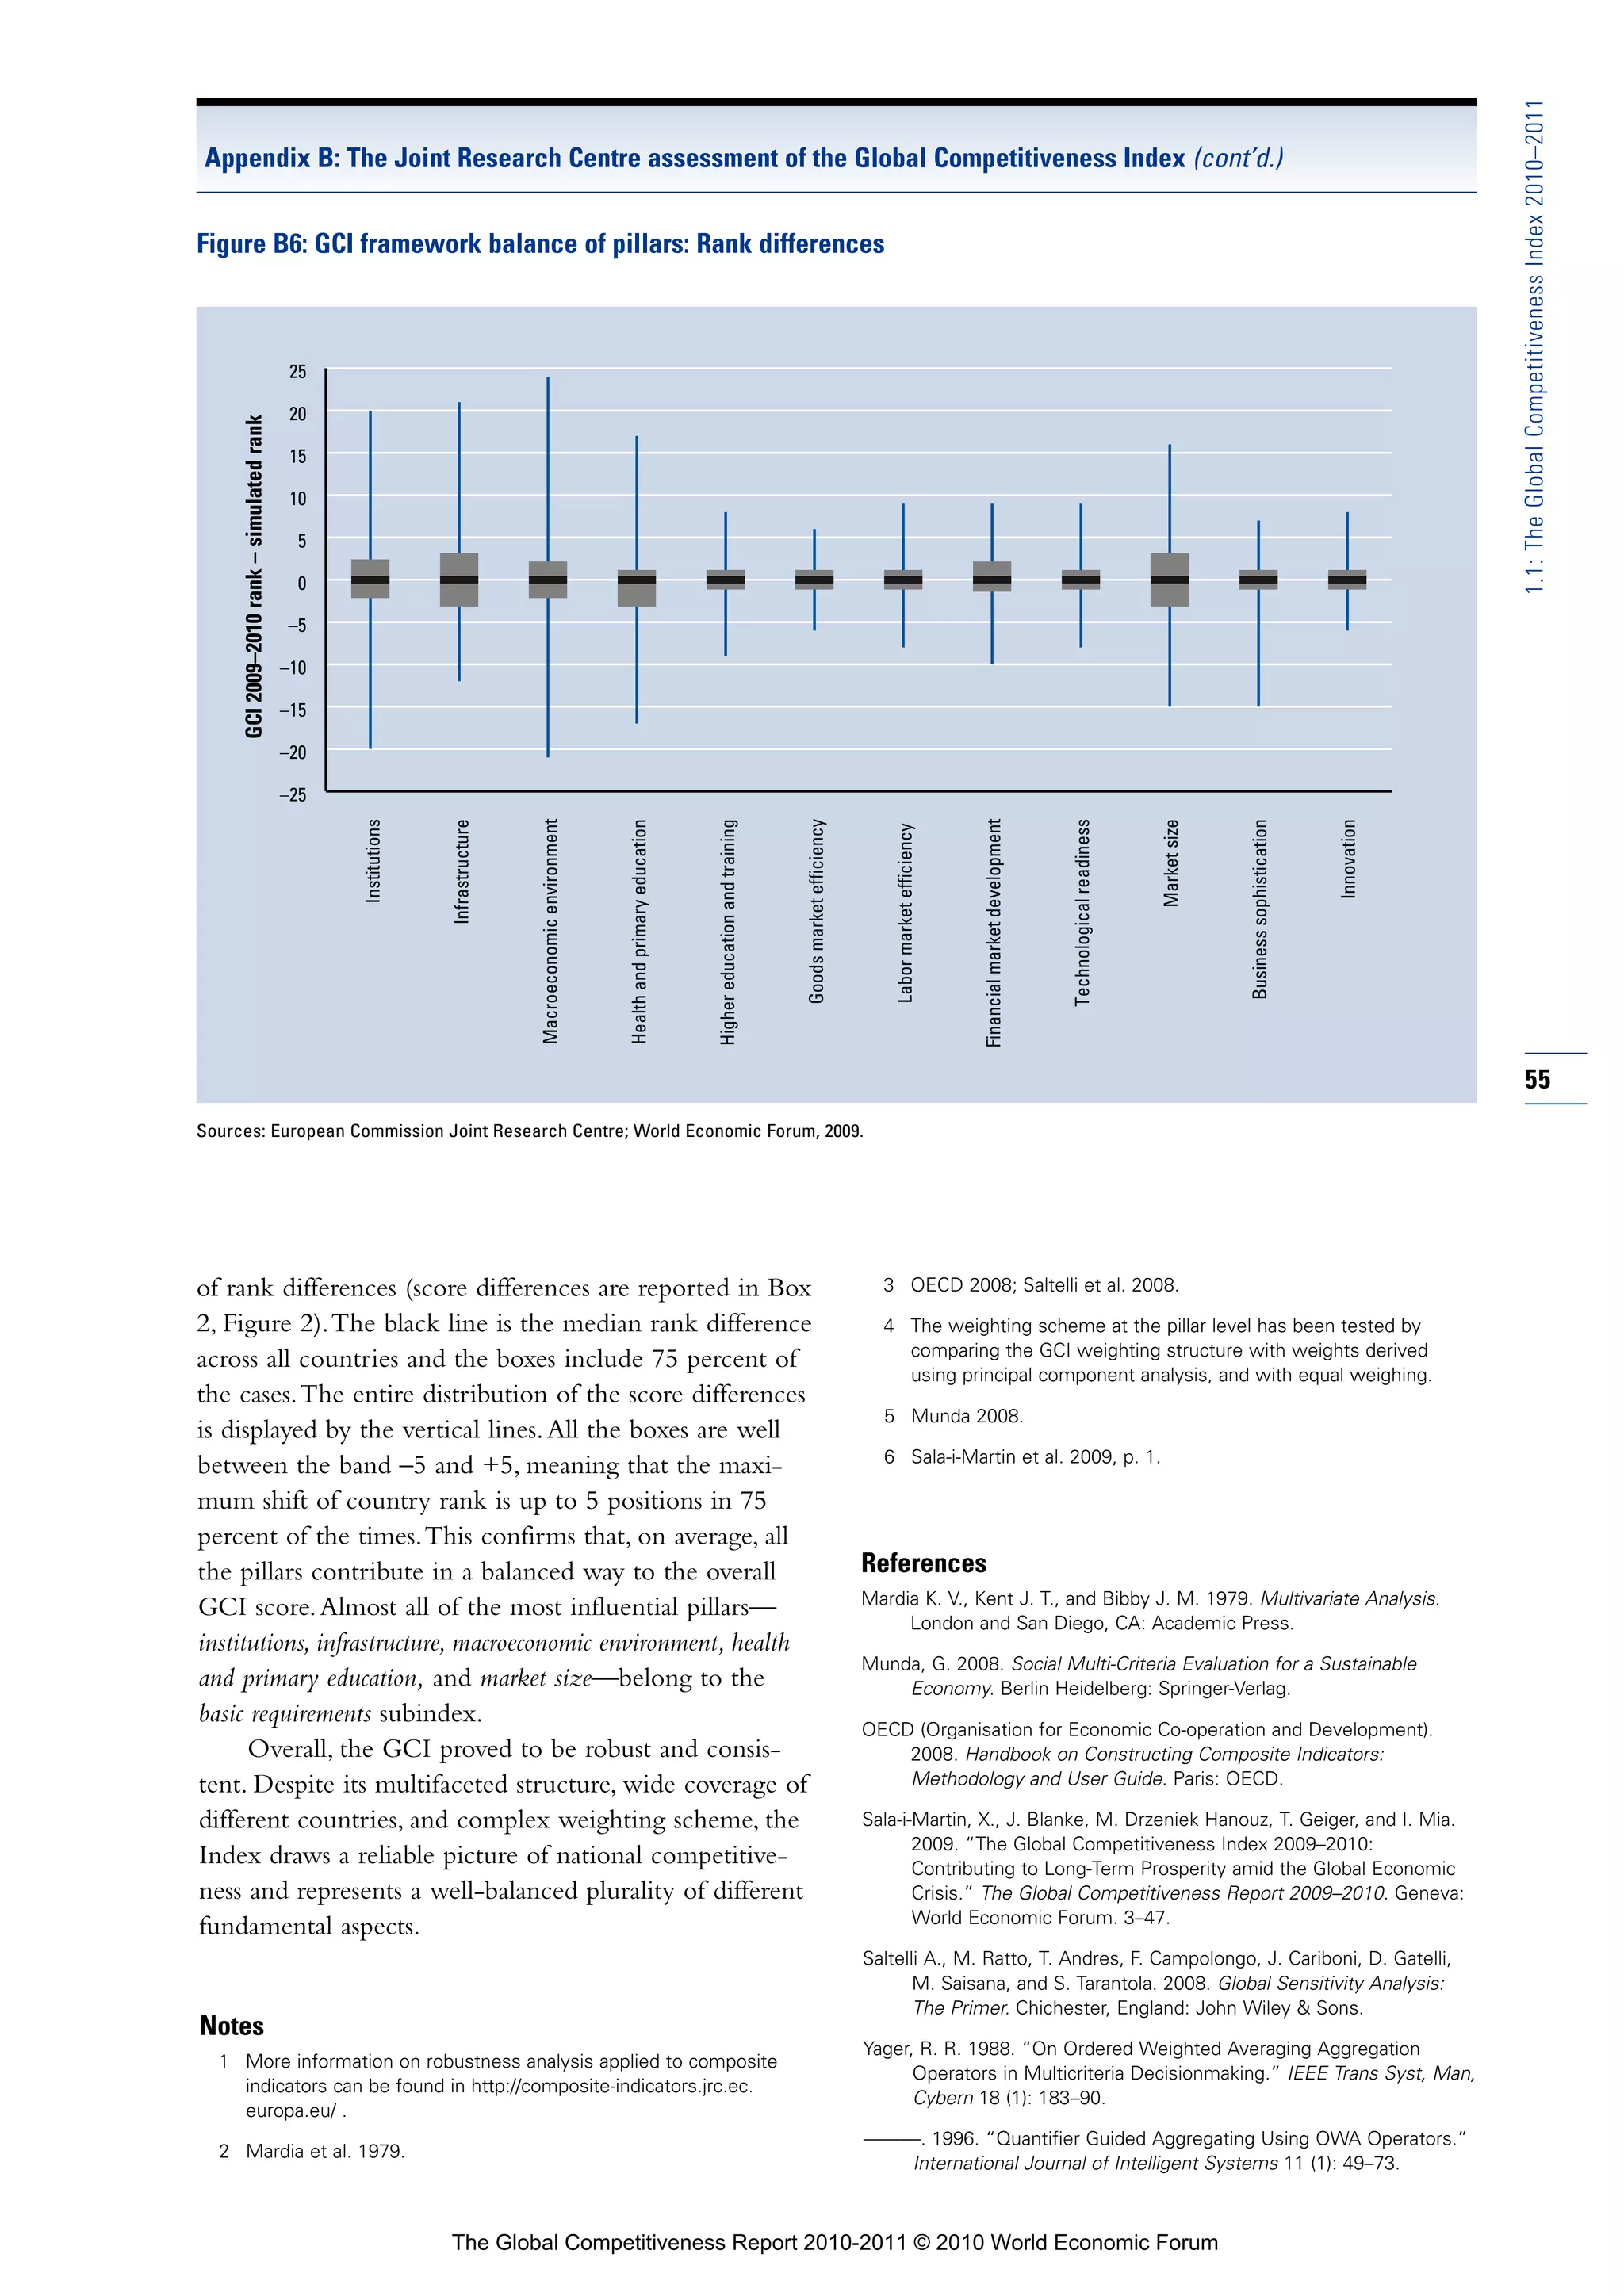
the overall influence of each of them on the Index. framework.
The robustness assessment of the GCI consisted of Compensability is present within the GCI given its
different steps. First, a Monte Carlo experiment was linear structure, which intrinsically embeds the possibili-
used to assess the impact of assigning different weights ty of offsetting a disadvantage in some pillars by a suffi-
5
to the GCI subindexes according to the development ciently large advantage in others. This offsetting might
stage of each country. This exercise was used to test the not be always desirable when dealing with fundamental
weighting scheme at subindex level (basic requirements, aspects of a concept such as competitiveness. Although it
efficiency enhancers, and innovation and sophistication factors), is generally difficult to quantify the level of compens-
which is considered critical for the results of the GCI.4 ability (comparisons with fully non-compensatory
For technical reasons, all economies are classified multi-criteria methods should be necessary), the ordered
into three main development stages in the uncertainty weighted averaging (OWA), originally proposed by
analysis. Countries in transition from one stage to the Yager (1988 and 1996), is applied to the GCI. The
next were assigned the closest higher or lower develop- OWA method consists of a family of operators that, for
ment stage. any given element (country, region, individual, . . .), map
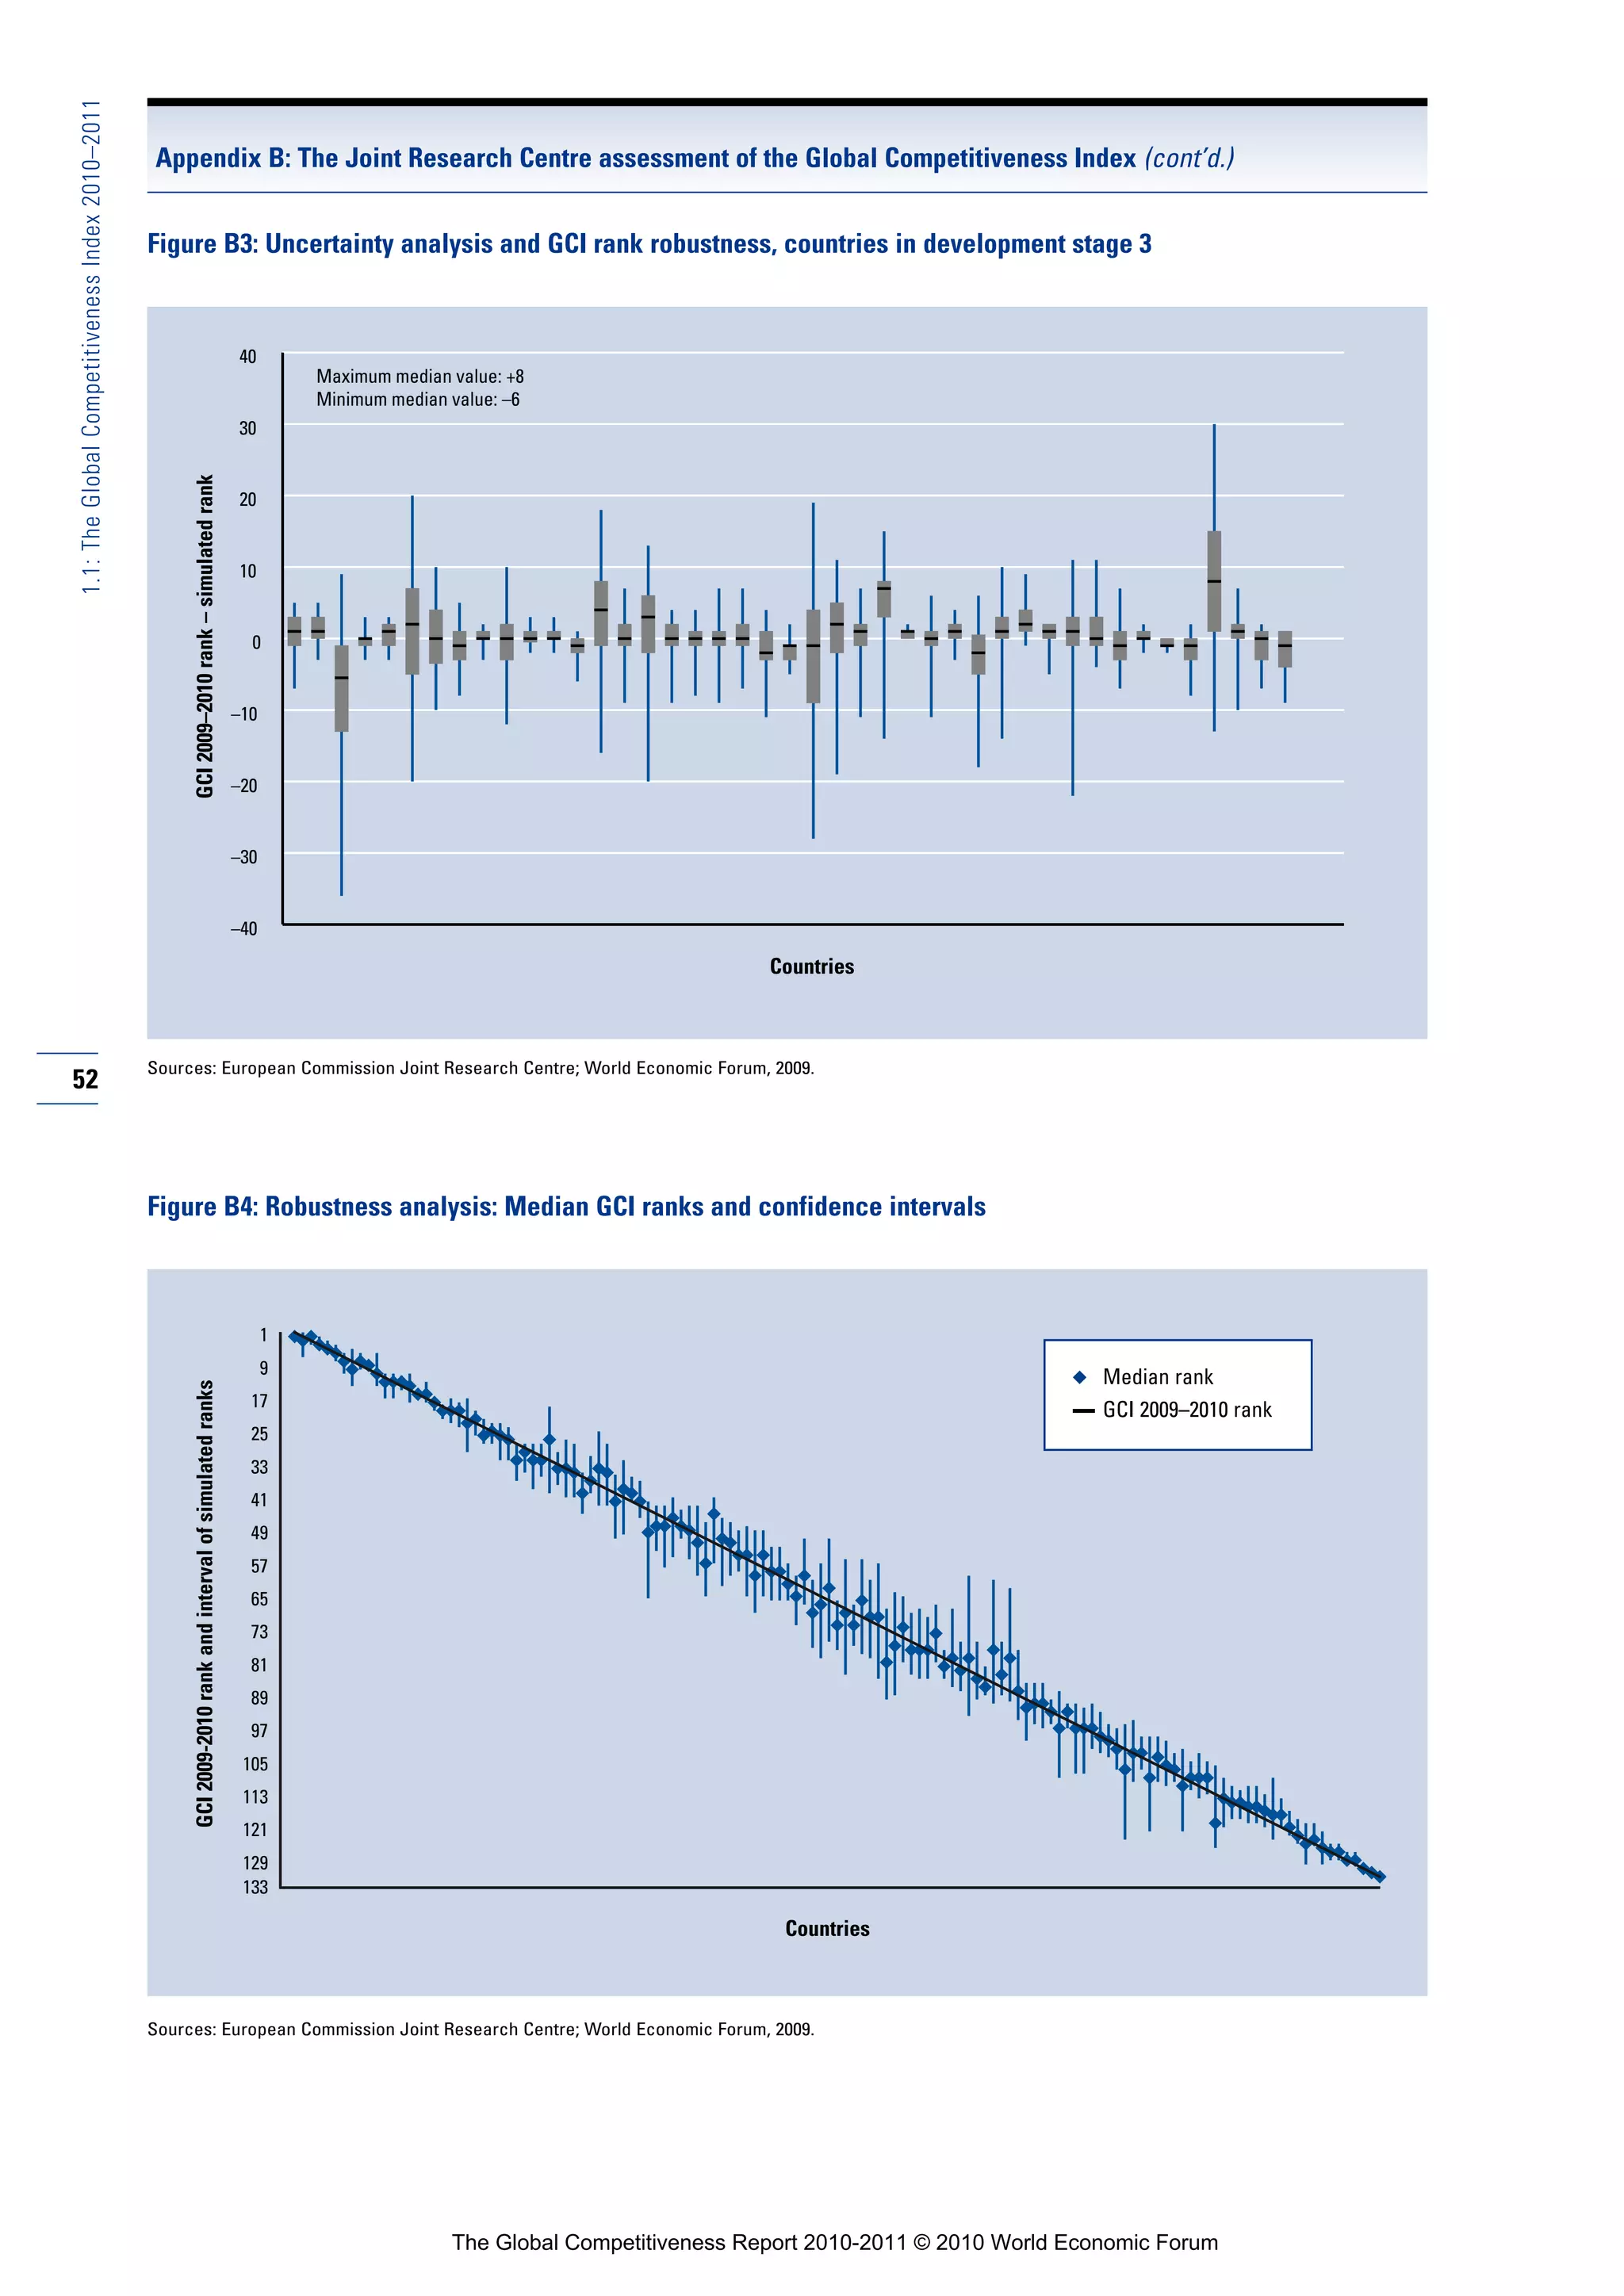
Figures B1, B2, and B3 show the main outcomes of a set of (k) real values {x1, x2, . . ., xk}—that is, indicators
the 1,200 Monte Carlo simulations, which assessed the observed for that element—into a single index depend-
GCI robustness with respect to its weighting scheme. ing on a set of weights {w1, w2, . . ., wk}:
For each development stage, the distributions of the k k
rank differences between the GCI and that based on our fOWA(x1, x1, ..., xk) ∑w x i (i) wi ∈ [0,1] ∑w i 1
simulated weights (henceforth termed the simulated i=1 i=1
GCI) are plotted country by country. The median rank where x(i) is the i-th largest xi—that is, {x(1), x(2), . . ., x(k)}
difference is in black while the boxes represent the is the series of xi values reordered in descending order.
interquartile range of the distribution (25th and 75th OWA operators are not weighted averages since the set
percentiles). No particular volatility affects the GCI on of weights depends only on the i-th ordered position of
average: the median absolute shift of a country ranking the indicators. OWA operators embed many different
is smaller than eight positions for all countries. In types of aggregations depending on the set of weights
absolute terms we find only 7 volatile countries out of wi.
an overall sample of 133 countries considered in the In particular, operator f(or) assigns to each country
GCI 2009–2010. The dispersion around the median is the highest indicator value, thus implying full compens-
lower for economies in development stage 3 than for ability among indicators. Consider, for example, the basic
the others. requirements subindex, comprised of the first four pillars.
The Global Competitiveness Report 2010-2011 © 2010 World Economic Forum](https://image.slidesharecdn.com/globalcompetitivenessreportwef2010-11-100928142139-phpapp02/75/Global-competitiveness-report-wef-2010-11-63-2048.jpg)

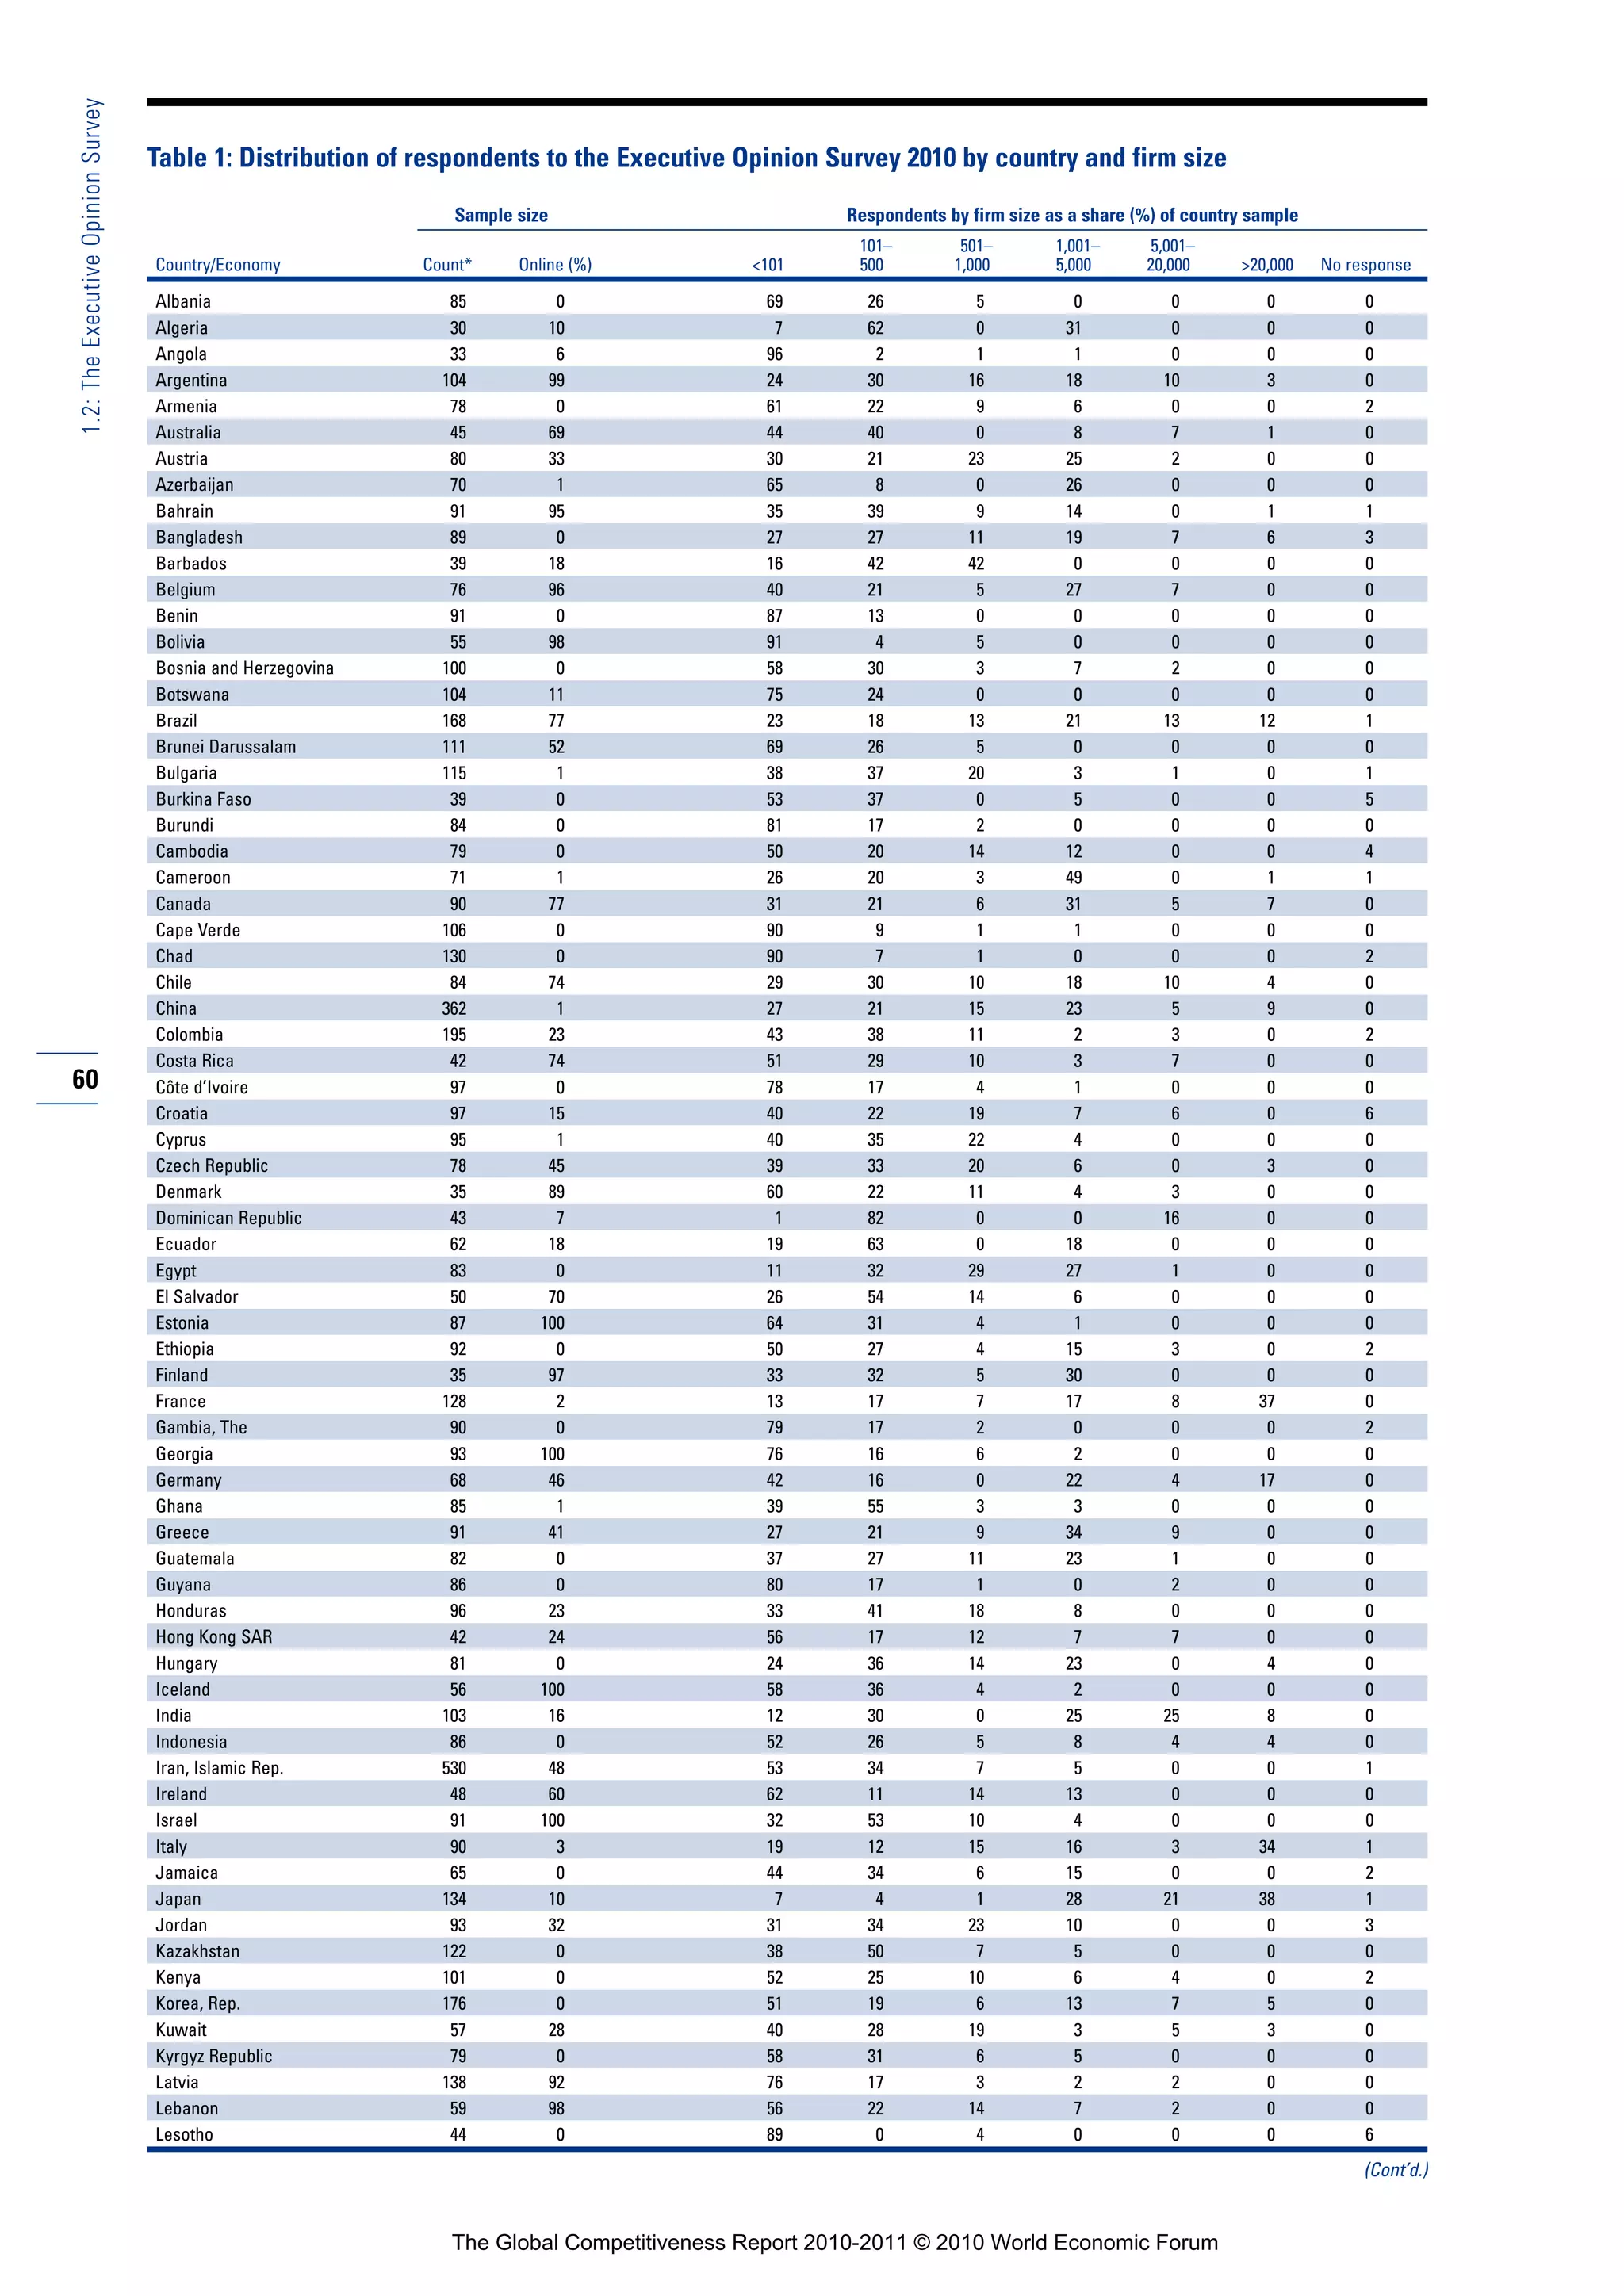
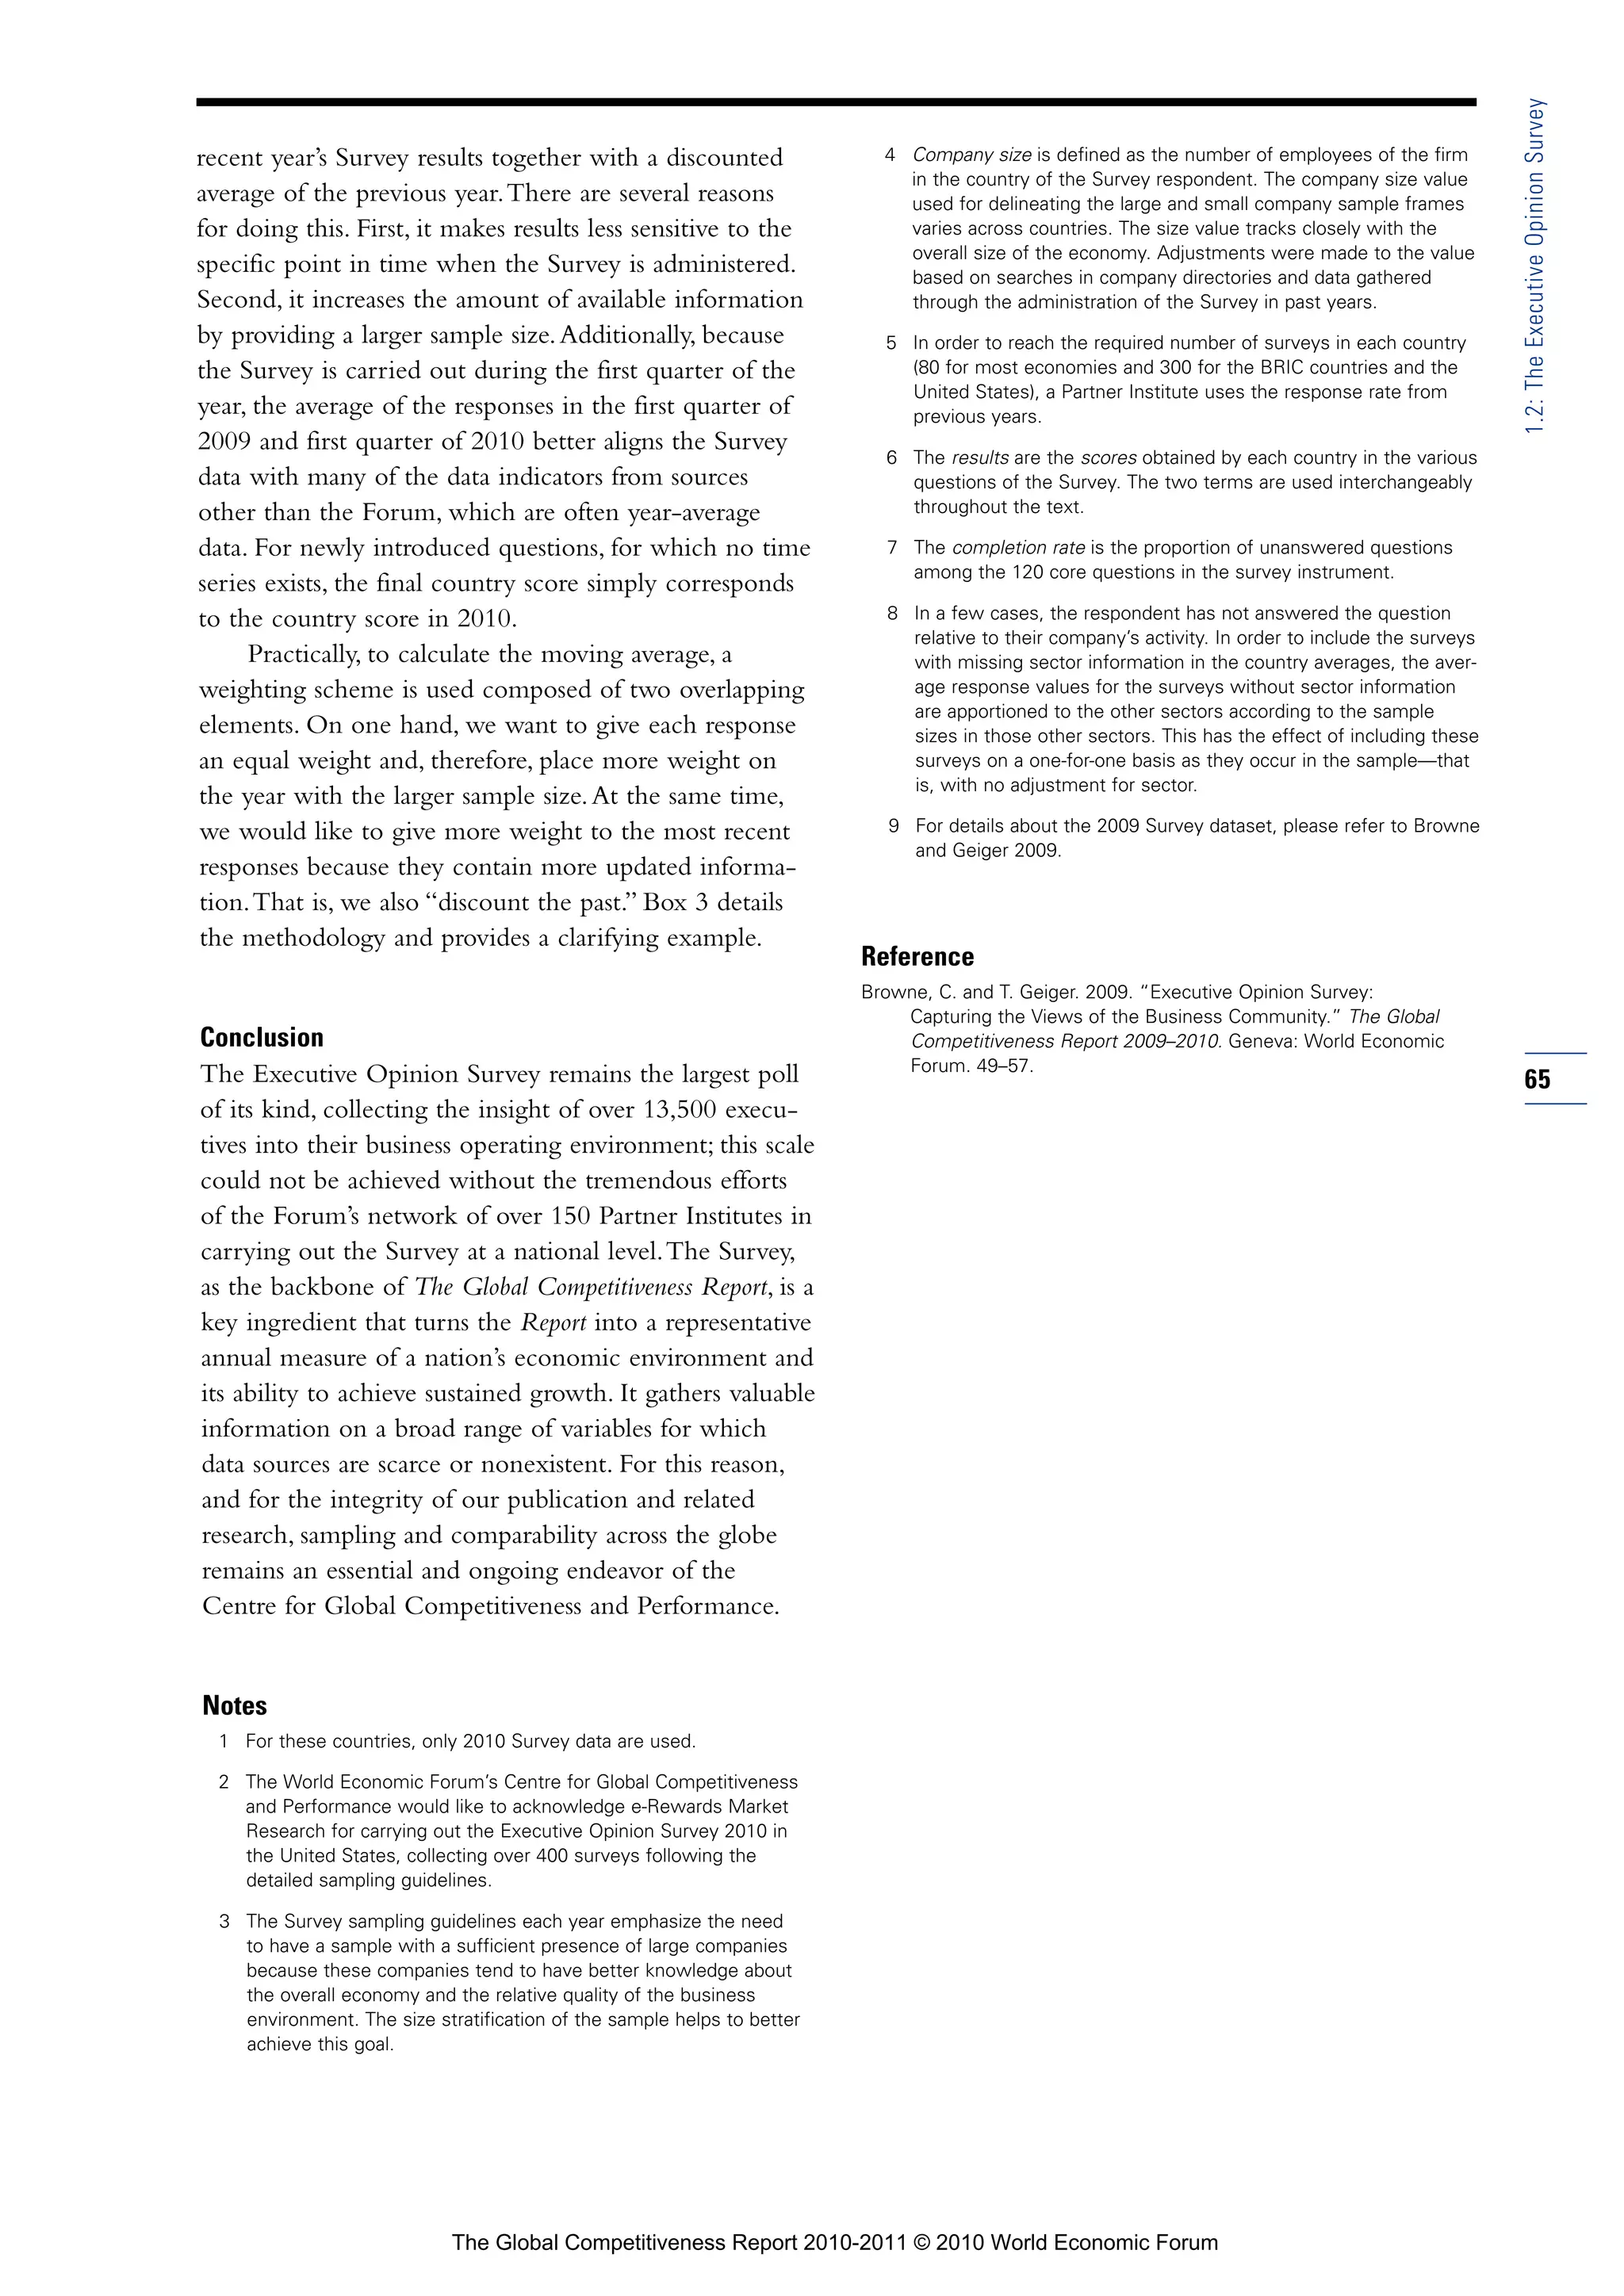


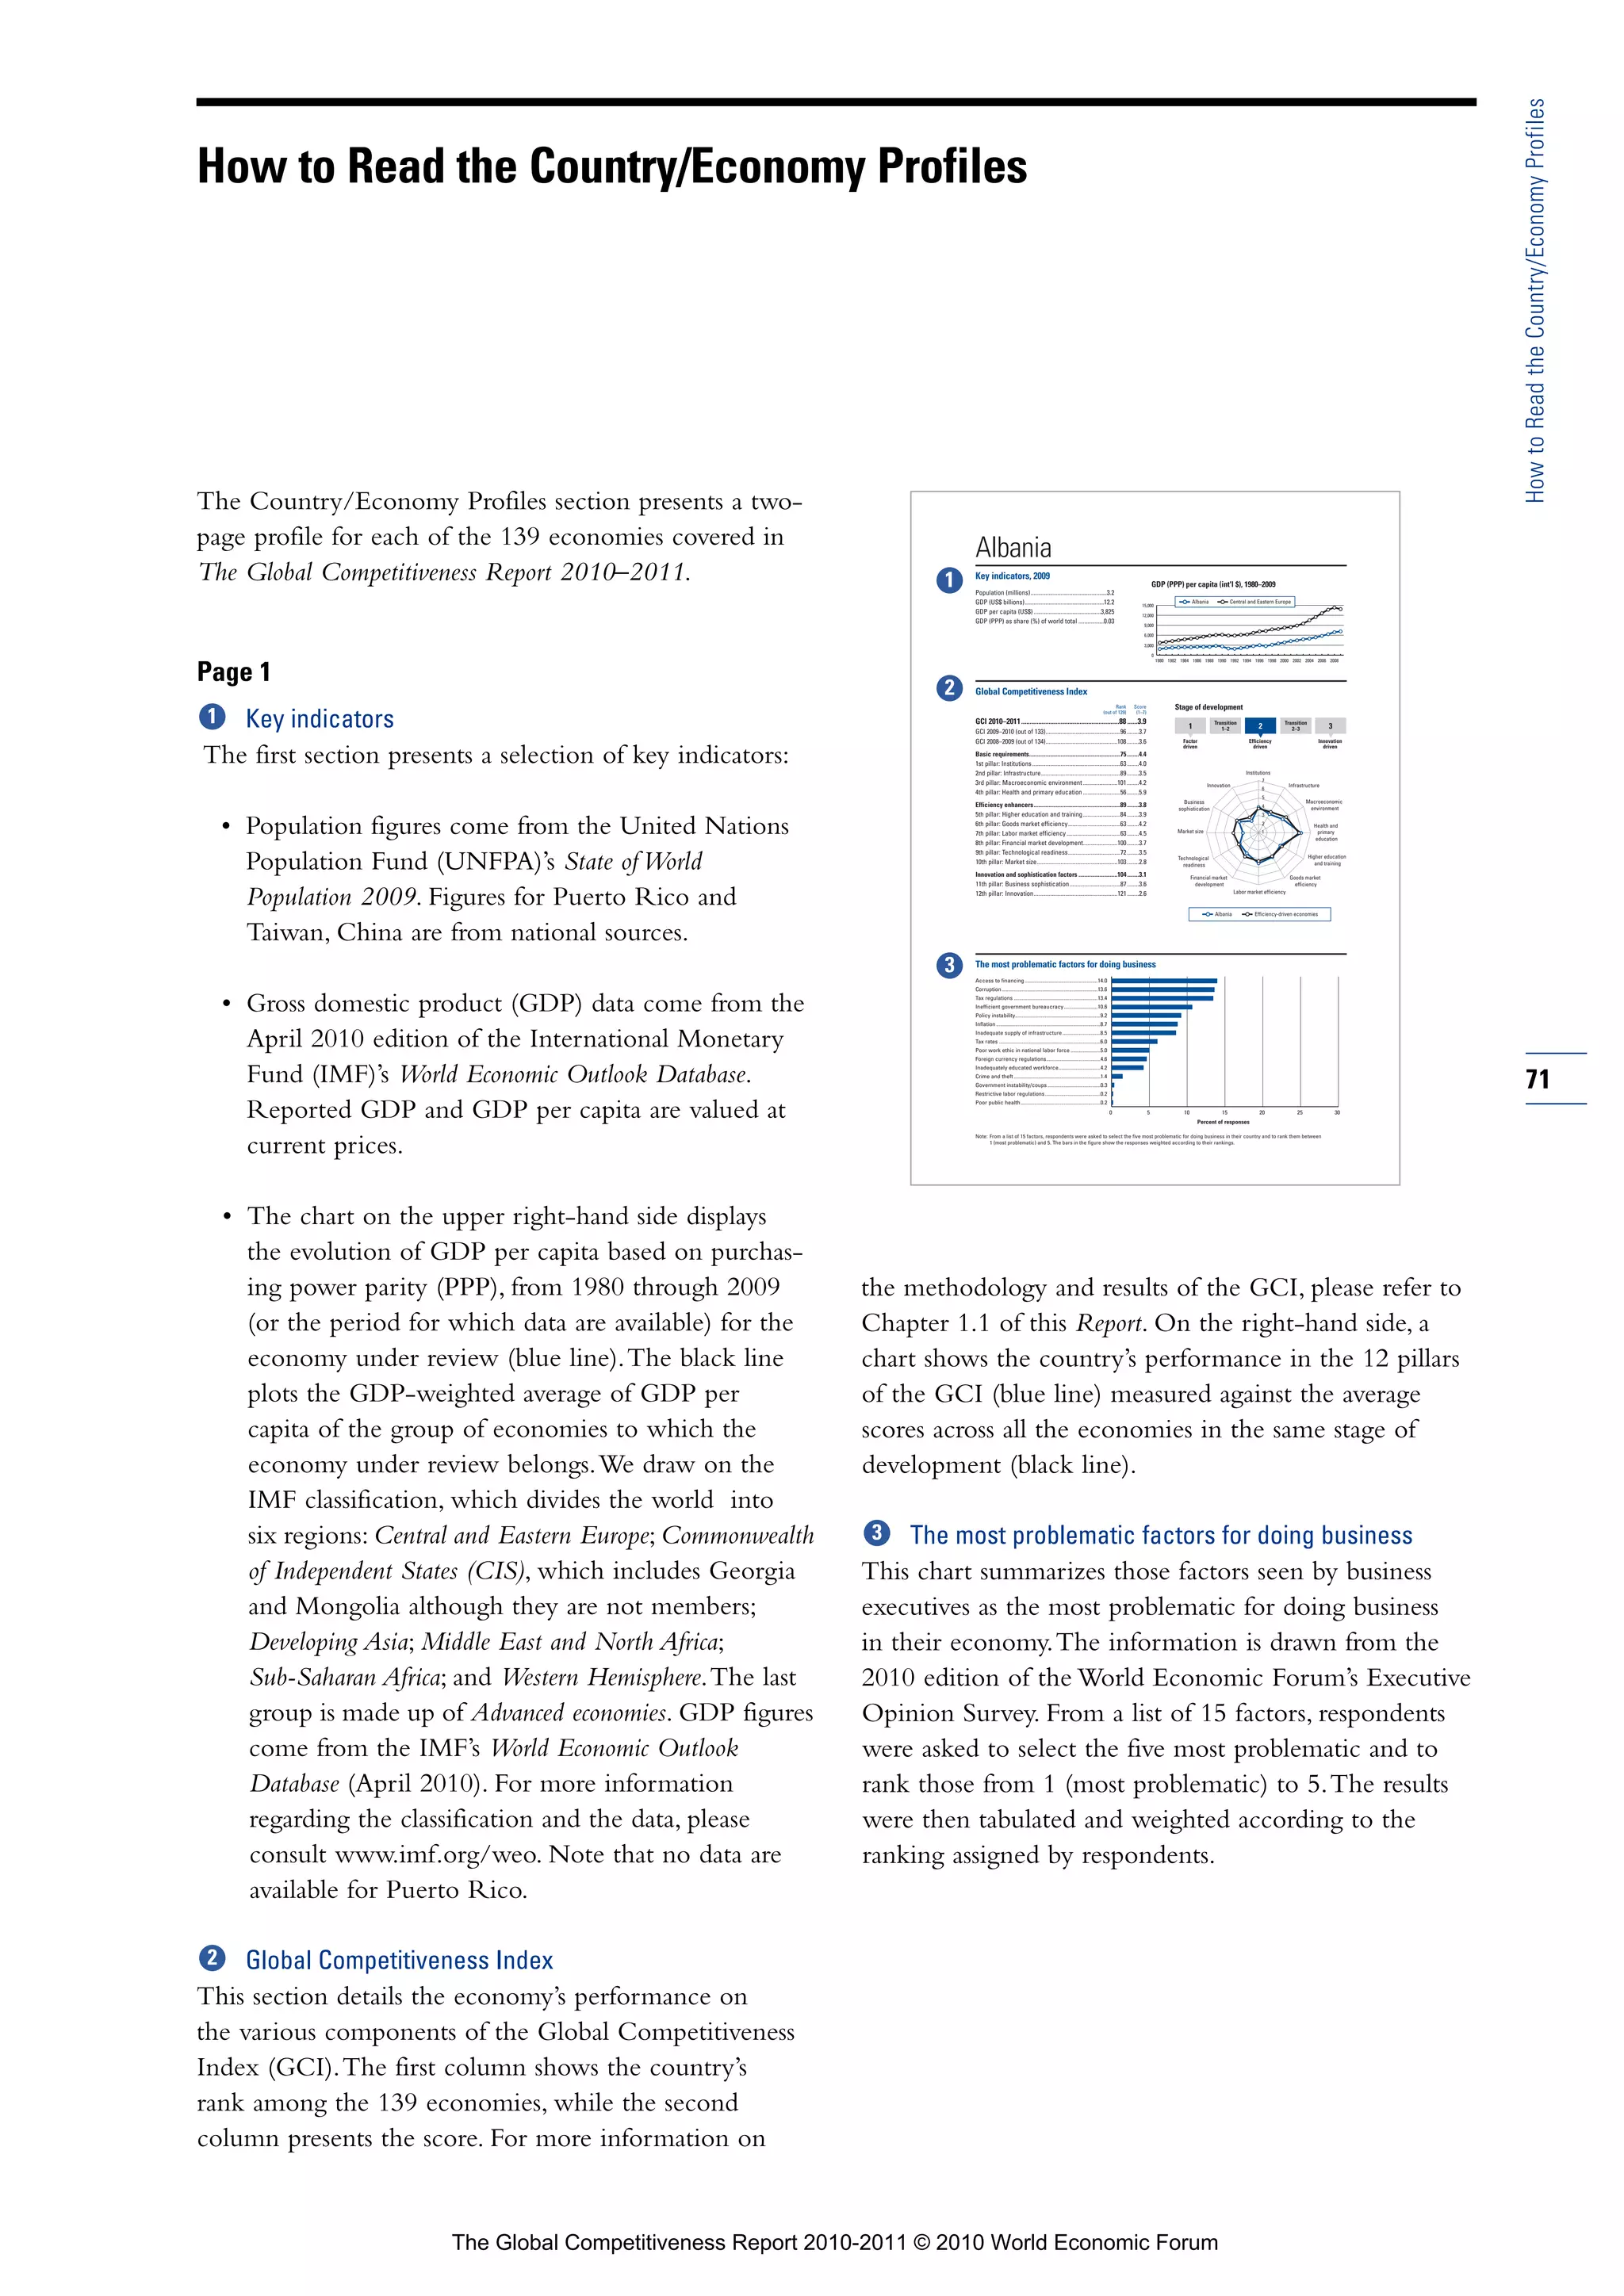
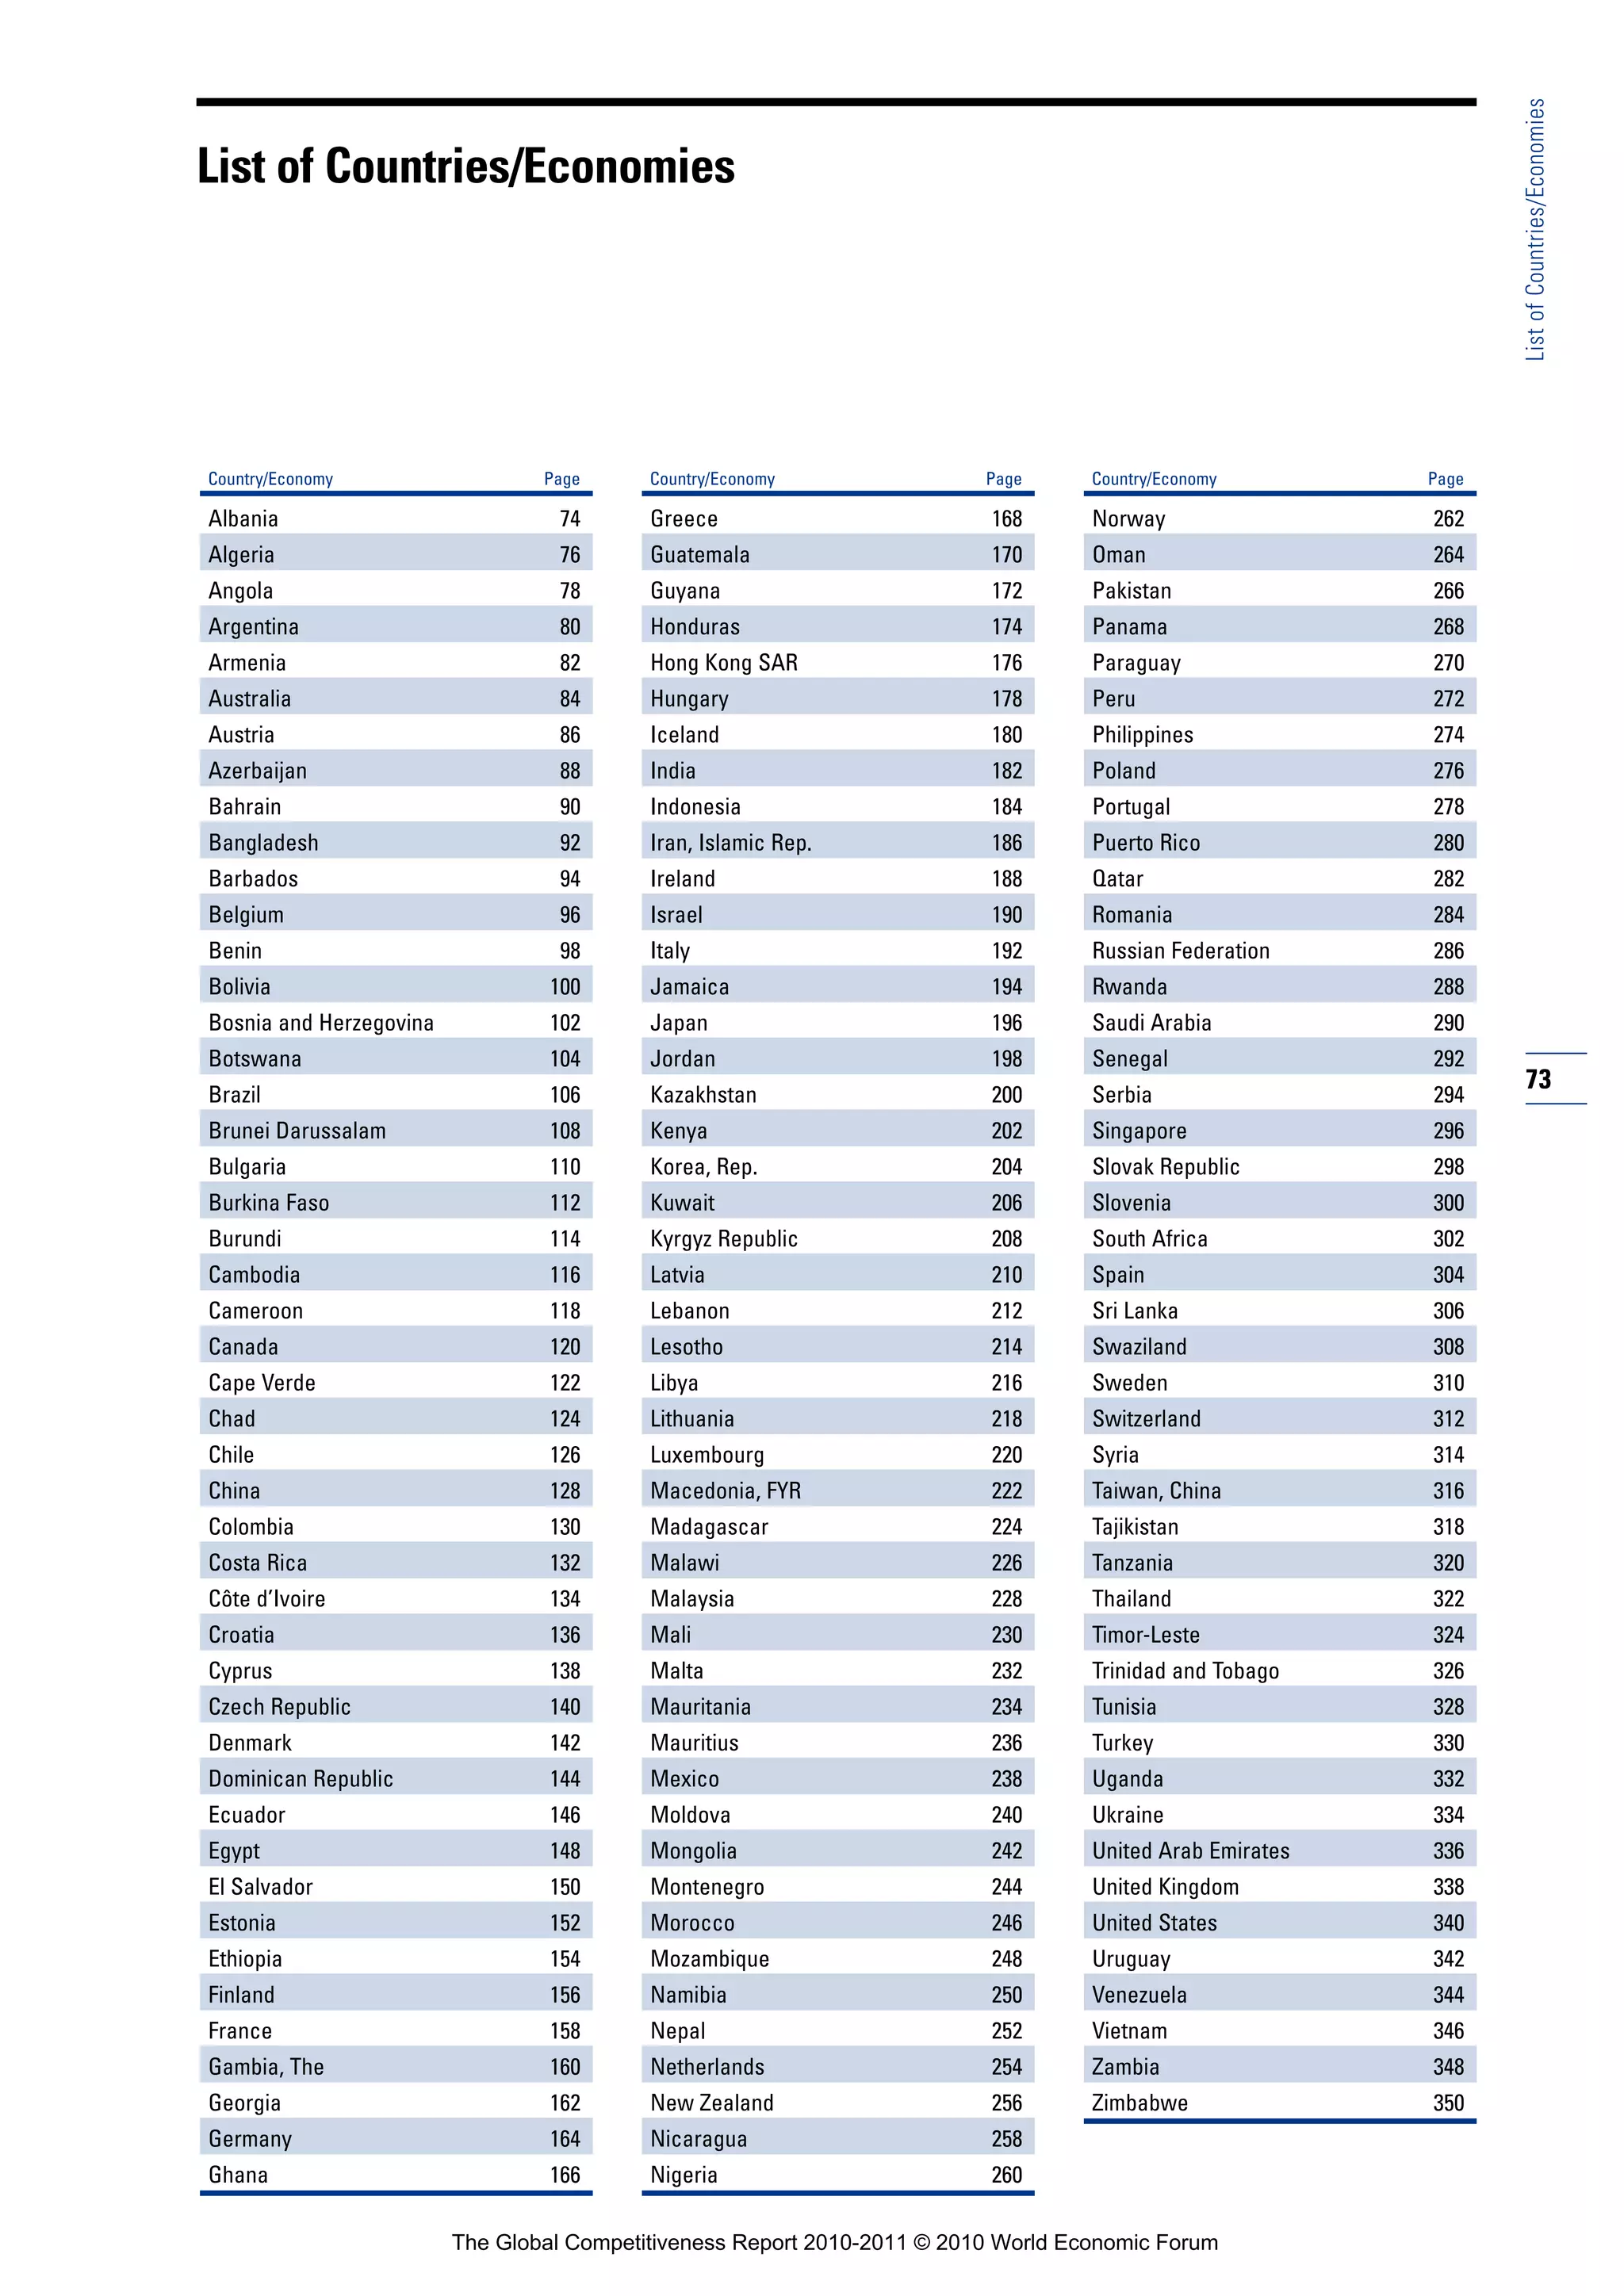

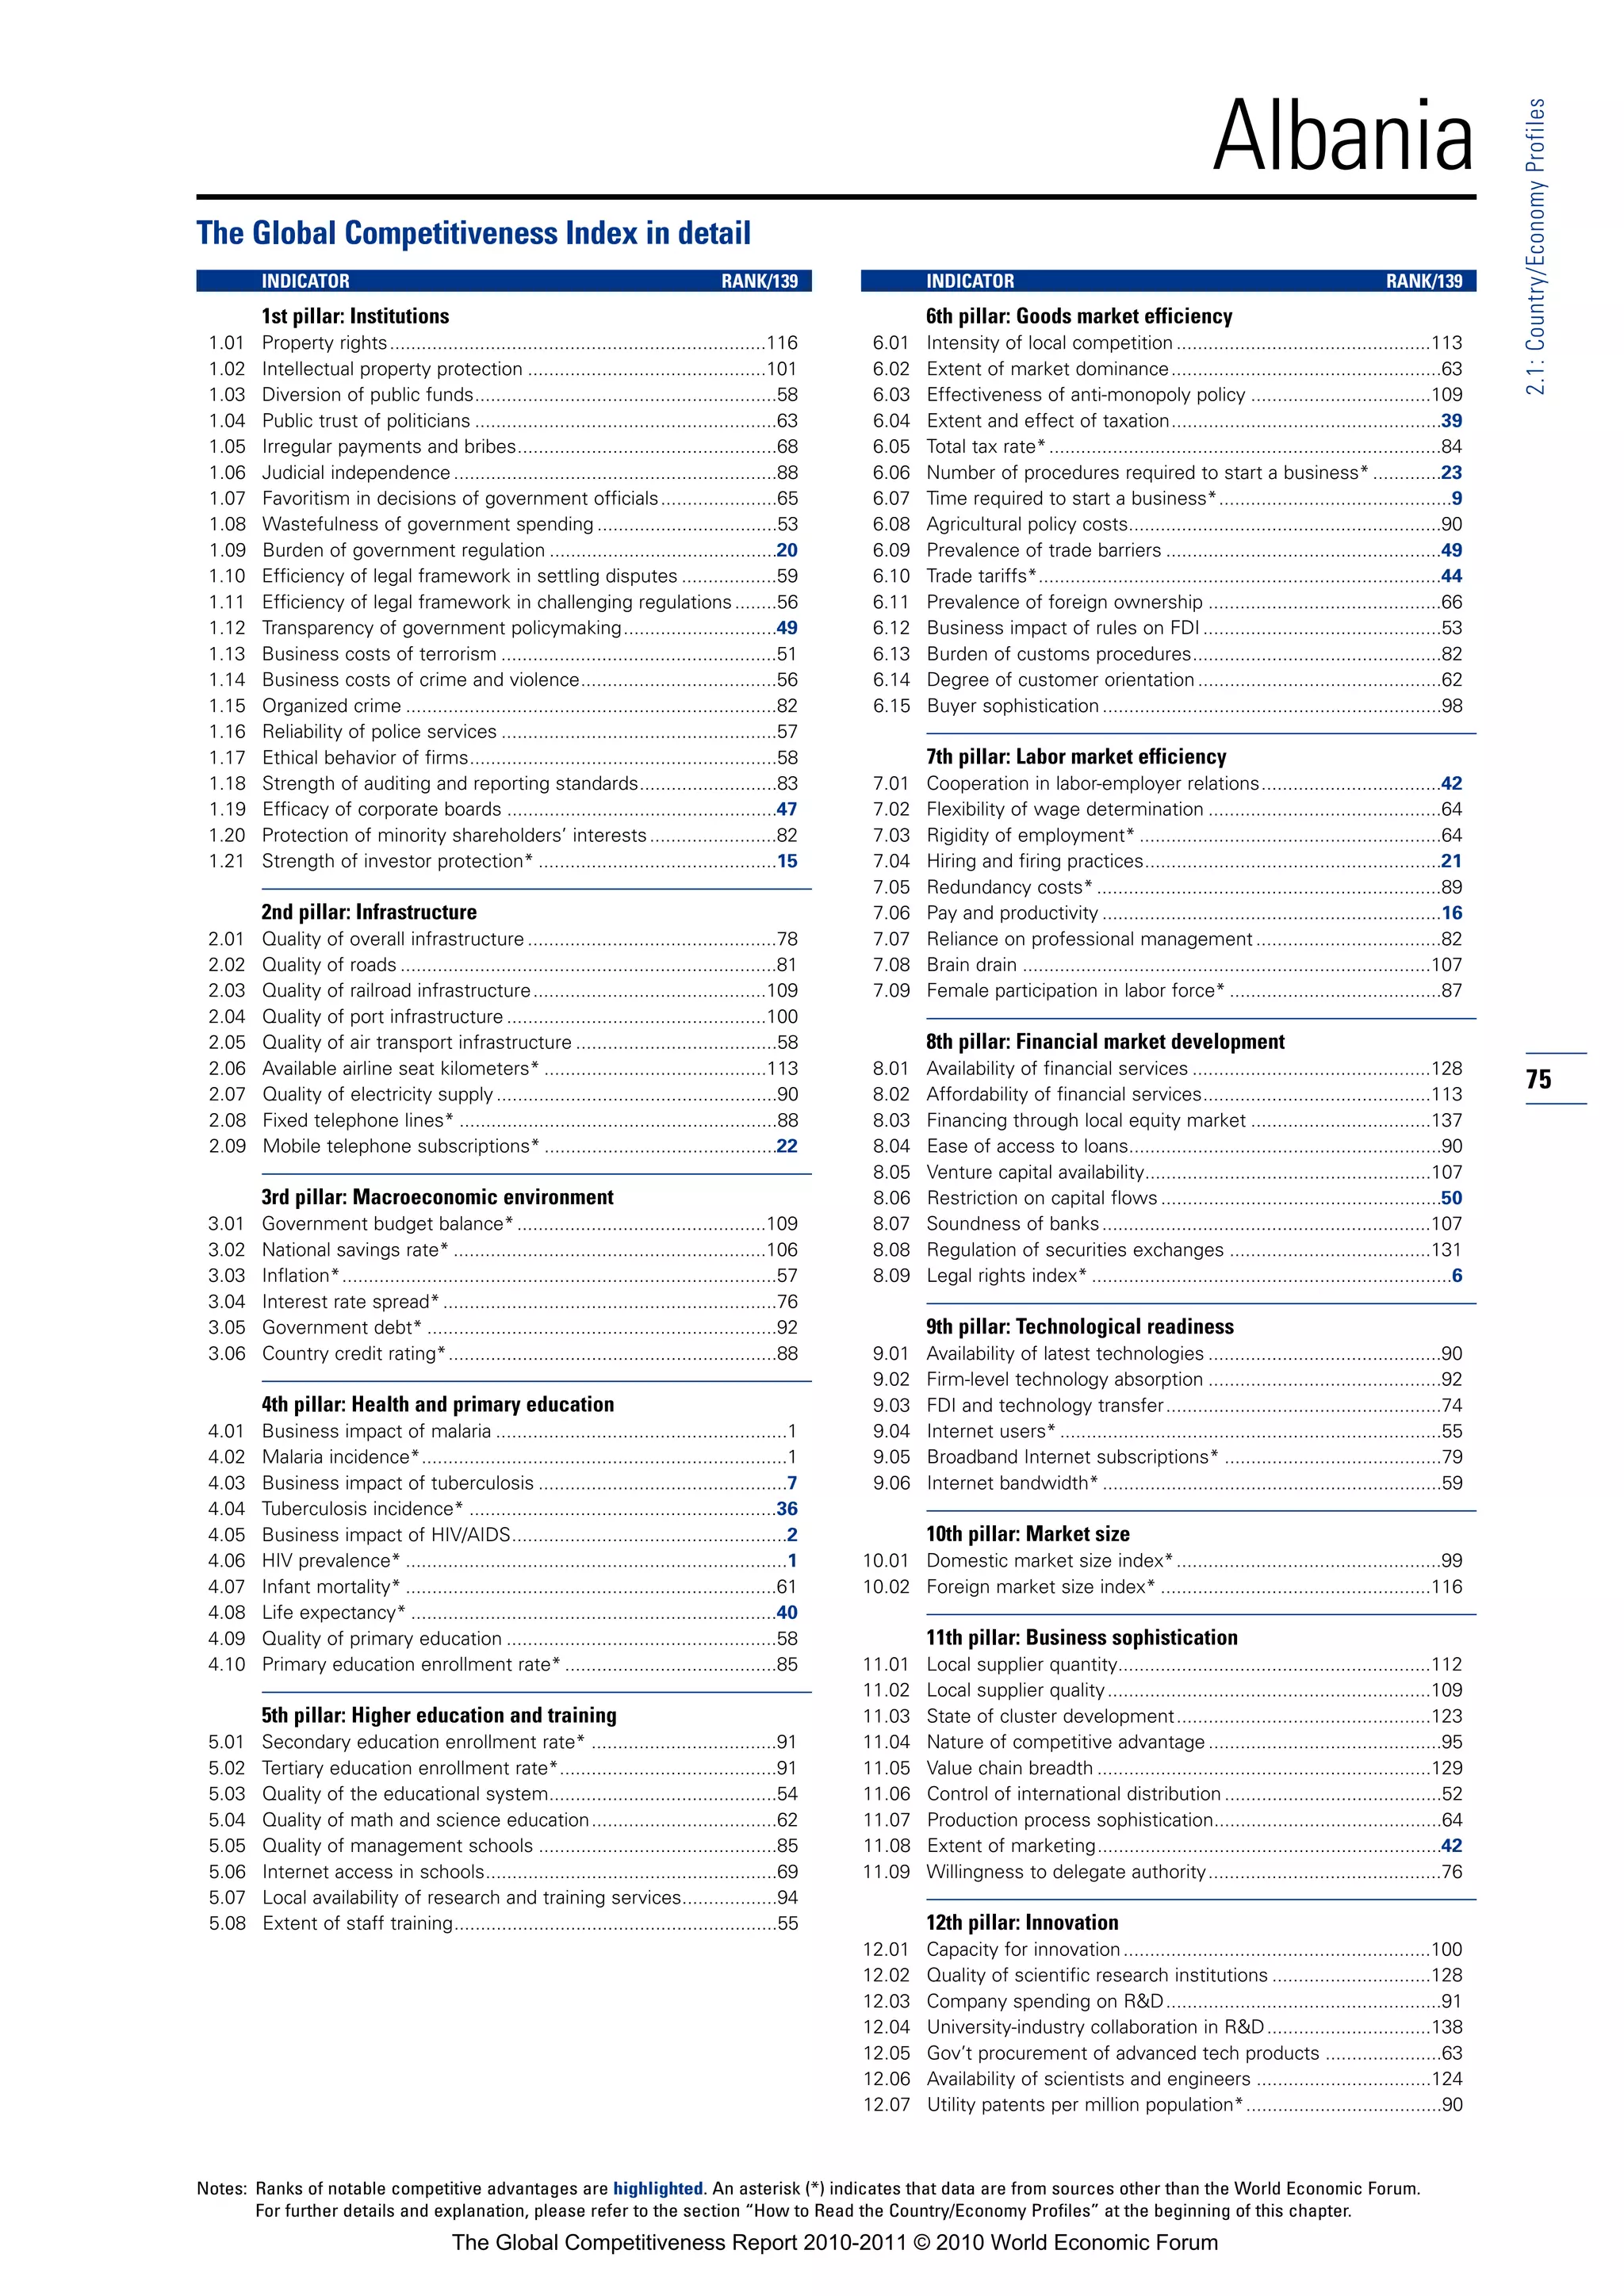


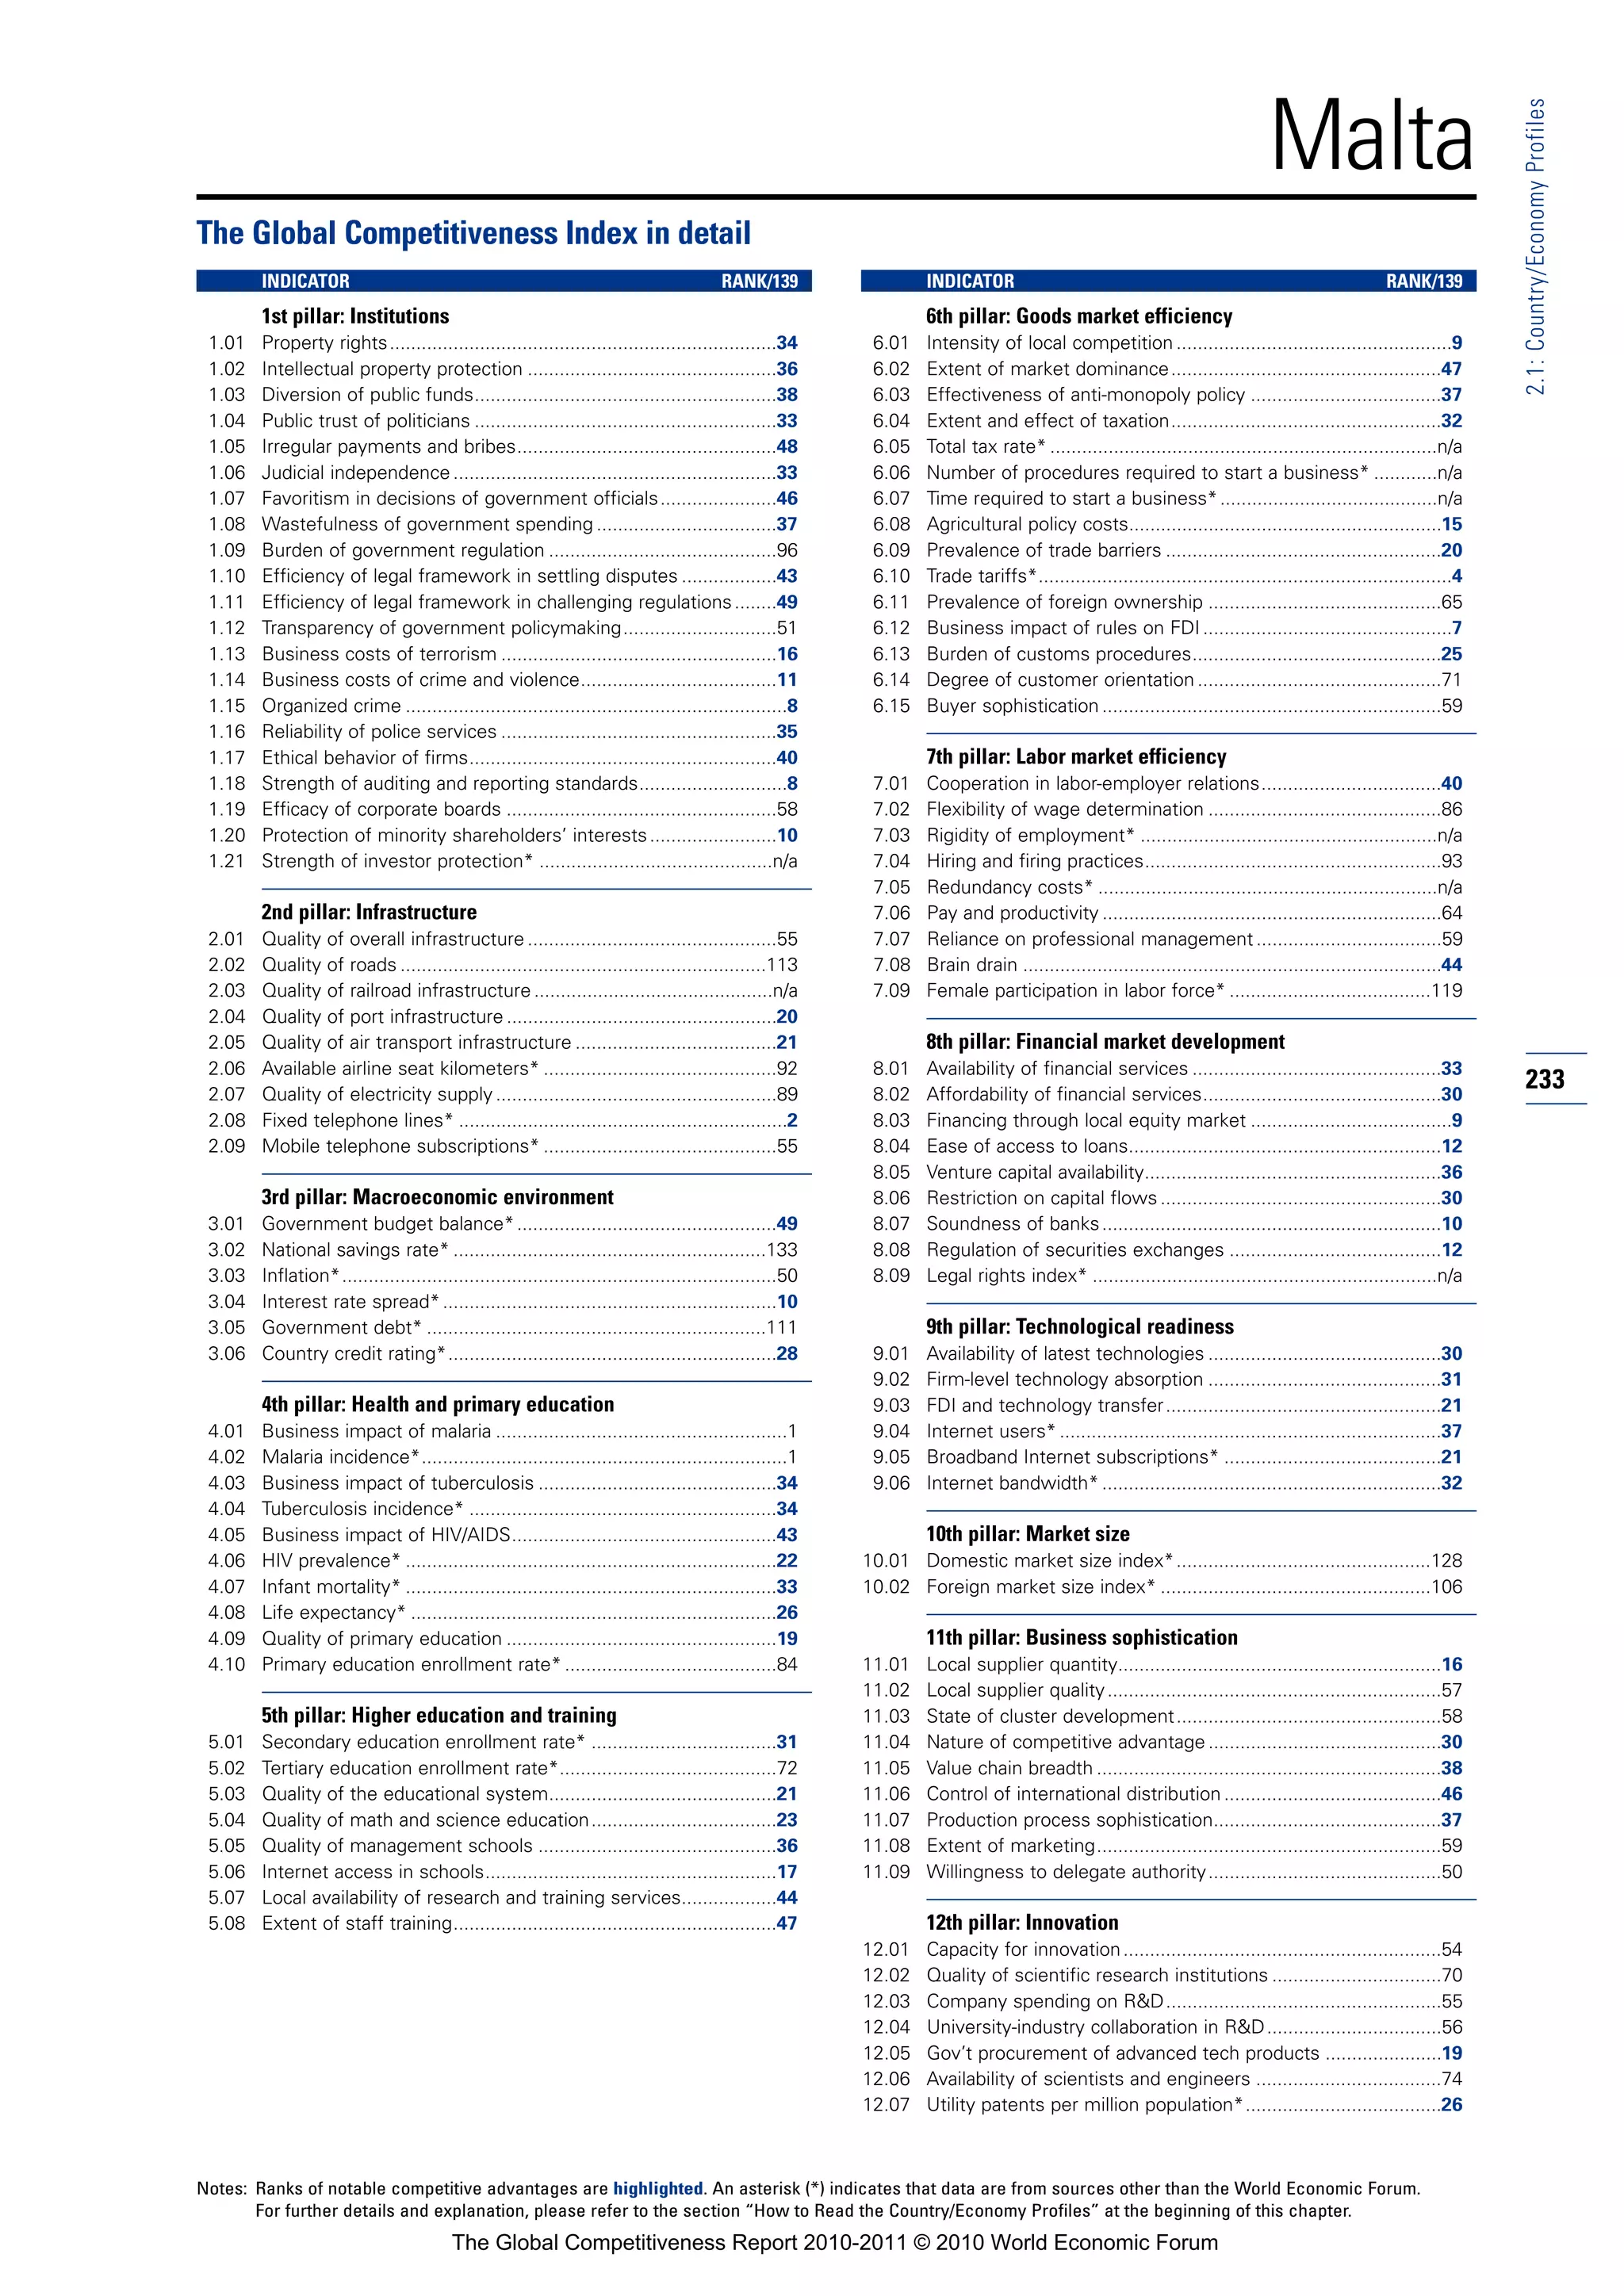

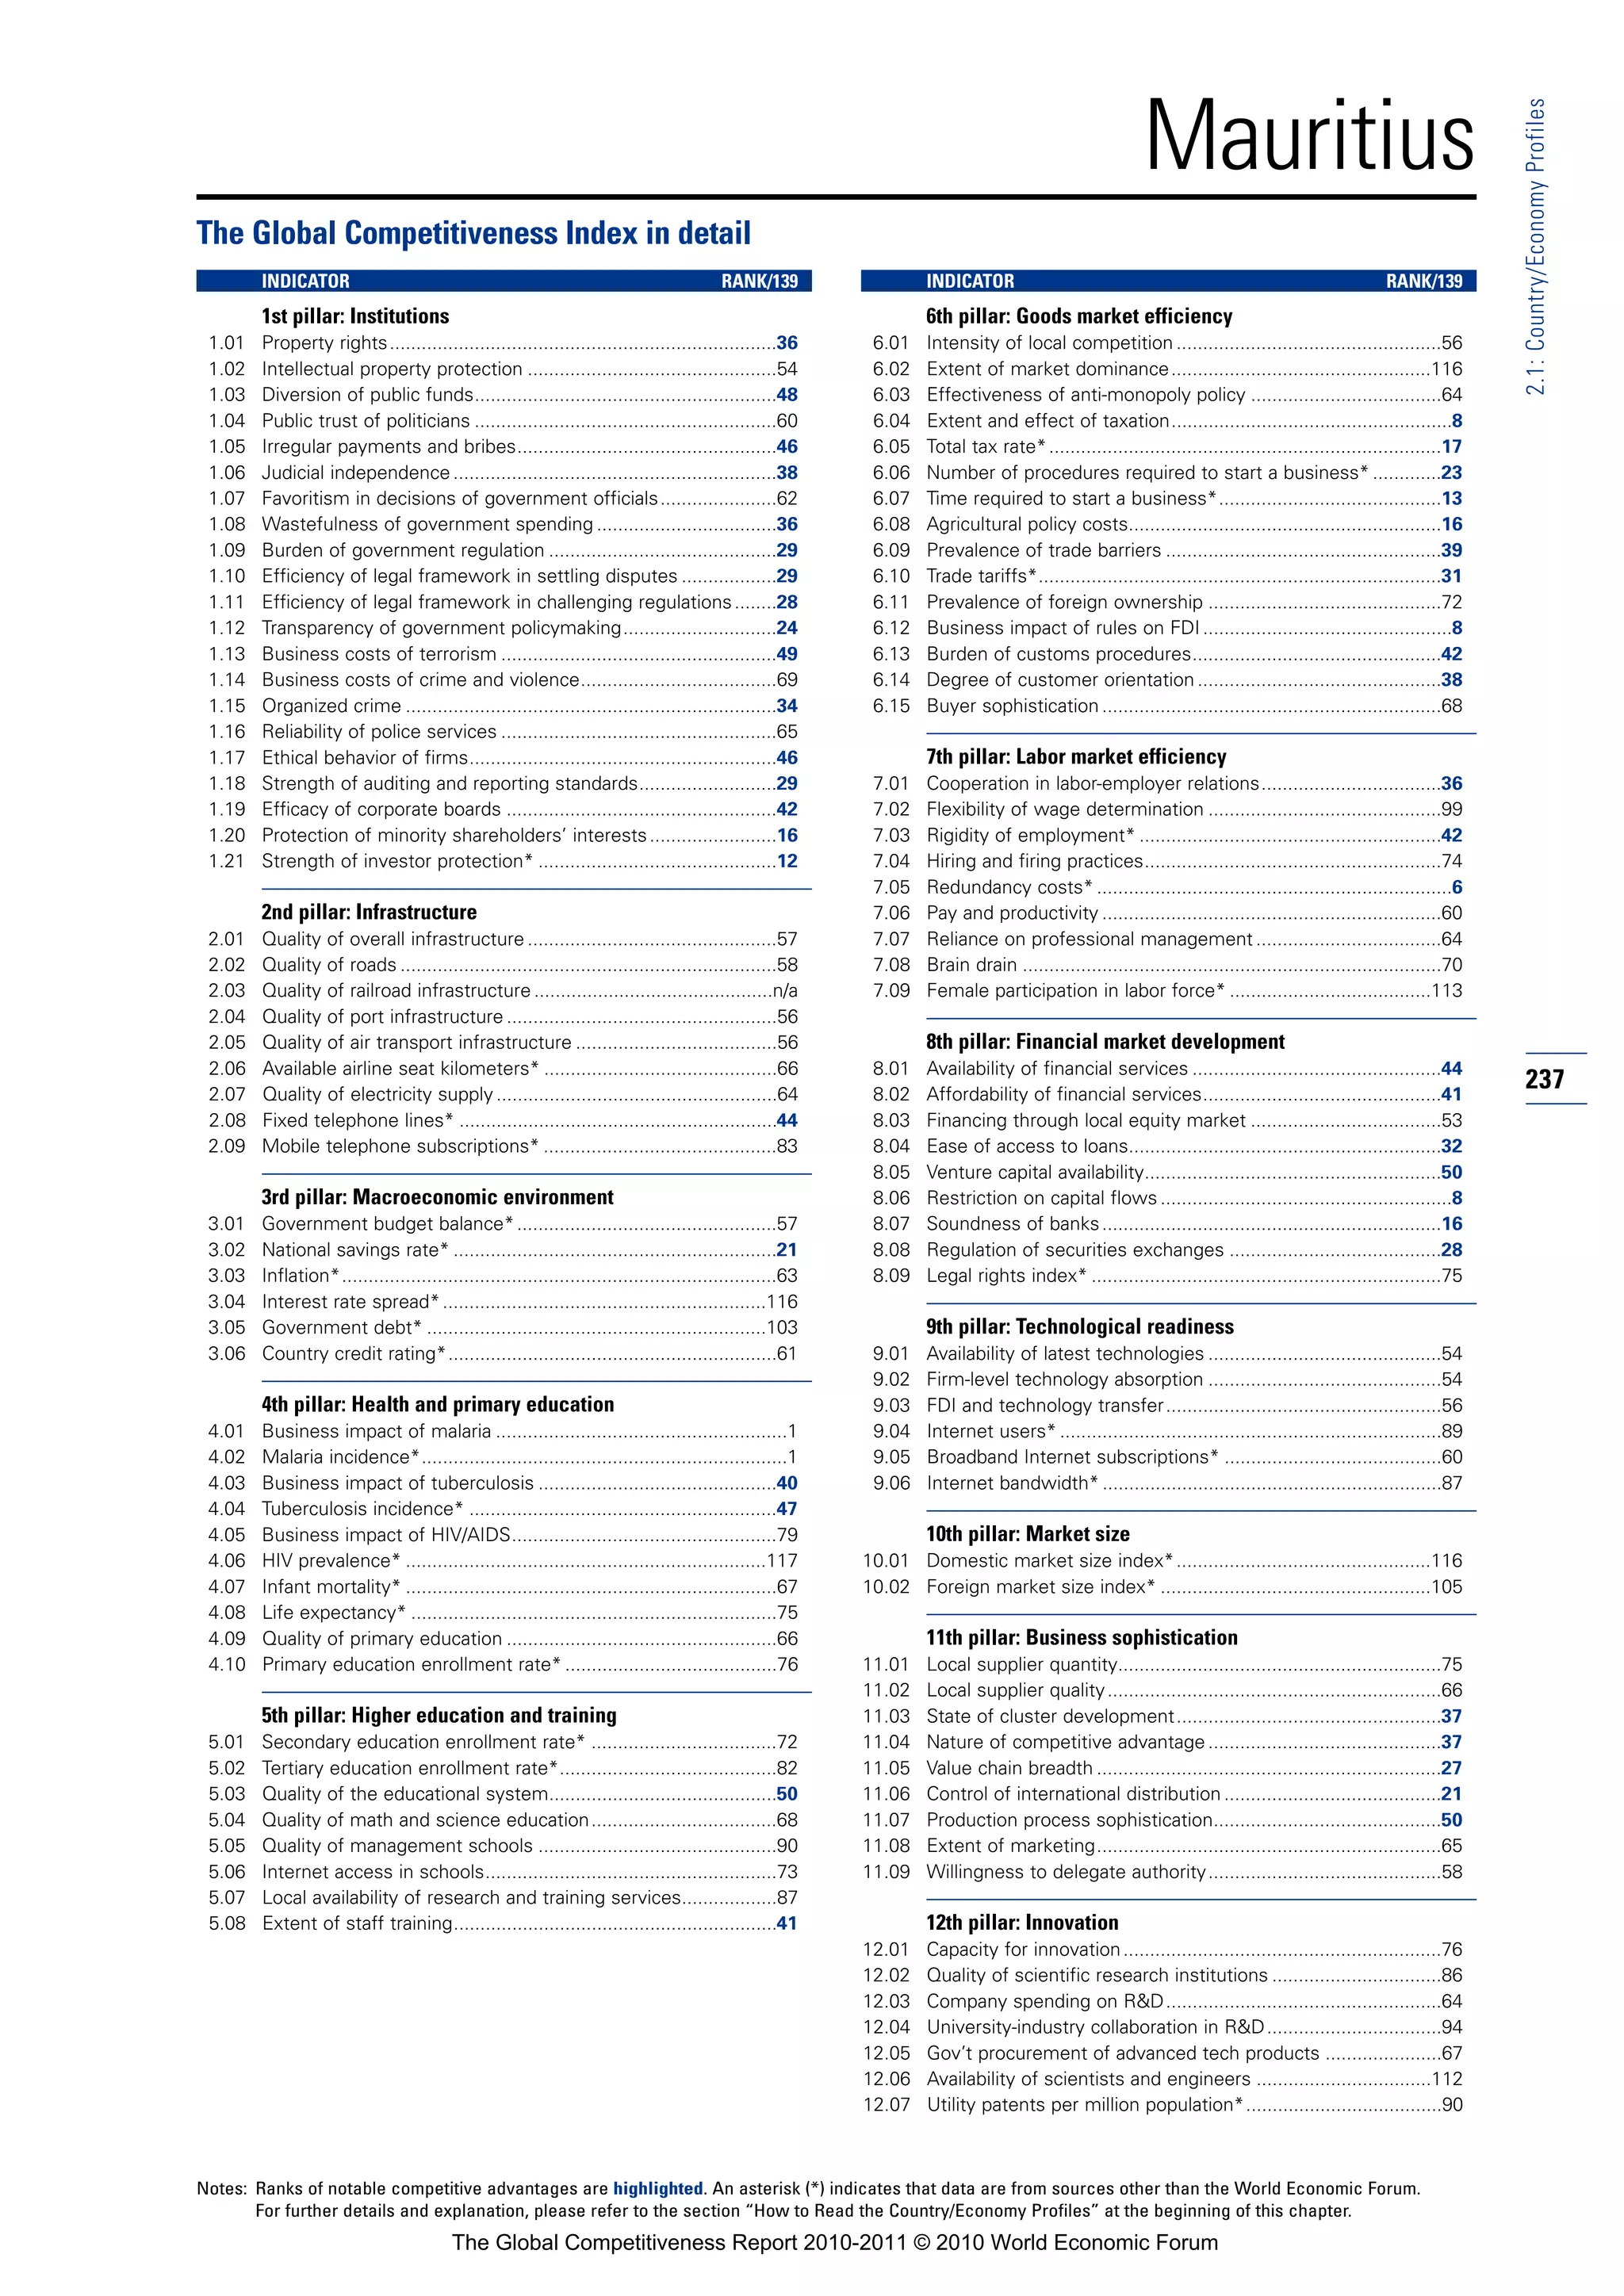


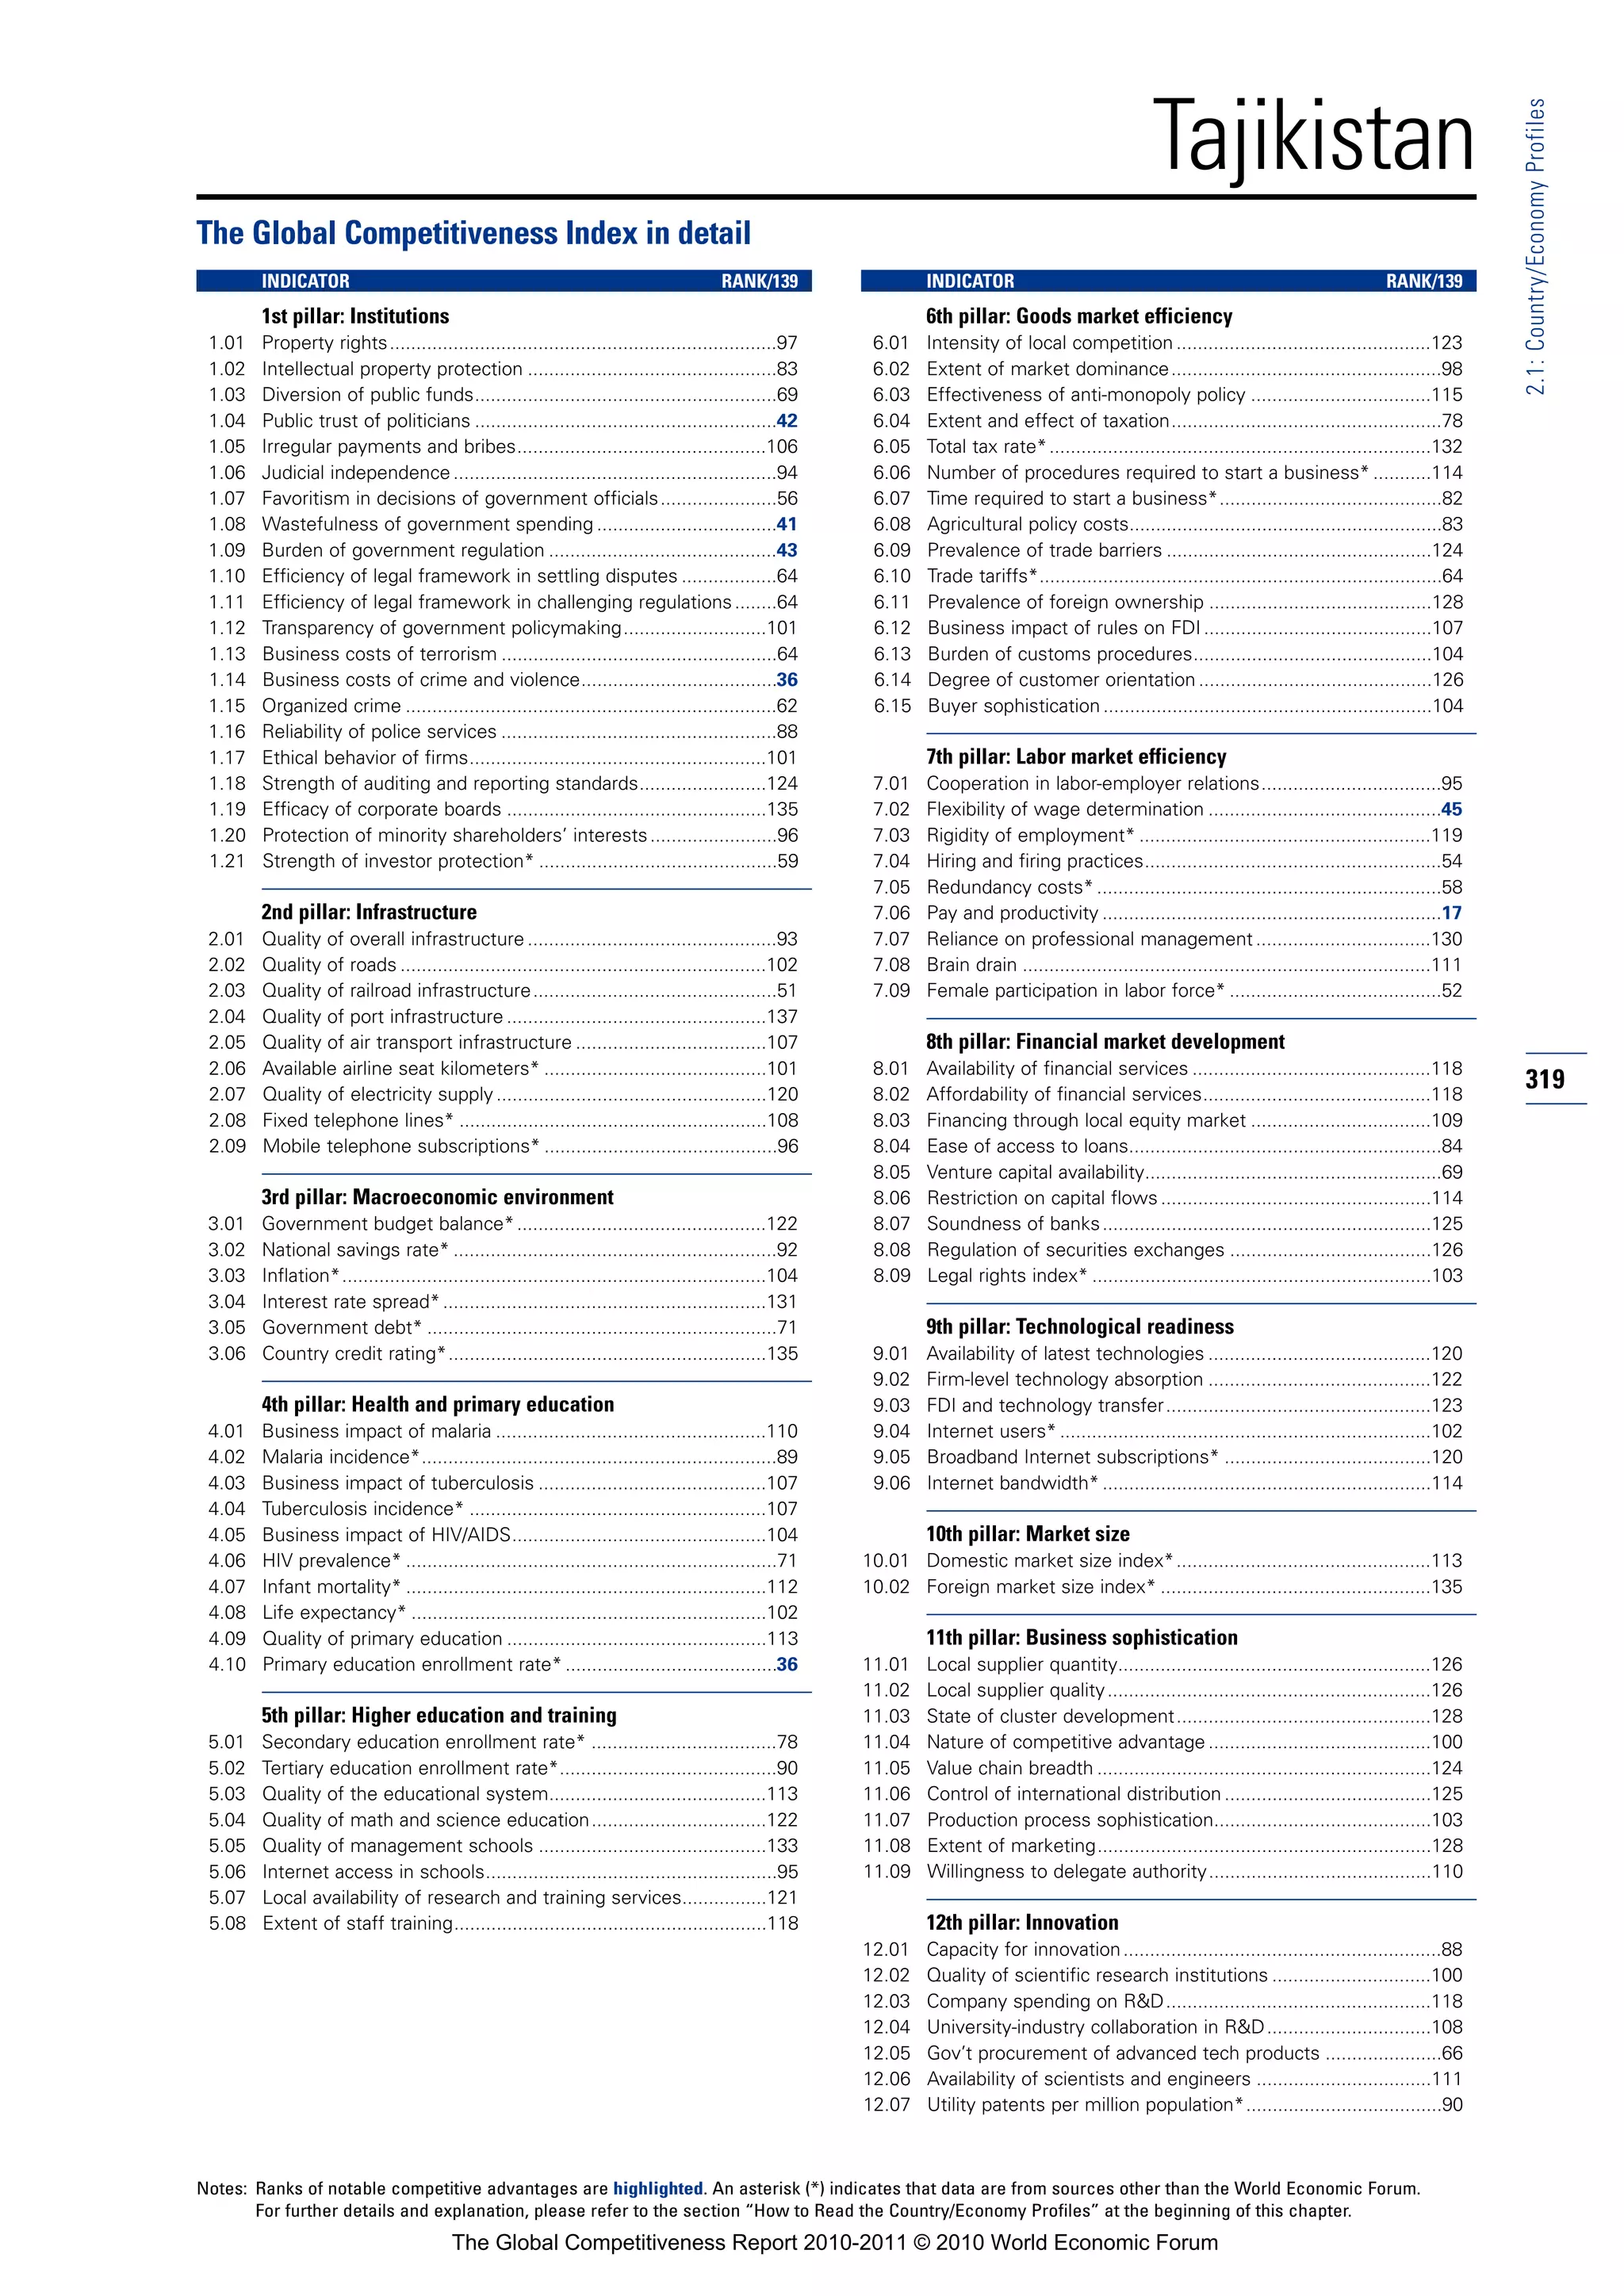


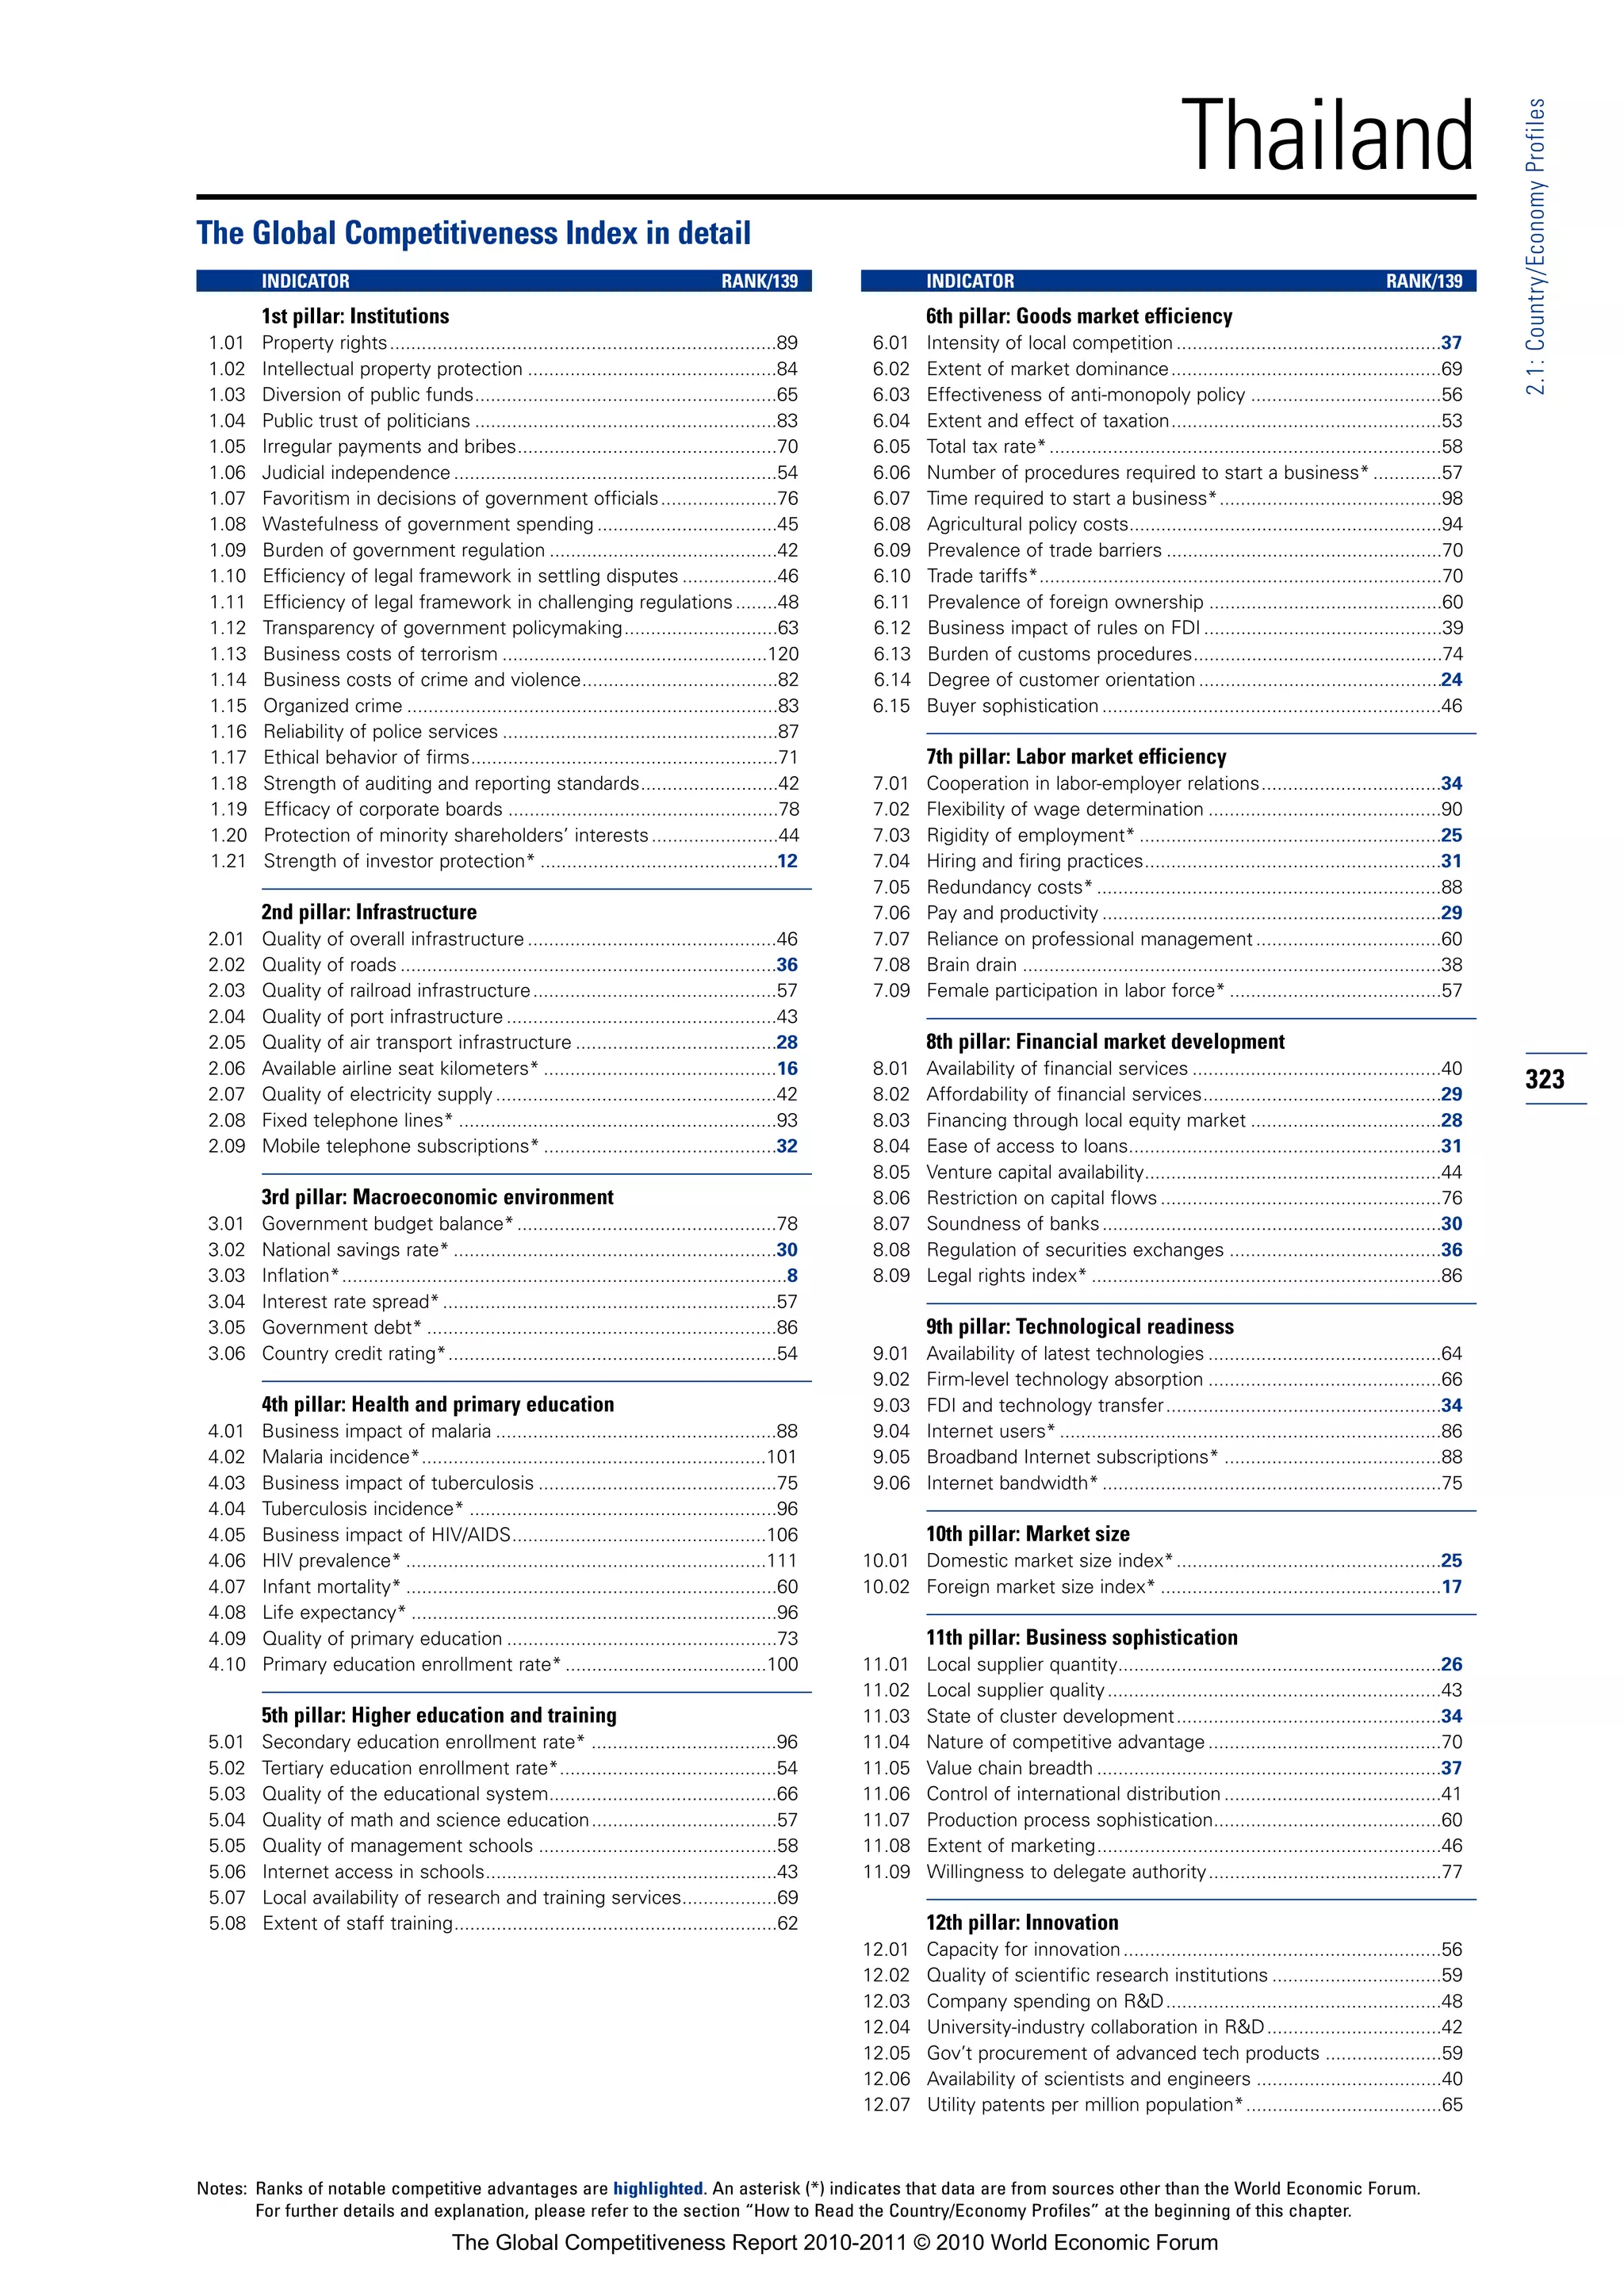


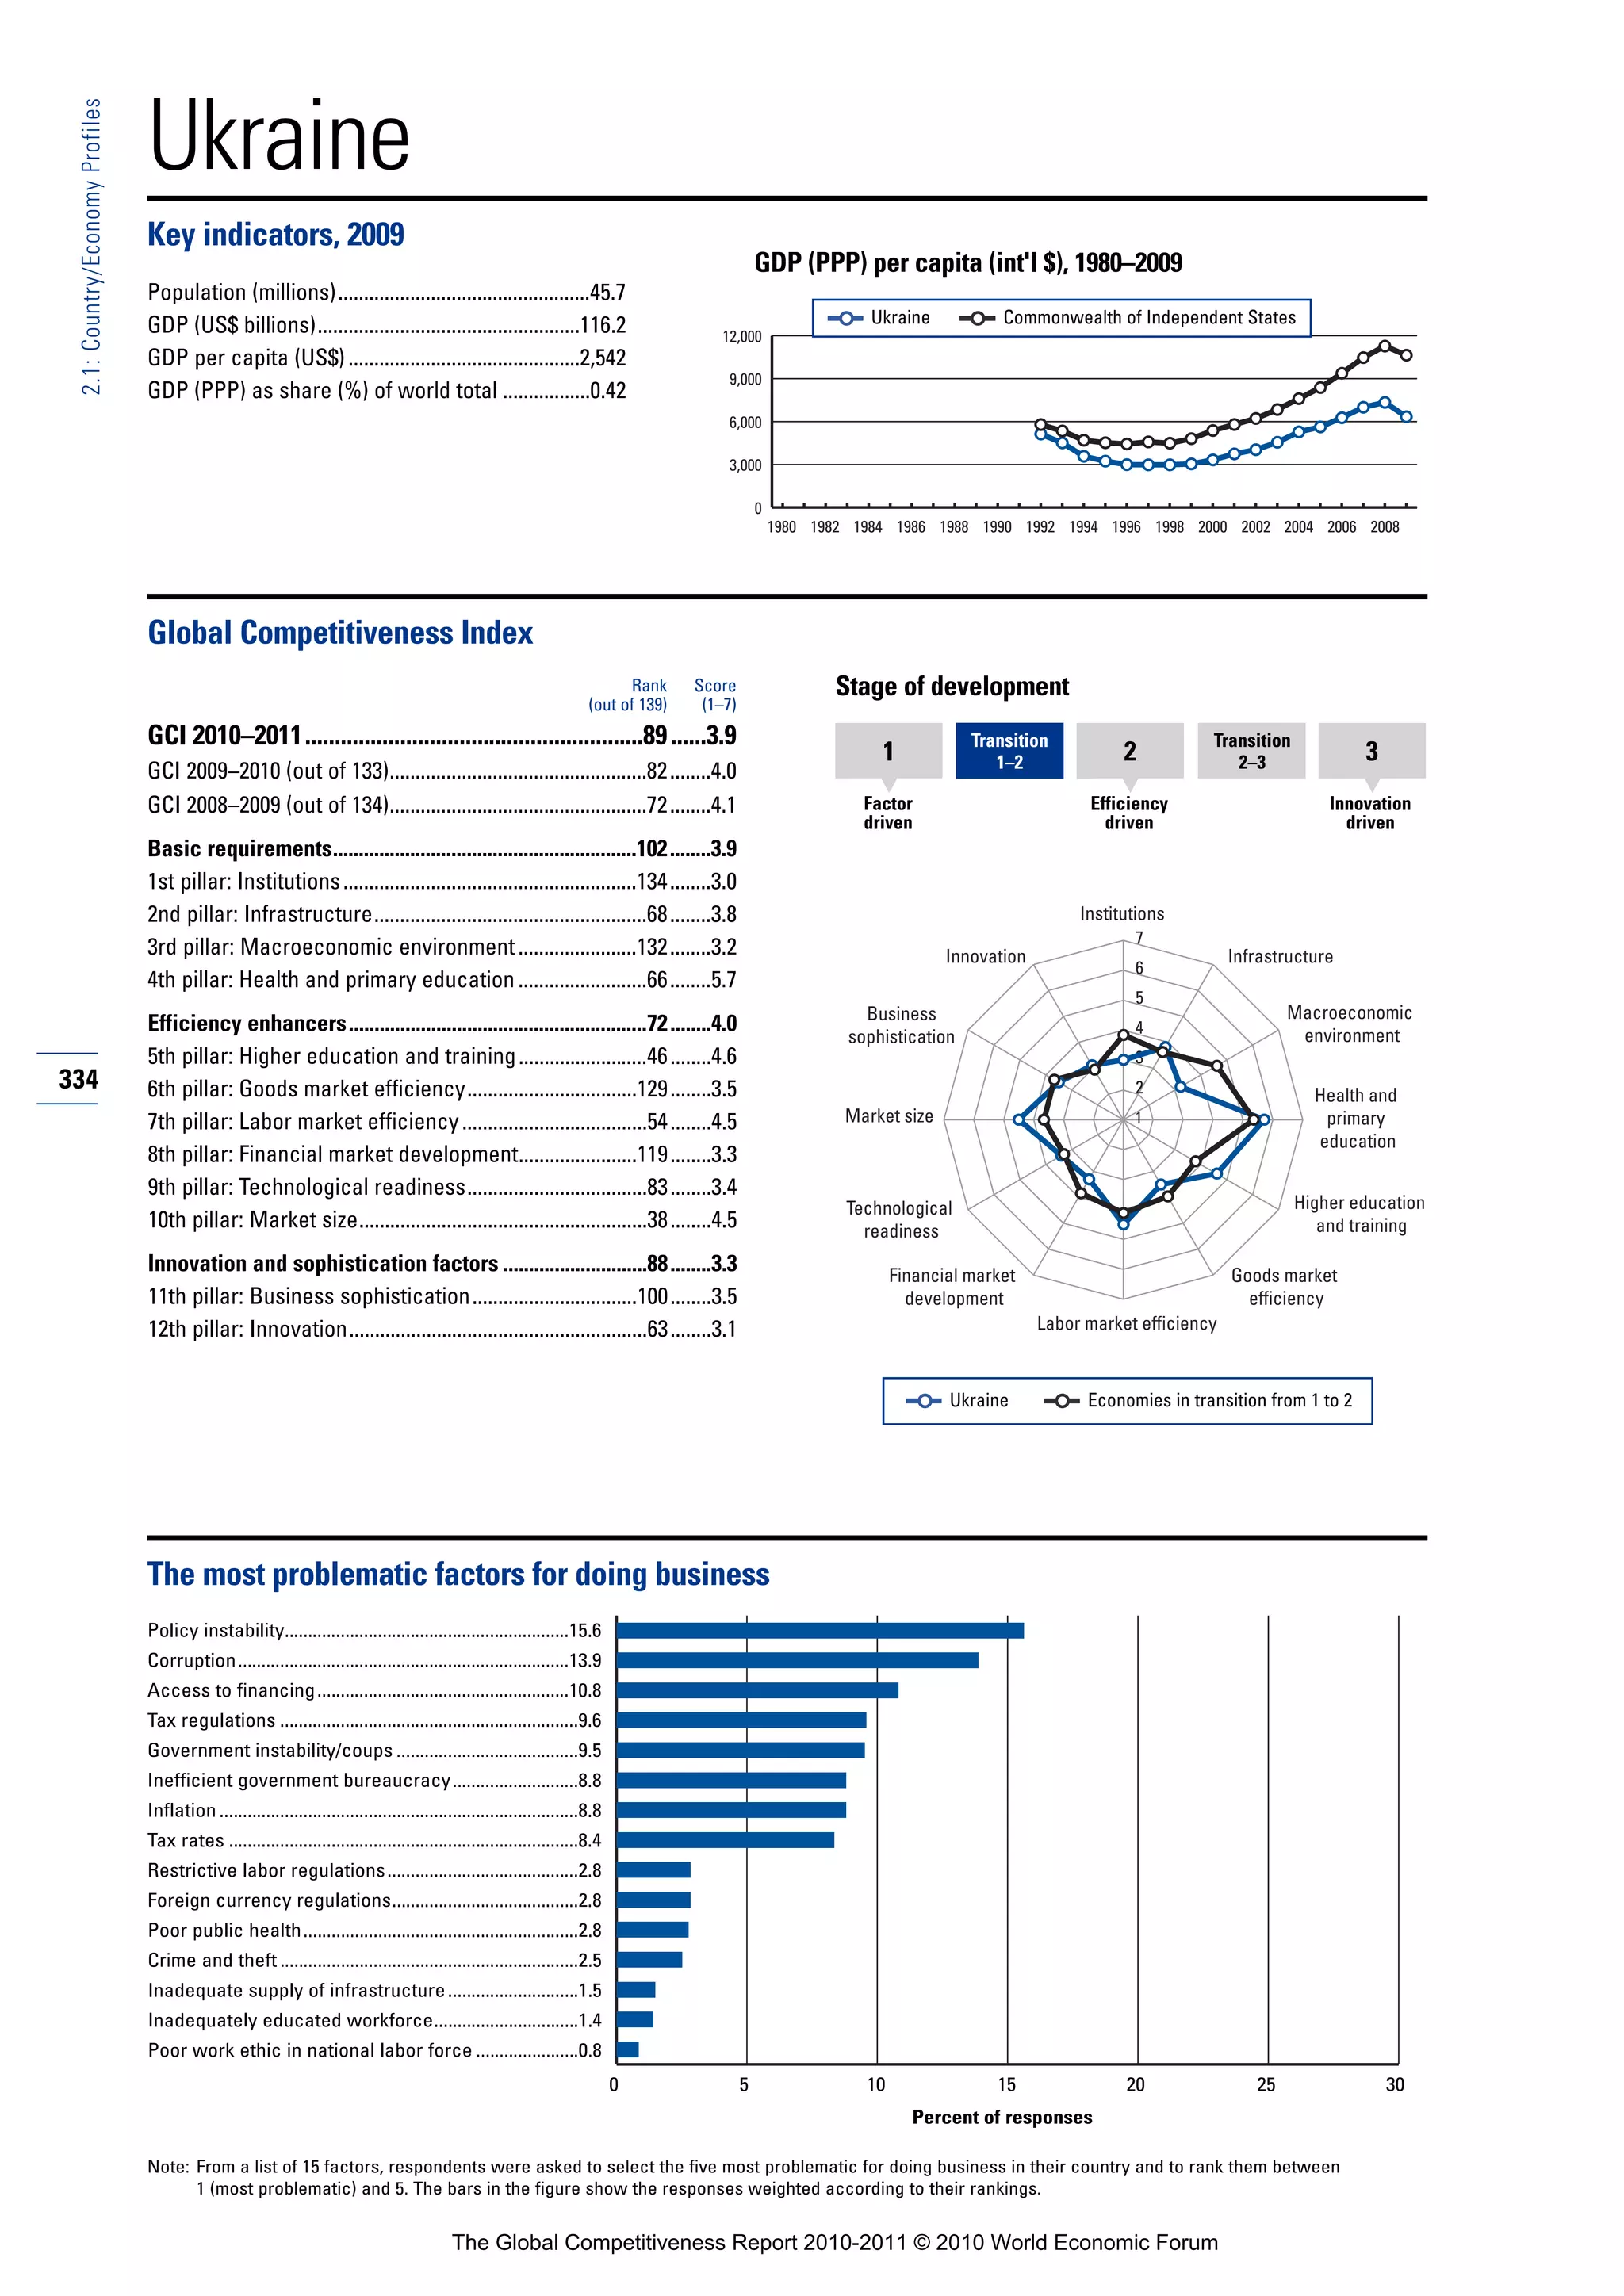
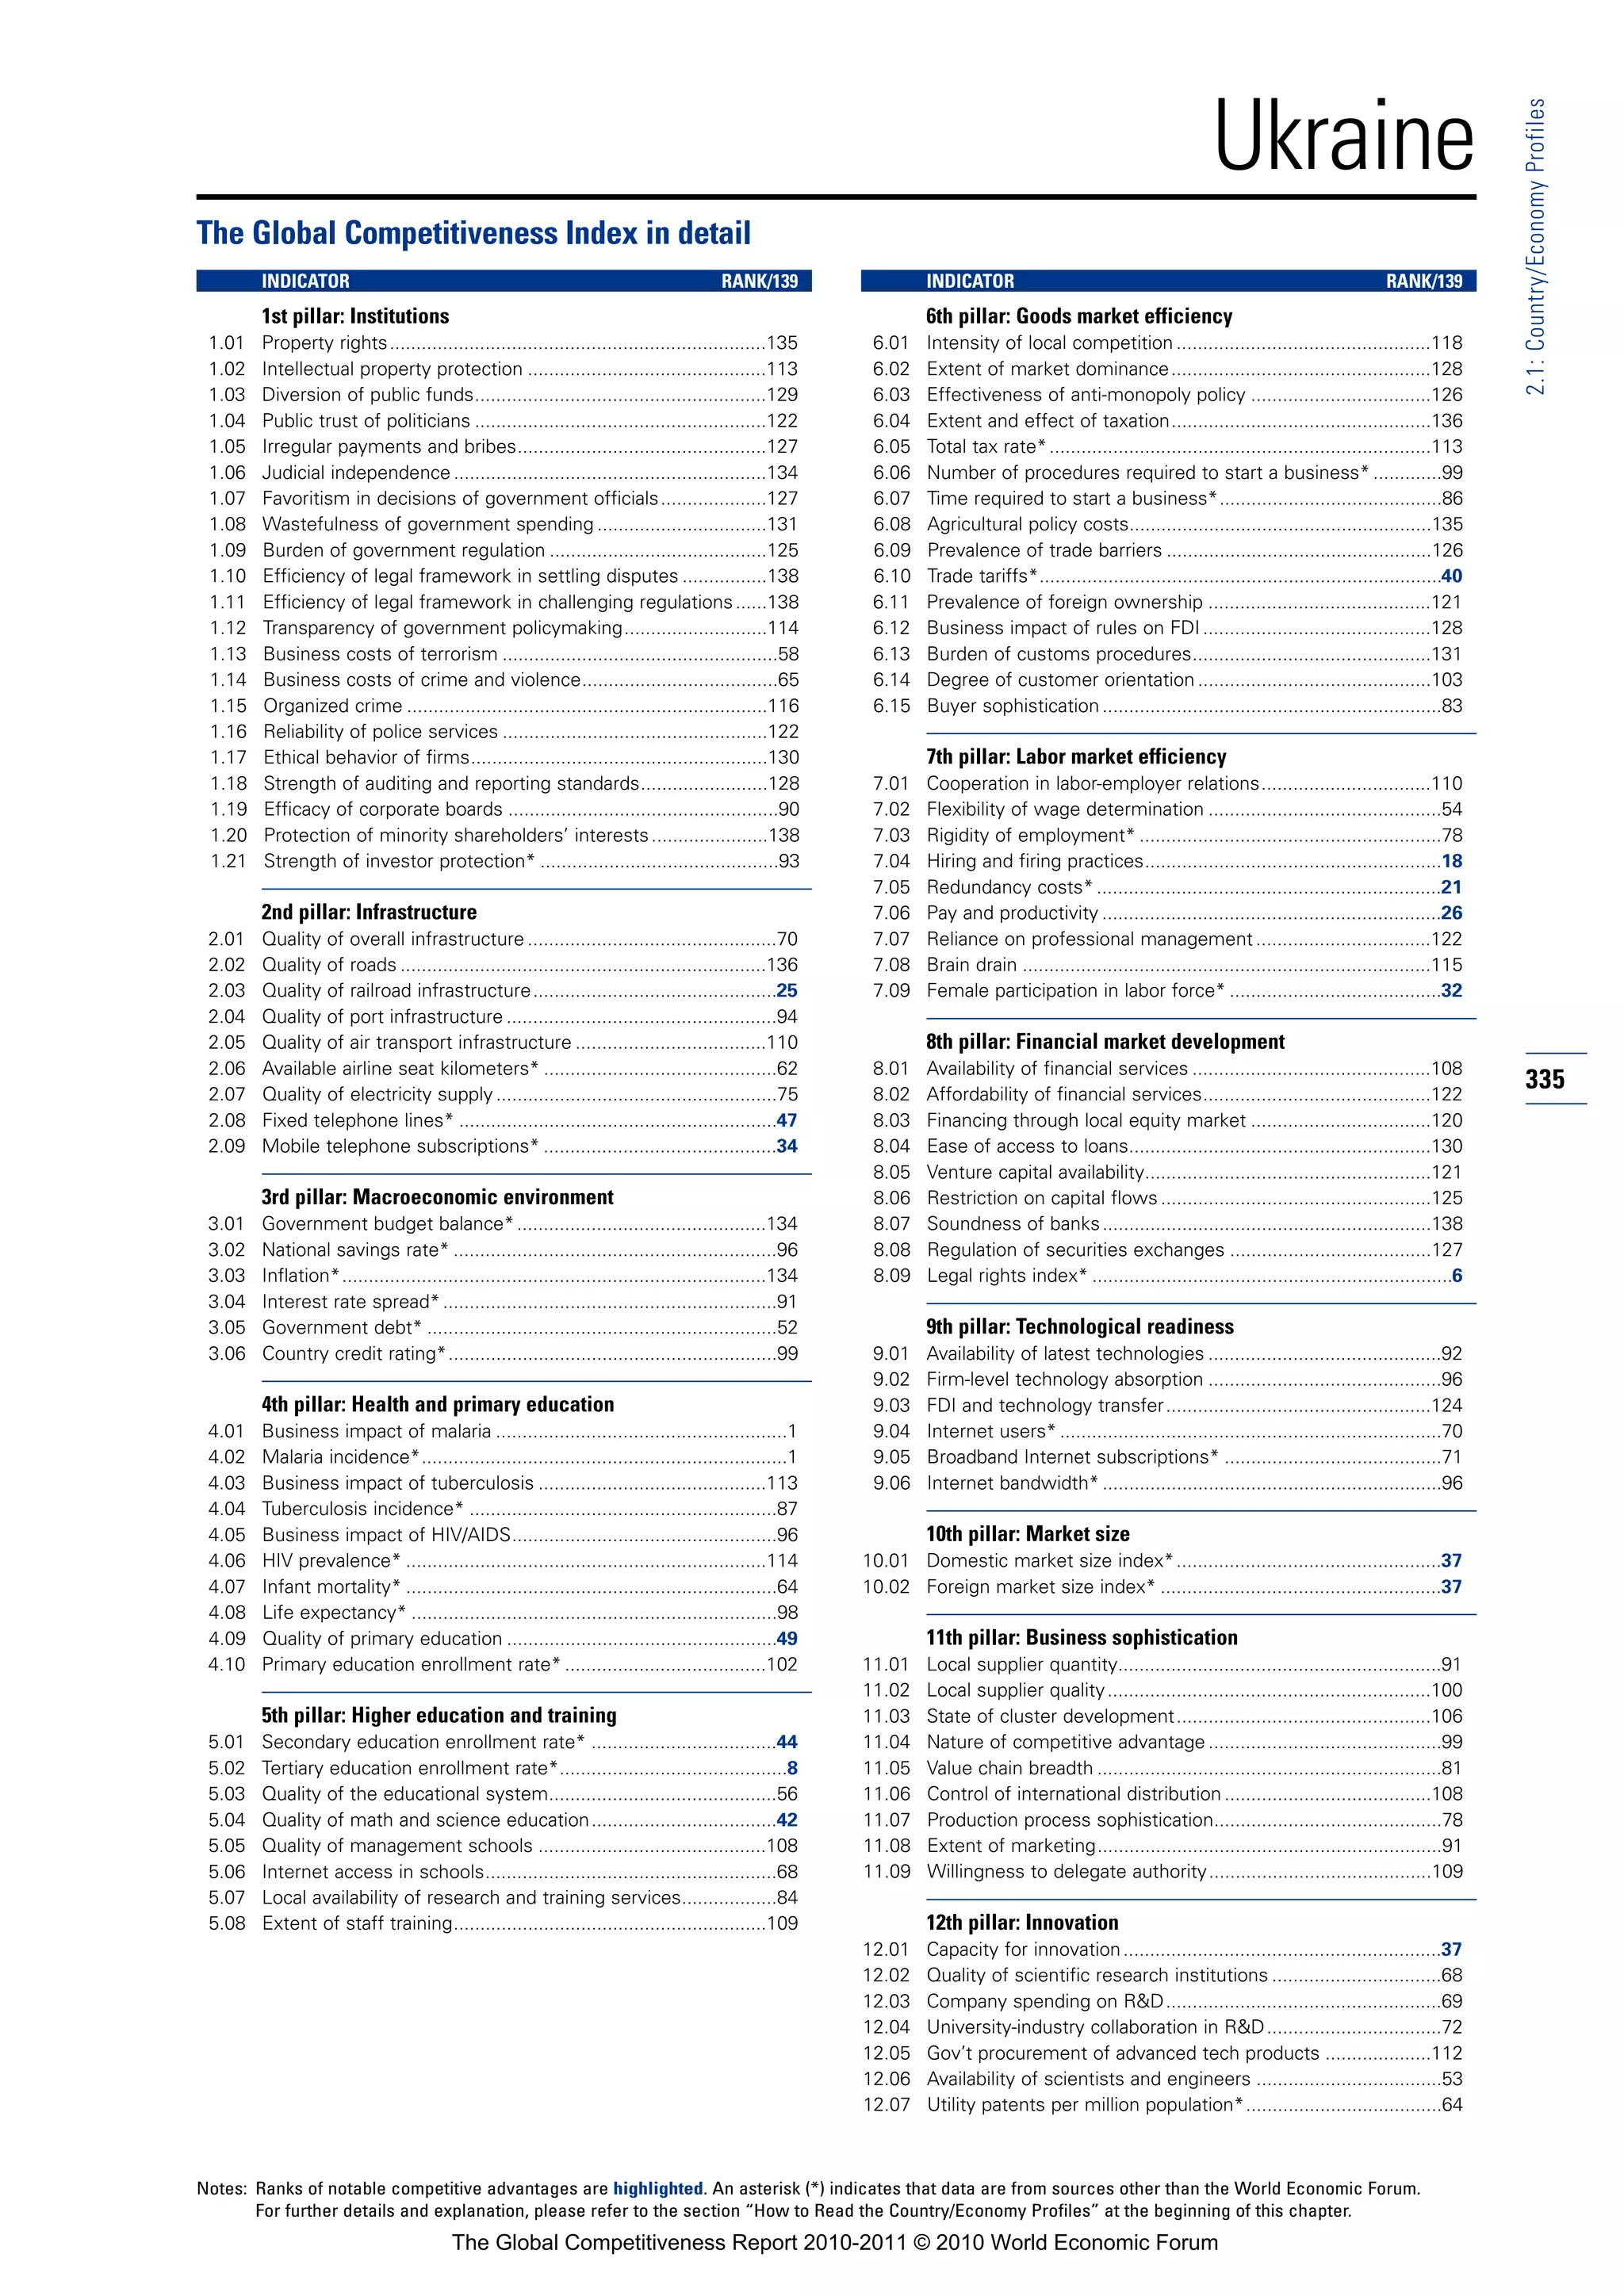
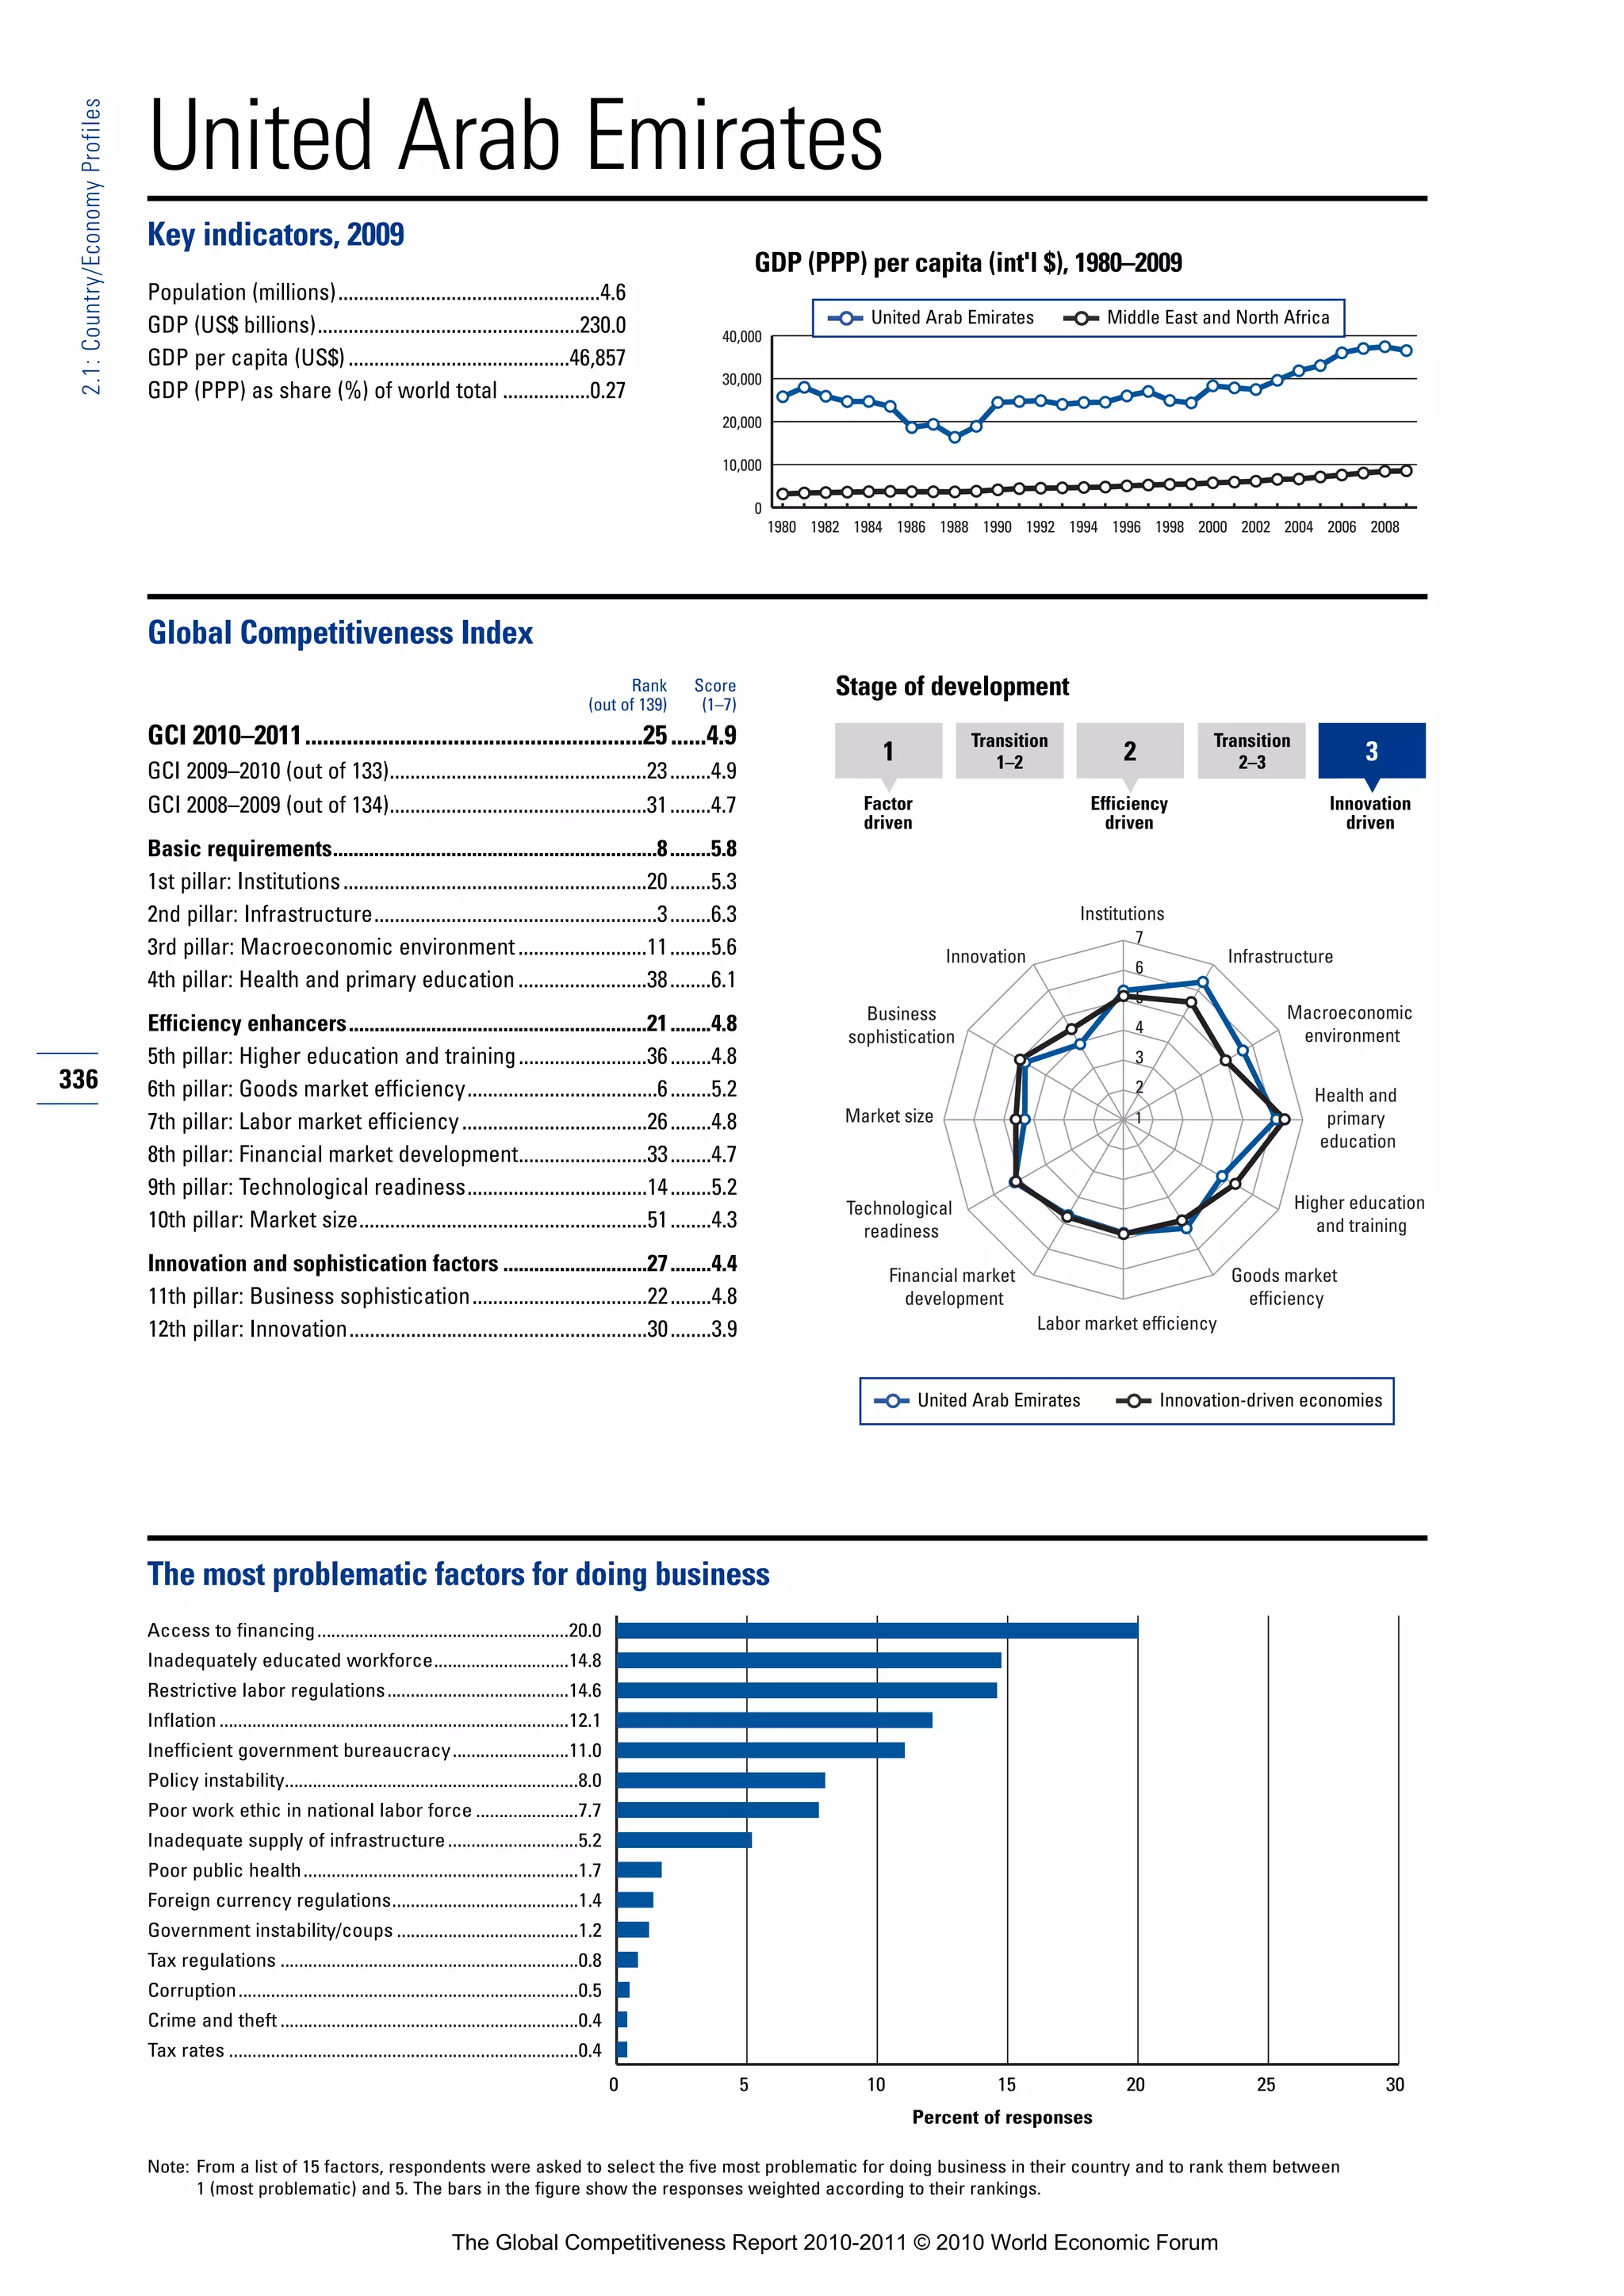
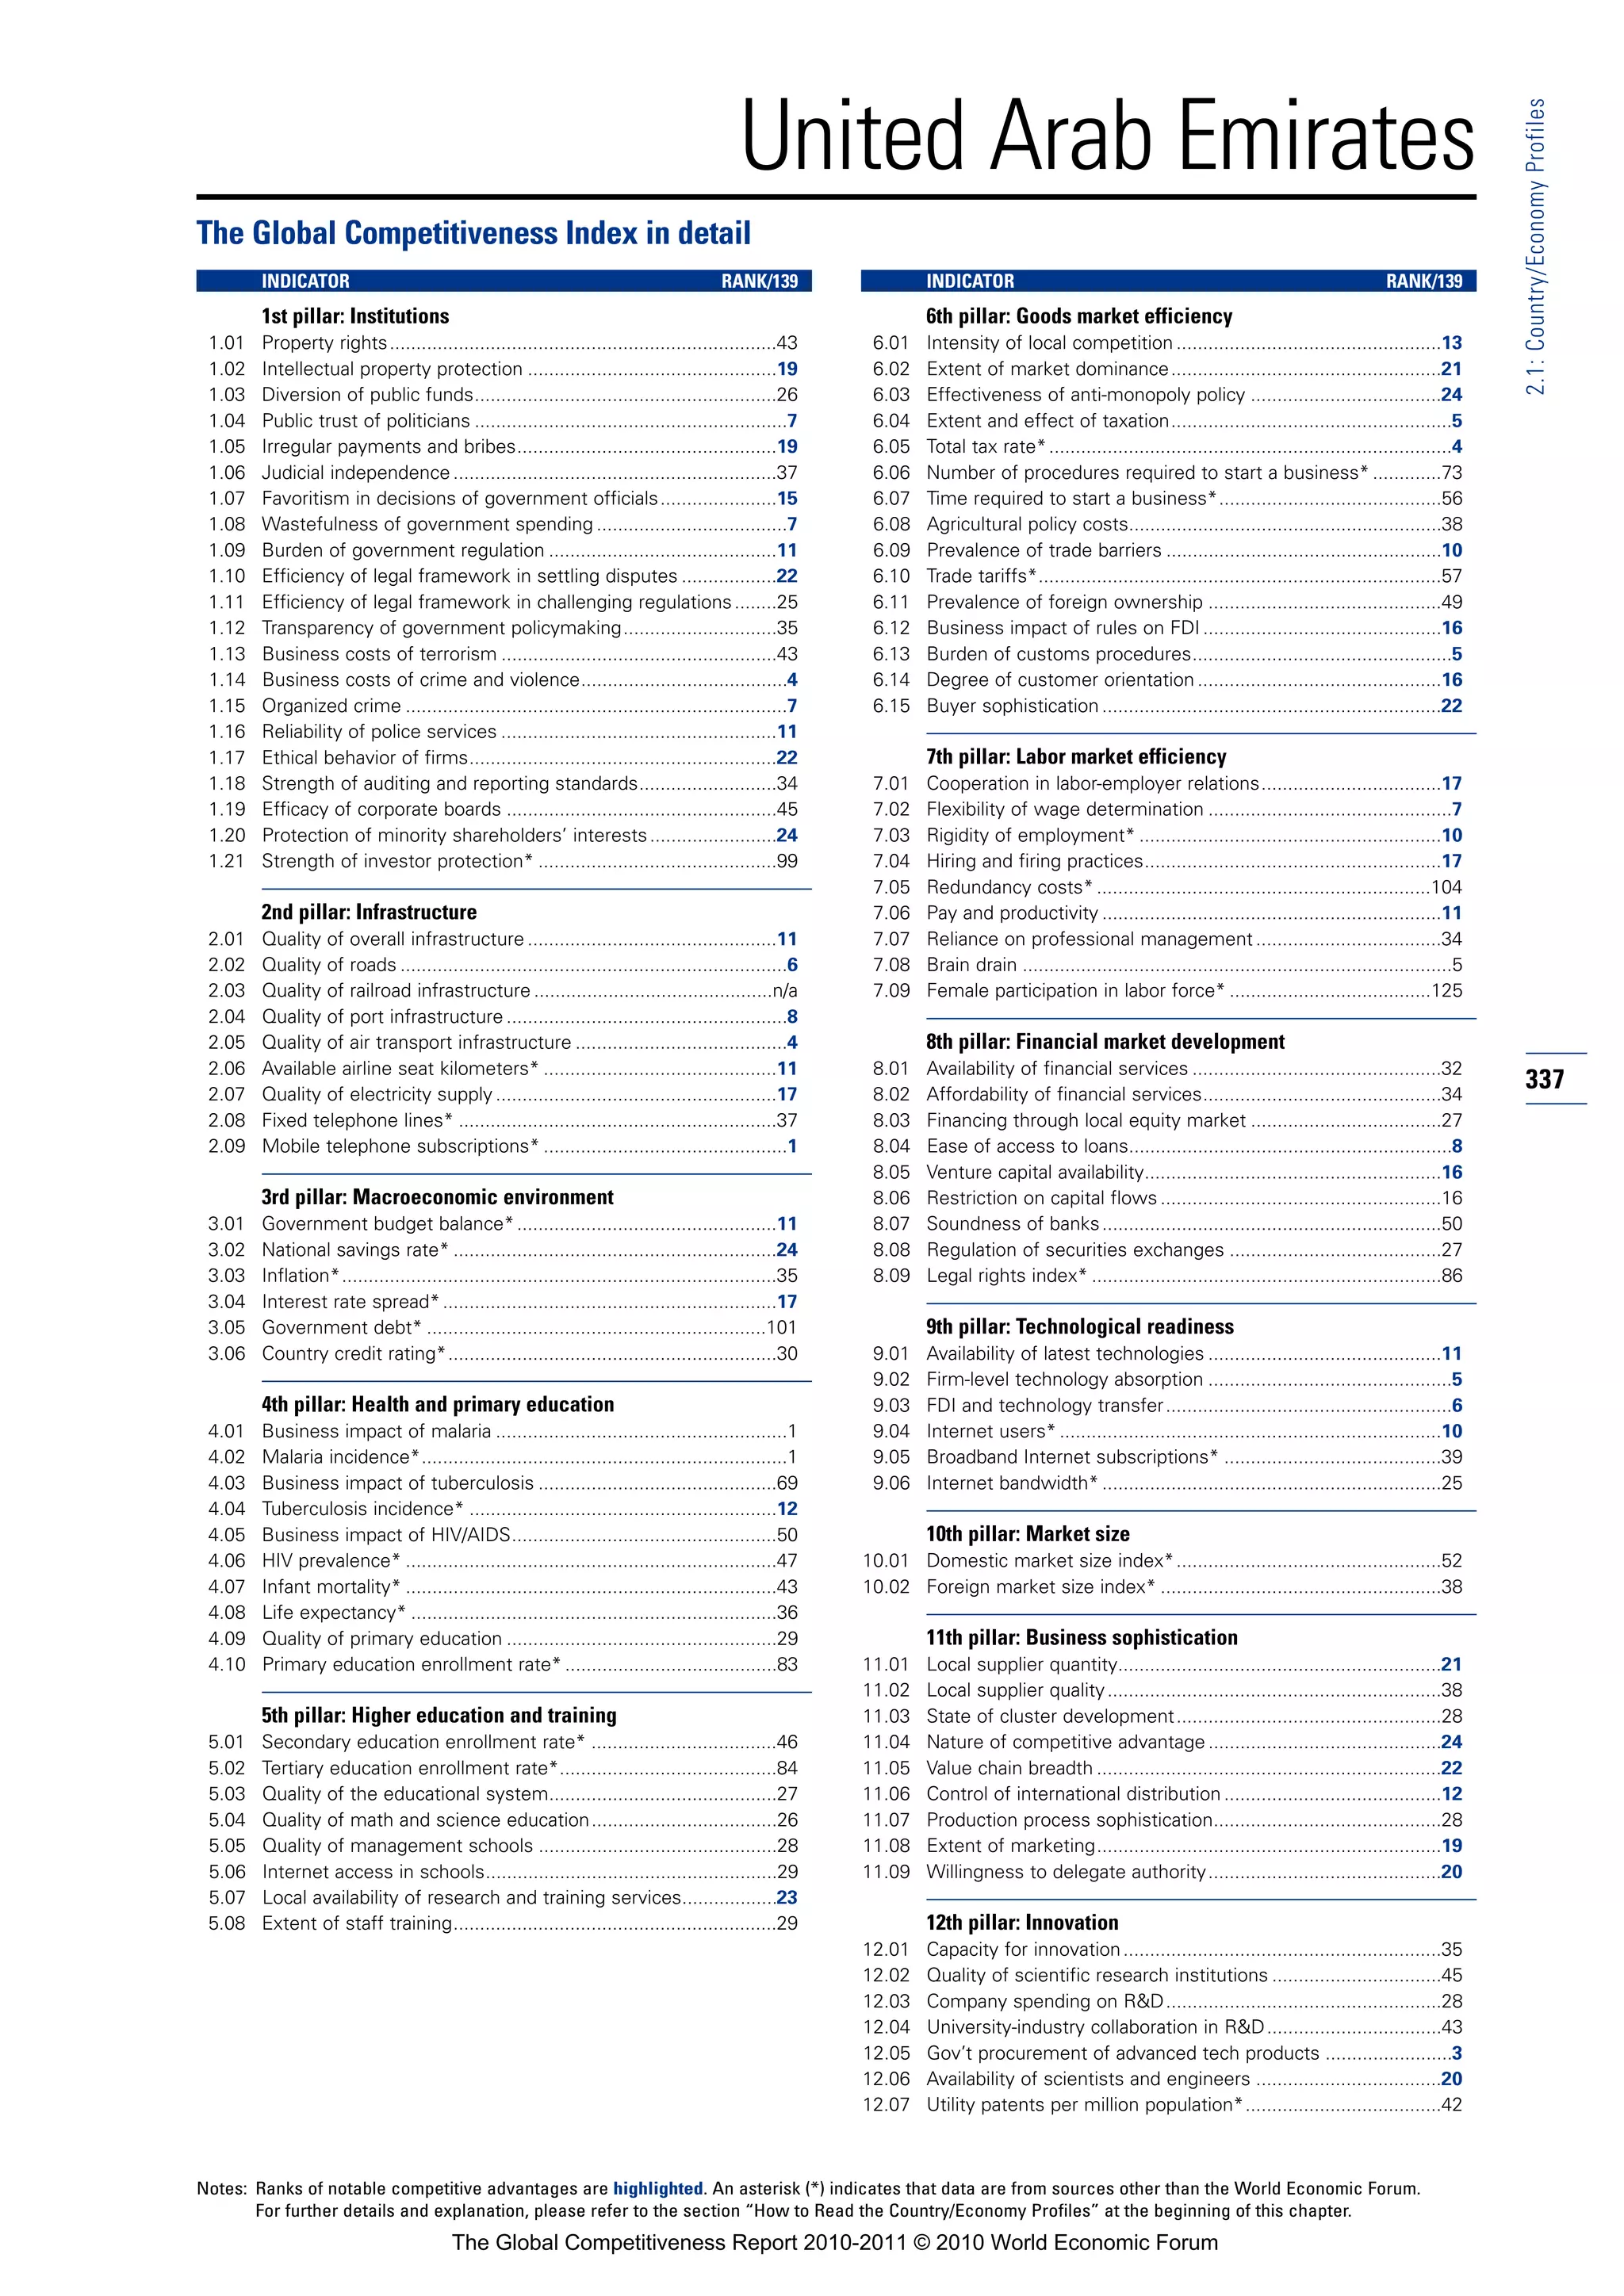


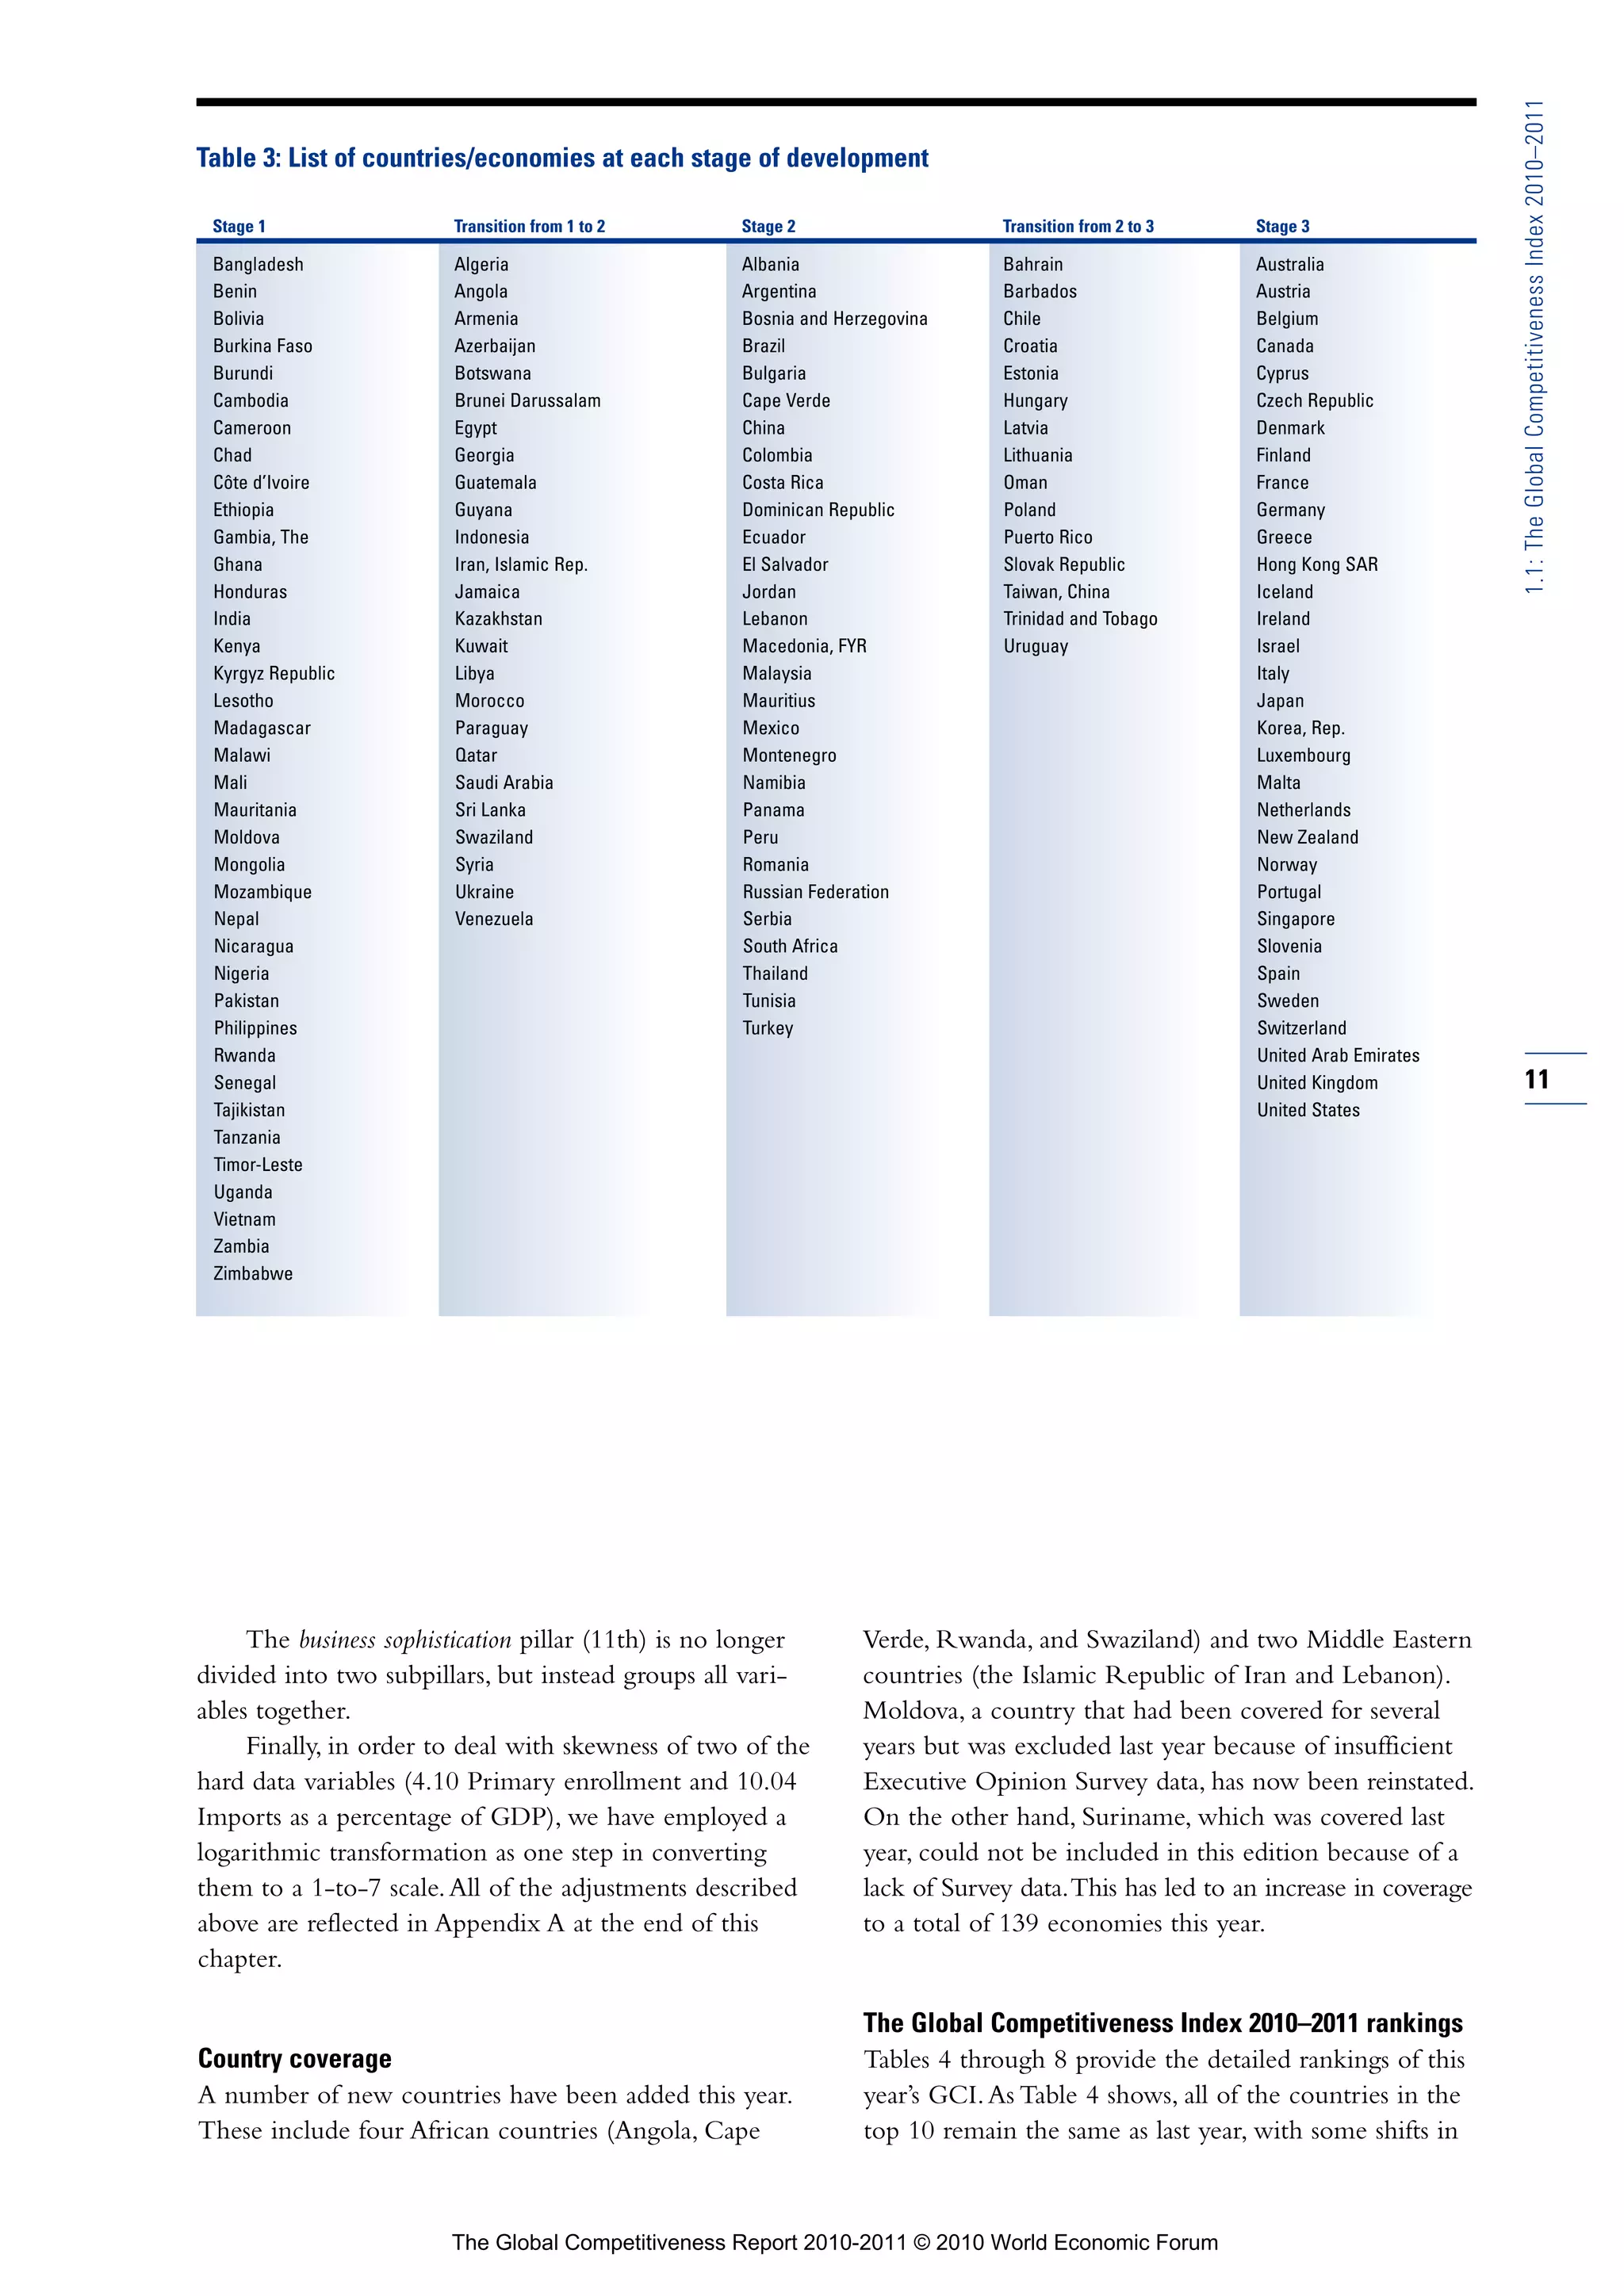
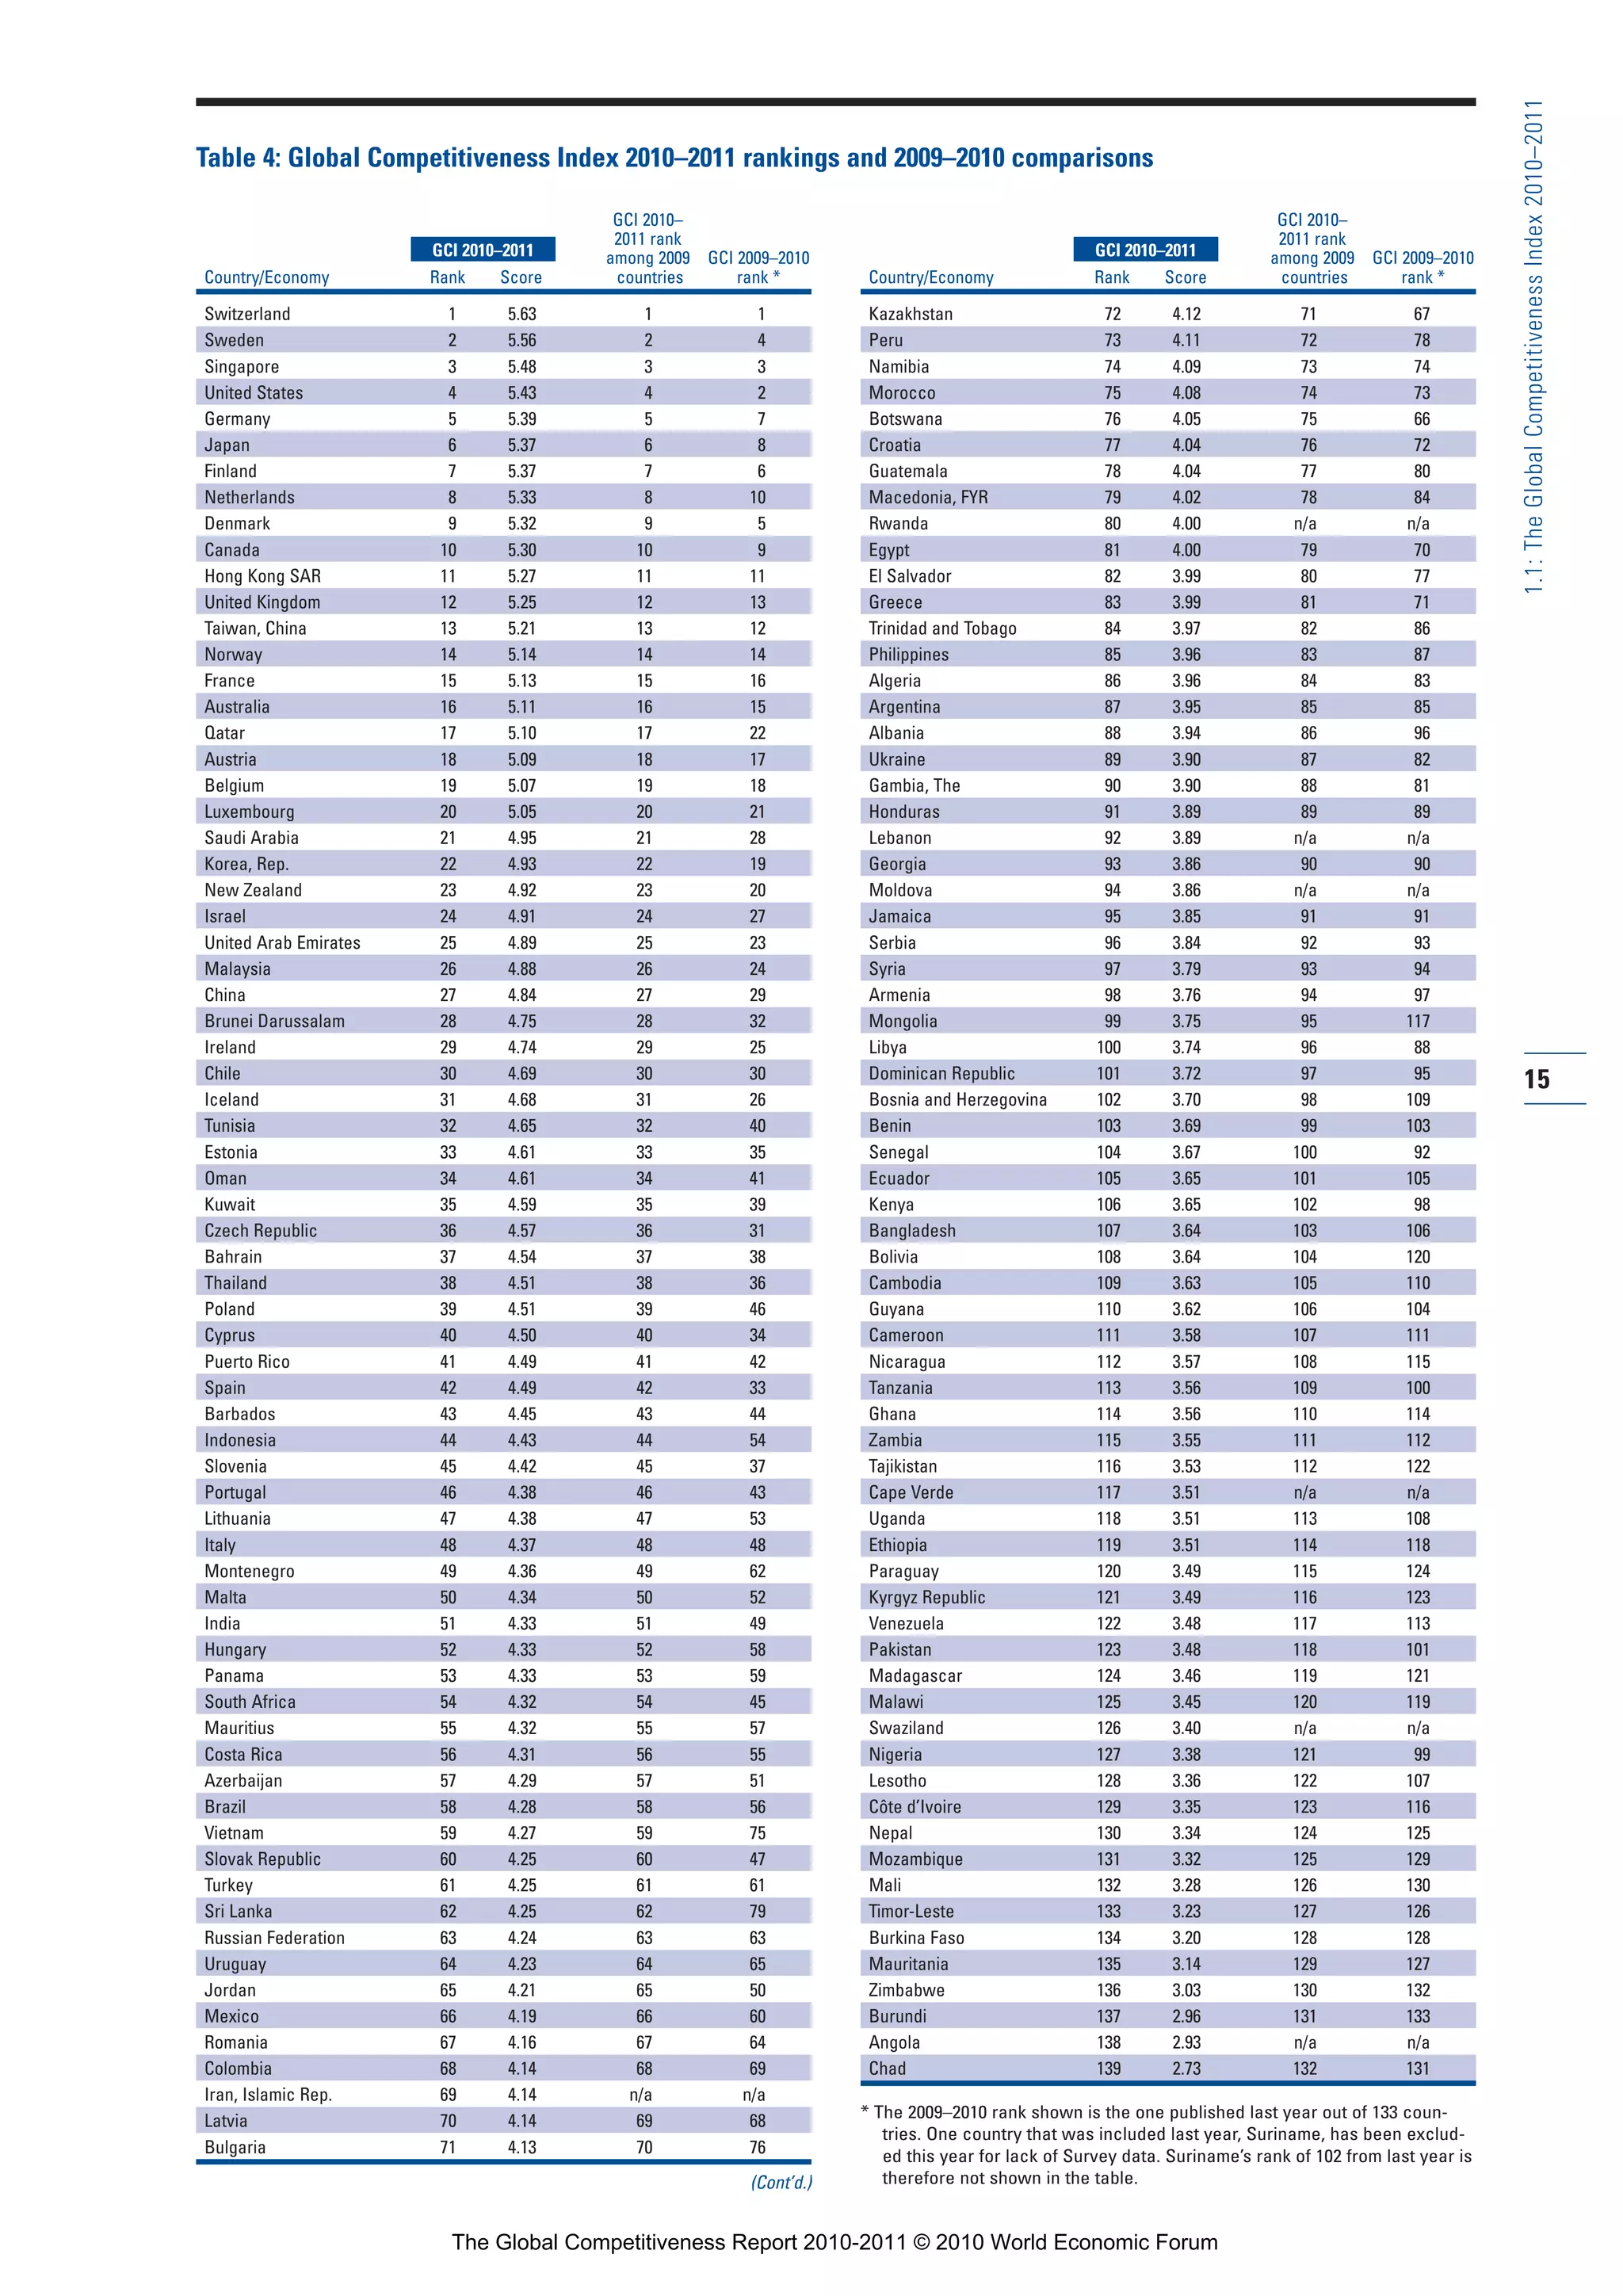
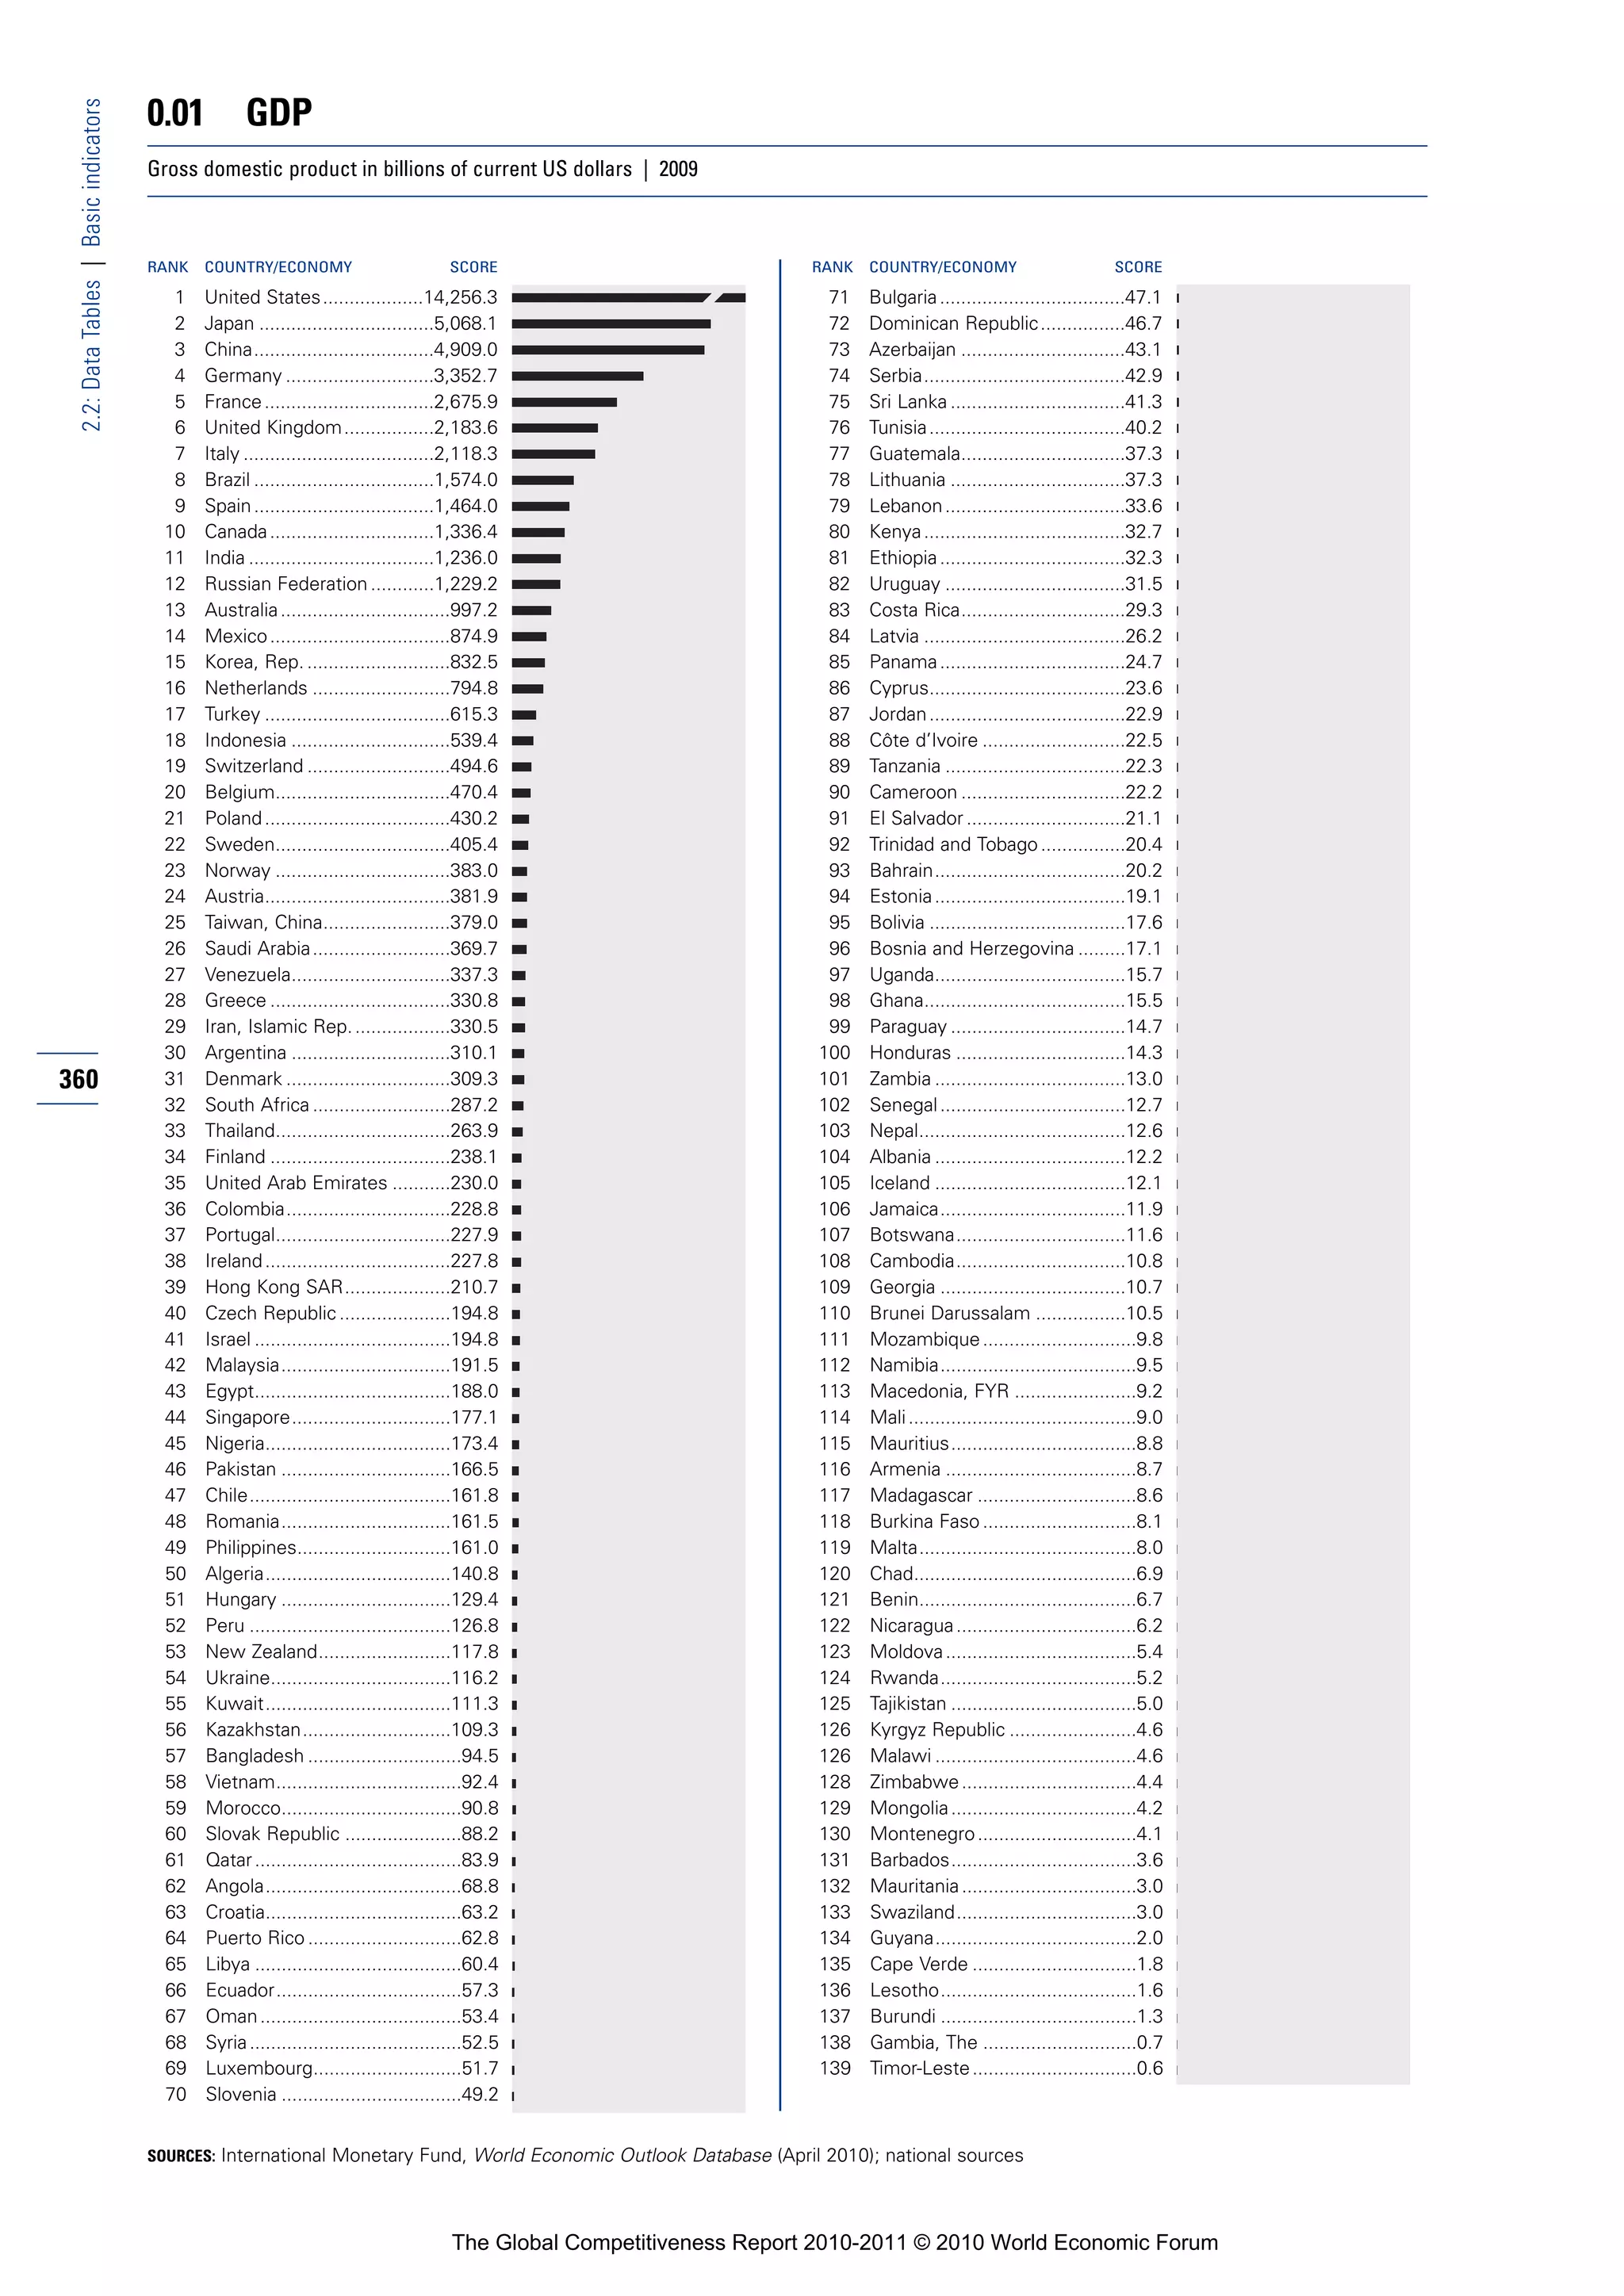
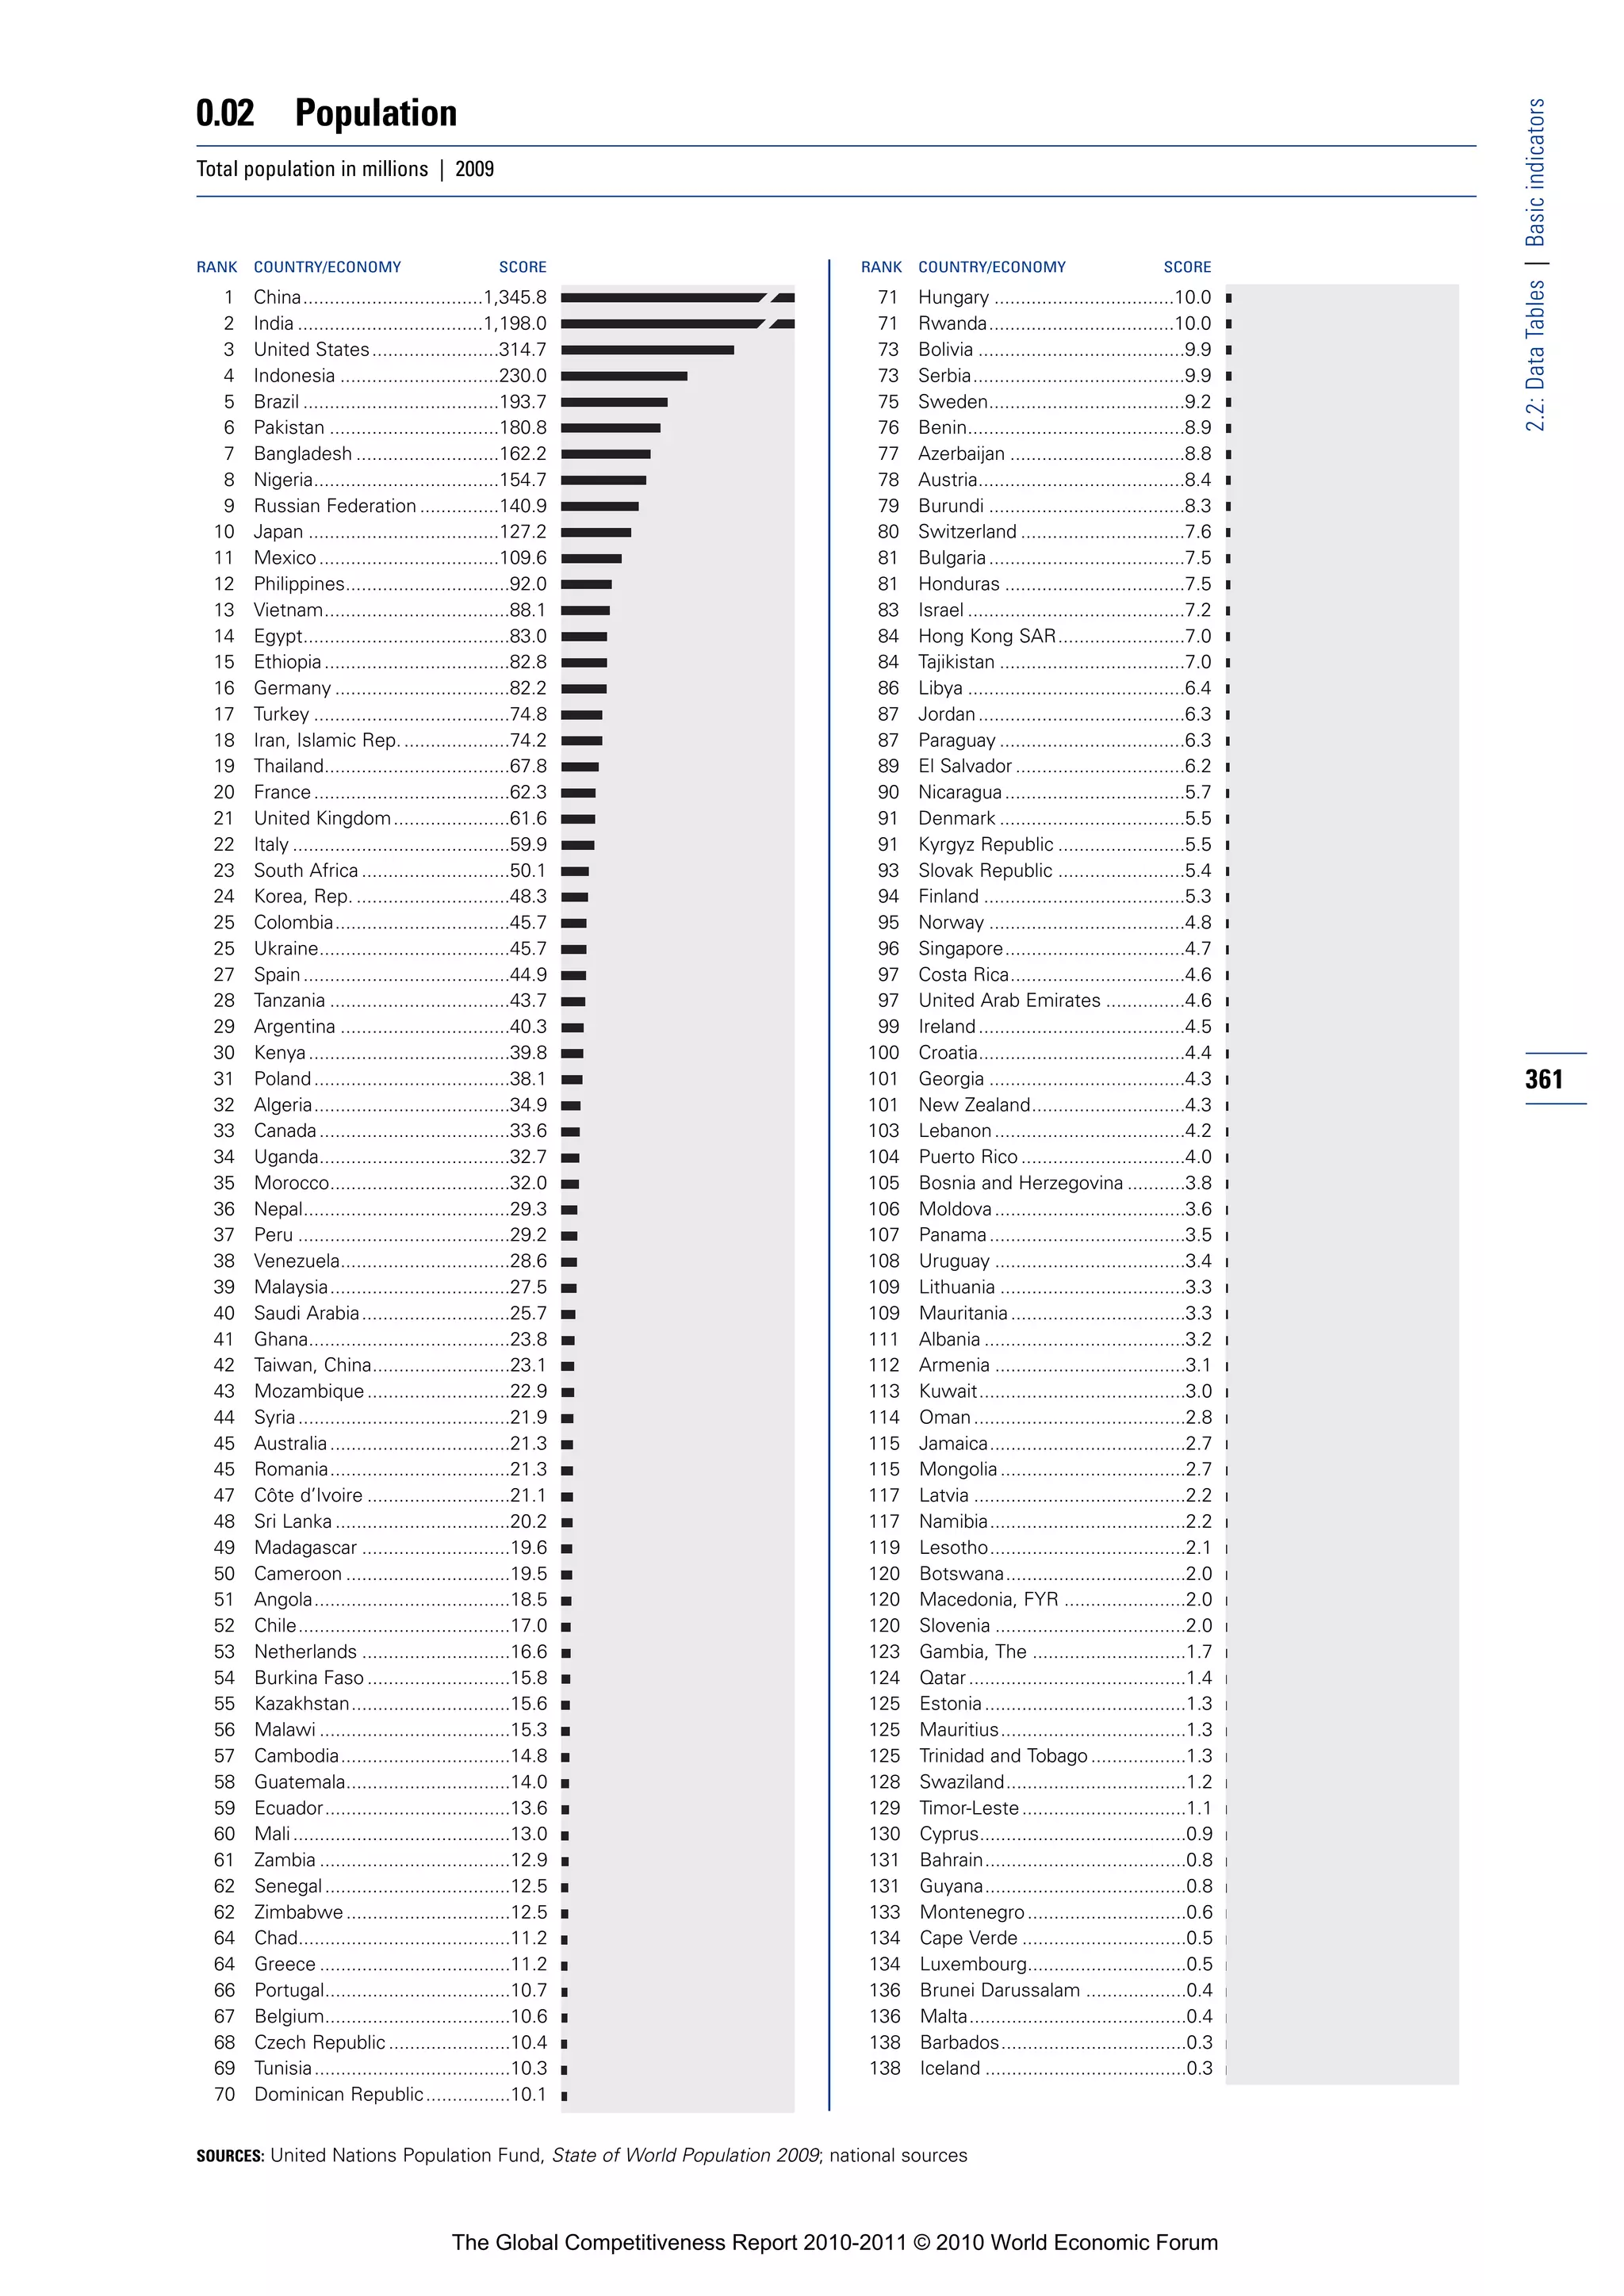
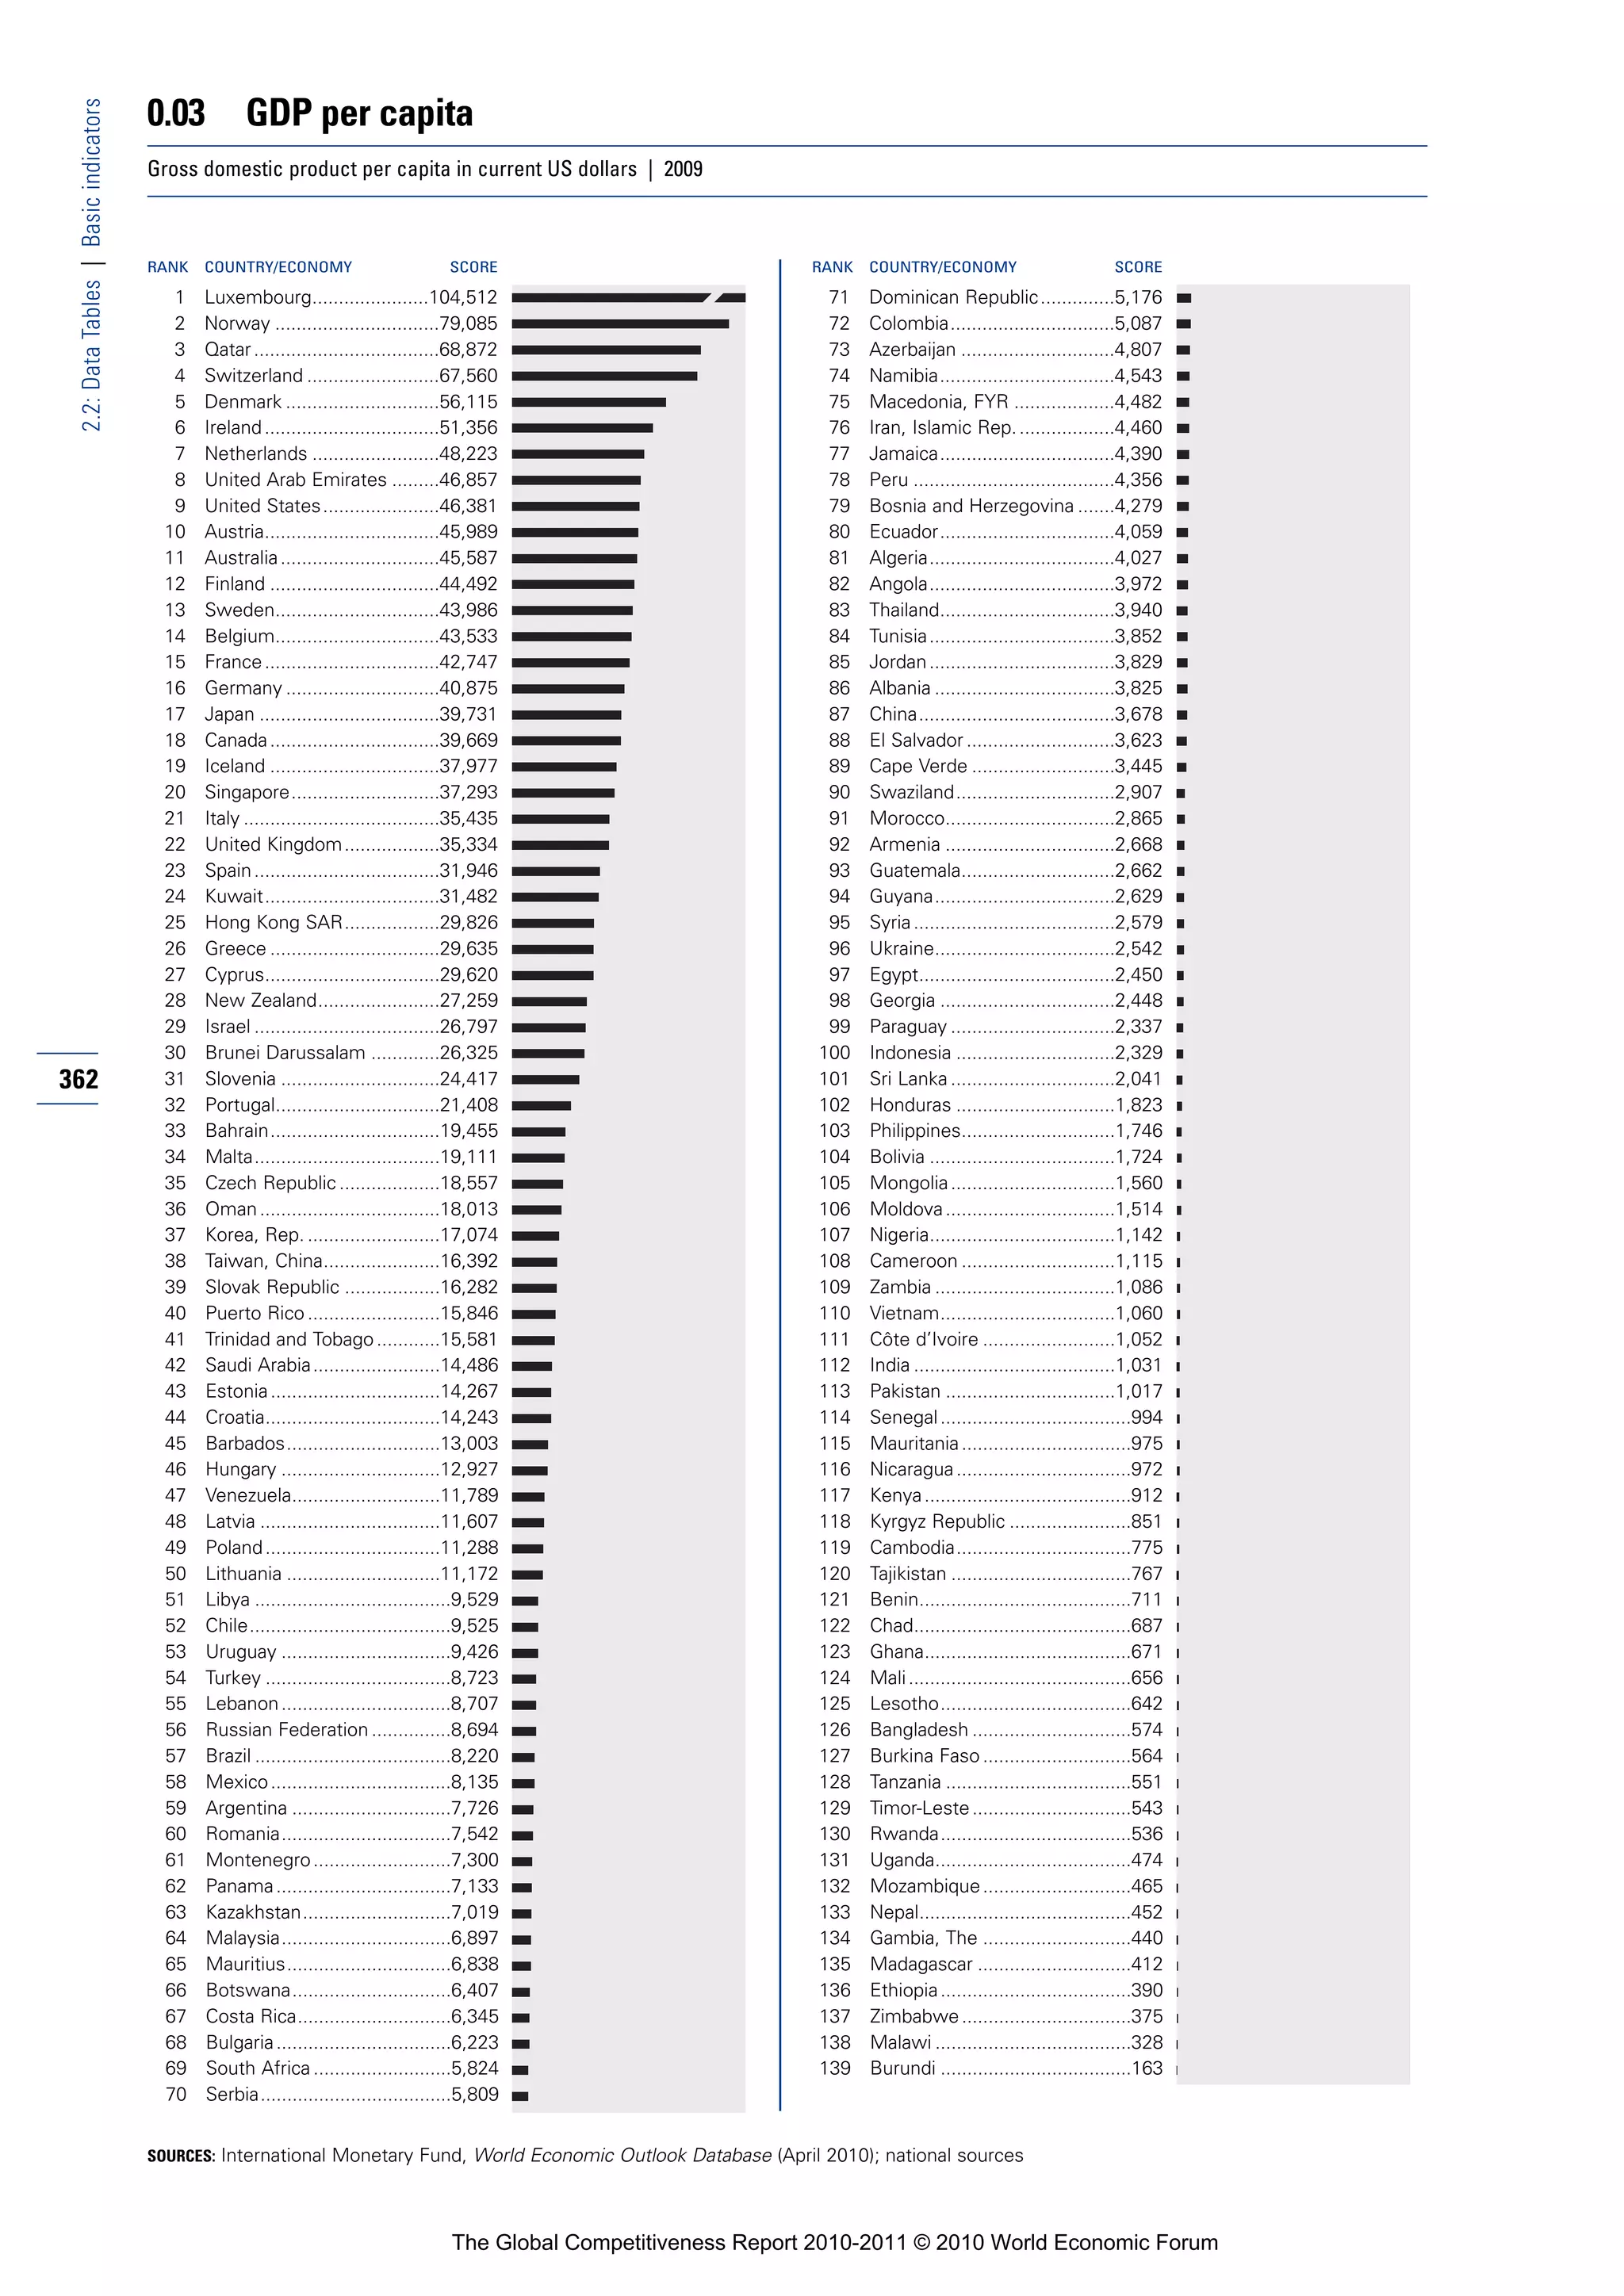
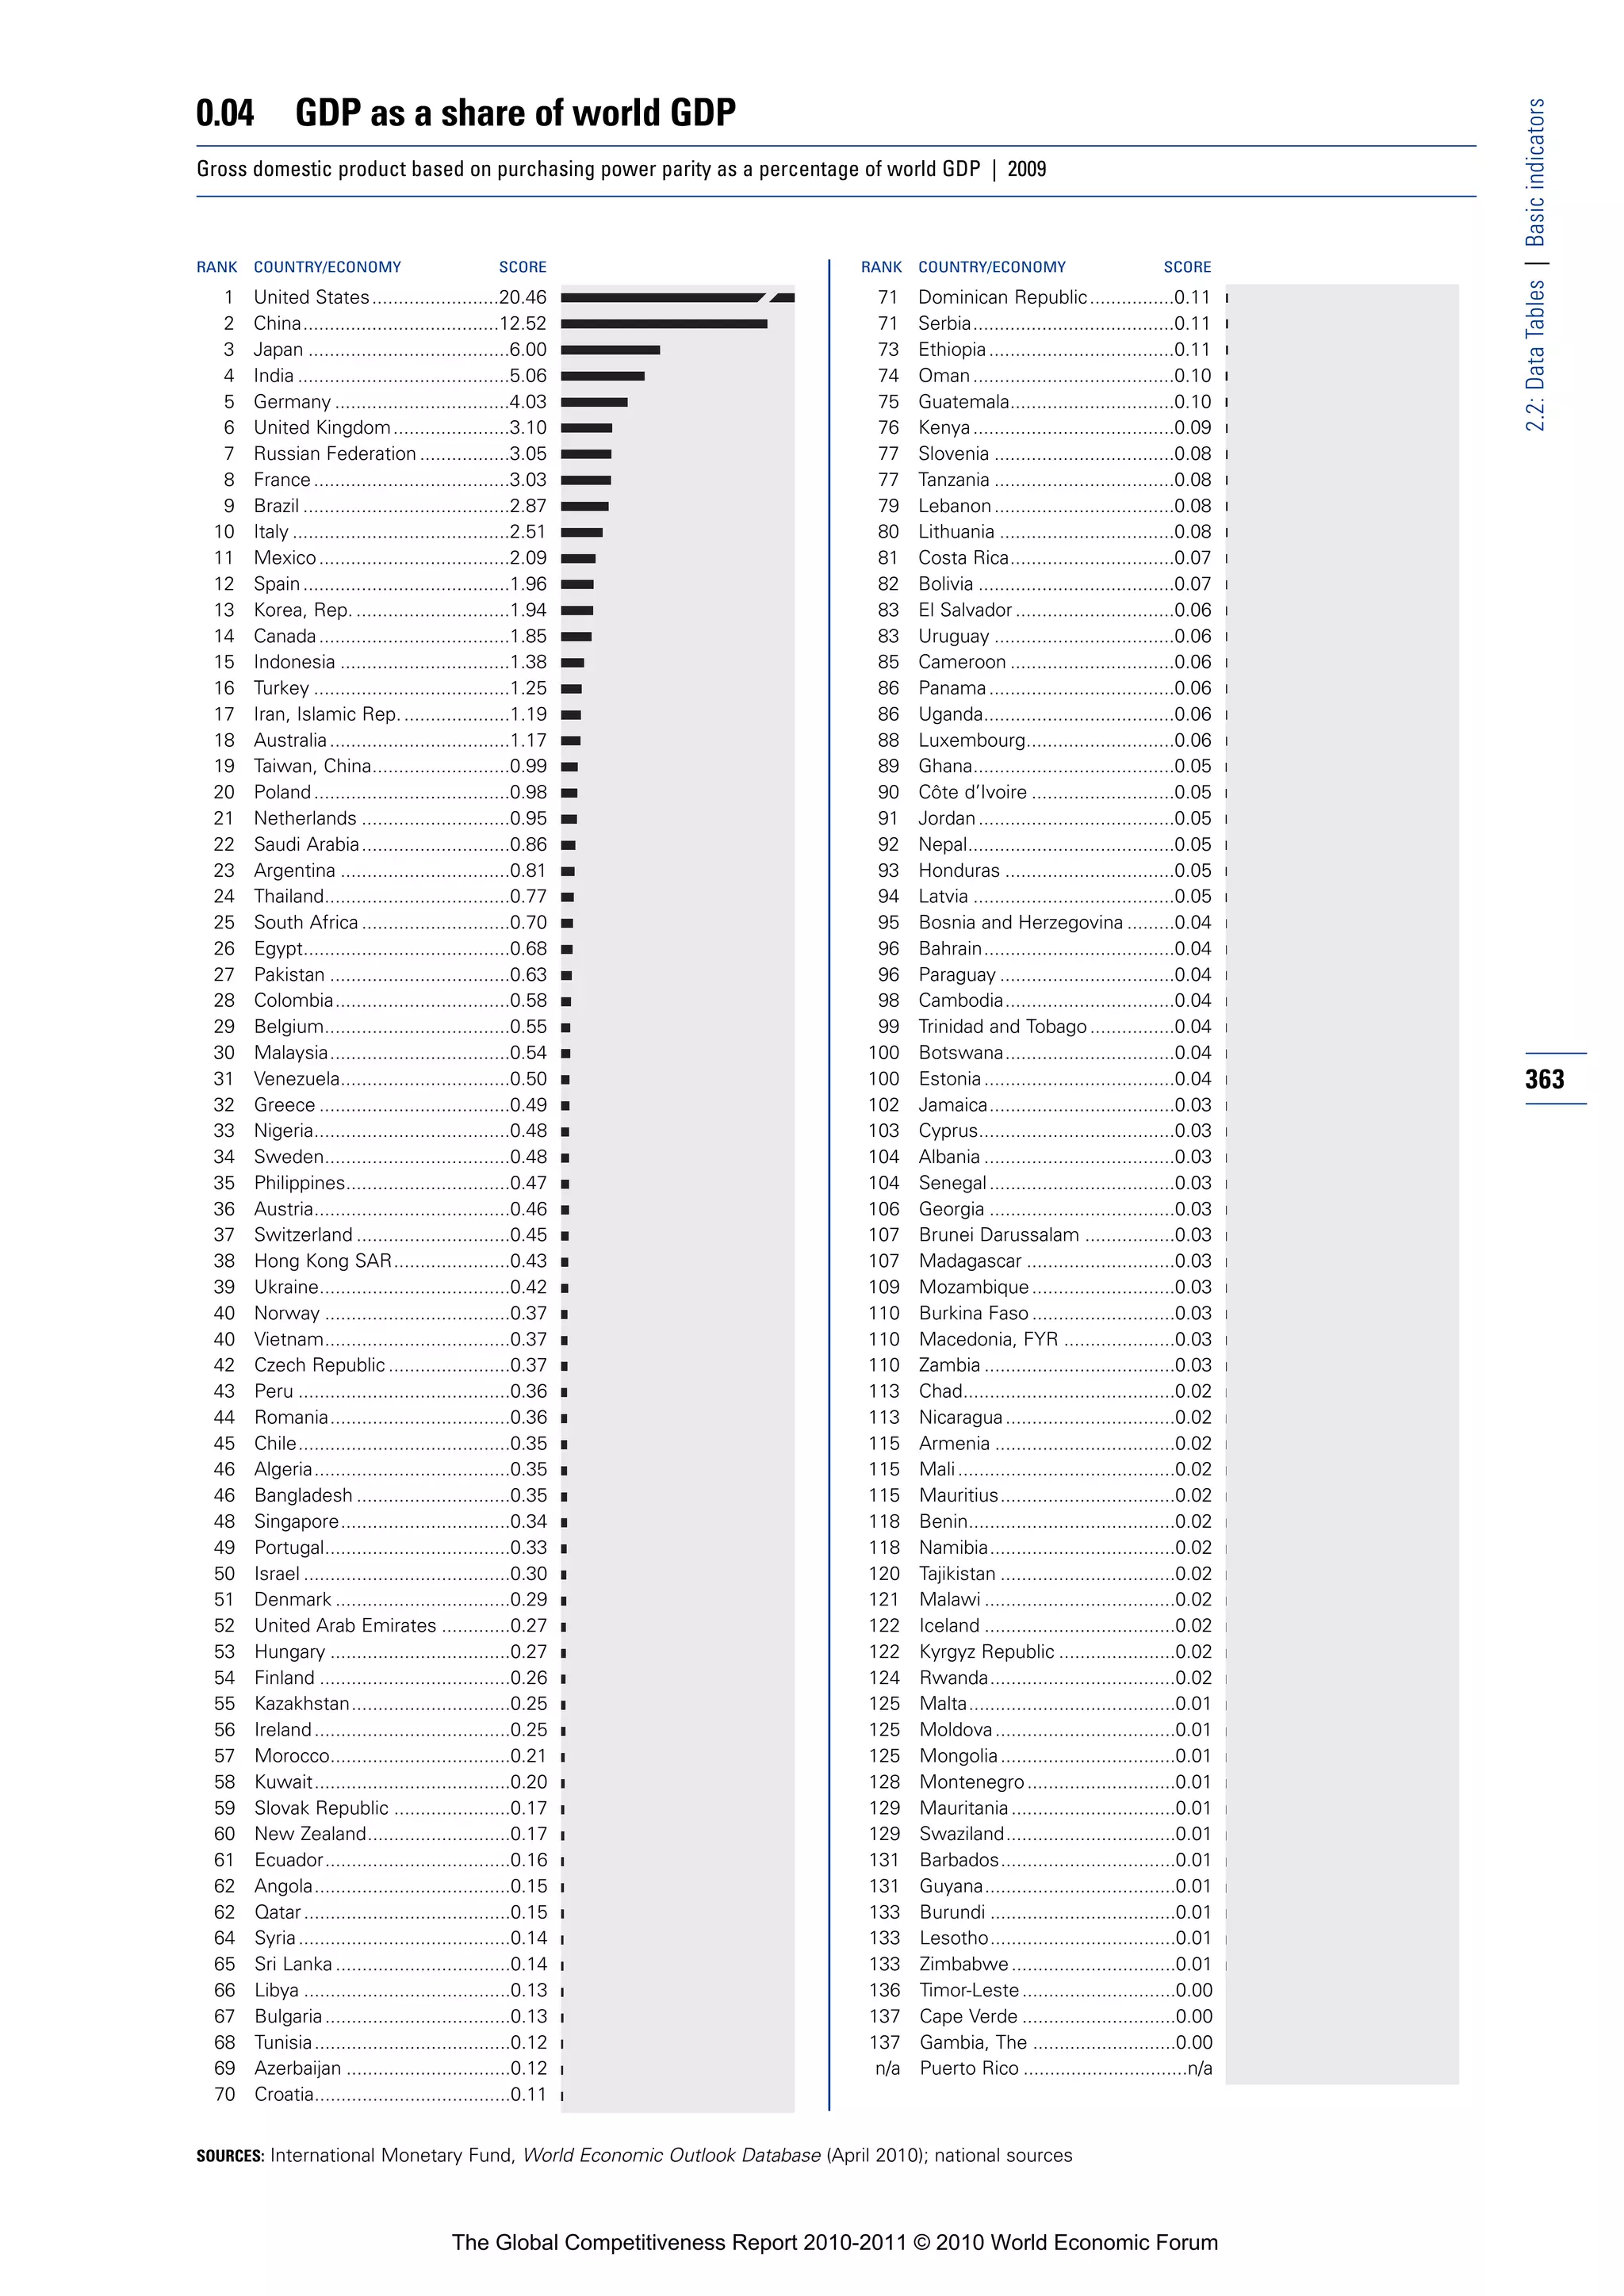
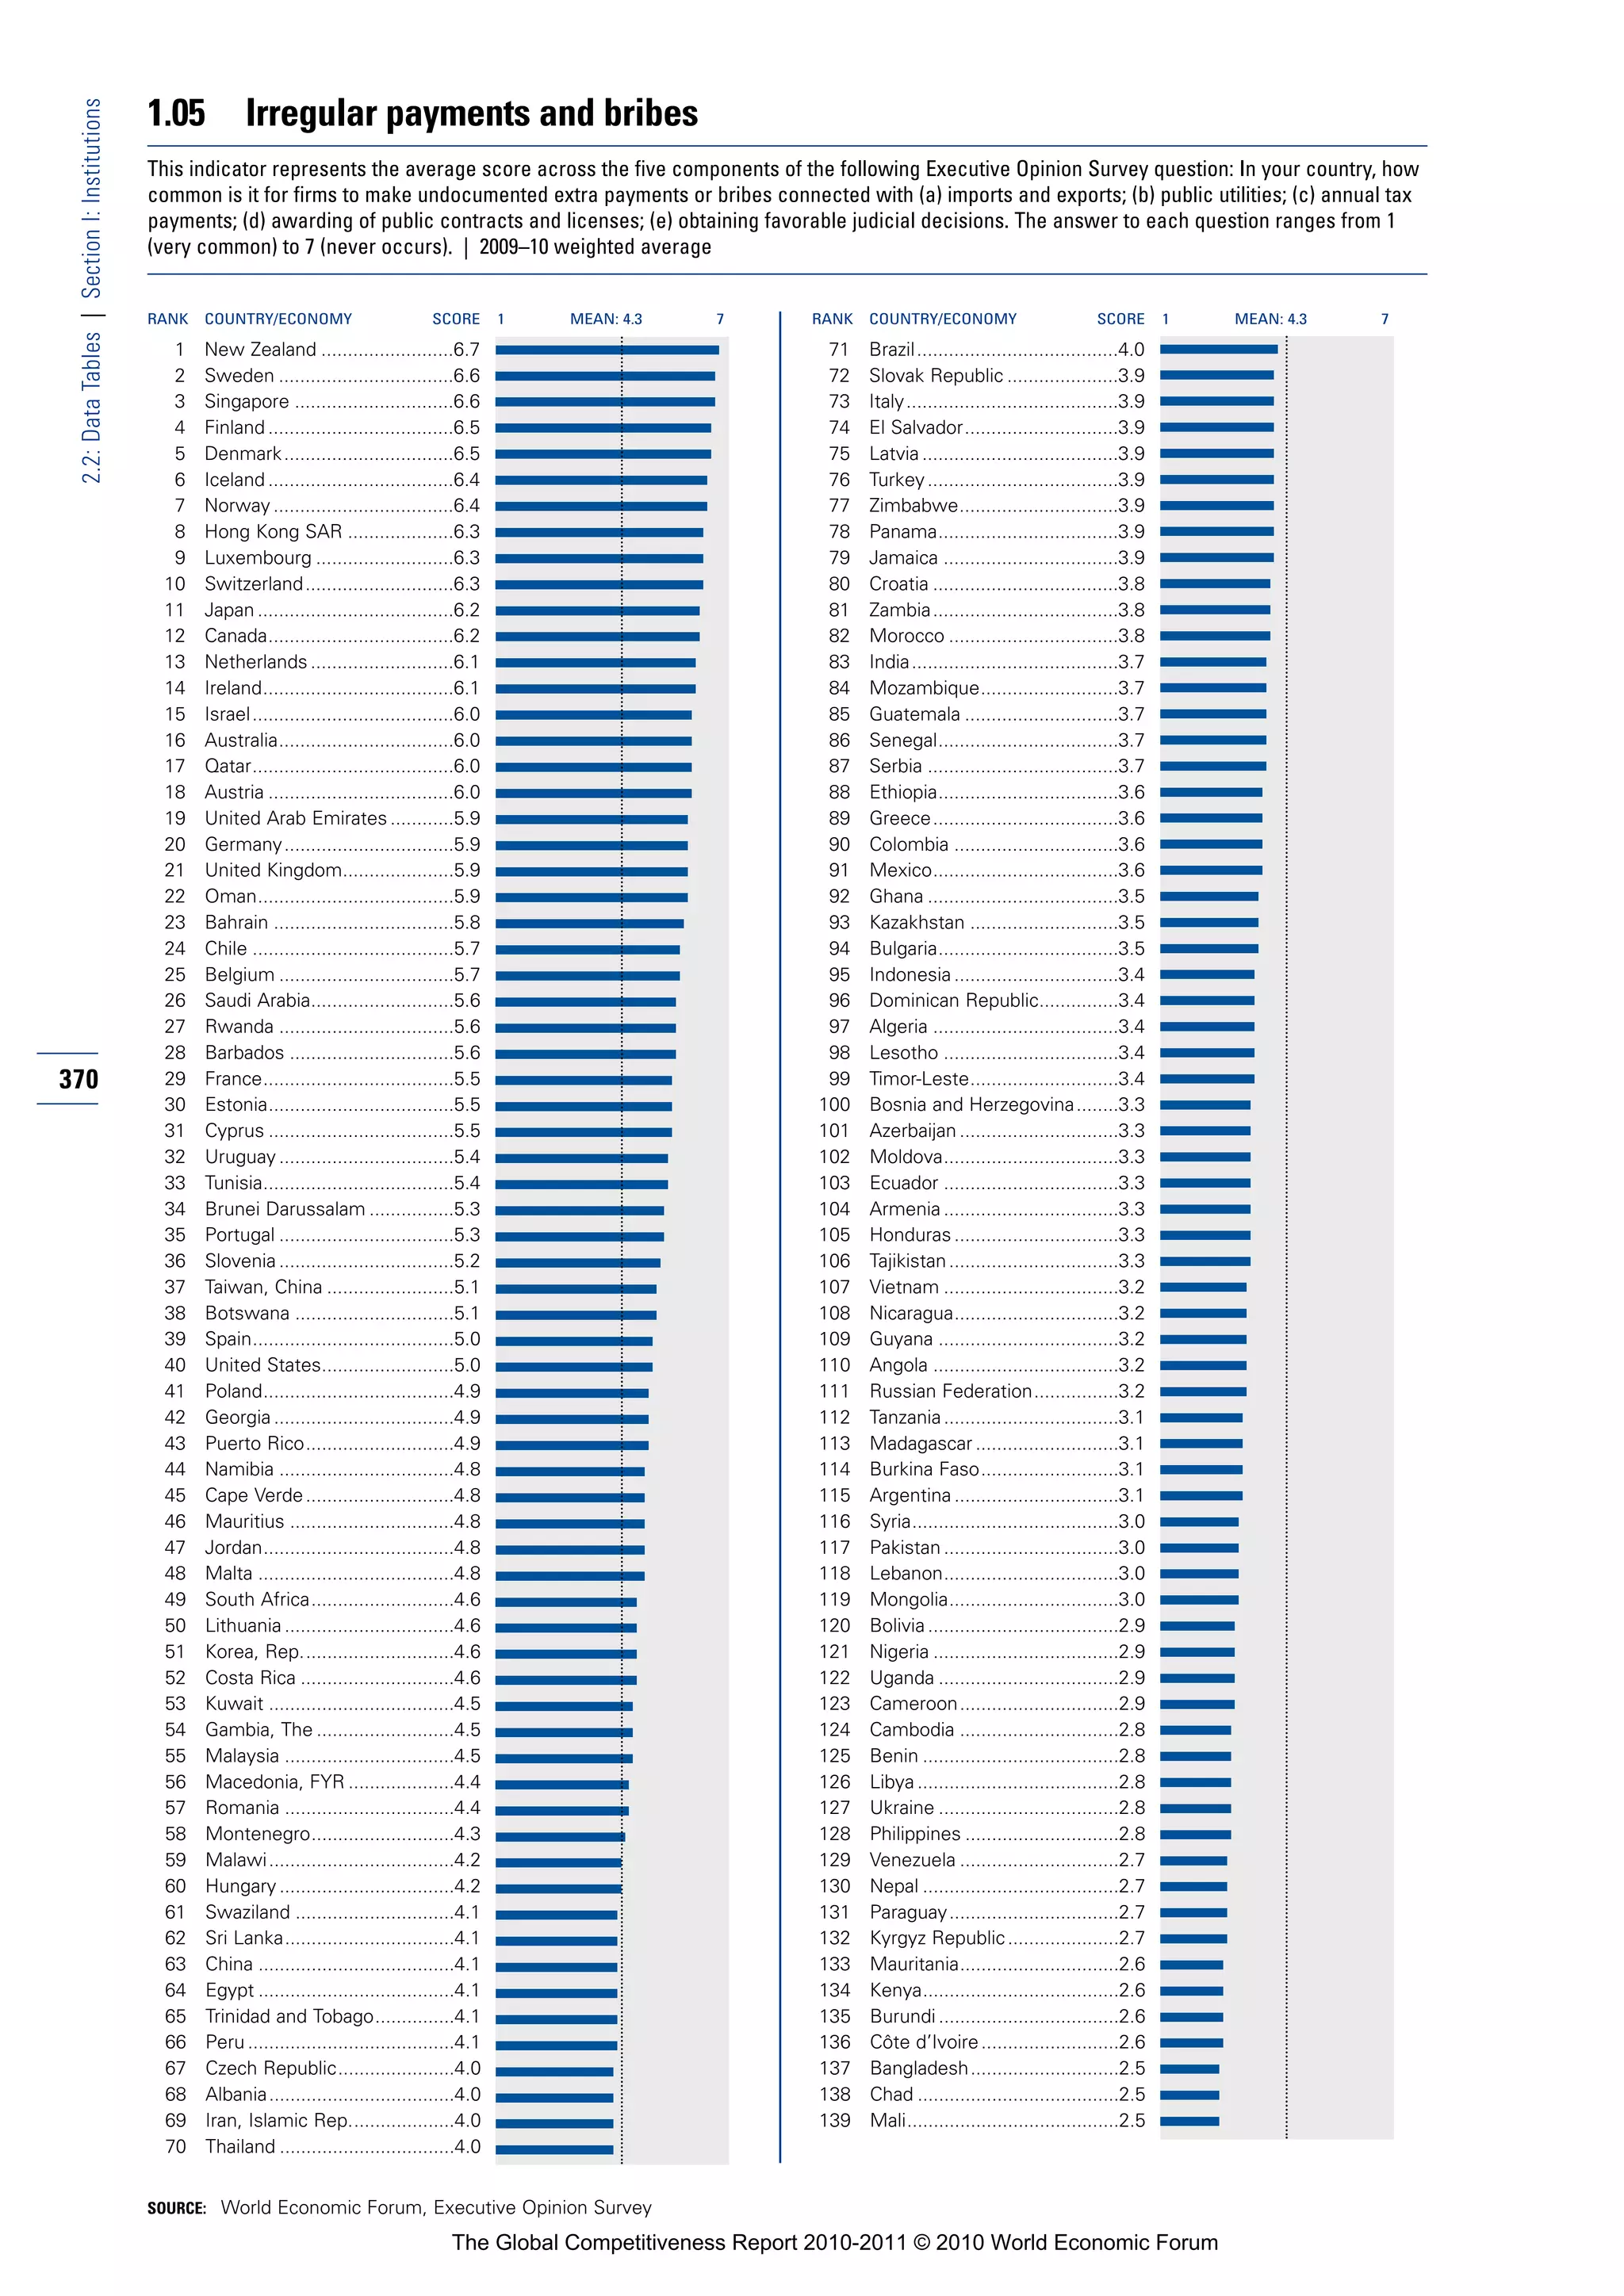
![How to Read the Data Tables
How to Read the Data Tables
The following pages provide detailed data for all 139 The 12 numbered sections correspond to the 12
economies included in The Global Competitiveness Report pillars of the Global Competitiveness Index (GCI).
2010–2011. The data tables are organized into 13 sec-
tions:
Executive Opinion Survey indicators
Basic indicators In the tables, indicators derived from the World
I. Institutions Economic Forum’s Executive Opinion Survey (Survey)
II. Infrastructure have country scores represented by blue-colored bar
III. Macroeconomic environment graphs. Survey questions asked for responses on a scale
IV. Health and primary education of 1 to 7, where an answer of 1 or 7 always corresponds
V. Higher education and training to the worst or best possible outcome, respectively. In
VI. Goods market efficiency the tables, the Survey question and the two extreme
VII. Labor market efficiency answers are shown above the rankings. Country scores
VIII. Financial market development are reported with a precision of one decimal point,
IX. Technological readiness although exact figures are used to determine rankings.
X. Market size The sample mean is represented by a dotted line run-
XI. Business sophistication ning across the bar graphs. For more information on the 355
XII. Innovation Executive Opinion Survey and a detailed explanation of
how country scores are computed, please refer to
Chapter 1.2 of the Report.
Note that in Table 2.03, “n/appl.” is used for
economies with no railroad infrastructure. In Table 4.01,
which shows the results of the Survey question about
the business impact of malaria, “n/appl.” is used when
malaria is not endemic or when no case was reported in
1.01 Property rights
How would you rate the protection of property rights, including financial assets, in your country? [1 = very weak; 7 = very strong] | 2009–10
weighted average
the economy. Malaria incidence is shown in Table 4.02,
RANK
1
COUNTRY/ECONOMY SCORE
Switzerland ............................6.4
1 MEAN: 4.4 7 RANK
71
COUNTRY/ECONOMY SCORE
Latvia .....................................4.3
1 MEAN: 4.4 7 where “(NE)” stands for non-endemic, indicating that
2 Finland ...................................6.4 72 Brazil ......................................4.3
3
4
5
Singapore ..............................6.3
Hong Kong SAR ....................6.3
Sweden .................................6.3
73
74
75
Jamaica .................................4.3
Slovak Republic .....................4.2
Trinidad and Tobago...............4.2
malaria is not present in the country because of its geo-
6
7
8
Luxembourg ..........................6.2
Austria ...................................6.2
Germany................................6.1
76
77
78
Ghana ....................................4.2
Malawi ...................................4.2
Burkina Faso..........................4.2
graphical characteristics.
9 Norway ..................................6.1 79 Romania ................................4.2
10 Canada...................................6.1 80 Zambia...................................4.1
11 Denmark................................6.0 81 Vietnam .................................4.1
12 Puerto Rico............................5.9 82 El Salvador.............................4.1
13 Ireland....................................5.9 83 Turkey ....................................4.0
14 Australia.................................5.9 84 Indonesia ...............................4.0
15 Netherlands ...........................5.8 85 Senegal..................................4.0
16 France....................................5.8 86 Dominican Republic...............4.0
17 United Kingdom.....................5.8 87 Croatia ...................................4.0
18 New Zealand .........................5.7 88 Mexico...................................3.9
19 Taiwan, China ........................5.6 89 Thailand .................................3.9
20 Namibia .................................5.6 90 Azerbaijan ..............................3.9
21 Bahrain ..................................5.6 91 Colombia ...............................3.8
22 Barbados ...............................5.6 92 Peru .......................................3.8
23 Japan .....................................5.6 93 Honduras ...............................3.8
24 Oman.....................................5.5 94 Uganda ..................................3.8
25 Qatar......................................5.5 95 Guyana ..................................3.7
26 Belgium .................................5.4 96 Cameroon..............................3.7
27 Cyprus ...................................5.4 97 Tajikistan ................................3.7
28 Saudi Arabia...........................5.4 98 Armenia .................................3.7
29 South Africa...........................5.4 99 Philippines .............................3.7
30 Jordan....................................5.4 100 Cape Verde ............................3.7
31 Tunisia....................................5.4 101 Lesotho .................................3.7
32 Iceland ...................................5.4 102 Guatemala .............................3.7
33 Estonia...................................5.3 103 Kenya.....................................3.7
34 Malta .....................................5.3 104 Tanzania .................................3.7
35 Botswana ..............................5.3 105 Macedonia, FYR ....................3.6
36 Mauritius ...............................5.3 106 Algeria ...................................3.6
37 Chile ......................................5.2 107 Pakistan .................................3.6
38 China .....................................5.1 108 Mauritania..............................3.5
39 Gambia, The ..........................5.1 109 Mali........................................3.5
40 United States.........................5.1 110 Cambodia ..............................3.5
41 Malaysia ................................5.1 111 Libya ......................................3.5
42 Portugal .................................5.0 112 Kazakhstan ............................3.5
43 United Arab Emirates ............5.0 113 Bangladesh............................3.4
44 Rwanda .................................5.0 114 Côte d’Ivoire ..........................3.4
45 Spain......................................4.9 115 Mongolia................................3.4
46 Kuwait ...................................4.9 116 Albania...................................3.3
47 Swaziland ..............................4.9 117 Mozambique..........................3.3
48 Montenegro...........................4.8 118 Nigeria ...................................3.3
49 Israel......................................4.7 119 Moldova.................................3.3
50 Uruguay .................................4.7 120 Georgia ..................................3.2
51 Panama..................................4.7 121 Bulgaria..................................3.2
52 Brunei Darussalam ................4.7 122 Serbia ....................................3.2
53 Greece...................................4.7 123 Ecuador .................................3.2
54 Korea, Rep.............................4.7 124 Nicaragua...............................3.1
55 Benin .....................................4.7 125 Nepal .....................................3.0
56 Egypt .....................................4.6 126 Madagascar ...........................3.0
57 Lebanon.................................4.6 127 Burundi ..................................3.0
58 Slovenia .................................4.6 128 Russian Federation................2.9
59 Poland....................................4.6 129 Paraguay ................................2.9
60 Ethiopia..................................4.5 130 Angola ...................................2.9
61 India.......................................4.5 131 Timor-Leste............................2.8
62 Syria.......................................4.4 132 Kyrgyz Republic .....................2.8
63 Morocco ................................4.4 133 Bosnia and Herzegovina ........2.7
64 Sri Lanka................................4.4 134 Argentina ...............................2.7
65 Czech Republic......................4.4 135 Ukraine ..................................2.6
66 Hungary .................................4.4 136 Chad ......................................2.4
67 Costa Rica .............................4.4 137 Bolivia ....................................2.2
68 Lithuania ................................4.3 138 Zimbabwe..............................2.2
69 Italy........................................4.3 139 Venezuela ..............................1.8
70 Iran, Islamic Rep....................4.3
SOURCE: World Economic Forum, Executive Opinion Survey
The Global Competitiveness Report 2010-2011 © 2010 World Economic Forum](https://image.slidesharecdn.com/globalcompetitivenessreportwef2010-11-100928142139-phpapp02/75/Global-competitiveness-report-wef-2010-11-368-2048.jpg)

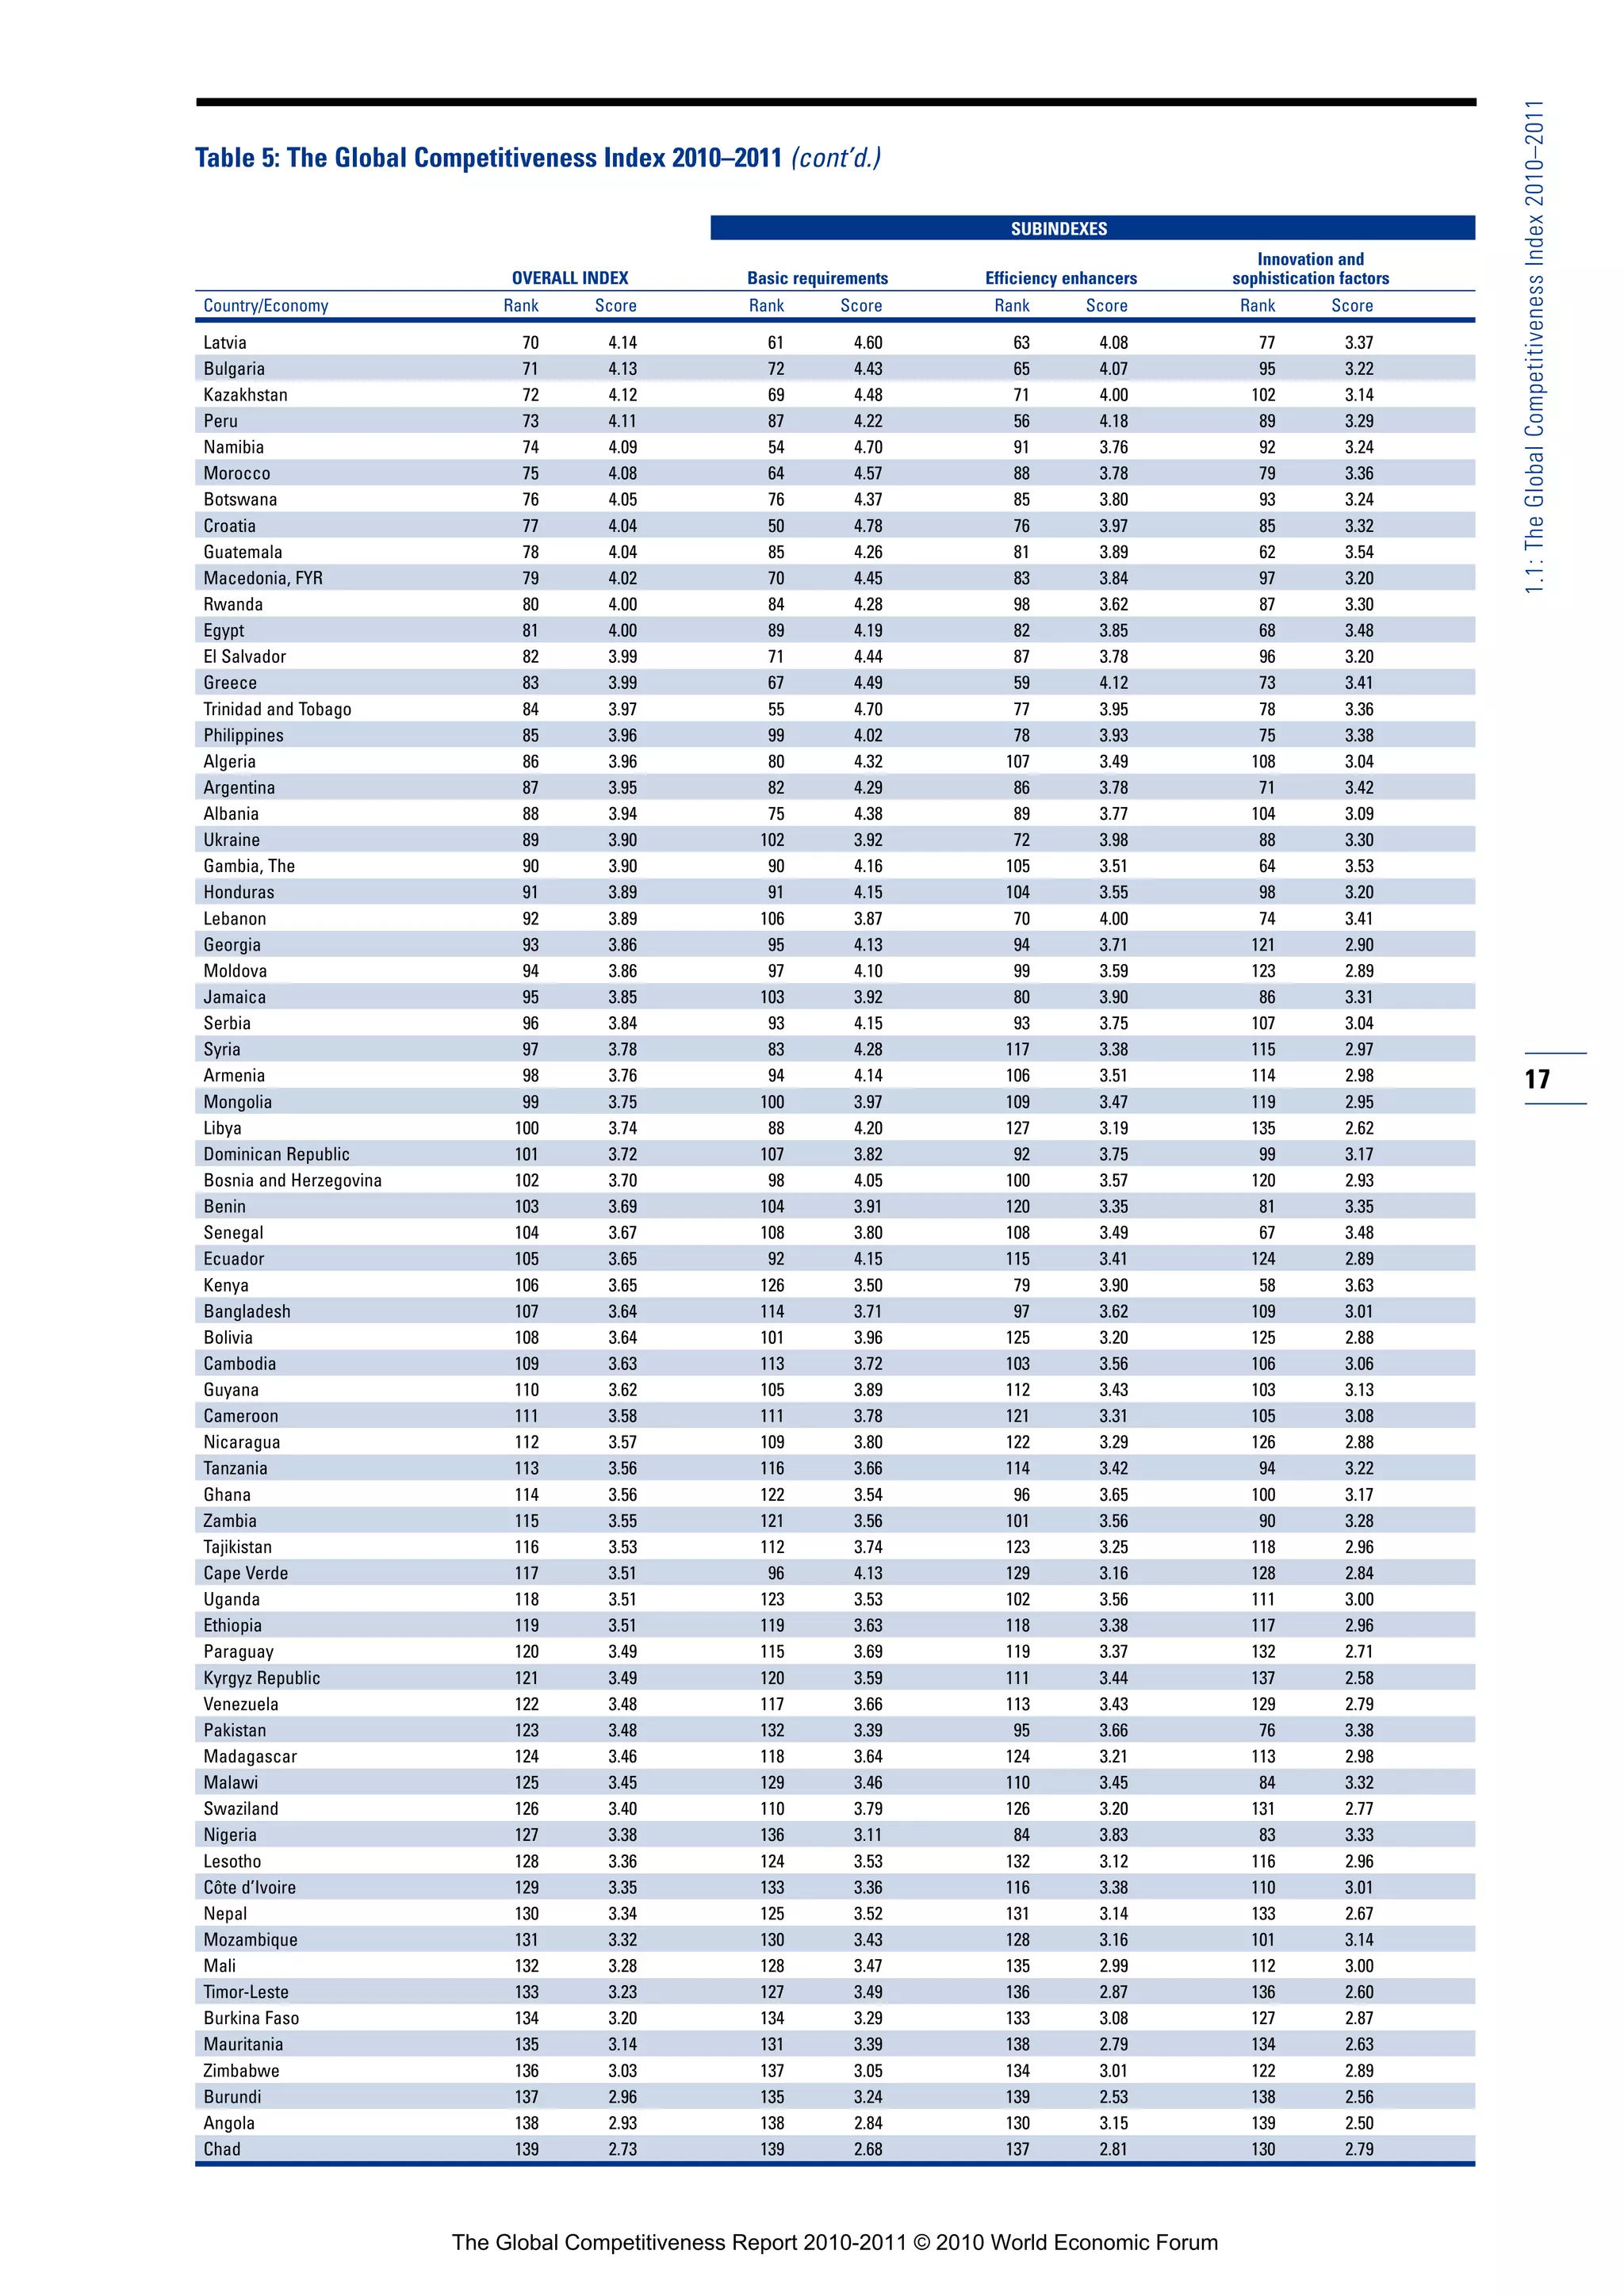
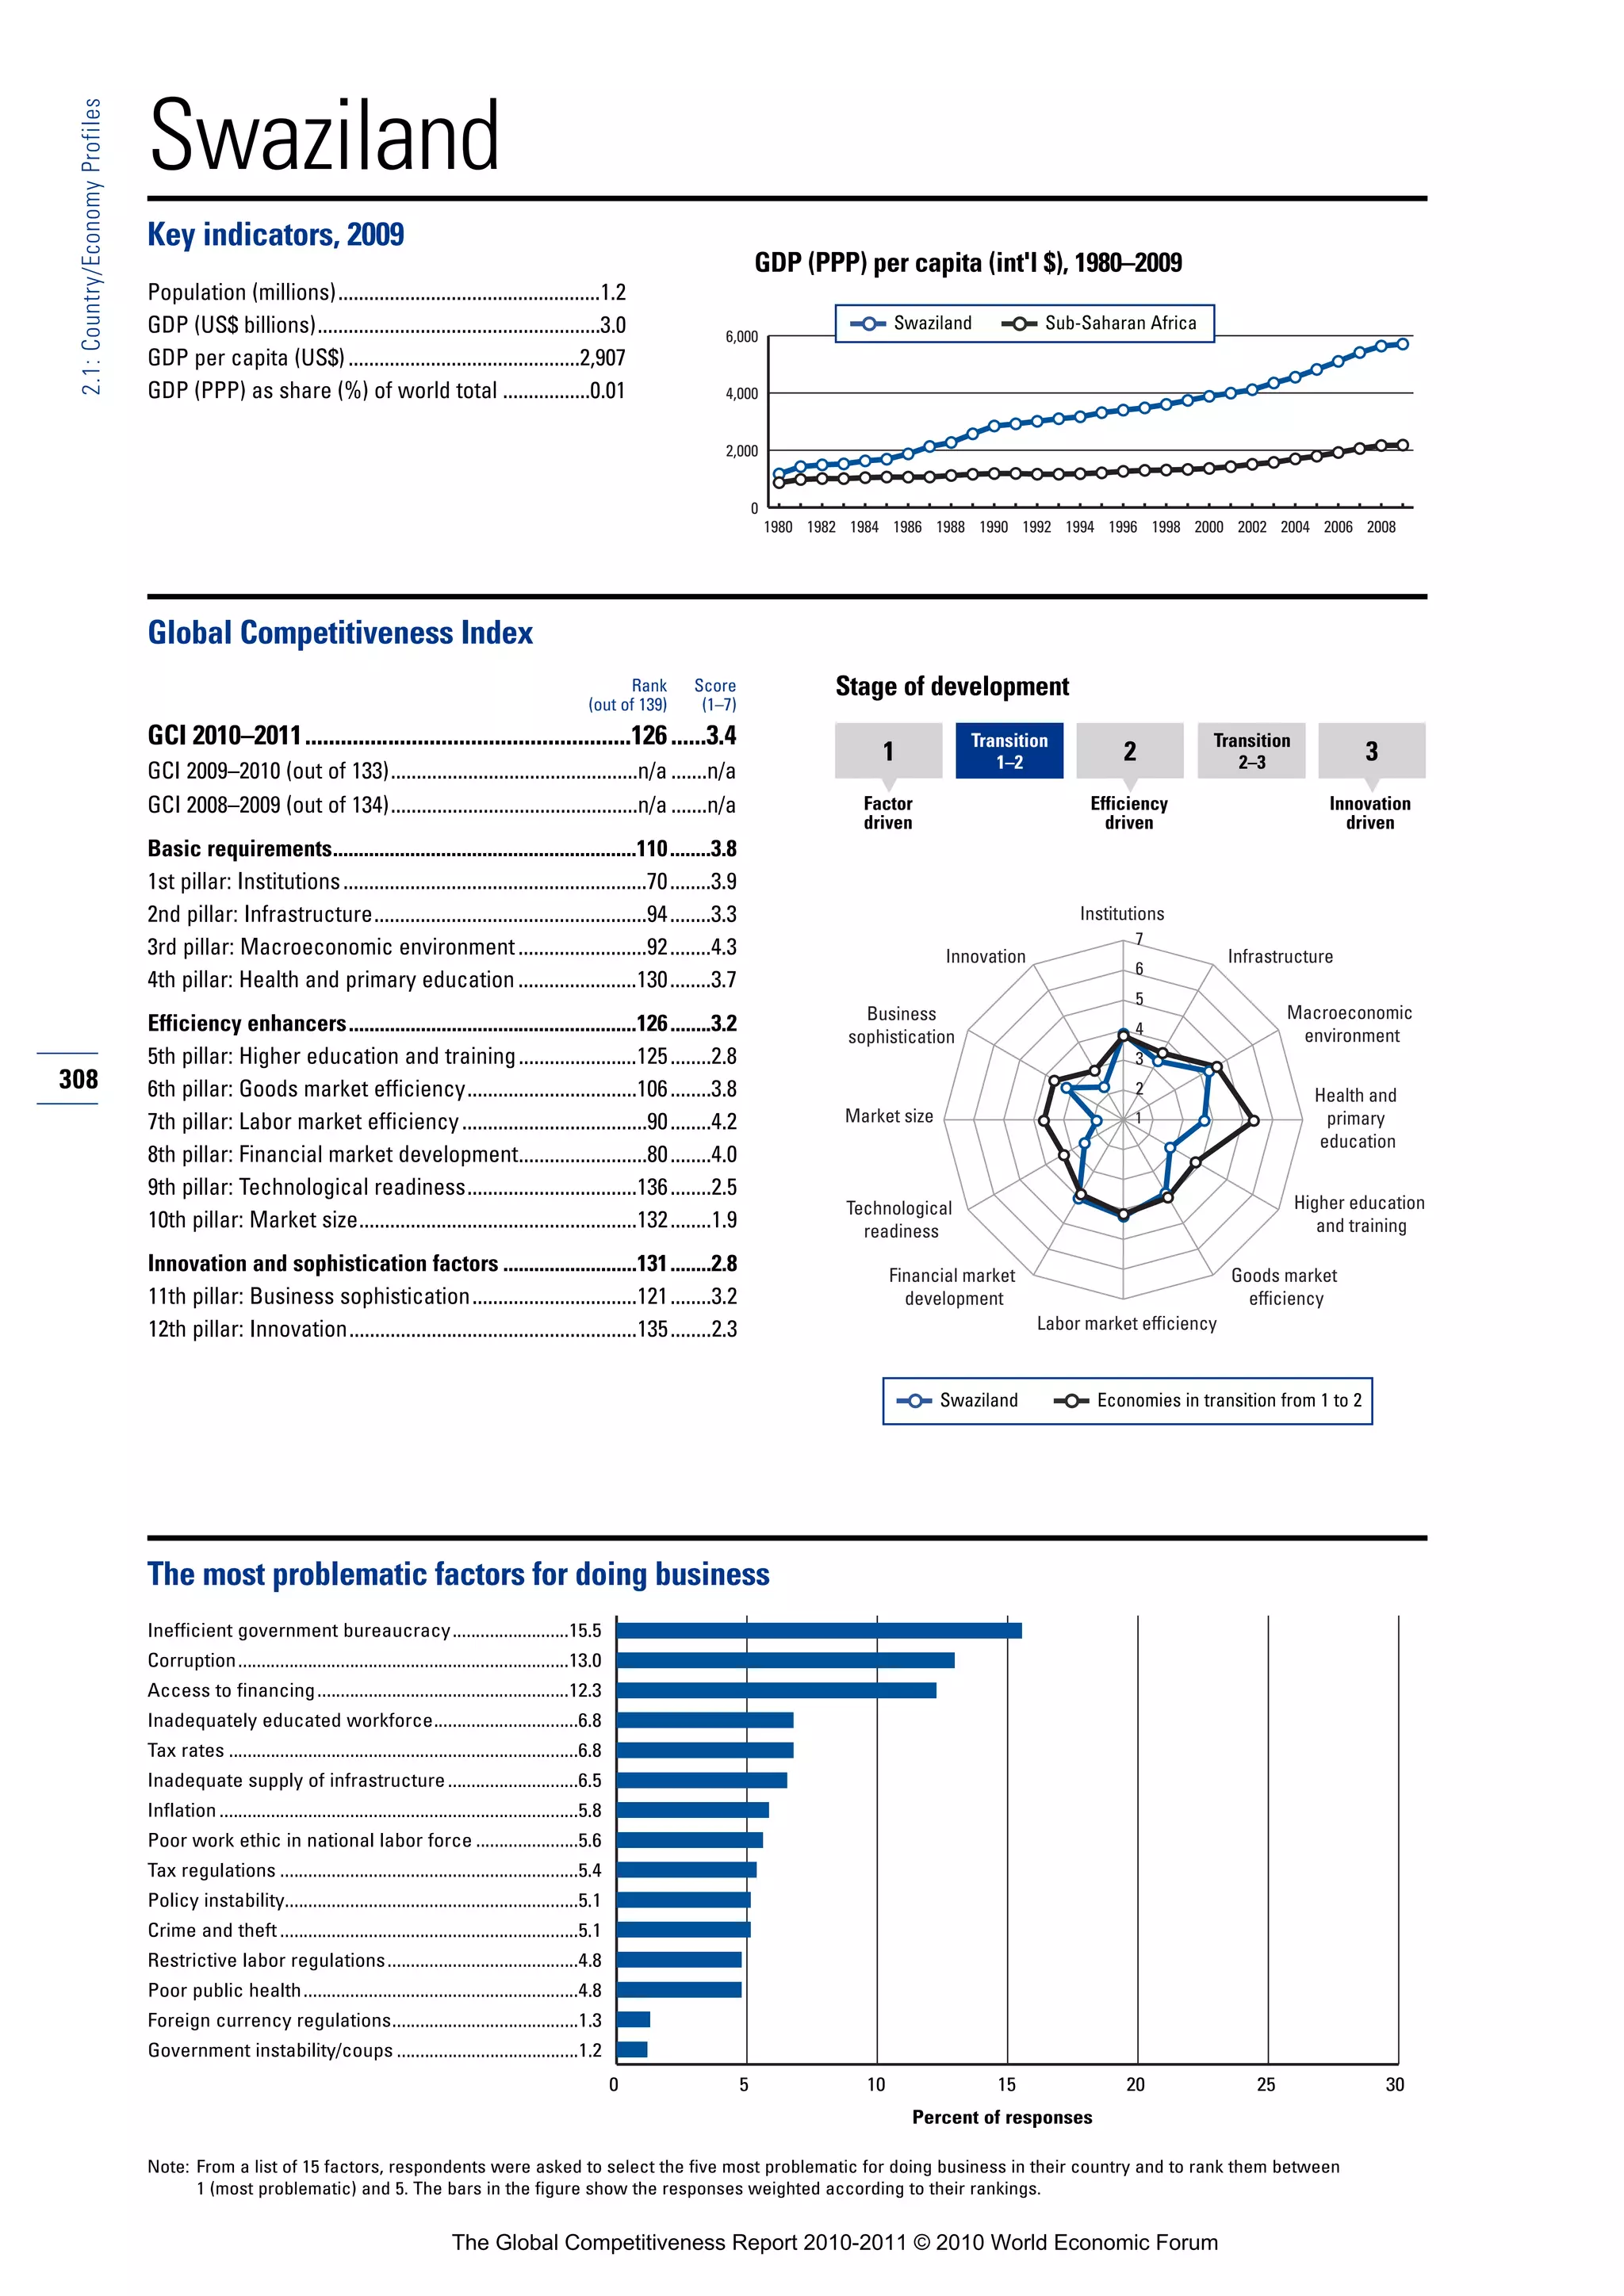
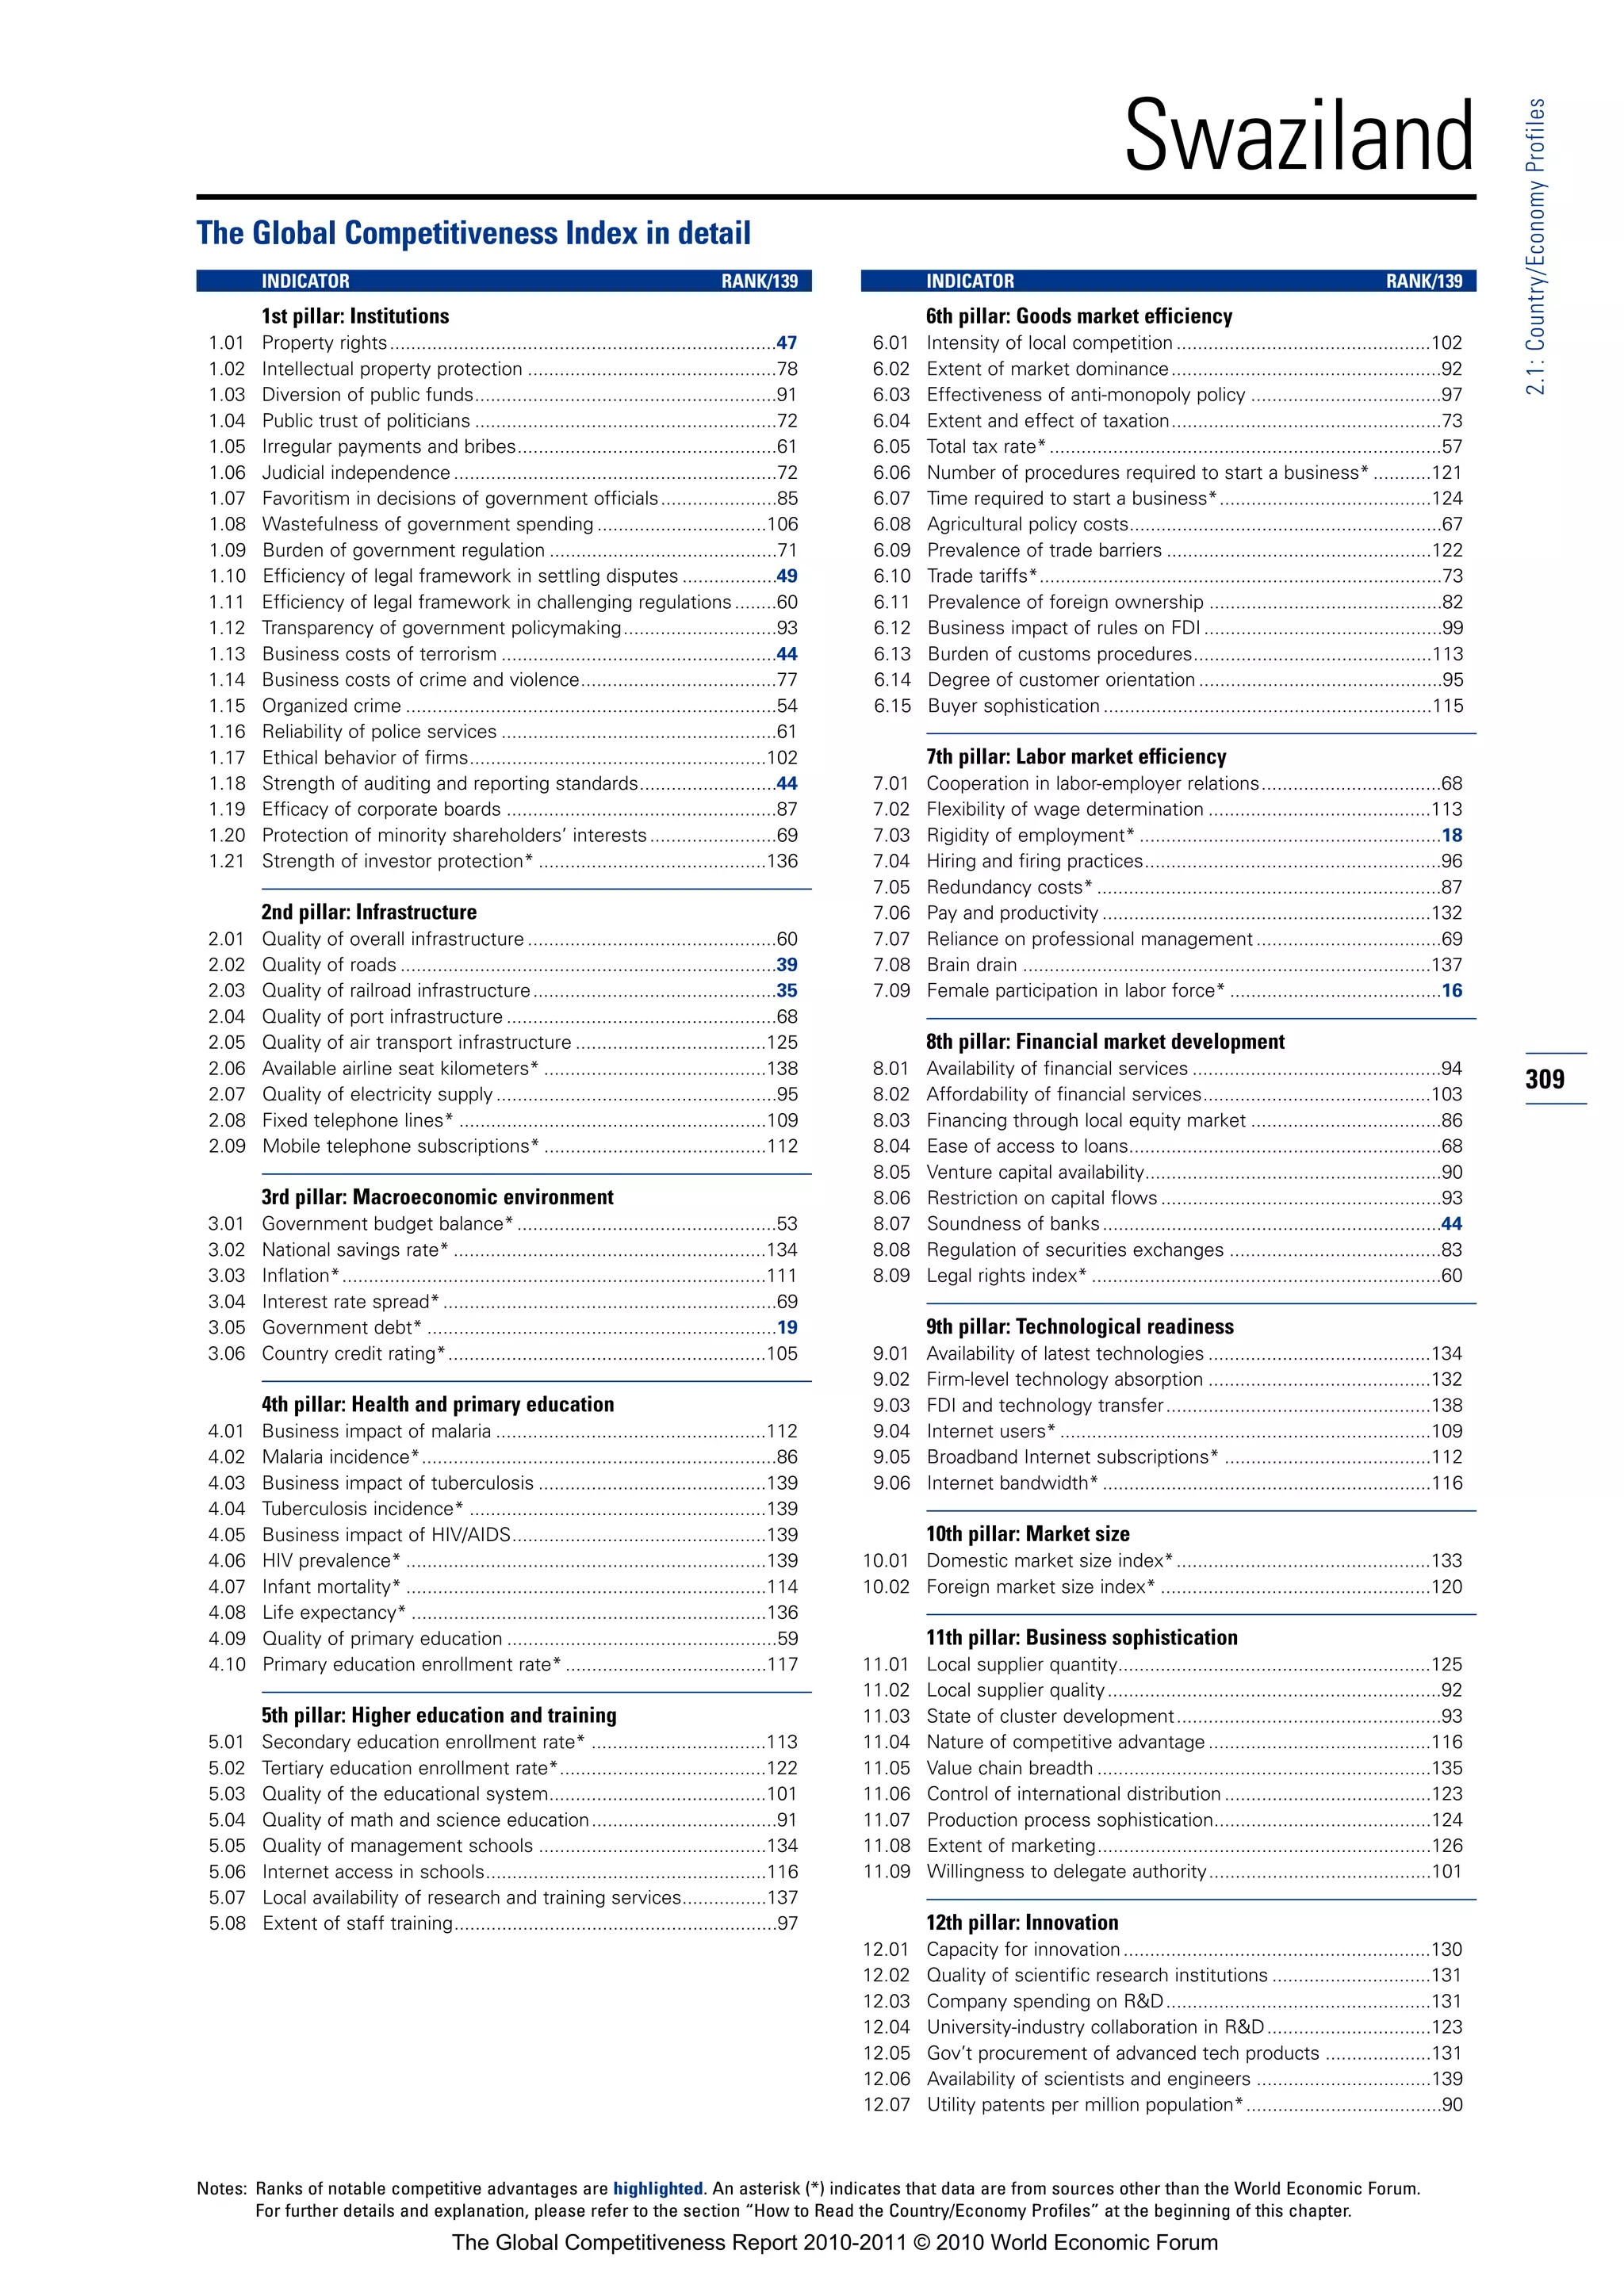
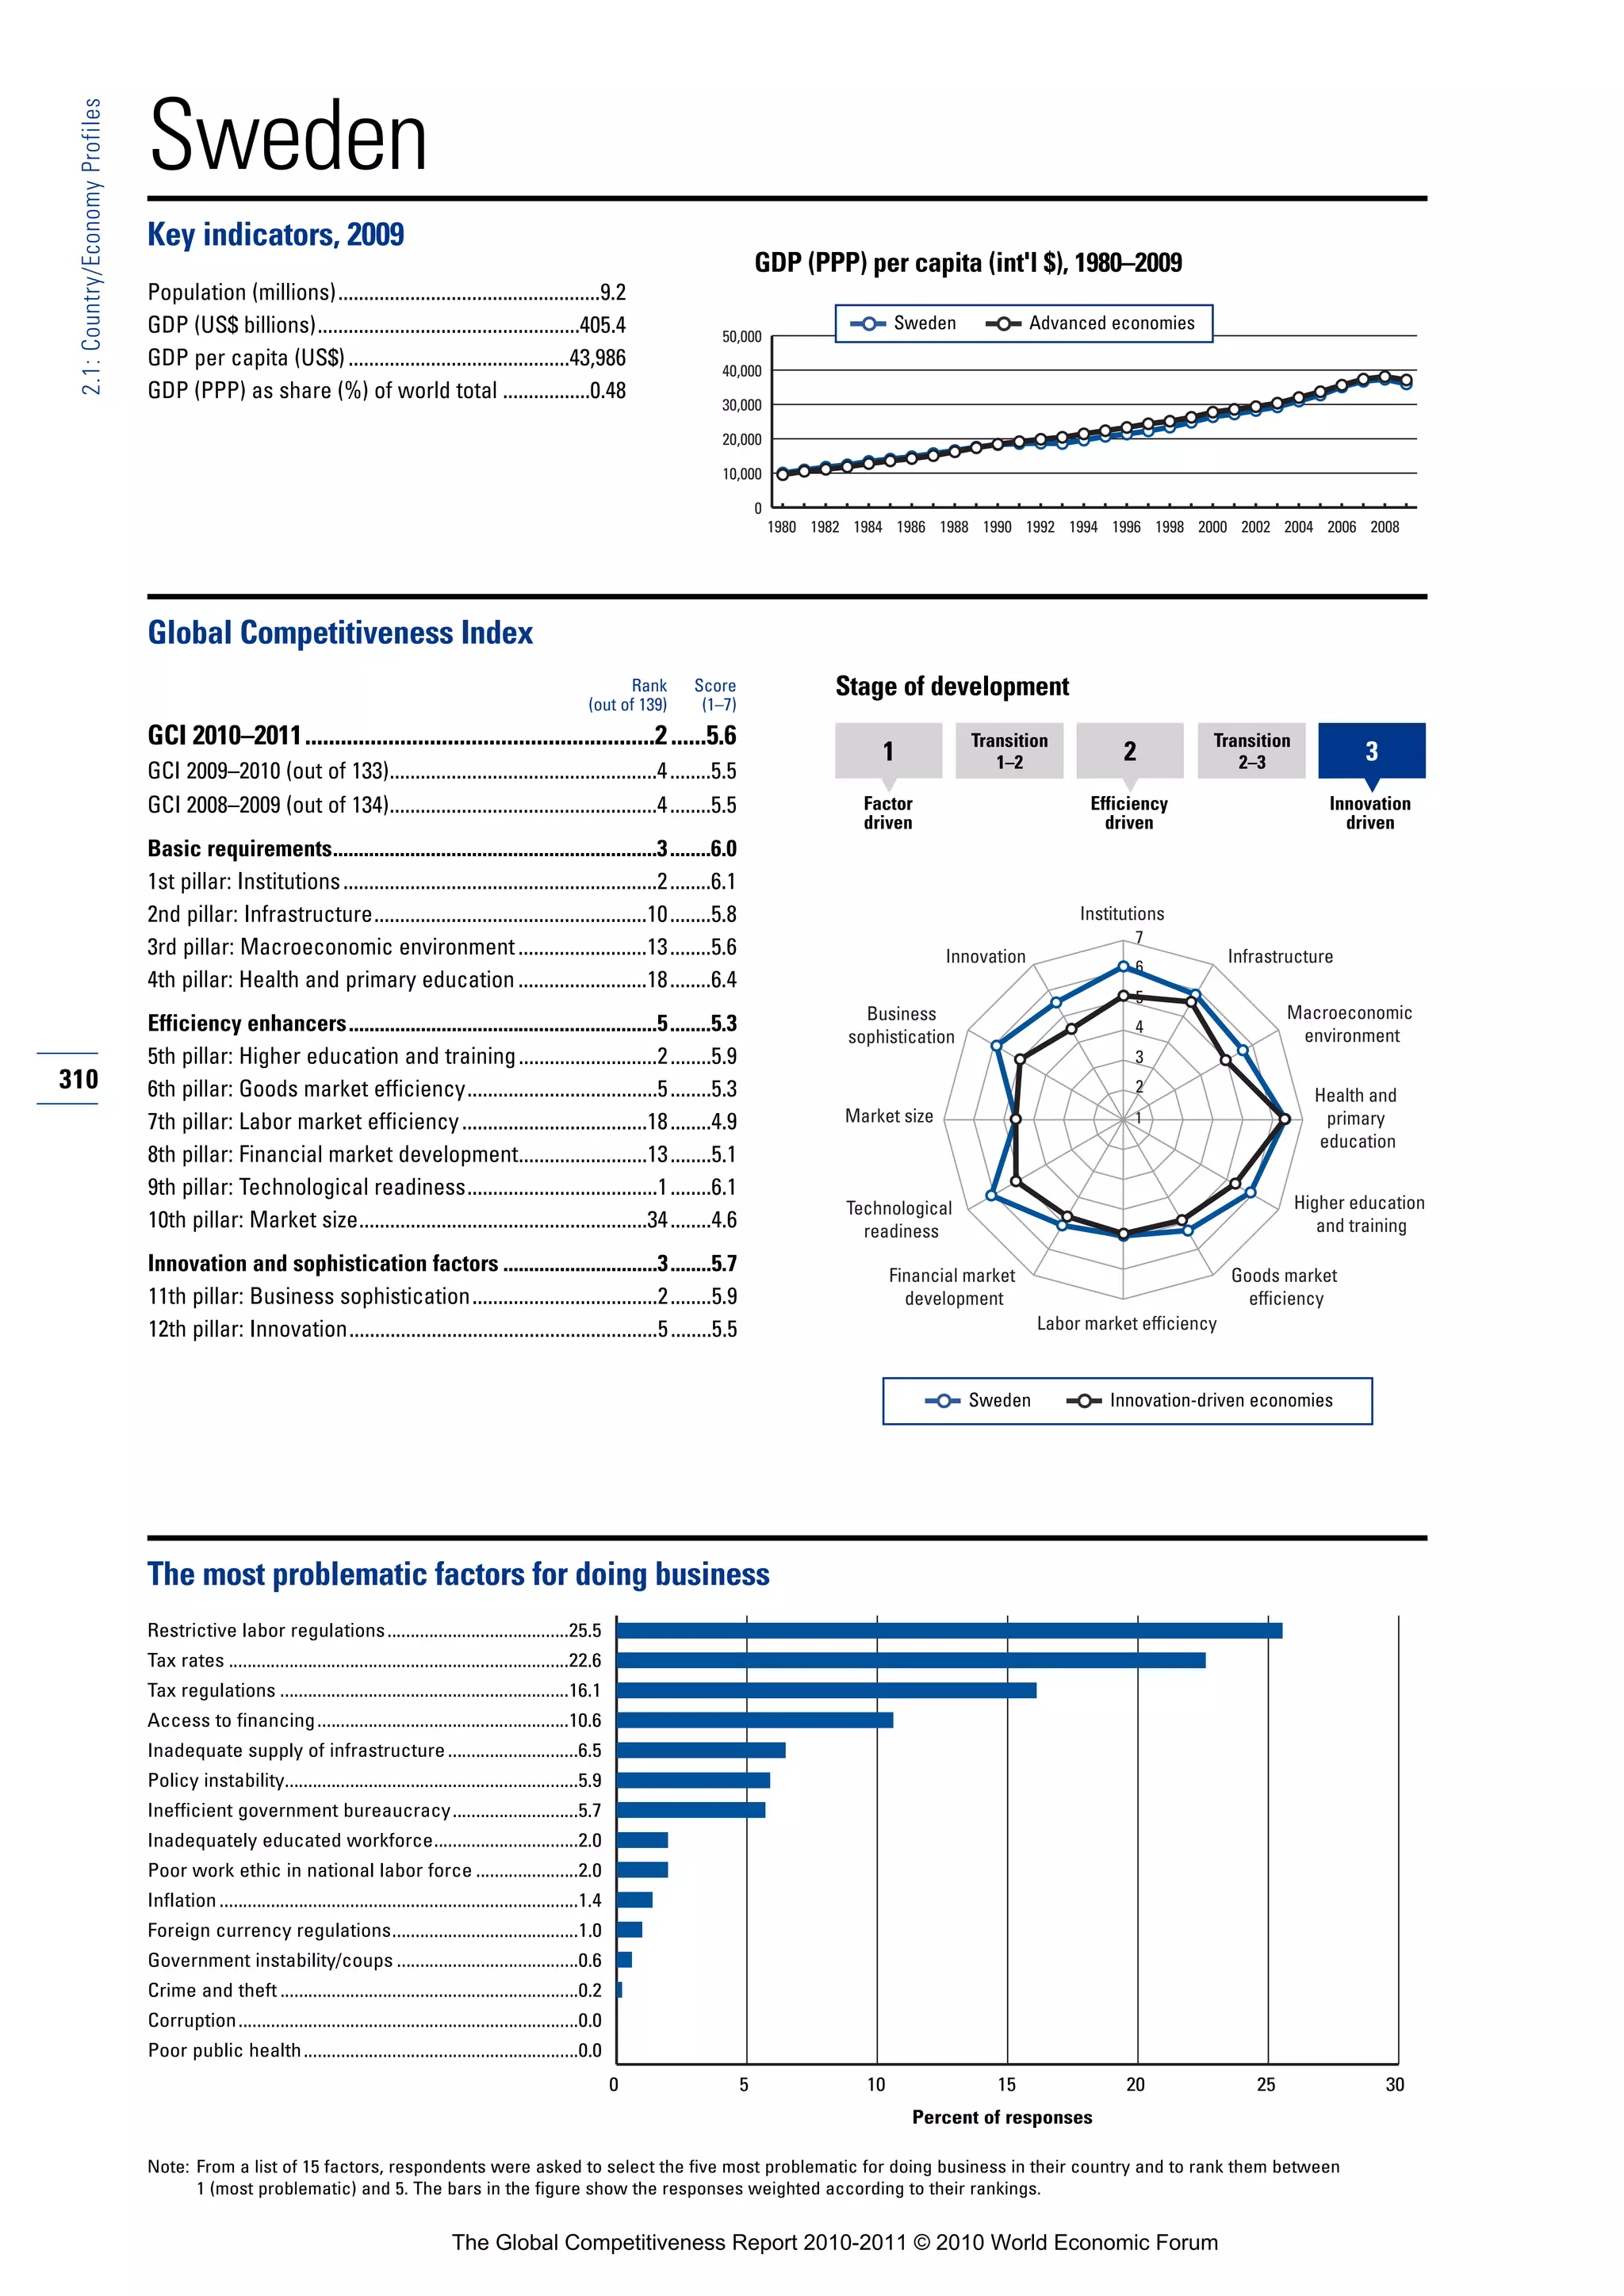
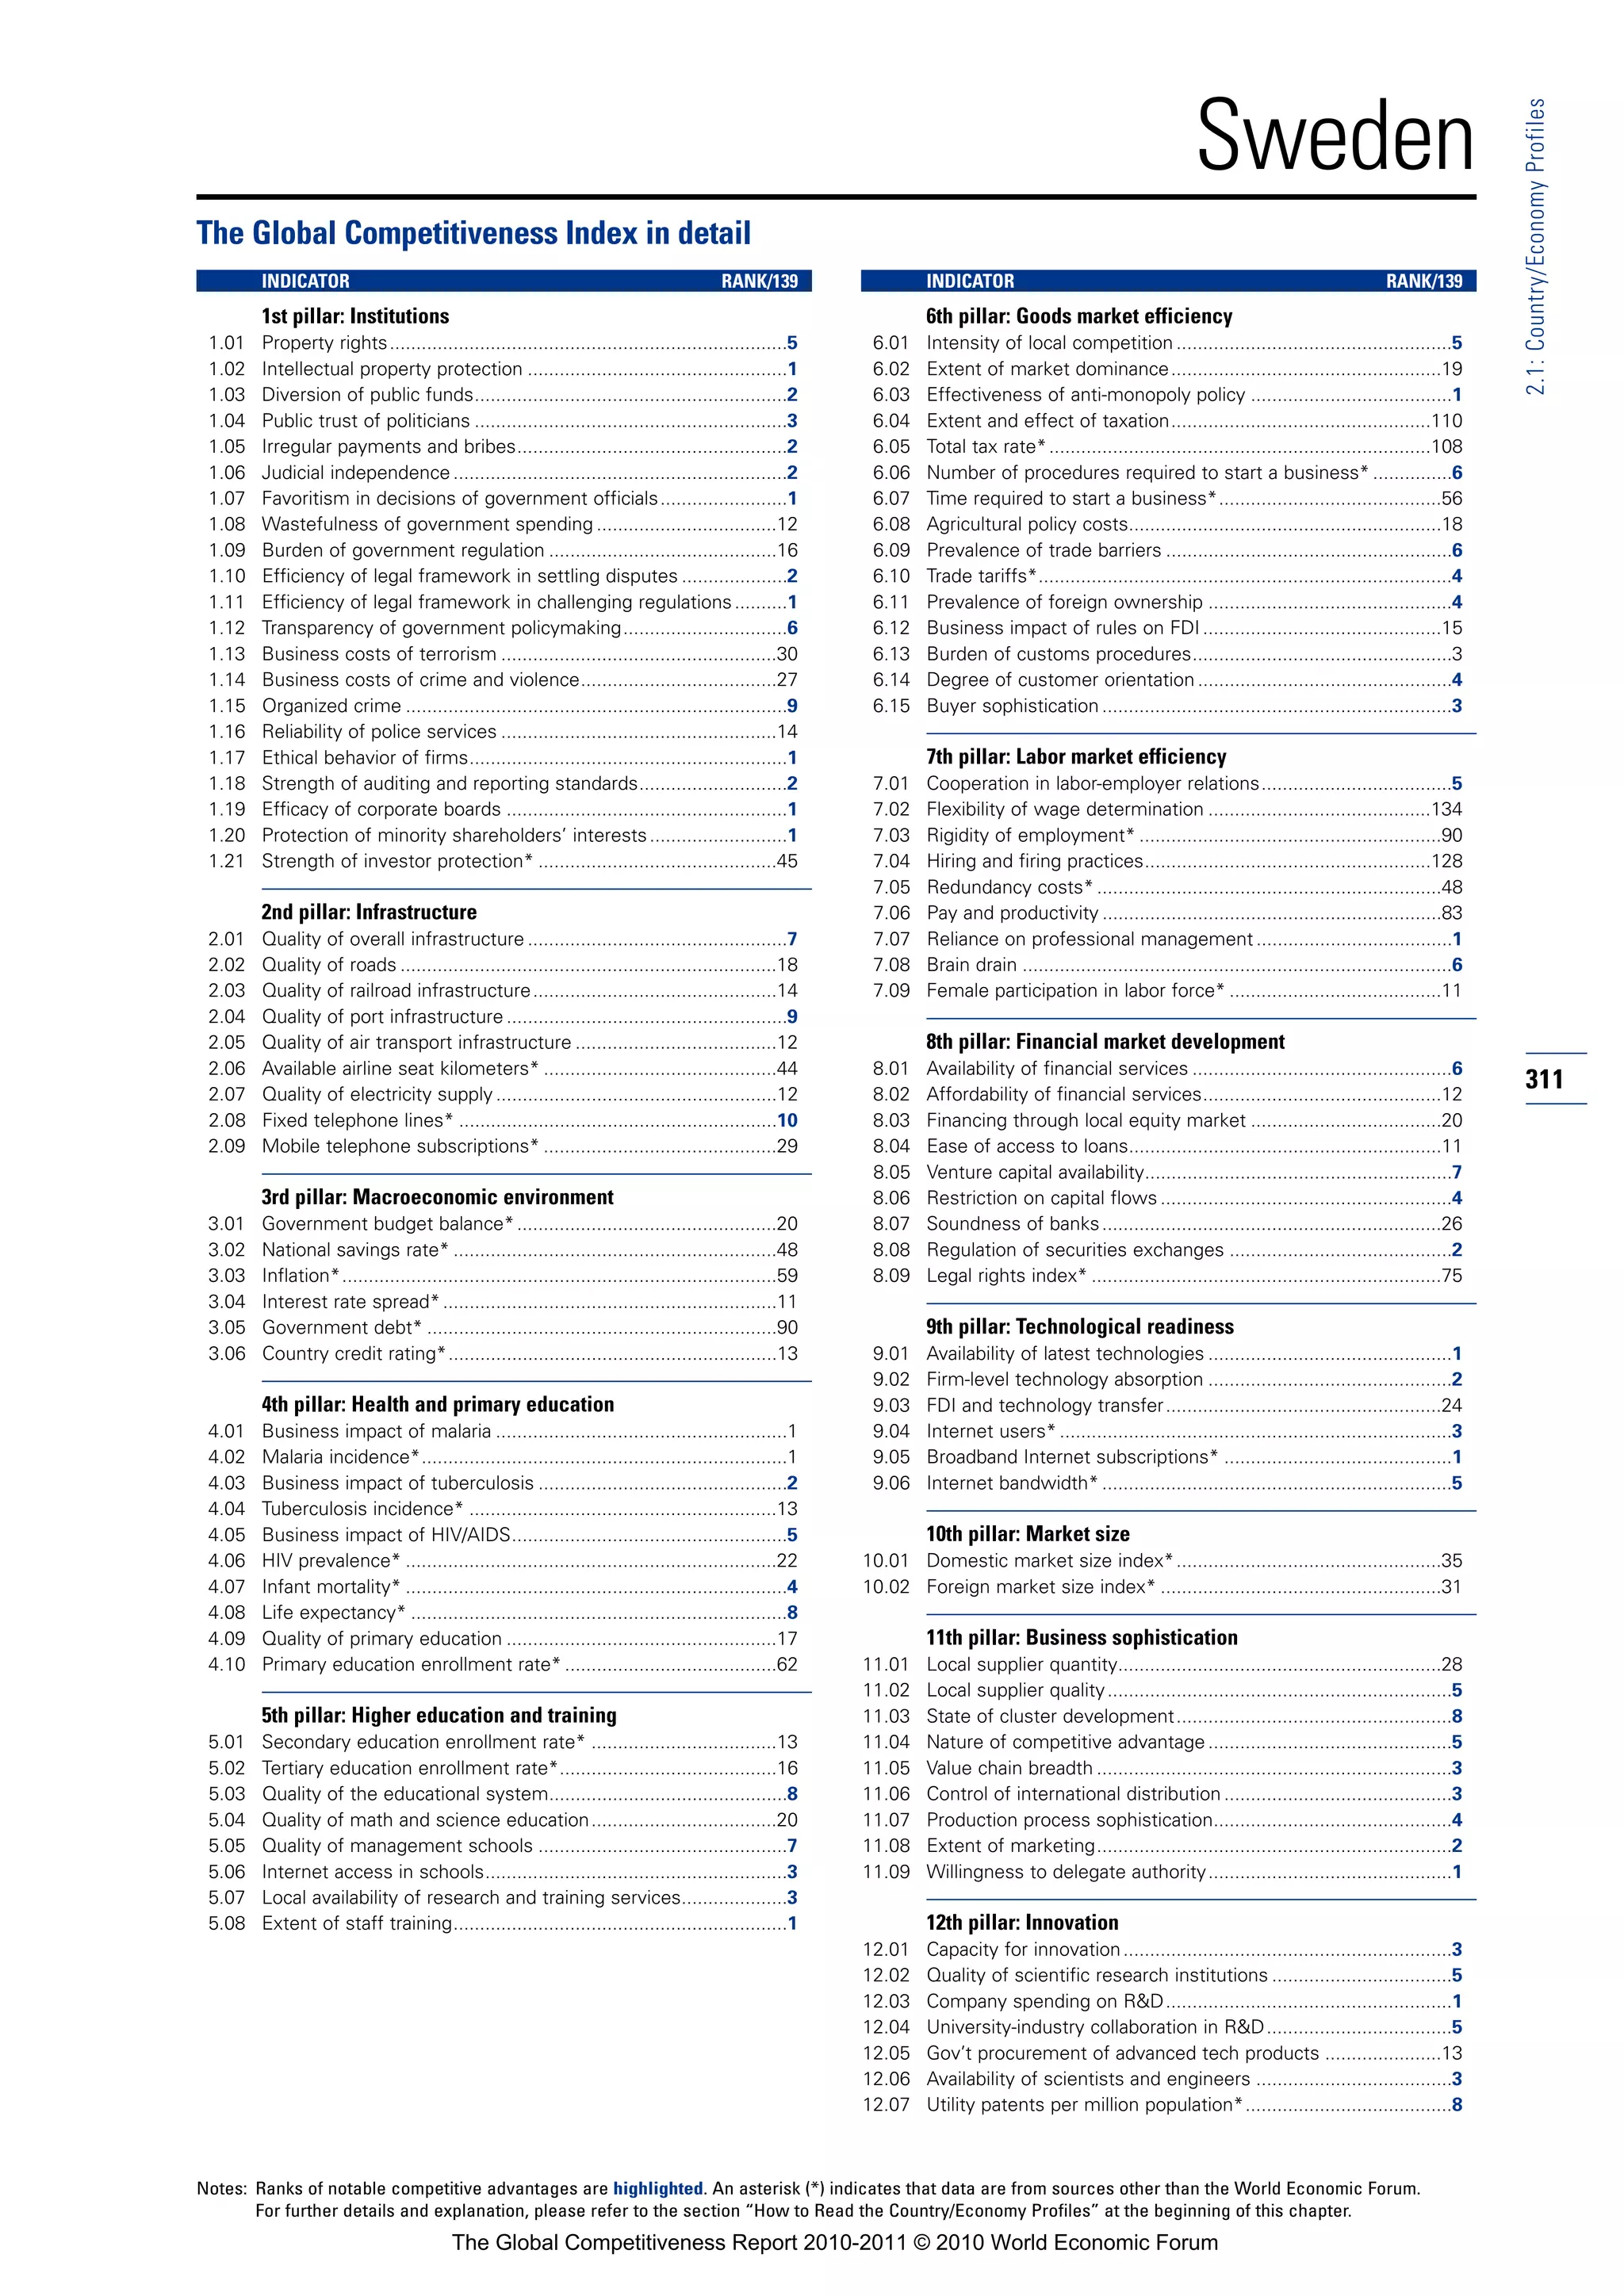
![1.01 Property rights
2.2: Data Tables | Section I: Institutions
How would you rate the protection of property rights, including financial assets, in your country? [1 = very weak; 7 = very strong] | 2009–10
weighted average
RANK COUNTRY/ECONOMY SCORE 1 MEAN: 4.4 7 RANK COUNTRY/ECONOMY SCORE 1 MEAN: 4.4 7
1 Switzerland ............................6.4 71 Latvia .....................................4.3
2 Finland ...................................6.4 72 Brazil ......................................4.3
3 Singapore ..............................6.3 73 Jamaica .................................4.3
4 Hong Kong SAR ....................6.3 74 Slovak Republic .....................4.2
5 Sweden .................................6.3 75 Trinidad and Tobago...............4.2
6 Luxembourg ..........................6.2 76 Ghana ....................................4.2
7 Austria ...................................6.2 77 Malawi ...................................4.2
8 Germany ................................6.1 78 Burkina Faso..........................4.2
9 Norway ..................................6.1 79 Romania ................................4.2
10 Canada...................................6.1 80 Zambia...................................4.1
11 Denmark ................................6.0 81 Vietnam .................................4.1
12 Puerto Rico............................5.9 82 El Salvador.............................4.1
13 Ireland....................................5.9 83 Turkey ....................................4.0
14 Australia.................................5.9 84 Indonesia ...............................4.0
15 Netherlands ...........................5.8 85 Senegal..................................4.0
16 France....................................5.8 86 Dominican Republic...............4.0
17 United Kingdom.....................5.8 87 Croatia ...................................4.0
18 New Zealand .........................5.7 88 Mexico...................................3.9
19 Taiwan, China ........................5.6 89 Thailand .................................3.9
20 Namibia .................................5.6 90 Azerbaijan ..............................3.9
21 Bahrain ..................................5.6 91 Colombia ...............................3.8
22 Barbados ...............................5.6 92 Peru .......................................3.8
23 Japan .....................................5.6 93 Honduras ...............................3.8
24 Oman.....................................5.5 94 Uganda ..................................3.8
25 Qatar......................................5.5 95 Guyana ..................................3.7
26 Belgium .................................5.4 96 Cameroon..............................3.7
27 Cyprus ...................................5.4 97 Tajikistan ................................3.7
28 Saudi Arabia...........................5.4 98 Armenia .................................3.7
29 South Africa...........................5.4 99 Philippines .............................3.7
30 Jordan....................................5.4 100 Cape Verde ............................3.7
366 31 Tunisia....................................5.4 101 Lesotho .................................3.7
32 Iceland ...................................5.4 102 Guatemala .............................3.7
33 Estonia...................................5.3 103 Kenya.....................................3.7
34 Malta .....................................5.3 104 Tanzania .................................3.7
35 Botswana ..............................5.3 105 Macedonia, FYR ....................3.6
36 Mauritius ...............................5.3 106 Algeria ...................................3.6
37 Chile ......................................5.2 107 Pakistan .................................3.6
38 China .....................................5.1 108 Mauritania..............................3.5
39 Gambia, The ..........................5.1 109 Mali........................................3.5
40 United States.........................5.1 110 Cambodia ..............................3.5
41 Malaysia ................................5.1 111 Libya ......................................3.5
42 Portugal .................................5.0 112 Kazakhstan ............................3.5
43 United Arab Emirates ............5.0 113 Bangladesh............................3.4
44 Rwanda .................................5.0 114 Côte d’Ivoire ..........................3.4
45 Spain......................................4.9 115 Mongolia................................3.4
46 Kuwait ...................................4.9 116 Albania...................................3.3
47 Swaziland ..............................4.9 117 Mozambique..........................3.3
48 Montenegro...........................4.8 118 Nigeria ...................................3.3
49 Israel ......................................4.7 119 Moldova.................................3.3
50 Uruguay .................................4.7 120 Georgia ..................................3.2
51 Panama..................................4.7 121 Bulgaria..................................3.2
52 Brunei Darussalam ................4.7 122 Serbia ....................................3.2
53 Greece...................................4.7 123 Ecuador .................................3.2
54 Korea, Rep.............................4.7 124 Nicaragua...............................3.1
55 Benin .....................................4.7 125 Nepal .....................................3.0
56 Egypt .....................................4.6 126 Madagascar ...........................3.0
57 Lebanon.................................4.6 127 Burundi ..................................3.0
58 Slovenia .................................4.6 128 Russian Federation................2.9
59 Poland....................................4.6 129 Paraguay................................2.9
60 Ethiopia..................................4.5 130 Angola ...................................2.9
61 India.......................................4.5 131 Timor-Leste............................2.8
62 Syria.......................................4.4 132 Kyrgyz Republic .....................2.8
63 Morocco ................................4.4 133 Bosnia and Herzegovina........2.7
64 Sri Lanka................................4.4 134 Argentina ...............................2.7
65 Czech Republic......................4.4 135 Ukraine ..................................2.6
66 Hungary .................................4.4 136 Chad ......................................2.4
67 Costa Rica .............................4.4 137 Bolivia ....................................2.2
68 Lithuania ................................4.3 138 Zimbabwe..............................2.2
69 Italy ........................................4.3 139 Venezuela ..............................1.8
70 Iran, Islamic Rep....................4.3
SOURCE: World Economic Forum, Executive Opinion Survey
The Global Competitiveness Report 2010-2011 © 2010 World Economic Forum](https://image.slidesharecdn.com/globalcompetitivenessreportwef2010-11-100928142139-phpapp02/75/Global-competitiveness-report-wef-2010-11-379-2048.jpg)
![1.02 Intellectual property protection
2.2: Data Tables | Section I: Institutions
How would you rate intellectual property protection, including anti-counterfeiting measures, in your country? [1 = very weak; 7 = very strong] |
2009–10 weighted average
RANK COUNTRY/ECONOMY SCORE 1 MEAN: 3.7 7 RANK COUNTRY/ECONOMY SCORE 1 MEAN: 3.7 7
1 Sweden .................................6.2 71 Ethiopia..................................3.4
2 Finland ...................................6.2 72 Morocco ................................3.4
3 Singapore ..............................6.1 73 Trinidad and Tobago...............3.3
4 Switzerland ............................6.0 74 Tanzania .................................3.3
5 Luxembourg ..........................6.0 75 Syria.......................................3.3
6 France....................................5.9 76 Ghana ....................................3.3
7 New Zealand .........................5.8 77 Burkina Faso..........................3.3
8 Puerto Rico............................5.8 78 Swaziland ..............................3.2
9 Germany ................................5.7 79 Jamaica .................................3.2
10 Netherlands ...........................5.7 80 Honduras ...............................3.2
11 Austria ...................................5.7 81 Romania ................................3.2
12 Denmark ................................5.7 82 Senegal..................................3.2
13 Canada...................................5.6 83 Tajikistan ................................3.1
14 Australia.................................5.6 84 Thailand .................................3.1
15 Ireland....................................5.6 85 Mexico...................................3.1
16 Norway ..................................5.6 86 Pakistan .................................3.1
17 United Kingdom.....................5.5 87 Macedonia, FYR ....................3.1
18 Hong Kong SAR ....................5.4 88 Zimbabwe..............................3.1
19 United Arab Emirates ............5.3 89 Brazil ......................................3.1
20 Oman.....................................5.3 90 Guyana ..................................3.1
21 Japan .....................................5.2 91 Benin .....................................3.0
22 Bahrain ..................................5.2 92 Lesotho .................................3.0
23 Belgium .................................5.1 93 Colombia ...............................3.0
24 United States.........................5.1 94 Kenya.....................................2.9
25 Iceland ...................................5.1 95 Nigeria ...................................2.9
26 Taiwan, China ........................4.9 96 El Salvador.............................2.9
27 South Africa...........................4.9 97 Georgia ..................................2.9
28 Qatar......................................4.8 98 Kazakhstan ............................2.8
29 Barbados ...............................4.8 99 Cambodia ..............................2.8
30 Saudi Arabia...........................4.8 100 Uganda ..................................2.8
31 Namibia .................................4.8 101 Albania...................................2.8 367
32 Cyprus ...................................4.7 102 Libya ......................................2.8
33 Malaysia ................................4.7 103 Philippines .............................2.8
34 Estonia...................................4.6 104 Dominican Republic...............2.8
35 Gambia, The ..........................4.6 105 Algeria ...................................2.7
36 Malta .....................................4.6 106 Cameroon..............................2.7
37 Tunisia....................................4.4 107 Armenia .................................2.7
38 Jordan....................................4.4 108 Mali........................................2.7
39 Slovenia .................................4.4 109 Vietnam .................................2.7
40 Portugal .................................4.4 110 Lebanon.................................2.7
41 Rwanda .................................4.4 111 Serbia ....................................2.6
42 Spain......................................4.3 112 Bulgaria..................................2.6
43 Israel ......................................4.2 113 Ukraine ..................................2.6
44 Korea, Rep.............................4.1 114 Iran, Islamic Rep....................2.6
45 Botswana ..............................4.1 115 Nicaragua...............................2.6
46 Sri Lanka................................4.1 116 Nepal .....................................2.6
47 Kuwait ...................................4.1 117 Turkey ....................................2.6
48 Panama..................................4.0 118 Moldova.................................2.6
49 China .....................................4.0 119 Russian Federation................2.6
50 Greece...................................4.0 120 Angola ...................................2.6
51 Hungary .................................4.0 121 Guatemala .............................2.6
52 Czech Republic......................3.9 122 Bangladesh............................2.6
53 Uruguay .................................3.9 123 Peru .......................................2.6
54 Mauritius ...............................3.9 124 Mozambique..........................2.5
55 Brunei Darussalam ................3.9 125 Mauritania..............................2.5
56 Malawi ...................................3.8 126 Argentina ...............................2.5
57 Slovak Republic .....................3.8 127 Cape Verde ............................2.5
58 Indonesia ...............................3.8 128 Ecuador .................................2.5
59 Chile ......................................3.7 129 Kyrgyz Republic .....................2.3
60 Poland....................................3.7 130 Mongolia................................2.3
61 Italy ........................................3.7 131 Chad ......................................2.3
62 Montenegro...........................3.6 132 Timor-Leste............................2.3
63 Azerbaijan ..............................3.6 133 Bosnia and Herzegovina........2.2
64 Latvia .....................................3.6 134 Madagascar ...........................2.2
65 Zambia...................................3.6 135 Paraguay................................2.2
66 India.......................................3.6 136 Côte d’Ivoire ..........................2.2
67 Egypt .....................................3.6 137 Venezuela ..............................1.9
68 Costa Rica .............................3.6 138 Burundi ..................................1.9
69 Lithuania ................................3.5 139 Bolivia ....................................1.9
70 Croatia ...................................3.5
SOURCE: World Economic Forum, Executive Opinion Survey
The Global Competitiveness Report 2010-2011 © 2010 World Economic Forum](https://image.slidesharecdn.com/globalcompetitivenessreportwef2010-11-100928142139-phpapp02/75/Global-competitiveness-report-wef-2010-11-380-2048.jpg)
![1.03 Diversion of public funds
2.2: Data Tables | Section I: Institutions
In your country, how common is diversion of public funds to companies, individuals, or groups due to corruption? [1 = very common; 7 = never
occurs] | 2009–10 weighted average
RANK COUNTRY/ECONOMY SCORE 1 MEAN: 3.7 7 RANK COUNTRY/ECONOMY SCORE 1 MEAN: 3.7 7
1 New Zealand .........................6.6 71 India.......................................3.2
2 Sweden .................................6.5 72 Timor-Leste............................3.2
3 Singapore ..............................6.4 73 Lesotho .................................3.2
4 Denmark ................................6.4 74 El Salvador.............................3.2
5 Finland ...................................6.3 75 Panama..................................3.2
6 Luxembourg ..........................6.1 76 Turkey ....................................3.2
7 Switzerland ............................6.1 77 Italy........................................3.1
8 Hong Kong SAR ....................6.0 78 Jamaica .................................3.1
9 Norway ..................................5.9 79 Latvia .....................................3.1
10 Netherlands ...........................5.9 80 Guyana ..................................3.1
11 United Kingdom.....................5.8 81 Trinidad and Tobago...............3.1
12 Qatar......................................5.8 82 South Africa...........................3.1
13 Australia.................................5.8 83 Egypt .....................................3.1
14 Germany ................................5.7 84 Romania ................................3.1
15 Rwanda .................................5.7 85 Tanzania .................................3.1
16 Canada...................................5.7 86 Peru .......................................3.1
17 Austria ...................................5.7 87 Cambodia ..............................3.0
18 Oman.....................................5.5 88 Azerbaijan ..............................3.0
19 Iceland ...................................5.5 89 Zambia...................................3.0
20 Tunisia....................................5.5 90 Croatia ...................................3.0
21 Ireland....................................5.3 91 Swaziland ..............................3.0
22 Bahrain ..................................5.3 92 Pakistan .................................3.0
23 Barbados ...............................5.3 93 Syria.......................................2.9
24 Israel ......................................5.3 94 Greece...................................2.9
25 France....................................5.2 95 Serbia ....................................2.9
26 United Arab Emirates ............5.2 96 Moldova.................................2.8
27 Japan .....................................5.2 97 Kazakhstan ............................2.8
28 Saudi Arabia...........................5.1 98 Mexico...................................2.8
29 Brunei Darussalam ................5.1 99 Senegal..................................2.8
30 Uruguay .................................5.1 100 Hungary .................................2.7
368 31 Belgium .................................5.1 101 Bulgaria..................................2.7
32 Cyprus ...................................5.0 102 Czech Republic......................2.7
33 Botswana ..............................4.8 103 Armenia .................................2.7
34 United States.........................4.7 104 Zimbabwe..............................2.7
35 Chile ......................................4.6 105 Mauritania..............................2.7
36 Taiwan, China ........................4.6 106 Colombia ...............................2.6
37 Estonia...................................4.6 107 Bangladesh............................2.6
38 Malta .....................................4.5 108 Mali........................................2.6
39 Cape Verde ............................4.5 109 Russian Federation................2.6
40 Gambia, The ..........................4.5 110 Honduras ...............................2.6
41 Jordan....................................4.3 111 Madagascar ...........................2.6
42 Montenegro...........................4.2 112 Nepal .....................................2.6
43 Poland....................................4.2 113 Slovak Republic .....................2.5
44 Namibia .................................4.2 114 Mozambique..........................2.5
45 Portugal .................................4.1 115 Burkina Faso..........................2.5
46 Georgia ..................................4.1 116 Lebanon.................................2.4
47 Malaysia ................................4.1 117 Benin .....................................2.4
48 Mauritius ...............................4.1 118 Nicaragua...............................2.4
49 Costa Rica .............................4.1 119 Bolivia ....................................2.3
50 Spain......................................4.0 120 Kyrgyz Republic .....................2.3
51 Puerto Rico............................3.9 121 Brazil ......................................2.3
52 Slovenia .................................3.9 122 Angola ...................................2.3
53 Malawi ...................................3.9 123 Libya ......................................2.3
54 Ethiopia..................................3.9 124 Cameroon..............................2.3
55 China .....................................3.8 125 Mongolia................................2.3
56 Korea, Rep.............................3.7 126 Nigeria ...................................2.2
57 Kuwait ...................................3.6 127 Kenya.....................................2.2
58 Albania...................................3.6 128 Guatemala .............................2.2
59 Macedonia, FYR ....................3.5 129 Ukraine ..................................2.2
60 Indonesia ...............................3.5 130 Ecuador .................................2.1
61 Sri Lanka................................3.5 131 Argentina ...............................2.1
62 Iran, Islamic Rep....................3.4 132 Côte d’Ivoire ..........................2.0
63 Morocco ................................3.4 133 Chad ......................................2.0
64 Bosnia and Herzegovina........3.4 134 Dominican Republic...............2.0
65 Thailand .................................3.3 135 Philippines .............................2.0
66 Vietnam .................................3.3 136 Uganda ..................................2.0
67 Algeria ...................................3.3 137 Venezuela ..............................1.9
68 Ghana ....................................3.3 138 Paraguay................................1.9
69 Tajikistan ................................3.3 139 Burundi ..................................1.8
70 Lithuania ................................3.3
SOURCE: World Economic Forum, Executive Opinion Survey
The Global Competitiveness Report 2010-2011 © 2010 World Economic Forum](https://image.slidesharecdn.com/globalcompetitivenessreportwef2010-11-100928142139-phpapp02/75/Global-competitiveness-report-wef-2010-11-381-2048.jpg)
![1.04 Public trust of politicians
2.2: Data Tables | Section I: Institutions
How would you rate the level of public trust in the ethical standards of politicians in your country? [1 = very low; 7 = very high] | 2009–10
weighted average
RANK COUNTRY/ECONOMY SCORE 1 MEAN: 3.1 7 RANK COUNTRY/ECONOMY SCORE 1 MEAN: 3.1 7
1 Singapore ..............................6.4 71 Lesotho .................................2.8
2 Qatar......................................6.1 72 Swaziland ..............................2.8
3 Sweden .................................5.8 73 Libya ......................................2.8
4 Luxembourg ..........................5.8 74 Sri Lanka................................2.7
5 New Zealand .........................5.6 75 Spain......................................2.6
6 Norway ..................................5.6 76 Moldova.................................2.6
7 United Arab Emirates ............5.6 77 Guyana ..................................2.6
8 Rwanda .................................5.4 78 Georgia ..................................2.6
9 Saudi Arabia...........................5.4 79 Puerto Rico............................2.5
10 Denmark ................................5.4 80 Benin .....................................2.5
11 Oman.....................................5.3 81 Turkey ....................................2.5
12 Switzerland ............................5.2 82 Poland....................................2.5
13 Finland ...................................5.1 83 Thailand .................................2.5
14 Netherlands ...........................5.0 84 Zambia...................................2.4
15 Tunisia....................................5.0 85 Algeria ...................................2.4
16 Hong Kong SAR ....................4.7 86 South Africa...........................2.4
17 Australia.................................4.6 87 Burkina Faso..........................2.4
18 Brunei Darussalam ................4.6 88 India.......................................2.3
19 Barbados ...............................4.6 89 Armenia .................................2.3
20 Gambia, The ..........................4.4 90 Honduras ...............................2.3
21 Botswana ..............................4.4 91 Pakistan .................................2.3
22 China .....................................4.3 92 Uganda ..................................2.2
23 Canada...................................4.2 93 Greece...................................2.2
24 Cape Verde ............................4.2 94 Mexico...................................2.2
25 Uruguay .................................4.2 95 Mali........................................2.2
26 Cyprus ...................................4.2 96 Croatia ...................................2.2
27 Bahrain ..................................4.1 97 Colombia ...............................2.2
28 Austria ...................................4.0 98 El Salvador.............................2.2
29 Germany ................................4.0 99 Serbia ....................................2.1
30 Namibia .................................4.0 100 Bosnia and Herzegovina........2.1
31 France....................................3.9 101 Cameroon..............................2.1 369
32 Vietnam .................................3.9 102 Panama..................................2.1
33 Malta .....................................3.9 103 Trinidad and Tobago...............2.1
34 Chile ......................................3.8 104 Bulgaria..................................2.1
35 Malaysia ................................3.8 105 Korea, Rep.............................2.1
36 Taiwan, China ........................3.7 106 Senegal..................................2.1
37 Israel ......................................3.7 107 Jamaica .................................2.1
38 Montenegro...........................3.7 108 Lithuania ................................2.0
39 Iran, Islamic Rep....................3.7 109 Bolivia ....................................2.0
40 Egypt .....................................3.6 110 Italy........................................2.0
41 Costa Rica .............................3.6 111 Kyrgyz Republic .....................2.0
42 Tajikistan ................................3.6 112 Mauritania..............................2.0
43 Jordan....................................3.5 113 Nicaragua...............................2.0
44 Iceland ...................................3.5 114 Zimbabwe..............................2.0
45 Azerbaijan ..............................3.5 115 Bangladesh............................2.0
46 Kuwait ...................................3.4 116 Romania ................................2.0
47 Kazakhstan ............................3.4 117 Chad ......................................1.9
48 Belgium .................................3.4 118 Mongolia................................1.9
49 Cambodia ..............................3.3 119 Latvia .....................................1.9
50 Syria.......................................3.3 120 Peru .......................................1.9
51 Indonesia ...............................3.3 121 Czech Republic......................1.9
52 Timor-Leste............................3.3 122 Ukraine ..................................1.9
53 Estonia...................................3.3 123 Burundi ..................................1.9
54 United States.........................3.3 124 Ecuador .................................1.8
55 United Kingdom.....................3.2 125 Nigeria ...................................1.8
56 Ethiopia..................................3.2 126 Dominican Republic...............1.8
57 Portugal .................................3.2 127 Brazil ......................................1.8
58 Japan .....................................3.1 128 Hungary .................................1.8
59 Morocco ................................3.1 129 Kenya.....................................1.7
60 Mauritius ...............................3.1 130 Nepal .....................................1.7
61 Malawi ...................................3.1 131 Guatemala .............................1.7
62 Tanzania .................................3.1 132 Slovak Republic .....................1.7
63 Albania...................................3.0 133 Paraguay................................1.7
64 Mozambique..........................3.0 134 Philippines .............................1.6
65 Ireland....................................3.0 135 Madagascar ...........................1.6
66 Angola ...................................3.0 136 Lebanon.................................1.6
67 Ghana ....................................2.9 137 Côte d’Ivoire ..........................1.6
68 Macedonia, FYR ....................2.9 138 Argentina ...............................1.5
69 Russian Federation................2.9 139 Venezuela ..............................1.5
70 Slovenia .................................2.9
SOURCE: World Economic Forum, Executive Opinion Survey
The Global Competitiveness Report 2010-2011 © 2010 World Economic Forum](https://image.slidesharecdn.com/globalcompetitivenessreportwef2010-11-100928142139-phpapp02/75/Global-competitiveness-report-wef-2010-11-382-2048.jpg)
![1.06 Judicial independence
2.2: Data Tables | Section I: Institutions
To what extent is the judiciary in your country independent from influences of members of government, citizens, or firms? [1 = heavily influenced;
7 = entirely independent] | 2009–10 weighted average
RANK COUNTRY/ECONOMY SCORE 1 MEAN: 4.0 7 RANK COUNTRY/ECONOMY SCORE 1 MEAN: 4.0 7
1 New Zealand .........................6.8 71 Latvia .....................................3.7
2 Sweden .................................6.6 72 Swaziland ..............................3.6
3 Denmark ................................6.4 73 Lithuania ................................3.6
4 Switzerland ............................6.4 74 Pakistan .................................3.6
5 Germany ................................6.4 75 Greece...................................3.5
6 Finland ...................................6.3 76 Brazil ......................................3.5
7 Qatar......................................6.3 77 Tanzania .................................3.5
8 United Kingdom.....................6.3 78 Colombia ...............................3.5
9 Australia.................................6.3 79 Morocco ................................3.5
10 Ireland....................................6.2 80 Nigeria ...................................3.5
11 Canada...................................6.2 81 Italy........................................3.5
12 Netherlands ...........................6.2 82 Romania ................................3.5
13 Norway ..................................6.2 83 Turkey ....................................3.4
14 Israel ......................................6.2 84 Uganda ..................................3.4
15 Hong Kong SAR ....................6.1 85 Bangladesh............................3.4
16 Iceland ...................................5.9 86 Guyana ..................................3.4
17 Luxembourg ..........................5.9 87 Azerbaijan ..............................3.3
18 Austria ...................................5.8 88 Albania...................................3.3
19 Barbados ...............................5.7 89 Ethiopia..................................3.3
20 Japan .....................................5.7 90 Benin .....................................3.3
21 Singapore ..............................5.6 91 Lesotho .................................3.2
22 Cyprus ...................................5.5 92 Mexico...................................3.2
23 Namibia .................................5.5 93 Nepal .....................................3.2
24 Estonia...................................5.5 94 Tajikistan ................................3.2
25 Chile ......................................5.4 95 Libya ......................................3.1
26 Costa Rica .............................5.3 96 Honduras ...............................3.1
27 Uruguay .................................5.3 97 Croatia ...................................3.1
28 Belgium .................................5.2 98 Senegal..................................3.1
29 Saudi Arabia...........................5.2 99 Dominican Republic...............3.1
30 Botswana ..............................5.2 100 El Salvador.............................3.0
31 Oman.....................................5.1 101 Bulgaria..................................3.0 371
32 Rwanda .................................5.1 102 Angola ...................................3.0
33 Malta .....................................5.0 103 Macedonia, FYR ....................2.9
34 Bahrain ..................................5.0 104 Georgia ..................................2.9
35 United States.........................5.0 105 Mozambique..........................2.9
36 Kuwait ...................................4.9 106 Slovak Republic .....................2.9
37 United Arab Emirates ............4.9 107 Syria.......................................2.9
38 Mauritius ...............................4.8 108 Cambodia ..............................2.9
39 France....................................4.8 109 Kazakhstan ............................2.9
40 Tunisia....................................4.8 110 Mali........................................2.8
41 India.......................................4.8 111 Philippines .............................2.8
42 Puerto Rico............................4.7 112 Algeria ...................................2.8
43 Brunei Darussalam ................4.7 113 Lebanon.................................2.7
44 South Africa...........................4.7 114 Guatemala .............................2.7
45 Trinidad and Tobago...............4.7 115 Russian Federation................2.7
46 Sri Lanka................................4.7 116 Chad ......................................2.7
47 Malawi ...................................4.6 117 Cameroon..............................2.6
48 Jordan....................................4.6 118 Armenia .................................2.6
49 Taiwan, China ........................4.6 119 Peru .......................................2.6
50 Gambia, The ..........................4.6 120 Mongolia................................2.6
51 Jamaica .................................4.5 121 Kenya.....................................2.6
52 Malaysia ................................4.3 122 Bosnia and Herzegovina........2.6
53 Poland....................................4.3 123 Argentina ...............................2.6
54 Thailand .................................4.3 124 Serbia ....................................2.5
55 Portugal .................................4.3 125 Panama..................................2.5
56 Slovenia .................................4.2 126 Madagascar ...........................2.5
57 Montenegro...........................4.1 127 Burkina Faso..........................2.5
58 Cape Verde ............................4.1 128 Mauritania..............................2.4
59 Hungary .................................4.0 129 Bolivia ....................................2.3
60 Korea, Rep.............................4.0 130 Moldova.................................2.3
61 Czech Republic......................4.0 131 Zimbabwe..............................2.3
62 China .....................................4.0 132 Nicaragua...............................2.1
63 Egypt .....................................3.9 133 Kyrgyz Republic .....................2.1
64 Vietnam .................................3.9 134 Ukraine ..................................2.0
65 Iran, Islamic Rep....................3.8 135 Ecuador .................................2.0
66 Spain......................................3.8 136 Burundi ..................................1.9
67 Indonesia ...............................3.8 137 Côte d’Ivoire ..........................1.9
68 Ghana ....................................3.8 138 Paraguay................................1.7
69 Zambia...................................3.8 139 Venezuela ..............................1.7
70 Timor-Leste............................3.7
SOURCE: World Economic Forum, Executive Opinion Survey
The Global Competitiveness Report 2010-2011 © 2010 World Economic Forum](https://image.slidesharecdn.com/globalcompetitivenessreportwef2010-11-100928142139-phpapp02/75/Global-competitiveness-report-wef-2010-11-384-2048.jpg)
![1.07 Favoritism in decisions of government officials
2.2: Data Tables | Section I: Institutions
To what extent do government officials in your country show favoritism to well-connected firms and individuals when deciding upon policies and
contracts? [1 = always show favoritism; 7 = never show favoritism] | 2009–10 weighted average
RANK COUNTRY/ECONOMY SCORE 1 MEAN: 3.3 7 RANK COUNTRY/ECONOMY SCORE 1 MEAN: 3.3 7
1 Sweden .................................6.0 71 Macedonia, FYR ....................2.9
2 New Zealand .........................5.7 72 India.......................................2.9
3 Singapore ..............................5.6 73 Peru .......................................2.9
4 Qatar......................................5.4 74 Brazil ......................................2.9
5 Denmark ................................5.4 75 Benin .....................................2.9
6 Netherlands ...........................5.2 76 Thailand .................................2.9
7 Norway ..................................5.2 77 Trinidad and Tobago...............2.8
8 Rwanda .................................5.1 78 Armenia .................................2.8
9 Finland ...................................5.0 79 Ghana ....................................2.8
10 Switzerland ............................4.8 80 Cameroon..............................2.8
11 Luxembourg ..........................4.8 81 Kazakhstan ............................2.8
12 Tunisia....................................4.7 82 Algeria ...................................2.8
13 Saudi Arabia...........................4.6 83 Mexico...................................2.8
14 Japan .....................................4.6 84 Korea, Rep.............................2.8
15 United Arab Emirates ............4.6 85 Swaziland ..............................2.8
16 Germany ................................4.6 86 Senegal..................................2.8
17 Oman.....................................4.6 87 Pakistan .................................2.8
18 Gambia, The ..........................4.6 88 Puerto Rico............................2.8
19 Australia.................................4.6 89 Turkey ....................................2.8
20 Canada...................................4.3 90 Lesotho .................................2.7
21 Chile ......................................4.3 91 Syria.......................................2.7
22 Botswana ..............................4.2 92 Kyrgyz Republic .....................2.7
23 United Kingdom.....................4.2 93 Croatia ...................................2.7
24 Uruguay .................................4.1 94 Moldova.................................2.7
25 Hong Kong SAR ....................4.0 95 Egypt .....................................2.7
26 Austria ...................................4.0 96 Bosnia and Herzegovina........2.7
27 Belgium .................................3.9 97 Chad ......................................2.7
28 Indonesia ...............................3.9 98 Timor-Leste............................2.7
29 Iceland ...................................3.9 99 Guyana ..................................2.7
30 Brunei Darussalam ................3.9 100 Madagascar ...........................2.6
372 31 Barbados ...............................3.9 101 Mauritania..............................2.6
32 France....................................3.8 102 South Africa...........................2.6
33 Montenegro...........................3.8 103 Panama..................................2.6
34 Israel ......................................3.8 104 Latvia .....................................2.6
35 Taiwan, China ........................3.8 105 Greece...................................2.6
36 Estonia...................................3.8 106 Russian Federation................2.6
37 China .....................................3.8 107 Czech Republic......................2.6
38 Malaysia ................................3.7 108 El Salvador.............................2.6
39 Costa Rica .............................3.6 109 Hungary .................................2.6
40 Cyprus ...................................3.6 110 Zimbabwe..............................2.6
41 Ireland....................................3.6 111 Bulgaria..................................2.6
42 Bahrain ..................................3.6 112 Ecuador .................................2.6
43 Cape Verde ............................3.5 113 Burundi ..................................2.5
44 Jordan....................................3.5 114 Mali........................................2.5
45 Namibia .................................3.5 115 Italy........................................2.5
46 Malta .....................................3.5 116 Jamaica .................................2.5
47 Kuwait ...................................3.5 117 Bangladesh............................2.5
48 Iran, Islamic Rep....................3.5 118 Colombia ...............................2.5
49 Poland....................................3.4 119 Honduras ...............................2.5
50 Tanzania .................................3.4 120 Uganda ..................................2.4
51 Ethiopia..................................3.3 121 Kenya.....................................2.4
52 Morocco ................................3.3 122 Libya ......................................2.4
53 Malawi ...................................3.3 123 Romania ................................2.4
54 Lithuania ................................3.3 124 Nigeria ...................................2.4
55 United States.........................3.3 125 Serbia ....................................2.4
56 Tajikistan ................................3.3 126 Guatemala .............................2.3
57 Spain......................................3.2 127 Ukraine ..................................2.3
58 Cambodia ..............................3.2 128 Bolivia ....................................2.3
59 Zambia...................................3.2 129 Côte d’Ivoire ..........................2.3
60 Sri Lanka................................3.2 130 Nicaragua...............................2.3
61 Vietnam .................................3.1 131 Philippines .............................2.2
62 Mauritius ...............................3.1 132 Angola ...................................2.2
63 Portugal .................................3.1 133 Paraguay................................2.2
64 Azerbaijan ..............................3.1 134 Mongolia................................2.2
65 Albania...................................3.1 135 Venezuela ..............................2.0
66 Nepal .....................................3.0 136 Lebanon.................................2.0
67 Burkina Faso..........................3.0 137 Argentina ...............................1.9
68 Georgia ..................................3.0 138 Slovak Republic .....................1.9
69 Slovenia .................................3.0 139 Dominican Republic...............1.8
70 Mozambique..........................3.0
SOURCE: World Economic Forum, Executive Opinion Survey
The Global Competitiveness Report 2010-2011 © 2010 World Economic Forum](https://image.slidesharecdn.com/globalcompetitivenessreportwef2010-11-100928142139-phpapp02/75/Global-competitiveness-report-wef-2010-11-385-2048.jpg)
![1.08 Wastefulness of government spending
2.2: Data Tables | Section I: Institutions
How would you rate the composition of public spending in your country? [1 = extremely wasteful; 7 = highly efficient in providing necessary goods
and services] | 2009–10 weighted average
RANK COUNTRY/ECONOMY SCORE 1 MEAN: 3.4 7 RANK COUNTRY/ECONOMY SCORE 1 MEAN: 3.4 7
1 Singapore ..............................6.1 71 Korea, Rep.............................3.2
2 Rwanda .................................5.8 72 United Kingdom.....................3.2
3 Qatar......................................5.7 73 Syria.......................................3.2
4 Oman.....................................5.6 74 Morocco ................................3.2
5 Tunisia....................................5.3 75 Trinidad and Tobago...............3.1
6 Saudi Arabia...........................5.2 76 Poland....................................3.1
7 United Arab Emirates ............5.2 77 Burkina Faso..........................3.1
8 Bahrain ..................................5.1 78 Lesotho .................................3.1
9 Switzerland ............................5.0 79 Bangladesh............................3.1
10 Gambia, The ..........................5.0 80 Mozambique..........................3.1
11 Hong Kong SAR ....................5.0 81 Mexico...................................3.1
12 Sweden .................................4.9 82 Russian Federation................3.1
13 Luxembourg ..........................4.8 83 Vietnam .................................3.1
14 Finland ...................................4.7 84 Panama..................................3.1
15 Botswana ..............................4.7 85 Iran, Islamic Rep....................3.0
16 Denmark ................................4.6 86 Macedonia, FYR ....................3.0
17 Netherlands ...........................4.6 87 Colombia ...............................3.0
18 Barbados ...............................4.5 88 Zambia...................................3.0
19 Brunei Darussalam ................4.5 89 Moldova.................................3.0
20 Norway ..................................4.4 90 Bulgaria..................................3.0
21 Australia.................................4.4 91 Japan .....................................3.0
22 New Zealand .........................4.3 92 Slovenia .................................2.9
23 Montenegro...........................4.3 93 Ireland....................................2.9
24 Iceland ...................................4.2 94 Mali........................................2.9
25 Malaysia ................................4.2 95 Czech Republic......................2.9
26 Chile ......................................4.2 96 Turkey ....................................2.9
27 Namibia .................................4.2 97 Uruguay .................................2.8
28 Austria ...................................4.2 98 Jamaica .................................2.8
29 Cyprus ...................................4.2 99 Nepal .....................................2.8
30 Indonesia ...............................4.2 100 Cameroon..............................2.8
31 Ethiopia..................................4.1 101 Spain......................................2.7 373
32 Canada...................................4.1 102 Puerto Rico............................2.7
33 Germany ................................4.0 103 Kenya.....................................2.7
34 Malawi ...................................4.0 104 Senegal..................................2.7
35 China .....................................3.9 105 Nicaragua...............................2.7
36 Mauritius ...............................3.9 106 Swaziland ..............................2.6
37 Malta .....................................3.8 107 Bolivia ....................................2.6
38 Peru .......................................3.8 108 Italy........................................2.6
39 Taiwan, China ........................3.8 109 Madagascar ...........................2.5
40 Benin .....................................3.7 110 Romania ................................2.5
41 Tajikistan ................................3.7 111 Chad ......................................2.5
42 Jordan....................................3.7 112 Uganda ..................................2.5
43 Cape Verde ............................3.6 113 Kyrgyz Republic .....................2.5
44 Israel ......................................3.6 114 Portugal .................................2.5
45 Thailand .................................3.6 115 Zimbabwe..............................2.5
46 Costa Rica .............................3.6 116 Angola ...................................2.4
47 Belgium .................................3.6 117 Lithuania ................................2.4
48 France....................................3.5 118 Philippines .............................2.4
49 Estonia...................................3.5 119 Slovak Republic .....................2.4
50 Cambodia ..............................3.5 120 Latvia .....................................2.4
51 Egypt .....................................3.5 121 Croatia ...................................2.4
52 Georgia ..................................3.4 122 Bosnia and Herzegovina........2.4
53 Albania...................................3.4 123 Honduras ...............................2.3
54 Armenia .................................3.4 124 Serbia ....................................2.3
55 Kazakhstan ............................3.4 125 Burundi ..................................2.3
56 Sri Lanka................................3.4 126 Hungary .................................2.2
57 India.......................................3.4 127 Paraguay................................2.2
58 Pakistan .................................3.4 128 Greece...................................2.2
59 Azerbaijan ..............................3.4 129 Guatemala .............................2.2
60 South Africa...........................3.4 130 Lebanon.................................2.2
61 Guyana ..................................3.4 131 Ukraine ..................................2.1
62 Timor-Leste............................3.3 132 Côte d’Ivoire ..........................2.1
63 Tanzania .................................3.3 133 Ecuador .................................2.1
64 Algeria ...................................3.3 134 Argentina ...............................2.1
65 Libya ......................................3.3 135 Nigeria ...................................2.0
66 Kuwait ...................................3.3 136 Brazil ......................................1.8
67 Ghana ....................................3.3 137 Venezuela ..............................1.7
68 United States.........................3.3 138 Dominican Republic...............1.7
69 El Salvador.............................3.3 139 Mongolia................................1.6
70 Mauritania..............................3.3
SOURCE: World Economic Forum, Executive Opinion Survey
The Global Competitiveness Report 2010-2011 © 2010 World Economic Forum](https://image.slidesharecdn.com/globalcompetitivenessreportwef2010-11-100928142139-phpapp02/75/Global-competitiveness-report-wef-2010-11-386-2048.jpg)
![1.09 Burden of government regulation
2.2: Data Tables | Section I: Institutions
How burdensome is it for businesses in your country to comply with governmental administrative requirements (e.g., permits, regulations,
reporting)? [1 = extremely burdensome; 7 = not burdensome at all] | 2009–10 weighted average
RANK COUNTRY/ECONOMY SCORE 1 MEAN: 3.3 7 RANK COUNTRY/ECONOMY SCORE 1 MEAN: 3.3 7
1 Singapore ..............................5.5 71 Swaziland ..............................3.2
2 Hong Kong SAR ....................5.1 72 Pakistan .................................3.2
3 Rwanda .................................5.0 73 Kazakhstan ............................3.2
4 Georgia ..................................4.6 74 Bolivia ....................................3.2
5 Gambia, The ..........................4.6 75 Burundi ..................................3.2
6 Qatar......................................4.5 76 Bulgaria..................................3.2
7 Estonia...................................4.4 77 Netherlands ...........................3.1
8 Oman.....................................4.3 78 Dominican Republic...............3.1
9 Mauritania..............................4.3 79 Egypt .....................................3.1
10 Finland ...................................4.3 80 Zimbabwe..............................3.1
11 United Arab Emirates ............4.3 81 Turkey ....................................3.1
12 Iceland ...................................4.3 82 Lebanon.................................3.1
13 Barbados ...............................4.3 83 Uruguay .................................3.1
14 Switzerland ............................4.2 84 Kyrgyz Republic .....................3.1
15 Tunisia....................................4.2 85 Israel......................................3.1
16 Sweden .................................4.0 86 Nigeria ...................................3.1
17 Malaysia ................................4.0 87 Ireland....................................3.1
18 Saudi Arabia...........................4.0 88 Latvia .....................................3.1
19 Bahrain ..................................4.0 89 United Kingdom.....................3.1
20 Albania...................................4.0 90 Macedonia, FYR ....................3.1
21 China .....................................4.0 91 Armenia .................................3.1
22 Luxembourg ..........................4.0 92 Germany................................3.0
23 Cyprus ...................................4.0 93 Madagascar ...........................3.0
24 Uganda ..................................3.9 94 South Africa...........................3.0
25 New Zealand .........................3.9 95 India.......................................3.0
26 Denmark ................................3.8 96 Malta .....................................3.0
27 Ethiopia..................................3.8 97 Ecuador .................................2.9
28 Zambia...................................3.8 98 Romania ................................2.9
29 Mauritius ...............................3.8 99 Iran, Islamic Rep....................2.9
30 Taiwan, China ........................3.7 100 Chad ......................................2.9
374 31 Montenegro...........................3.7 101 Cameroon..............................2.9
32 Azerbaijan ..............................3.7 102 Bangladesh............................2.9
33 Brunei Darussalam ................3.7 103 Côte d’Ivoire ..........................2.9
34 Benin .....................................3.7 104 Moldova.................................2.8
35 Honduras ...............................3.7 105 Slovak Republic .....................2.8
36 Indonesia ...............................3.7 106 Kenya.....................................2.8
37 Malawi ...................................3.7 107 Bosnia and Herzegovina........2.8
38 Namibia .................................3.6 108 Korea, Rep.............................2.8
39 Austria ...................................3.6 109 Libya ......................................2.8
40 Panama..................................3.6 110 Spain......................................2.8
41 Canada...................................3.6 111 Poland....................................2.7
42 Thailand .................................3.6 112 Jamaica .................................2.7
43 Tajikistan ................................3.6 113 Mongolia................................2.7
44 Botswana ..............................3.6 114 Nepal .....................................2.7
45 Chile ......................................3.6 115 Lithuania ................................2.7
46 Guatemala .............................3.6 116 Mexico...................................2.7
47 Ghana ....................................3.5 117 Kuwait ...................................2.7
48 Guyana ..................................3.5 118 Czech Republic......................2.7
49 United States.........................3.5 119 Peru .......................................2.7
50 Jordan....................................3.5 120 Vietnam .................................2.6
51 Trinidad and Tobago...............3.5 121 Belgium .................................2.6
52 Slovenia .................................3.5 122 France....................................2.6
53 Timor-Leste............................3.5 123 Argentina ...............................2.6
54 Mali........................................3.4 124 Colombia ...............................2.6
55 El Salvador.............................3.4 125 Ukraine ..................................2.6
56 Senegal..................................3.4 126 Philippines .............................2.5
57 Mozambique..........................3.4 127 Portugal .................................2.5
58 Paraguay ................................3.4 128 Russian Federation................2.5
59 Norway ..................................3.4 129 Greece...................................2.4
60 Australia.................................3.4 130 Syria.......................................2.3
61 Morocco ................................3.4 131 Serbia ....................................2.3
62 Lesotho .................................3.4 132 Algeria ...................................2.3
63 Nicaragua...............................3.4 133 Italy........................................2.2
64 Cambodia ..............................3.4 134 Hungary .................................2.2
65 Burkina Faso..........................3.3 135 Venezuela ..............................2.1
66 Tanzania .................................3.3 136 Croatia ...................................2.1
67 Cape Verde ............................3.3 137 Angola ...................................2.0
68 Sri Lanka................................3.3 138 Puerto Rico............................2.0
69 Costa Rica .............................3.3 139 Brazil ......................................1.9
70 Japan .....................................3.3
SOURCE: World Economic Forum, Executive Opinion Survey
The Global Competitiveness Report 2010-2011 © 2010 World Economic Forum](https://image.slidesharecdn.com/globalcompetitivenessreportwef2010-11-100928142139-phpapp02/75/Global-competitiveness-report-wef-2010-11-387-2048.jpg)
![1.10 Efficiency of legal framework in settling disputes
2.2: Data Tables | Section I: Institutions
How efficient is the legal framework in your country for private businesses in settling disputes? [1 = extremely inefficient; 7 = highly efficient] |
2009–10 weighted average
RANK COUNTRY/ECONOMY SCORE 1 MEAN: 3.8 7 RANK COUNTRY/ECONOMY SCORE 1 MEAN: 3.8 7
1 Singapore ..............................6.3 71 Senegal..................................3.6
2 Sweden .................................6.1 72 Cambodia ..............................3.6
3 Hong Kong SAR ....................6.1 73 Turkey ....................................3.6
4 Norway ..................................5.8 74 Spain......................................3.6
5 New Zealand .........................5.7 75 Korea, Rep.............................3.5
6 Qatar......................................5.6 76 Mozambique..........................3.5
7 Finland ...................................5.5 77 Lithuania ................................3.5
8 United Kingdom.....................5.5 78 Dominican Republic...............3.5
9 Netherlands ...........................5.4 79 Iran, Islamic Rep....................3.4
10 Switzerland ............................5.4 80 Mali........................................3.4
11 Luxembourg ..........................5.4 81 Slovenia .................................3.4
12 Australia.................................5.4 82 Cape Verde ............................3.4
13 Denmark ................................5.4 83 Brazil ......................................3.4
14 Canada...................................5.3 84 Mauritania..............................3.4
15 Germany ................................5.3 85 Jamaica .................................3.4
16 Oman.....................................5.2 86 Kazakhstan ............................3.4
17 Tunisia....................................5.2 87 Colombia ...............................3.4
18 Austria ...................................5.1 88 Zimbabwe..............................3.4
19 South Africa...........................5.1 89 Georgia ..................................3.4
20 Iceland ...................................5.1 90 Cameroon..............................3.3
21 Barbados ...............................5.0 91 Panama..................................3.3
22 United Arab Emirates ............4.9 92 Hungary .................................3.3
23 France....................................4.9 93 Algeria ...................................3.3
24 Namibia .................................4.9 94 Azerbaijan ..............................3.3
25 Gambia, The ..........................4.9 95 Honduras ...............................3.2
26 Chile ......................................4.8 96 Timor-Leste............................3.2
27 Japan .....................................4.7 97 Czech Republic......................3.2
28 Cyprus ...................................4.7 98 Greece...................................3.2
29 Mauritius ...............................4.7 99 Macedonia, FYR ....................3.1
30 Malaysia ................................4.6 100 Kenya.....................................3.1
31 Puerto Rico............................4.6 101 El Salvador.............................3.1 375
32 Botswana ..............................4.6 102 Mexico...................................3.1
33 United States.........................4.6 103 Pakistan .................................3.1
34 Ireland....................................4.5 104 Armenia .................................3.1
35 Rwanda .................................4.5 105 Guatemala .............................3.1
36 Brunei Darussalam ................4.4 106 Poland....................................3.1
37 Saudi Arabia...........................4.4 107 Lebanon.................................3.0
38 Kuwait ...................................4.4 108 Peru .......................................3.0
39 Jordan....................................4.4 109 Guyana ..................................3.0
40 Egypt .....................................4.3 110 Lesotho .................................3.0
41 Estonia...................................4.3 111 Moldova.................................3.0
42 Sri Lanka................................4.3 112 Côte d’Ivoire ..........................3.0
43 Malta .....................................4.2 113 Bangladesh............................2.9
44 China .....................................4.2 114 Russian Federation................2.9
45 Israel ......................................4.2 115 Romania ................................2.9
46 Thailand .................................4.1 116 Burundi ..................................2.9
47 India.......................................4.1 117 Latvia .....................................2.9
48 Montenegro...........................4.1 118 Syria.......................................2.9
49 Swaziland ..............................4.0 119 Chad ......................................2.9
50 Ghana ....................................4.0 120 Angola ...................................2.9
51 Taiwan, China ........................4.0 121 Madagascar ...........................2.8
52 Belgium .................................4.0 122 Philippines .............................2.8
53 Costa Rica .............................4.0 123 Portugal .................................2.8
54 Zambia...................................3.9 124 Mongolia................................2.8
55 Uruguay .................................3.9 125 Bulgaria..................................2.7
56 Malawi ...................................3.9 126 Croatia ...................................2.7
57 Morocco ................................3.9 127 Kyrgyz Republic .....................2.7
58 Bahrain ..................................3.9 128 Nepal .....................................2.7
59 Albania...................................3.8 129 Italy........................................2.6
60 Indonesia ...............................3.8 130 Argentina ...............................2.6
61 Vietnam .................................3.8 131 Nicaragua...............................2.6
62 Trinidad and Tobago...............3.8 132 Serbia ....................................2.6
63 Uganda ..................................3.7 133 Slovak Republic .....................2.6
64 Tajikistan ................................3.7 134 Paraguay................................2.5
65 Tanzania .................................3.7 135 Ecuador .................................2.5
66 Benin .....................................3.7 136 Bolivia ....................................2.5
67 Ethiopia..................................3.7 137 Bosnia and Herzegovina........2.3
68 Nigeria ...................................3.7 138 Ukraine ..................................2.3
69 Burkina Faso..........................3.7 139 Venezuela ..............................2.0
70 Libya ......................................3.7
SOURCE: World Economic Forum, Executive Opinion Survey
The Global Competitiveness Report 2010-2011 © 2010 World Economic Forum](https://image.slidesharecdn.com/globalcompetitivenessreportwef2010-11-100928142139-phpapp02/75/Global-competitiveness-report-wef-2010-11-388-2048.jpg)
![1.11 Efficiency of legal framework in challenging regulations
2.2: Data Tables | Section I: Institutions
How efficient is the legal framework in your country for private businesses in challenging the legality of government actions and/or regulations?
[1 = extremely inefficient; 7 = highly efficient] | 2009–10 weighted average
RANK COUNTRY/ECONOMY SCORE 1 MEAN: 3.7 7 RANK COUNTRY/ECONOMY SCORE 1 MEAN: 3.7 7
1 Sweden .................................5.8 71 Brazil ......................................3.5
2 Hong Kong SAR ....................5.8 72 Tanzania .................................3.5
3 Luxembourg ..........................5.6 73 Colombia ...............................3.4
4 Finland ...................................5.5 74 Turkey ....................................3.4
5 Switzerland ............................5.4 75 Benin .....................................3.4
6 Singapore ..............................5.3 76 Honduras ...............................3.4
7 New Zealand .........................5.3 77 Mexico...................................3.4
8 Germany ................................5.3 78 Mozambique..........................3.4
9 Norway ..................................5.3 79 Slovenia .................................3.4
10 Austria ...................................5.2 80 Nigeria ...................................3.3
11 Denmark ................................5.2 81 Jamaica .................................3.3
12 Netherlands ...........................5.1 82 Senegal..................................3.3
13 Australia.................................5.0 83 Mauritania..............................3.3
14 Iceland ...................................5.0 84 Czech Republic......................3.3
15 Namibia .................................4.9 85 Kazakhstan ............................3.3
16 United Kingdom.....................4.9 86 Panama..................................3.2
17 France....................................4.9 87 Korea, Rep.............................3.2
18 Canada...................................4.9 88 Cape Verde ............................3.2
19 Tunisia....................................4.8 89 Timor-Leste............................3.2
20 South Africa...........................4.7 90 Angola ...................................3.2
21 Cyprus ...................................4.7 91 Lithuania ................................3.2
22 Barbados ...............................4.7 92 Burkina Faso..........................3.2
23 Oman.....................................4.7 93 Peru .......................................3.1
24 Chile ......................................4.6 94 Greece...................................3.1
25 United Arab Emirates ............4.5 95 Poland....................................3.1
26 Botswana ..............................4.5 96 Pakistan .................................3.1
27 Ireland....................................4.5 97 Cameroon..............................3.1
28 Mauritius ...............................4.4 98 Georgia ..................................3.1
29 Saudi Arabia...........................4.4 99 Moldova.................................3.1
30 Malaysia ................................4.4 100 Algeria ...................................3.1
376 31 Puerto Rico............................4.3 101 El Salvador.............................3.0
32 Qatar......................................4.3 102 Bangladesh............................3.0
33 Japan .....................................4.3 103 Armenia .................................3.0
34 Uruguay .................................4.3 104 Guatemala .............................3.0
35 United States.........................4.3 105 Chad ......................................3.0
36 Gambia, The ..........................4.2 106 Madagascar ...........................3.0
37 India.......................................4.2 107 Guyana ..................................3.0
38 Costa Rica .............................4.2 108 Kenya.....................................3.0
39 Montenegro...........................4.2 109 Portugal .................................3.0
40 Estonia...................................4.2 110 Macedonia, FYR ....................3.0
41 Kuwait ...................................4.2 111 Romania ................................2.9
42 Rwanda .................................4.2 112 Iran, Islamic Rep....................2.9
43 Israel ......................................4.1 113 Mongolia................................2.9
44 Belgium .................................4.1 114 Hungary .................................2.8
45 Bahrain ..................................4.1 115 Russian Federation................2.8
46 Taiwan, China ........................4.1 116 Philippines .............................2.8
47 Sri Lanka................................4.1 117 Côte d’Ivoire ..........................2.8
48 Thailand .................................4.0 118 Latvia .....................................2.8
49 Malta .....................................4.0 119 Bulgaria..................................2.8
50 Jordan....................................4.0 120 Dominican Republic...............2.8
51 China .....................................4.0 121 Syria.......................................2.7
52 Malawi ...................................3.9 122 Italy........................................2.7
53 Morocco ................................3.9 123 Nepal .....................................2.7
54 Trinidad and Tobago...............3.9 124 Lesotho .................................2.7
55 Indonesia ...............................3.9 125 Serbia ....................................2.7
56 Albania...................................3.8 126 Croatia ...................................2.6
57 Ghana ....................................3.8 127 Kyrgyz Republic .....................2.6
58 Vietnam .................................3.8 128 Burundi ..................................2.6
59 Brunei Darussalam ................3.8 129 Paraguay................................2.5
60 Swaziland ..............................3.8 130 Zimbabwe..............................2.4
61 Cambodia ..............................3.8 131 Slovak Republic .....................2.4
62 Azerbaijan ..............................3.7 132 Ecuador .................................2.4
63 Uganda ..................................3.7 133 Lebanon.................................2.4
64 Tajikistan ................................3.7 134 Nicaragua...............................2.3
65 Spain......................................3.7 135 Bolivia ....................................2.3
66 Zambia...................................3.6 136 Bosnia and Herzegovina........2.3
67 Mali........................................3.6 137 Argentina ...............................2.3
68 Libya ......................................3.5 138 Ukraine ..................................2.3
69 Egypt .....................................3.5 139 Venezuela ..............................1.5
70 Ethiopia..................................3.5
SOURCE: World Economic Forum, Executive Opinion Survey
The Global Competitiveness Report 2010-2011 © 2010 World Economic Forum](https://image.slidesharecdn.com/globalcompetitivenessreportwef2010-11-100928142139-phpapp02/75/Global-competitiveness-report-wef-2010-11-389-2048.jpg)
![1.12 Transparency of government policymaking
2.2: Data Tables | Section I: Institutions
How easy is it for businesses in your country to obtain information about changes in government policies and regulations affecting their
activities? [1 = impossible; 7 = extremely easy] | 2009–10 weighted average
RANK COUNTRY/ECONOMY SCORE 1 MEAN: 4.4 7 RANK COUNTRY/ECONOMY SCORE 1 MEAN: 4.4 7
1 Singapore ..............................6.3 71 Croatia ...................................4.3
2 Hong Kong SAR ....................6.2 72 Portugal .................................4.3
3 New Zealand .........................6.0 73 Vietnam .................................4.3
4 Luxembourg ..........................5.9 74 El Salvador.............................4.2
5 Switzerland ............................5.8 75 Kazakhstan ............................4.2
6 Sweden .................................5.8 76 Morocco ................................4.2
7 Taiwan, China ........................5.7 77 Latvia .....................................4.2
8 Finland ...................................5.6 78 Mali........................................4.2
9 Denmark ................................5.6 79 Mexico...................................4.2
10 Chile ......................................5.6 80 Macedonia, FYR ....................4.2
11 Canada...................................5.5 81 Trinidad and Tobago...............4.2
12 Norway ..................................5.4 82 Slovak Republic .....................4.2
13 Germany ................................5.4 83 Honduras ...............................4.2
14 Estonia...................................5.4 84 Guyana ..................................4.1
15 Qatar......................................5.3 85 Tanzania .................................4.1
16 Iceland ...................................5.3 86 Burkina Faso..........................4.1
17 Austria ...................................5.3 87 Brazil ......................................4.1
18 Netherlands ...........................5.2 88 Brunei Darussalam ................4.1
19 Australia.................................5.2 89 Greece...................................4.1
20 Tunisia....................................5.2 90 Israel......................................4.1
21 Barbados ...............................5.2 91 Indonesia ...............................4.1
22 Rwanda .................................5.1 92 Mauritania..............................4.1
23 Slovenia .................................5.1 93 Swaziland ..............................4.1
24 Mauritius ...............................5.1 94 Hungary .................................4.0
25 Ireland....................................5.1 95 Kyrgyz Republic .....................4.0
26 Botswana ..............................5.0 96 Puerto Rico............................4.0
27 South Africa...........................5.0 97 Serbia ....................................4.0
28 France....................................4.9 98 Nepal .....................................4.0
29 Uruguay .................................4.9 99 Ghana ....................................3.9
30 Gambia, The ..........................4.9 100 Ethiopia..................................3.9
31 Cyprus ...................................4.9 101 Tajikistan ................................3.9 377
32 Oman.....................................4.9 102 Czech Republic......................3.9
33 Georgia ..................................4.9 103 Senegal..................................3.9
34 United Kingdom.....................4.9 104 Lebanon.................................3.9
35 United Arab Emirates ............4.8 105 Russian Federation................3.8
36 Montenegro...........................4.8 106 Bangladesh............................3.8
37 Malaysia ................................4.8 107 Sri Lanka................................3.8
38 China .....................................4.8 108 Paraguay................................3.8
39 Namibia .................................4.8 109 Kenya.....................................3.8
40 Saudi Arabia...........................4.8 110 Côte d’Ivoire ..........................3.8
41 United States.........................4.7 111 Korea, Rep.............................3.8
42 India.......................................4.7 112 Ecuador .................................3.7
43 Bahrain ..................................4.7 113 Poland....................................3.7
44 Benin .....................................4.6 114 Ukraine ..................................3.7
45 Lithuania ................................4.6 115 Pakistan .................................3.7
46 Guatemala .............................4.6 116 Nicaragua...............................3.7
47 Zambia...................................4.6 117 Cameroon..............................3.7
48 Japan .....................................4.6 118 Kuwait ...................................3.7
49 Albania...................................4.6 119 Italy........................................3.7
50 Cape Verde ............................4.6 120 Mongolia................................3.6
51 Malta .....................................4.6 121 Algeria ...................................3.6
52 Panama..................................4.5 122 Lesotho .................................3.6
53 Armenia .................................4.5 123 Philippines .............................3.6
54 Turkey ....................................4.5 124 Iran, Islamic Rep....................3.6
55 Jordan....................................4.5 125 Cambodia ..............................3.6
56 Costa Rica .............................4.5 126 Nigeria ...................................3.6
57 Malawi ...................................4.5 127 Angola ...................................3.5
58 Azerbaijan ..............................4.5 128 Madagascar ...........................3.5
59 Peru .......................................4.4 129 Argentina ...............................3.5
60 Colombia ...............................4.4 130 Bulgaria..................................3.5
61 Dominican Republic...............4.4 131 Timor-Leste............................3.4
62 Belgium .................................4.3 132 Bolivia ....................................3.4
63 Thailand .................................4.3 133 Syria.......................................3.3
64 Jamaica .................................4.3 134 Burundi ..................................3.3
65 Zimbabwe..............................4.3 135 Libya ......................................3.0
66 Mozambique..........................4.3 136 Venezuela ..............................3.0
67 Moldova.................................4.3 137 Romania ................................2.9
68 Egypt .....................................4.3 138 Chad ......................................2.8
69 Uganda ..................................4.3 139 Bosnia and Herzegovina........2.7
70 Spain......................................4.3
SOURCE: World Economic Forum, Executive Opinion Survey
The Global Competitiveness Report 2010-2011 © 2010 World Economic Forum](https://image.slidesharecdn.com/globalcompetitivenessreportwef2010-11-100928142139-phpapp02/75/Global-competitiveness-report-wef-2010-11-390-2048.jpg)
![1.13 Business costs of terrorism
2.2: Data Tables | Section I: Institutions
To what extent does the threat of terrorism impose costs on businesses in your country? [1 = significant costs; 7 = no costs] | 2009–10 weighted
average
RANK COUNTRY/ECONOMY SCORE 1 MEAN: 5.6 7 RANK COUNTRY/ECONOMY SCORE 1 MEAN: 5.6 7
1 Uruguay .................................6.8 71 Gambia, The ..........................5.7
2 Rwanda .................................6.7 72 Cape Verde ............................5.7
3 Iceland ...................................6.7 73 Italy........................................5.7
4 Slovak Republic .....................6.7 74 France....................................5.6
5 Lithuania ................................6.7 75 Netherlands ...........................5.6
6 Syria.......................................6.7 76 Jamaica .................................5.6
7 Austria ...................................6.7 77 Panama..................................5.6
8 Finland ...................................6.7 78 Benin .....................................5.5
9 Zimbabwe..............................6.6 79 China .....................................5.5
10 Slovenia .................................6.6 80 Australia.................................5.5
11 Oman.....................................6.6 81 Kazakhstan ............................5.5
12 Estonia...................................6.6 82 Guyana ..................................5.5
13 Montenegro...........................6.6 83 Mali........................................5.4
14 Croatia ...................................6.6 84 Morocco ................................5.4
15 Brazil ......................................6.6 85 Tanzania .................................5.4
16 Malta .....................................6.6 86 Serbia ....................................5.4
17 Angola ...................................6.5 87 Bahrain ..................................5.4
18 Bosnia and Herzegovina........6.5 88 Dominican Republic...............5.4
19 Mongolia................................6.5 89 Trinidad and Tobago...............5.4
20 Latvia .....................................6.5 90 Lesotho .................................5.3
21 Chile ......................................6.4 91 Korea, Rep.............................5.3
22 Hungary .................................6.4 92 Bulgaria..................................5.3
23 Brunei Darussalam ................6.4 93 Russian Federation................5.3
24 Czech Republic......................6.4 94 Greece...................................5.3
25 Norway ..................................6.4 95 Japan .....................................5.3
26 Switzerland ............................6.4 96 Canada...................................5.3
27 Romania ................................6.4 97 Mozambique..........................5.2
28 Tunisia....................................6.4 98 Ecuador .................................5.2
29 Ireland....................................6.4 99 United Kingdom.....................5.2
30 Sweden .................................6.4 100 Ethiopia..................................5.2
378 31 Senegal..................................6.4 101 Indonesia ...............................5.1
32 Armenia .................................6.4 102 Singapore ..............................5.1
33 Portugal .................................6.4 103 Malaysia ................................5.1
34 Argentina ...............................6.4 104 Bolivia ....................................5.1
35 Luxembourg ..........................6.4 105 Israel......................................5.1
36 Denmark ................................6.3 106 Timor-Leste............................5.1
37 Namibia .................................6.3 107 Cambodia ..............................5.0
38 Qatar......................................6.3 108 Paraguay................................5.0
39 Libya ......................................6.3 109 Vietnam .................................5.0
40 Costa Rica .............................6.3 110 Venezuela ..............................4.9
41 Hong Kong SAR ....................6.3 111 Honduras ...............................4.9
42 South Africa...........................6.3 112 Mexico...................................4.9
43 United Arab Emirates ............6.2 113 El Salvador.............................4.9
44 Swaziland ..............................6.2 114 Chad ......................................4.8
45 Malawi ...................................6.2 115 Peru .......................................4.8
46 Botswana ..............................6.2 116 Kyrgyz Republic .....................4.8
47 Belgium .................................6.2 117 Spain......................................4.8
48 Moldova.................................6.2 118 Nicaragua...............................4.8
49 Mauritius ...............................6.1 119 Iran, Islamic Rep....................4.8
50 Kuwait ...................................6.1 120 Thailand .................................4.7
51 Albania...................................6.1 121 Nigeria ...................................4.7
52 Burkina Faso..........................6.1 122 Madagascar ...........................4.7
53 Cyprus ...................................6.1 123 Guatemala .............................4.6
54 Côte d’Ivoire ..........................6.1 124 Bangladesh............................4.6
55 Zambia...................................6.1 125 United States.........................4.5
56 Germany ................................6.1 126 Philippines .............................4.4
57 Saudi Arabia...........................6.1 127 India.......................................4.4
58 Ukraine ..................................6.0 128 Algeria ...................................4.4
59 Poland....................................6.0 129 Mauritania..............................4.4
60 Ghana ....................................6.0 130 Burundi ..................................4.3
61 Georgia ..................................5.9 131 Uganda ..................................4.2
62 Azerbaijan ..............................5.9 132 Egypt .....................................4.1
63 Taiwan, China ........................5.9 133 Kenya.....................................4.1
64 Tajikistan ................................5.9 134 Sri Lanka................................4.0
65 Jordan....................................5.9 135 Turkey ....................................4.0
66 Macedonia, FYR ....................5.8 136 Lebanon.................................3.8
67 New Zealand .........................5.8 137 Nepal .....................................3.4
68 Barbados ...............................5.8 138 Pakistan .................................2.9
69 Puerto Rico............................5.8 139 Colombia ...............................2.5
70 Cameroon..............................5.8
SOURCE: World Economic Forum, Executive Opinion Survey
The Global Competitiveness Report 2010-2011 © 2010 World Economic Forum](https://image.slidesharecdn.com/globalcompetitivenessreportwef2010-11-100928142139-phpapp02/75/Global-competitiveness-report-wef-2010-11-391-2048.jpg)
![1.14 Business costs of crime and violence
2.2: Data Tables | Section I: Institutions
To what extent does the incidence of crime and violence impose costs on businesses in your country? [1 = significant costs; 7 = no costs] |
2009–10 weighted average
RANK COUNTRY/ECONOMY SCORE 1 MEAN: 4.8 7 RANK COUNTRY/ECONOMY SCORE 1 MEAN: 4.8 7
1 Syria.......................................6.6 71 Zimbabwe..............................4.9
2 Oman.....................................6.5 72 Kazakhstan ............................4.8
3 Qatar......................................6.4 73 Mongolia................................4.8
4 United Arab Emirates ............6.4 74 Algeria ...................................4.8
5 Tunisia....................................6.4 75 Indonesia ...............................4.7
6 Rwanda .................................6.4 76 Tanzania .................................4.7
7 Iceland ...................................6.4 77 Swaziland ..............................4.7
8 Hong Kong SAR ....................6.4 78 Chile ......................................4.6
9 Kuwait ...................................6.3 79 Greece...................................4.6
10 Finland ...................................6.2 80 Korea, Rep.............................4.6
11 Malta .....................................6.2 81 Cameroon..............................4.6
12 Switzerland ............................6.2 82 Thailand .................................4.6
13 Luxembourg ..........................6.2 83 Botswana ..............................4.6
14 Norway ..................................6.2 84 United States.........................4.5
15 Denmark ................................6.1 85 Sri Lanka................................4.5
16 Saudi Arabia...........................6.1 86 Turkey ....................................4.5
17 Singapore ..............................6.0 87 Zambia...................................4.5
18 Brunei Darussalam ................6.0 88 Vietnam .................................4.5
19 Slovenia .................................6.0 89 Barbados ...............................4.5
20 Montenegro...........................6.0 90 Russian Federation................4.5
21 Jordan....................................5.9 91 Malawi ...................................4.5
22 Austria ...................................5.9 92 Italy........................................4.5
23 Germany ................................5.9 93 Malaysia ................................4.4
24 Libya ......................................5.9 94 Serbia ....................................4.4
25 Cyprus ...................................5.9 95 Cambodia ..............................4.4
26 Belgium .................................5.8 96 Cape Verde ............................4.3
27 Sweden .................................5.8 97 Egypt .....................................4.3
28 Ireland....................................5.8 98 Angola ...................................4.2
29 Senegal..................................5.8 99 Benin .....................................4.2
30 Estonia...................................5.7 100 Kyrgyz Republic .....................4.2
31 Armenia .................................5.7 101 Iran, Islamic Rep....................4.2 379
32 Romania ................................5.7 102 Ghana ....................................4.2
33 Portugal .................................5.6 103 Bulgaria..................................4.2
34 New Zealand .........................5.6 104 Philippines .............................4.0
35 Czech Republic......................5.6 105 Nicaragua...............................4.0
36 Tajikistan ................................5.5 106 Mozambique..........................4.0
37 Lithuania ................................5.5 107 Namibia .................................4.0
38 Bahrain ..................................5.5 108 Puerto Rico............................4.0
39 Taiwan, China ........................5.5 109 Timor-Leste............................4.0
40 Croatia ...................................5.5 110 Bolivia ....................................4.0
41 Georgia ..................................5.5 111 Lesotho .................................3.9
42 France....................................5.5 112 Panama..................................3.8
43 Latvia .....................................5.4 113 Uganda ..................................3.8
44 Israel ......................................5.4 114 Chad ......................................3.8
45 Australia.................................5.4 115 Costa Rica .............................3.7
46 Azerbaijan ..............................5.4 116 Argentina ...............................3.7
47 China .....................................5.3 117 Ecuador .................................3.7
48 Slovak Republic .....................5.3 118 Bangladesh............................3.6
49 Canada...................................5.3 119 Peru .......................................3.6
50 Poland....................................5.3 120 Nigeria ...................................3.5
51 Gambia, The ..........................5.3 121 Paraguay................................3.4
52 Spain......................................5.2 122 Madagascar ...........................3.4
53 Japan .....................................5.2 123 Brazil ......................................3.3
54 Ethiopia..................................5.2 124 Kenya.....................................3.3
55 United Kingdom.....................5.2 125 Dominican Republic...............3.3
56 Albania...................................5.2 126 Pakistan .................................3.2
57 Morocco ................................5.2 127 Guyana ..................................3.1
58 Mali........................................5.1 128 Côte d’Ivoire ..........................3.1
59 Netherlands ...........................5.1 129 Burundi ..................................3.1
60 Moldova.................................5.1 130 Nepal .....................................3.0
61 Hungary .................................5.0 131 Trinidad and Tobago...............2.9
62 Lebanon.................................5.0 132 Mexico...................................2.7
63 Burkina Faso..........................5.0 133 Honduras ...............................2.7
64 Bosnia and Herzegovina........5.0 134 Colombia ...............................2.5
65 Ukraine ..................................5.0 135 Venezuela ..............................2.3
66 Macedonia, FYR ....................5.0 136 Jamaica .................................2.1
67 India.......................................5.0 137 South Africa...........................2.1
68 Mauritania..............................4.9 138 El Salvador.............................1.8
69 Mauritius ...............................4.9 139 Guatemala .............................1.7
70 Uruguay .................................4.9
SOURCE: World Economic Forum, Executive Opinion Survey
The Global Competitiveness Report 2010-2011 © 2010 World Economic Forum](https://image.slidesharecdn.com/globalcompetitivenessreportwef2010-11-100928142139-phpapp02/75/Global-competitiveness-report-wef-2010-11-392-2048.jpg)
![1.15 Organized crime
2.2: Data Tables | Section I: Institutions
To what extent does organized crime (mafia-oriented racketeering, extortion) impose costs on businesses in your country? [1 = significant costs;
7 = no costs] | 2009–10 weighted average
RANK COUNTRY/ECONOMY SCORE 1 MEAN: 5.2 7 RANK COUNTRY/ECONOMY SCORE 1 MEAN: 5.2 7
1 Rwanda .................................6.9 71 Japan .....................................5.3
2 Iceland ...................................6.8 72 Hungary .................................5.3
3 Luxembourg ..........................6.8 73 India.......................................5.3
4 Singapore ..............................6.7 74 Croatia ...................................5.3
5 Finland ...................................6.7 75 Namibia .................................5.3
6 Syria.......................................6.7 76 China .....................................5.2
7 United Arab Emirates ............6.7 77 Malaysia ................................5.2
8 Malta .....................................6.7 78 Mali........................................5.2
9 Sweden .................................6.7 79 Slovak Republic .....................5.2
10 Austria ...................................6.6 80 Cameroon..............................5.2
11 Norway ..................................6.6 81 Burkina Faso..........................5.2
12 Denmark ................................6.6 82 Albania...................................5.2
13 Jordan....................................6.6 83 Thailand .................................5.1
14 Egypt .....................................6.6 84 Mongolia................................5.1
15 Oman.....................................6.6 85 Korea, Rep.............................5.1
16 Saudi Arabia...........................6.6 86 United States.........................5.1
17 Tunisia....................................6.6 87 Algeria ...................................5.1
18 Ireland....................................6.5 88 Azerbaijan ..............................5.0
19 Estonia...................................6.5 89 Sri Lanka................................5.0
20 Switzerland ............................6.5 90 Cambodia ..............................4.9
21 New Zealand .........................6.5 91 Lesotho .................................4.9
22 Brunei Darussalam ................6.5 92 Macedonia, FYR ....................4.8
23 Barbados ...............................6.4 93 Cape Verde ............................4.8
24 Uruguay .................................6.4 94 Bosnia and Herzegovina........4.8
25 Belgium .................................6.3 95 Kazakhstan ............................4.8
26 Qatar......................................6.3 96 Guyana ..................................4.7
27 Kuwait ...................................6.3 97 Vietnam .................................4.7
28 Germany ................................6.3 98 Indonesia ...............................4.7
29 Hong Kong SAR ....................6.2 99 Trinidad and Tobago...............4.7
30 Bahrain ..................................6.2 100 Uganda ..................................4.7
380 31 Portugal .................................6.2 101 Costa Rica .............................4.7
32 Australia.................................6.2 102 Iran, Islamic Rep....................4.6
33 Zimbabwe..............................6.1 103 Panama..................................4.5
34 Mauritius ...............................6.1 104 Turkey ....................................4.4
35 Senegal..................................6.0 105 Nicaragua...............................4.4
36 Angola ...................................6.0 106 Philippines .............................4.4
37 Latvia .....................................6.0 107 Bangladesh............................4.4
38 Lithuania ................................6.0 108 Kyrgyz Republic .....................4.4
39 United Kingdom.....................6.0 109 Peru .......................................4.3
40 Cyprus ...................................6.0 110 Madagascar ...........................4.3
41 Netherlands ...........................6.0 111 Serbia ....................................4.3
42 Slovenia .................................6.0 112 Russian Federation................4.3
43 Romania ................................5.9 113 Ecuador .................................4.3
44 Malawi ...................................5.9 114 South Africa...........................4.3
45 Chile ......................................5.8 115 Argentina ...............................4.2
46 France....................................5.8 116 Ukraine ..................................4.2
47 Gambia, The ..........................5.8 117 Bolivia ....................................4.2
48 Libya ......................................5.8 118 Timor-Leste............................4.2
49 Czech Republic......................5.8 119 Nigeria ...................................4.2
50 Canada...................................5.8 120 Paraguay................................4.1
51 Ethiopia..................................5.7 121 Dominican Republic...............4.1
52 Botswana ..............................5.7 122 Mozambique..........................4.0
53 Montenegro...........................5.7 123 Kenya.....................................4.0
54 Swaziland ..............................5.7 124 Bulgaria..................................3.9
55 Poland....................................5.7 125 Brazil ......................................3.9
56 Greece...................................5.6 126 Burundi ..................................3.9
57 Israel ......................................5.6 127 Pakistan .................................3.9
58 Morocco ................................5.6 128 Benin .....................................3.8
59 Lebanon.................................5.6 129 Chad ......................................3.8
60 Spain......................................5.6 130 Italy........................................3.7
61 Taiwan, China ........................5.5 131 Nepal .....................................3.7
62 Tajikistan ................................5.5 132 Côte d’Ivoire ..........................3.4
63 Georgia ..................................5.4 133 Honduras ...............................3.2
64 Zambia...................................5.4 134 Jamaica .................................3.2
65 Mauritania..............................5.4 135 Venezuela ..............................3.0
66 Armenia .................................5.4 136 Mexico...................................2.9
67 Puerto Rico............................5.4 137 Colombia ...............................2.5
68 Moldova.................................5.3 138 Guatemala .............................2.2
69 Tanzania .................................5.3 139 El Salvador.............................2.2
70 Ghana ....................................5.3
SOURCE: World Economic Forum, Executive Opinion Survey
The Global Competitiveness Report 2010-2011 © 2010 World Economic Forum](https://image.slidesharecdn.com/globalcompetitivenessreportwef2010-11-100928142139-phpapp02/75/Global-competitiveness-report-wef-2010-11-393-2048.jpg)
![1.16 Reliability of police services
2.2: Data Tables | Section I: Institutions
To what extent can police services be relied upon to enforce law and order in your country? [1 = cannot be relied upon at all; 7 = can always be
relied upon] | 2009–10 weighted average
RANK COUNTRY/ECONOMY SCORE 1 MEAN: 4.3 7 RANK COUNTRY/ECONOMY SCORE 1 MEAN: 4.3 7
1 Finland ...................................6.6 71 Zambia...................................4.2
2 Singapore ..............................6.4 72 Romania ................................4.2
3 Iceland ...................................6.4 73 Bosnia and Herzegovina........4.1
4 Hong Kong SAR ....................6.3 74 Brazil ......................................4.1
5 Chile ......................................6.3 75 Latvia .....................................4.1
6 Switzerland ............................6.3 76 Lithuania ................................4.0
7 Canada...................................6.2 77 Uganda ..................................4.0
8 Norway ..................................6.2 78 Israel......................................4.0
9 Qatar......................................6.2 79 Algeria ...................................4.0
10 Denmark ................................6.2 80 Indonesia ...............................4.0
11 United Arab Emirates ............6.2 81 Egypt .....................................4.0
12 Germany ................................6.2 82 Panama..................................3.9
13 New Zealand .........................6.2 83 Angola ...................................3.8
14 Sweden .................................6.1 84 Tanzania .................................3.8
15 Netherlands ...........................6.0 85 Burkina Faso..........................3.8
16 Luxembourg ..........................6.0 86 Czech Republic......................3.8
17 Ireland....................................6.0 87 Thailand .................................3.8
18 Barbados ...............................6.0 88 Tajikistan ................................3.8
19 Australia.................................5.9 89 Slovak Republic .....................3.8
20 Oman.....................................5.9 90 Mozambique..........................3.7
21 Rwanda .................................5.8 91 Sri Lanka................................3.7
22 Japan .....................................5.8 92 Greece...................................3.7
23 Austria ...................................5.7 93 Timor-Leste............................3.7
24 Jordan....................................5.7 94 Syria.......................................3.7
25 Spain......................................5.7 95 Azerbaijan ..............................3.7
26 United States.........................5.6 96 Mongolia................................3.6
27 France....................................5.6 97 Serbia ....................................3.6
28 Belgium .................................5.6 98 Turkey ....................................3.6
29 Tunisia....................................5.5 99 El Salvador.............................3.5
30 Saudi Arabia...........................5.5 100 Libya ......................................3.5
31 United Kingdom.....................5.5 101 Nicaragua...............................3.5 381
32 Bahrain ..................................5.4 102 Lesotho .................................3.5
33 Estonia...................................5.4 103 Cameroon..............................3.5
34 Taiwan, China ........................5.4 104 South Africa...........................3.4
35 Malta .....................................5.3 105 Philippines .............................3.4
36 Brunei Darussalam ................5.1 106 Honduras ...............................3.4
37 Portugal .................................5.1 107 Trinidad and Tobago...............3.4
38 Gambia, The ..........................5.1 108 Lebanon.................................3.4
39 Kuwait ...................................5.0 109 Jamaica .................................3.4
40 Cyprus ...................................5.0 110 Mali........................................3.3
41 Vietnam .................................4.9 111 Bulgaria..................................3.3
42 Puerto Rico............................4.9 112 Armenia .................................3.3
43 Botswana ..............................4.8 113 Kazakhstan ............................3.3
44 Italy ........................................4.8 114 Guyana ..................................3.3
45 Georgia ..................................4.7 115 Cambodia ..............................3.2
46 Korea, Rep.............................4.7 116 Moldova.................................3.2
47 Montenegro...........................4.7 117 Kenya.....................................3.1
48 Slovenia .................................4.7 118 Peru .......................................3.1
49 Costa Rica .............................4.6 119 Pakistan .................................3.1
50 Malaysia ................................4.6 120 Ecuador .................................3.0
51 China .....................................4.6 121 Argentina ...............................3.0
52 Malawi ...................................4.6 122 Ukraine ..................................3.0
53 Iran, Islamic Rep....................4.6 123 Bangladesh............................2.9
54 Namibia .................................4.5 124 Nepal .....................................2.9
55 Benin .....................................4.5 125 Nigeria ...................................2.8
56 Uruguay .................................4.5 126 Zimbabwe..............................2.8
57 Albania...................................4.5 127 Madagascar ...........................2.7
58 Croatia ...................................4.4 128 Russian Federation................2.7
59 Ethiopia..................................4.4 129 Mauritania..............................2.7
60 Poland....................................4.4 130 Kyrgyz Republic .....................2.6
61 Swaziland ..............................4.4 131 Chad ......................................2.6
62 Morocco ................................4.3 132 Mexico...................................2.5
63 Cape Verde ............................4.3 133 Guatemala .............................2.3
64 Colombia ...............................4.3 134 Dominican Republic...............2.3
65 Mauritius ...............................4.3 135 Burundi ..................................2.3
66 Senegal..................................4.2 136 Paraguay................................2.3
67 Hungary .................................4.2 137 Côte d’Ivoire ..........................2.3
68 India.......................................4.2 138 Bolivia ....................................2.1
69 Macedonia, FYR ....................4.2 139 Venezuela ..............................2.1
70 Ghana ....................................4.2
SOURCE: World Economic Forum, Executive Opinion Survey
The Global Competitiveness Report 2010-2011 © 2010 World Economic Forum](https://image.slidesharecdn.com/globalcompetitivenessreportwef2010-11-100928142139-phpapp02/75/Global-competitiveness-report-wef-2010-11-394-2048.jpg)
![1.17 Ethical behavior of firms
2.2: Data Tables | Section I: Institutions
How would you compare the corporate ethics (ethical behavior in interactions with public officials, politicians, and other enterprises) of firms in
your country with those of other countries in the world? [1 = among the worst in the world; 7 = among the best in the world] | 2009–10 weighted
average
RANK COUNTRY/ECONOMY SCORE 1 MEAN: 4.2 7 RANK COUNTRY/ECONOMY SCORE 1 MEAN: 4.2 7
1 Sweden .................................6.8 71 Thailand .................................3.8
2 New Zealand .........................6.7 72 Zambia...................................3.8
3 Finland ...................................6.6 73 Croatia ...................................3.8
4 Singapore ..............................6.6 74 Senegal..................................3.8
5 Denmark ................................6.5 75 Guatemala .............................3.8
6 Switzerland ............................6.4 76 Morocco ................................3.8
7 Norway ..................................6.4 77 Macedonia, FYR ....................3.8
8 Canada...................................6.3 78 Georgia ..................................3.8
9 Netherlands ...........................6.3 79 Turkey ....................................3.7
10 Australia.................................6.2 80 Syria.......................................3.7
11 Austria ...................................6.2 81 Honduras ...............................3.7
12 Luxembourg ..........................6.1 82 Italy........................................3.7
13 Germany ................................6.0 83 Guyana ..................................3.7
14 United Kingdom.....................6.0 84 Iran, Islamic Rep....................3.7
15 Hong Kong SAR ....................6.0 85 Cambodia ..............................3.7
16 Iceland ...................................5.7 86 Peru .......................................3.6
17 France....................................5.7 87 Kazakhstan ............................3.6
18 Japan .....................................5.6 88 Zimbabwe..............................3.6
19 Chile ......................................5.6 89 Tanzania .................................3.6
20 Barbados ...............................5.5 90 Czech Republic......................3.6
21 Belgium .................................5.5 91 Slovak Republic .....................3.6
22 United Arab Emirates ............5.4 92 Romania ................................3.6
23 Oman.....................................5.4 93 Mexico...................................3.6
24 Israel ......................................5.3 94 Brazil ......................................3.5
25 Ireland....................................5.3 95 Latvia .....................................3.5
26 Bahrain ..................................5.3 96 Benin .....................................3.5
27 Uruguay .................................5.3 97 Burkina Faso..........................3.5
28 Qatar......................................5.2 98 Algeria ...................................3.5
382 29 Tunisia....................................5.2 99 Indonesia ...............................3.5
30 United States.........................5.2 100 Pakistan .................................3.4
31 Saudi Arabia...........................5.2 101 Tajikistan ................................3.4
32 Brunei Darussalam ................5.0 102 Swaziland ..............................3.4
33 Estonia...................................5.0 103 Timor-Leste............................3.4
34 Rwanda .................................5.0 104 Uganda ..................................3.4
35 Costa Rica .............................5.0 105 Hungary .................................3.3
36 Botswana ..............................5.0 106 Greece...................................3.3
37 Taiwan, China ........................4.9 107 Moldova.................................3.3
38 Puerto Rico............................4.9 108 Mozambique..........................3.3
39 Cyprus ...................................4.7 109 Dominican Republic...............3.3
40 Malta .....................................4.7 110 Bulgaria..................................3.3
41 Spain......................................4.7 111 Mali........................................3.3
42 Malaysia ................................4.7 112 Russian Federation................3.3
43 Gambia, The ..........................4.7 113 Ecuador .................................3.3
44 Cape Verde ............................4.6 114 Côte d’Ivoire ..........................3.3
45 Namibia .................................4.6 115 Argentina ...............................3.3
46 Mauritius ...............................4.6 116 Bangladesh............................3.3
47 Portugal .................................4.6 117 Kenya.....................................3.3
48 Jordan....................................4.5 118 Armenia .................................3.2
49 Slovenia .................................4.5 119 Lesotho .................................3.2
50 South Africa...........................4.5 120 Serbia ....................................3.2
51 Kuwait ...................................4.4 121 Cameroon..............................3.2
52 Montenegro...........................4.4 122 Nicaragua...............................3.2
53 Malawi ...................................4.3 123 Lebanon.................................3.2
54 Poland....................................4.2 124 Bolivia ....................................3.2
55 China .....................................4.2 125 Nigeria ...................................3.1
56 Panama..................................4.2 126 Madagascar ...........................3.1
57 Korea, Rep.............................4.1 127 Venezuela ..............................3.1
58 Albania...................................4.1 128 Chad ......................................3.1
59 Egypt .....................................4.1 129 Philippines .............................3.0
60 Sri Lanka................................4.1 130 Ukraine ..................................3.0
61 Trinidad and Tobago...............4.0 131 Mauritania..............................2.9
62 El Salvador.............................4.0 132 Burundi ..................................2.9
63 Colombia ...............................3.9 133 Mongolia................................2.9
64 Jamaica .................................3.9 134 Nepal .....................................2.9
65 Ethiopia..................................3.9 135 Kyrgyz Republic .....................2.9
66 Ghana ....................................3.9 136 Paraguay................................2.8
67 Azerbaijan ..............................3.9 137 Libya ......................................2.8
68 Vietnam .................................3.9 138 Angola ...................................2.7
69 Lithuania ................................3.9 139 Bosnia and Herzegovina........2.6
70 India.......................................3.9
SOURCE: World Economic Forum, Executive Opinion Survey
The Global Competitiveness Report 2010-2011 © 2010 World Economic Forum](https://image.slidesharecdn.com/globalcompetitivenessreportwef2010-11-100928142139-phpapp02/75/Global-competitiveness-report-wef-2010-11-395-2048.jpg)
![1.18 Strength of auditing and reporting standards
2.2: Data Tables | Section I: Institutions
In your country, how would you assess financial auditing and reporting standards regarding company financial performance? [1 = extremely
weak; 7 = extremely strong] | 2009–10 weighted average
RANK COUNTRY/ECONOMY SCORE 1 MEAN: 4.7 7 RANK COUNTRY/ECONOMY SCORE 1 MEAN: 4.7 7
1 South Africa...........................6.4 71 Greece...................................4.7
2 Sweden .................................6.3 72 Zambia...................................4.7
3 New Zealand .........................6.2 73 Ghana ....................................4.7
4 Singapore ..............................6.2 74 Senegal..................................4.7
5 Finland ...................................6.2 75 Philippines .............................4.6
6 Canada...................................6.1 76 Iceland ...................................4.6
7 Norway ..................................6.1 77 Romania ................................4.6
8 Malta .....................................6.0 78 Indonesia ...............................4.6
9 Hong Kong SAR ....................5.9 79 Latvia .....................................4.6
10 Barbados ...............................5.9 80 Lebanon.................................4.6
11 Namibia .................................5.9 81 Croatia ...................................4.5
12 Qatar......................................5.8 82 Honduras ...............................4.5
13 Puerto Rico............................5.8 83 Albania...................................4.5
14 Australia.................................5.8 84 Guatemala .............................4.5
15 Netherlands ...........................5.8 85 Montenegro...........................4.4
16 Luxembourg ..........................5.8 86 Rwanda .................................4.4
17 Austria ...................................5.7 87 Turkey ....................................4.4
18 Cyprus ...................................5.7 88 Guyana ..................................4.4
19 Denmark ................................5.7 89 Colombia ...............................4.3
20 Bahrain ..................................5.6 90 Ethiopia..................................4.3
21 Germany ................................5.6 91 Bulgaria..................................4.3
22 United Kingdom.....................5.6 92 Georgia ..................................4.3
23 Belgium .................................5.6 93 Dominican Republic...............4.3
24 Chile ......................................5.6 94 Tanzania .................................4.3
25 Switzerland ............................5.6 95 Korea, Rep.............................4.3
26 Estonia...................................5.6 96 Moldova.................................4.3
27 France....................................5.5 97 Pakistan .................................4.2
28 Israel ......................................5.5 98 Kazakhstan ............................4.2
29 Mauritius ...............................5.5 99 Cape Verde ............................4.2
30 Taiwan, China ........................5.4 100 Morocco ................................4.2
31 Hungary .................................5.4 101 Armenia .................................4.2 383
32 Malaysia ................................5.4 102 Nicaragua...............................4.1
33 Japan .....................................5.4 103 Mozambique..........................4.1
34 United Arab Emirates ............5.4 104 Algeria ...................................4.0
35 Saudi Arabia...........................5.4 105 Uganda ..................................4.0
36 Jordan....................................5.3 106 Nepal .....................................4.0
37 Oman.....................................5.3 107 Iran, Islamic Rep....................4.0
38 Jamaica .................................5.3 108 Ecuador .................................4.0
39 Trinidad and Tobago...............5.3 109 Venezuela ..............................4.0
40 Sri Lanka................................5.2 110 Burkina Faso..........................4.0
41 Gambia, The ..........................5.2 111 Italy........................................4.0
42 Thailand .................................5.1 112 Azerbaijan ..............................3.9
43 Lithuania ................................5.1 113 Paraguay................................3.9
44 Swaziland ..............................5.1 114 Lesotho .................................3.9
45 India.......................................5.1 115 Serbia ....................................3.8
46 Poland....................................5.1 116 Russian Federation................3.8
47 Czech Republic......................5.1 117 Mongolia................................3.8
48 Slovenia .................................5.1 118 Côte d’Ivoire ..........................3.8
49 Zimbabwe..............................5.1 119 Vietnam .................................3.8
50 Malawi ...................................5.1 120 Bangladesh............................3.8
51 Botswana ..............................5.0 121 Cambodia ..............................3.8
52 Panama..................................5.0 122 Argentina ...............................3.8
53 Brunei Darussalam ................5.0 123 Cameroon..............................3.8
54 Tunisia....................................5.0 124 Tajikistan ................................3.7
55 United States.........................5.0 125 Bolivia ....................................3.6
56 Portugal .................................4.9 126 Mali........................................3.6
57 Spain......................................4.9 127 Benin .....................................3.5
58 Egypt .....................................4.8 128 Ukraine ..................................3.5
59 Slovak Republic .....................4.8 129 Kyrgyz Republic .....................3.5
60 Peru .......................................4.8 130 Nigeria ...................................3.4
61 China .....................................4.8 131 Bosnia and Herzegovina........3.4
62 Costa Rica .............................4.8 132 Angola ...................................3.4
63 El Salvador.............................4.8 133 Syria.......................................3.4
64 Brazil ......................................4.8 134 Chad ......................................3.4
65 Kuwait ...................................4.8 135 Libya ......................................3.4
66 Kenya.....................................4.7 136 Madagascar ...........................3.3
67 Uruguay .................................4.7 137 Timor-Leste............................3.2
68 Mexico...................................4.7 138 Mauritania..............................3.1
69 Ireland....................................4.7 139 Burundi ..................................2.9
70 Macedonia, FYR ....................4.7
SOURCE: World Economic Forum, Executive Opinion Survey
The Global Competitiveness Report 2010-2011 © 2010 World Economic Forum](https://image.slidesharecdn.com/globalcompetitivenessreportwef2010-11-100928142139-phpapp02/75/Global-competitiveness-report-wef-2010-11-396-2048.jpg)
![1.19 Efficacy of corporate boards
2.2: Data Tables | Section I: Institutions
How would you characterize corporate governance by investors and boards of directors in your country? [1 = management has little
accountability to investors and boards; 7 = investors and boards exert strong supervision of management decisions] | 2009–10 weighted average
RANK COUNTRY/ECONOMY SCORE 1 MEAN: 4.6 7 RANK COUNTRY/ECONOMY SCORE 1 MEAN: 4.6 7
1 Sweden .................................5.9 71 Burkina Faso..........................4.5
2 South Africa...........................5.8 72 Guyana ..................................4.5
3 Rwanda .................................5.8 73 Poland....................................4.5
4 Canada...................................5.7 74 Vietnam .................................4.5
5 Singapore ..............................5.6 75 Montenegro...........................4.5
6 Norway ..................................5.5 76 India.......................................4.5
7 Australia.................................5.5 77 Dominican Republic...............4.5
8 New Zealand .........................5.5 78 Thailand .................................4.5
9 Finland ...................................5.5 79 Moldova.................................4.4
10 Qatar......................................5.4 80 Ethiopia..................................4.4
11 Luxembourg ..........................5.3 81 Jordan....................................4.4
12 Netherlands ...........................5.3 82 Egypt .....................................4.4
13 Denmark ................................5.2 83 Uruguay .................................4.4
14 Switzerland ............................5.2 84 Ireland....................................4.4
15 Germany ................................5.2 85 China .....................................4.4
16 United Kingdom.....................5.2 86 Kazakhstan ............................4.4
17 Malaysia ................................5.2 87 Swaziland ..............................4.4
18 Chile ......................................5.1 88 Romania ................................4.4
19 Japan .....................................5.1 89 Latvia .....................................4.4
20 Puerto Rico............................5.1 90 Ukraine ..................................4.3
21 Namibia .................................5.0 91 Jamaica .................................4.3
22 Côte d’Ivoire ..........................5.0 92 Kenya.....................................4.3
23 Taiwan, China ........................5.0 93 Spain......................................4.3
24 Bahrain ..................................5.0 94 Portugal .................................4.3
25 El Salvador.............................5.0 95 Cambodia ..............................4.3
26 Saudi Arabia...........................5.0 96 Lebanon.................................4.3
27 Belgium .................................5.0 97 Madagascar ...........................4.2
28 United States.........................5.0 98 Korea, Rep.............................4.2
29 Guatemala .............................5.0 99 Nicaragua...............................4.2
30 Austria ...................................5.0 100 Tanzania .................................4.2
384 31 France....................................5.0 101 Iran, Islamic Rep....................4.2
32 Oman.....................................4.9 102 Azerbaijan ..............................4.2
33 Tunisia....................................4.9 103 Ecuador .................................4.2
34 Sri Lanka................................4.9 104 Argentina ...............................4.2
35 Lithuania ................................4.9 105 Turkey ....................................4.2
36 Slovak Republic .....................4.9 106 Macedonia, FYR ....................4.1
37 Benin .....................................4.9 107 Nigeria ...................................4.1
38 Gambia, The ..........................4.9 108 Cyprus ...................................4.1
39 Zambia...................................4.9 109 Georgia ..................................4.1
40 Costa Rica .............................4.8 110 Algeria ...................................4.1
41 Trinidad and Tobago...............4.8 111 Bulgaria..................................4.1
42 Mauritius ...............................4.8 112 Mexico...................................4.1
43 Czech Republic......................4.8 113 Russian Federation................4.1
44 Hong Kong SAR ....................4.8 114 Kuwait ...................................4.1
45 United Arab Emirates ............4.8 115 Pakistan .................................4.1
46 Brunei Darussalam ................4.8 116 Cape Verde ............................4.1
47 Albania...................................4.8 117 Syria.......................................4.0
48 Cameroon..............................4.8 118 Slovenia .................................4.0
49 Barbados ...............................4.8 119 Nepal .....................................4.0
50 Zimbabwe..............................4.8 120 Greece...................................4.0
51 Iceland ...................................4.8 121 Kyrgyz Republic .....................4.0
52 Uganda ..................................4.7 122 Bosnia and Herzegovina........4.0
53 Ghana ....................................4.7 123 Bangladesh............................4.0
54 Indonesia ...............................4.7 124 Mali........................................4.0
55 Peru .......................................4.7 125 Mozambique..........................4.0
56 Philippines .............................4.7 126 Italy........................................3.9
57 Malawi ...................................4.7 127 Paraguay................................3.9
58 Malta .....................................4.7 128 Mongolia................................3.9
59 Honduras ...............................4.7 129 Bolivia ....................................3.9
60 Colombia ...............................4.7 130 Armenia .................................3.9
61 Senegal..................................4.7 131 Croatia ...................................3.8
62 Israel ......................................4.6 132 Chad ......................................3.8
63 Panama..................................4.6 133 Venezuela ..............................3.8
64 Morocco ................................4.6 134 Serbia ....................................3.7
65 Botswana ..............................4.6 135 Tajikistan ................................3.6
66 Estonia...................................4.6 136 Timor-Leste............................3.6
67 Brazil ......................................4.5 137 Angola ...................................3.6
68 Hungary .................................4.5 138 Mauritania..............................3.5
69 Burundi ..................................4.5 139 Libya ......................................2.8
70 Lesotho .................................4.5
SOURCE: World Economic Forum, Executive Opinion Survey
The Global Competitiveness Report 2010-2011 © 2010 World Economic Forum](https://image.slidesharecdn.com/globalcompetitivenessreportwef2010-11-100928142139-phpapp02/75/Global-competitiveness-report-wef-2010-11-397-2048.jpg)
![1.20 Protection of minority shareholders’ interests
2.2: Data Tables | Section I: Institutions
In your country, to what extent are the interests of minority shareholders protected by the legal system? [1 = not protected at all; 7 = fully
protected] | 2009–10 weighted average
RANK COUNTRY/ECONOMY SCORE 1 MEAN: 4.3 7 RANK COUNTRY/ECONOMY SCORE 1 MEAN: 4.3 7
1 Sweden .................................6.0 71 Mauritania..............................4.3
2 Finland ...................................5.9 72 Lebanon.................................4.2
3 Norway ..................................5.8 73 Slovak Republic .....................4.2
4 Puerto Rico............................5.8 74 Spain......................................4.1
5 New Zealand .........................5.6 75 Cape Verde ............................4.1
6 South Africa...........................5.6 76 Trinidad and Tobago...............4.1
7 Singapore ..............................5.5 77 Burkina Faso..........................4.1
8 Canada...................................5.4 78 Hungary .................................4.1
9 Denmark ................................5.4 79 Romania ................................4.1
10 Malta .....................................5.4 80 Philippines .............................4.1
11 Tunisia....................................5.3 81 Mexico...................................4.1
12 Oman.....................................5.3 82 Albania...................................4.0
13 Germany ................................5.2 83 Iceland ...................................4.0
14 Namibia .................................5.2 84 Kuwait ...................................4.0
15 Australia.................................5.2 85 Lithuania ................................4.0
16 Mauritius ...............................5.2 86 Uganda ..................................4.0
17 United Kingdom.....................5.1 87 Montenegro...........................4.0
18 Netherlands ...........................5.1 88 Honduras ...............................4.0
19 Saudi Arabia...........................5.1 89 Czech Republic......................4.0
20 Bahrain ..................................5.1 90 Colombia ...............................4.0
21 Cyprus ...................................5.1 91 Tanzania .................................4.0
22 Gambia, The ..........................5.1 92 Mozambique..........................3.9
23 Luxembourg ..........................5.1 93 Latvia .....................................3.9
24 United Arab Emirates ............5.1 94 Pakistan .................................3.9
25 Israel ......................................5.0 95 Algeria ...................................3.9
26 Malaysia ................................5.0 96 Tajikistan ................................3.9
27 Japan .....................................5.0 97 Turkey ....................................3.9
28 Ethiopia..................................4.9 98 Iran, Islamic Rep....................3.9
29 Belgium .................................4.9 99 Côte d’Ivoire ..........................3.9
30 Jordan....................................4.9 100 Kenya.....................................3.9
31 Barbados ...............................4.9 101 Mali........................................3.8 385
32 Hong Kong SAR ....................4.9 102 Korea, Rep.............................3.8
33 Qatar......................................4.8 103 Cambodia ..............................3.8
34 Taiwan, China ........................4.8 104 Paraguay................................3.8
35 Greece...................................4.8 105 Guyana ..................................3.8
36 Chile ......................................4.8 106 El Salvador.............................3.8
37 Botswana ..............................4.8 107 Azerbaijan ..............................3.8
38 Austria ...................................4.8 108 Guatemala .............................3.8
39 Brunei Darussalam ................4.8 109 Dominican Republic...............3.8
40 United States.........................4.8 110 Chad ......................................3.7
41 Switzerland ............................4.7 111 Moldova.................................3.7
42 Rwanda .................................4.7 112 Macedonia, FYR ....................3.7
43 France....................................4.7 113 Ecuador .................................3.7
44 Thailand .................................4.6 114 Lesotho .................................3.6
45 Panama..................................4.6 115 Angola ...................................3.6
46 Egypt .....................................4.6 116 Kazakhstan ............................3.6
47 Sri Lanka................................4.6 117 Nigeria ...................................3.6
48 Indonesia ...............................4.6 118 Libya ......................................3.6
49 Ghana ....................................4.6 119 Slovenia .................................3.6
50 Jamaica .................................4.6 120 Madagascar ...........................3.5
51 Zimbabwe..............................4.6 121 Argentina ...............................3.5
52 Portugal .................................4.5 122 Georgia ..................................3.5
53 Senegal..................................4.5 123 Croatia ...................................3.5
54 Estonia...................................4.5 124 Bulgaria..................................3.5
55 India.......................................4.5 125 Bangladesh............................3.4
56 Syria.......................................4.5 126 Nepal .....................................3.4
57 Ireland....................................4.5 127 Nicaragua...............................3.4
58 Morocco ................................4.5 128 Italy........................................3.4
59 Costa Rica .............................4.5 129 Burundi ..................................3.3
60 Poland....................................4.5 130 Venezuela ..............................3.3
61 Malawi ...................................4.4 131 Armenia .................................3.2
62 Zambia...................................4.4 132 Russian Federation................3.2
63 Peru .......................................4.4 133 Timor-Leste............................3.1
64 Brazil ......................................4.4 134 Mongolia................................3.1
65 Cameroon..............................4.4 135 Bolivia ....................................3.0
66 China .....................................4.4 136 Kyrgyz Republic .....................3.0
67 Benin .....................................4.3 137 Serbia ....................................2.9
68 Uruguay .................................4.3 138 Ukraine ..................................2.8
69 Swaziland ..............................4.3 139 Bosnia and Herzegovina........2.7
70 Vietnam .................................4.3
SOURCE: World Economic Forum, Executive Opinion Survey
The Global Competitiveness Report 2010-2011 © 2010 World Economic Forum](https://image.slidesharecdn.com/globalcompetitivenessreportwef2010-11-100928142139-phpapp02/75/Global-competitiveness-report-wef-2010-11-398-2048.jpg)
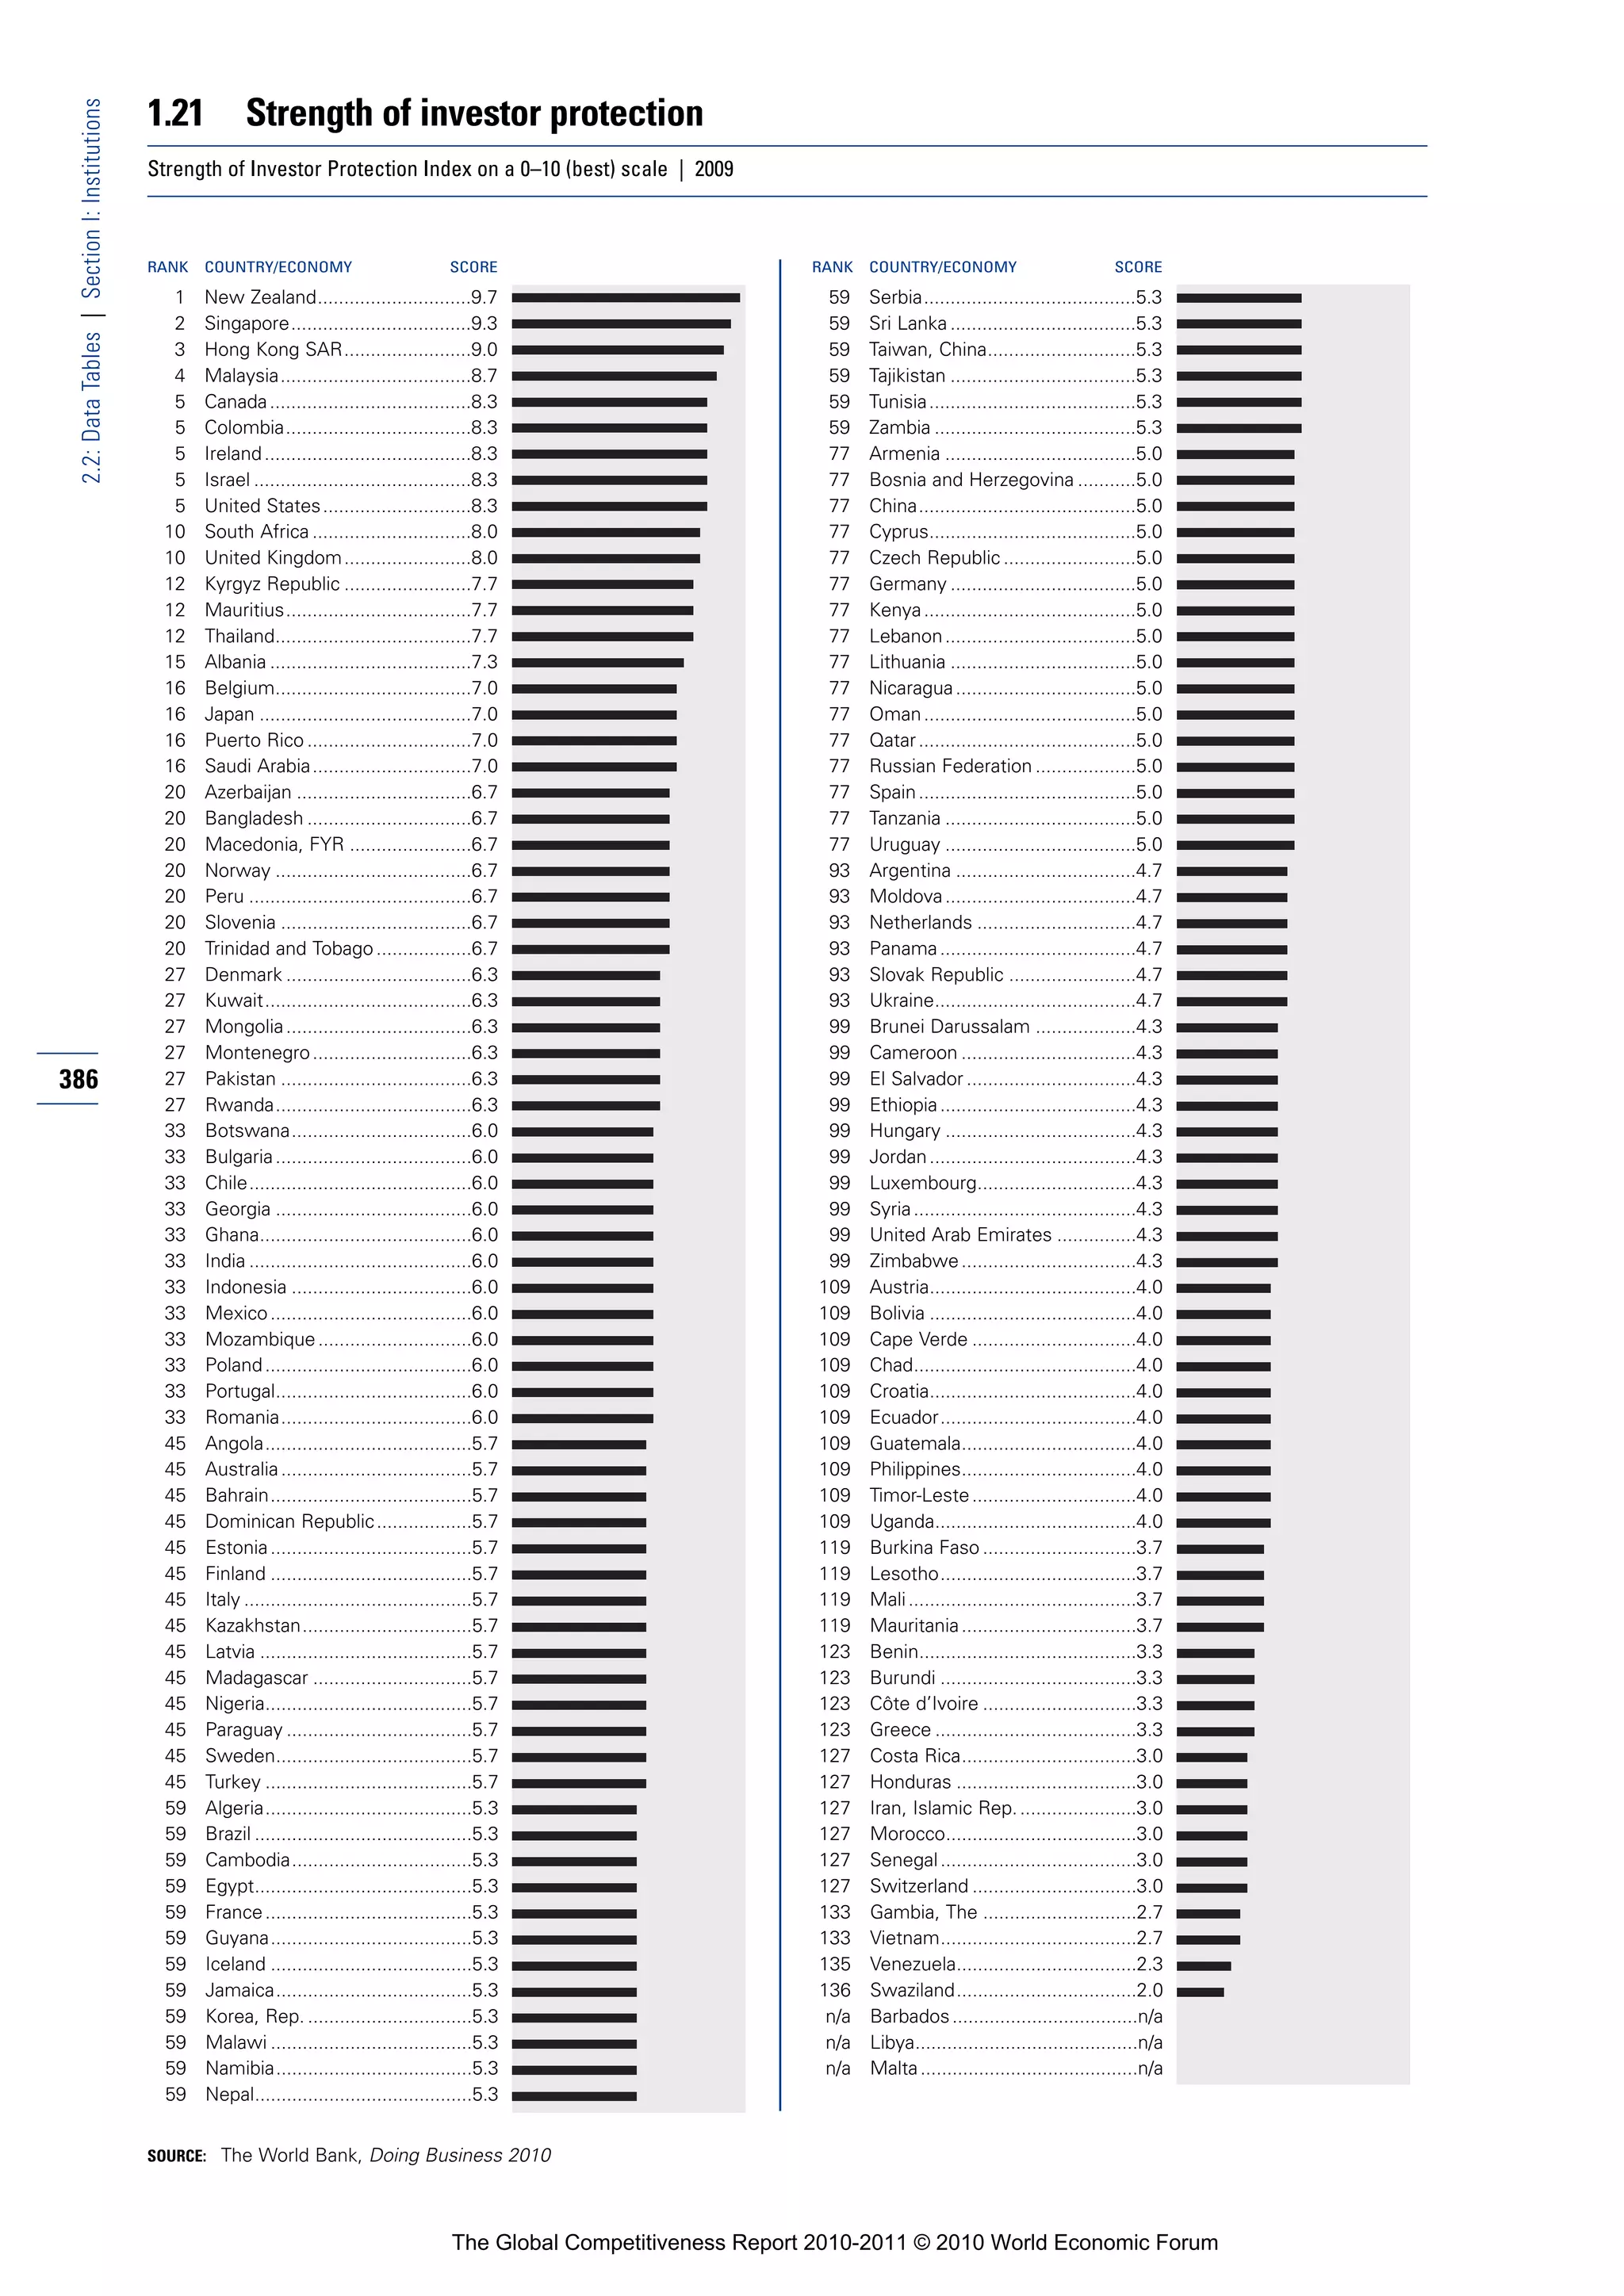
![2.01 Quality of overall infrastructure
2.2: Data Tables | Section II: Infrastructure
How would you assess general infrastructure (e.g., transport, telephony, and energy) in your country? [1 = extremely underdeveloped;
7 = extensive and efficient by international standards] | 2009–10 weighted average
RANK COUNTRY/ECONOMY SCORE 1 MEAN: 4.3 7 RANK COUNTRY/ECONOMY SCORE 1 MEAN: 4.3 7
1 Switzerland ............................6.8 71 Morocco ................................4.1
2 Hong Kong SAR ....................6.7 72 China .....................................4.1
3 Singapore ..............................6.6 73 Italy........................................4.0
4 France....................................6.6 74 Kazakhstan ............................4.0
5 Iceland ...................................6.6 75 Iran, Islamic Rep....................4.0
6 Austria ...................................6.4 76 Armenia .................................4.0
7 Sweden .................................6.4 77 Costa Rica .............................3.9
8 Finland ...................................6.4 78 Albania...................................3.9
9 Germany ................................6.3 79 Mexico...................................3.9
10 Denmark ................................6.3 80 Côte d’Ivoire ..........................3.9
11 United Arab Emirates ............6.2 81 Senegal..................................3.9
12 Korea, Rep.............................6.0 82 Honduras ...............................3.8
13 Canada...................................6.0 83 Cambodia ..............................3.8
14 Portugal .................................6.0 84 Brazil ......................................3.8
15 Japan .....................................6.0 85 Ghana ....................................3.8
16 Luxembourg ..........................6.0 86 Algeria ...................................3.8
17 Netherlands ...........................5.9 87 Ethiopia..................................3.8
18 Barbados ...............................5.9 88 Kenya.....................................3.8
19 Taiwan, China ........................5.9 89 Macedonia, FYR ....................3.7
20 Belgium .................................5.8 90 Indonesia ...............................3.7
21 Oman.....................................5.8 91 India.......................................3.6
22 Spain......................................5.8 92 Peru .......................................3.6
23 United States.........................5.8 93 Tajikistan ................................3.6
24 Chile ......................................5.7 94 Russian Federation................3.6
25 Namibia .................................5.6 95 Syria.......................................3.6
26 Bahrain ..................................5.6 96 Guyana ..................................3.6
27 Malaysia ................................5.5 97 Colombia ...............................3.6
28 Estonia...................................5.5 98 Ecuador .................................3.5
29 Saudi Arabia...........................5.5 99 Cape Verde ............................3.5
30 Tunisia....................................5.5 100 Pakistan .................................3.5
388 31 Cyprus ...................................5.4 101 Kyrgyz Republic .....................3.5
32 Slovenia .................................5.3 102 Argentina ...............................3.5
33 United Kingdom.....................5.3 103 Zambia...................................3.4
34 Australia.................................5.2 104 Lesotho .................................3.4
35 Jordan....................................5.2 105 Uganda ..................................3.4
36 Brunei Darussalam ................5.1 106 Malawi ...................................3.4
37 Czech Republic......................5.1 107 Mali........................................3.4
38 Norway ..................................5.1 108 Poland....................................3.4
39 Qatar......................................5.1 109 Bolivia ....................................3.3
40 Turkey ....................................5.1 110 Mozambique..........................3.3
41 Lithuania ................................5.1 111 Dominican Republic...............3.2
42 Croatia ...................................5.1 112 Madagascar ...........................3.2
43 Puerto Rico............................5.1 113 Philippines .............................3.2
44 El Salvador.............................5.1 114 Nicaragua...............................3.2
45 Kuwait ...................................4.9 115 Libya ......................................3.2
46 Thailand .................................4.9 116 Zimbabwe..............................3.2
47 Israel ......................................4.9 117 Venezuela ..............................3.1
48 New Zealand .........................4.8 118 Montenegro...........................3.1
49 Hungary .................................4.8 119 Moldova.................................3.1
50 Guatemala .............................4.8 120 Bulgaria..................................3.1
51 Latvia .....................................4.7 121 Cameroon..............................3.1
52 Gambia, The ..........................4.7 122 Serbia ....................................3.0
53 Trinidad and Tobago...............4.7 123 Vietnam .................................3.0
54 Botswana ..............................4.7 124 Tanzania .................................3.0
55 Malta .....................................4.7 125 Benin .....................................2.9
56 South Africa...........................4.6 126 Burundi ..................................2.8
57 Mauritius ...............................4.6 127 Mauritania..............................2.8
58 Greece...................................4.5 128 Burkina Faso..........................2.8
59 Uruguay .................................4.5 129 Timor-Leste............................2.7
60 Swaziland ..............................4.5 130 Bangladesh............................2.7
61 Sri Lanka................................4.4 131 Chad ......................................2.5
62 Georgia ..................................4.4 132 Lebanon.................................2.5
63 Azerbaijan ..............................4.4 133 Nepal .....................................2.4
64 Jamaica .................................4.4 134 Nigeria ...................................2.4
65 Slovak Republic .....................4.4 135 Paraguay................................2.4
66 Panama..................................4.3 136 Romania ................................2.4
67 Rwanda .................................4.3 137 Mongolia................................2.3
68 Egypt .....................................4.3 138 Angola ...................................2.2
69 Ireland....................................4.2 139 Bosnia and Herzegovina........2.0
70 Ukraine ..................................4.1
SOURCE: World Economic Forum, Executive Opinion Survey
The Global Competitiveness Report 2010-2011 © 2010 World Economic Forum](https://image.slidesharecdn.com/globalcompetitivenessreportwef2010-11-100928142139-phpapp02/75/Global-competitiveness-report-wef-2010-11-401-2048.jpg)
![2.02 Quality of roads
2.2: Data Tables | Section II: Infrastructure
How would you assess roads in your country? [1 = extremely underdeveloped; 7 = extensive and efficient by international standards] | 2009–10
weighted average
RANK COUNTRY/ECONOMY SCORE 1 MEAN: 4.0 7 RANK COUNTRY/ECONOMY SCORE 1 MEAN: 4.0 7
1 Singapore ..............................6.6 71 Jamaica .................................3.8
2 France....................................6.6 72 Pakistan .................................3.8
3 Switzerland ............................6.5 73 Cambodia ..............................3.8
4 Hong Kong SAR ....................6.5 74 Iran, Islamic Rep....................3.7
5 Germany ................................6.4 75 Egypt .....................................3.7
6 United Arab Emirates ............6.3 76 Malawi ...................................3.6
7 Austria ...................................6.3 77 Kenya.....................................3.6
8 Portugal .................................6.2 78 Dominican Republic...............3.6
9 Denmark ................................6.2 79 Norway ..................................3.6
10 Oman.....................................6.2 80 Czech Republic......................3.6
11 Luxembourg ..........................5.9 81 Albania...................................3.5
12 Chile ......................................5.9 82 Honduras ...............................3.5
13 Finland ...................................5.9 83 Ecuador .................................3.5
14 Korea, Rep.............................5.8 84 Indonesia ...............................3.5
15 Namibia .................................5.8 85 Syria.......................................3.5
16 Taiwan, China ........................5.8 86 Ghana ....................................3.4
17 Canada...................................5.7 87 Armenia .................................3.4
18 Sweden .................................5.7 88 Morocco ................................3.4
19 United States.........................5.7 89 Argentina ...............................3.3
20 Spain......................................5.7 90 India.......................................3.3
21 Malaysia ................................5.7 91 Senegal..................................3.3
22 Japan .....................................5.6 92 Peru .......................................3.3
23 Cyprus ...................................5.6 93 Côte d’Ivoire ..........................3.2
24 Belgium .................................5.5 94 Zimbabwe..............................3.2
25 Bahrain ..................................5.5 95 Nicaragua...............................3.2
26 Saudi Arabia...........................5.5 96 Venezuela ..............................3.2
27 Netherlands ...........................5.4 97 Libya ......................................3.1
28 Iceland ...................................5.4 98 Latvia .....................................3.1
29 El Salvador.............................5.4 99 Macedonia, FYR ....................3.1
30 Australia.................................5.3 100 Bangladesh............................3.0
31 Croatia ...................................5.3 101 Lebanon.................................3.0 389
32 Lithuania ................................5.3 102 Tajikistan ................................3.0
33 Brunei Darussalam ................5.3 103 Mali........................................2.9
34 Barbados ...............................5.3 104 Tanzania .................................2.9
35 United Kingdom.....................5.1 105 Brazil ......................................2.9
36 Thailand .................................5.1 106 Madagascar ...........................2.9
37 Tunisia....................................5.1 107 Benin .....................................2.9
38 Puerto Rico............................5.1 108 Colombia ...............................2.9
39 Swaziland ..............................5.1 109 Lesotho .................................2.9
40 Kuwait ...................................5.0 110 Zambia...................................2.8
41 Qatar......................................4.9 111 Costa Rica .............................2.8
42 Slovenia .................................4.8 112 Montenegro...........................2.8
43 South Africa...........................4.8 113 Malta .....................................2.8
44 Jordan....................................4.7 114 Philippines .............................2.8
45 New Zealand .........................4.7 115 Angola ...................................2.8
46 Turkey ....................................4.7 116 Cameroon..............................2.8
47 Botswana ..............................4.6 117 Vietnam .................................2.7
48 Estonia...................................4.5 118 Kyrgyz Republic .....................2.7
49 Uruguay .................................4.4 119 Uganda ..................................2.7
50 Israel ......................................4.4 120 Burundi ..................................2.7
51 Gambia, The ..........................4.3 121 Bolivia ....................................2.6
52 Ireland....................................4.3 122 Burkina Faso..........................2.6
53 China .....................................4.3 123 Serbia ....................................2.5
54 Italy ........................................4.2 124 Kazakhstan ............................2.4
55 Sri Lanka................................4.2 125 Russian Federation................2.4
56 Rwanda .................................4.1 126 Chad ......................................2.4
57 Greece...................................4.1 127 Mauritania..............................2.4
58 Mauritius ...............................4.1 128 Nigeria ...................................2.4
59 Panama..................................4.1 129 Mozambique..........................2.4
60 Ethiopia..................................4.1 130 Nepal .....................................2.3
61 Guatemala .............................4.1 131 Poland....................................2.2
62 Mexico...................................4.1 132 Timor-Leste............................2.2
63 Hungary .................................4.1 133 Paraguay................................2.2
64 Trinidad and Tobago...............4.0 134 Romania ................................2.1
65 Georgia ..................................3.9 135 Bulgaria..................................2.1
66 Algeria ...................................3.9 136 Ukraine ..................................2.0
67 Slovak Republic .....................3.9 137 Bosnia and Herzegovina........1.8
68 Cape Verde ............................3.9 138 Mongolia................................1.7
69 Guyana ..................................3.9 139 Moldova.................................1.3
70 Azerbaijan ..............................3.8
SOURCE: World Economic Forum, Executive Opinion Survey
The Global Competitiveness Report 2010-2011 © 2010 World Economic Forum](https://image.slidesharecdn.com/globalcompetitivenessreportwef2010-11-100928142139-phpapp02/75/Global-competitiveness-report-wef-2010-11-402-2048.jpg)
![2.03 Quality of railroad infrastructure
2.2: Data Tables | Section II: Infrastructure
How would you assess the railroad system in your country? [1 = extremely underdeveloped; 7 = extensive and efficient by international standards]
| 2009–10 weighted average
RANK COUNTRY/ECONOMY SCORE 1 MEAN: 3.2 7 RANK COUNTRY/ECONOMY SCORE 1 MEAN: 3.2 7
1 Switzerland ............................6.8 71 Bangladesh............................2.5
2 Hong Kong SAR ....................6.7 72 Tanzania .................................2.4
3 Japan .....................................6.6 73 Mozambique..........................2.4
4 France....................................6.5 74 Kenya.....................................2.3
5 Germany ................................6.2 75 Cameroon..............................2.3
6 Singapore ..............................5.8 76 Mexico...................................2.3
7 Finland ...................................5.8 77 Chile ......................................2.2
8 Taiwan, China ........................5.7 78 Malawi ...................................2.2
9 Netherlands ...........................5.7 79 Armenia .................................2.2
10 Korea, Rep.............................5.7 80 Côte d’Ivoire ..........................2.1
11 Belgium .................................5.5 81 Macedonia, FYR ....................2.1
12 Denmark ................................5.4 82 Argentina ...............................2.1
13 Spain......................................5.4 83 Dominican Republic...............2.0
14 Sweden .................................5.4 84 Zambia...................................2.0
15 Austria ...................................5.3 85 Mali........................................2.0
16 Canada...................................5.3 86 Mauritania..............................2.0
17 Luxembourg ..........................5.2 87 Brazil ......................................1.9
18 United States.........................4.8 88 Benin .....................................1.9
19 United Kingdom.....................4.7 89 Senegal..................................1.9
20 Malaysia ................................4.7 90 Guyana ..................................1.9
21 Slovak Republic .....................4.7 91 Peru .......................................1.9
22 Czech Republic......................4.6 92 Burkina Faso..........................1.8
23 India.......................................4.6 93 Serbia ....................................1.7
24 Portugal .................................4.5 94 Bolivia ....................................1.7
25 Ukraine ..................................4.4 95 Bosnia and Herzegovina........1.7
26 Australia.................................4.4 96 Madagascar ...........................1.7
27 China .....................................4.3 97 Philippines .............................1.7
28 Lithuania ................................4.3 98 Jordan....................................1.6
29 Tunisia....................................4.2 99 Cambodia ..............................1.6
30 Namibia .................................4.1 100 Costa Rica .............................1.6
390 31 Russian Federation................4.1 101 Venezuela ..............................1.5
32 Kazakhstan ............................4.0 102 Colombia ...............................1.5
33 Latvia .....................................3.9 103 Ethiopia..................................1.5
34 Azerbaijan ..............................3.9 104 Nigeria ...................................1.5
35 Swaziland ..............................3.7 105 Honduras ...............................1.5
36 Estonia...................................3.7 106 Ghana ....................................1.4
37 Morocco ................................3.7 107 Angola ...................................1.4
38 Saudi Arabia...........................3.6 108 Uruguay .................................1.4
39 Italy ........................................3.6 109 Albania...................................1.3
40 Sri Lanka................................3.6 110 El Salvador.............................1.2
41 Georgia ..................................3.6 111 Uganda ..................................1.2
42 Ireland....................................3.5 112 Nepal .....................................1.2
43 Hungary .................................3.5 113 Ecuador .................................1.1
44 Botswana ..............................3.5 114 Guatemala .............................1.1
45 New Zealand .........................3.4 115 Paraguay................................1.0
46 Egypt .....................................3.4 116 Lebanon.................................1.0
47 South Africa...........................3.3 Bahrain.............................n/appl.
48 Croatia ...................................3.3 Barbados..........................n/appl.
49 Slovenia .................................3.2 Brunei Darussalam...........n/appl.
50 Norway ..................................3.2 Burundi ............................n/appl.
51 Tajikistan ................................3.2 Cape Verde ......................n/appl.
52 Israel ......................................3.2 Chad.................................n/appl.
53 Iran, Islamic Rep....................3.2 Cyprus..............................n/appl.
54 Bulgaria..................................3.1 Gambia, The.....................n/appl.
55 Pakistan .................................3.1 Iceland .............................n/appl.
56 Indonesia ...............................3.0 Jamaica............................n/appl.
57 Thailand .................................3.0 Kuwait ..............................n/appl.
58 Panama..................................3.0 Lesotho............................n/appl.
59 Vietnam .................................2.9 Libya ................................n/appl.
60 Kyrgyz Republic .....................2.8 Malta ................................n/appl.
61 Zimbabwe..............................2.8 Mauritius ..........................n/appl.
62 Poland....................................2.7 Nicaragua .........................n/appl.
63 Turkey ....................................2.7 Oman ...............................n/appl.
64 Greece...................................2.7 Puerto Rico ......................n/appl.
65 Algeria ...................................2.7 Qatar ................................n/appl.
66 Syria.......................................2.6 Rwanda............................n/appl.
67 Moldova.................................2.6 Timor-Leste ......................n/appl.
68 Montenegro...........................2.6 Trinidad and Tobago .........n/appl.
69 Mongolia................................2.5 United Arab Emirates ......n/appl.
70 Romania ................................2.5
SOURCE: World Economic Forum, Executive Opinion Survey
The Global Competitiveness Report 2010-2011 © 2010 World Economic Forum](https://image.slidesharecdn.com/globalcompetitivenessreportwef2010-11-100928142139-phpapp02/75/Global-competitiveness-report-wef-2010-11-403-2048.jpg)
![2.04 Quality of port infrastructure
2.2: Data Tables | Section II: Infrastructure
How would you assess port facilities in your country? [1 = extremely underdeveloped; 7 = well developed and efficient by international standards]
For landlocked countries, the question is as follows: How accessible are port facilities? [1 = extremely inaccessible; 7 = extremely accessible] |
2009–10 weighted average
RANK COUNTRY/ECONOMY SCORE 1 MEAN: 4.3 7 RANK COUNTRY/ECONOMY SCORE 1 MEAN: 4.3 7
1 Hong Kong SAR ....................6.8 71 El Salvador.............................4.1
2 Singapore ..............................6.8 72 Turkey ....................................4.1
3 Netherlands ...........................6.6 73 Pakistan .................................4.0
4 Belgium .................................6.4 74 Greece...................................4.0
5 Germany ................................6.4 75 Georgia ..................................4.0
6 Finland ...................................6.4 76 Benin .....................................4.0
7 Iceland ...................................6.3 77 Hungary .................................4.0
8 United Arab Emirates ............6.2 78 Slovak Republic .....................4.0
9 Sweden .................................6.2 79 Croatia ...................................4.0
10 Denmark ................................6.1 80 Burkina Faso..........................3.9
11 Panama..................................6.0 81 Italy........................................3.9
12 France....................................5.9 82 Cambodia ..............................3.9
13 Bahrain ..................................5.8 83 India.......................................3.9
14 Canada...................................5.7 84 Iran, Islamic Rep....................3.9
15 Norway ..................................5.7 85 Kenya.....................................3.8
16 Namibia .................................5.6 86 Botswana ..............................3.8
17 Estonia...................................5.6 87 Bulgaria..................................3.8
18 Spain......................................5.6 88 Argentina ...............................3.8
19 Malaysia ................................5.6 89 Mexico...................................3.7
20 Malta .....................................5.6 90 Macedonia, FYR ....................3.7
21 Barbados ...............................5.5 91 Mali........................................3.7
22 United States.........................5.5 92 Ecuador .................................3.7
23 United Kingdom.....................5.5 93 Russian Federation................3.7
24 Chile ......................................5.5 94 Ukraine ..................................3.6
25 Korea, Rep.............................5.5 95 Zambia...................................3.6
26 New Zealand .........................5.4 96 Indonesia ...............................3.6
27 Qatar......................................5.4 97 Vietnam .................................3.6
28 Puerto Rico............................5.4 98 Mauritania..............................3.6
29 Luxembourg ..........................5.4 99 Malawi ...................................3.6 391
30 Taiwan, China ........................5.4 100 Albania...................................3.5
31 Jamaica .................................5.3 101 Uganda ..................................3.5
32 Honduras ...............................5.3 102 Cape Verde ............................3.5
33 Oman.....................................5.3 103 Guyana ..................................3.5
34 Slovenia .................................5.3 104 Mozambique..........................3.5
35 Switzerland ............................5.2 105 Colombia ...............................3.5
36 Saudi Arabia...........................5.2 106 Montenegro...........................3.4
37 Japan .....................................5.2 107 Bangladesh............................3.4
38 Uruguay .................................5.2 108 Madagascar ...........................3.4
39 Cyprus ...................................5.1 109 Paraguay................................3.4
40 Gambia, The ..........................5.1 110 Cameroon..............................3.3
41 Tunisia....................................5.0 111 Kazakhstan ............................3.3
42 Côte d’Ivoire ..........................5.0 112 Mongolia................................3.3
43 Thailand .................................5.0 113 Peru .......................................3.3
44 Sri Lanka................................4.9 114 Poland....................................3.3
45 Ireland....................................4.9 115 Algeria ...................................3.2
46 Australia.................................4.9 116 Libya ......................................3.2
47 Portugal .................................4.9 117 Syria.......................................3.1
48 Austria ...................................4.8 118 Lesotho .................................3.1
49 South Africa...........................4.7 119 Tanzania .................................3.0
50 Lithuania ................................4.7 120 Burundi ..................................3.0
51 Senegal..................................4.7 121 Nigeria ...................................3.0
52 Latvia .....................................4.7 122 Romania ................................3.0
53 Israel ......................................4.6 123 Brazil ......................................2.9
54 Czech Republic......................4.6 124 Moldova.................................2.9
55 Lebanon.................................4.5 125 Nepal .....................................2.9
56 Mauritius ...............................4.5 126 Nicaragua...............................2.9
57 Guatemala .............................4.5 127 Bolivia ....................................2.9
58 Brunei Darussalam ................4.5 128 Armenia .................................2.9
59 Ghana ....................................4.5 129 Serbia ....................................2.8
60 Ethiopia..................................4.4 130 Rwanda .................................2.8
61 Zimbabwe..............................4.4 131 Philippines .............................2.8
62 Morocco ................................4.4 132 Costa Rica .............................2.7
63 Kuwait ...................................4.4 133 Chad ......................................2.6
64 Jordan....................................4.4 134 Timor-Leste............................2.5
65 Dominican Republic...............4.3 135 Venezuela ..............................2.4
66 Trinidad and Tobago...............4.3 136 Angola ...................................2.1
67 China .....................................4.3 137 Tajikistan ................................1.9
68 Swaziland ..............................4.2 138 Bosnia and Herzegovina........1.6
69 Egypt .....................................4.2 139 Kyrgyz Republic .....................1.4
70 Azerbaijan ..............................4.2
SOURCE: World Economic Forum, Executive Opinion Survey
The Global Competitiveness Report 2010-2011 © 2010 World Economic Forum](https://image.slidesharecdn.com/globalcompetitivenessreportwef2010-11-100928142139-phpapp02/75/Global-competitiveness-report-wef-2010-11-404-2048.jpg)
![2.05 Quality of air transport infrastructure
2.2: Data Tables | Section II: Infrastructure
How would you assess passenger air transport infrastructure in your country? [1 = extremely underdeveloped; 7 = extensive and efficient by
international standards] | 2009–10 weighted average
RANK COUNTRY/ECONOMY SCORE 1 MEAN: 4.7 7 RANK COUNTRY/ECONOMY SCORE 1 MEAN: 4.7 7
1 Hong Kong SAR ....................6.9 71 India.......................................4.6
2 Singapore ..............................6.9 72 Croatia ...................................4.6
3 Germany ................................6.6 73 Ecuador .................................4.6
4 United Arab Emirates ............6.6 74 Estonia...................................4.6
5 Switzerland ............................6.5 75 Côte d’Ivoire ..........................4.5
6 Denmark ................................6.4 76 Senegal..................................4.5
7 Iceland ...................................6.4 77 Armenia .................................4.5
8 Netherlands ...........................6.3 78 Peru .......................................4.5
9 France....................................6.3 79 China .....................................4.4
10 Norway ..................................6.2 80 Costa Rica .............................4.4
11 New Zealand .........................6.2 81 Pakistan .................................4.3
12 Sweden .................................6.2 82 Cape Verde ............................4.3
13 Barbados ...............................6.2 83 Cambodia ..............................4.3
14 Belgium .................................6.2 84 Italy........................................4.3
15 Finland ...................................6.2 85 Ghana ....................................4.2
16 Qatar......................................6.1 86 Georgia ..................................4.2
17 Czech Republic......................6.1 87 Nicaragua...............................4.2
18 South Africa...........................6.1 88 Vietnam .................................4.2
19 Puerto Rico............................6.0 89 Colombia ...............................4.1
20 Bahrain ..................................6.0 90 Bulgaria..................................4.1
21 Malta .....................................6.0 91 Montenegro...........................4.1
22 Korea, Rep.............................6.0 92 Mozambique..........................4.1
23 Canada...................................6.0 93 Brazil ......................................4.0
24 Panama..................................6.0 94 Botswana ..............................4.0
25 Austria ...................................6.0 95 Kazakhstan ............................3.9
26 Chile ......................................5.9 96 Benin .....................................3.9
27 Luxembourg ..........................5.9 97 Rwanda .................................3.9
28 Thailand .................................5.9 98 Algeria ...................................3.9
29 Malaysia ................................5.9 99 Zimbabwe..............................3.9
30 Australia.................................5.8 100 Uganda ..................................3.9
392 31 Spain......................................5.8 101 Nigeria ...................................3.9
32 United States.........................5.8 102 Romania ................................3.9
33 El Salvador.............................5.7 103 Bolivia ....................................3.8
34 United Kingdom.....................5.7 104 Russian Federation................3.8
35 Jordan....................................5.7 105 Guyana ..................................3.8
36 Lebanon.................................5.7 106 Madagascar ...........................3.8
37 Israel ......................................5.6 107 Tajikistan ................................3.8
38 Tunisia....................................5.6 108 Poland....................................3.6
39 Egypt .....................................5.5 109 Moldova.................................3.6
40 Trinidad and Tobago...............5.5 110 Ukraine ..................................3.6
41 Oman.....................................5.5 111 Zambia...................................3.6
42 Latvia .....................................5.4 112 Philippines .............................3.6
43 Cyprus ...................................5.4 113 Venezuela ..............................3.6
44 Turkey ....................................5.4 114 Lithuania ................................3.6
45 Greece...................................5.4 115 Argentina ...............................3.6
46 Saudi Arabia...........................5.4 116 Nepal .....................................3.5
47 Jamaica .................................5.4 117 Bangladesh............................3.5
48 Ethiopia..................................5.4 118 Tanzania .................................3.4
49 Guatemala .............................5.4 119 Malawi ...................................3.3
50 Portugal .................................5.3 120 Slovak Republic .....................3.3
51 Dominican Republic...............5.3 121 Burundi ..................................3.3
52 Ireland....................................5.2 122 Cameroon..............................3.3
53 Taiwan, China ........................5.2 123 Mali........................................3.2
54 Japan .....................................5.1 124 Serbia ....................................3.2
55 Namibia .................................5.1 125 Swaziland ..............................3.2
56 Mauritius ...............................5.0 126 Syria.......................................3.1
57 Kenya.....................................5.0 127 Macedonia, FYR ....................3.1
58 Albania...................................4.9 128 Angola ...................................3.0
59 Azerbaijan ..............................4.9 129 Mongolia................................3.0
60 Brunei Darussalam ................4.9 130 Iran, Islamic Rep....................3.0
61 Gambia, The ..........................4.8 131 Burkina Faso..........................3.0
62 Sri Lanka................................4.8 132 Kyrgyz Republic .....................3.0
63 Slovenia .................................4.8 133 Libya ......................................2.9
64 Kuwait ...................................4.7 134 Timor-Leste............................2.9
65 Mexico...................................4.7 135 Mauritania..............................2.9
66 Hungary .................................4.7 136 Chad ......................................2.8
67 Morocco ................................4.7 137 Paraguay................................2.6
68 Uruguay .................................4.7 138 Bosnia and Herzegovina........2.5
69 Indonesia ...............................4.6 139 Lesotho .................................2.3
70 Honduras ...............................4.6
SOURCE: World Economic Forum, Executive Opinion Survey
The Global Competitiveness Report 2010-2011 © 2010 World Economic Forum](https://image.slidesharecdn.com/globalcompetitivenessreportwef2010-11-100928142139-phpapp02/75/Global-competitiveness-report-wef-2010-11-405-2048.jpg)
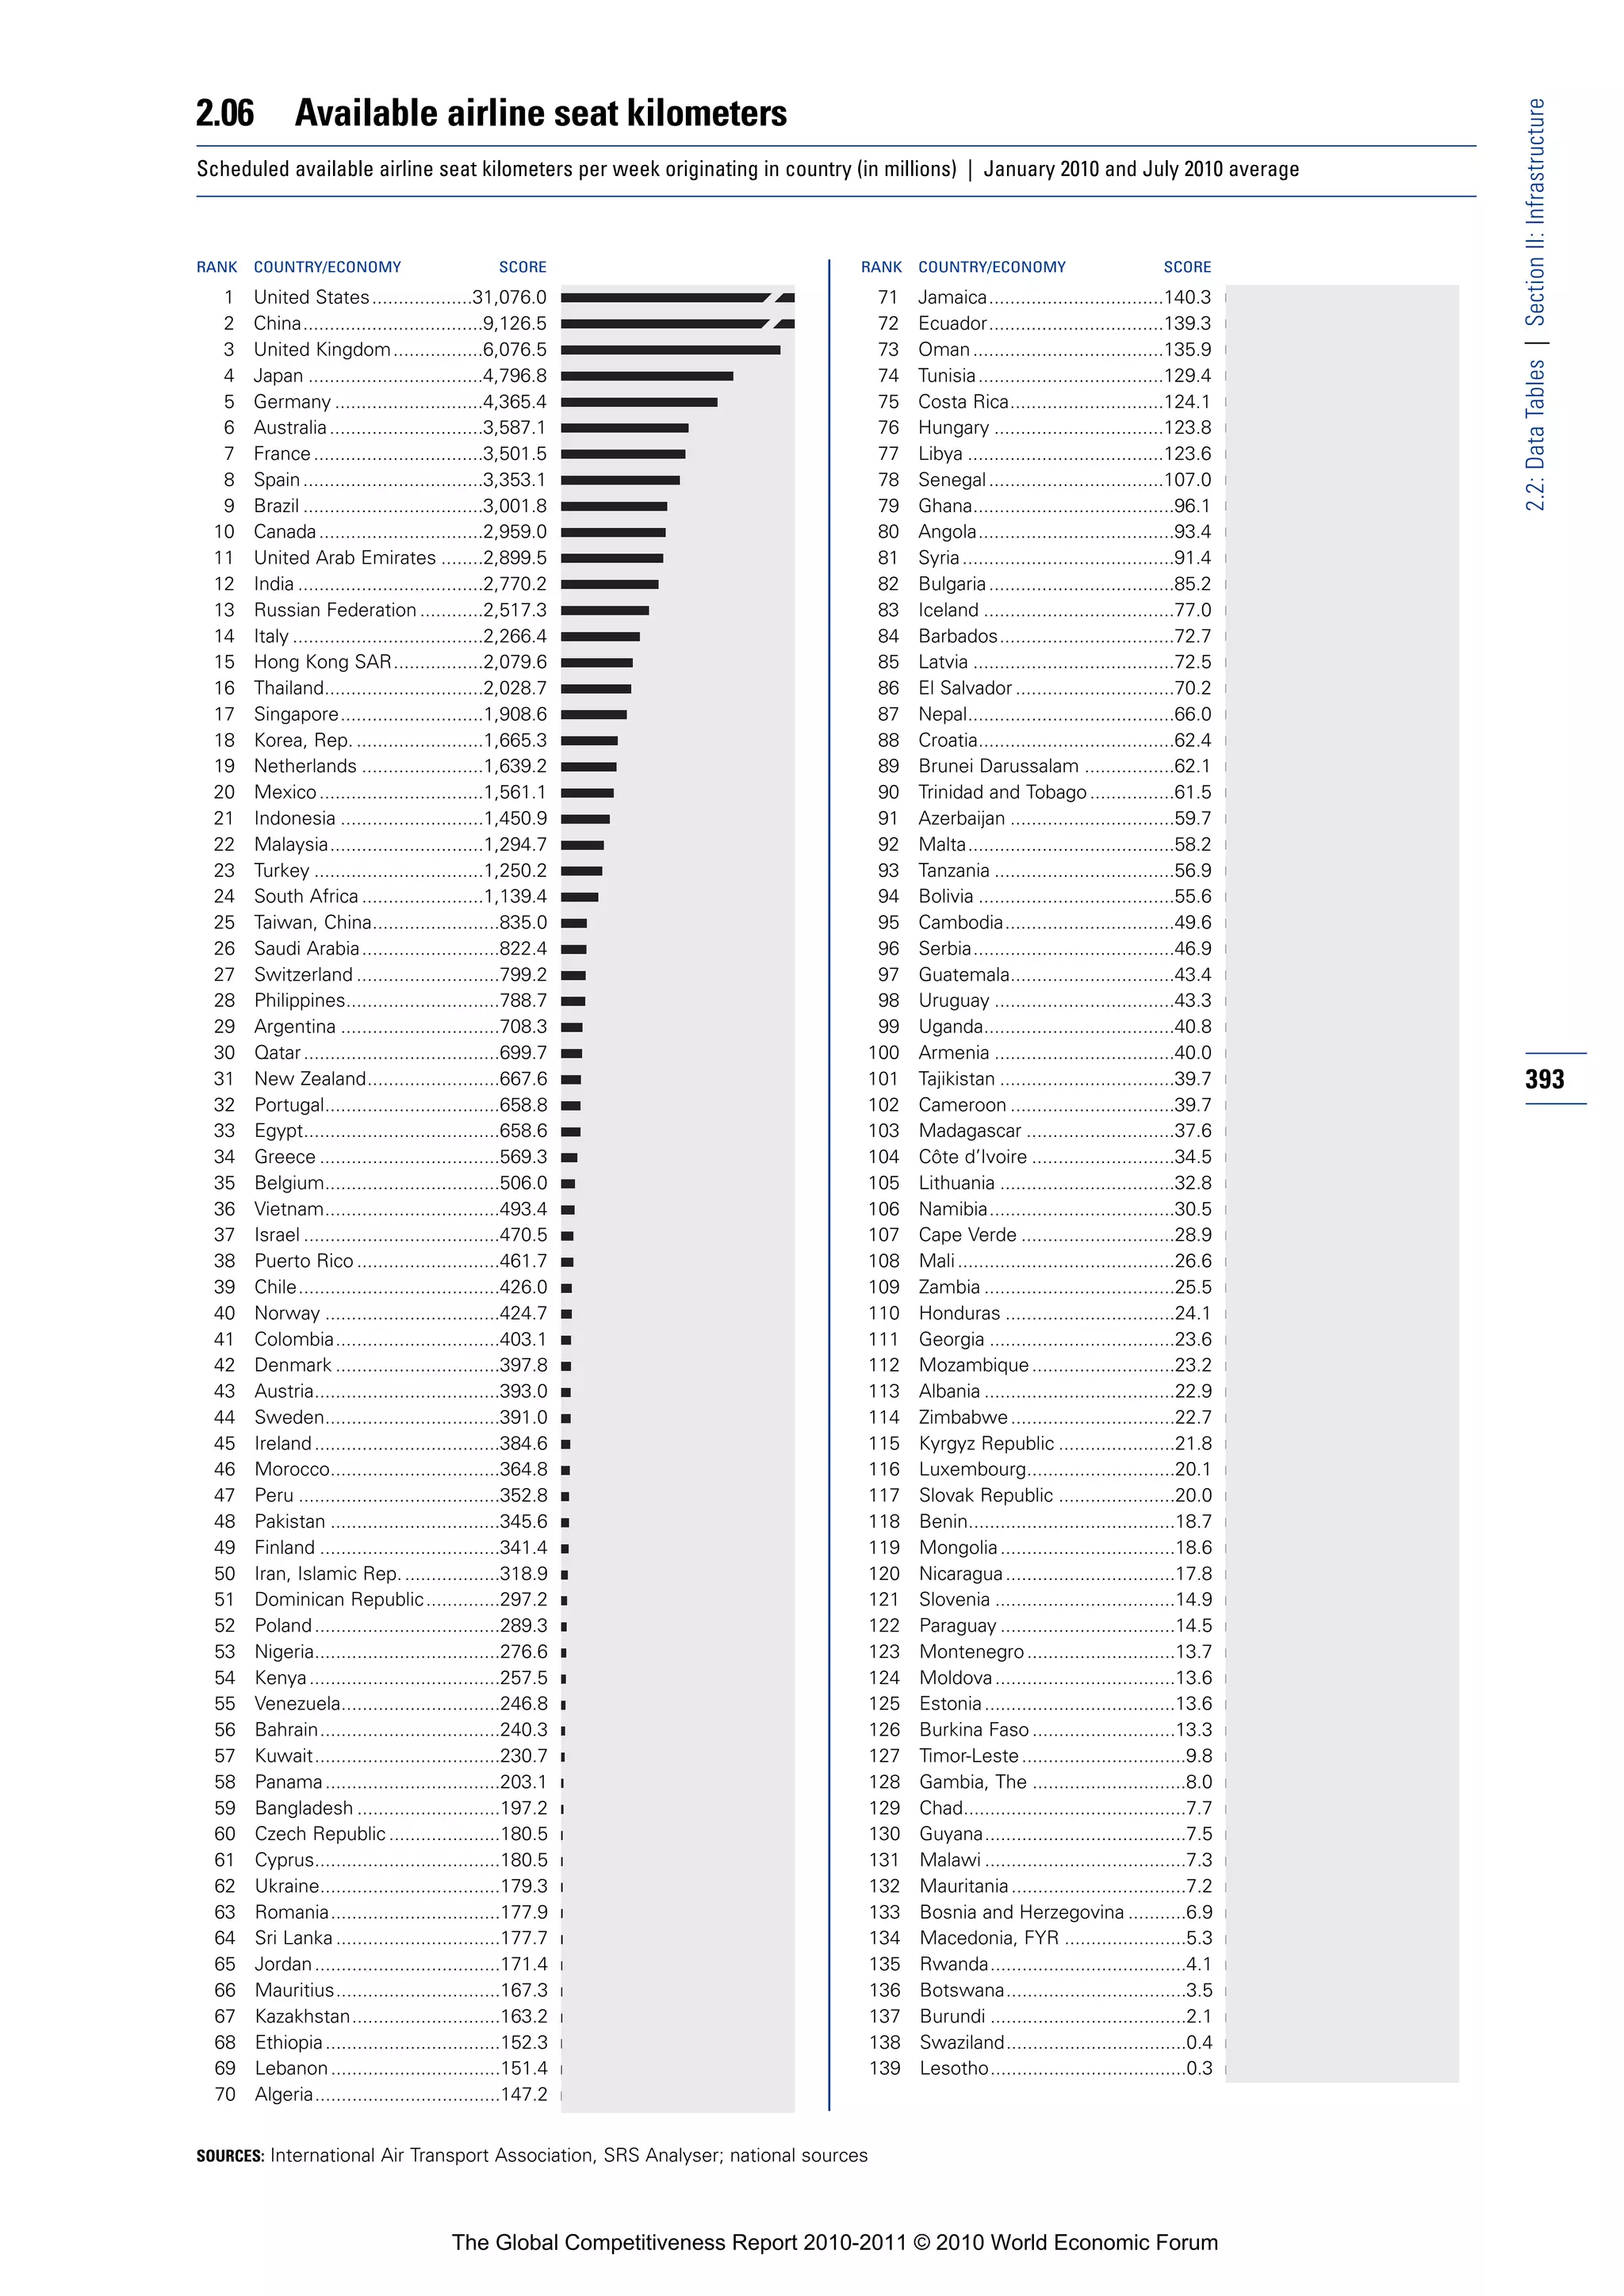
![2.07 Quality of electricity supply
2.2: Data Tables | Section II: Infrastructure
How would you assess the quality of the electricity supply in your country (lack of interruptions and lack of voltage fluctuations)? [1 = insufficient
and suffers frequent interruptions; 7 = sufficient and reliable] | 2009–10 weighted average
RANK COUNTRY/ECONOMY SCORE 1 MEAN: 4.5 7 RANK COUNTRY/ECONOMY SCORE 1 MEAN: 4.5 7
1 Hong Kong SAR ....................6.9 71 Kuwait ...................................4.7
2 Iceland ...................................6.9 72 Macedonia, FYR ....................4.6
3 Denmark ................................6.9 73 Turkey ....................................4.6
4 Finland ...................................6.8 74 Serbia ....................................4.6
5 Japan .....................................6.8 75 Ukraine ..................................4.6
6 Germany ................................6.8 76 Sri Lanka................................4.6
7 Switzerland ............................6.8 77 Romania ................................4.5
8 Austria ...................................6.7 78 Armenia .................................4.4
9 Singapore ..............................6.7 79 Bolivia ....................................4.4
10 France....................................6.7 80 Russian Federation................4.3
11 Netherlands ...........................6.7 81 Libya ......................................4.3
12 Sweden .................................6.7 82 Honduras ...............................4.2
13 Belgium .................................6.7 83 Jamaica .................................4.2
14 Canada...................................6.6 84 Kazakhstan ............................4.1
15 United Kingdom.....................6.6 85 Rwanda .................................4.1
16 Norway ..................................6.6 86 Azerbaijan ..............................4.1
17 United Arab Emirates ............6.5 87 Moldova.................................4.1
18 Czech Republic......................6.4 88 Botswana ..............................4.1
19 Korea, Rep.............................6.3 89 Malta .....................................4.0
20 Luxembourg ..........................6.3 90 Albania...................................4.0
21 Qatar......................................6.3 91 Mexico...................................3.9
22 Oman.....................................6.2 92 Montenegro...........................3.9
23 United States.........................6.2 93 Argentina ...............................3.8
24 Taiwan, China ........................6.2 94 South Africa...........................3.8
25 Ireland....................................6.2 95 Swaziland ..............................3.8
26 Portugal .................................6.1 96 Bulgaria..................................3.7
27 Barbados ...............................6.1 97 Indonesia ...............................3.6
28 Slovak Republic .....................6.1 98 Vietnam .................................3.6
29 Saudi Arabia...........................6.1 99 Lesotho .................................3.6
30 Chile ......................................6.0 100 Côte d’Ivoire ..........................3.5
394 31 Cyprus ...................................6.0 101 Philippines .............................3.4
32 Slovenia .................................6.0 102 Ecuador .................................3.4
33 Australia.................................6.0 103 Kenya.....................................3.4
34 Israel ......................................5.9 104 Mali........................................3.3
35 Tunisia....................................5.9 105 Mozambique..........................3.3
36 Spain......................................5.9 106 Zambia...................................3.3
37 Uruguay .................................5.8 107 Syria.......................................3.3
38 Jordan....................................5.8 108 Benin .....................................3.3
39 Estonia...................................5.7 109 Ghana ....................................3.2
40 Malaysia ................................5.7 110 India.......................................3.1
41 Namibia .................................5.7 111 Mongolia................................3.1
42 Thailand .................................5.7 112 Cambodia ..............................3.1
43 Costa Rica .............................5.7 113 Nicaragua...............................3.0
44 Trinidad and Tobago...............5.6 114 Mauritania..............................3.0
45 Lithuania ................................5.6 115 Paraguay................................2.9
46 Hungary .................................5.5 116 Guyana ..................................2.9
47 Italy ........................................5.5 117 Uganda ..................................2.8
48 Bosnia and Herzegovina........5.4 118 Cameroon..............................2.8
49 Croatia ...................................5.4 119 Ethiopia..................................2.7
50 Latvia .....................................5.3 120 Tajikistan ................................2.6
51 Panama..................................5.3 121 Madagascar ...........................2.6
52 China .....................................5.3 122 Tanzania .................................2.5
53 Egypt .....................................5.3 123 Burundi ..................................2.5
54 Poland....................................5.2 124 Venezuela ..............................2.3
55 Brunei Darussalam ................5.2 125 Senegal..................................2.3
56 New Zealand .........................5.2 126 Kyrgyz Republic .....................2.3
57 Colombia ...............................5.2 127 Burkina Faso..........................2.2
58 Georgia ..................................5.1 128 Pakistan .................................2.1
59 Puerto Rico............................5.1 129 Malawi ...................................2.0
60 El Salvador.............................5.1 130 Zimbabwe..............................1.8
61 Guatemala .............................5.1 131 Cape Verde ............................1.8
62 Bahrain ..................................5.1 132 Dominican Republic...............1.7
63 Brazil ......................................5.1 133 Timor-Leste............................1.6
64 Mauritius ...............................5.1 134 Bangladesh............................1.6
65 Greece...................................5.0 135 Angola ...................................1.5
66 Morocco ................................4.9 136 Lebanon.................................1.5
67 Gambia, The ..........................4.8 137 Chad ......................................1.5
68 Peru .......................................4.8 138 Nigeria ...................................1.3
69 Algeria ...................................4.8 139 Nepal .....................................1.2
70 Iran, Islamic Rep....................4.7
SOURCE: World Economic Forum, Executive Opinion Survey
The Global Competitiveness Report 2010-2011 © 2010 World Economic Forum](https://image.slidesharecdn.com/globalcompetitivenessreportwef2010-11-100928142139-phpapp02/75/Global-competitiveness-report-wef-2010-11-407-2048.jpg)
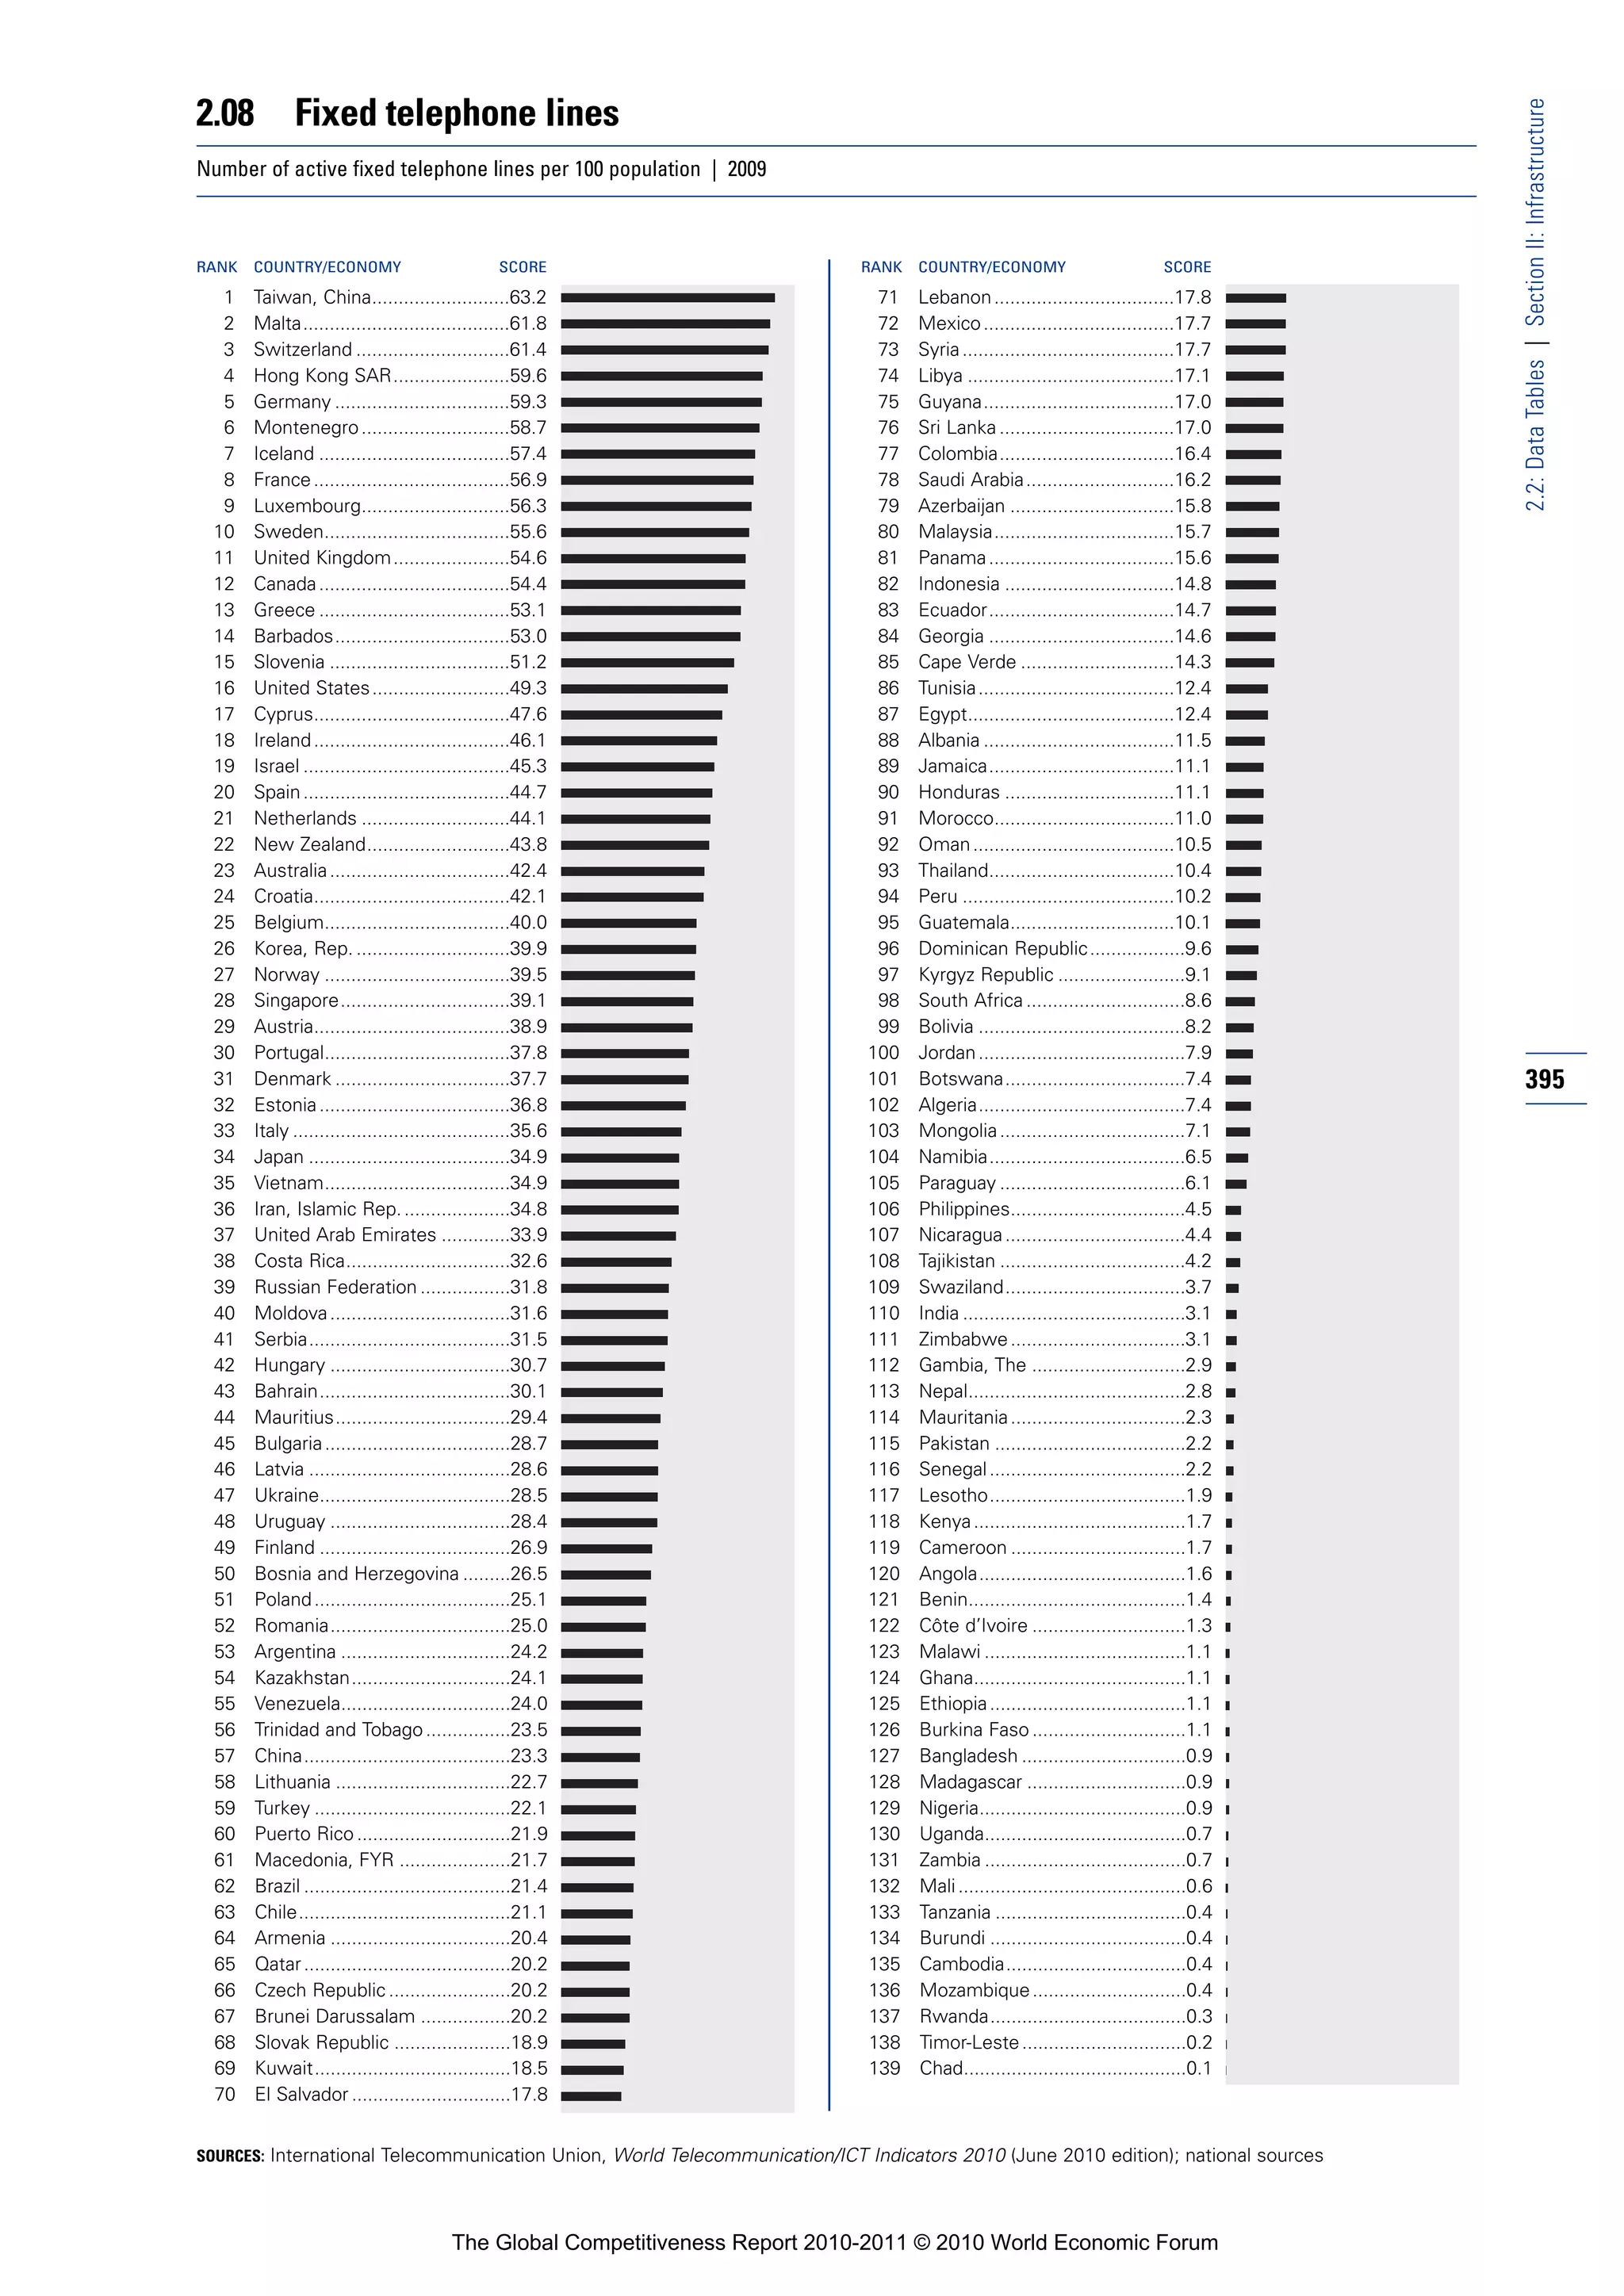
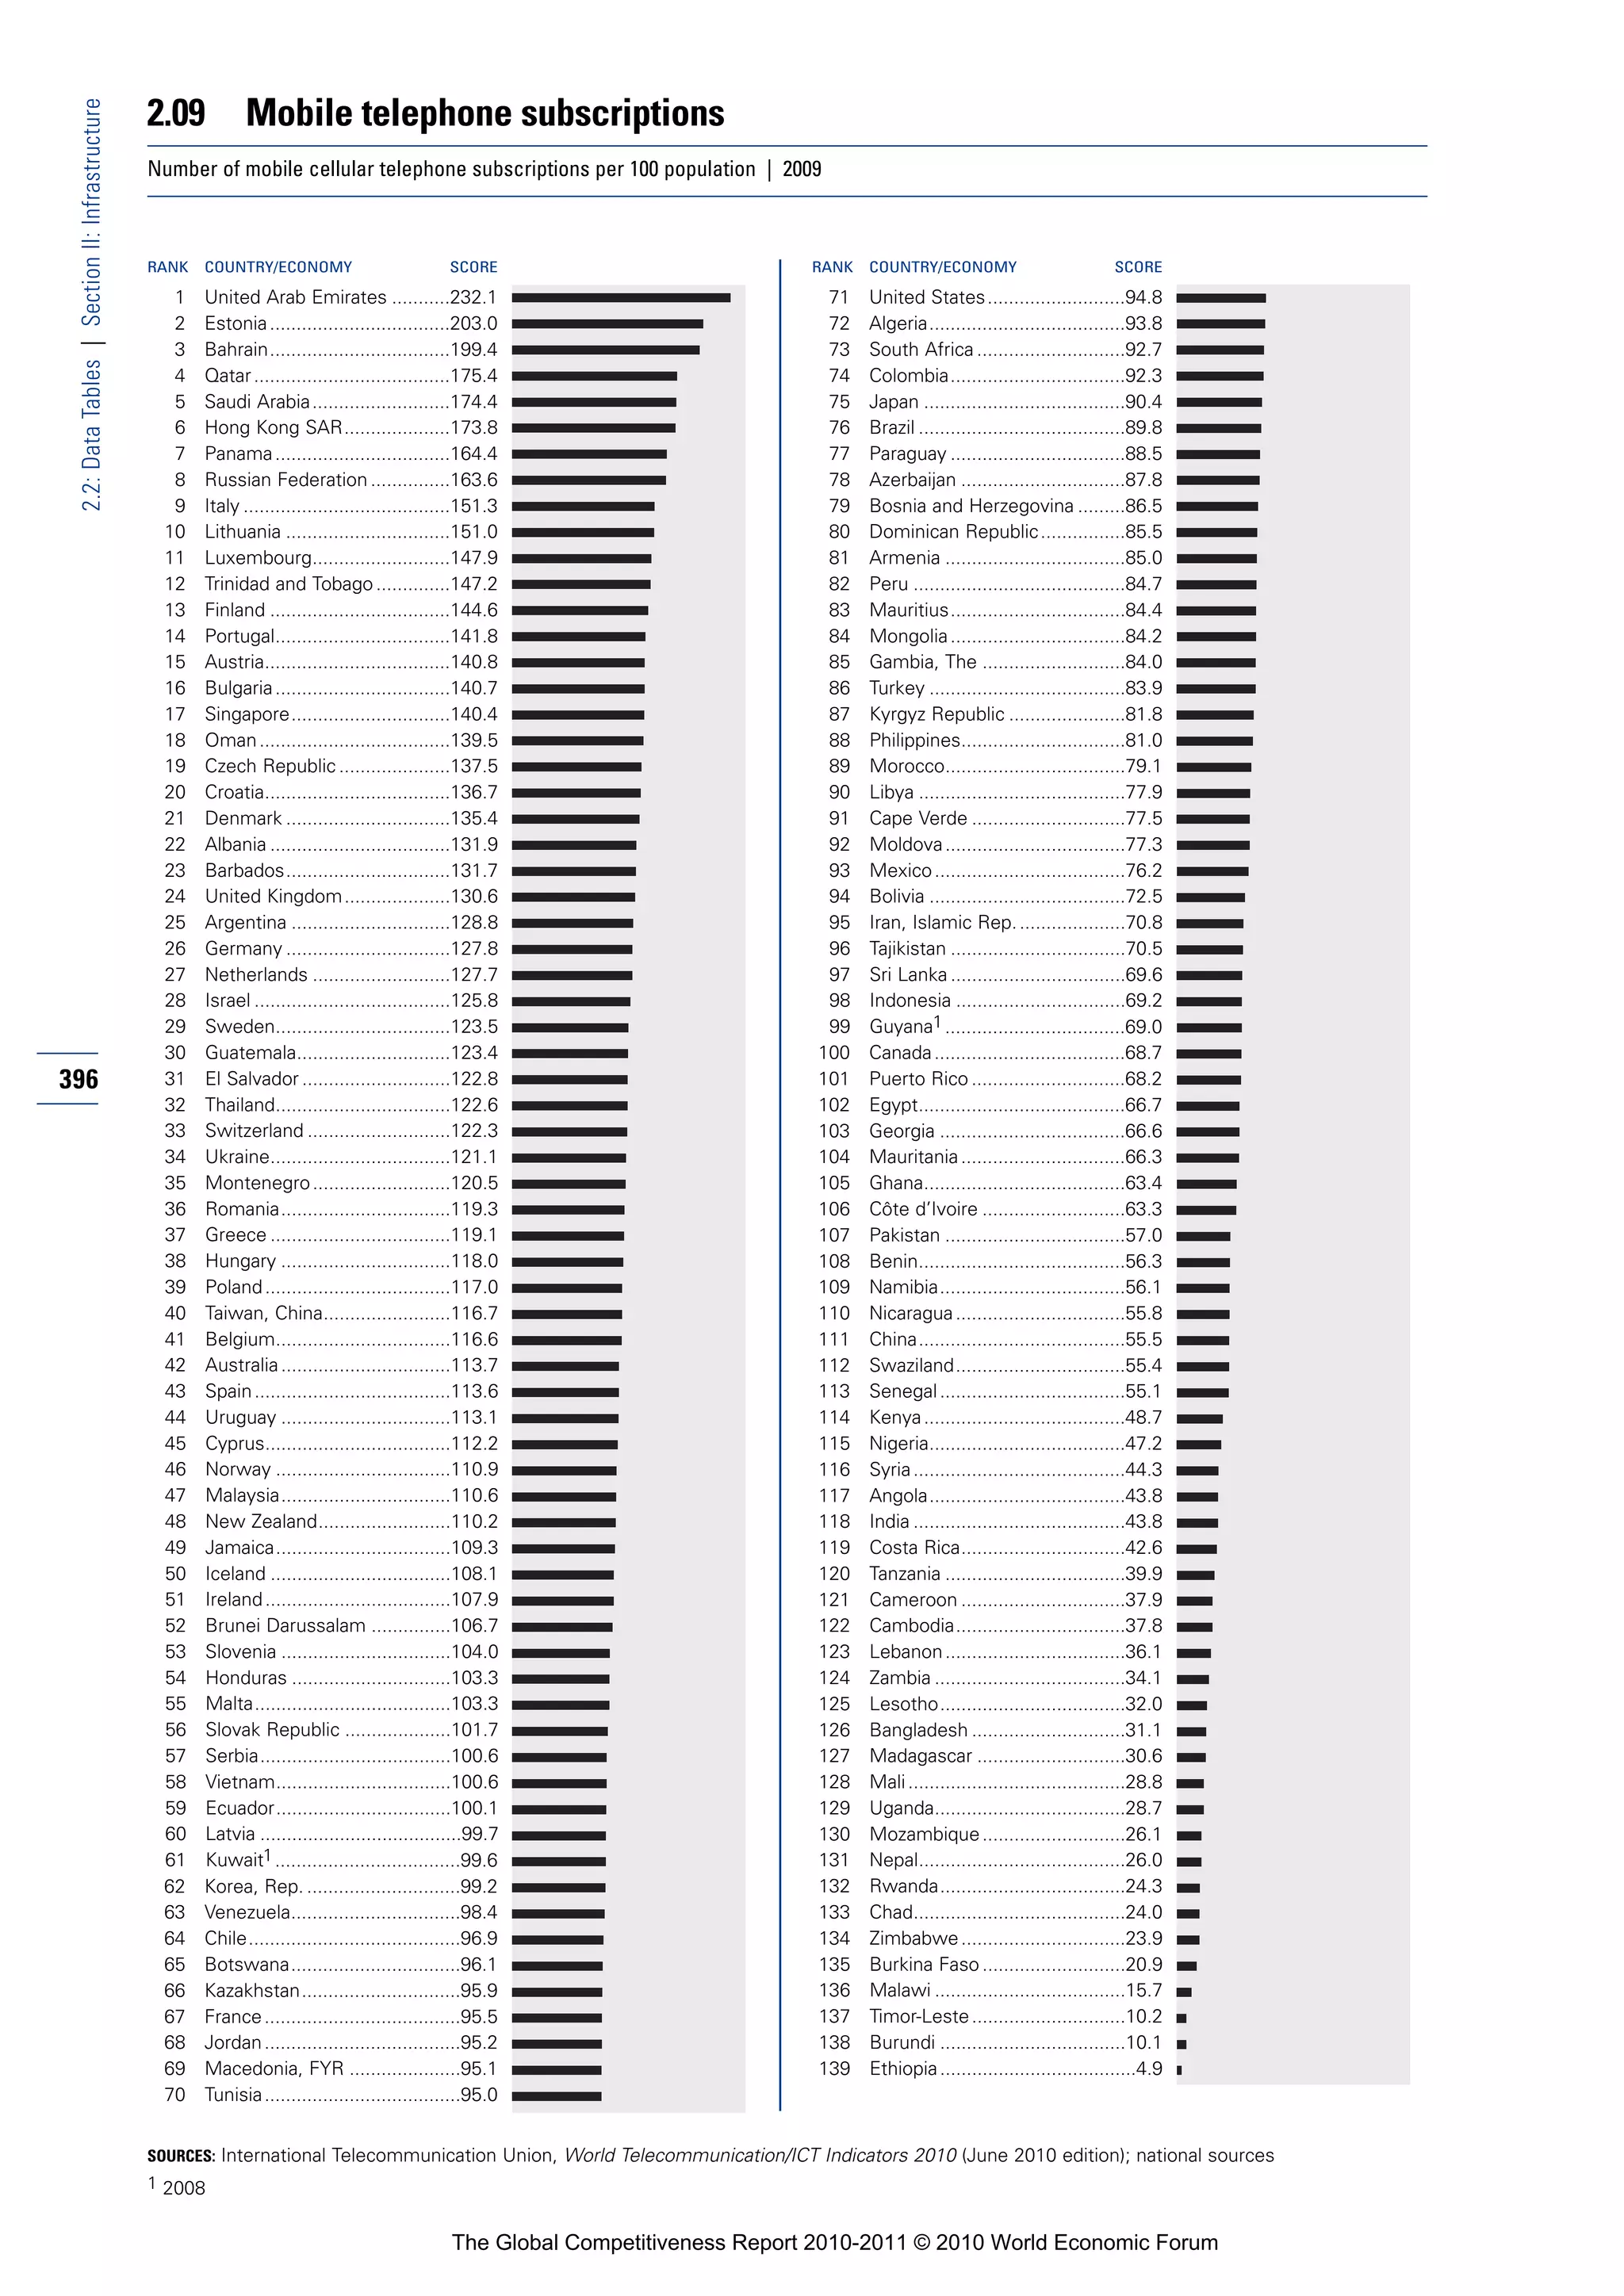
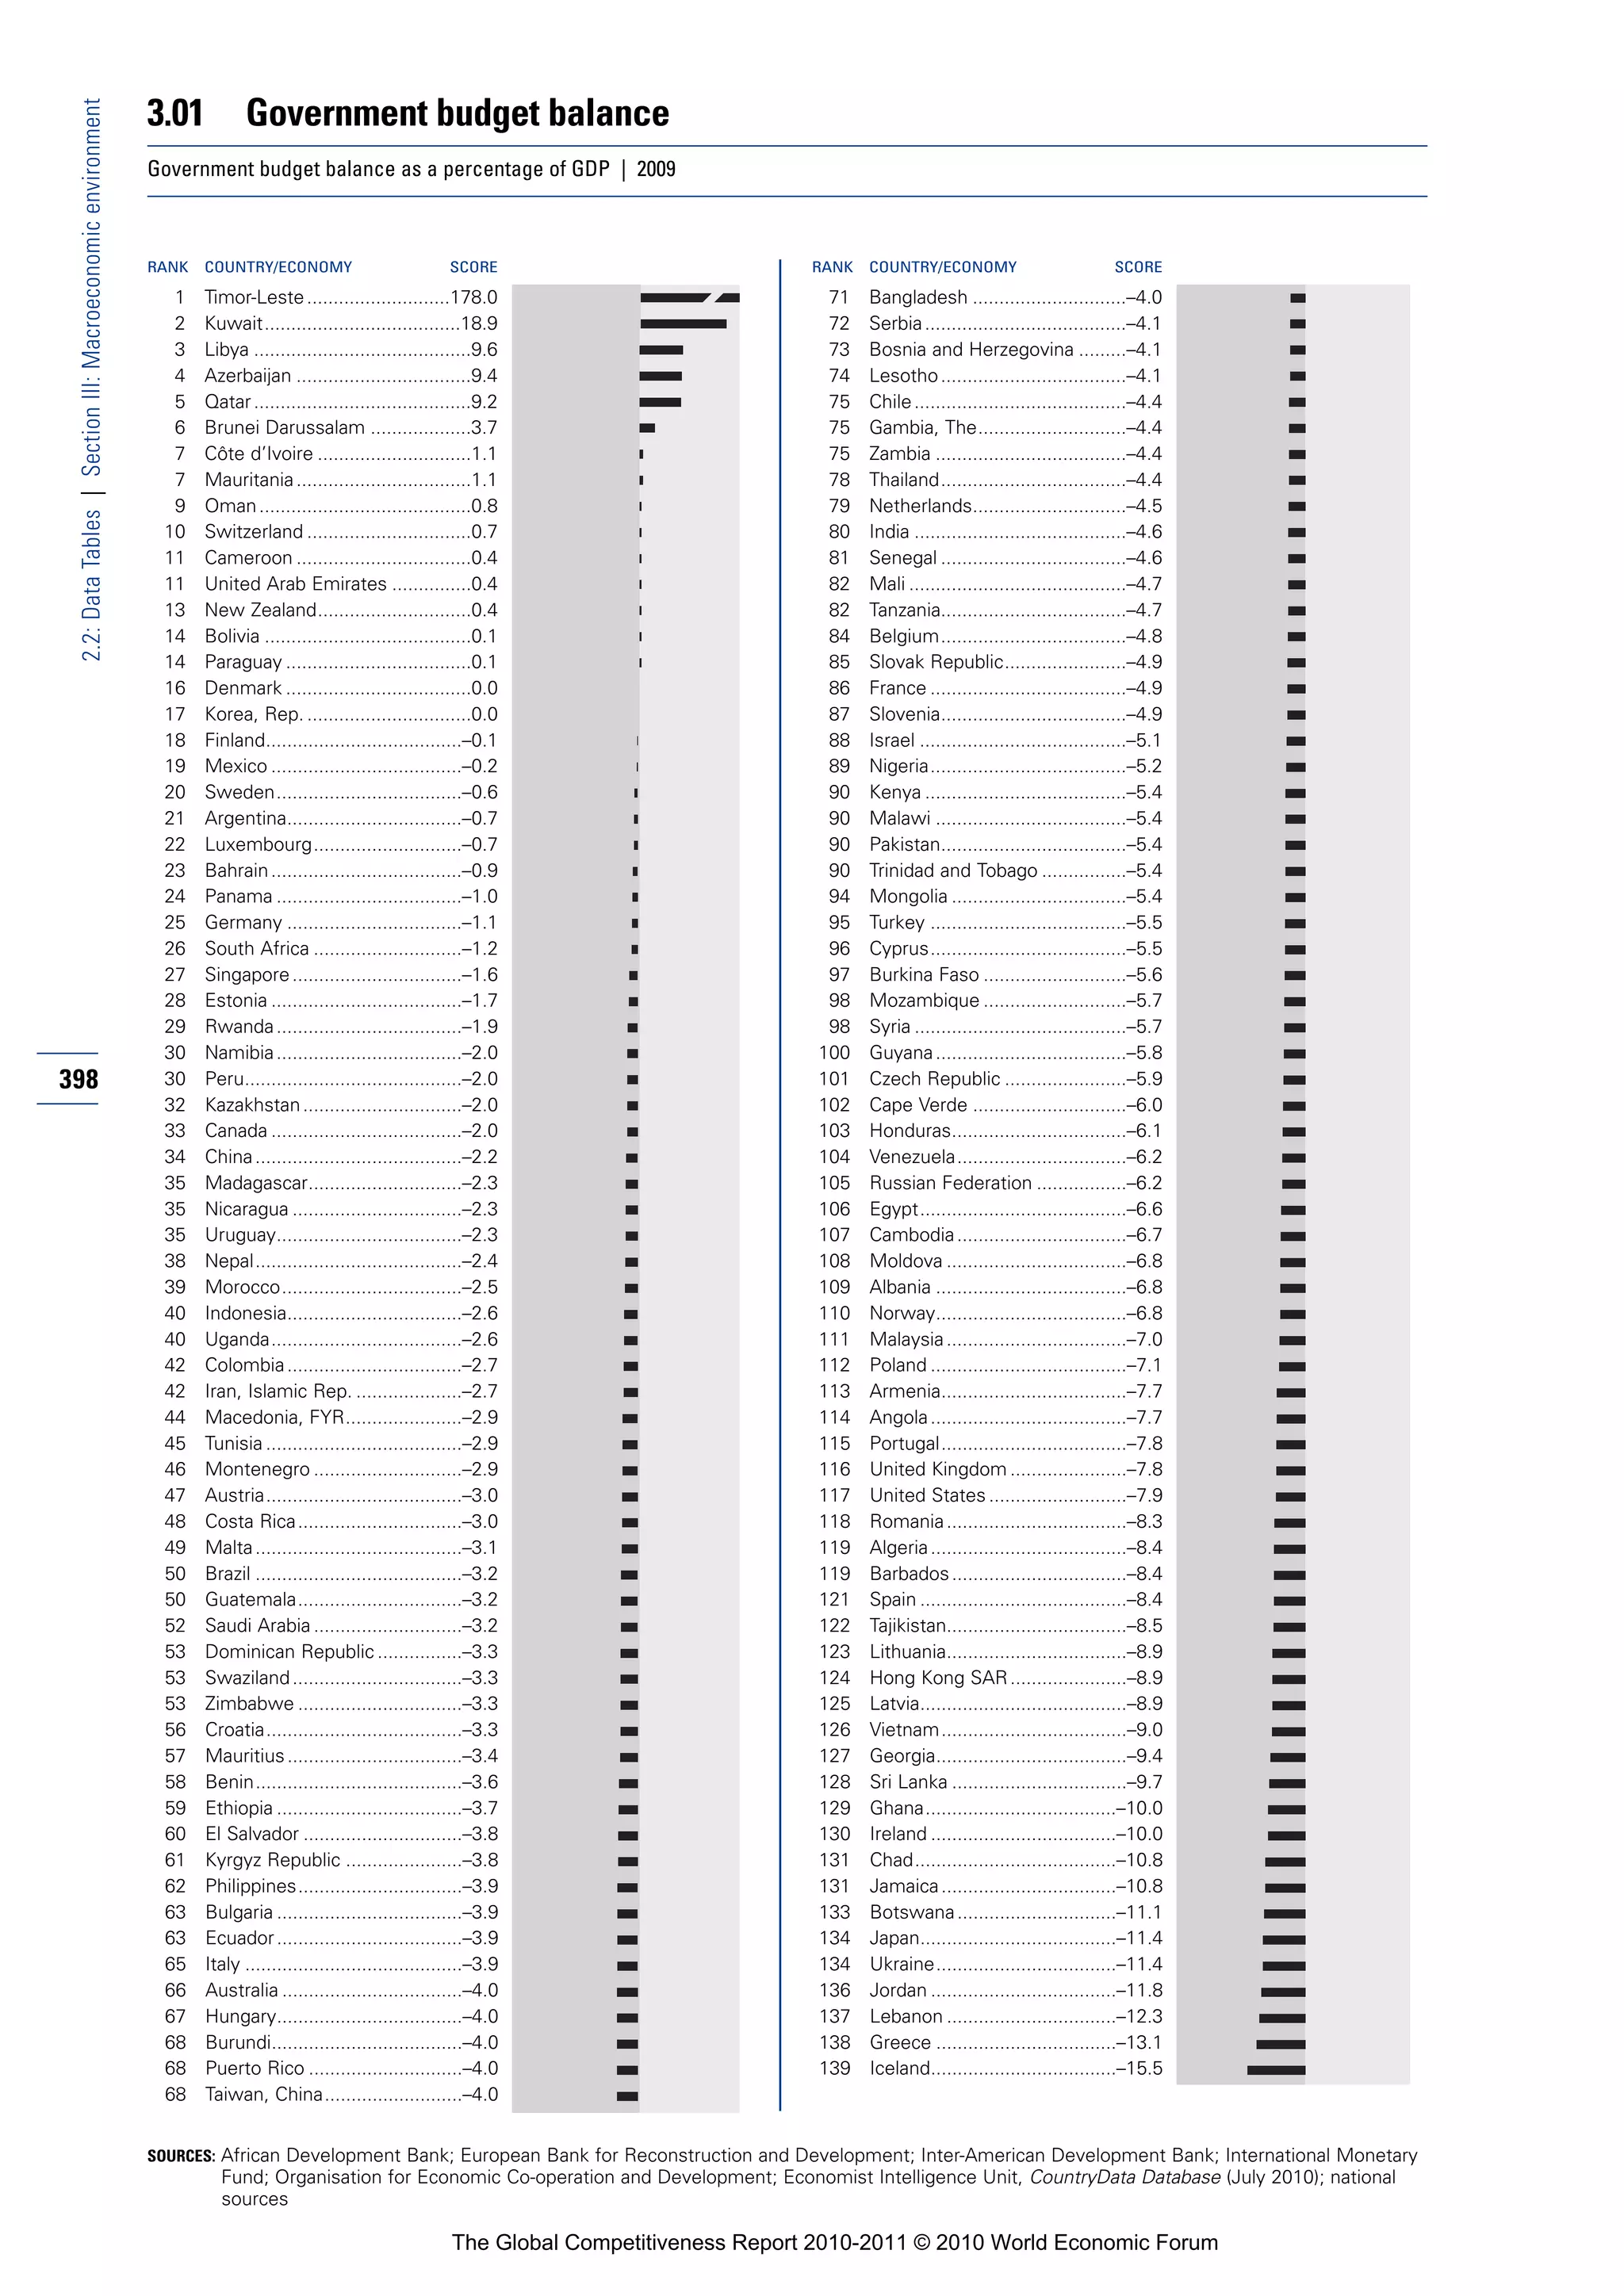
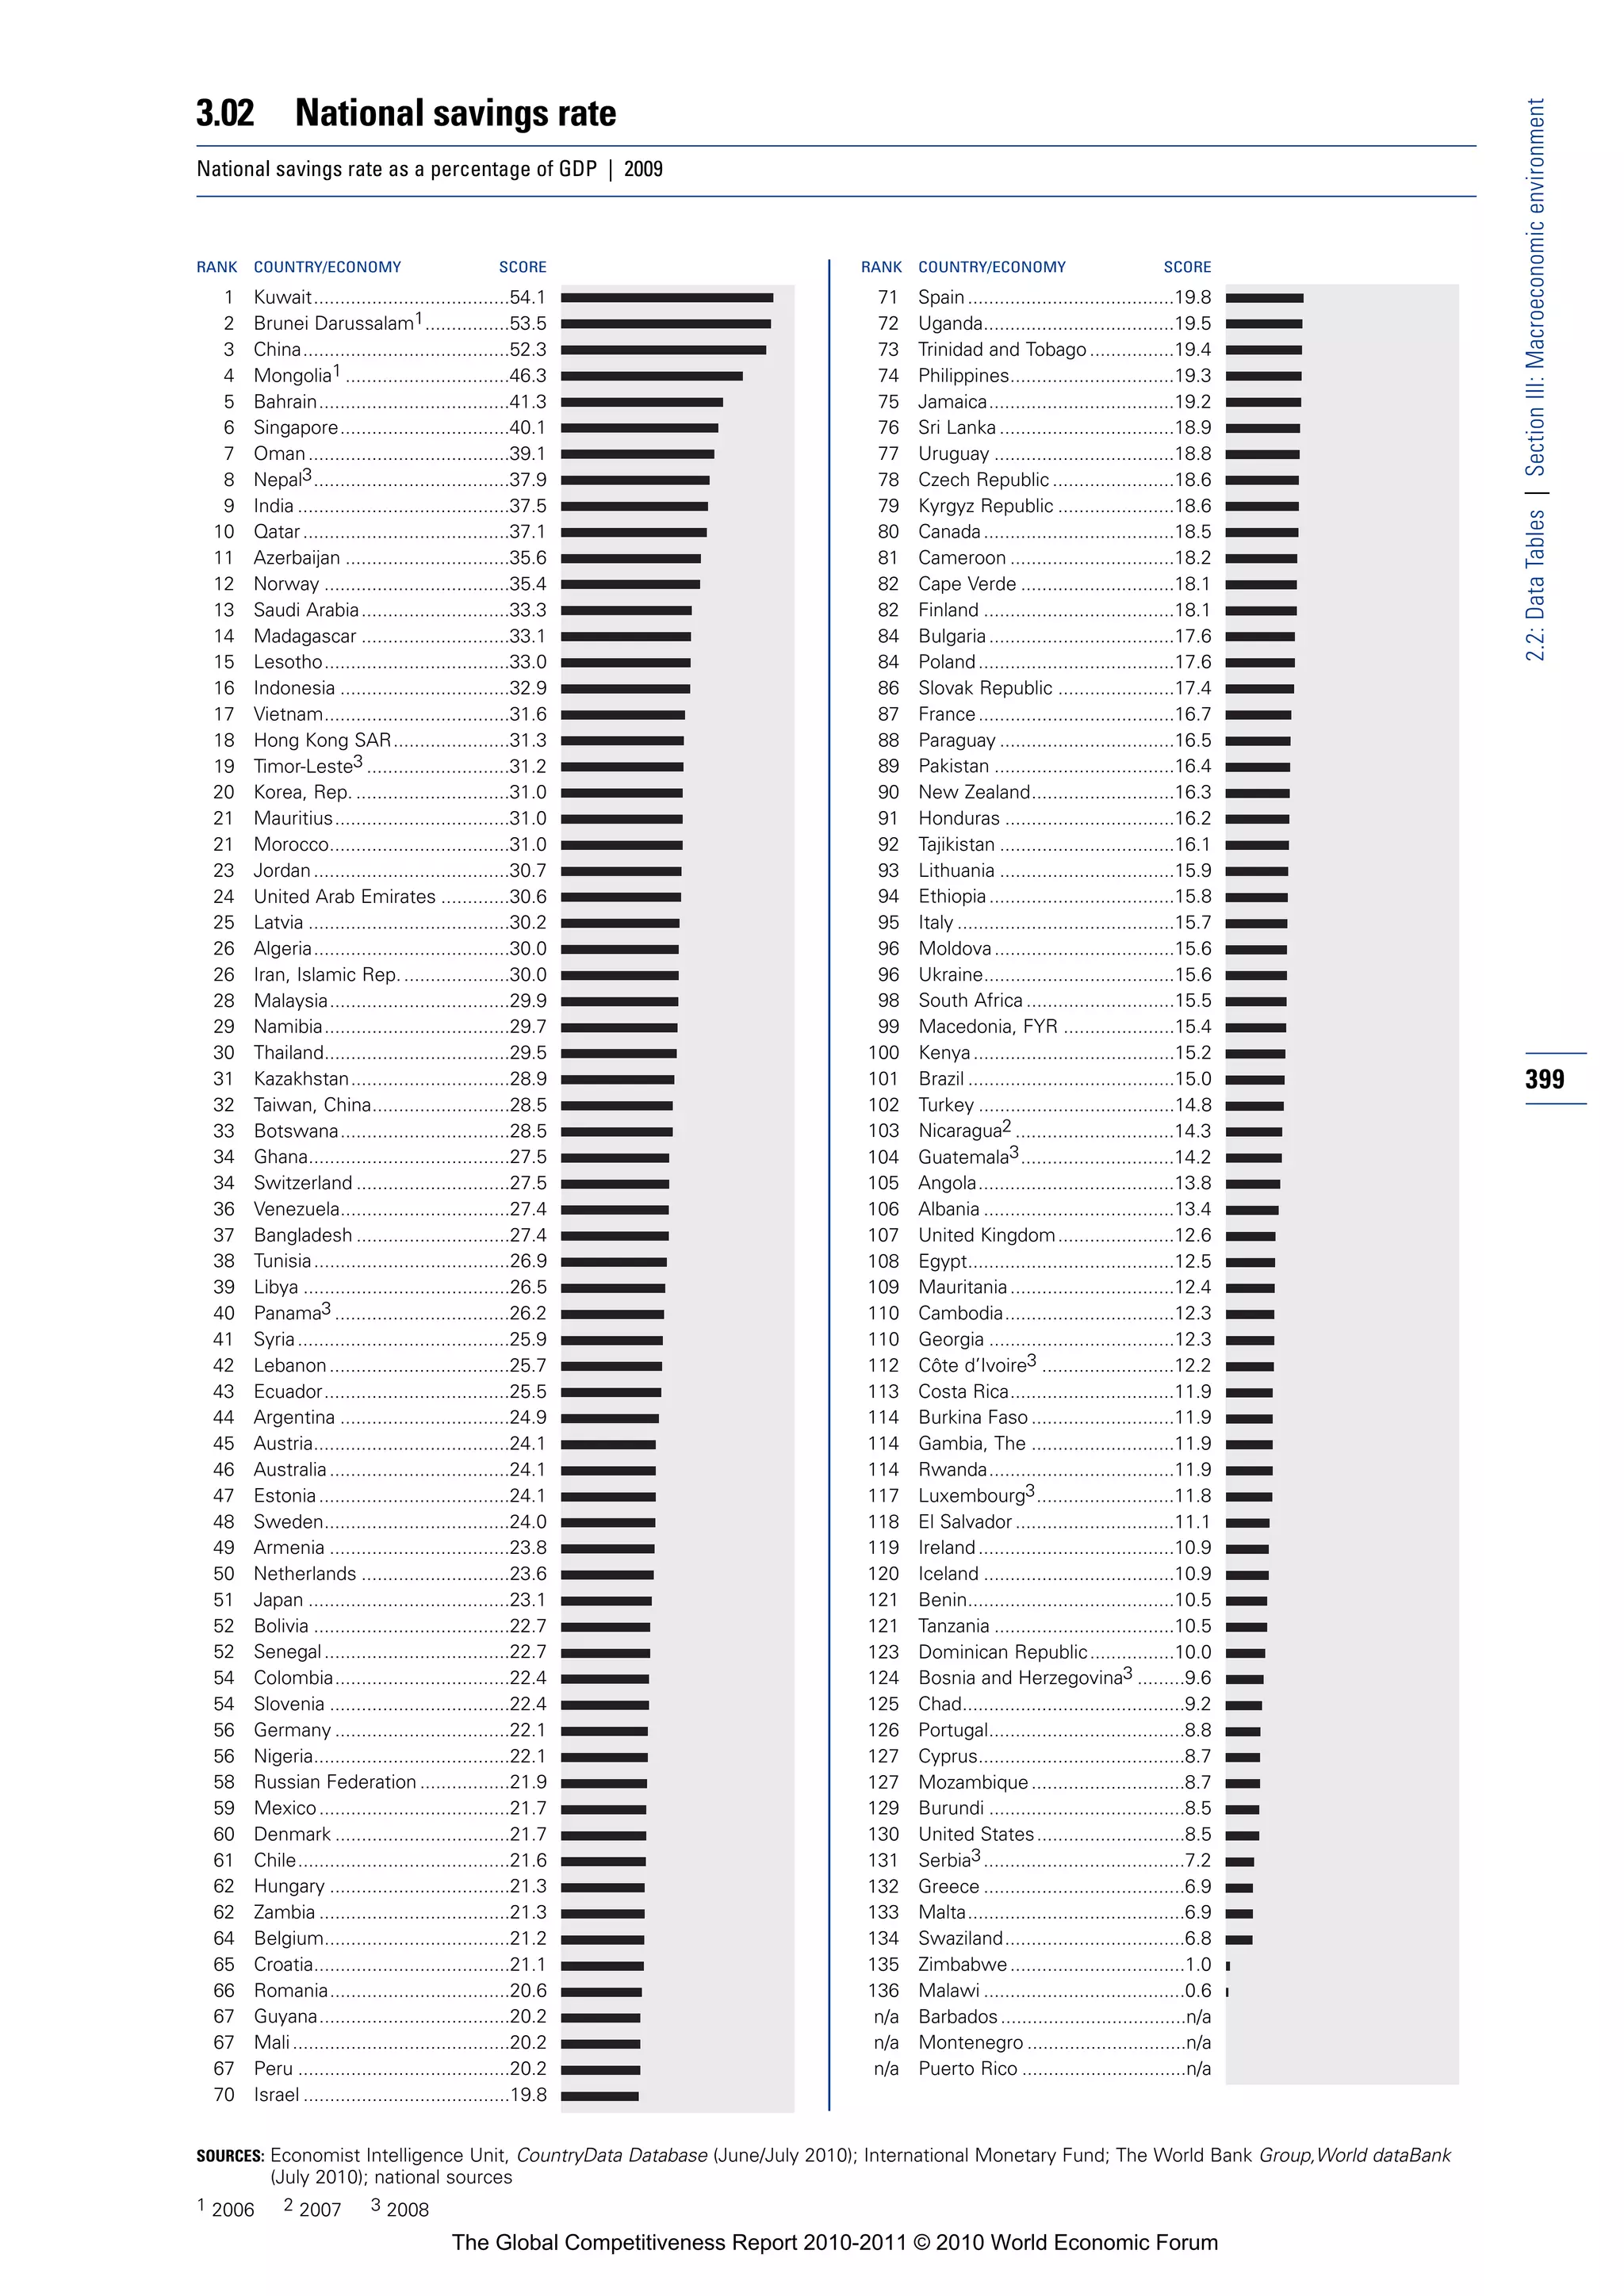
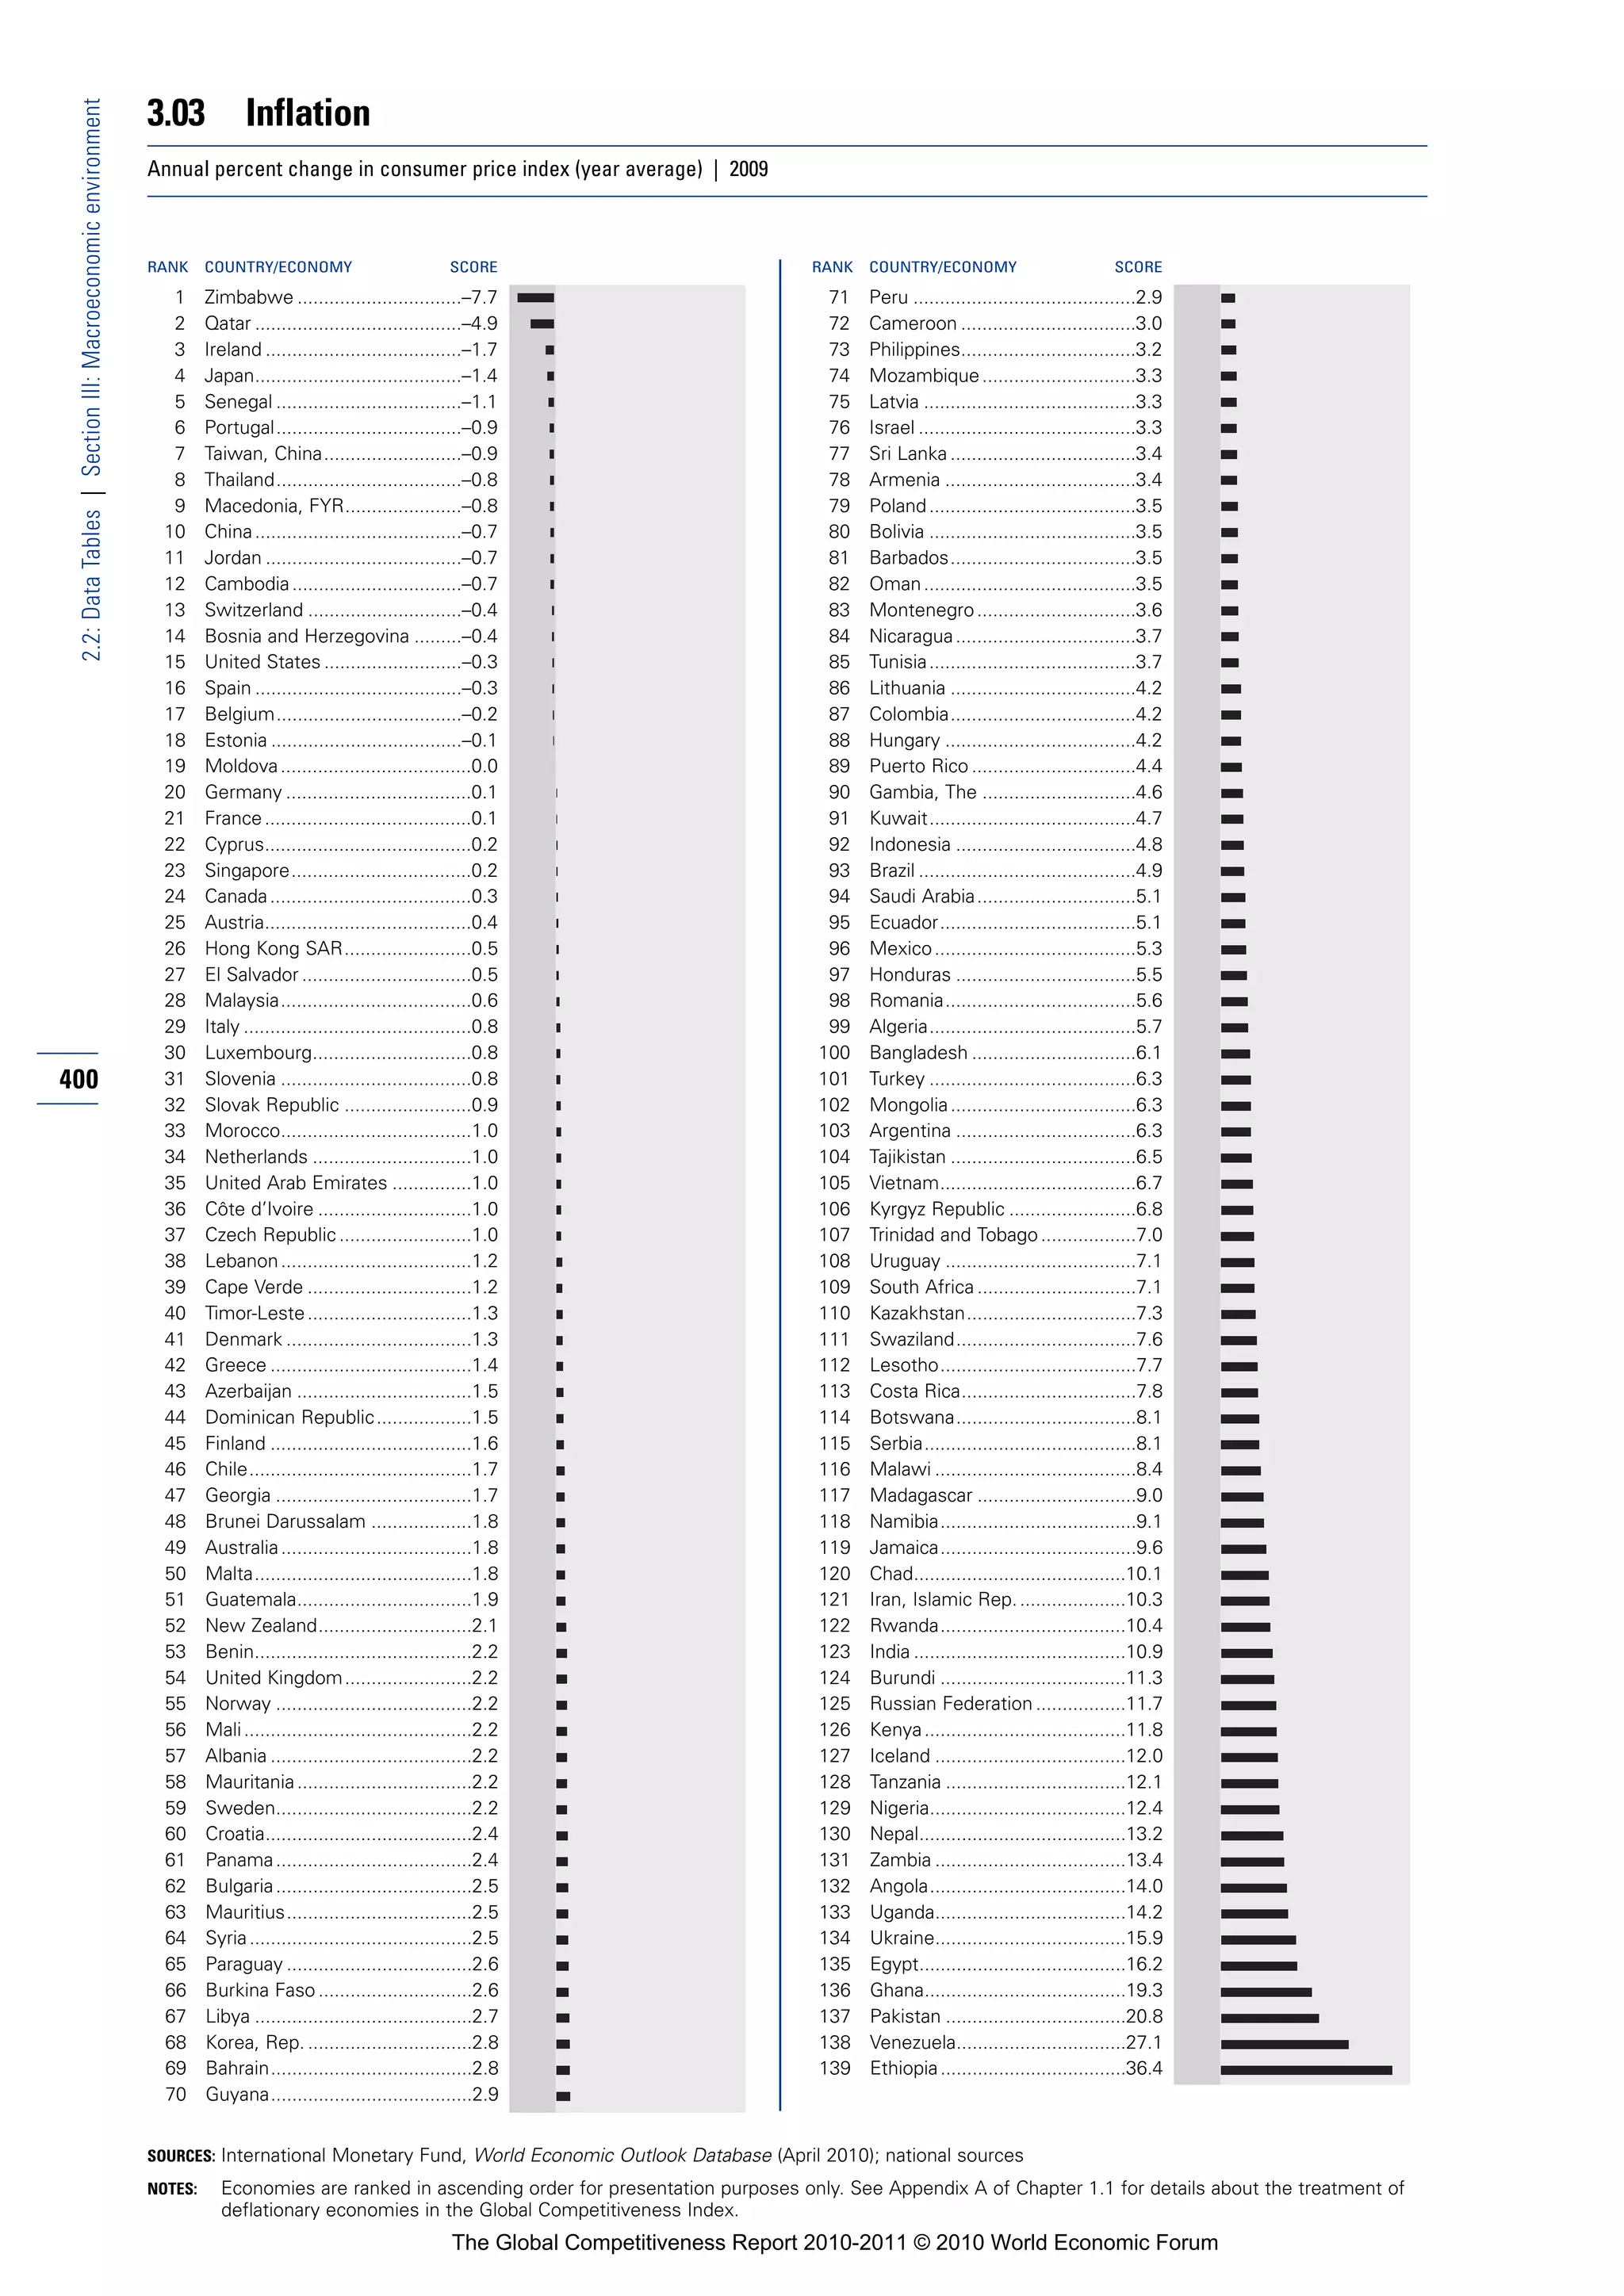
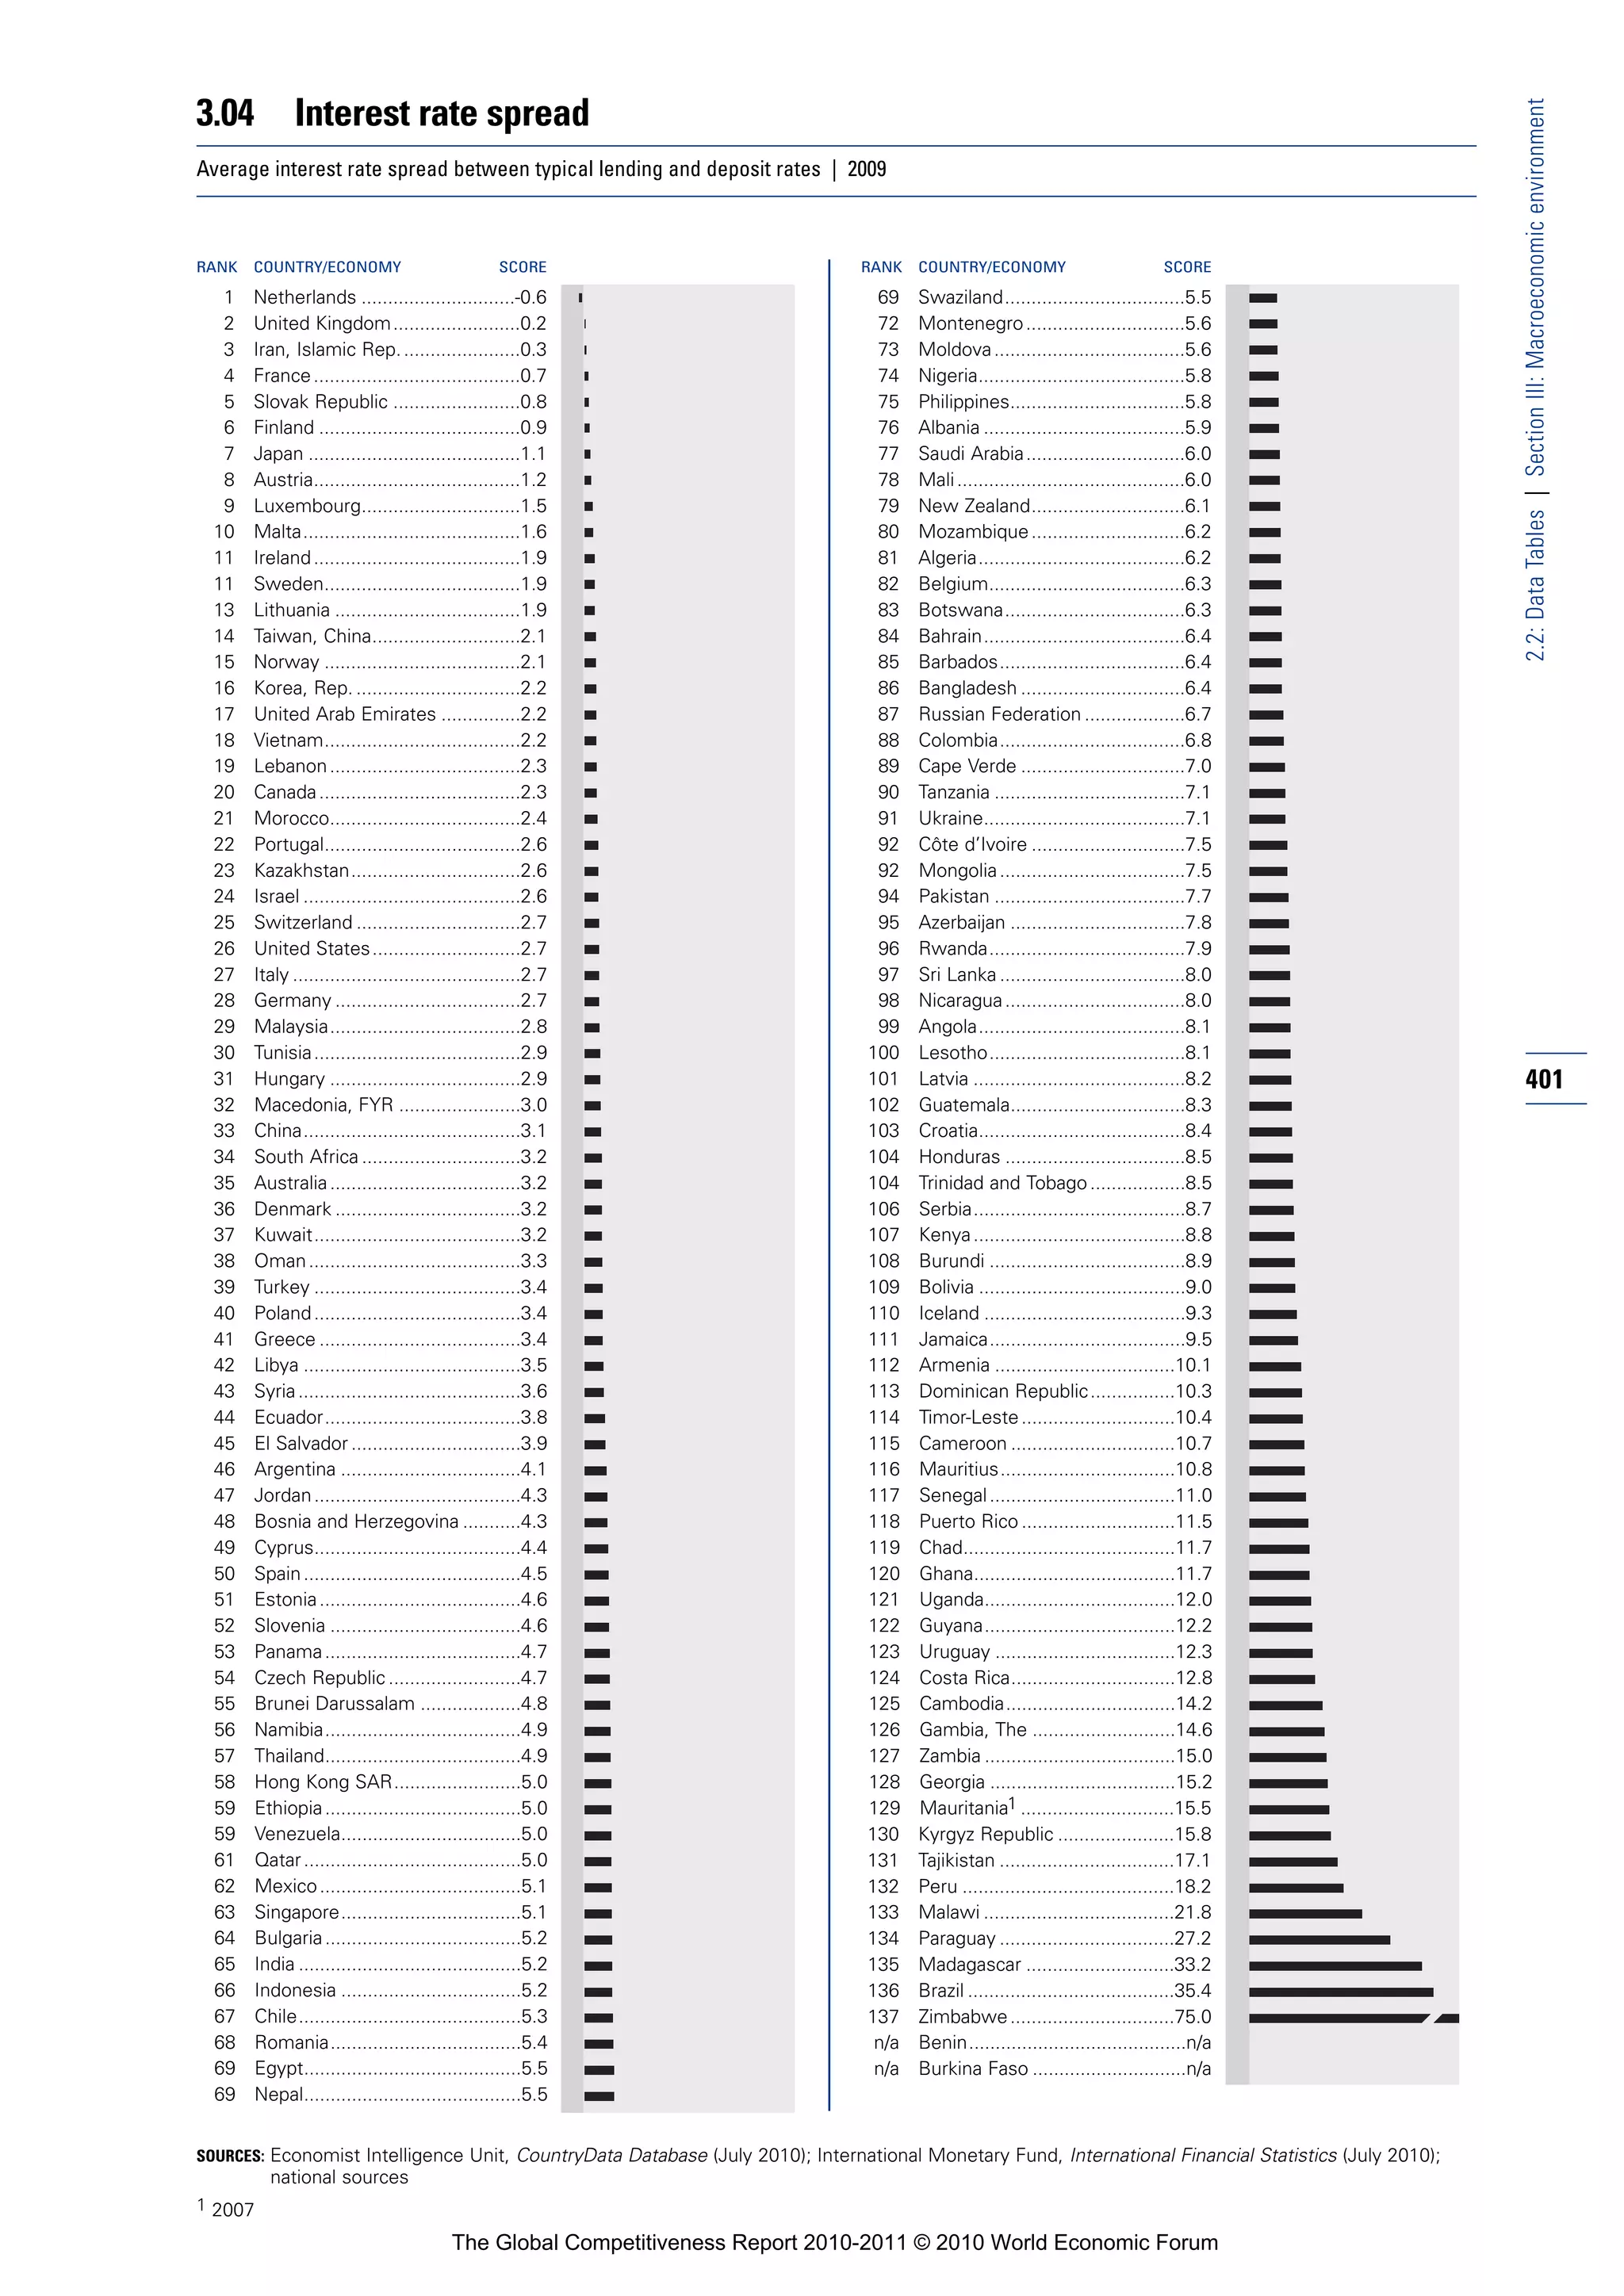
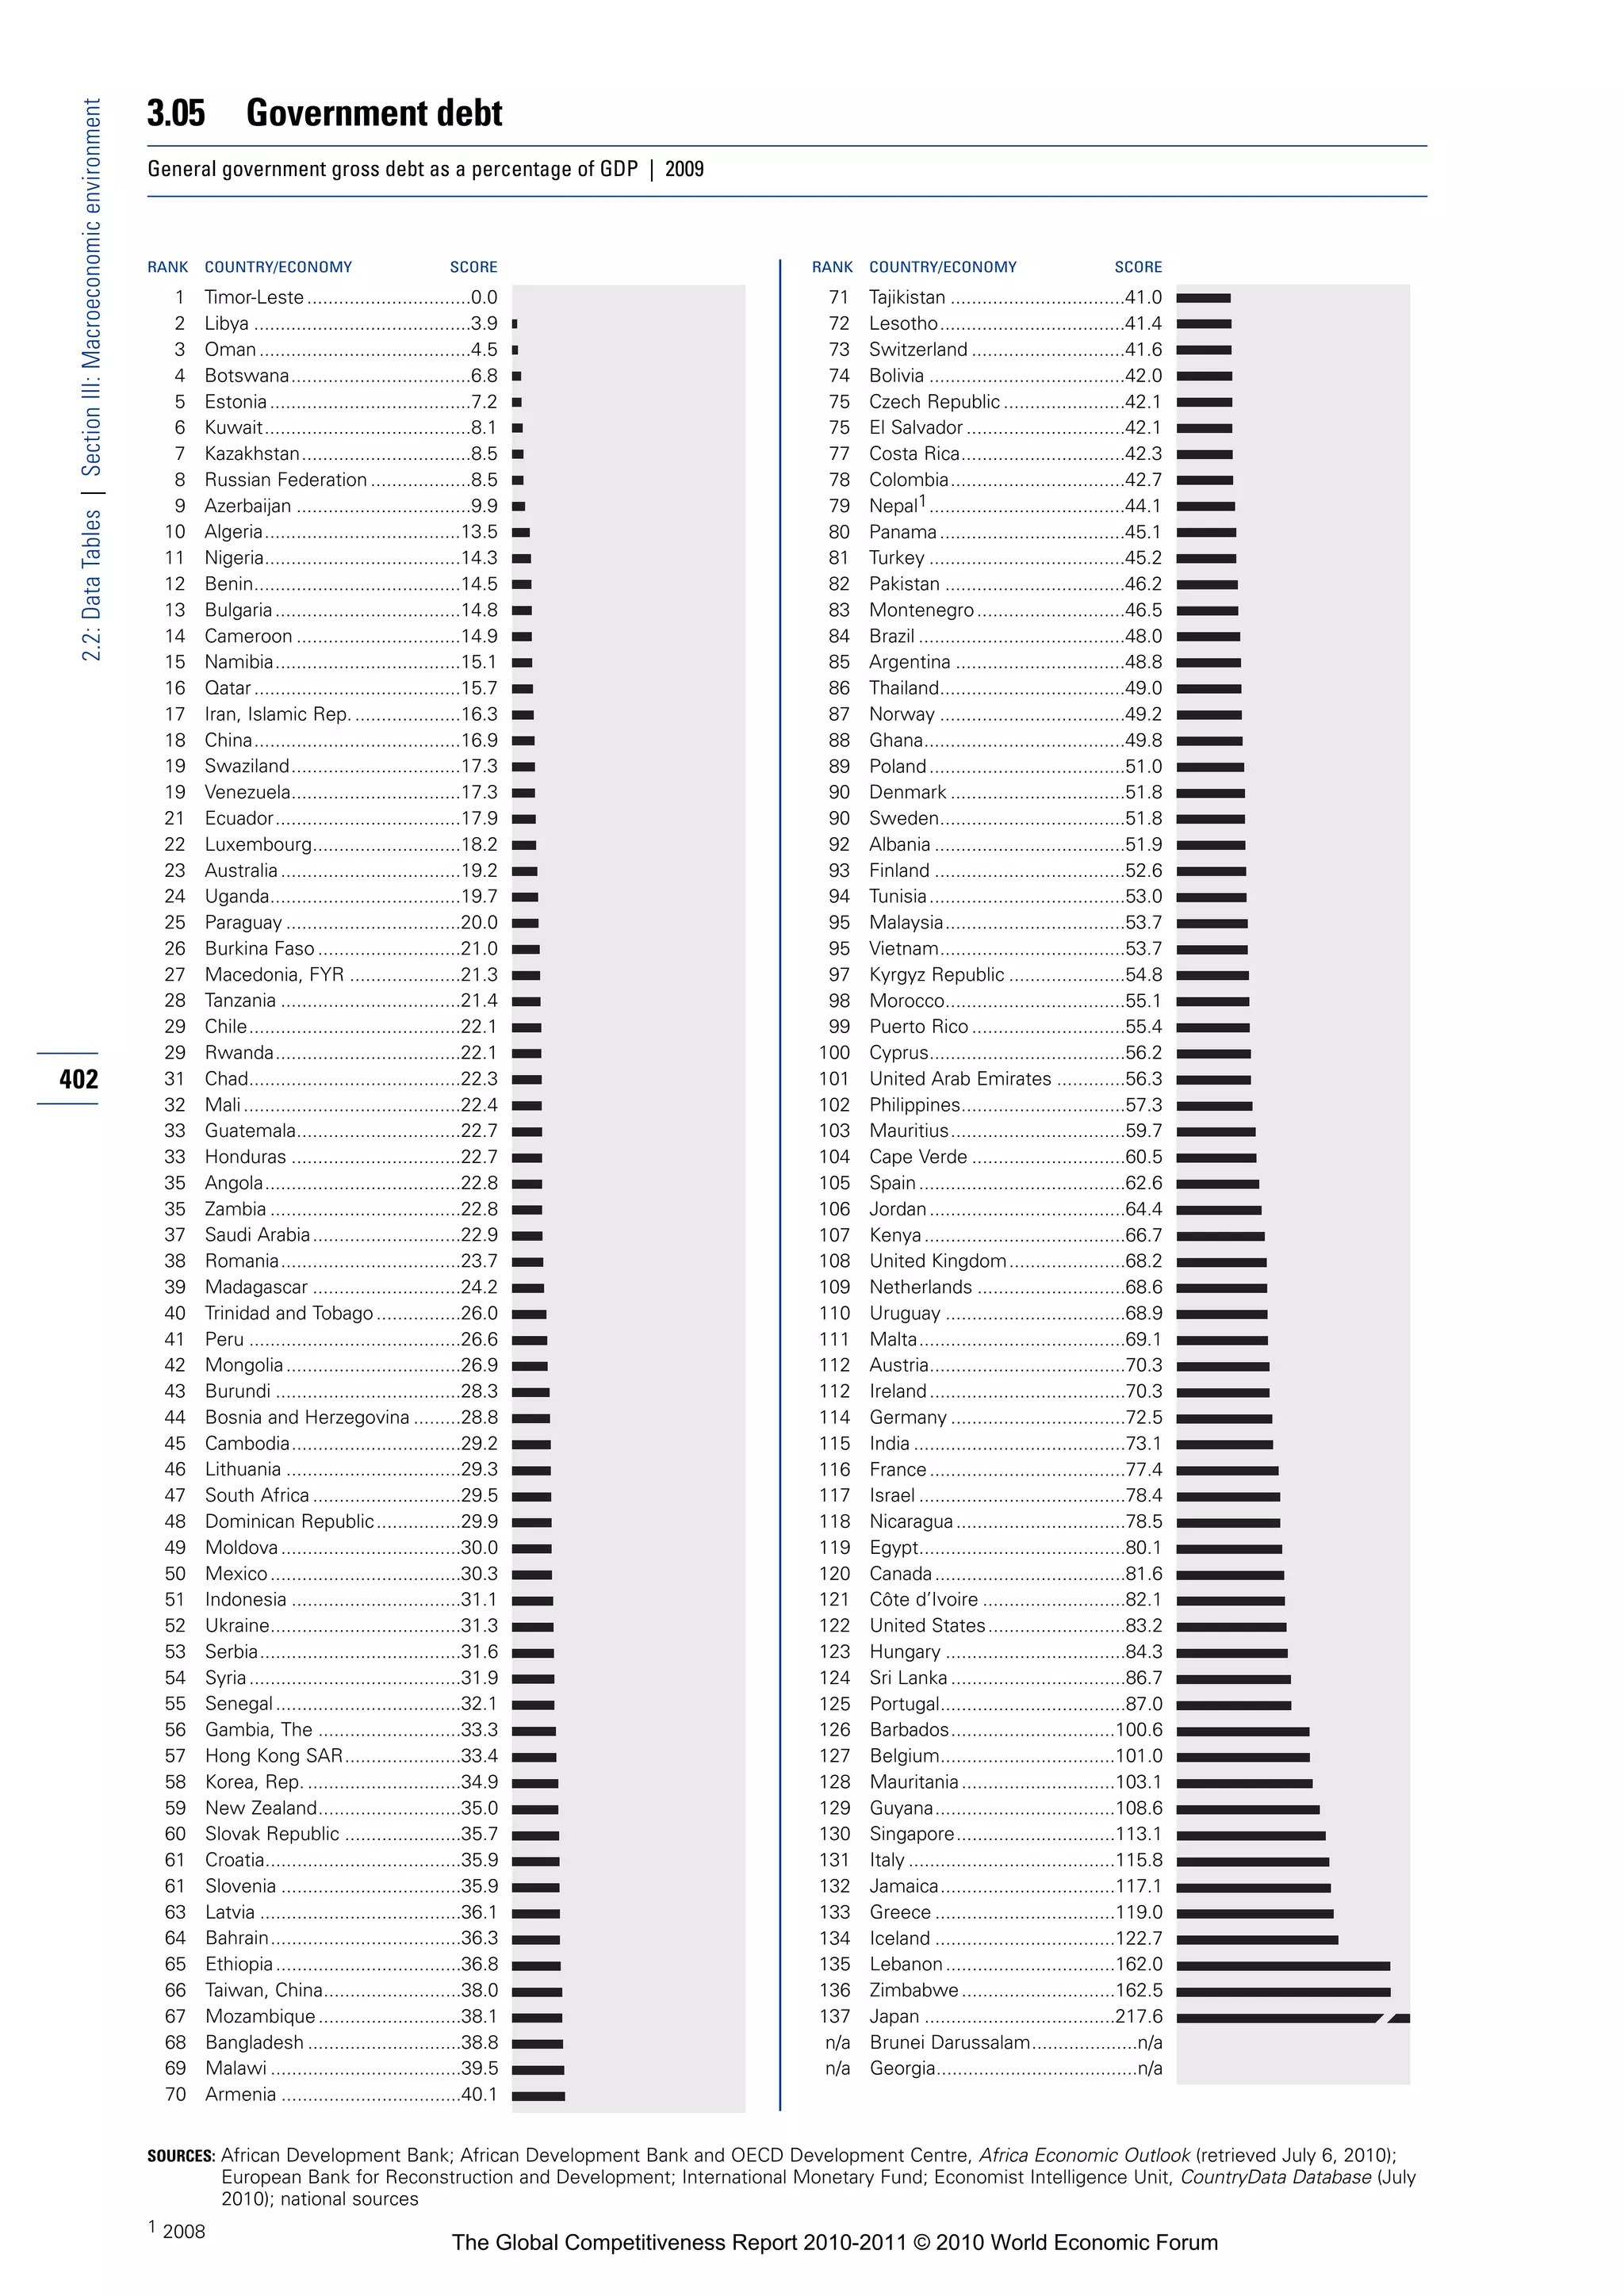
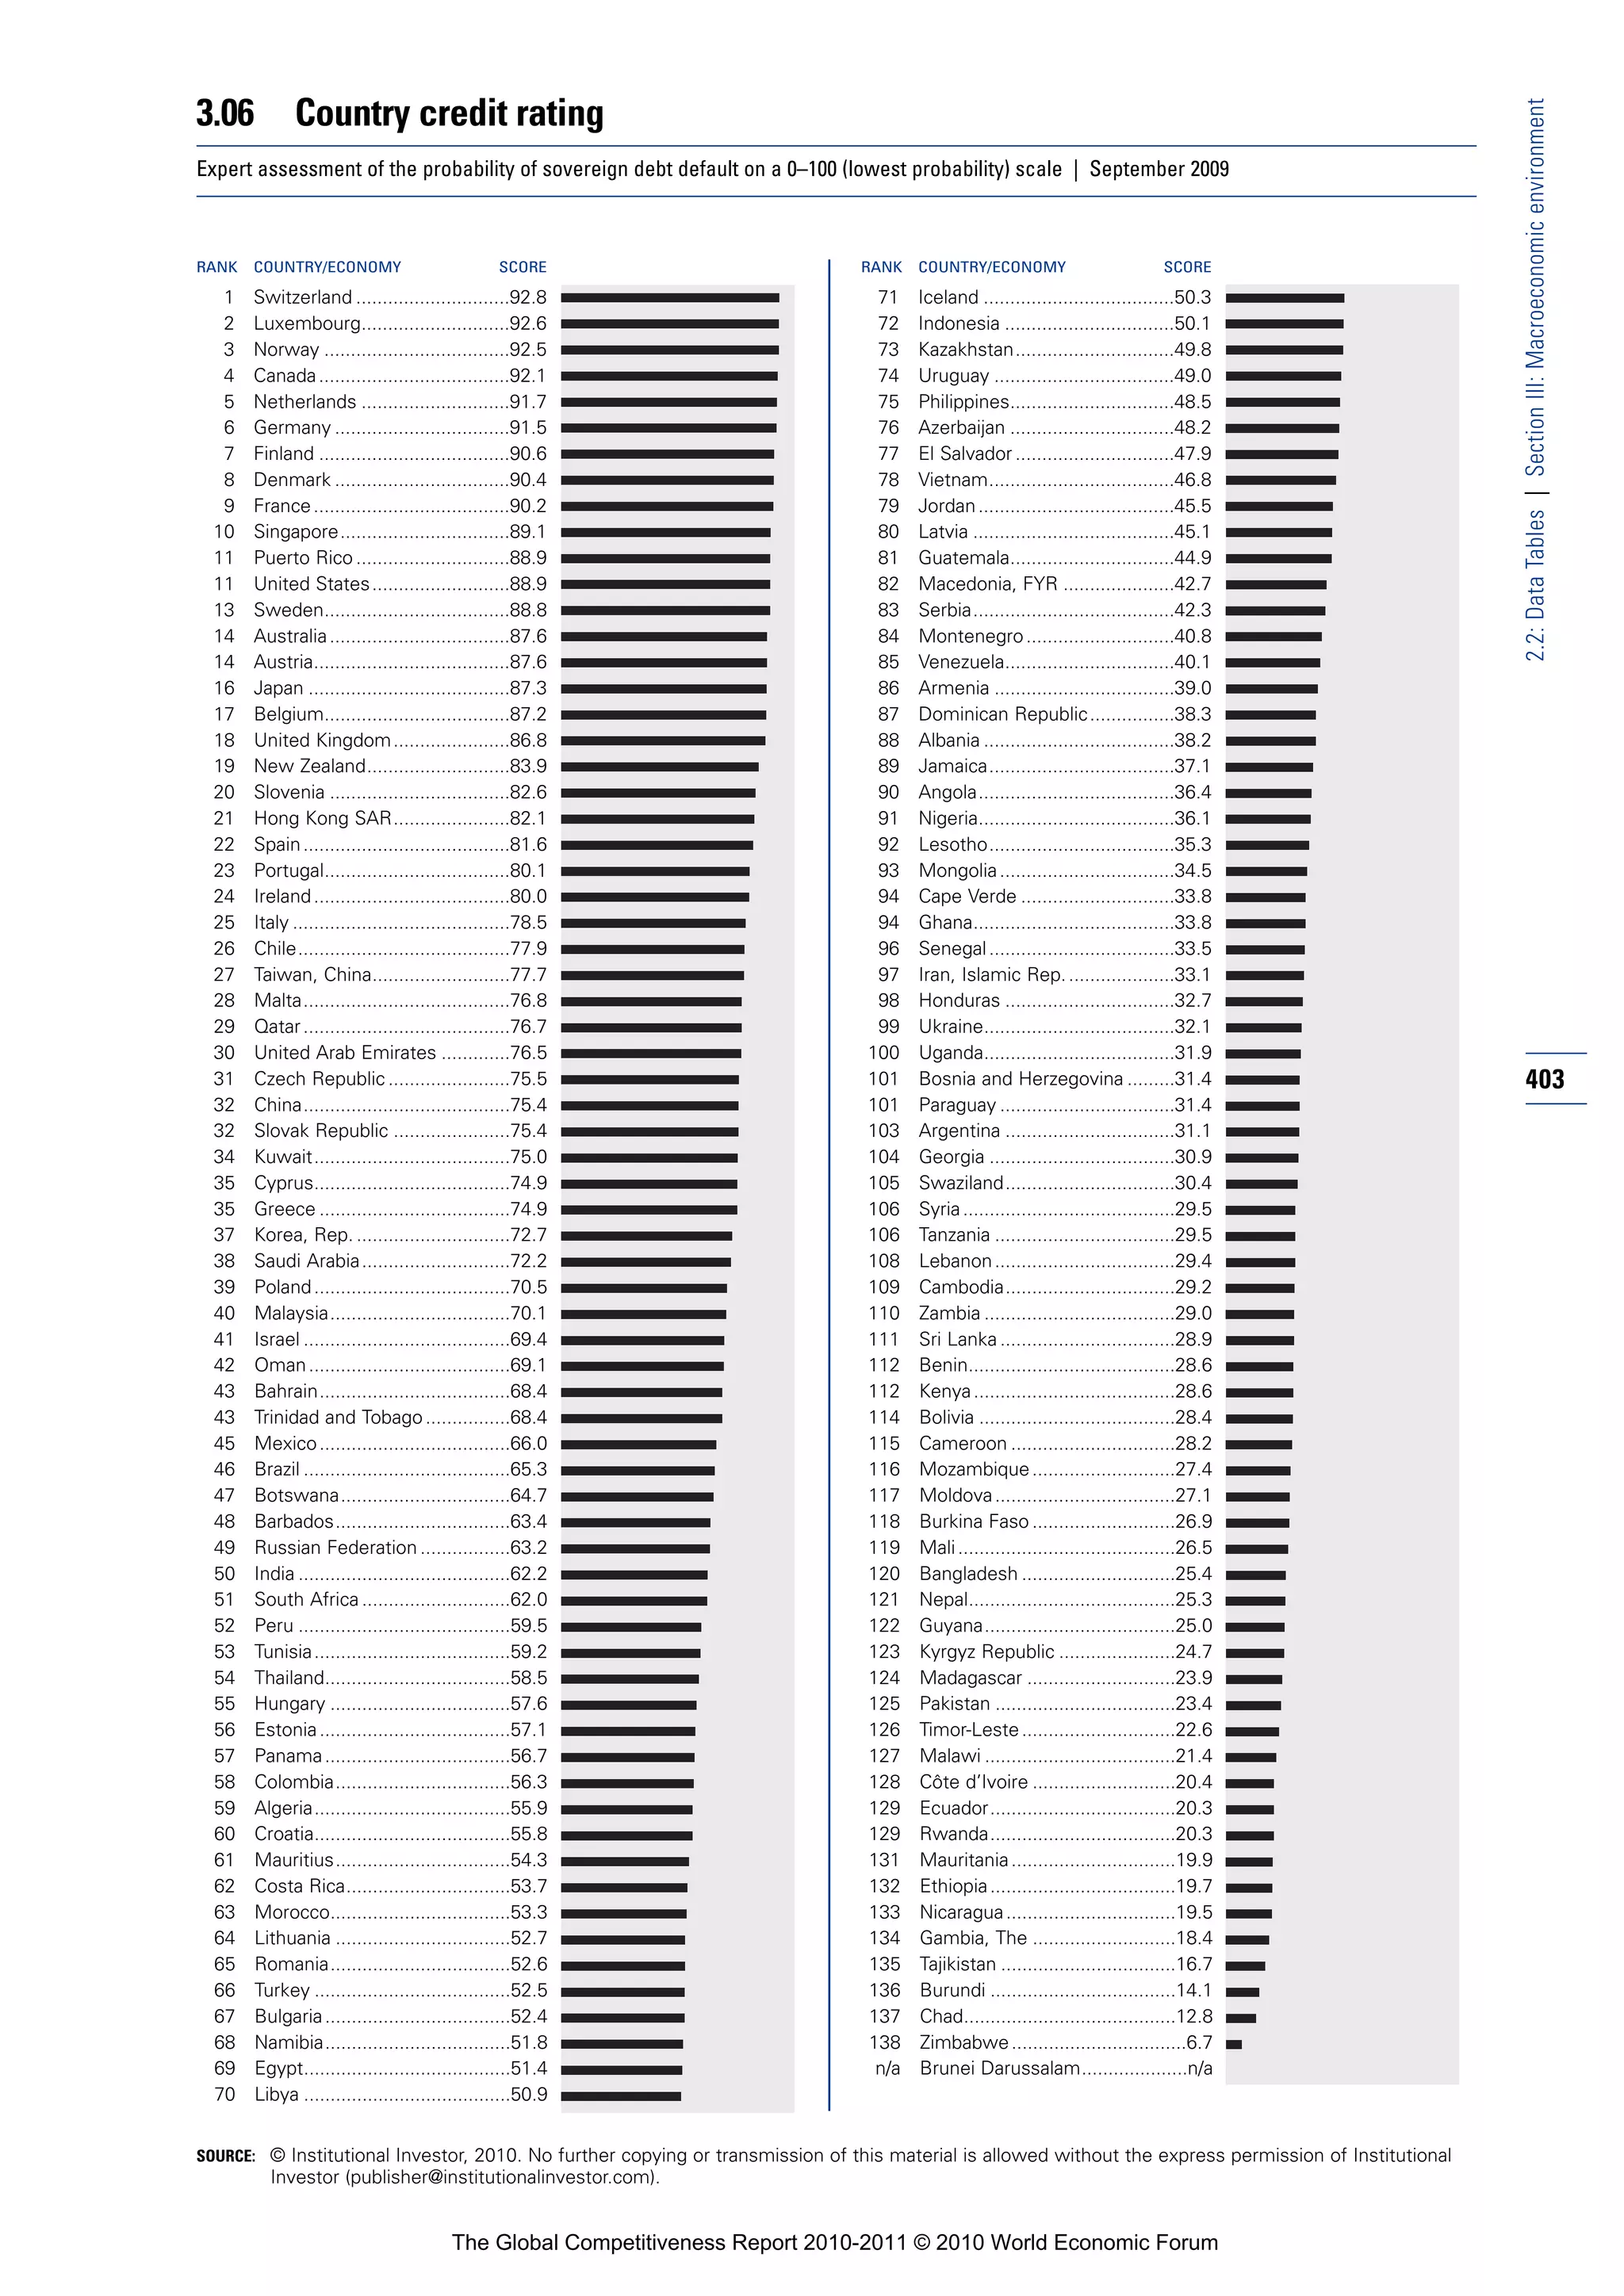

![4.01 Business impact of malaria
2.2: Data Tables | Section IV: Health and primary education
How serious an impact do you consider malaria will have on your company in the next five years (e.g., death, disability, medical and funeral
expenses, productivity and absenteeism, recruitment and training expenses, revenues)? [1 = a serious impact; 7 = no impact at all] | 2009–10
weighted average
RANK COUNTRY/ECONOMY SCORE 1 MEAN: 4.7 7 RANK COUNTRY/ECONOMY SCORE 1 MEAN: 4.7 7
1 Albania .............................n/appl. 1 Uruguay ...........................n/appl.
1 Algeria ..............................n/appl. 72 Turkey ....................................6.7
1 Armenia ...........................n/appl. 73 Costa Rica .............................6.6
1 Australia ...........................n/appl. 74 Mexico...................................6.4
1 Austria..............................n/appl. 75 Saudi Arabia...........................6.3
1 Bahrain .............................n/appl. 76 Korea, Rep.............................6.3
1 Barbados..........................n/appl. 77 Argentina ...............................6.3
1 Belgium............................n/appl. 78 Hong Kong SAR ....................6.2
1 Bosnia and Herzegovina ..n/appl. 79 Georgia ..................................6.2
1 Brunei Darussalam...........n/appl. 80 El Salvador.............................6.1
1 Bulgaria ............................n/appl. 81 Brazil ......................................6.1
1 Canada .............................n/appl. 82 Panama..................................6.0
1 Chile.................................n/appl. 83 Peru .......................................6.0
1 Croatia..............................n/appl. 84 Jamaica .................................5.9
1 Cyprus..............................n/appl. 85 Guatemala .............................5.9
1 Czech Republic ................n/appl. 86 Iran, Islamic Rep....................5.8
1 Denmark ..........................n/appl. 87 Sri Lanka................................5.7
1 Egypt................................n/appl. 88 Thailand .................................5.7
1 Estonia .............................n/appl. 89 Honduras ...............................5.7
1 Finland .............................n/appl. 90 China .....................................5.7
1 France ..............................n/appl. 91 Dominican Republic...............5.7
1 Germany ..........................n/appl. 92 Vietnam .................................5.5
1 Greece .............................n/appl. 93 Venezuela ..............................5.5
1 Hungary ...........................n/appl. 94 Paraguay................................5.4
1 Iceland .............................n/appl. 95 Ecuador .................................5.4
1 Ireland ..............................n/appl. 96 Colombia ...............................5.4
1 Israel ................................n/appl. 97 Kyrgyz Republic .....................5.3
1 Italy ..................................n/appl. 98 Malaysia ................................5.3
1 Japan ...............................n/appl. 99 Azerbaijan ..............................5.2
406 1 Jordan ..............................n/appl. 100 Cape Verde ............................5.1
1 Kazakhstan .......................n/appl. 101 Philippines .............................5.1
1 Kuwait ..............................n/appl. 102 India.......................................5.1
1 Latvia ...............................n/appl. 103 Bangladesh............................5.0
1 Lebanon ...........................n/appl. 104 Bolivia ....................................5.0
1 Lesotho............................n/appl. 105 South Africa...........................4.9
1 Libya ................................n/appl. 106 Indonesia ...............................4.8
1 Lithuania ..........................n/appl. 107 Botswana ..............................4.8
1 Luxembourg.....................n/appl. 108 Nicaragua...............................4.7
1 Macedonia, FYR...............n/appl. 109 Nepal .....................................4.7
1 Malta ................................n/appl. 110 Tajikistan ................................4.6
1 Mauritius ..........................n/appl. 111 Pakistan .................................4.4
1 Moldova ...........................n/appl. 112 Swaziland ..............................4.4
1 Mongolia ..........................n/appl. 113 Cambodia ..............................4.4
1 Montenegro .....................n/appl. 114 Zimbabwe..............................4.4
1 Morocco...........................n/appl. 115 Namibia .................................4.2
1 Netherlands .....................n/appl. 116 Gambia, The ..........................4.1
1 New Zealand....................n/appl. 117 Ethiopia..................................4.1
1 Norway ............................n/appl. 118 Guyana ..................................4.1
1 Oman ...............................n/appl. 119 Kenya.....................................3.9
1 Poland ..............................n/appl. 120 Benin .....................................3.7
1 Portugal............................n/appl. 121 Madagascar ...........................3.5
1 Puerto Rico ......................n/appl. 122 Senegal..................................3.5
1 Qatar ................................n/appl. 123 Rwanda .................................3.5
1 Romania...........................n/appl. 124 Mauritania..............................3.5
1 Russian Federation ..........n/appl. 125 Burundi ..................................3.3
1 Serbia ...............................n/appl. 126 Ghana ....................................3.3
1 Singapore.........................n/appl. 127 Burkina Faso..........................3.3
1 Slovak Republic................n/appl. 128 Mozambique..........................3.2
1 Slovenia ...........................n/appl. 129 Cameroon..............................3.2
1 Spain ................................n/appl. 130 Côte d’Ivoire ..........................3.1
1 Sweden............................n/appl. 131 Tanzania .................................3.0
1 Switzerland ......................n/appl. 132 Zambia...................................2.9
1 Syria .................................n/appl. 133 Malawi ...................................2.8
1 Taiwan, China...................n/appl. 134 Mali........................................2.7
1 Trinidad and Tobago .........n/appl. 135 Nigeria ...................................2.6
1 Tunisia ..............................n/appl. 136 Uganda ..................................2.6
1 Ukraine.............................n/appl. 137 Chad ......................................2.6
1 United Arab Emirates ......n/appl. 138 Timor-Leste............................2.5
1 United Kingdom ...............n/appl. 139 Angola ...................................2.1
1 United States ...................n/appl.
SOURCE: World Economic Forum, Executive Opinion Survey
The Global Competitiveness Report 2010-2011 © 2010 World Economic Forum](https://image.slidesharecdn.com/globalcompetitivenessreportwef2010-11-100928142139-phpapp02/75/Global-competitiveness-report-wef-2010-11-419-2048.jpg)
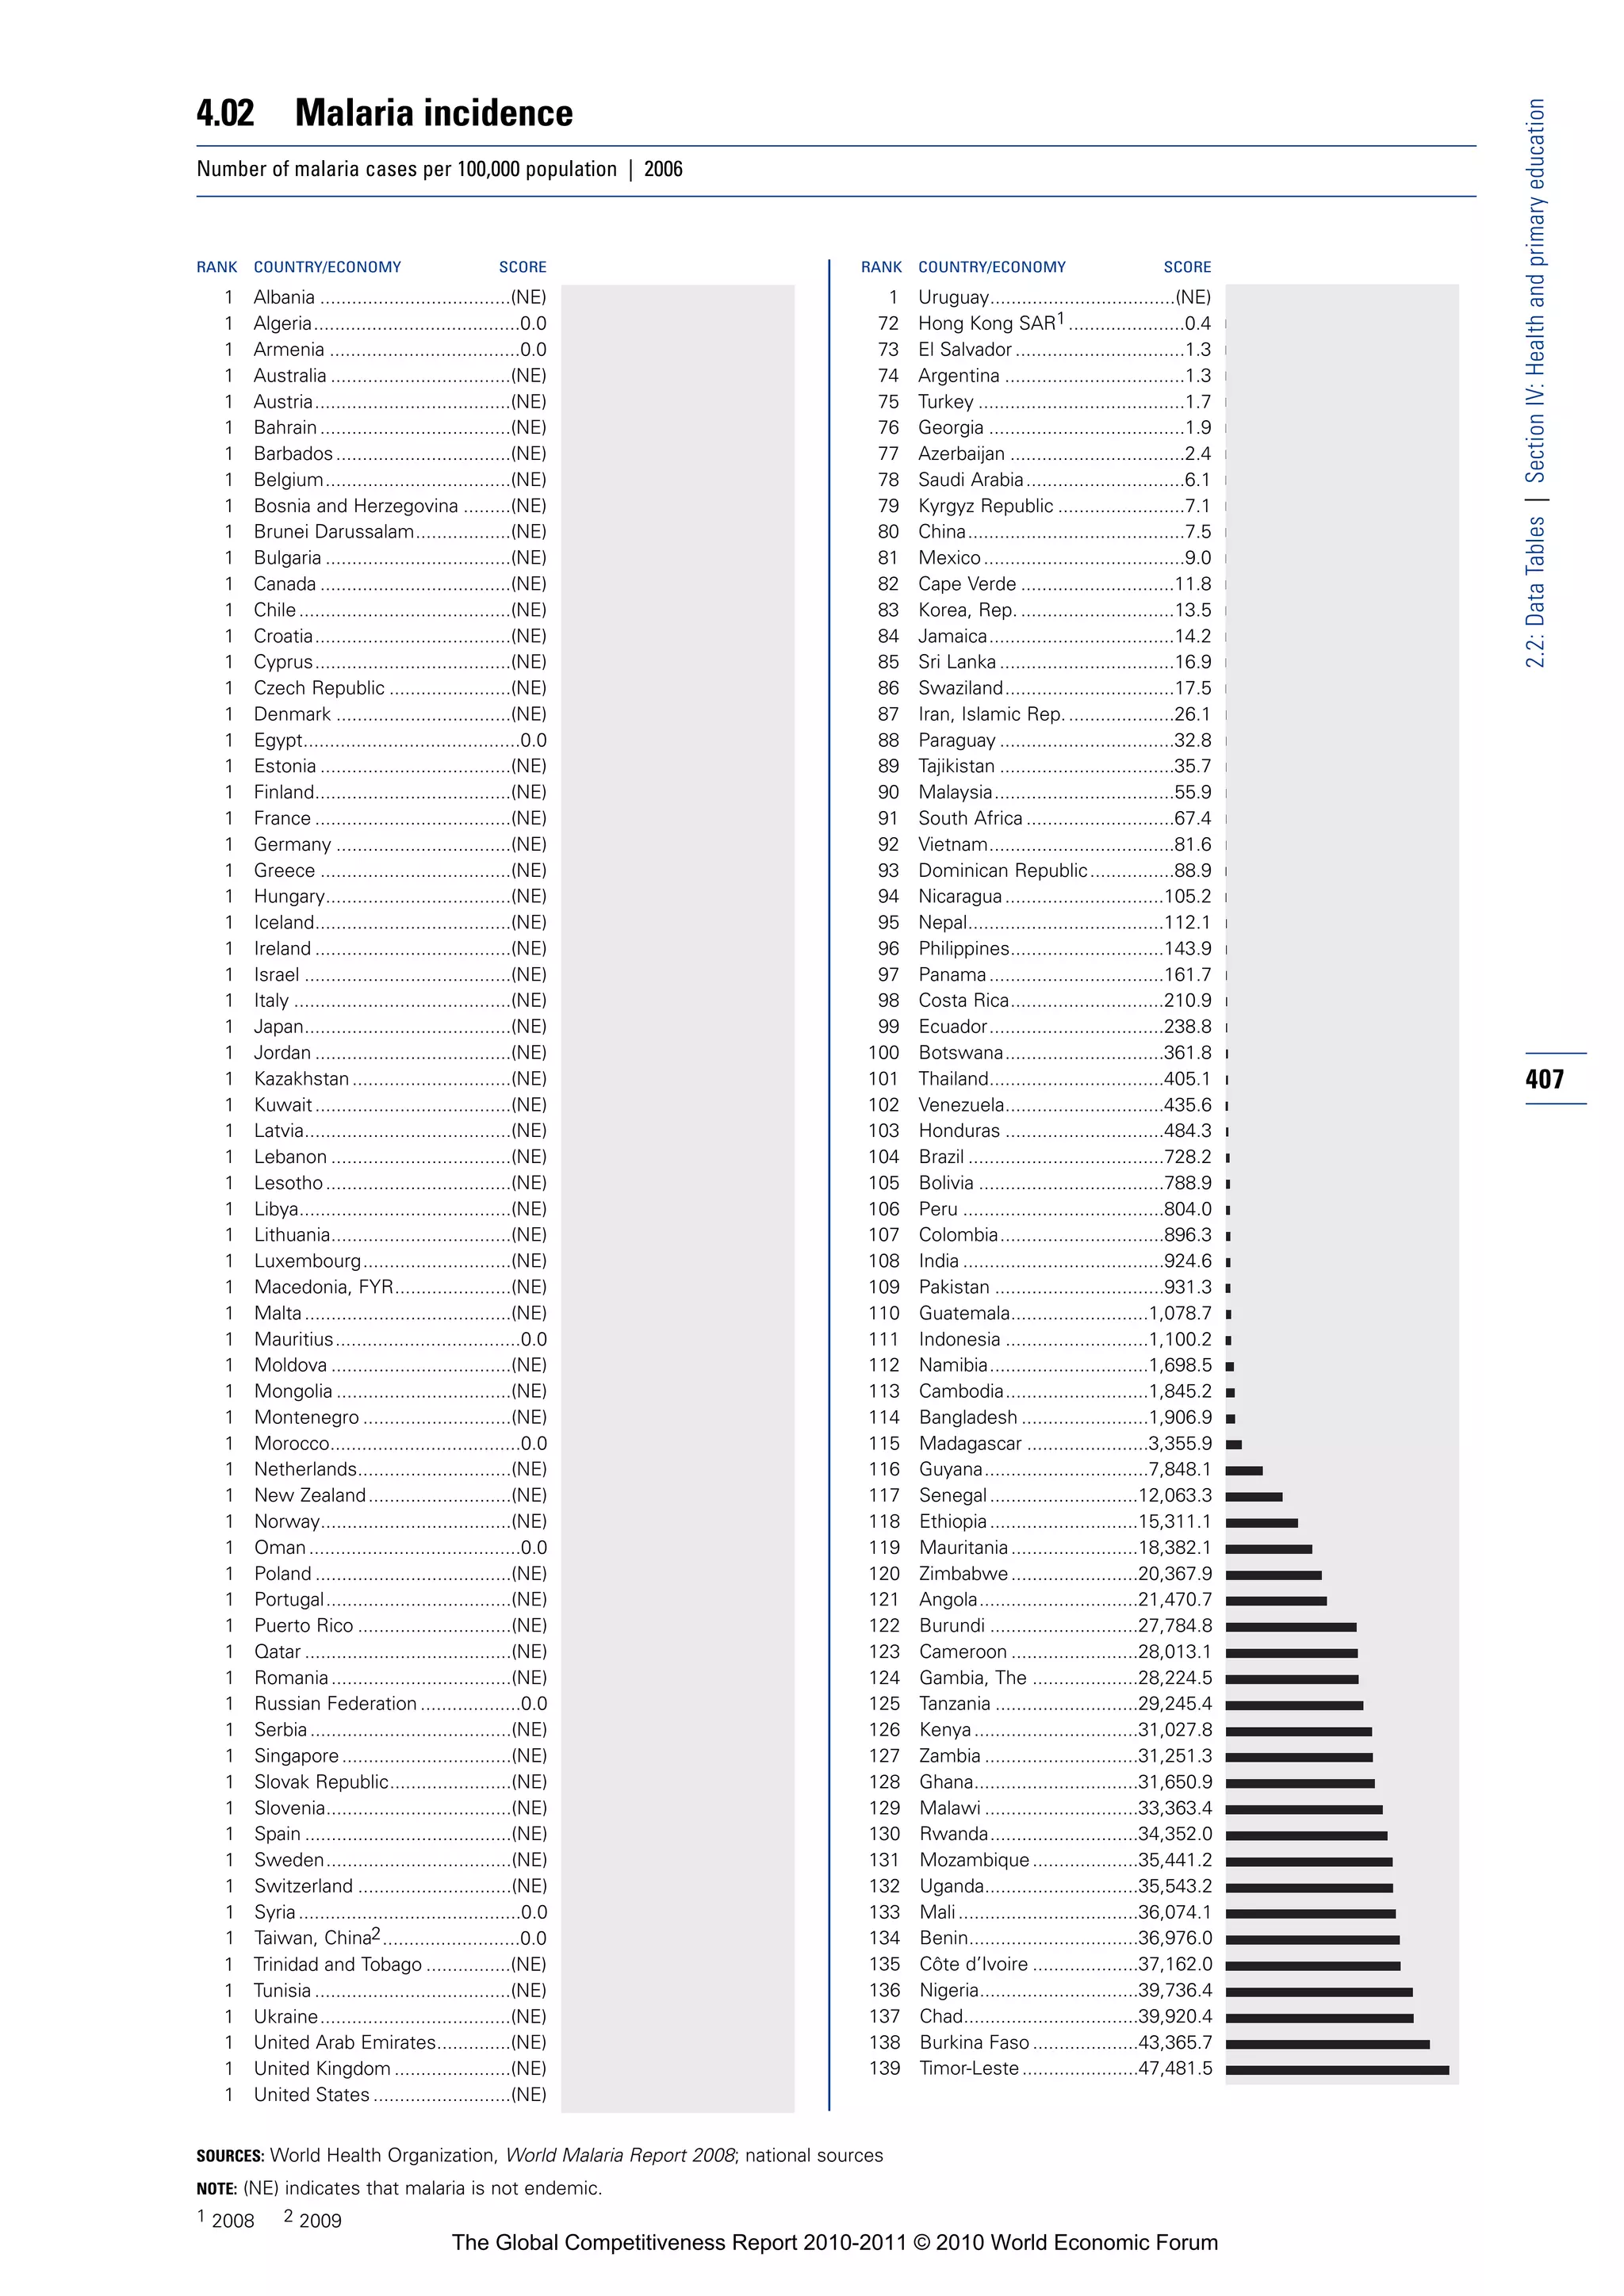
![4.03 Business impact of tuberculosis
2.2: Data Tables | Section IV: Health and primary education
How serious an impact do you consider tuberculosis will have on your company in the next five years (e.g., death, disability, medical and funeral
expenses, productivity and absenteeism, recruitment and training expenses, revenues)? [1 = a serious impact; 7 = no impact at all] | 2009–10
weighted average
RANK COUNTRY/ECONOMY SCORE 1 MEAN: 5.4 7 RANK COUNTRY/ECONOMY SCORE 1 MEAN: 5.4 7
1 Finland ...................................7.0 71 Lebanon.................................5.6
2 Sweden .................................6.9 72 Qatar......................................5.6
3 Norway ..................................6.9 73 Romania ................................5.5
4 Denmark ................................6.8 74 China .....................................5.5
5 Uruguay .................................6.7 75 Thailand .................................5.5
6 Austria ...................................6.7 76 Iran, Islamic Rep....................5.5
7 Albania...................................6.7 77 Latvia .....................................5.4
8 Iceland ...................................6.7 78 Georgia ..................................5.4
9 Canada...................................6.7 79 Ecuador .................................5.4
10 Belgium .................................6.7 80 Venezuela ..............................5.3
11 Germany ................................6.7 81 Dominican Republic...............5.3
12 Israel ......................................6.7 82 Peru .......................................5.3
13 Switzerland ............................6.7 83 Colombia ...............................5.3
14 Spain......................................6.7 84 Armenia .................................5.2
15 Slovak Republic .....................6.7 85 Paraguay................................5.2
16 New Zealand .........................6.6 86 Bulgaria..................................5.2
17 Luxembourg ..........................6.6 87 India.......................................5.2
18 Greece...................................6.6 88 Malaysia ................................5.0
19 Costa Rica .............................6.6 89 Brunei Darussalam ................5.0
20 Italy ........................................6.6 90 Vietnam .................................5.0
21 Croatia ...................................6.6 91 Algeria ...................................5.0
22 Montenegro...........................6.5 92 Cape Verde ............................5.0
23 Cyprus ...................................6.5 93 Azerbaijan ..............................4.9
24 Ireland....................................6.5 94 Bangladesh............................4.8
25 Slovenia .................................6.5 95 Moldova.................................4.8
26 Hungary .................................6.5 96 Mongolia................................4.8
27 Puerto Rico............................6.5 97 Trinidad and Tobago...............4.8
28 Netherlands ...........................6.5 98 Bolivia ....................................4.7
408 29 France....................................6.5 99 Morocco ................................4.7
30 Turkey ....................................6.4 100 Nicaragua...............................4.7
31 Chile ......................................6.4 101 Gambia, The ..........................4.7
32 Egypt .....................................6.4 102 Indonesia ...............................4.7
33 Tunisia....................................6.3 103 Ghana ....................................4.7
34 Malta .....................................6.3 104 Kazakhstan ............................4.5
35 Australia.................................6.3 105 Madagascar ...........................4.5
36 United Kingdom.....................6.3 106 Philippines .............................4.5
37 Bosnia and Herzegovina........6.3 107 Tajikistan ................................4.5
38 Saudi Arabia...........................6.2 108 Guyana ..................................4.5
39 Poland....................................6.2 109 Senegal..................................4.5
40 Mauritius ...............................6.1 110 Rwanda .................................4.5
41 Czech Republic......................6.1 111 Nepal .....................................4.4
42 Portugal .................................6.1 112 Benin .....................................4.3
43 Guatemala .............................6.1 113 Ukraine ..................................4.3
44 Mexico...................................6.1 114 Pakistan .................................4.3
45 Bahrain ..................................6.1 115 Burkina Faso..........................4.2
46 Jordan....................................6.1 116 Kyrgyz Republic .....................4.2
47 Singapore ..............................6.0 117 Mali........................................4.2
48 Korea, Rep.............................6.0 118 Cambodia ..............................4.2
49 Syria.......................................6.0 119 Cameroon..............................4.2
50 Japan .....................................6.0 120 Burundi ..................................4.1
51 Barbados ...............................6.0 121 Namibia .................................4.0
52 Estonia...................................5.9 122 Côte d’Ivoire ..........................4.0
53 United States.........................5.9 123 Angola ...................................3.9
54 Jamaica .................................5.9 124 Nigeria ...................................3.9
55 Brazil ......................................5.9 125 Ethiopia..................................3.8
56 Serbia ....................................5.9 126 Kenya.....................................3.8
57 Argentina ...............................5.9 127 Mauritania..............................3.7
58 El Salvador.............................5.9 128 Uganda ..................................3.6
59 Hong Kong SAR ....................5.9 129 Tanzania .................................3.6
60 Sri Lanka................................5.8 130 Mozambique..........................3.6
61 Panama..................................5.8 131 Botswana ..............................3.6
62 Libya ......................................5.8 132 Zimbabwe..............................3.5
63 Lithuania ................................5.8 133 Malawi ...................................3.3
64 Taiwan, China ........................5.8 134 Chad ......................................3.2
65 Honduras ...............................5.7 135 South Africa...........................3.2
66 Russian Federation................5.7 136 Zambia...................................3.1
67 Kuwait ...................................5.7 137 Lesotho .................................3.0
68 Oman.....................................5.7 138 Timor-Leste............................2.9
69 United Arab Emirates ............5.7 139 Swaziland ..............................2.2
70 Macedonia, FYR ....................5.7
SOURCE: World Economic Forum, Executive Opinion Survey
The Global Competitiveness Report 2010-2011 © 2010 World Economic Forum](https://image.slidesharecdn.com/globalcompetitivenessreportwef2010-11-100928142139-phpapp02/75/Global-competitiveness-report-wef-2010-11-421-2048.jpg)
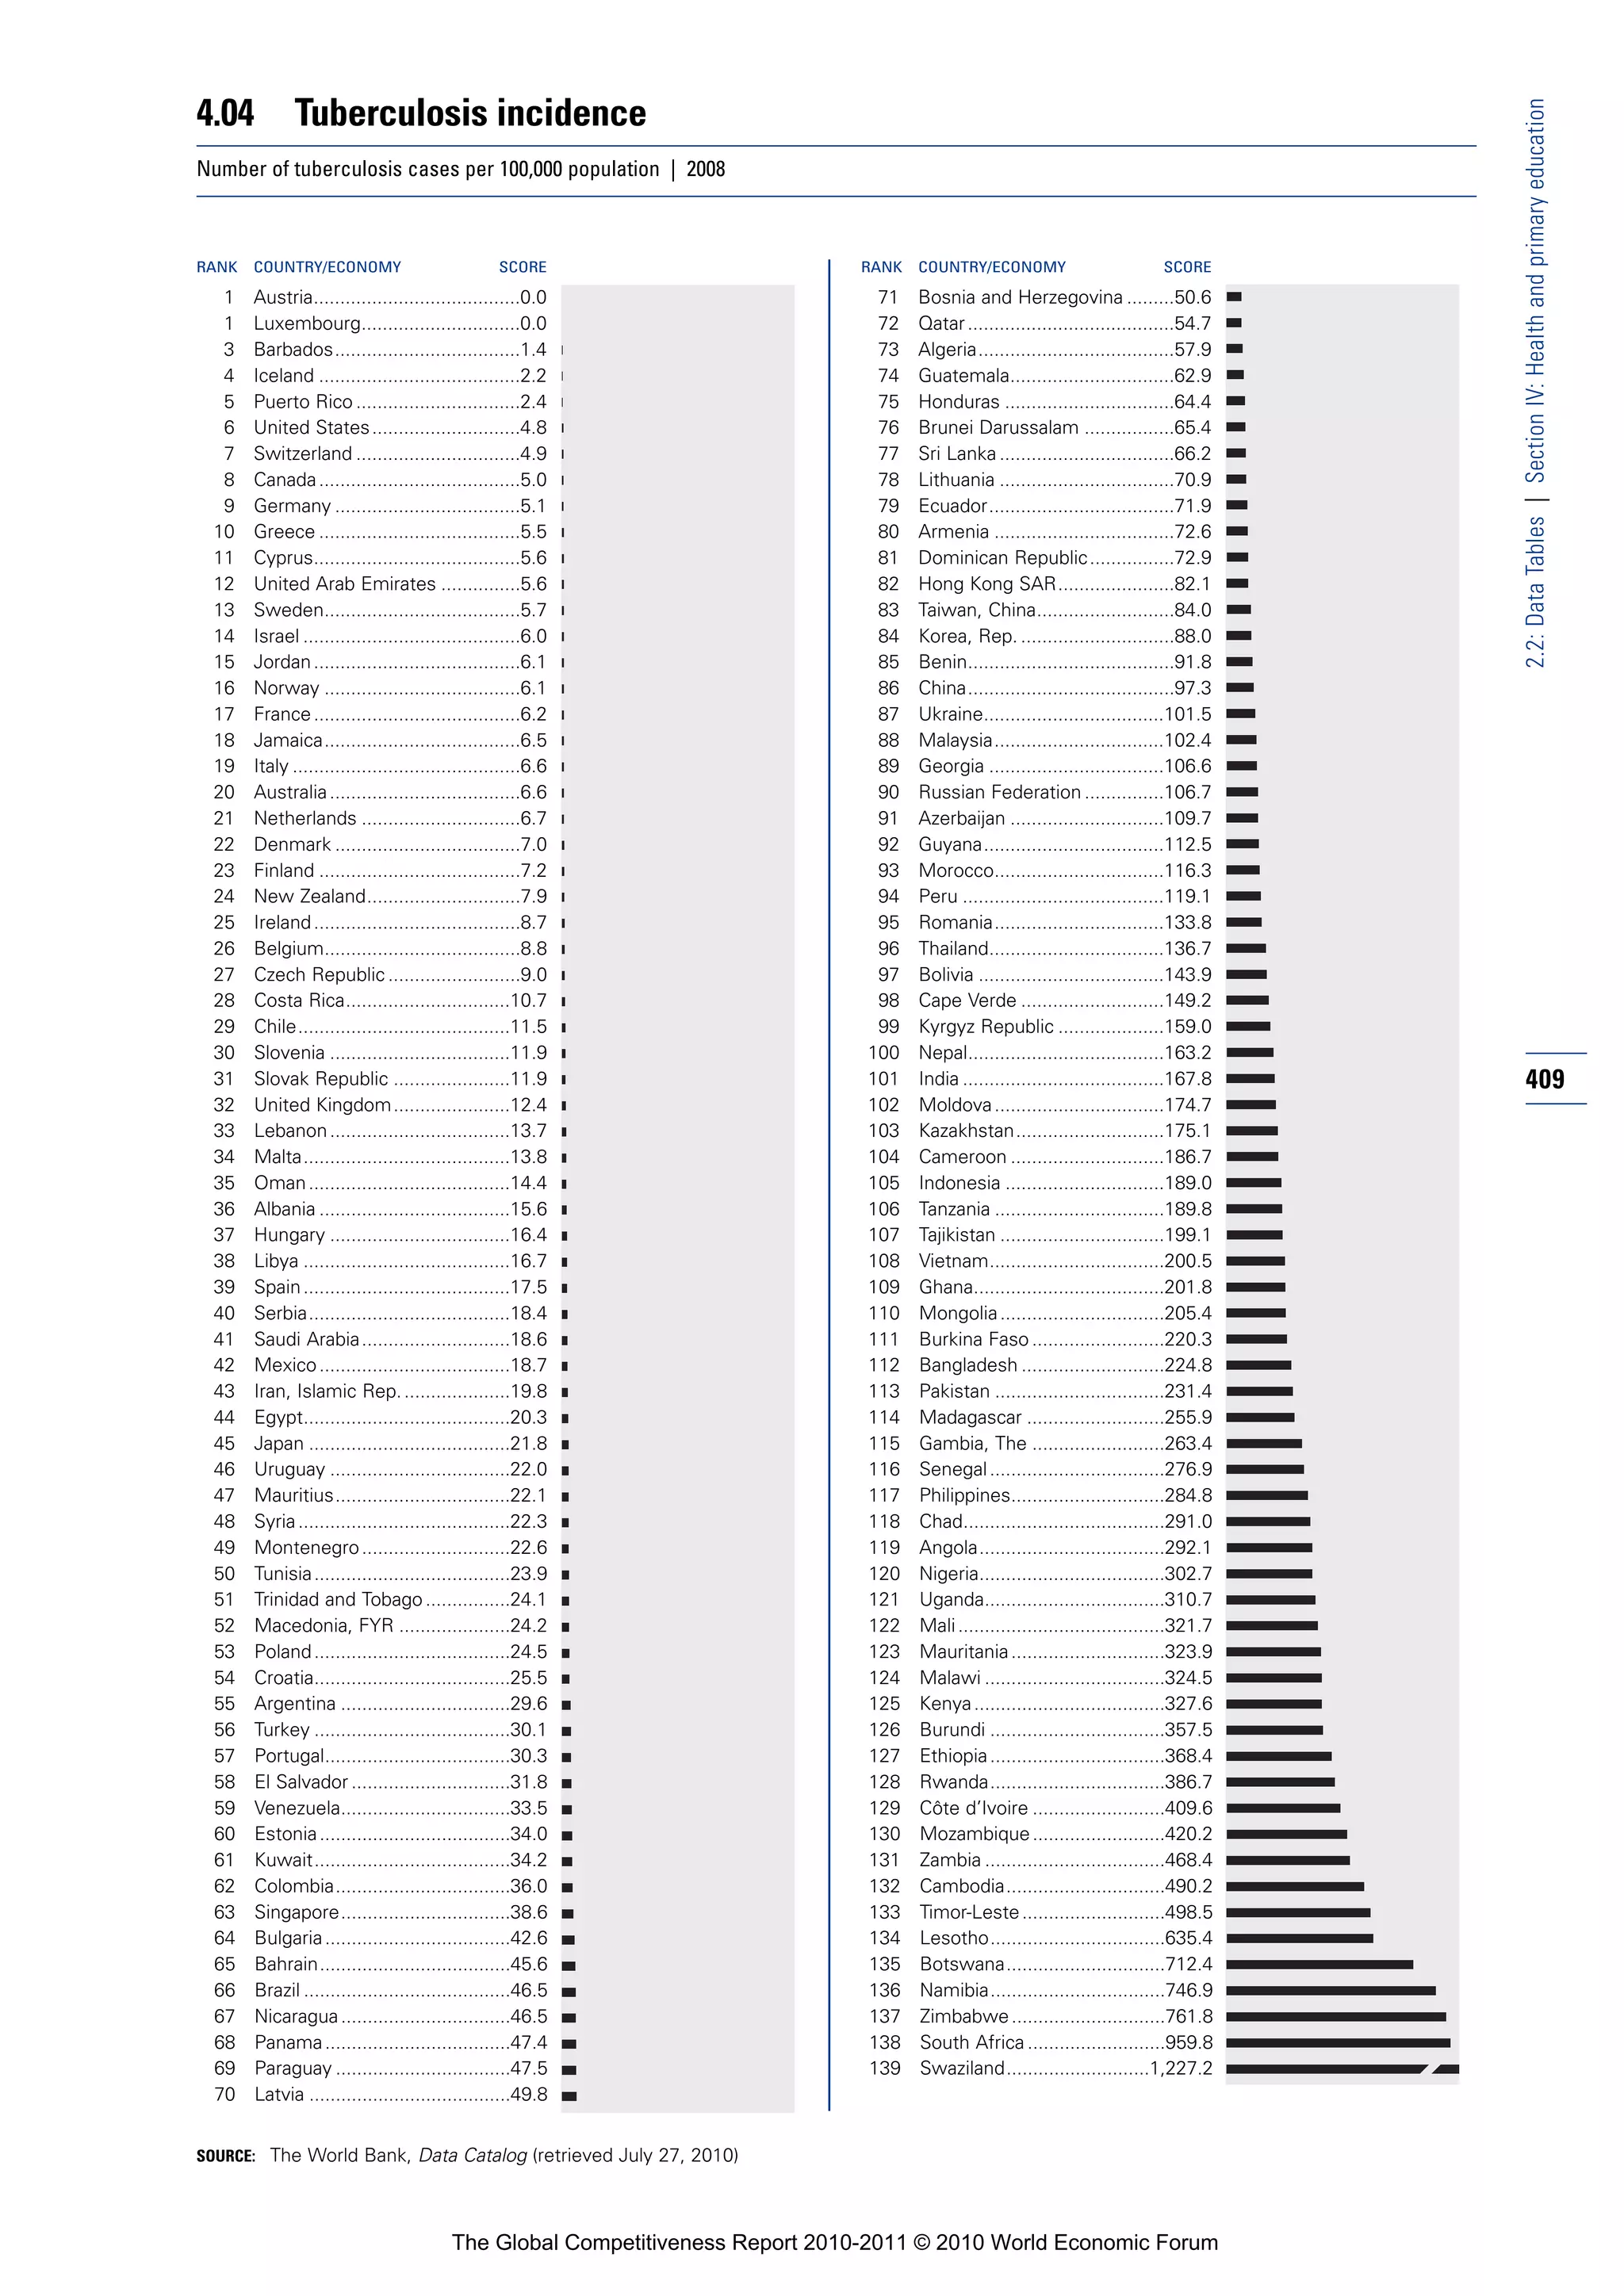
![4.05 Business impact of HIV/AIDS
2.2: Data Tables | Section IV: Health and primary education
How serious an impact do you consider HIV/AIDS will have on your company in the next five years (e.g., death, disability, medical and funeral
expenses, productivity and absenteeism, recruitment and training expenses, revenues)? [1 = a serious impact; 7 = no impact at all] | 2009–10
weighted average
RANK COUNTRY/ECONOMY SCORE 1 MEAN: 5.1 7 RANK COUNTRY/ECONOMY SCORE 1 MEAN: 5.1 7
1 Norway ..................................6.7 71 Bulgaria..................................5.2
2 Albania...................................6.7 72 Argentina ...............................5.2
3 Slovak Republic .....................6.7 73 El Salvador.............................5.2
4 Bosnia and Herzegovina........6.6 74 Moldova.................................5.2
5 Sweden .................................6.6 75 Ecuador .................................5.2
6 Finland ...................................6.6 76 Bangladesh............................5.2
7 Iceland ...................................6.6 77 Brunei Darussalam ................5.2
8 Austria ...................................6.5 78 Mexico...................................5.2
9 Israel ......................................6.5 79 Mauritius ...............................5.1
10 New Zealand .........................6.5 80 United States.........................5.1
11 Slovenia .................................6.4 81 Panama..................................5.1
12 Germany ................................6.4 82 Venezuela ..............................5.1
13 Switzerland ............................6.4 83 Philippines .............................5.0
14 Croatia ...................................6.4 84 Vietnam .................................5.0
15 Hungary .................................6.4 85 Cape Verde ............................5.0
16 Tunisia....................................6.3 86 Kazakhstan ............................4.9
17 Ireland....................................6.3 87 Bolivia ....................................4.9
18 Belgium .................................6.3 88 Honduras ...............................4.9
19 Greece...................................6.3 89 Libya ......................................4.9
20 Montenegro...........................6.2 90 Gambia, The ..........................4.9
21 Cyprus ...................................6.2 91 Paraguay................................4.9
22 Spain......................................6.2 92 Senegal..................................4.8
23 Turkey ....................................6.2 93 Malaysia ................................4.8
24 Poland....................................6.2 94 Qatar......................................4.7
25 Canada...................................6.2 95 Indonesia ...............................4.7
26 Denmark ................................6.1 96 Ukraine ..................................4.7
27 Uruguay .................................6.1 97 Madagascar ...........................4.7
28 Luxembourg ..........................6.1 98 Nicaragua...............................4.7
410 29 Egypt .....................................6.1 99 India.......................................4.7
30 Saudi Arabia...........................6.1 100 Azerbaijan ..............................4.6
31 Jordan....................................6.1 101 Colombia ...............................4.6
32 Chile ......................................6.1 102 Pakistan .................................4.6
33 Syria.......................................6.0 103 Dominican Republic...............4.6
34 Netherlands ...........................6.0 104 Tajikistan ................................4.6
35 Lithuania ................................6.0 105 Morocco ................................4.5
36 Italy ........................................6.0 106 Thailand .................................4.4
37 Hong Kong SAR ....................5.9 107 Kyrgyz Republic .....................4.4
38 Portugal .................................5.9 108 Jamaica .................................4.4
39 Kuwait ...................................5.9 109 Ghana ....................................4.4
40 Sri Lanka................................5.9 110 Timor-Leste............................4.3
41 Korea, Rep.............................5.9 111 Benin .....................................4.2
42 Japan .....................................5.9 112 Barbados ...............................4.2
43 Malta .....................................5.9 113 Burkina Faso..........................3.9
44 Serbia ....................................5.8 114 Cambodia ..............................3.9
45 Costa Rica .............................5.8 115 Nepal .....................................3.9
46 Macedonia, FYR ....................5.8 116 Rwanda .................................3.8
47 Singapore ..............................5.8 117 Cameroon..............................3.8
48 Bahrain ..................................5.7 118 Nigeria ...................................3.7
49 Taiwan, China ........................5.7 119 Trinidad and Tobago...............3.7
50 United Arab Emirates ............5.7 120 Mauritania..............................3.7
51 France....................................5.7 121 Mali........................................3.7
52 Czech Republic......................5.6 122 Guyana ..................................3.6
53 Australia.................................5.6 123 Côte d’Ivoire ..........................3.6
54 United Kingdom.....................5.6 124 Ethiopia..................................3.4
55 Armenia .................................5.5 125 Tanzania .................................3.4
56 China .....................................5.5 126 Angola ...................................3.3
57 Estonia...................................5.5 127 Kenya.....................................3.3
58 Romania ................................5.5 128 Namibia .................................3.2
59 Lebanon.................................5.5 129 Burundi ..................................3.1
60 Oman.....................................5.4 130 Mozambique..........................3.1
61 Guatemala .............................5.4 131 Zimbabwe..............................2.9
62 Russian Federation................5.4 132 Botswana ..............................2.9
63 Algeria ...................................5.4 133 Chad ......................................2.7
64 Latvia .....................................5.4 134 Uganda ..................................2.7
65 Peru .......................................5.3 135 Malawi ...................................2.7
66 Iran, Islamic Rep....................5.3 136 Zambia...................................2.7
67 Mongolia................................5.3 137 Lesotho .................................2.5
68 Brazil ......................................5.3 138 South Africa...........................2.5
69 Puerto Rico............................5.3 139 Swaziland ..............................1.6
70 Georgia ..................................5.3
SOURCE: World Economic Forum, Executive Opinion Survey
The Global Competitiveness Report 2010-2011 © 2010 World Economic Forum](https://image.slidesharecdn.com/globalcompetitivenessreportwef2010-11-100928142139-phpapp02/75/Global-competitiveness-report-wef-2010-11-423-2048.jpg)
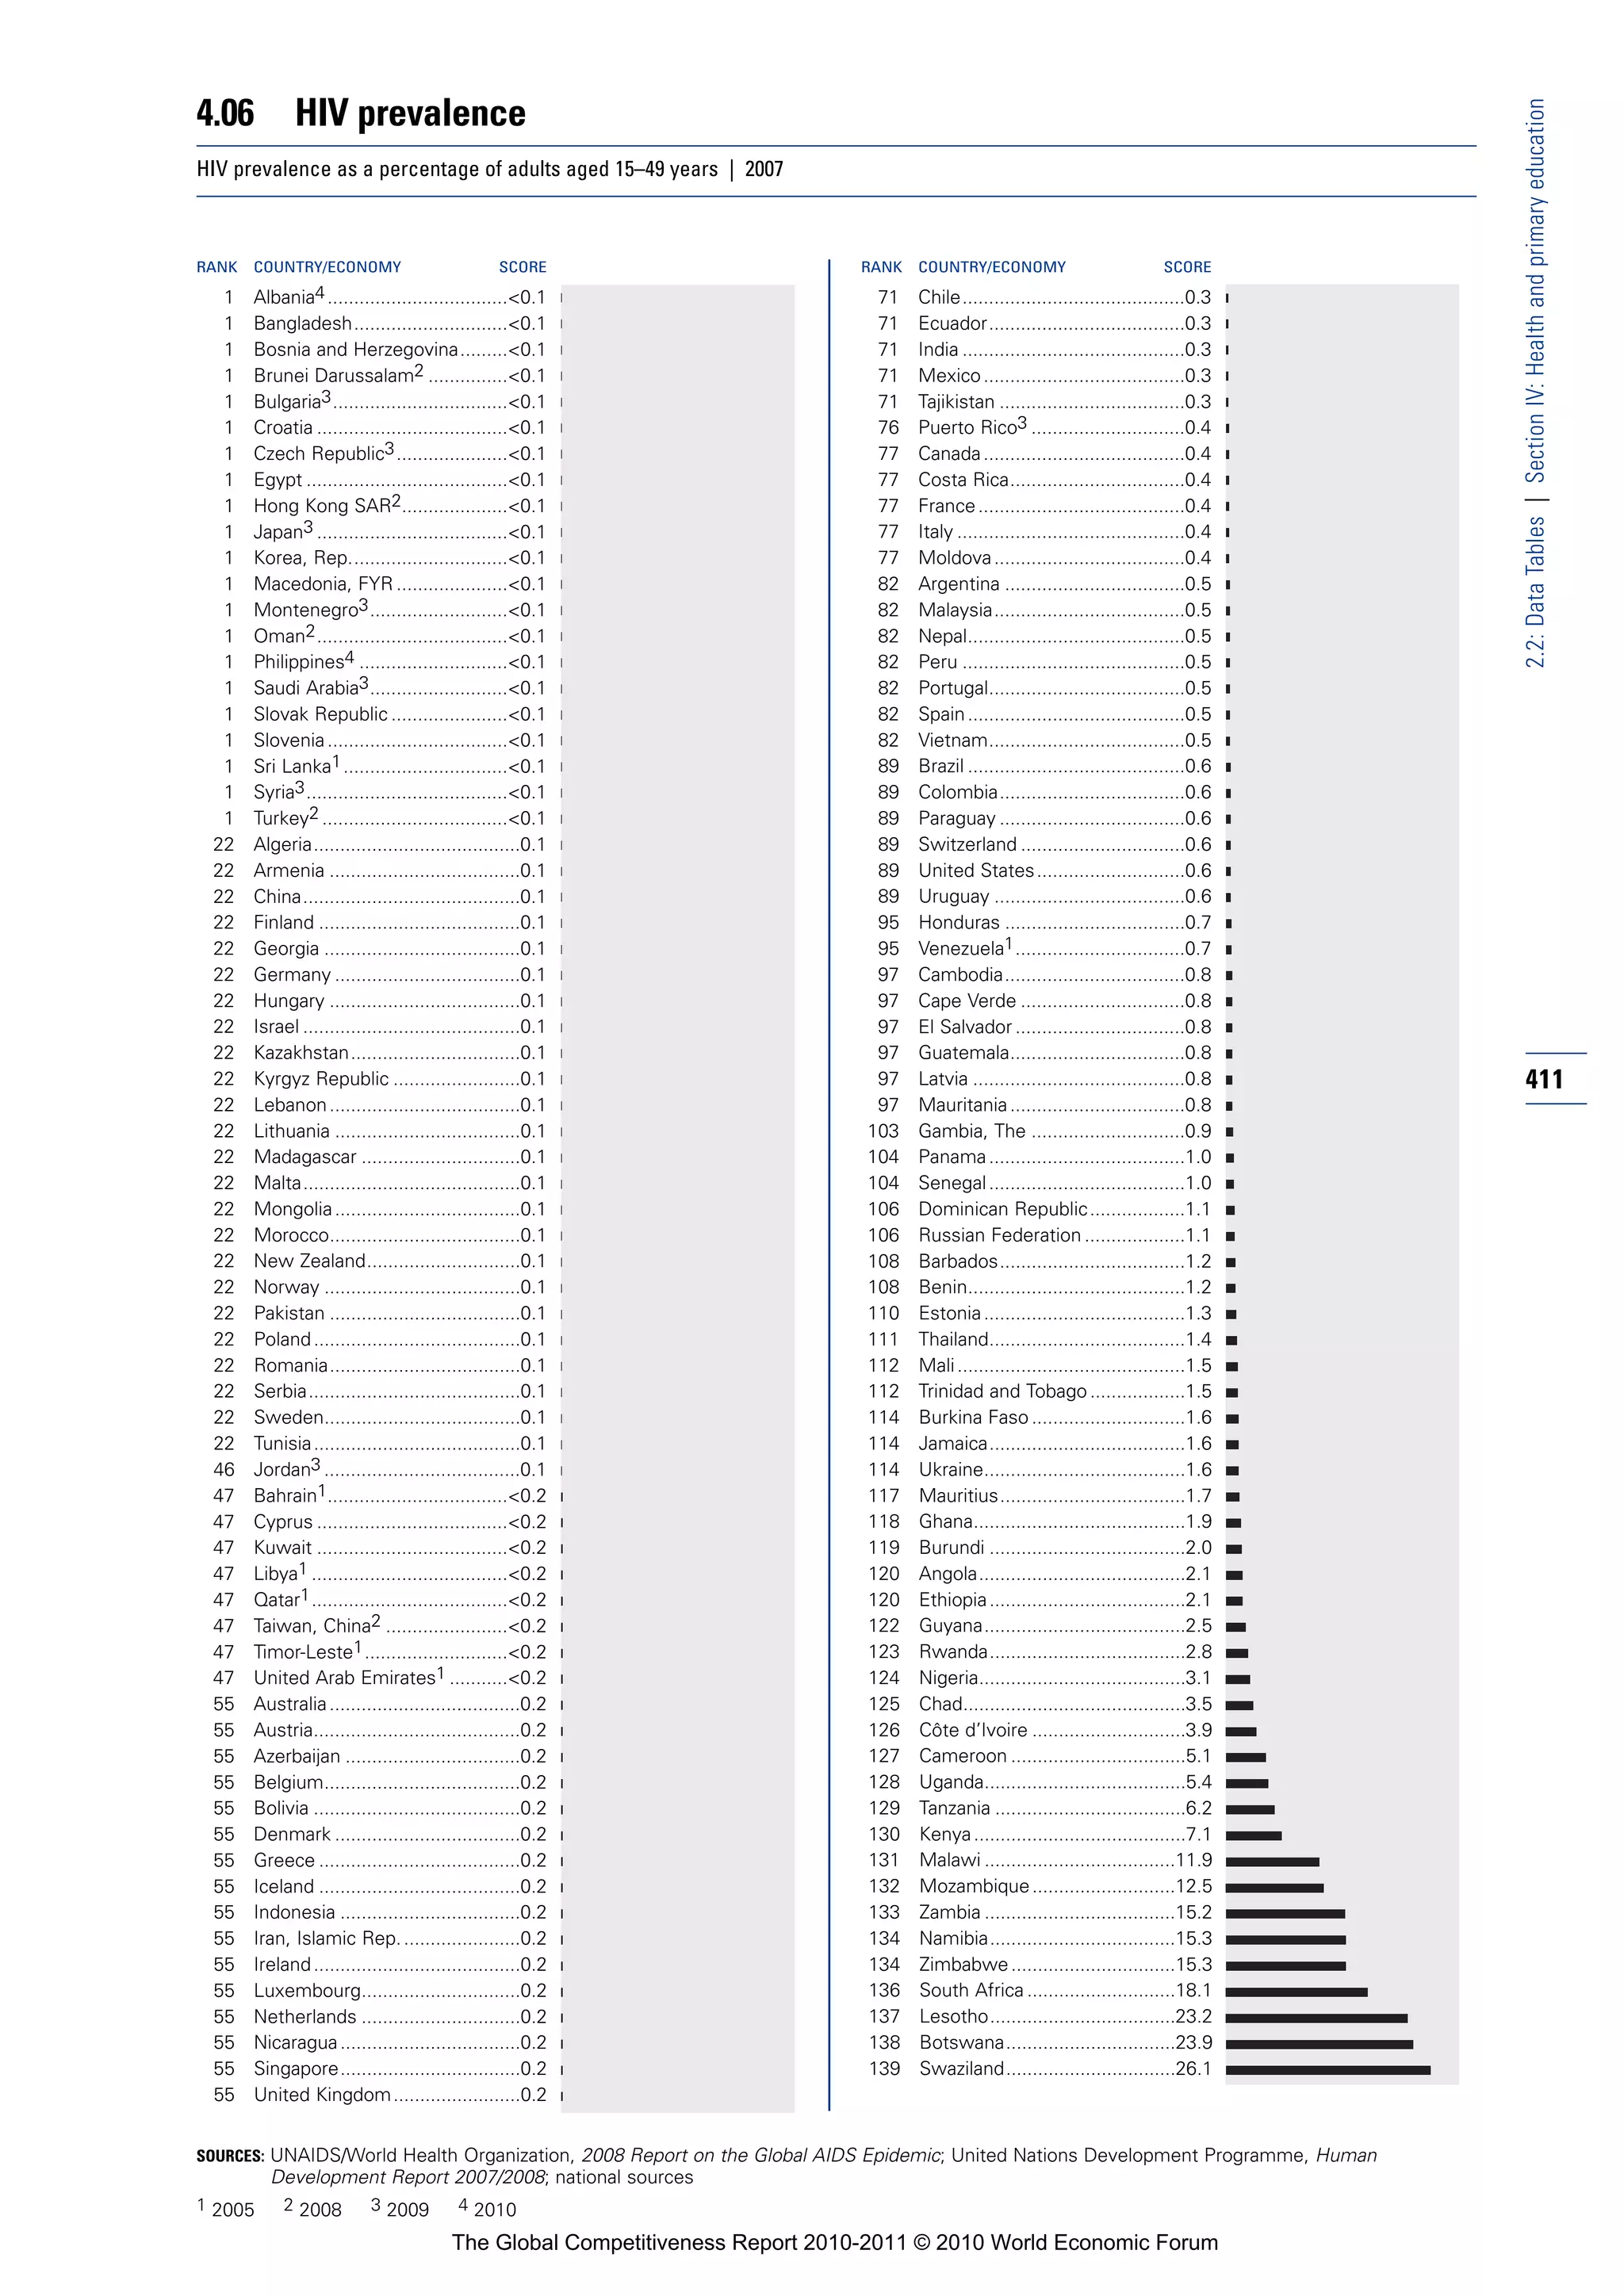
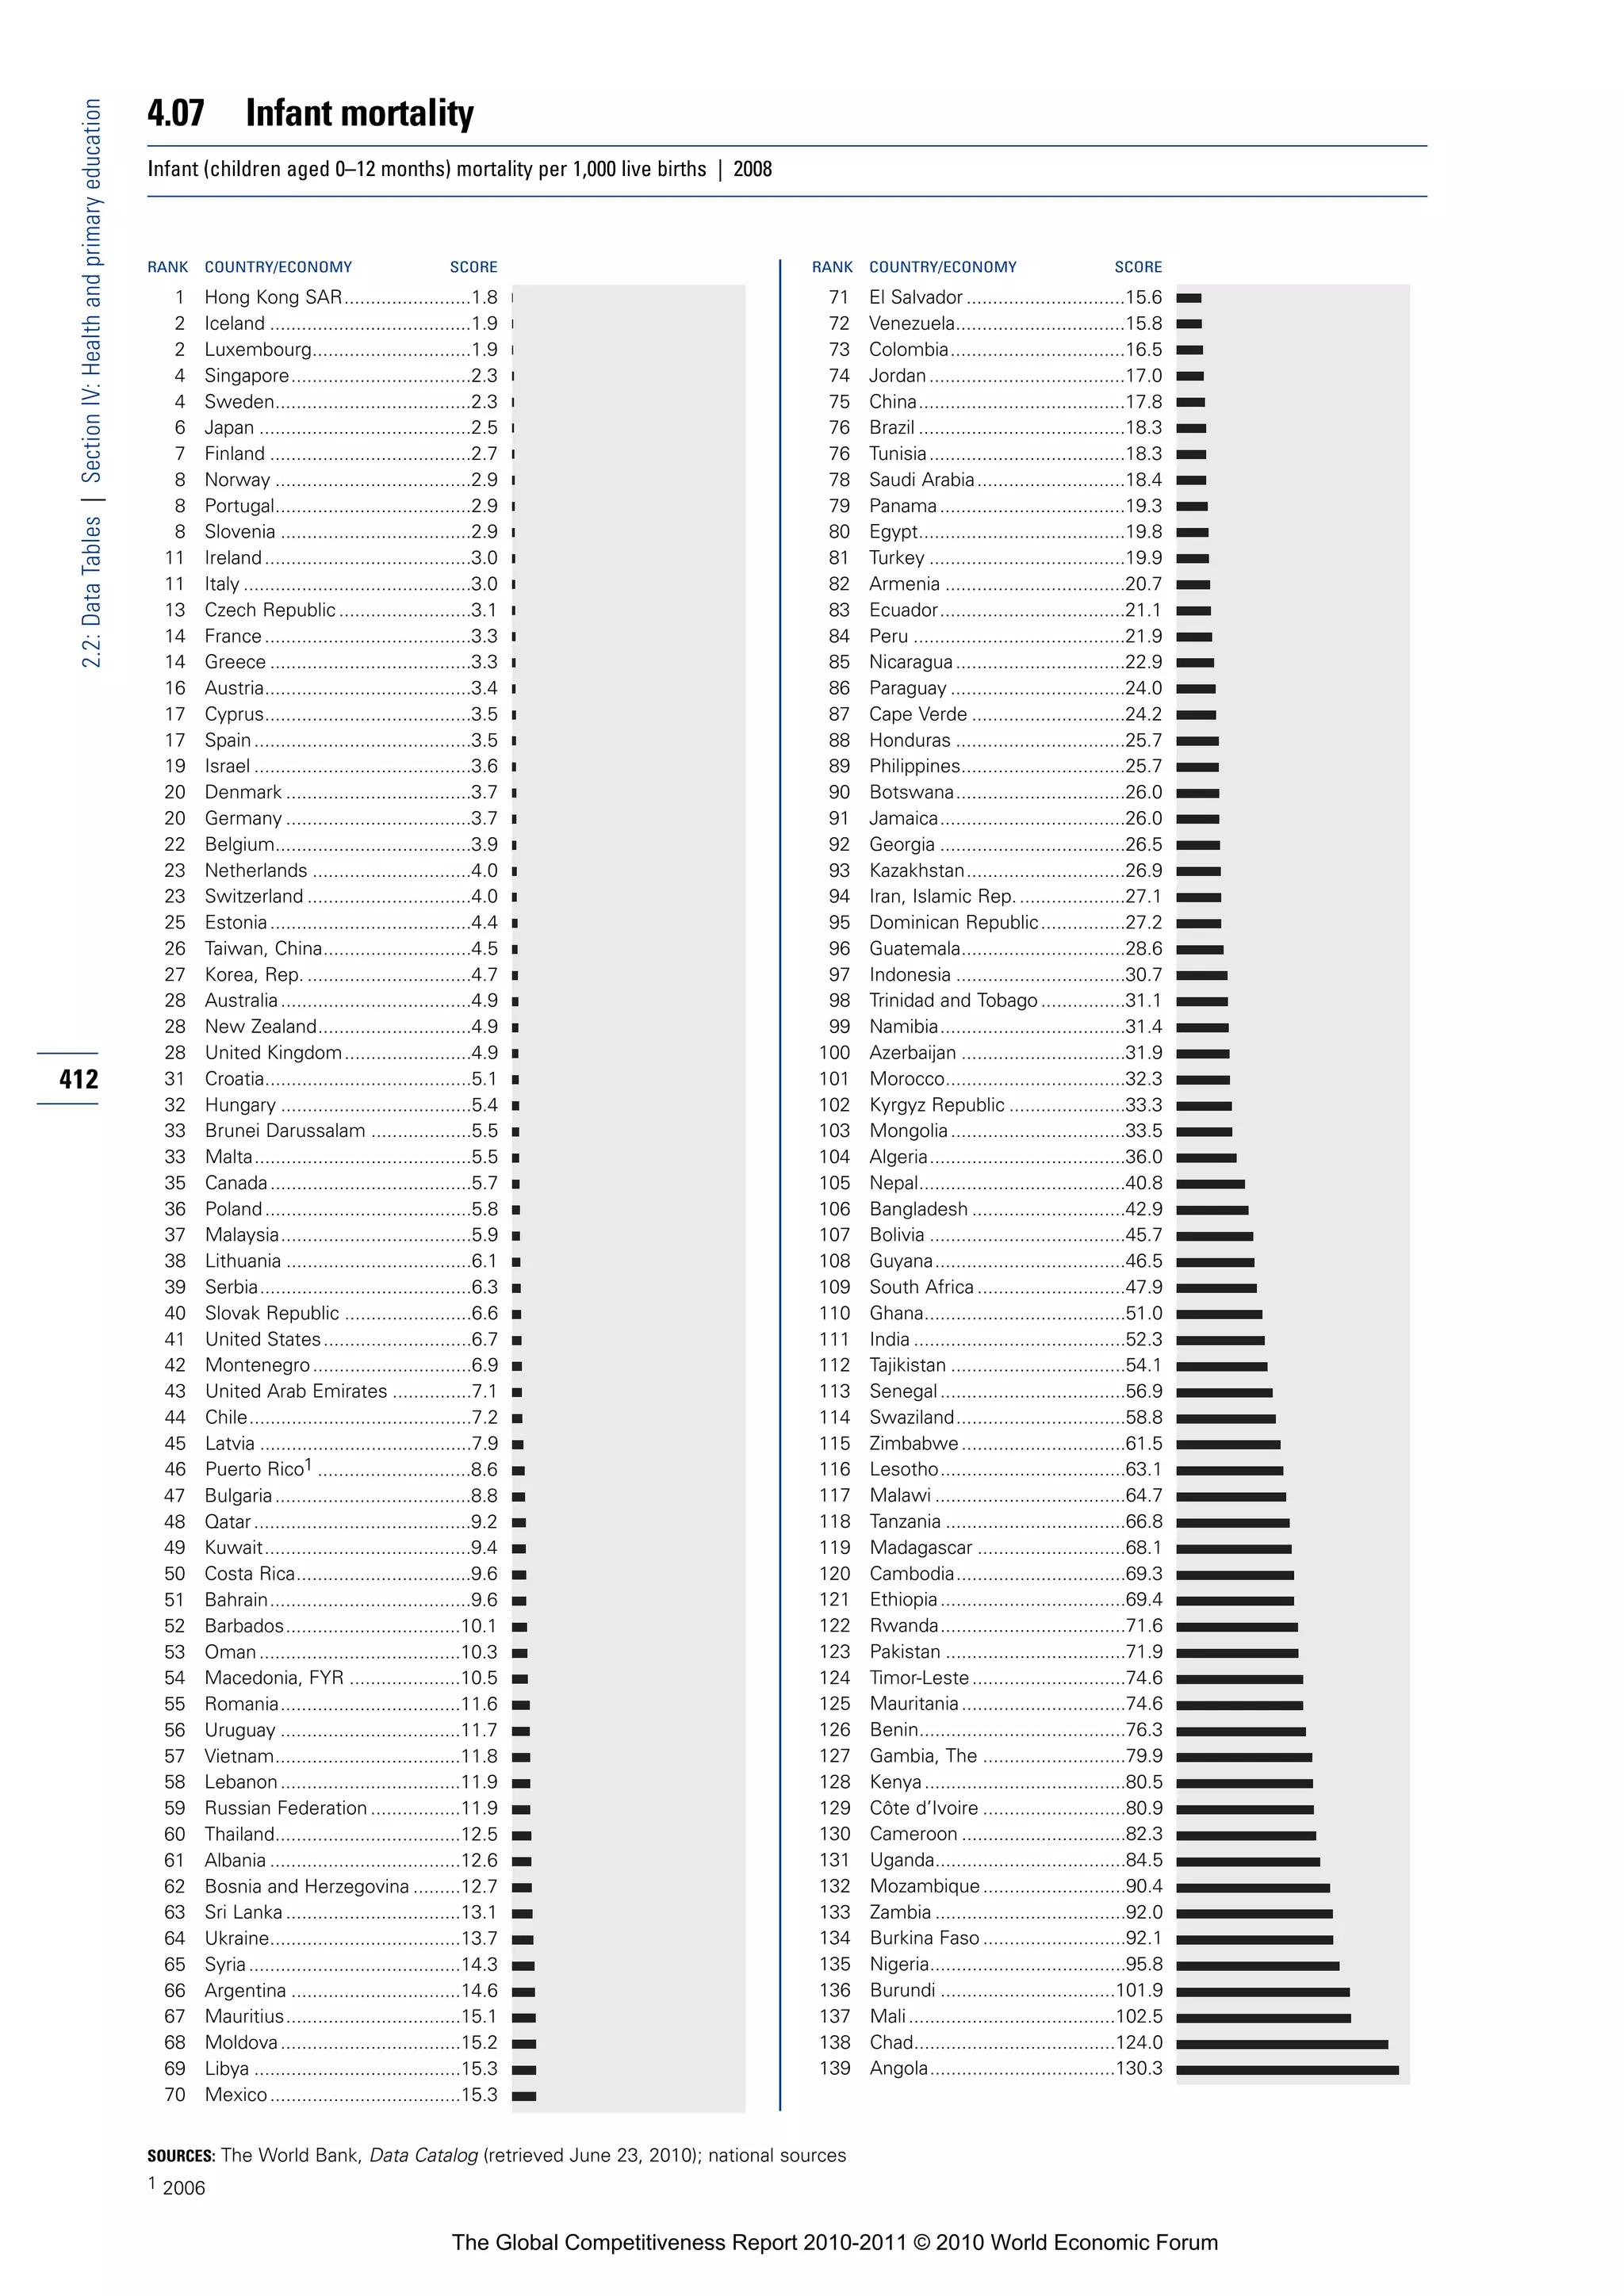
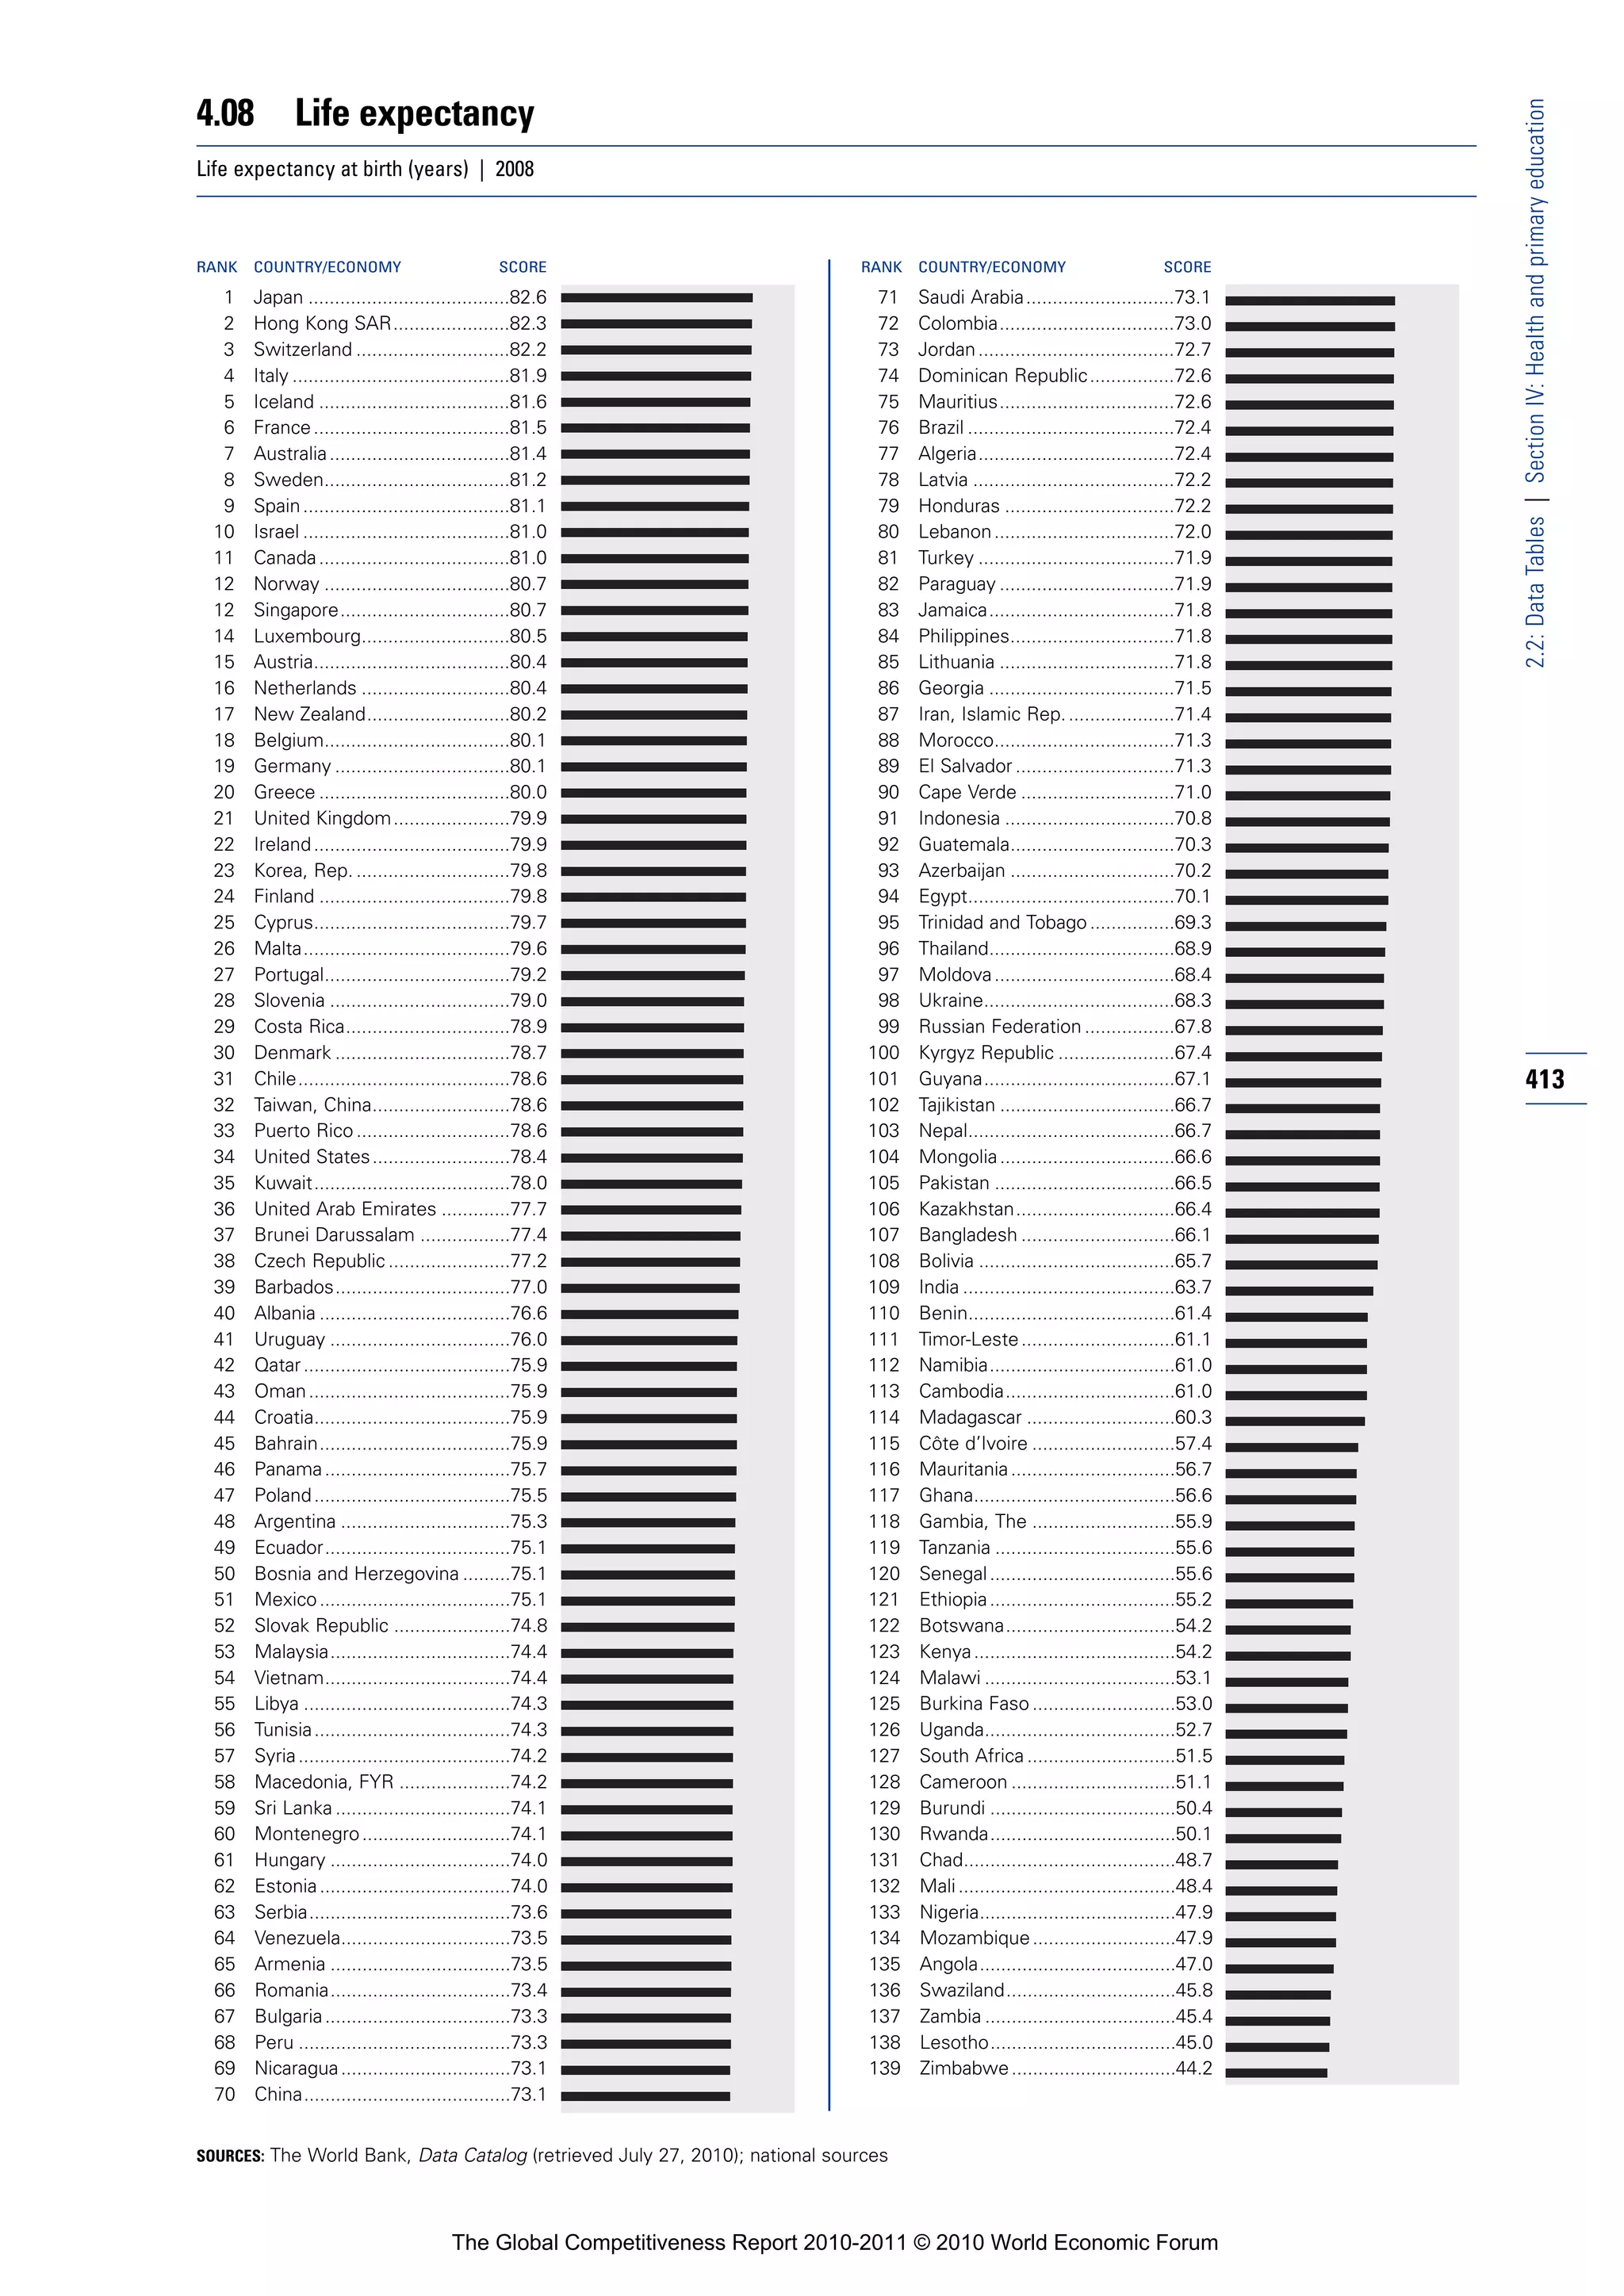
![4.09 Quality of primary education
2.2: Data Tables | Section IV: Health and primary education
How would you assess the quality of primary schools in your country? [1 = poor; 7 = excellent—among the best in the world] | 2009–10 weighted
average
RANK COUNTRY/ECONOMY SCORE 1 MEAN: 3.9 7 RANK COUNTRY/ECONOMY SCORE 1 MEAN: 3.9 7
1 Finland ...................................6.6 71 Greece...................................3.8
2 Belgium .................................6.4 72 Moldova.................................3.7
3 Singapore ..............................6.2 73 Thailand .................................3.7
4 Iceland ...................................6.0 74 Kazakhstan ............................3.7
5 Qatar......................................6.0 75 Israel......................................3.6
6 Switzerland ............................5.9 76 Bulgaria..................................3.6
7 New Zealand .........................5.8 77 Cameroon..............................3.6
8 Barbados ...............................5.8 78 Vietnam .................................3.6
9 Canada...................................5.6 79 Kuwait ...................................3.5
10 Taiwan, China ........................5.6 80 Benin .....................................3.5
11 Ireland....................................5.6 81 Kyrgyz Republic .....................3.5
12 Lebanon.................................5.5 82 Ghana ....................................3.4
13 Netherlands ...........................5.4 83 Senegal..................................3.4
14 Australia.................................5.4 84 Puerto Rico............................3.4
15 Cyprus ...................................5.4 85 Zimbabwe..............................3.3
16 Estonia...................................5.3 86 Syria.......................................3.3
17 Sweden .................................5.3 87 Namibia .................................3.3
18 Denmark ................................5.2 88 Armenia .................................3.3
19 Malta .....................................5.1 89 Jamaica .................................3.3
20 Japan .....................................5.1 90 Colombia ...............................3.3
21 Austria ...................................5.0 91 Ethiopia..................................3.3
22 Tunisia....................................5.0 92 Zambia...................................3.2
23 Brunei Darussalam ................5.0 93 Spain......................................3.2
24 France....................................5.0 94 Turkey ....................................3.2
25 Hong Kong SAR ....................4.9 95 Lesotho .................................3.2
26 Czech Republic......................4.9 96 Algeria ...................................3.1
27 United Kingdom.....................4.9 97 Côte d’Ivoire ..........................3.1
28 Slovenia .................................4.9 98 India.......................................3.1
29 United Arab Emirates ............4.9 99 Philippines .............................3.1
30 Malaysia ................................4.9 100 Morocco ................................3.1
414 31 Korea, Rep.............................4.8 101 Argentina ...............................3.1
32 Luxembourg ..........................4.8 102 Uganda ..................................3.0
33 Costa Rica .............................4.7 103 Pakistan .................................3.0
34 United States.........................4.7 104 Malawi ...................................3.0
35 China .....................................4.7 105 Georgia ..................................3.0
36 Germany ................................4.6 106 Mongolia................................3.0
37 Croatia ...................................4.6 107 Madagascar ...........................3.0
38 Norway ..................................4.6 108 Burkina Faso..........................2.9
39 Sri Lanka................................4.6 109 Azerbaijan ..............................2.9
40 Montenegro...........................4.5 110 Venezuela ..............................2.9
41 Bahrain ..................................4.5 111 Cambodia ..............................2.9
42 Poland....................................4.5 112 Chad ......................................2.9
43 Trinidad and Tobago...............4.5 113 Tajikistan ................................2.8
44 Lithuania ................................4.5 114 El Salvador.............................2.7
45 Latvia .....................................4.4 115 Tanzania .................................2.7
46 Gambia, The ..........................4.4 116 Nepal .....................................2.7
47 Italy ........................................4.4 117 Ecuador .................................2.7
48 Oman.....................................4.4 118 Bolivia ....................................2.6
49 Ukraine ..................................4.4 119 Bangladesh............................2.6
50 Bosnia and Herzegovina........4.2 120 Mexico...................................2.6
51 Hungary .................................4.2 121 Chile ......................................2.6
52 Slovak Republic .....................4.2 122 Nigeria ...................................2.6
53 Guyana ..................................4.2 123 Honduras ...............................2.6
54 Saudi Arabia...........................4.2 124 Mauritania..............................2.5
55 Indonesia ...............................4.1 125 South Africa...........................2.5
56 Rwanda .................................4.1 126 Egypt .....................................2.5
57 Botswana ..............................4.1 127 Brazil ......................................2.5
58 Albania...................................4.1 128 Libya ......................................2.5
59 Swaziland ..............................4.1 129 Panama..................................2.4
60 Romania ................................4.0 130 Mozambique..........................2.4
61 Kenya.....................................4.0 131 Nicaragua...............................2.4
62 Serbia ....................................4.0 132 Burundi ..................................2.3
63 Jordan....................................4.0 133 Peru .......................................2.3
64 Uruguay .................................4.0 134 Guatemala .............................2.2
65 Russian Federation................3.9 135 Timor-Leste............................2.1
66 Mauritius ...............................3.9 136 Mali........................................2.1
67 Portugal .................................3.9 137 Dominican Republic...............2.0
68 Macedonia, FYR ....................3.9 138 Paraguay................................1.9
69 Cape Verde ............................3.9 139 Angola ...................................1.5
70 Iran, Islamic Rep....................3.8
SOURCE: World Economic Forum, Executive Opinion Survey
The Global Competitiveness Report 2010-2011 © 2010 World Economic Forum](https://image.slidesharecdn.com/globalcompetitivenessreportwef2010-11-100928142139-phpapp02/75/Global-competitiveness-report-wef-2010-11-427-2048.jpg)
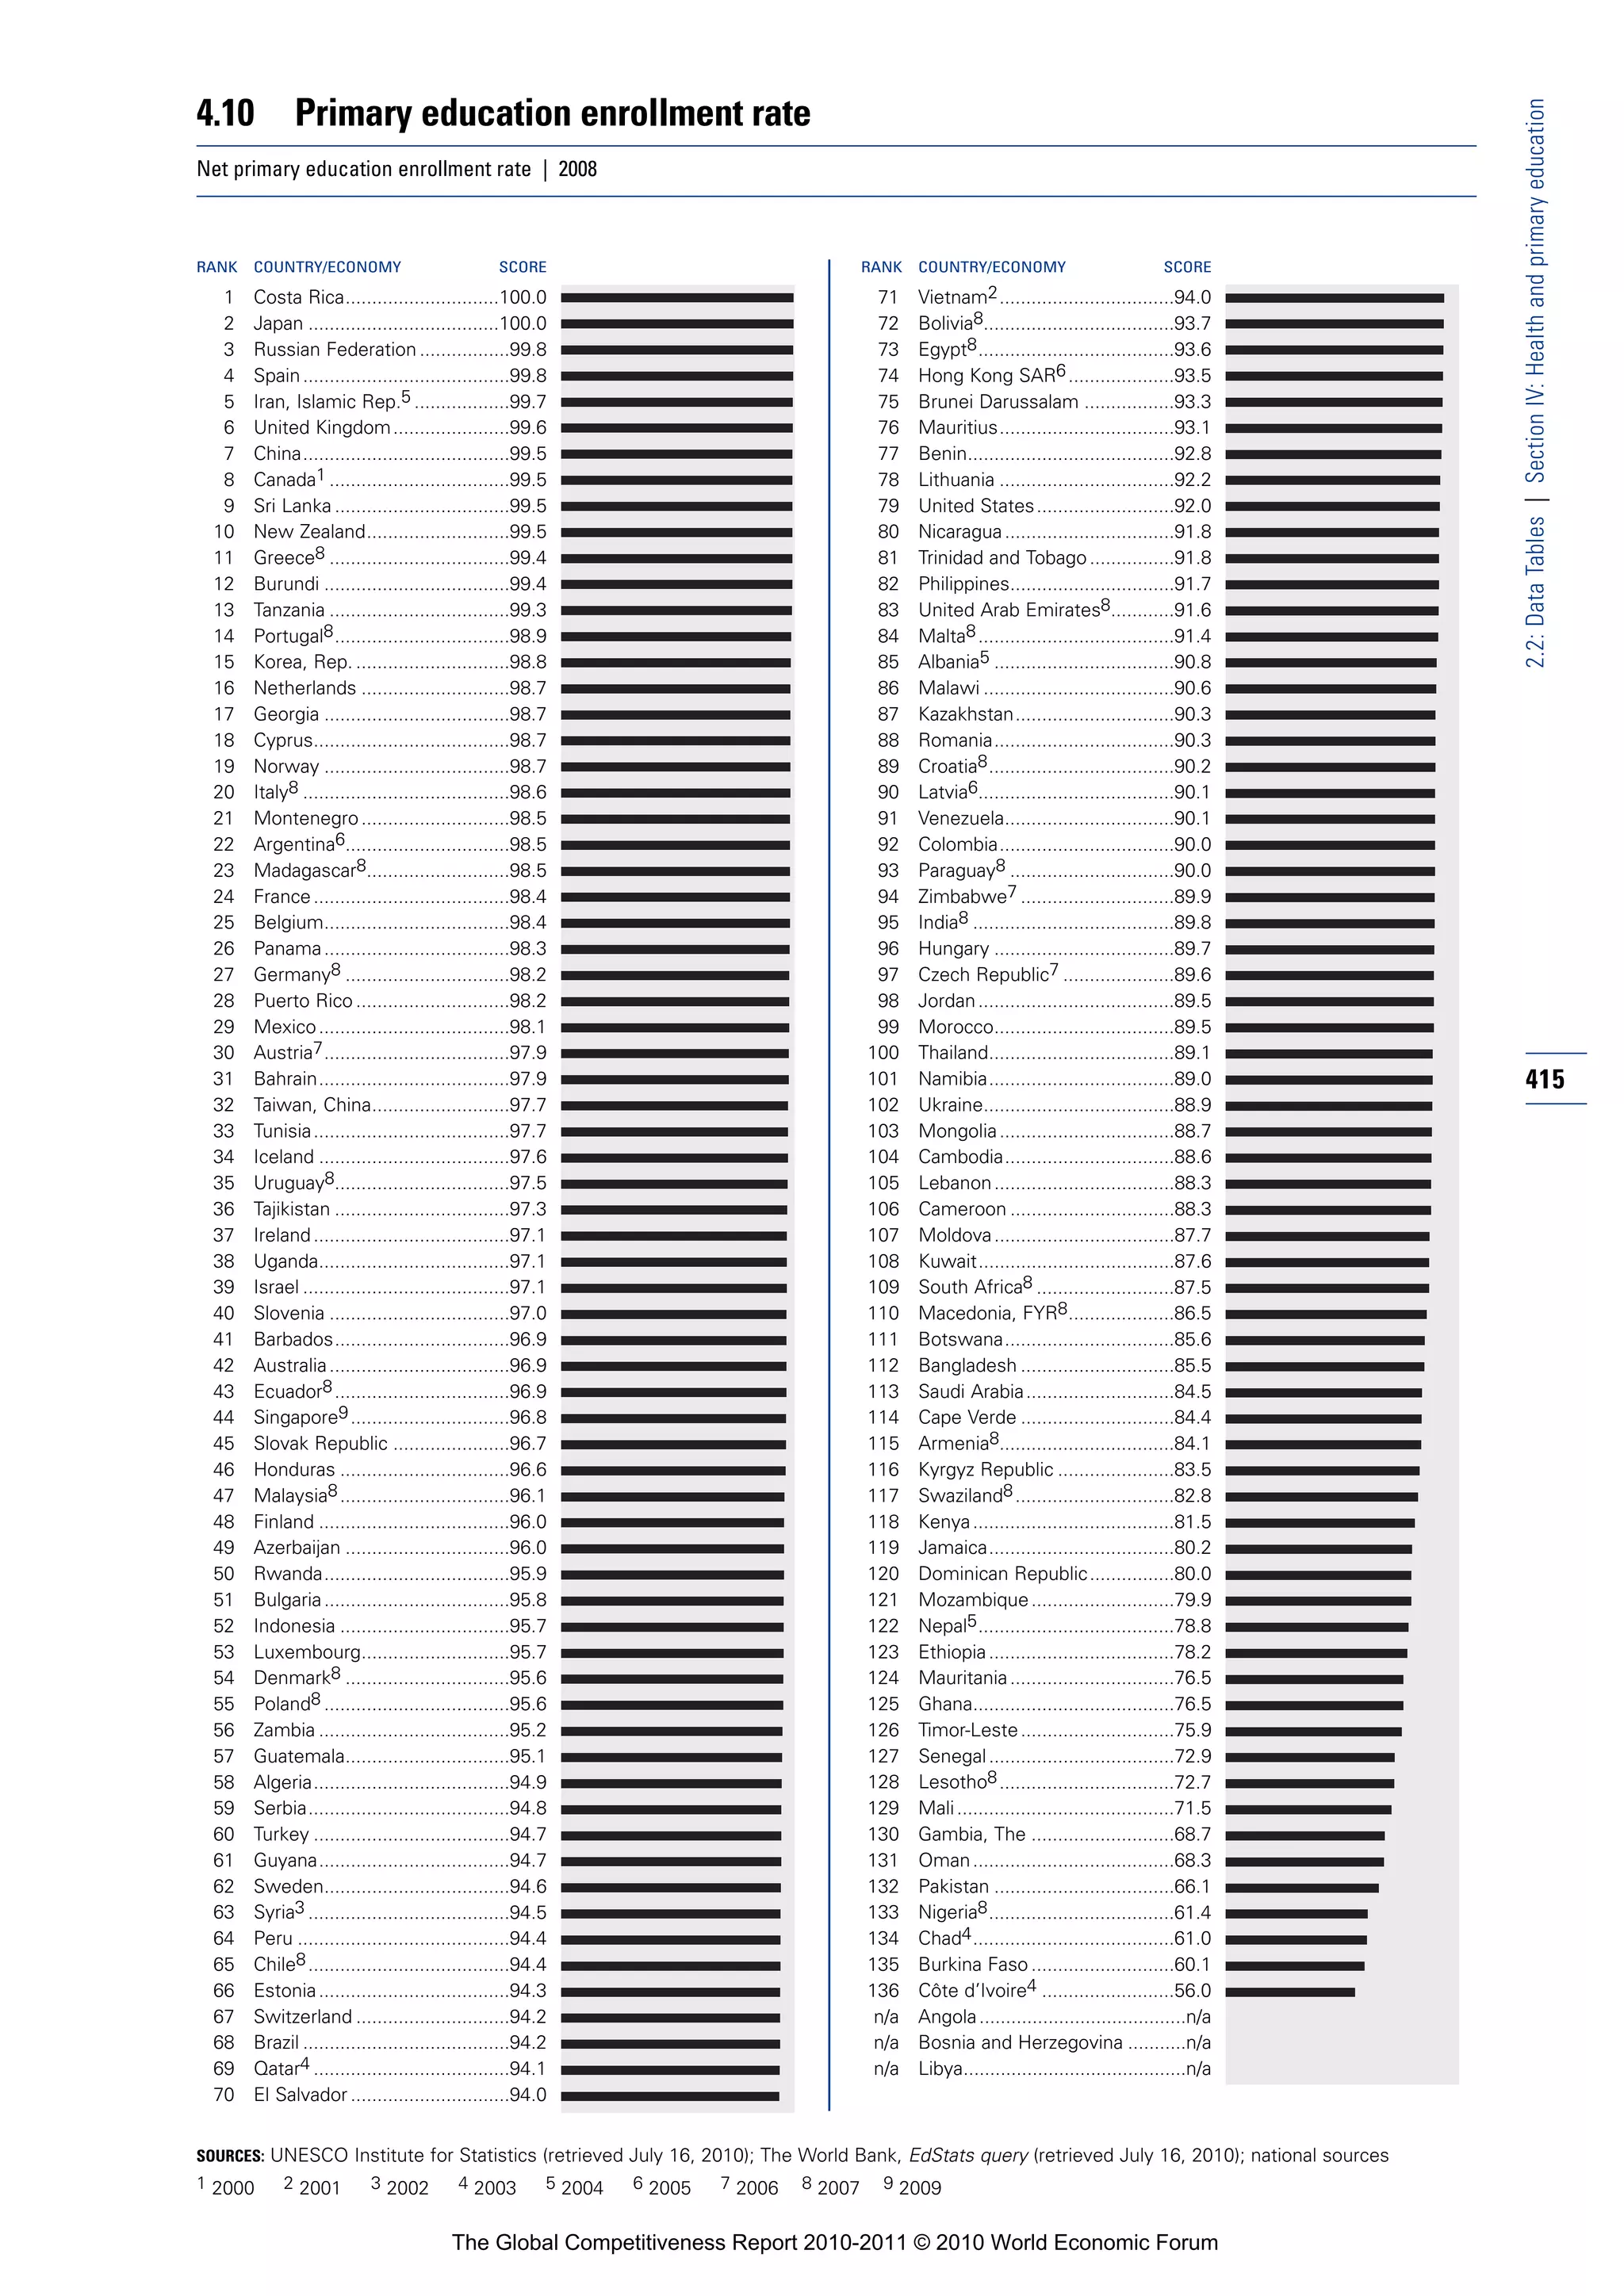


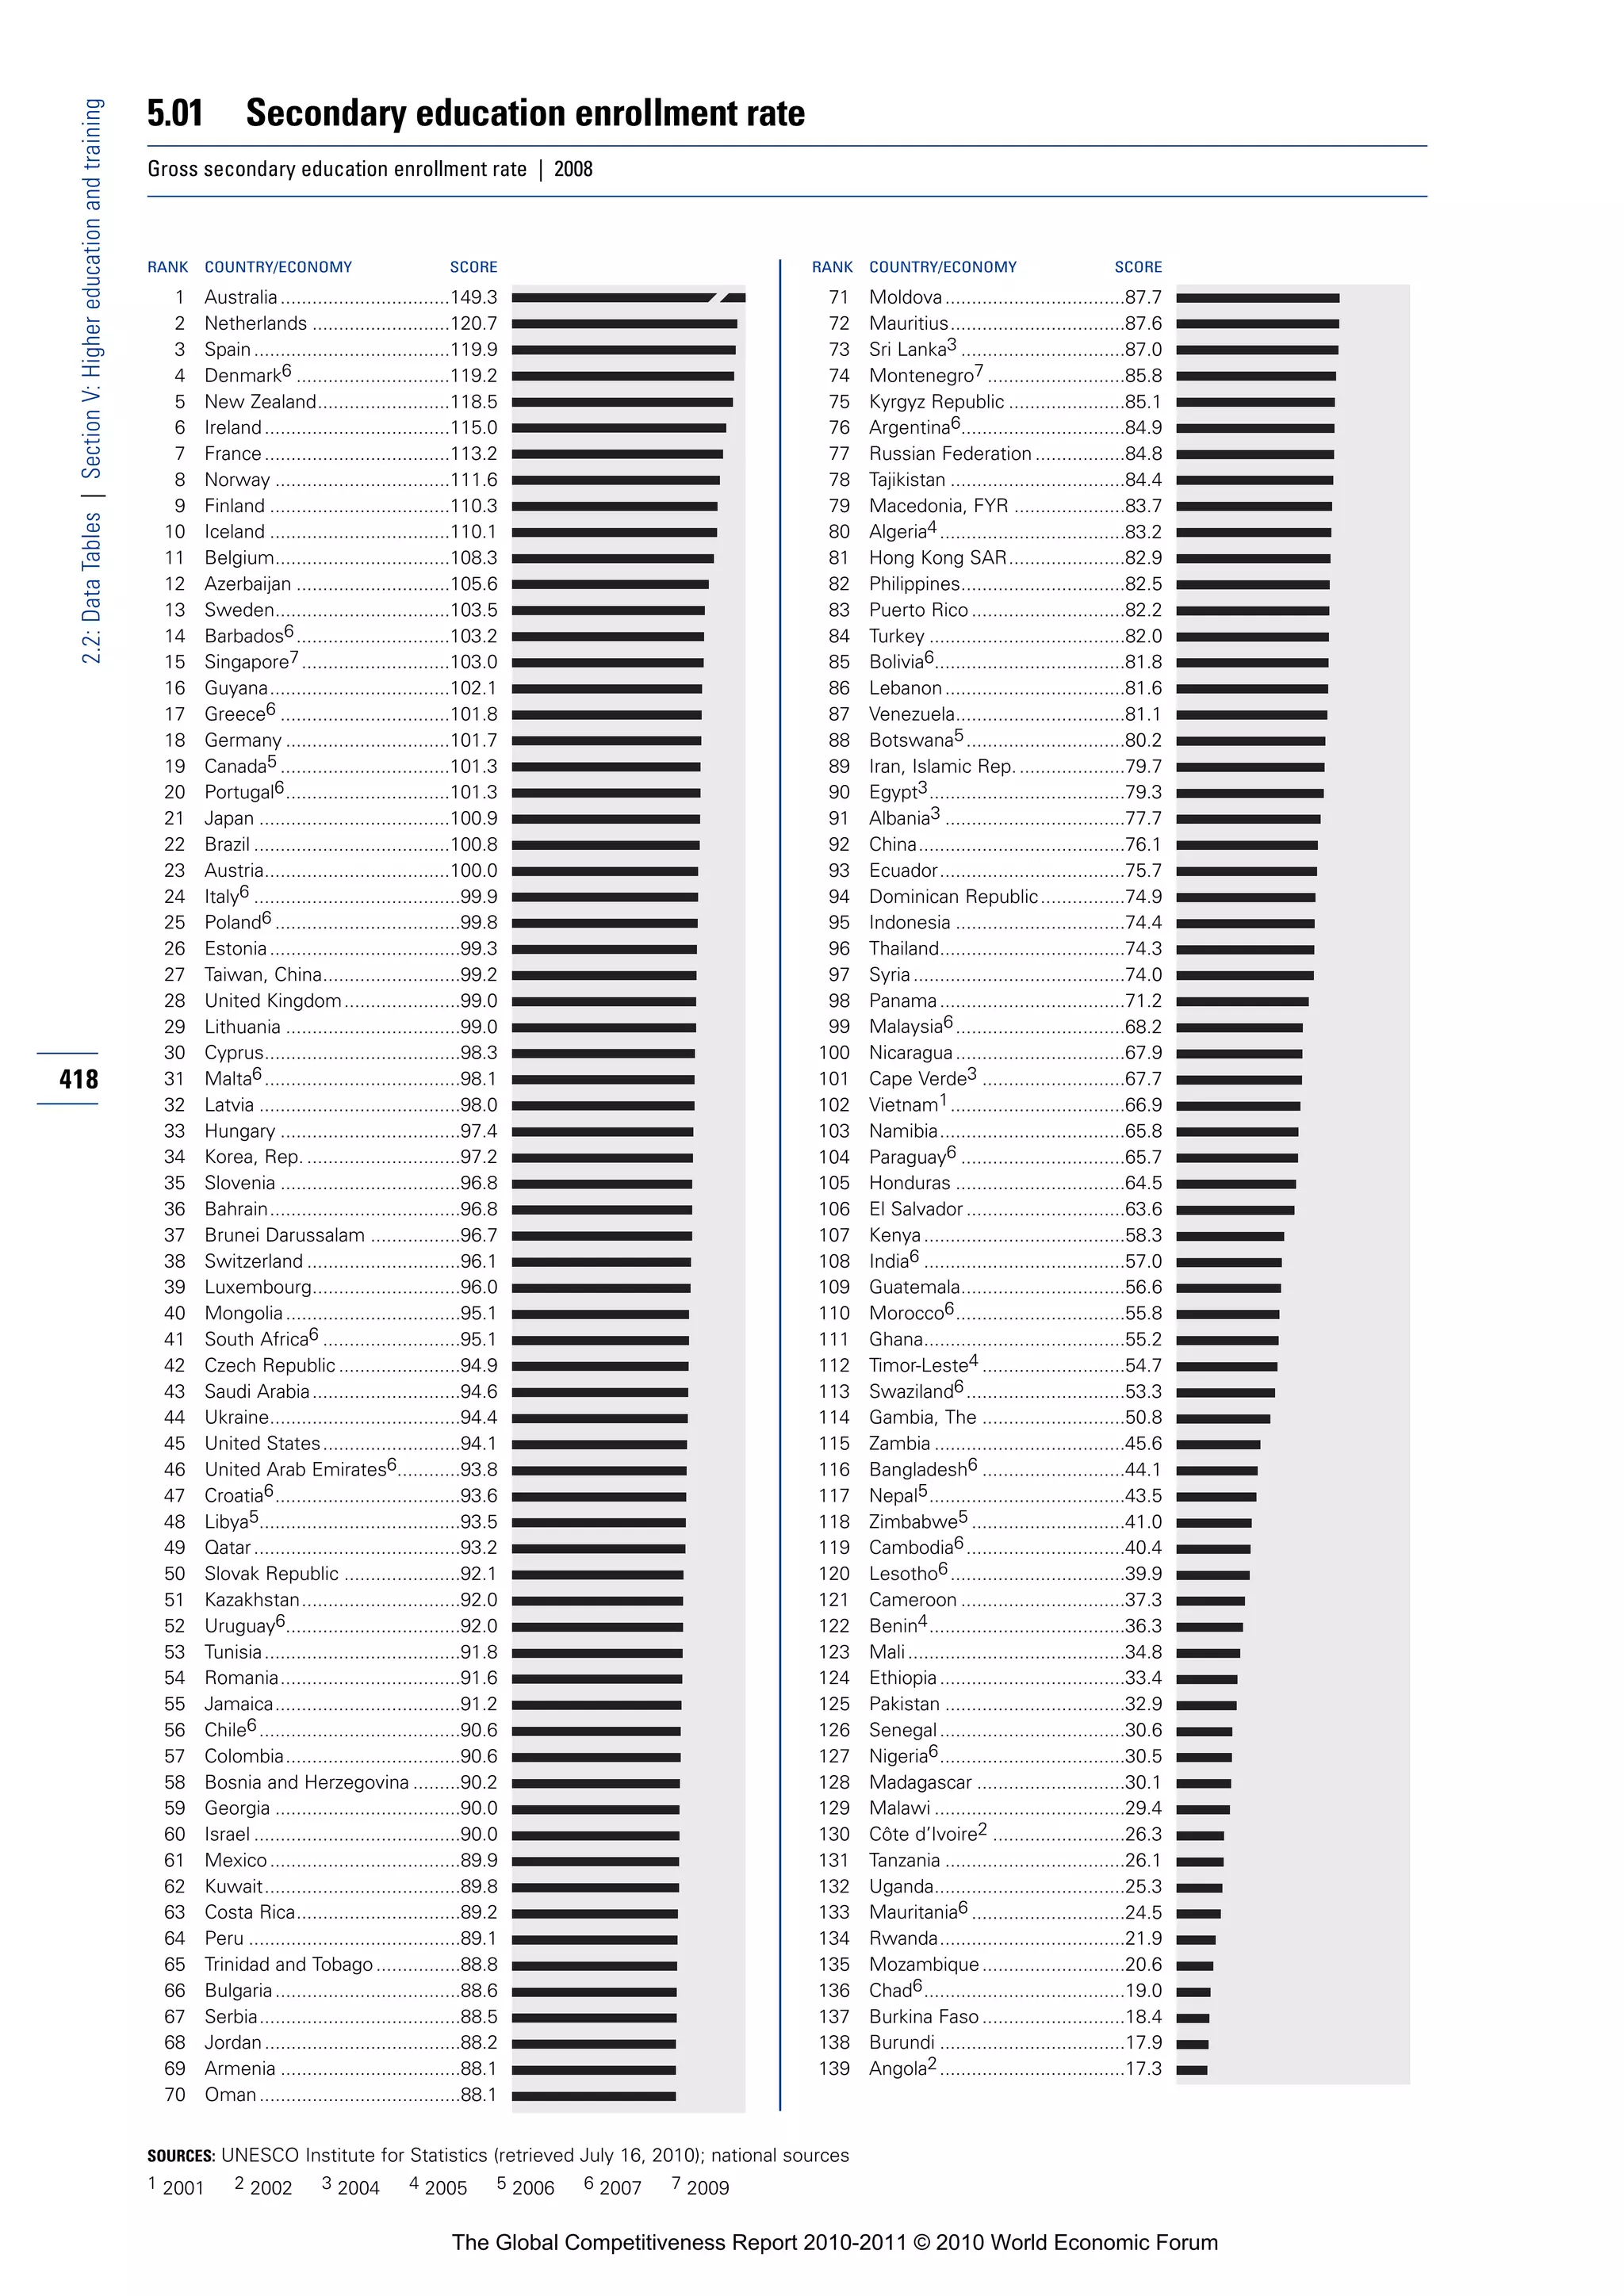
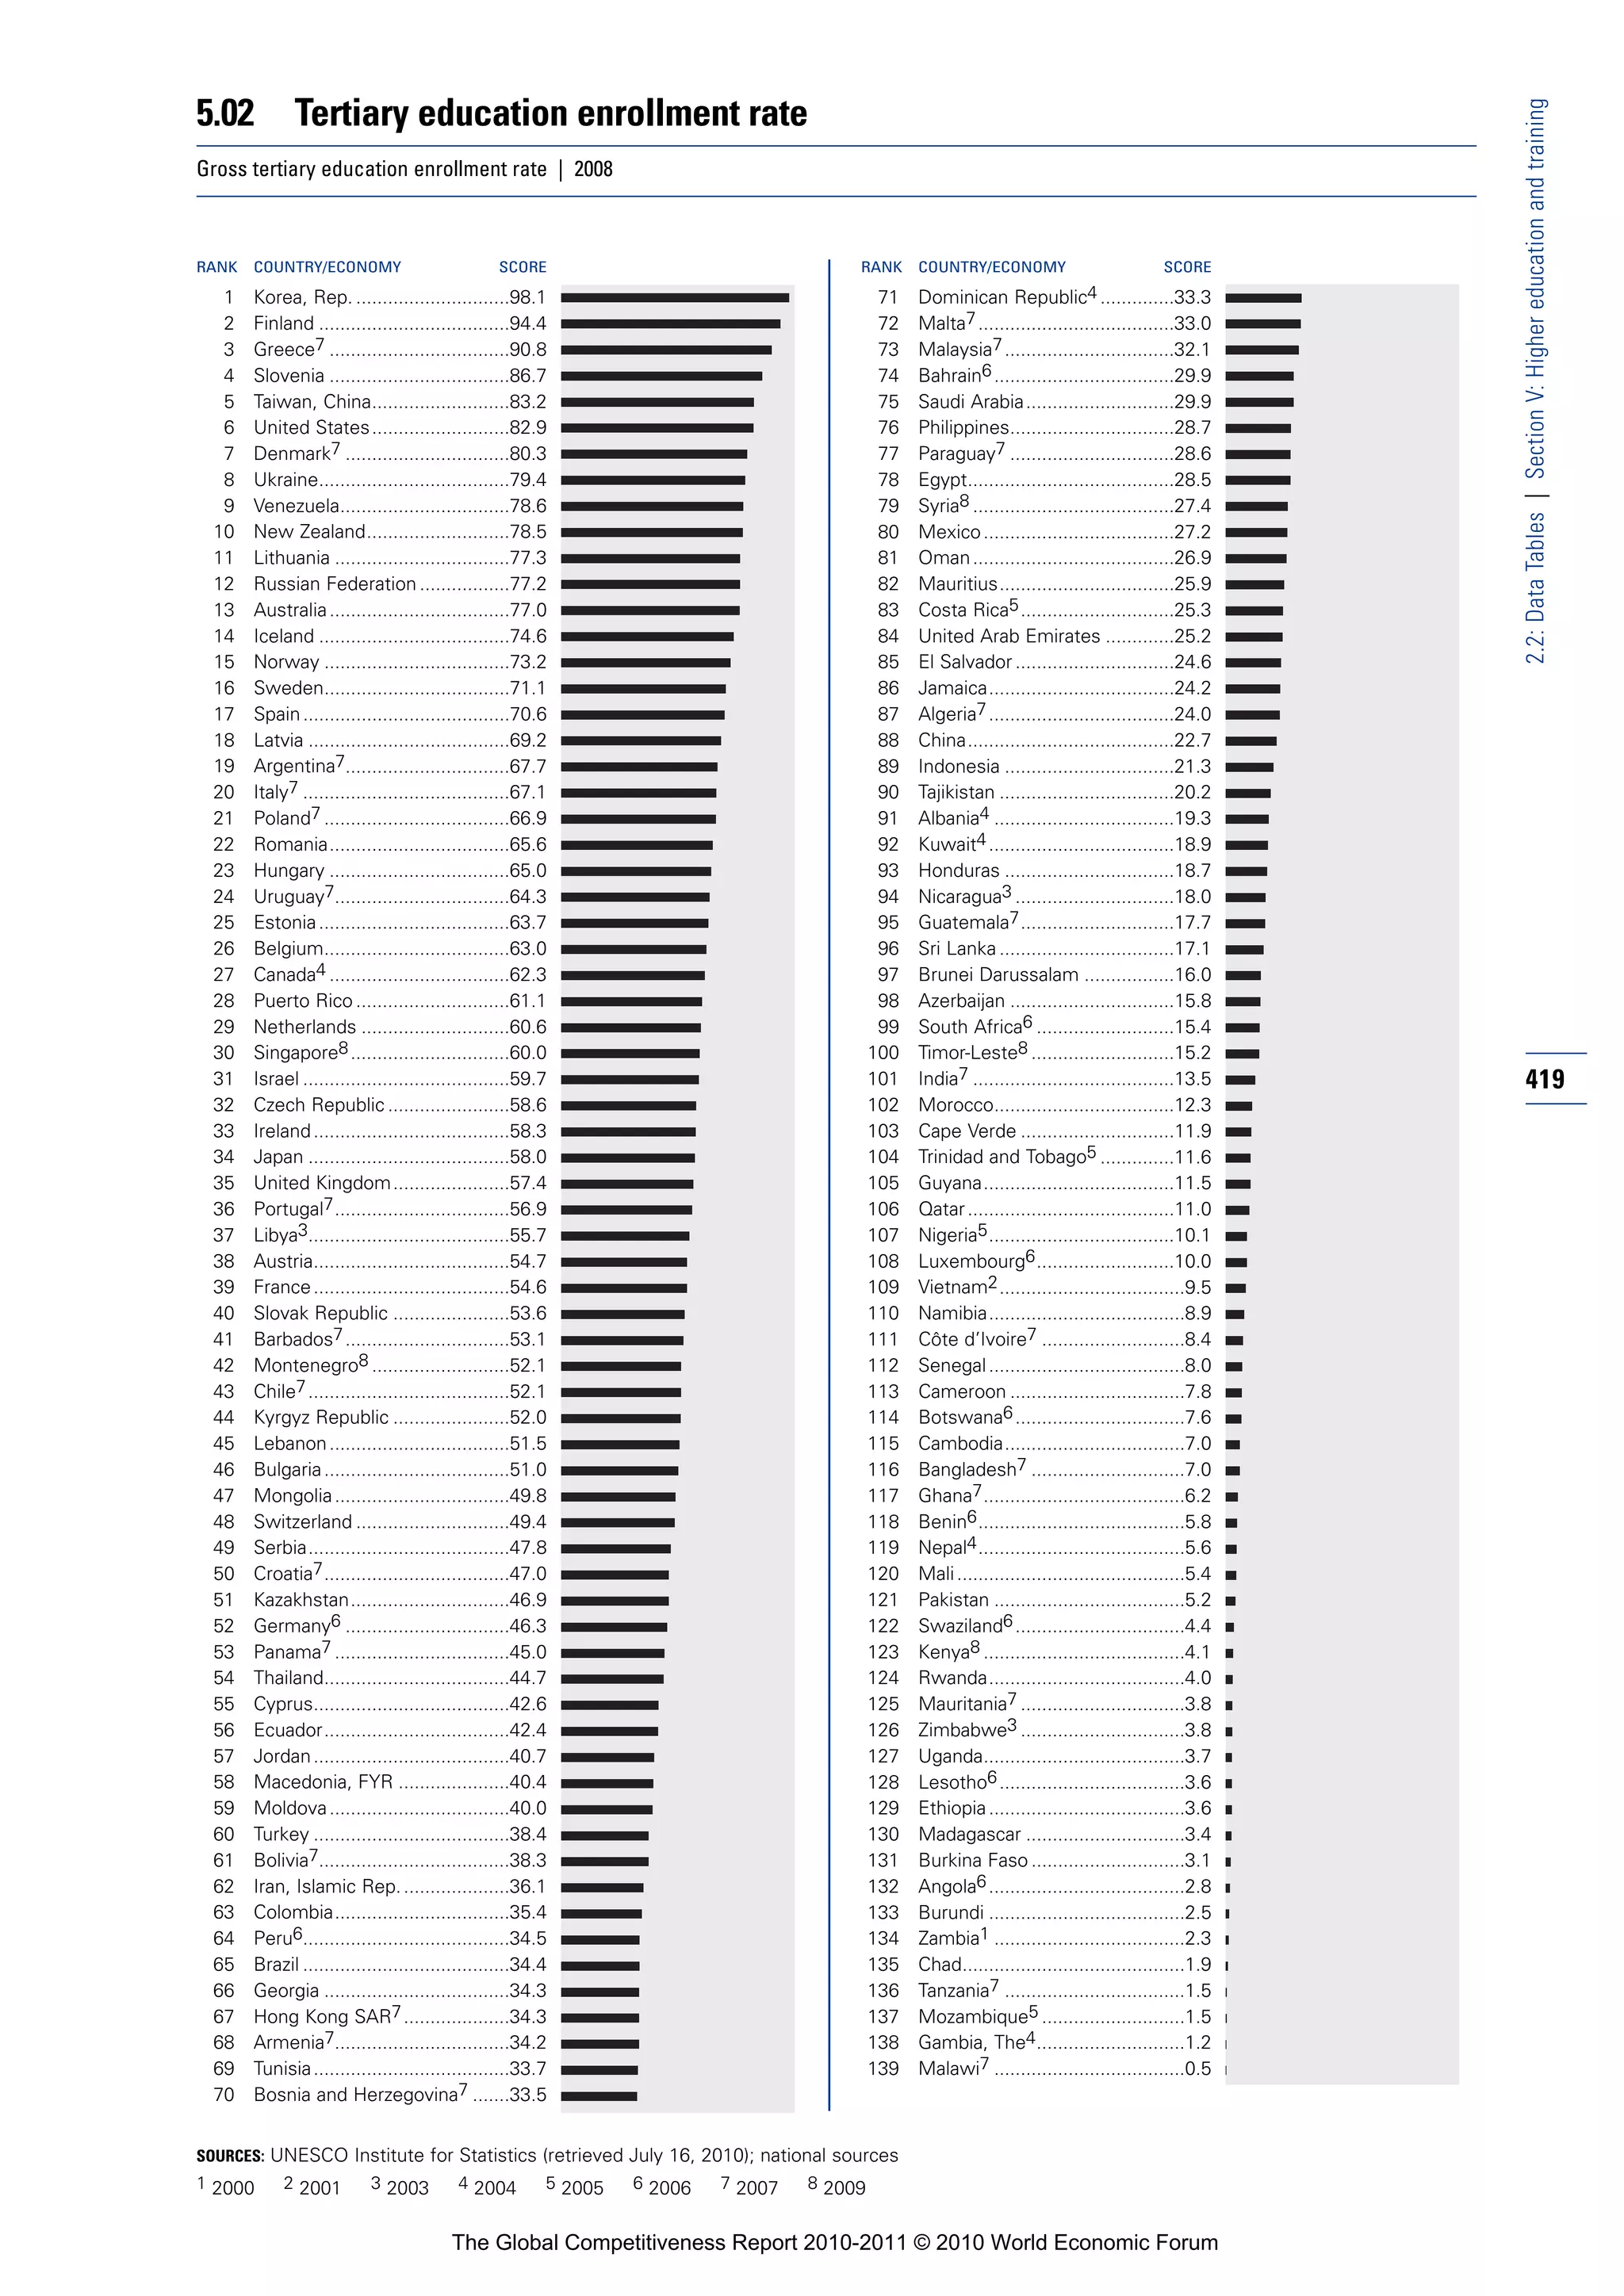
![5.03 Quality of the educational system
2.2: Data Tables | Section V: Higher education and training
How well does the educational system in your country meet the needs of a competitive economy? [1 = not well at all; 7 = very well] | 2009–10
weighted average
RANK COUNTRY/ECONOMY SCORE 1 MEAN: 3.8 7 RANK COUNTRY/ECONOMY SCORE 1 MEAN: 3.8 7
1 Singapore ..............................6.1 71 Ghana ....................................3.7
2 Switzerland ............................6.0 72 Uganda ..................................3.6
3 Iceland ...................................5.9 73 Senegal..................................3.6
4 Qatar......................................5.7 74 Israel......................................3.6
5 Canada...................................5.7 75 Hungary .................................3.6
6 Finland ...................................5.6 76 Portugal .................................3.6
7 Belgium .................................5.5 77 Lesotho .................................3.6
8 Sweden .................................5.4 78 Russian Federation................3.6
9 New Zealand .........................5.4 79 Cameroon..............................3.5
10 Denmark ................................5.3 80 Colombia ...............................3.5
11 Ireland....................................5.3 81 Mozambique..........................3.5
12 Australia.................................5.2 82 Cambodia ..............................3.4
13 Cyprus ...................................5.1 83 Italy........................................3.4
14 Netherlands ...........................5.1 84 Romania ................................3.4
15 Barbados ...............................5.0 85 Bulgaria..................................3.4
16 Lebanon.................................5.0 86 Serbia ....................................3.3
17 Taiwan, China ........................5.0 87 Pakistan .................................3.3
18 Germany ................................5.0 88 Kuwait ...................................3.3
19 Norway ..................................5.0 89 Croatia ...................................3.3
20 Tunisia....................................5.0 90 Argentina ...............................3.3
21 Malta .....................................4.9 91 Kyrgyz Republic .....................3.3
22 Costa Rica .............................4.9 92 Madagascar ...........................3.3
23 Malaysia ................................4.9 93 Kazakhstan ............................3.3
24 Austria ...................................4.9 94 Bangladesh............................3.3
25 Hong Kong SAR ....................4.8 95 Turkey ....................................3.2
26 United States.........................4.8 96 Moldova.................................3.2
27 United Arab Emirates ............4.7 97 Chad ......................................3.2
28 United Kingdom.....................4.7 98 Jamaica .................................3.2
29 France....................................4.7 99 Tanzania .................................3.2
30 Trinidad and Tobago...............4.6 100 Chile ......................................3.2
420 31 Brunei Darussalam ................4.5 101 Swaziland ..............................3.2
32 Kenya.....................................4.5 102 Bosnia and Herzegovina........3.1
33 Gambia, The ..........................4.5 103 Brazil ......................................3.1
34 Czech Republic......................4.5 104 Azerbaijan ..............................3.1
35 Japan .....................................4.5 105 Morocco ................................3.1
36 Luxembourg ..........................4.4 106 Côte d’Ivoire ..........................3.1
37 Montenegro...........................4.4 107 Spain......................................3.1
38 Bahrain ..................................4.4 108 Iran, Islamic Rep....................3.1
39 India.......................................4.3 109 Syria.......................................3.1
40 Indonesia ...............................4.3 110 Bolivia ....................................3.1
41 Saudi Arabia...........................4.3 111 Slovak Republic .....................3.1
42 Estonia...................................4.3 112 Namibia .................................3.0
43 Oman.....................................4.2 113 Tajikistan ................................3.0
44 Sri Lanka................................4.2 114 Timor-Leste............................3.0
45 Benin .....................................4.2 115 Armenia .................................3.0
46 Zimbabwe..............................4.2 116 Nepal .....................................3.0
47 Slovenia .................................4.2 117 Algeria ...................................2.9
48 Botswana ..............................4.1 118 Greece...................................2.9
49 Malawi ...................................4.0 119 Georgia ..................................2.9
50 Mauritius ...............................4.0 120 Mexico...................................2.9
51 Puerto Rico............................4.0 121 El Salvador.............................2.9
52 Zambia...................................4.0 122 Ecuador .................................2.8
53 China .....................................4.0 123 Honduras ...............................2.8
54 Albania...................................3.9 124 Peru .......................................2.7
55 Jordan....................................3.9 125 Mali........................................2.7
56 Ukraine ..................................3.9 126 Guatemala .............................2.6
57 Korea, Rep.............................3.9 127 Venezuela ..............................2.6
58 Rwanda .................................3.9 128 Panama..................................2.6
59 Macedonia, FYR ....................3.9 129 Burkina Faso..........................2.5
60 Ethiopia..................................3.8 130 South Africa...........................2.5
61 Vietnam .................................3.8 131 Egypt .....................................2.5
62 Poland....................................3.8 132 Nicaragua...............................2.5
63 Nigeria ...................................3.8 133 Dominican Republic...............2.4
64 Latvia .....................................3.8 134 Burundi ..................................2.3
65 Cape Verde ............................3.8 135 Mauritania..............................2.3
66 Thailand .................................3.7 136 Mongolia................................2.2
67 Uruguay .................................3.7 137 Paraguay................................2.1
68 Guyana ..................................3.7 138 Libya ......................................2.0
69 Philippines .............................3.7 139 Angola ...................................2.0
70 Lithuania ................................3.7
SOURCE: World Economic Forum, Executive Opinion Survey
The Global Competitiveness Report 2010-2011 © 2010 World Economic Forum](https://image.slidesharecdn.com/globalcompetitivenessreportwef2010-11-100928142139-phpapp02/75/Global-competitiveness-report-wef-2010-11-433-2048.jpg)
![5.04 Quality of math and science education
2.2: Data Tables | Section V: Higher education and training
How would you assess the quality of math and science education in your country’s schools? [1 = poor; 7 = excellent – among the best in the
world] | 2009–10 weighted average
RANK COUNTRY/ECONOMY SCORE 1 MEAN: 4.0 7 RANK COUNTRY/ECONOMY SCORE 1 MEAN: 4.0 7
1 Singapore ..............................6.5 71 Guyana ..................................3.9
2 Belgium .................................6.2 72 Senegal..................................3.9
3 Finland ...................................6.2 73 Mongolia................................3.8
4 Qatar......................................5.9 74 Armenia .................................3.8
5 Switzerland ............................5.8 75 Moldova.................................3.8
6 Taiwan, China ........................5.7 76 Zimbabwe..............................3.8
7 Lebanon.................................5.6 77 Zambia...................................3.8
8 Tunisia....................................5.6 78 Kazakhstan ............................3.8
9 New Zealand .........................5.5 79 Botswana ..............................3.7
10 Canada...................................5.4 80 Malawi ...................................3.7
11 France....................................5.4 81 Cameroon..............................3.7
12 Hong Kong SAR ....................5.4 82 Italy........................................3.6
13 Barbados ...............................5.3 83 Côte d’Ivoire ..........................3.6
14 Iceland ...................................5.3 84 Algeria ...................................3.6
15 Netherlands ...........................5.2 85 Madagascar ...........................3.6
16 Cyprus ...................................5.2 86 Gambia, The ..........................3.6
17 Slovenia .................................5.2 87 Burkina Faso..........................3.6
18 Korea, Rep.............................5.1 88 Kyrgyz Republic .....................3.6
19 Denmark ................................5.1 89 Kuwait ...................................3.5
20 Sweden .................................5.0 90 Pakistan .................................3.5
21 Estonia...................................4.9 91 Swaziland ..............................3.5
22 Croatia ...................................4.9 92 Uruguay .................................3.5
23 Malta .....................................4.9 93 Colombia ...............................3.5
24 Australia.................................4.9 94 Ethiopia..................................3.5
25 Czech Republic......................4.9 95 Israel......................................3.5
26 United Arab Emirates ............4.9 96 Puerto Rico............................3.5
27 Brunei Darussalam ................4.9 97 Cape Verde ............................3.4
28 Japan .....................................4.9 98 Ghana ....................................3.4
29 Lithuania ................................4.9 99 Turkey ....................................3.4
30 Hungary .................................4.8 100 Lesotho .................................3.4
31 Malaysia ................................4.8 101 Azerbaijan ..............................3.3 421
32 Trinidad and Tobago...............4.8 102 Uganda ..................................3.3
33 China .....................................4.7 103 Chad ......................................3.3
34 Ireland....................................4.7 104 Georgia ..................................3.2
35 Montenegro...........................4.7 105 Bangladesh............................3.2
36 Bosnia and Herzegovina........4.7 106 Argentina ...............................3.2
37 Austria ...................................4.7 107 Mauritania..............................3.2
38 India.......................................4.7 108 Portugal .................................3.2
39 Germany ................................4.7 109 Nepal .....................................3.2
40 Poland....................................4.6 110 Burundi ..................................3.1
41 Iran, Islamic Rep....................4.6 111 Cambodia ..............................3.1
42 Ukraine ..................................4.6 112 Philippines .............................3.1
43 Romania ................................4.6 113 Libya ......................................3.1
44 Bahrain ..................................4.5 114 Spain......................................3.1
45 Luxembourg ..........................4.5 115 Jamaica .................................2.9
46 Indonesia ...............................4.5 116 Venezuela ..............................2.9
47 Sri Lanka................................4.5 117 Ecuador .................................2.9
48 Serbia ....................................4.5 118 Mozambique..........................2.9
49 Saudi Arabia...........................4.5 119 Nigeria ...................................2.9
50 Costa Rica .............................4.4 120 Namibia .................................2.8
51 Vietnam .................................4.4 121 Bolivia ....................................2.8
52 United States.........................4.4 122 Tajikistan ................................2.8
53 Jordan....................................4.4 123 Chile ......................................2.8
54 Russian Federation................4.4 124 El Salvador.............................2.7
55 United Kingdom.....................4.4 125 Egypt .....................................2.7
56 Greece...................................4.3 126 Brazil ......................................2.7
57 Thailand .................................4.3 127 Tanzania .................................2.7
58 Oman.....................................4.2 128 Mexico...................................2.6
59 Latvia .....................................4.2 129 Panama..................................2.6
60 Benin .....................................4.2 130 Honduras ...............................2.6
61 Macedonia, FYR ....................4.2 131 Guatemala .............................2.6
62 Albania...................................4.2 132 Nicaragua...............................2.5
63 Kenya.....................................4.2 133 Peru .......................................2.5
64 Norway ..................................4.1 134 Mali........................................2.4
65 Slovak Republic .....................4.1 135 Paraguay................................2.1
66 Rwanda .................................4.1 136 Dominican Republic...............2.0
67 Morocco ................................4.0 137 South Africa...........................2.0
68 Mauritius ...............................4.0 138 Timor-Leste............................2.0
69 Bulgaria..................................4.0 139 Angola ...................................1.6
70 Syria.......................................3.9
SOURCE: World Economic Forum, Executive Opinion Survey
The Global Competitiveness Report 2010-2011 © 2010 World Economic Forum](https://image.slidesharecdn.com/globalcompetitivenessreportwef2010-11-100928142139-phpapp02/75/Global-competitiveness-report-wef-2010-11-434-2048.jpg)
![5.05 Quality of management schools
2.2: Data Tables | Section V: Higher education and training
How would you assess the quality of management or business schools in your country? [1 = poor; 7 = excellent – among the best in the world] |
2009–10 weighted average
RANK COUNTRY/ECONOMY SCORE 1 MEAN: 4.2 7 RANK COUNTRY/ECONOMY SCORE 1 MEAN: 4.2 7
1 Qatar......................................6.1 71 Hungary .................................4.1
2 Switzerland ............................6.1 72 Zimbabwe..............................4.1
3 Canada...................................6.0 73 Brazil ......................................4.1
4 Belgium .................................6.0 74 Cameroon..............................4.0
5 France....................................5.7 75 Macedonia, FYR ....................4.0
6 Singapore ..............................5.7 76 Guyana ..................................4.0
7 Sweden .................................5.6 77 Madagascar ...........................4.0
8 Spain......................................5.6 78 Zambia...................................4.0
9 Iceland ...................................5.6 79 El Salvador.............................4.0
10 United Kingdom.....................5.5 80 Pakistan .................................4.0
11 United States.........................5.5 81 Oman.....................................4.0
12 Netherlands ...........................5.5 82 Bosnia and Herzegovina........3.9
13 Costa Rica .............................5.5 83 Jordan....................................3.9
14 Denmark ................................5.4 84 Uganda ..................................3.9
15 Chile ......................................5.3 85 Albania...................................3.8
16 Argentina ...............................5.3 86 Bangladesh............................3.8
17 Australia.................................5.3 87 Iran, Islamic Rep....................3.8
18 Finland ...................................5.3 88 Croatia ...................................3.8
19 Norway ..................................5.2 89 Burkina Faso..........................3.8
20 Lebanon.................................5.1 90 Mauritius ...............................3.8
21 South Africa...........................5.1 91 Algeria ...................................3.8
22 Tunisia....................................5.1 92 Russian Federation................3.8
23 India.......................................5.1 93 Dominican Republic...............3.7
24 Hong Kong SAR ....................5.1 94 Bulgaria..................................3.7
25 New Zealand .........................5.0 95 Kuwait ...................................3.7
26 Ireland....................................5.0 96 Malawi ...................................3.7
27 Taiwan, China ........................5.0 97 Greece...................................3.7
28 United Arab Emirates ............5.0 98 Romania ................................3.7
29 Barbados ...............................5.0 99 Nigeria ...................................3.7
30 Cyprus ...................................4.9 100 Côte d’Ivoire ..........................3.7
422 31 Germany ................................4.9 101 Serbia ....................................3.6
32 Portugal .................................4.9 102 Rwanda .................................3.6
33 Austria ...................................4.9 103 Ecuador .................................3.6
34 Trinidad and Tobago...............4.9 104 Kazakhstan ............................3.6
35 Malaysia ................................4.7 105 Turkey ....................................3.6
36 Malta .....................................4.7 106 Ethiopia..................................3.6
37 Sri Lanka................................4.7 107 Vietnam .................................3.5
38 Italy ........................................4.7 108 Ukraine ..................................3.5
39 Uruguay .................................4.7 109 Panama..................................3.5
40 Senegal..................................4.6 110 Honduras ...............................3.5
41 Estonia...................................4.6 111 Lesotho .................................3.5
42 Peru .......................................4.6 112 Nicaragua...............................3.5
43 Guatemala .............................4.6 113 Botswana ..............................3.5
44 Slovenia .................................4.6 114 Slovak Republic .....................3.4
45 Bahrain ..................................4.6 115 Syria.......................................3.4
46 Israel ......................................4.6 116 Georgia ..................................3.4
47 Korea, Rep.............................4.5 117 Mozambique..........................3.3
48 Montenegro...........................4.5 118 Cambodia ..............................3.3
49 Morocco ................................4.5 119 Bolivia ....................................3.3
50 Benin .....................................4.5 120 Chad ......................................3.3
51 Kenya.....................................4.5 121 Cape Verde ............................3.3
52 Mexico...................................4.5 122 Egypt .....................................3.3
53 Gambia, The ..........................4.5 123 Moldova.................................3.3
54 Puerto Rico............................4.4 124 Azerbaijan ..............................3.2
55 Indonesia ...............................4.4 125 Nepal .....................................3.2
56 Czech Republic......................4.4 126 Mali........................................3.1
57 Venezuela ..............................4.4 127 Namibia .................................3.1
58 Thailand .................................4.4 128 Tanzania .................................3.0
59 Colombia ...............................4.3 129 Kyrgyz Republic .....................3.0
60 Saudi Arabia...........................4.3 130 Armenia .................................2.9
61 Philippines .............................4.3 131 Burundi ..................................2.9
62 Poland....................................4.2 132 Paraguay................................2.9
63 China .....................................4.2 133 Tajikistan ................................2.8
64 Ghana ....................................4.2 134 Swaziland ..............................2.7
65 Japan .....................................4.2 135 Mongolia................................2.7
66 Luxembourg ..........................4.2 136 Mauritania..............................2.4
67 Latvia .....................................4.2 137 Libya ......................................2.2
68 Lithuania ................................4.2 138 Timor-Leste............................2.2
69 Brunei Darussalam ................4.1 139 Angola ...................................1.8
70 Jamaica .................................4.1
SOURCE: World Economic Forum, Executive Opinion Survey
The Global Competitiveness Report 2010-2011 © 2010 World Economic Forum](https://image.slidesharecdn.com/globalcompetitivenessreportwef2010-11-100928142139-phpapp02/75/Global-competitiveness-report-wef-2010-11-435-2048.jpg)
![5.06 Internet access in schools
2.2: Data Tables | Section V: Higher education and training
How would you rate the level of access to the Internet in schools in your country? [1 = very limited; 7 = extensive] | 2009–10 weighted average
RANK COUNTRY/ECONOMY SCORE 1 MEAN: 4.1 7 RANK COUNTRY/ECONOMY SCORE 1 MEAN: 4.1 7
1 Iceland ...................................6.8 71 Bosnia and Herzegovina........3.8
2 Estonia...................................6.4 72 Brazil ......................................3.8
3 Sweden .................................6.4 73 Mauritius ...............................3.7
4 Qatar......................................6.3 74 Georgia ..................................3.7
5 Singapore ..............................6.2 75 Panama..................................3.7
6 Netherlands ...........................6.2 76 Philippines .............................3.7
7 Switzerland ............................6.2 77 Azerbaijan ..............................3.7
8 Taiwan, China ........................6.1 78 Gambia, The ..........................3.7
9 Hong Kong SAR ....................6.1 79 Lebanon.................................3.7
10 Denmark ................................6.1 80 Jamaica .................................3.6
11 Finland ...................................6.1 81 Greece...................................3.6
12 Korea, Rep.............................6.0 82 Sri Lanka................................3.6
13 Canada...................................6.0 83 Morocco ................................3.6
14 United States.........................5.9 84 Pakistan .................................3.6
15 Norway ..................................5.9 85 Italy........................................3.6
16 Austria ...................................5.8 86 Mongolia................................3.6
17 Malta .....................................5.8 87 Serbia ....................................3.5
18 United Kingdom.....................5.8 88 Colombia ...............................3.5
19 Luxembourg ..........................5.8 89 Mexico...................................3.5
20 Belgium .................................5.8 90 Cape Verde ............................3.4
21 New Zealand .........................5.8 91 Kenya.....................................3.4
22 China .....................................5.7 92 Dominican Republic...............3.3
23 Slovenia .................................5.7 93 Rwanda .................................3.3
24 Czech Republic......................5.7 94 Botswana ..............................3.3
25 Portugal .................................5.6 95 Tajikistan ................................3.3
26 Uruguay .................................5.5 96 Egypt .....................................3.3
27 Lithuania ................................5.5 97 Kyrgyz Republic .....................3.2
28 Australia.................................5.5 98 Honduras ...............................3.2
29 United Arab Emirates ............5.4 99 Nigeria ...................................3.2
30 Latvia .....................................5.4 100 South Africa...........................3.2
31 Hungary .................................5.4 101 Benin .....................................3.1 423
32 Bahrain ..................................5.3 102 Venezuela ..............................3.1
33 Israel ......................................5.2 103 Namibia .................................3.1
34 Barbados ...............................5.0 104 Ghana ....................................3.1
35 Slovak Republic .....................5.0 105 El Salvador.............................3.0
36 Malaysia ................................5.0 106 Guatemala .............................3.0
37 Cyprus ...................................4.9 107 Armenia .................................3.0
38 Brunei Darussalam ................4.9 108 Guyana ..................................3.0
39 Germany ................................4.9 109 Ecuador .................................3.0
40 Japan .....................................4.9 110 Cambodia ..............................3.0
41 France....................................4.8 111 Argentina ...............................3.0
42 Chile ......................................4.7 112 Nepal .....................................2.8
43 Thailand .................................4.7 113 Zambia...................................2.8
44 Croatia ...................................4.7 114 Iran, Islamic Rep....................2.8
45 Bulgaria..................................4.6 115 Uganda ..................................2.8
46 Oman.....................................4.6 116 Swaziland ..............................2.8
47 Tunisia....................................4.5 117 Mali........................................2.8
48 Poland....................................4.5 118 Madagascar ...........................2.7
49 Vietnam .................................4.5 119 Nicaragua...............................2.7
50 Indonesia ...............................4.5 120 Mozambique..........................2.6
51 Jordan....................................4.4 121 Bolivia ....................................2.6
52 Saudi Arabia...........................4.4 122 Cameroon..............................2.6
53 Spain......................................4.4 123 Tanzania .................................2.6
54 Macedonia, FYR ....................4.4 124 Côte d’Ivoire ..........................2.6
55 Romania ................................4.3 125 Algeria ...................................2.5
56 Montenegro...........................4.3 126 Malawi ...................................2.5
57 Turkey ....................................4.3 127 Ethiopia..................................2.4
58 Ireland....................................4.2 128 Zimbabwe..............................2.3
59 Puerto Rico............................4.2 129 Libya ......................................2.3
60 Senegal..................................4.2 130 Mauritania..............................2.2
61 Moldova.................................4.1 131 Syria.......................................2.1
62 Russian Federation................4.1 132 Lesotho .................................2.1
63 Kazakhstan ............................4.1 133 Bangladesh............................2.1
64 Costa Rica .............................4.1 134 Timor-Leste............................2.0
65 Trinidad and Tobago...............4.0 135 Paraguay................................2.0
66 Peru .......................................3.9 136 Burkina Faso..........................1.9
67 Kuwait ...................................3.9 137 Angola ...................................1.8
68 Ukraine ..................................3.8 138 Chad ......................................1.6
69 Albania...................................3.8 139 Burundi ..................................1.6
70 India.......................................3.8
SOURCE: World Economic Forum, Executive Opinion Survey
The Global Competitiveness Report 2010-2011 © 2010 World Economic Forum](https://image.slidesharecdn.com/globalcompetitivenessreportwef2010-11-100928142139-phpapp02/75/Global-competitiveness-report-wef-2010-11-436-2048.jpg)
![5.07 Local availability of specialized research and training services
2.2: Data Tables | Section V: Higher education and training
In your country, to what extent are high-quality, specialized training services available? [1 = not available; 7 = widely available] | 2009–10
weighted average
RANK COUNTRY/ECONOMY SCORE 1 MEAN: 4.1 7 RANK COUNTRY/ECONOMY SCORE 1 MEAN: 4.1 7
1 Switzerland ............................6.5 71 Qatar......................................4.1
2 Germany ................................6.2 72 Gambia, The ..........................4.0
3 Sweden .................................6.1 73 Peru .......................................4.0
4 Netherlands ...........................6.0 74 Iran, Islamic Rep....................4.0
5 France....................................5.9 75 Kuwait ...................................4.0
6 Austria ...................................5.9 76 Kazakhstan ............................4.0
7 Finland ...................................5.8 77 Philippines .............................4.0
8 Denmark ................................5.8 78 Dominican Republic...............3.9
9 Belgium .................................5.8 79 Montenegro...........................3.9
10 United States.........................5.8 80 Bulgaria..................................3.9
11 Canada...................................5.7 81 Bahrain ..................................3.9
12 United Kingdom.....................5.7 82 Benin .....................................3.9
13 Japan .....................................5.6 83 El Salvador.............................3.9
14 Norway ..................................5.5 84 Ukraine ..................................3.9
15 Hong Kong SAR ....................5.4 85 Oman.....................................3.8
16 Iceland ...................................5.4 86 Zambia...................................3.8
17 Czech Republic......................5.4 87 Mauritius ...............................3.8
18 Puerto Rico............................5.3 88 Greece...................................3.7
19 Singapore ..............................5.3 89 Honduras ...............................3.7
20 Australia.................................5.3 90 Nigeria ...................................3.7
21 Taiwan, China ........................5.2 91 Burkina Faso..........................3.7
22 Poland....................................5.1 92 Malawi ...................................3.7
23 United Arab Emirates ............5.1 93 Moldova.................................3.6
24 Ireland....................................5.0 94 Albania...................................3.6
25 Malaysia ................................5.0 95 Romania ................................3.5
26 Spain......................................5.0 96 Cameroon..............................3.5
27 Tunisia....................................5.0 97 Pakistan .................................3.5
28 Luxembourg ..........................4.9 98 Ghana ....................................3.5
29 New Zealand .........................4.9 99 Jamaica .................................3.5
30 Israel ......................................4.9 100 Serbia ....................................3.5
424 31 Chile ......................................4.9 101 Uganda ..................................3.4
32 Costa Rica .............................4.9 102 Macedonia, FYR ....................3.4
33 Estonia...................................4.8 103 Ecuador .................................3.4
34 Saudi Arabia...........................4.7 104 Vietnam .................................3.4
35 Slovenia .................................4.7 105 Algeria ...................................3.4
36 Brazil ......................................4.7 106 Guyana ..................................3.4
37 Italy ........................................4.7 107 Tanzania .................................3.4
38 Lithuania ................................4.6 108 Botswana ..............................3.4
39 Korea, Rep.............................4.6 109 Zimbabwe..............................3.3
40 Portugal .................................4.6 110 Madagascar ...........................3.3
41 Slovak Republic .....................4.6 111 Cambodia ..............................3.3
42 Argentina ...............................4.5 112 Bolivia ....................................3.3
43 Cyprus ...................................4.5 113 Mali........................................3.3
44 Malta .....................................4.5 114 Syria.......................................3.3
45 Senegal..................................4.5 115 Brunei Darussalam ................3.2
46 Sri Lanka................................4.4 116 Namibia .................................3.2
47 Hungary .................................4.4 117 Lesotho .................................3.2
48 Jordan....................................4.4 118 Rwanda .................................3.2
49 South Africa...........................4.4 119 Nicaragua...............................3.1
50 China .....................................4.4 120 Kyrgyz Republic .....................3.1
51 India.......................................4.4 121 Tajikistan ................................3.1
52 Indonesia ...............................4.4 122 Ethiopia..................................3.1
53 Lebanon.................................4.4 123 Venezuela ..............................3.0
54 Guatemala .............................4.4 124 Armenia .................................3.0
55 Mexico...................................4.3 125 Georgia ..................................3.0
56 Kenya.....................................4.3 126 Mozambique..........................3.0
57 Uruguay .................................4.3 127 Bangladesh............................3.0
58 Turkey ....................................4.2 128 Bosnia and Herzegovina........3.0
59 Trinidad and Tobago...............4.2 129 Cape Verde ............................2.9
60 Morocco ................................4.2 130 Paraguay................................2.9
61 Croatia ...................................4.2 131 Chad ......................................2.9
62 Panama..................................4.2 132 Nepal .....................................2.7
63 Côte d’Ivoire ..........................4.2 133 Angola ...................................2.7
64 Egypt .....................................4.1 134 Libya ......................................2.7
65 Colombia ...............................4.1 135 Mauritania..............................2.6
66 Azerbaijan ..............................4.1 136 Timor-Leste............................2.6
67 Russian Federation................4.1 137 Swaziland ..............................2.3
68 Latvia .....................................4.1 138 Burundi ..................................2.2
69 Thailand .................................4.1 139 Mongolia................................1.9
70 Barbados ...............................4.1
SOURCE: World Economic Forum, Executive Opinion Survey
The Global Competitiveness Report 2010-2011 © 2010 World Economic Forum](https://image.slidesharecdn.com/globalcompetitivenessreportwef2010-11-100928142139-phpapp02/75/Global-competitiveness-report-wef-2010-11-437-2048.jpg)
![5.08 Extent of staff training
2.2: Data Tables | Section V: Higher education and training
To what extent do companies in your country invest in training and employee development? [1 = hardly at all; 7 = to a great extent] | 2009–10
weighted average
RANK COUNTRY/ECONOMY SCORE 1 MEAN: 4.0 7 RANK COUNTRY/ECONOMY SCORE 1 MEAN: 4.0 7
1 Sweden .................................5.7 71 Zimbabwe..............................3.9
2 Switzerland ............................5.5 72 Romania ................................3.9
3 Norway ..................................5.5 73 Portugal .................................3.9
4 Singapore ..............................5.5 74 Nigeria ...................................3.9
5 Luxembourg ..........................5.4 75 Slovak Republic .....................3.9
6 Japan .....................................5.4 76 Latvia .....................................3.9
7 Denmark ................................5.4 77 Ghana ....................................3.8
8 Germany ................................5.2 78 Peru .......................................3.8
9 Finland ...................................5.2 79 Argentina ...............................3.8
10 United States.........................5.1 80 Honduras ...............................3.8
11 Netherlands ...........................5.1 81 Zambia...................................3.8
12 Canada...................................5.0 82 Mongolia................................3.8
13 Malaysia ................................5.0 83 Lesotho .................................3.8
14 Austria ...................................4.9 84 Mexico...................................3.8
15 Belgium .................................4.9 85 Turkey ....................................3.7
16 Bahrain ..................................4.9 86 Uruguay .................................3.7
17 Puerto Rico............................4.9 87 Morocco ................................3.7
18 Tunisia....................................4.8 88 Hungary .................................3.7
19 Qatar......................................4.8 89 Spain......................................3.7
20 Australia.................................4.8 90 Russian Federation................3.7
21 New Zealand .........................4.8 91 Venezuela ..............................3.7
22 Costa Rica .............................4.8 92 Cambodia ..............................3.7
23 Ireland....................................4.7 93 Cameroon..............................3.7
24 Iceland ...................................4.7 94 Dominican Republic...............3.6
25 Israel ......................................4.7 95 Nicaragua...............................3.6
26 South Africa...........................4.7 96 Kuwait ...................................3.6
27 Hong Kong SAR ....................4.7 97 Swaziland ..............................3.6
28 United Kingdom.....................4.7 98 Kazakhstan ............................3.6
29 United Arab Emirates ............4.7 99 Colombia ...............................3.6
30 France....................................4.7 100 Uganda ..................................3.6
31 Taiwan, China ........................4.7 101 Jordan....................................3.6 425
32 Gambia, The ..........................4.4 102 Lebanon.................................3.5
33 Chile ......................................4.4 103 Algeria ...................................3.5
34 Saudi Arabia...........................4.4 104 Benin .....................................3.5
35 Cyprus ...................................4.4 105 Greece...................................3.5
36 Indonesia ...............................4.4 106 Tanzania .................................3.4
37 Sri Lanka................................4.4 107 Ecuador .................................3.4
38 Rwanda .................................4.4 108 Georgia ..................................3.4
39 Angola ...................................4.4 109 Ukraine ..................................3.4
40 Czech Republic......................4.4 110 Libya ......................................3.4
41 Mauritius ...............................4.4 111 Mozambique..........................3.4
42 Korea, Rep.............................4.4 112 Egypt .....................................3.3
43 Barbados ...............................4.3 113 Senegal..................................3.3
44 Côte d’Ivoire ..........................4.3 114 Madagascar ...........................3.3
45 Oman.....................................4.3 115 Pakistan .................................3.3
46 Philippines .............................4.3 116 Armenia .................................3.3
47 Malta .....................................4.3 117 Moldova.................................3.3
48 Estonia...................................4.3 118 Tajikistan ................................3.3
49 Jamaica .................................4.2 119 Macedonia, FYR ....................3.3
50 Panama..................................4.2 120 Cape Verde ............................3.3
51 Trinidad and Tobago...............4.2 121 Bolivia ....................................3.3
52 Poland....................................4.2 122 Ethiopia..................................3.2
53 Brazil ......................................4.2 123 Paraguay................................3.2
54 Botswana ..............................4.2 124 Kyrgyz Republic .....................3.2
55 Albania...................................4.2 125 Chad ......................................3.2
56 Guatemala .............................4.2 126 Timor-Leste............................3.2
57 China .....................................4.1 127 Italy........................................3.2
58 Vietnam .................................4.1 128 Croatia ...................................3.1
59 India.......................................4.1 129 Bangladesh............................3.1
60 Brunei Darussalam ................4.1 130 Serbia ....................................3.0
61 Guyana ..................................4.1 131 Mali........................................3.0
62 Thailand .................................4.1 132 Iran, Islamic Rep....................2.9
63 El Salvador.............................4.1 133 Burundi ..................................2.9
64 Lithuania ................................4.1 134 Burkina Faso..........................2.9
65 Slovenia .................................4.1 135 Bulgaria..................................2.8
66 Namibia .................................4.0 136 Bosnia and Herzegovina........2.7
67 Malawi ...................................4.0 137 Nepal .....................................2.7
68 Azerbaijan ..............................4.0 138 Mauritania..............................2.6
69 Montenegro...........................4.0 139 Syria.......................................2.5
70 Kenya.....................................3.9
SOURCE: World Economic Forum, Executive Opinion Survey
The Global Competitiveness Report 2010-2011 © 2010 World Economic Forum](https://image.slidesharecdn.com/globalcompetitivenessreportwef2010-11-100928142139-phpapp02/75/Global-competitiveness-report-wef-2010-11-438-2048.jpg)

![6.01 Intensity of local competition
2.2: Data Tables | Section VI: Goods market efficiency
How would you assess the intensity of competition in the local markets in your country? [1 = limited in most industries; 7 = intense in most
industries] | 2009–10 weighted average
RANK COUNTRY/ECONOMY SCORE 1 MEAN: 4.8 7 RANK COUNTRY/ECONOMY SCORE 1 MEAN: 4.8 7
1 Taiwan, China ........................6.1 71 Ghana ....................................4.8
2 Germany ................................6.1 72 Jamaica .................................4.8
3 Qatar......................................6.1 73 Mali........................................4.8
4 Belgium .................................5.9 74 Benin .....................................4.8
5 Sweden .................................5.9 75 Vietnam .................................4.8
6 Austria ...................................5.9 76 Côte d’Ivoire ..........................4.8
7 Japan .....................................5.8 77 Greece...................................4.7
8 United Kingdom.....................5.8 78 Lithuania ................................4.7
9 Malta .....................................5.8 79 Romania ................................4.7
10 Netherlands ...........................5.8 80 Barbados ...............................4.7
11 Australia.................................5.7 81 Bangladesh............................4.7
12 Czech Republic......................5.7 82 Colombia ...............................4.7
13 United Arab Emirates ............5.7 83 Malawi ...................................4.7
14 Korea, Rep.............................5.7 84 Italy........................................4.7
15 Turkey ....................................5.7 85 Zambia...................................4.6
16 United States.........................5.6 86 Dominican Republic...............4.6
17 France....................................5.6 87 Pakistan .................................4.6
18 Cyprus ...................................5.6 88 Namibia .................................4.6
19 China .....................................5.6 89 Botswana ..............................4.6
20 Canada...................................5.6 90 Gambia, The ..........................4.6
21 Lebanon.................................5.6 91 Egypt .....................................4.6
22 Israel ......................................5.6 92 Latvia .....................................4.6
23 Denmark ................................5.6 93 Algeria ...................................4.5
24 Saudi Arabia...........................5.6 94 Bulgaria..................................4.5
25 Chile ......................................5.5 95 Mongolia................................4.5
26 Spain......................................5.5 96 Macedonia, FYR ....................4.5
27 Norway ..................................5.5 97 Honduras ...............................4.5
28 Singapore ..............................5.5 98 Mexico...................................4.5
29 Puerto Rico............................5.5 99 Guyana ..................................4.5
30 India.......................................5.4 100 Rwanda .................................4.3
428 31 Estonia...................................5.4 101 Moldova.................................4.3
32 Hong Kong SAR ....................5.4 102 Swaziland ..............................4.3
33 Slovak Republic .....................5.4 103 Madagascar ...........................4.3
34 Tunisia....................................5.4 104 Tanzania .................................4.3
35 Poland....................................5.4 105 Uruguay .................................4.3
36 Switzerland ............................5.4 106 Cambodia ..............................4.3
37 Thailand .................................5.3 107 Argentina ...............................4.3
38 Malaysia ................................5.3 108 Nepal .....................................4.2
39 Hungary .................................5.3 109 Kazakhstan ............................4.2
40 Bahrain ..................................5.2 110 Lesotho .................................4.2
41 El Salvador.............................5.2 111 Ethiopia..................................4.2
42 Sri Lanka................................5.2 112 Iran, Islamic Rep....................4.2
43 Slovenia .................................5.2 113 Albania...................................4.2
44 Luxembourg ..........................5.2 114 Croatia ...................................4.2
45 Portugal .................................5.2 115 Russian Federation................4.1
46 Jordan....................................5.2 116 Ecuador .................................4.1
47 Trinidad and Tobago...............5.2 117 Paraguay................................4.1
48 Guatemala .............................5.2 118 Ukraine ..................................4.1
49 Senegal..................................5.1 119 Zimbabwe..............................4.1
50 Brazil ......................................5.1 120 Mozambique..........................4.0
51 Ireland....................................5.1 121 Cape Verde ............................4.0
52 Finland ...................................5.1 122 Montenegro...........................4.0
53 Oman.....................................5.1 123 Tajikistan ................................4.0
54 Indonesia ...............................5.1 124 Georgia ..................................3.9
55 Kenya.....................................5.1 125 Nicaragua...............................3.9
56 Mauritius ...............................5.1 126 Bolivia ....................................3.9
57 Cameroon..............................5.0 127 Angola ...................................3.9
58 Panama..................................5.0 128 Burkina Faso..........................3.9
59 Costa Rica .............................5.0 129 Kyrgyz Republic .....................3.8
60 Kuwait ...................................5.0 130 Libya ......................................3.8
61 Brunei Darussalam ................5.0 131 Serbia ....................................3.8
62 Nigeria ...................................5.0 132 Mauritania..............................3.8
63 South Africa...........................5.0 133 Bosnia and Herzegovina........3.7
64 New Zealand .........................5.0 134 Azerbaijan ..............................3.7
65 Philippines .............................4.9 135 Burundi ..................................3.6
66 Iceland ...................................4.9 136 Armenia .................................3.5
67 Uganda ..................................4.9 137 Timor-Leste............................3.5
68 Peru .......................................4.9 138 Venezuela ..............................3.2
69 Morocco ................................4.9 139 Chad ......................................3.1
70 Syria.......................................4.9
SOURCE: World Economic Forum, Executive Opinion Survey
The Global Competitiveness Report 2010-2011 © 2010 World Economic Forum](https://image.slidesharecdn.com/globalcompetitivenessreportwef2010-11-100928142139-phpapp02/75/Global-competitiveness-report-wef-2010-11-441-2048.jpg)
![6.02 Extent of market dominance
2.2: Data Tables | Section VI: Goods market efficiency
How would you characterize corporate activity in your country? [1 = dominated by a few business groups; 7 = spread among many firms] |
2009–10 weighted average
RANK COUNTRY/ECONOMY SCORE 1 MEAN: 3.8 7 RANK COUNTRY/ECONOMY SCORE 1 MEAN: 3.8 7
1 Germany ................................5.9 71 Lebanon.................................3.6
2 Japan .....................................5.9 72 Oman.....................................3.6
3 Switzerland ............................5.7 73 Tanzania .................................3.6
4 Taiwan, China ........................5.7 74 Brunei Darussalam ................3.6
5 Belgium .................................5.5 75 Cameroon..............................3.6
6 Netherlands ...........................5.4 76 Mali........................................3.5
7 Qatar......................................5.3 77 Zambia...................................3.5
8 Austria ...................................5.3 78 Chile ......................................3.5
9 United States.........................5.3 79 Guyana ..................................3.5
10 United Kingdom.....................5.2 80 Cambodia ..............................3.5
11 Australia.................................5.1 81 Chad ......................................3.5
12 Denmark ................................5.1 82 Ethiopia..................................3.5
13 Canada...................................5.0 83 Botswana ..............................3.4
14 Singapore ..............................5.0 84 Cape Verde ............................3.4
15 Czech Republic......................5.0 85 Macedonia, FYR ....................3.4
16 Italy ........................................4.9 86 Namibia .................................3.4
17 Tunisia....................................4.9 87 Bulgaria..................................3.4
18 Norway ..................................4.9 88 Russian Federation................3.4
19 Sweden .................................4.9 89 Rwanda .................................3.4
20 Puerto Rico............................4.8 90 Peru .......................................3.4
21 United Arab Emirates ............4.8 91 Kazakhstan ............................3.4
22 France....................................4.8 92 Swaziland ..............................3.3
23 China .....................................4.8 93 Jamaica .................................3.3
24 Benin .....................................4.8 94 Barbados ...............................3.3
25 Saudi Arabia...........................4.7 95 Egypt .....................................3.3
26 India.......................................4.7 96 Portugal .................................3.3
27 Finland ...................................4.7 97 Lithuania ................................3.3
28 Luxembourg ..........................4.6 98 Tajikistan ................................3.3
29 Costa Rica .............................4.6 99 El Salvador.............................3.3
30 Malaysia ................................4.6 100 Malawi ...................................3.3
31 Cyprus ...................................4.6 101 Trinidad and Tobago...............3.3 429
32 Spain......................................4.5 102 Moldova.................................3.3
33 Slovak Republic .....................4.5 103 Lesotho .................................3.3
34 Sri Lanka................................4.4 104 Argentina ...............................3.3
35 Gambia, The ..........................4.4 105 Bolivia ....................................3.2
36 Ireland....................................4.4 106 Azerbaijan ..............................3.2
37 Bahrain ..................................4.3 107 Iceland ...................................3.2
38 Estonia...................................4.2 108 Côte d’Ivoire ..........................3.2
39 Poland....................................4.2 109 Philippines .............................3.2
40 New Zealand .........................4.2 110 Paraguay................................3.2
41 Panama..................................4.2 111 Madagascar ...........................3.2
42 Indonesia ...............................4.2 112 Korea, Rep.............................3.2
43 South Africa...........................4.2 113 Georgia ..................................3.2
44 Ghana ....................................4.2 114 Mozambique..........................3.1
45 Turkey ....................................4.2 115 Bangladesh............................3.1
46 Brazil ......................................4.2 116 Mauritius ...............................3.1
47 Malta .....................................4.1 117 Israel......................................3.1
48 Vietnam .................................4.0 118 Burkina Faso..........................3.1
49 Kenya.....................................4.0 119 Syria.......................................3.1
50 Burundi ..................................4.0 120 Honduras ...............................3.1
51 Guatemala .............................4.0 121 Croatia ...................................3.0
52 Montenegro...........................3.9 122 Mauritania..............................3.0
53 Senegal..................................3.9 123 Timor-Leste............................3.0
54 Iran, Islamic Rep....................3.9 124 Colombia ...............................3.0
55 Algeria ...................................3.9 125 Uganda ..................................3.0
56 Uruguay .................................3.9 126 Kyrgyz Republic .....................2.9
57 Slovenia .................................3.9 127 Mexico...................................2.9
58 Jordan....................................3.9 128 Ukraine ..................................2.9
59 Romania ................................3.8 129 Nicaragua...............................2.8
60 Kuwait ...................................3.8 130 Angola ...................................2.8
61 Nigeria ...................................3.8 131 Dominican Republic...............2.8
62 Hungary .................................3.7 132 Ecuador .................................2.8
63 Albania...................................3.7 133 Armenia .................................2.8
64 Zimbabwe..............................3.7 134 Libya ......................................2.7
65 Pakistan .................................3.7 135 Venezuela ..............................2.7
66 Hong Kong SAR ....................3.7 136 Nepal .....................................2.6
67 Greece...................................3.7 137 Bosnia and Herzegovina........2.5
68 Morocco ................................3.7 138 Serbia ....................................2.5
69 Thailand .................................3.7 139 Mongolia................................2.2
70 Latvia .....................................3.7
SOURCE: World Economic Forum, Executive Opinion Survey
The Global Competitiveness Report 2010-2011 © 2010 World Economic Forum](https://image.slidesharecdn.com/globalcompetitivenessreportwef2010-11-100928142139-phpapp02/75/Global-competitiveness-report-wef-2010-11-442-2048.jpg)
![6.03 Effectiveness of anti-monopoly policy
2.2: Data Tables | Section VI: Goods market efficiency
To what extent does anti-monopoly policy promote competition in your country? [1 = does not promote competition; 7 = effectively promotes
competition] | 2009–10 weighted average
RANK COUNTRY/ECONOMY SCORE 1 MEAN: 4.1 7 RANK COUNTRY/ECONOMY SCORE 1 MEAN: 4.1 7
1 Sweden .................................5.8 71 Morocco ................................4.0
2 Netherlands ...........................5.8 72 Greece...................................4.0
3 Germany ................................5.5 73 Pakistan .................................3.9
4 Finland ...................................5.4 74 Cape Verde ............................3.9
5 New Zealand .........................5.4 75 Brunei Darussalam ................3.9
6 Denmark ................................5.4 76 Peru .......................................3.9
7 Japan .....................................5.4 77 Cameroon..............................3.9
8 United Kingdom.....................5.4 78 Latvia .....................................3.9
9 Singapore ..............................5.3 79 Cambodia ..............................3.9
10 France....................................5.3 80 Uganda ..................................3.8
11 Norway ..................................5.3 81 Trinidad and Tobago...............3.8
12 South Africa...........................5.2 82 Mauritania..............................3.8
13 Belgium .................................5.2 83 Botswana ..............................3.8
14 Canada...................................5.2 84 Montenegro...........................3.8
15 Australia.................................5.2 85 Romania ................................3.8
16 Austria ...................................5.1 86 Zimbabwe..............................3.8
17 United States.........................5.1 87 Kuwait ...................................3.8
18 Tunisia....................................5.0 88 Burkina Faso..........................3.8
19 Puerto Rico............................5.0 89 Côte d’Ivoire ..........................3.8
20 Luxembourg ..........................5.0 90 Colombia ...............................3.8
21 Taiwan, China ........................4.9 91 Algeria ...................................3.7
22 Chile ......................................4.9 92 Philippines .............................3.7
23 Switzerland ............................4.9 93 Italy........................................3.7
24 United Arab Emirates ............4.9 94 Macedonia, FYR ....................3.7
25 Ireland....................................4.8 95 Guyana ..................................3.7
26 Cyprus ...................................4.8 96 El Salvador.............................3.7
27 Bahrain ..................................4.8 97 Swaziland ..............................3.7
28 Saudi Arabia...........................4.8 98 Croatia ...................................3.6
29 India.......................................4.8 99 Lesotho .................................3.6
30 Qatar......................................4.7 100 Mozambique..........................3.6
430 31 Czech Republic......................4.6 101 Guatemala .............................3.6
32 Malaysia ................................4.6 102 Bangladesh............................3.6
33 Spain......................................4.6 103 Ethiopia..................................3.6
34 Turkey ....................................4.6 104 Uruguay .................................3.6
35 Indonesia ...............................4.6 105 Honduras ...............................3.5
36 Oman.....................................4.6 106 Egypt .....................................3.5
37 Malta .....................................4.5 107 Nepal .....................................3.5
38 Israel ......................................4.5 108 Russian Federation................3.4
39 Brazil ......................................4.5 109 Albania...................................3.4
40 Slovenia .................................4.5 110 Syria.......................................3.4
41 Costa Rica .............................4.5 111 Lithuania ................................3.4
42 Gambia, The ..........................4.5 112 Mali........................................3.4
43 Korea, Rep.............................4.4 113 Kazakhstan ............................3.4
44 Iceland ...................................4.4 114 Bulgaria..................................3.3
45 Sri Lanka................................4.4 115 Tajikistan ................................3.3
46 Estonia...................................4.4 116 Mexico...................................3.3
47 Rwanda .................................4.4 117 Mongolia................................3.3
48 Panama..................................4.4 118 Argentina ...............................3.3
49 Portugal .................................4.4 119 Moldova.................................3.2
50 China .....................................4.4 120 Dominican Republic...............3.2
51 Jordan....................................4.4 121 Chad ......................................3.2
52 Poland....................................4.3 122 Madagascar ...........................3.2
53 Zambia...................................4.3 123 Nicaragua...............................3.1
54 Kenya.....................................4.3 124 Bolivia ....................................3.1
55 Benin .....................................4.3 125 Bosnia and Herzegovina........3.1
56 Thailand .................................4.2 126 Ukraine ..................................3.1
57 Malawi ...................................4.2 127 Lebanon.................................3.1
58 Vietnam .................................4.2 128 Angola ...................................3.1
59 Iran, Islamic Rep....................4.2 129 Azerbaijan ..............................3.0
60 Namibia .................................4.2 130 Kyrgyz Republic .....................3.0
61 Slovak Republic .....................4.2 131 Timor-Leste............................3.0
62 Jamaica .................................4.2 132 Paraguay................................3.0
63 Hong Kong SAR ....................4.1 133 Ecuador .................................2.9
64 Mauritius ...............................4.1 134 Burundi ..................................2.9
65 Ghana ....................................4.0 135 Georgia ..................................2.8
66 Hungary .................................4.0 136 Libya ......................................2.8
67 Tanzania .................................4.0 137 Serbia ....................................2.8
68 Nigeria ...................................4.0 138 Armenia .................................2.6
69 Barbados ...............................4.0 139 Venezuela ..............................2.6
70 Senegal..................................4.0
SOURCE: World Economic Forum, Executive Opinion Survey
The Global Competitiveness Report 2010-2011 © 2010 World Economic Forum](https://image.slidesharecdn.com/globalcompetitivenessreportwef2010-11-100928142139-phpapp02/75/Global-competitiveness-report-wef-2010-11-443-2048.jpg)
![6.04 Extent and effect of taxation
2.2: Data Tables | Section VI: Goods market efficiency
What impact does the level of taxes in your country have on incentives to work or invest? [1 = significantly limits incentives to work or invest;
7 = has no impact on incentives to work or invest] | 2009–10 weighted average
RANK COUNTRY/ECONOMY SCORE 1 MEAN: 3.6 7 RANK COUNTRY/ECONOMY SCORE 1 MEAN: 3.6 7
1 Bahrain ..................................6.1 71 United States.........................3.5
2 Hong Kong SAR ....................6.0 72 Iran, Islamic Rep....................3.5
3 Singapore ..............................5.6 73 Swaziland ..............................3.5
4 Oman.....................................5.6 74 Kazakhstan ............................3.5
5 United Arab Emirates ............5.5 75 Egypt .....................................3.5
6 Kuwait ...................................5.5 76 Azerbaijan ..............................3.5
7 Luxembourg ..........................5.4 77 Philippines .............................3.5
8 Mauritius ...............................5.4 78 Tajikistan ................................3.5
9 Saudi Arabia...........................5.3 79 Zambia...................................3.5
10 Switzerland ............................5.0 80 Lesotho .................................3.4
11 Qatar......................................4.8 81 Korea, Rep.............................3.4
12 Cyprus ...................................4.7 82 Nicaragua...............................3.4
13 Botswana ..............................4.6 83 Bulgaria..................................3.4
14 Tunisia....................................4.5 84 Armenia .................................3.4
15 Brunei Darussalam ................4.5 85 Uganda ..................................3.3
16 Timor-Leste............................4.5 86 Burkina Faso..........................3.3
17 Indonesia ...............................4.4 87 Mauritania..............................3.3
18 Estonia...................................4.3 88 Mozambique..........................3.3
19 Chile ......................................4.3 89 Slovenia .................................3.3
20 Barbados ...............................4.3 90 Germany................................3.3
21 Montenegro...........................4.3 91 Benin .....................................3.2
22 Lebanon.................................4.3 92 Jordan....................................3.2
23 Paraguay ................................4.3 93 Zimbabwe..............................3.2
24 Georgia ..................................4.2 94 Cape Verde ............................3.2
25 Taiwan, China ........................4.2 95 United Kingdom.....................3.2
26 Trinidad and Tobago...............4.2 96 Malawi ...................................3.2
27 Slovak Republic .....................4.1 97 Russian Federation................3.2
28 Malaysia ................................4.1 98 Venezuela ..............................3.2
29 China .....................................4.1 99 Greece...................................3.2
30 Angola ...................................4.1 100 Morocco ................................3.2
31 South Africa...........................4.1 101 Senegal..................................3.1 431
32 Malta .....................................4.0 102 Japan .....................................3.1
33 Namibia .................................4.0 103 Côte d’Ivoire ..........................3.1
34 Libya ......................................4.0 104 Uruguay .................................3.1
35 El Salvador.............................4.0 105 Madagascar ...........................3.1
36 India.......................................4.0 106 Kyrgyz Republic .....................3.1
37 Iceland ...................................3.9 107 Poland....................................3.1
38 Ireland....................................3.9 108 France....................................3.1
39 Albania...................................3.8 109 Puerto Rico............................3.1
40 Ghana ....................................3.8 110 Sweden .................................3.0
41 Costa Rica .............................3.8 111 Bolivia ....................................3.0
42 Macedonia, FYR ....................3.8 112 Spain......................................3.0
43 Panama..................................3.8 113 Mexico...................................3.0
44 New Zealand .........................3.8 114 Finland ...................................3.0
45 Israel ......................................3.8 115 Dominican Republic...............3.0
46 Pakistan .................................3.8 116 Mali........................................2.9
47 Peru .......................................3.8 117 Latvia .....................................2.9
48 Canada...................................3.8 118 Turkey ....................................2.9
49 Czech Republic......................3.8 119 Cameroon..............................2.9
50 Nigeria ...................................3.7 120 Serbia ....................................2.8
51 Honduras ...............................3.7 121 Jamaica .................................2.8
52 Sri Lanka................................3.7 122 Kenya.....................................2.8
53 Thailand .................................3.7 123 Portugal .................................2.8
54 Bangladesh............................3.7 124 Ecuador .................................2.8
55 Moldova.................................3.7 125 Guyana ..................................2.8
56 Algeria ...................................3.7 126 Lithuania ................................2.7
57 Rwanda .................................3.7 127 Burundi ..................................2.7
58 Vietnam .................................3.7 128 Colombia ...............................2.6
59 Netherlands ...........................3.7 129 Chad ......................................2.6
60 Gambia, The ..........................3.7 130 Denmark................................2.6
61 Cambodia ..............................3.7 131 Romania ................................2.5
62 Ethiopia..................................3.7 132 Bosnia and Herzegovina........2.4
63 Austria ...................................3.6 133 Italy........................................2.4
64 Norway ..................................3.6 134 Croatia ...................................2.4
65 Tanzania .................................3.6 135 Belgium .................................2.3
66 Australia.................................3.6 136 Ukraine ..................................2.3
67 Syria.......................................3.6 137 Argentina ...............................2.2
68 Guatemala .............................3.6 138 Hungary .................................2.1
69 Mongolia................................3.6 139 Brazil ......................................2.0
70 Nepal .....................................3.6
SOURCE: World Economic Forum, Executive Opinion Survey
The Global Competitiveness Report 2010-2011 © 2010 World Economic Forum](https://image.slidesharecdn.com/globalcompetitivenessreportwef2010-11-100928142139-phpapp02/75/Global-competitiveness-report-wef-2010-11-444-2048.jpg)
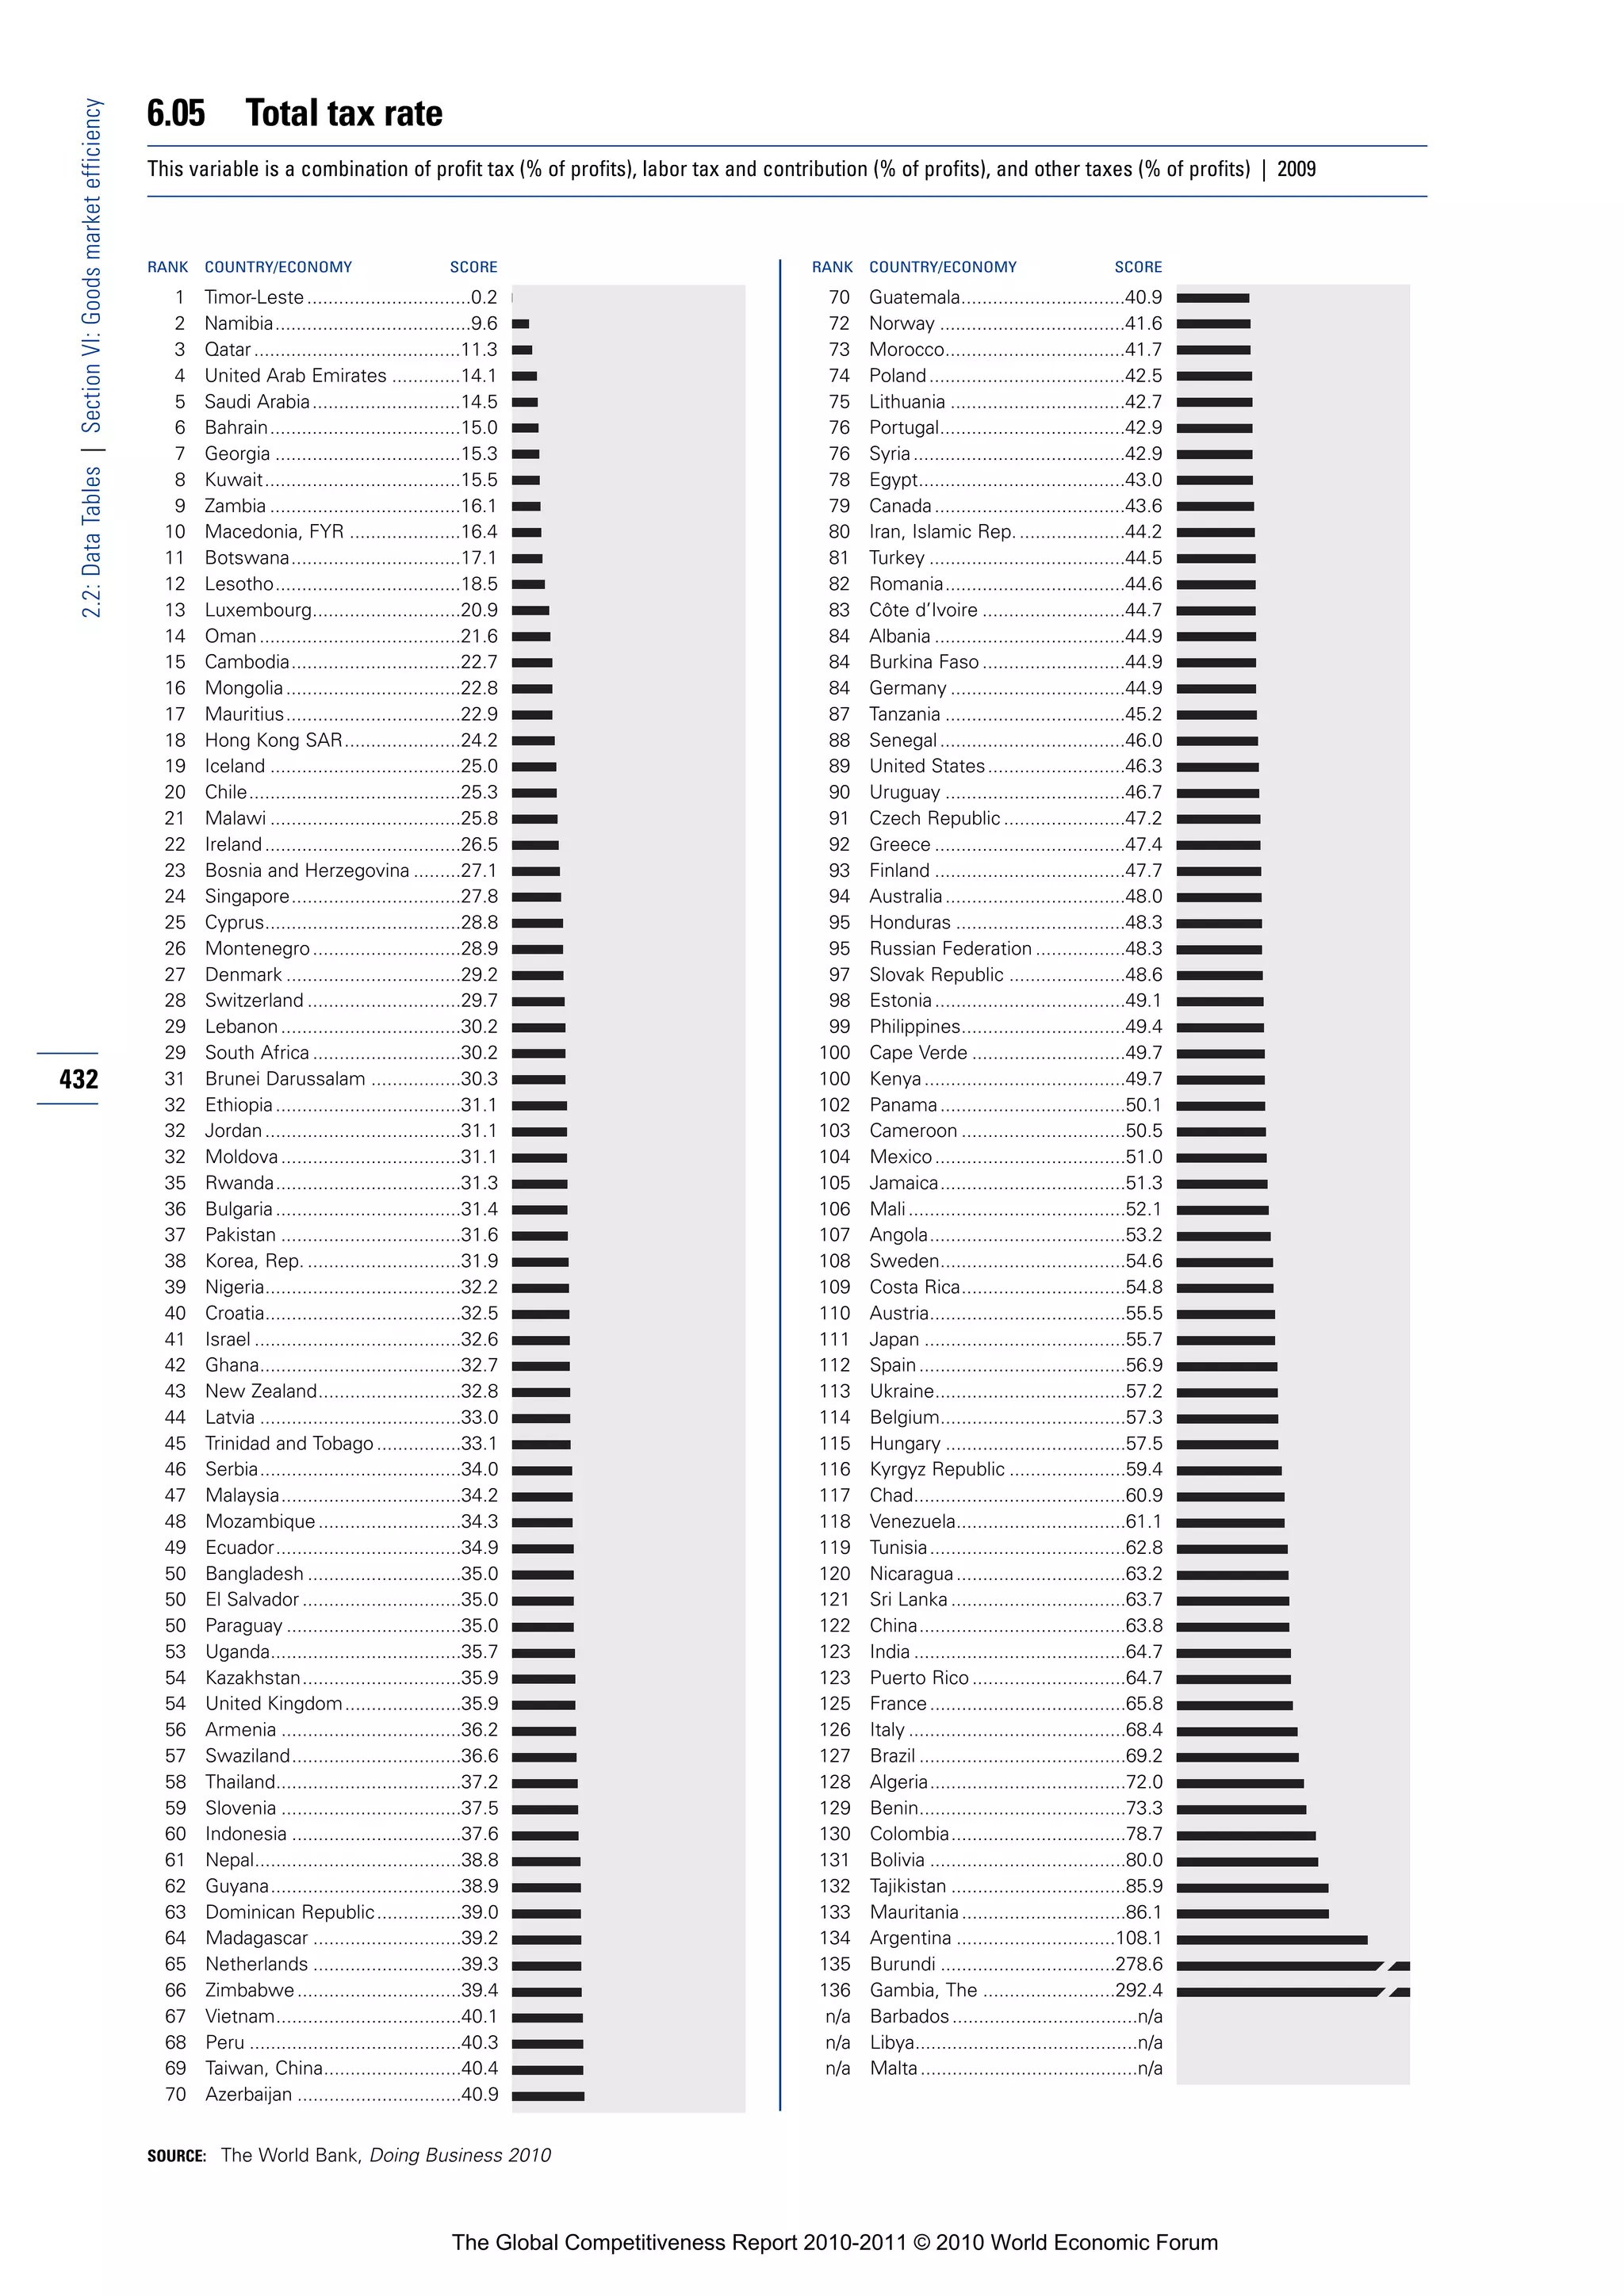
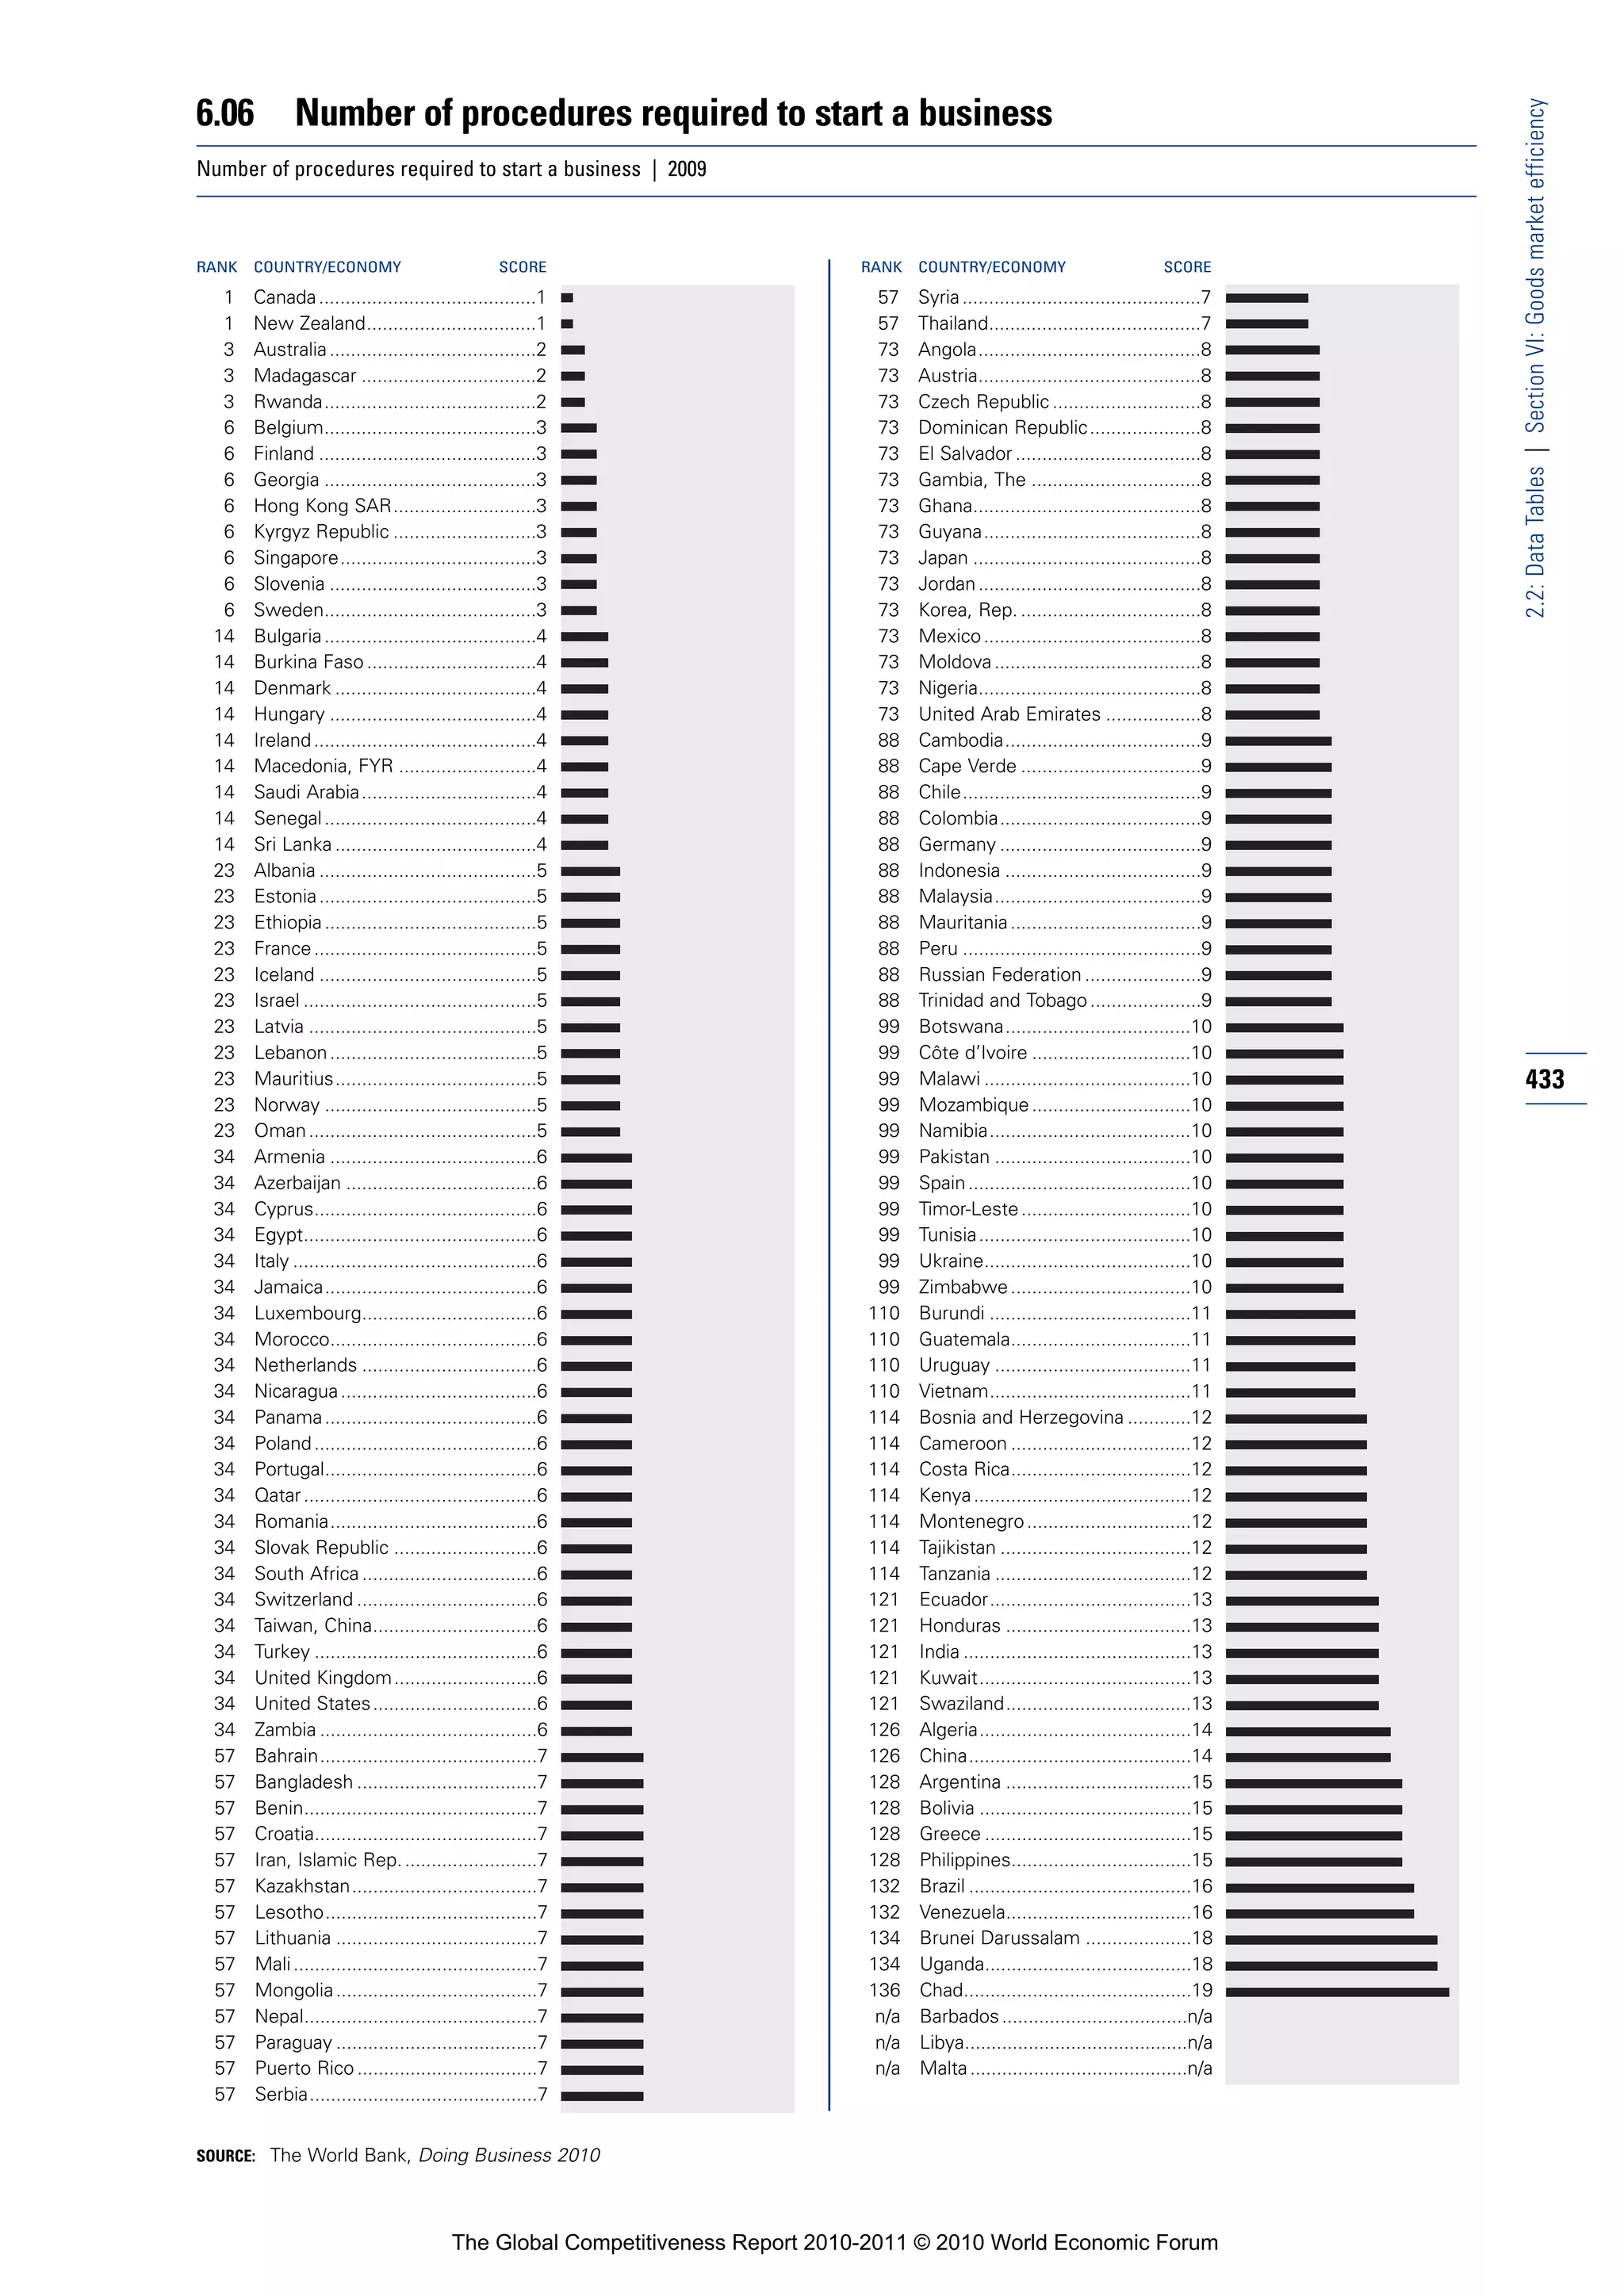
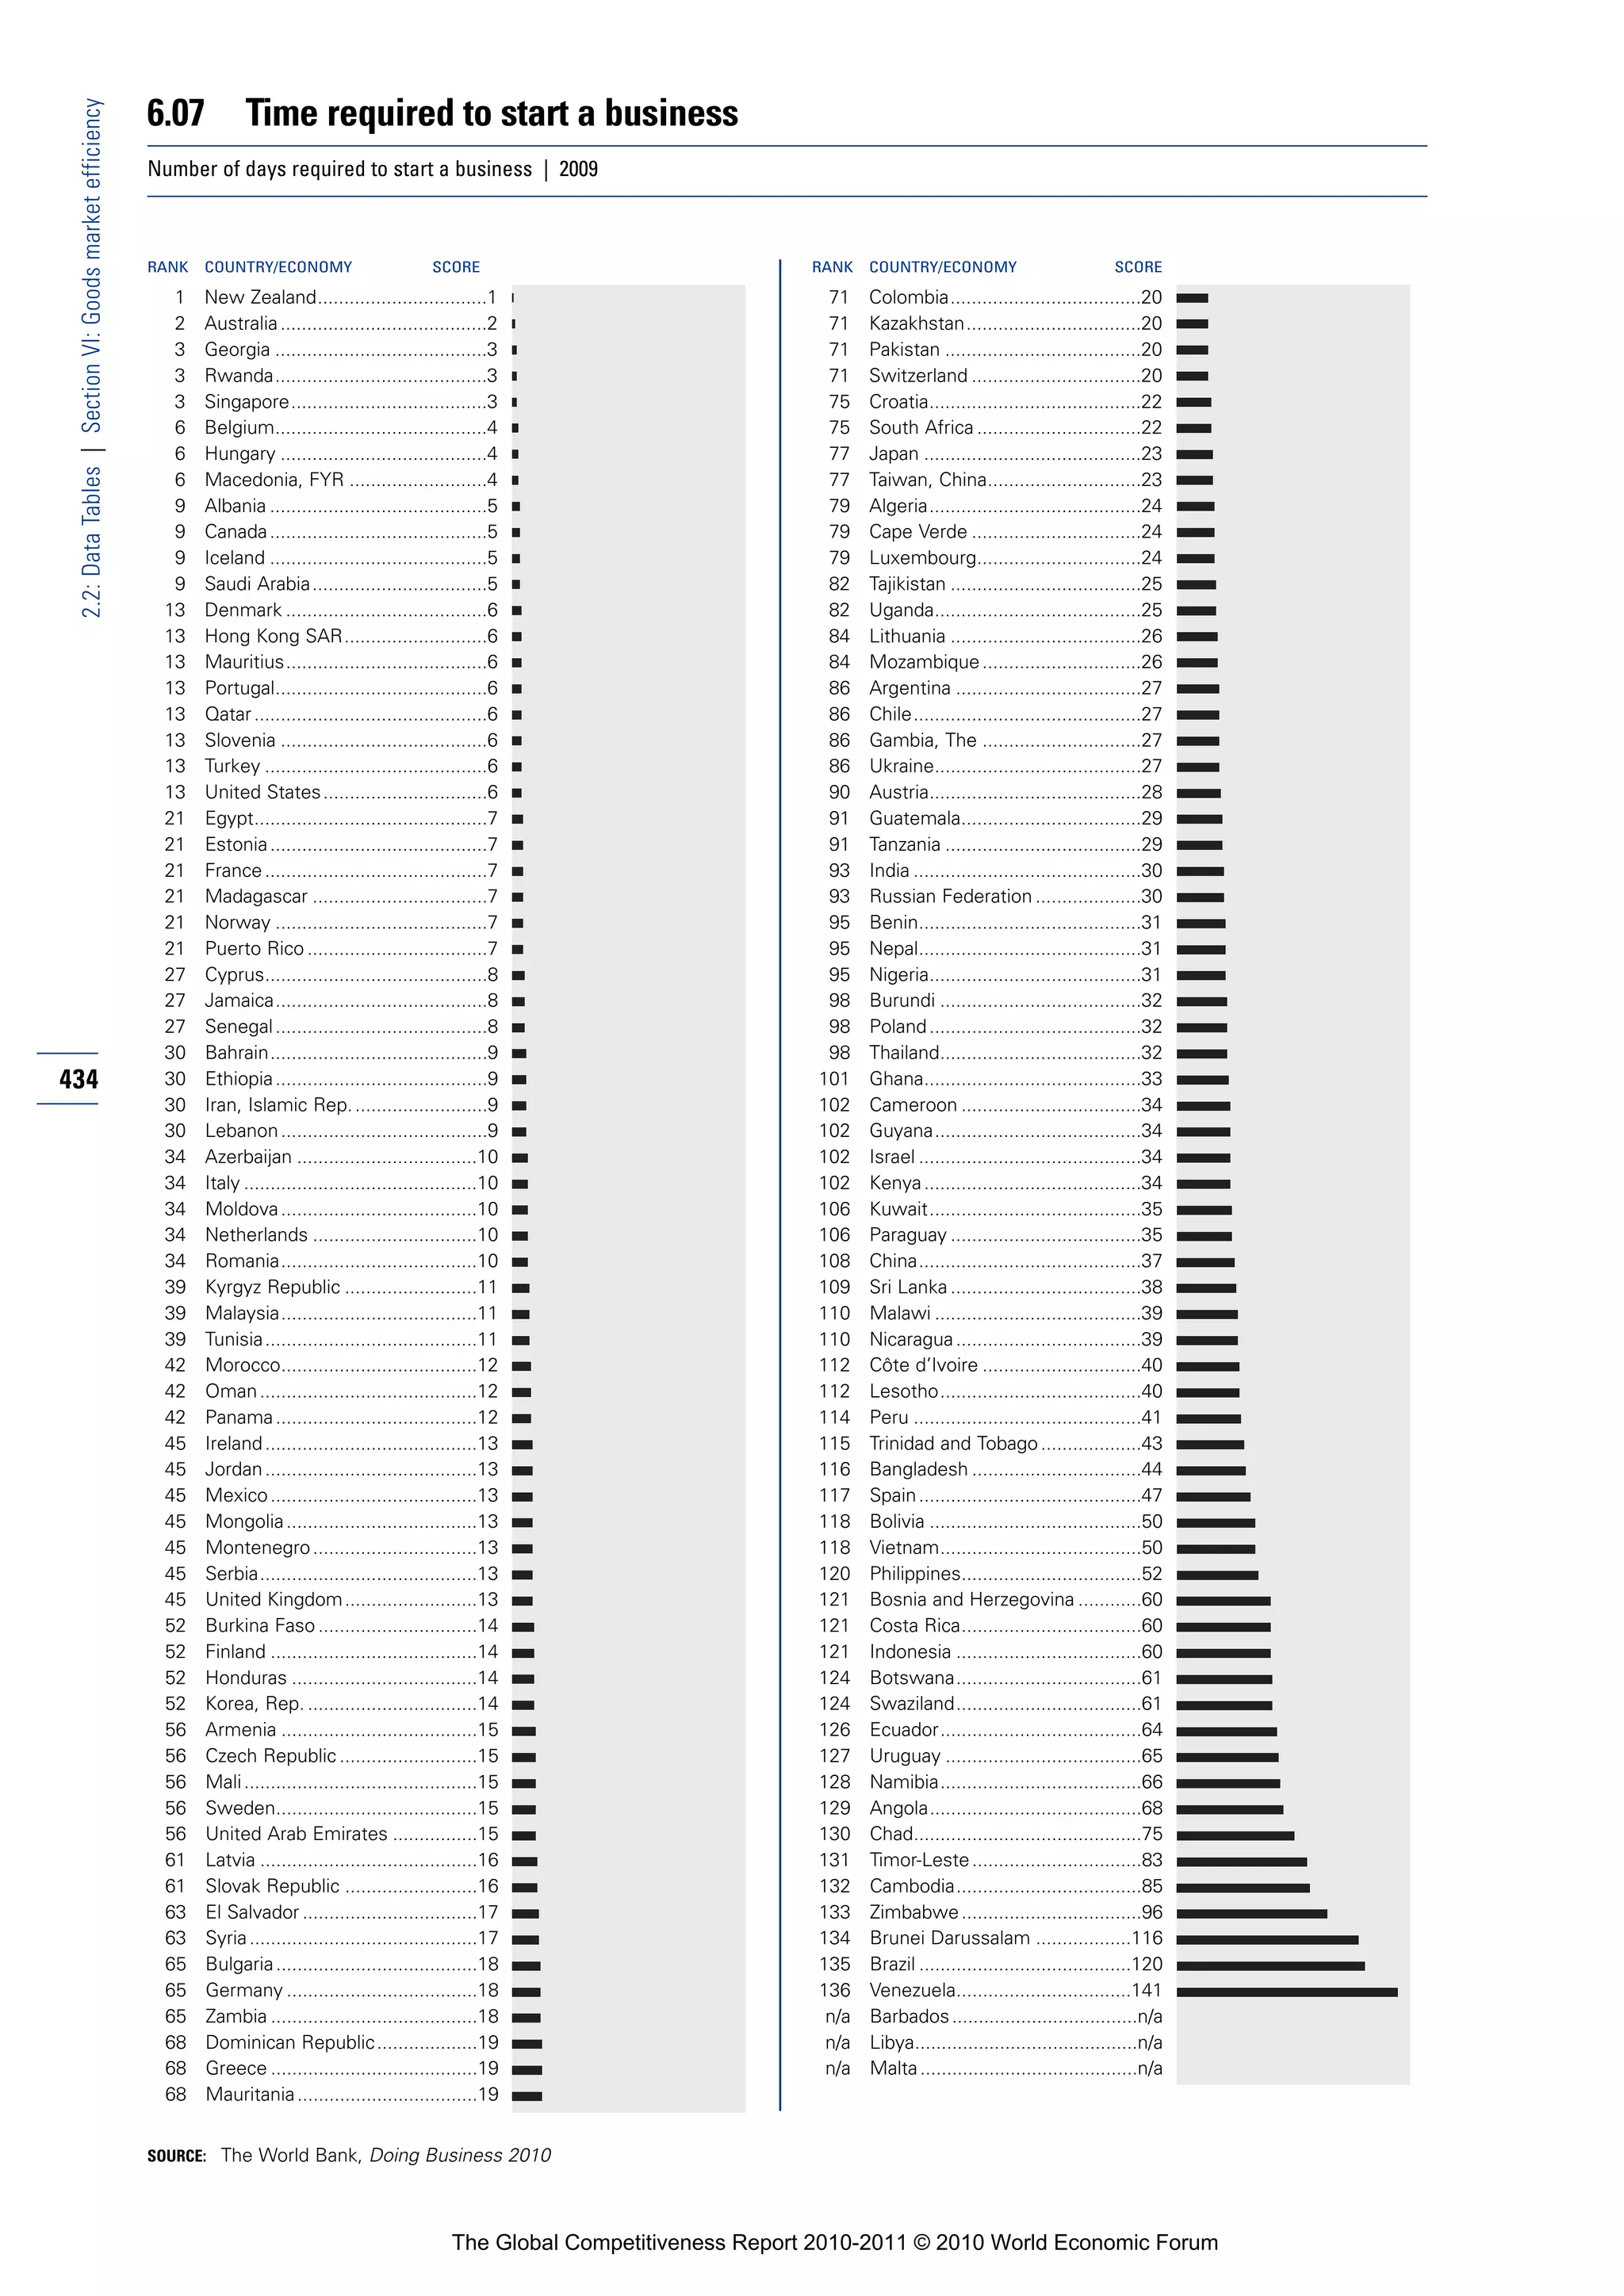
![6.08 Agricultural policy costs
2.2: Data Tables | Section VI: Goods market efficiency
How would you assess the agricultural policy in your country? [1 = excessively burdensome for the economy; 7 = balances the interests of
taxpayers, consumers, and producers] | 2009–10 weighted average
RANK COUNTRY/ECONOMY SCORE 1 MEAN: 3.9 7 RANK COUNTRY/ECONOMY SCORE 1 MEAN: 3.9 7
1 New Zealand .........................5.9 71 Ghana ....................................3.8
2 Hong Kong SAR ....................5.5 72 Burkina Faso..........................3.8
3 Gambia, The ..........................5.2 73 Lebanon.................................3.8
4 Chile ......................................5.1 74 Libya ......................................3.8
5 China .....................................5.0 75 Uganda ..................................3.8
6 Singapore ..............................5.0 76 Côte d’Ivoire ..........................3.8
7 Rwanda .................................4.9 77 Oman.....................................3.7
8 Tunisia....................................4.9 78 Mali........................................3.7
9 Australia.................................4.8 79 Poland....................................3.7
10 Israel ......................................4.8 80 Kenya.....................................3.7
11 Saudi Arabia...........................4.8 81 India.......................................3.7
12 Malaysia ................................4.8 82 Paraguay................................3.7
13 Luxembourg ..........................4.8 83 Tajikistan ................................3.7
14 Uruguay .................................4.8 84 Egypt .....................................3.7
15 Malta .....................................4.7 85 Germany................................3.7
16 Mauritius ...............................4.7 86 Nicaragua...............................3.7
17 Namibia .................................4.6 87 Madagascar ...........................3.7
18 Sweden .................................4.6 88 Panama..................................3.7
19 Bangladesh............................4.5 89 Colombia ...............................3.6
20 Bahrain ..................................4.5 90 Albania...................................3.6
21 Costa Rica .............................4.4 91 Lithuania ................................3.6
22 Indonesia ...............................4.4 92 Hungary .................................3.6
23 Barbados ...............................4.4 93 Benin .....................................3.6
24 Vietnam .................................4.4 94 Thailand .................................3.6
25 Brazil ......................................4.4 95 Philippines .............................3.6
26 Montenegro...........................4.4 96 Chad ......................................3.6
27 Netherlands ...........................4.4 97 Puerto Rico............................3.6
28 Canada...................................4.4 98 Bolivia ....................................3.6
29 Guatemala .............................4.4 99 Finland ...................................3.6
30 Malawi ...................................4.4 100 Latvia .....................................3.5
31 Taiwan, China ........................4.4 101 Mongolia................................3.5 435
32 Brunei Darussalam ................4.3 102 Dominican Republic...............3.5
33 Macedonia, FYR ....................4.3 103 Serbia ....................................3.5
34 Belgium .................................4.3 104 Timor-Leste............................3.5
35 Austria ...................................4.3 105 Spain......................................3.5
36 Botswana ..............................4.3 106 Pakistan .................................3.5
37 Peru .......................................4.2 107 Iceland ...................................3.5
38 United Arab Emirates ............4.2 108 Morocco ................................3.5
39 Ethiopia..................................4.2 109 Mozambique..........................3.5
40 Guyana ..................................4.2 110 Tanzania .................................3.5
41 Armenia .................................4.2 111 Burundi ..................................3.5
42 Estonia...................................4.2 112 Norway ..................................3.5
43 South Africa...........................4.2 113 Switzerland ............................3.5
44 Kuwait ...................................4.1 114 Georgia ..................................3.5
45 Denmark ................................4.1 115 Ecuador .................................3.4
46 France....................................4.1 116 Portugal .................................3.4
47 Cambodia ..............................4.1 117 Korea, Rep.............................3.4
48 Jamaica .................................4.1 118 Senegal..................................3.4
49 Ireland....................................4.1 119 Algeria ...................................3.4
50 Cyprus ...................................4.1 120 Trinidad and Tobago...............3.3
51 Sri Lanka................................4.0 121 Russian Federation................3.3
52 Italy ........................................4.0 122 Nepal .....................................3.3
53 United Kingdom.....................4.0 123 Bosnia and Herzegovina........3.3
54 Zambia...................................4.0 124 Slovak Republic .....................3.3
55 Cameroon..............................4.0 125 Kyrgyz Republic .....................3.2
56 El Salvador.............................4.0 126 Mexico...................................3.2
57 Azerbaijan ..............................4.0 127 Nigeria ...................................3.2
58 United States.........................4.0 128 Lesotho .................................3.2
59 Syria.......................................4.0 129 Mauritania..............................3.2
60 Iran, Islamic Rep....................3.9 130 Romania ................................3.2
61 Angola ...................................3.9 131 Greece...................................3.1
62 Kazakhstan ............................3.9 132 Moldova.................................3.0
63 Honduras ...............................3.9 133 Japan .....................................3.0
64 Czech Republic......................3.9 134 Croatia ...................................3.0
65 Jordan....................................3.9 135 Ukraine ..................................2.8
66 Cape Verde ............................3.8 136 Argentina ...............................2.8
67 Swaziland ..............................3.8 137 Bulgaria..................................2.6
68 Qatar......................................3.8 138 Venezuela ..............................2.4
69 Slovenia .................................3.8 139 Zimbabwe..............................2.2
70 Turkey ....................................3.8
SOURCE: World Economic Forum, Executive Opinion Survey
The Global Competitiveness Report 2010-2011 © 2010 World Economic Forum](https://image.slidesharecdn.com/globalcompetitivenessreportwef2010-11-100928142139-phpapp02/75/Global-competitiveness-report-wef-2010-11-448-2048.jpg)
![6.09 Prevalence of trade barriers
2.2: Data Tables | Section VI: Goods market efficiency
In your country, to what extent do tariff and non-tariff barriers limit the ability of imported goods to compete in the domestic market? [1 = strongly
limit; 7 = do not limit] | 2009–10 weighted average
RANK COUNTRY/ECONOMY SCORE 1 MEAN: 4.6 7 RANK COUNTRY/ECONOMY SCORE 1 MEAN: 4.6 7
1 Qatar......................................6.4 71 Côte d’Ivoire ..........................4.6
2 Hong Kong SAR ....................6.3 72 Uganda ..................................4.6
3 New Zealand .........................6.3 73 Senegal..................................4.5
4 Chile ......................................6.3 74 Mongolia................................4.5
5 Singapore ..............................6.2 75 Namibia .................................4.5
6 Sweden .................................6.2 76 Macedonia, FYR ....................4.5
7 Luxembourg ..........................6.1 77 Cambodia ..............................4.4
8 Finland ...................................5.9 78 Guyana ..................................4.4
9 Belgium .................................5.9 79 Zimbabwe..............................4.4
10 United Arab Emirates ............5.9 80 Madagascar ...........................4.4
11 Bahrain ..................................5.8 81 Honduras ...............................4.4
12 Czech Republic......................5.7 82 Serbia ....................................4.4
13 Portugal .................................5.6 83 Paraguay................................4.4
14 Estonia...................................5.6 84 Jordan....................................4.4
15 Hungary .................................5.6 85 Japan .....................................4.4
16 Ireland....................................5.6 86 Moldova.................................4.4
17 Austria ...................................5.5 87 Kenya.....................................4.3
18 Israel ......................................5.5 88 Malaysia ................................4.3
19 Slovak Republic .....................5.5 89 Philippines .............................4.3
20 Malta .....................................5.5 90 Timor-Leste............................4.3
21 United Kingdom.....................5.4 91 Bosnia and Herzegovina........4.3
22 Netherlands ...........................5.4 92 Libya ......................................4.3
23 Saudi Arabia...........................5.3 93 Barbados ...............................4.3
24 Australia.................................5.3 94 Switzerland ............................4.2
25 Cyprus ...................................5.3 95 Mauritania..............................4.2
26 Greece...................................5.2 96 India.......................................4.2
27 France....................................5.2 97 Tanzania .................................4.2
28 Oman.....................................5.2 98 Iceland ...................................4.2
29 Latvia .....................................5.2 99 Norway ..................................4.2
30 Slovenia .................................5.1 100 Armenia .................................4.2
436 31 Denmark ................................5.1 101 Costa Rica .............................4.2
32 Cameroon..............................5.0 102 Benin .....................................4.2
33 Georgia ..................................5.0 103 Sri Lanka................................4.2
34 Peru .......................................5.0 104 Morocco ................................4.1
35 Spain......................................5.0 105 Bangladesh............................4.1
36 Germany ................................5.0 106 Pakistan .................................4.1
37 Montenegro...........................5.0 107 Bulgaria..................................4.1
38 Kuwait ...................................5.0 108 Ethiopia..................................4.0
39 Mauritius ...............................5.0 109 Nepal .....................................4.0
40 Ghana ....................................4.9 110 Mali........................................4.0
41 Italy ........................................4.9 111 Korea, Rep.............................4.0
42 Romania ................................4.9 112 Vietnam .................................4.0
43 Trinidad and Tobago...............4.9 113 Nicaragua...............................4.0
44 Burkina Faso..........................4.9 114 Egypt .....................................4.0
45 Canada...................................4.9 115 Lesotho .................................3.9
46 Brunei Darussalam ................4.8 116 Kazakhstan ............................3.9
47 Poland....................................4.8 117 Mozambique..........................3.9
48 Zambia...................................4.8 118 Syria.......................................3.9
49 Albania...................................4.8 119 Brazil ......................................3.9
50 Gambia, The ..........................4.8 120 Malawi ...................................3.8
51 El Salvador.............................4.8 121 Dominican Republic...............3.8
52 Puerto Rico............................4.8 122 Swaziland ..............................3.8
53 Botswana ..............................4.8 123 Angola ...................................3.7
54 Panama..................................4.8 124 Tajikistan ................................3.7
55 Mexico...................................4.8 125 Cape Verde ............................3.7
56 Algeria ...................................4.7 126 Ukraine ..................................3.6
57 Tunisia....................................4.7 127 Nigeria ...................................3.6
58 Indonesia ...............................4.7 128 Rwanda .................................3.6
59 Taiwan, China ........................4.7 129 Burundi ..................................3.6
60 Uruguay .................................4.7 130 Kyrgyz Republic .....................3.6
61 South Africa...........................4.7 131 Bolivia ....................................3.6
62 Jamaica .................................4.7 132 Azerbaijan ..............................3.5
63 Lebanon.................................4.7 133 Russian Federation................3.5
64 Lithuania ................................4.7 134 Colombia ...............................3.5
65 Turkey ....................................4.6 135 Iran, Islamic Rep....................3.4
66 Croatia ...................................4.6 136 Chad ......................................3.4
67 United States.........................4.6 137 Venezuela ..............................3.2
68 Guatemala .............................4.6 138 Argentina ...............................2.8
69 China .....................................4.6 139 Ecuador .................................2.6
70 Thailand .................................4.6
SOURCE: World Economic Forum, Executive Opinion Survey
The Global Competitiveness Report 2010-2011 © 2010 World Economic Forum](https://image.slidesharecdn.com/globalcompetitivenessreportwef2010-11-100928142139-phpapp02/75/Global-competitiveness-report-wef-2010-11-449-2048.jpg)
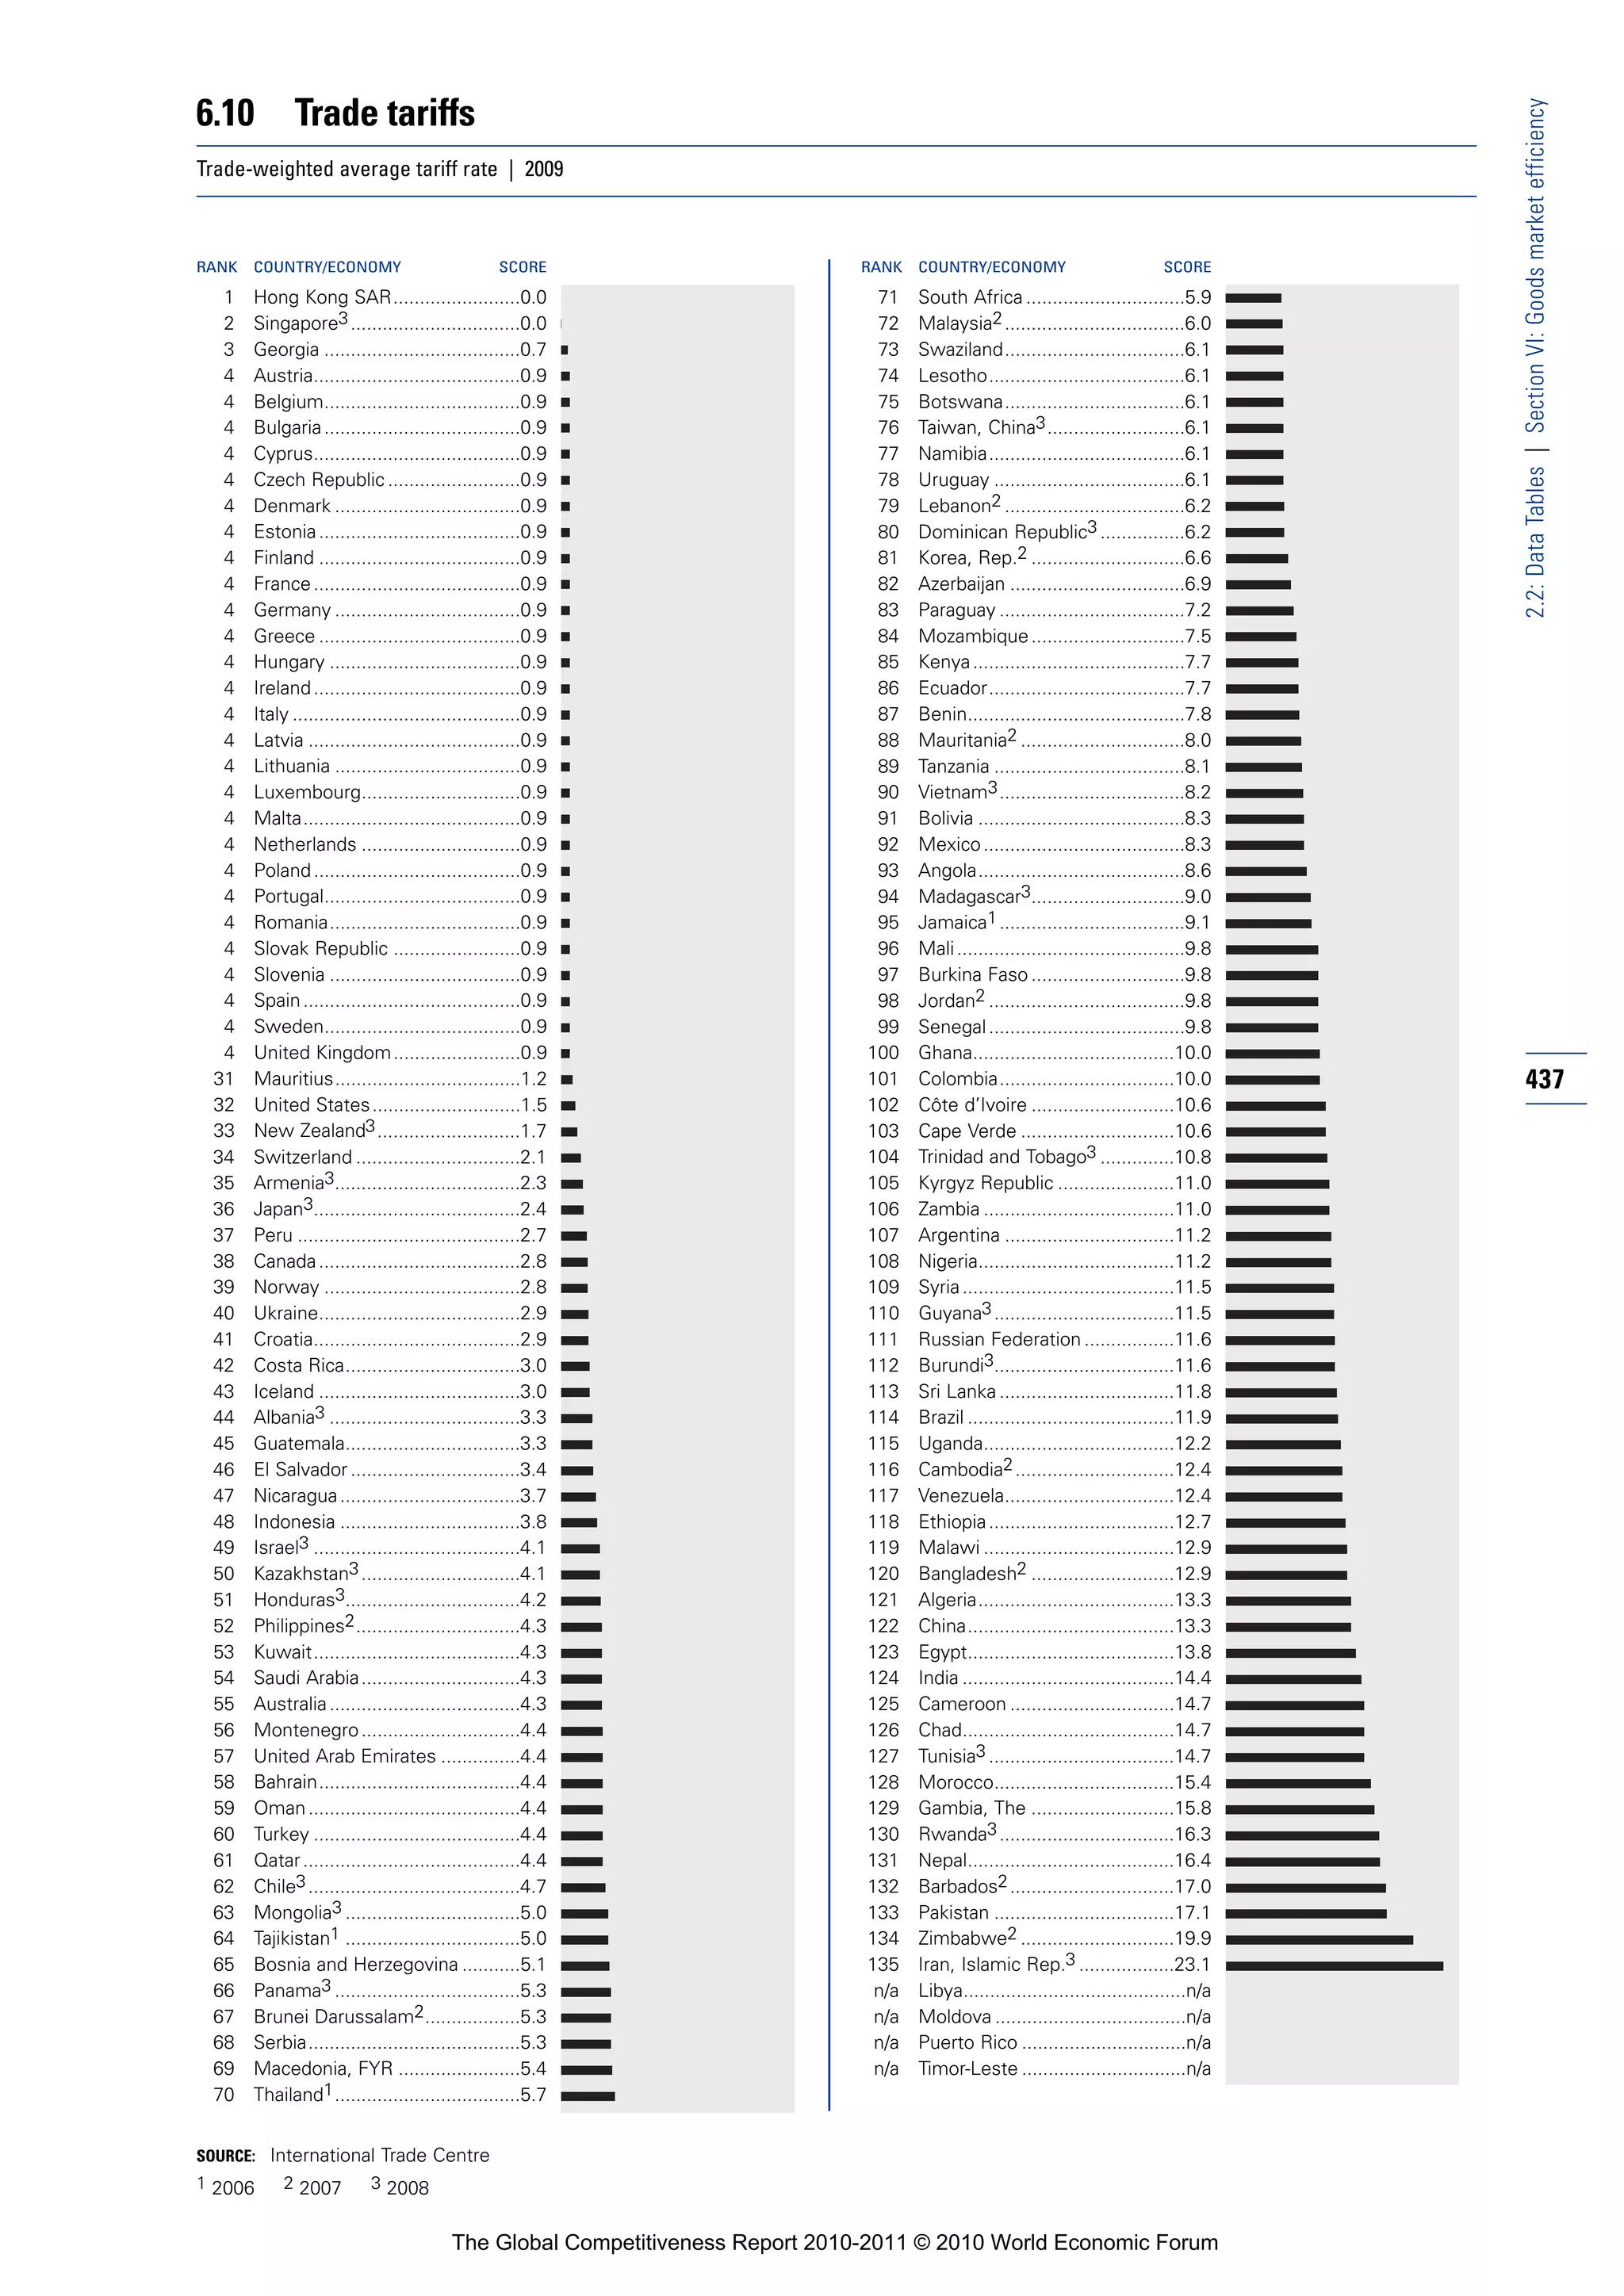
![6.11 Prevalence of foreign ownership
2.2: Data Tables | Section VI: Goods market efficiency
How prevalent is foreign ownership of companies in your country? [1 = very rare; 7 = highly prevalent] | 2009–10 weighted average
RANK COUNTRY/ECONOMY SCORE 1 MEAN: 4.7 7 RANK COUNTRY/ECONOMY SCORE 1 MEAN: 4.7 7
1 Slovak Republic .....................6.3 71 Mozambique..........................4.7
2 Singapore ..............................6.3 72 Mauritius ...............................4.7
3 Hong Kong SAR ....................6.2 73 Rwanda .................................4.6
4 Sweden .................................6.2 74 Morocco ................................4.6
5 Luxembourg ..........................6.2 75 Portugal .................................4.6
6 Uruguay .................................6.1 76 Brazil ......................................4.6
7 United Kingdom.....................6.1 77 Timor-Leste............................4.6
8 New Zealand .........................6.0 78 Cyprus ...................................4.6
9 Chile ......................................6.0 79 Greece...................................4.6
10 Hungary .................................5.9 80 Sri Lanka................................4.6
11 Canada...................................5.8 81 India.......................................4.6
12 Ireland....................................5.8 82 Swaziland ..............................4.6
13 Belgium .................................5.8 83 Angola ...................................4.6
14 Bahrain ..................................5.7 84 Saudi Arabia...........................4.6
15 Panama..................................5.7 85 Brunei Darussalam ................4.5
16 France....................................5.7 86 Turkey ....................................4.5
17 Switzerland ............................5.7 87 Oman.....................................4.5
18 Zambia...................................5.7 88 Nigeria ...................................4.5
19 Australia.................................5.6 89 Georgia ..................................4.5
20 Costa Rica .............................5.6 90 Benin .....................................4.5
21 Peru .......................................5.6 91 Cambodia ..............................4.5
22 Mexico...................................5.6 92 Colombia ...............................4.5
23 Finland ...................................5.6 93 Azerbaijan ..............................4.5
24 Norway ..................................5.5 94 Nicaragua...............................4.5
25 Qatar......................................5.5 95 Tanzania .................................4.5
26 Côte d’Ivoire ..........................5.5 96 Bosnia and Herzegovina........4.5
27 Netherlands ...........................5.5 97 Japan .....................................4.5
28 Spain......................................5.4 98 Lebanon.................................4.5
29 Botswana ..............................5.4 99 Lithuania ................................4.5
30 Puerto Rico............................5.4 100 Egypt .....................................4.5
438 31 Gambia, The ..........................5.4 101 Burkina Faso..........................4.4
32 Namibia .................................5.3 102 Bulgaria..................................4.4
33 Argentina ...............................5.3 103 China .....................................4.4
34 Austria ...................................5.3 104 Philippines .............................4.4
35 Uganda ..................................5.3 105 Paraguay................................4.3
36 Germany ................................5.3 106 Korea, Rep.............................4.3
37 Taiwan, China ........................5.3 107 Serbia ....................................4.2
38 El Salvador.............................5.3 108 Zimbabwe..............................4.2
39 Dominican Republic...............5.2 109 Pakistan .................................4.1
40 Guatemala .............................5.2 110 Croatia ...................................4.1
41 Cameroon..............................5.2 111 Armenia .................................4.1
42 Czech Republic......................5.2 112 Italy........................................4.1
43 South Africa...........................5.2 113 Kazakhstan ............................4.1
44 Denmark ................................5.2 114 Vietnam .................................4.1
45 Tunisia....................................5.1 115 Madagascar ...........................4.0
46 Jamaica .................................5.1 116 Slovenia .................................4.0
47 United States.........................5.1 117 Venezuela ..............................3.9
48 Estonia...................................5.1 118 Bangladesh............................3.9
49 United Arab Emirates ............5.1 119 Ecuador .................................3.9
50 Honduras ...............................5.1 120 Moldova.................................3.9
51 Montenegro...........................5.0 121 Ukraine ..................................3.8
52 Barbados ...............................5.0 122 Guyana ..................................3.8
53 Israel ......................................4.9 123 Algeria ...................................3.8
54 Indonesia ...............................4.9 124 Macedonia, FYR ....................3.7
55 Ghana ....................................4.9 125 Ethiopia..................................3.6
56 Malaysia ................................4.9 126 Russian Federation................3.6
57 Senegal..................................4.9 127 Kyrgyz Republic .....................3.6
58 Jordan....................................4.9 128 Tajikistan ................................3.4
59 Mongolia................................4.8 129 Mali........................................3.4
60 Thailand .................................4.8 130 Libya ......................................3.3
61 Lesotho .................................4.8 131 Bolivia ....................................3.3
62 Poland....................................4.8 132 Iceland ...................................3.2
63 Latvia .....................................4.8 133 Mauritania..............................3.1
64 Malawi ...................................4.8 134 Chad ......................................3.1
65 Malta .....................................4.8 135 Nepal .....................................3.0
66 Albania...................................4.8 136 Kuwait ...................................3.0
67 Cape Verde ............................4.8 137 Syria.......................................2.9
68 Romania ................................4.7 138 Burundi ..................................2.9
69 Kenya.....................................4.7 139 Iran, Islamic Rep....................2.4
70 Trinidad and Tobago...............4.7
SOURCE: World Economic Forum, Executive Opinion Survey
The Global Competitiveness Report 2010-2011 © 2010 World Economic Forum](https://image.slidesharecdn.com/globalcompetitivenessreportwef2010-11-100928142139-phpapp02/75/Global-competitiveness-report-wef-2010-11-451-2048.jpg)
![6.12 Business impact of rules on FDI
2.2: Data Tables | Section VI: Goods market efficiency
To what extent do rules governing foreign direct investment (FDI) encourage or discourage it? [1 = strongly discourage FDI; 7 = strongly
encourage FDI] | 2009–10 weighted average
RANK COUNTRY/ECONOMY SCORE 1 MEAN: 4.6 7 RANK COUNTRY/ECONOMY SCORE 1 MEAN: 4.6 7
1 Singapore ..............................6.5 71 South Africa...........................4.7
2 Ireland....................................6.4 72 Cape Verde ............................4.7
3 Hong Kong SAR ....................6.2 73 Pakistan .................................4.7
4 Luxembourg ..........................6.0 74 Morocco ................................4.7
5 Bahrain ..................................5.9 75 Egypt .....................................4.6
6 Tunisia....................................5.8 76 Spain......................................4.6
7 Malta .....................................5.7 77 United States.........................4.6
8 Mauritius ...............................5.7 78 Denmark................................4.6
9 Uruguay .................................5.6 79 Ethiopia..................................4.6
10 Qatar......................................5.6 80 Lesotho .................................4.6
11 Panama..................................5.6 81 Brazil ......................................4.6
12 Chile ......................................5.6 82 Azerbaijan ..............................4.5
13 Slovak Republic .....................5.5 83 Norway ..................................4.5
14 United Kingdom.....................5.5 84 Kenya.....................................4.5
15 Sweden .................................5.5 85 Guyana ..................................4.5
16 United Arab Emirates ............5.5 86 Nigeria ...................................4.5
17 Peru .......................................5.4 87 Malawi ...................................4.5
18 China .....................................5.4 88 Colombia ...............................4.5
19 Rwanda .................................5.4 89 Tanzania .................................4.5
20 Taiwan, China ........................5.4 90 Romania ................................4.5
21 Montenegro...........................5.4 91 Japan .....................................4.4
22 Czech Republic......................5.4 92 Senegal..................................4.4
23 Estonia...................................5.3 93 Benin .....................................4.4
24 Gambia, The ..........................5.3 94 Poland....................................4.4
25 Botswana ..............................5.3 95 Guatemala .............................4.4
26 Switzerland ............................5.3 96 Honduras ...............................4.3
27 Uganda ..................................5.3 97 Korea, Rep.............................4.3
28 Puerto Rico............................5.3 98 Philippines .............................4.3
29 Vietnam .................................5.3 99 Swaziland ..............................4.3
30 Zambia...................................5.2 100 Moldova.................................4.2
31 Malaysia ................................5.2 101 Kazakhstan ............................4.2 439
32 Belgium .................................5.2 102 Armenia .................................4.2
33 Cyprus ...................................5.2 103 Latvia .....................................4.2
34 Bangladesh............................5.2 104 Timor-Leste............................4.2
35 Saudi Arabia...........................5.1 105 Mongolia................................4.1
36 Costa Rica .............................5.1 106 Nicaragua...............................4.1
37 Cambodia ..............................5.1 107 Tajikistan ................................4.1
38 Netherlands ...........................5.1 108 Cameroon..............................4.1
39 Thailand .................................5.1 109 Mauritania..............................4.1
40 Barbados ...............................5.1 110 Nepal .....................................4.0
41 Finland ...................................5.1 111 Madagascar ...........................3.9
42 Namibia .................................5.1 112 Mali........................................3.9
43 Sri Lanka................................5.1 113 Bosnia and Herzegovina........3.9
44 Georgia ..................................5.0 114 Syria.......................................3.9
45 Jordan....................................5.0 115 Macedonia, FYR ....................3.8
46 India.......................................5.0 116 Slovenia .................................3.8
47 Austria ...................................5.0 117 Burundi ..................................3.8
48 Canada...................................5.0 118 Italy........................................3.8
49 Indonesia ...............................5.0 119 Paraguay................................3.8
50 Portugal .................................5.0 120 Angola ...................................3.8
51 Jamaica .................................4.9 121 Libya ......................................3.8
52 Trinidad and Tobago...............4.9 122 Greece...................................3.7
53 Albania...................................4.9 123 Serbia ....................................3.7
54 Oman.....................................4.9 124 Lithuania ................................3.7
55 New Zealand .........................4.9 125 Algeria ...................................3.7
56 Ghana ....................................4.9 126 Bulgaria..................................3.7
57 Australia.................................4.9 127 Russian Federation................3.6
58 Turkey ....................................4.9 128 Ukraine ..................................3.5
59 Dominican Republic...............4.9 129 Iran, Islamic Rep....................3.5
60 Hungary .................................4.9 130 Kuwait ...................................3.4
61 Lebanon.................................4.9 131 Croatia ...................................3.3
62 France....................................4.8 132 Chad ......................................3.3
63 Germany ................................4.8 133 Iceland ...................................3.3
64 Mexico...................................4.8 134 Argentina ...............................3.2
65 Israel ......................................4.8 135 Kyrgyz Republic .....................3.2
66 El Salvador.............................4.8 136 Zimbabwe..............................2.8
67 Côte d’Ivoire ..........................4.8 137 Bolivia ....................................2.8
68 Burkina Faso..........................4.8 138 Ecuador .................................2.5
69 Mozambique..........................4.7 139 Venezuela ..............................2.2
70 Brunei Darussalam ................4.7
SOURCE: World Economic Forum, Executive Opinion Survey
The Global Competitiveness Report 2010-2011 © 2010 World Economic Forum](https://image.slidesharecdn.com/globalcompetitivenessreportwef2010-11-100928142139-phpapp02/75/Global-competitiveness-report-wef-2010-11-452-2048.jpg)
![6.13 Burden of customs procedures
2.2: Data Tables | Section VI: Goods market efficiency
How would you rate the level of efficiency of customs procedures (related to the entry and exit of merchandise) in your country? [1 = extremely
inefficient; 7 = extremely efficient] | 2009–10 weighted average
RANK COUNTRY/ECONOMY SCORE 1 MEAN: 4.2 7 RANK COUNTRY/ECONOMY SCORE 1 MEAN: 4.2 7
1 Hong Kong SAR ....................6.5 71 Zambia...................................4.2
2 Singapore ..............................6.3 72 Benin .....................................4.2
3 Sweden .................................5.8 73 Latvia .....................................4.1
4 New Zealand .........................5.8 74 Thailand .................................4.1
5 United Arab Emirates ............5.8 75 Croatia ...................................4.1
6 Finland ...................................5.7 76 Colombia ...............................4.1
7 Chile ......................................5.7 77 Uganda ..................................4.1
8 Luxembourg ..........................5.7 78 Greece...................................4.1
9 Denmark ................................5.6 79 Mali........................................4.1
10 Gambia, The ..........................5.4 80 Kuwait ...................................4.1
11 Bahrain ..................................5.3 81 India.......................................4.0
12 Estonia...................................5.3 82 Albania...................................4.0
13 Austria ...................................5.3 83 Uruguay .................................4.0
14 Iceland ...................................5.2 84 Costa Rica .............................4.0
15 Netherlands ...........................5.2 85 Romania ................................3.9
16 Slovenia .................................5.2 86 Malawi ...................................3.9
17 Norway ..................................5.2 87 Mexico...................................3.9
18 Ireland....................................5.2 88 Madagascar ...........................3.9
19 Oman.....................................5.2 89 Indonesia ...............................3.9
20 Switzerland ............................5.1 90 Cameroon..............................3.8
21 Germany ................................5.1 91 Paraguay................................3.8
22 Taiwan, China ........................5.1 92 Lesotho .................................3.8
23 Cyprus ...................................5.0 93 Jamaica .................................3.8
24 Australia.................................5.0 94 Côte d’Ivoire ..........................3.8
25 Malta .....................................5.0 95 Ghana ....................................3.8
26 France....................................4.9 96 Turkey ....................................3.8
27 Canada...................................4.9 97 Mozambique..........................3.7
28 Saudi Arabia...........................4.9 98 Pakistan .................................3.6
29 Qatar......................................4.9 99 Zimbabwe..............................3.6
30 Portugal .................................4.9 100 Ethiopia..................................3.6
440 31 United Kingdom.....................4.8 101 Serbia ....................................3.6
32 Malaysia ................................4.8 102 Nicaragua...............................3.6
33 Rwanda .................................4.8 103 Timor-Leste............................3.6
34 Lithuania ................................4.8 104 Tajikistan ................................3.6
35 Senegal..................................4.7 105 Bosnia and Herzegovina........3.6
36 Puerto Rico............................4.7 106 Vietnam .................................3.6
37 Botswana ..............................4.7 107 Kazakhstan ............................3.5
38 Tunisia....................................4.7 108 Azerbaijan ..............................3.5
39 Georgia ..................................4.7 109 Libya ......................................3.5
40 Dominican Republic...............4.7 110 Lebanon.................................3.5
41 Japan .....................................4.6 111 Ecuador .................................3.5
42 Mauritius ...............................4.6 112 Bulgaria..................................3.5
43 Czech Republic......................4.6 113 Swaziland ..............................3.5
44 Spain......................................4.6 114 Iran, Islamic Rep....................3.5
45 Belgium .................................4.6 115 Cambodia ..............................3.5
46 China .....................................4.5 116 Tanzania .................................3.4
47 Korea, Rep.............................4.5 117 Nepal .....................................3.4
48 United States.........................4.5 118 Moldova.................................3.4
49 Peru .......................................4.5 119 Bangladesh............................3.4
50 Egypt .....................................4.5 120 Kenya.....................................3.3
51 Brunei Darussalam ................4.5 121 Guyana ..................................3.3
52 Mauritania..............................4.5 122 Brazil ......................................3.3
53 Jordan....................................4.5 123 Mongolia................................3.3
54 Slovak Republic .....................4.4 124 Algeria ...................................3.2
55 South Africa...........................4.4 125 Trinidad and Tobago...............3.1
56 Burkina Faso..........................4.4 126 Nigeria ...................................3.1
57 Panama..................................4.4 127 Cape Verde ............................3.1
58 Montenegro...........................4.3 128 Kyrgyz Republic .....................3.0
59 Hungary .................................4.3 129 Philippines .............................3.0
60 Morocco ................................4.3 130 Burundi ..................................3.0
61 Israel ......................................4.3 131 Ukraine ..................................3.0
62 Macedonia, FYR ....................4.3 132 Russian Federation................2.9
63 Barbados ...............................4.3 133 Angola ...................................2.8
64 Poland....................................4.3 134 Syria.......................................2.8
65 Namibia .................................4.2 135 Argentina ...............................2.7
66 Sri Lanka................................4.2 136 Bolivia ....................................2.7
67 Guatemala .............................4.2 137 Chad ......................................2.7
68 El Salvador.............................4.2 138 Armenia .................................2.6
69 Italy ........................................4.2 139 Venezuela ..............................2.2
70 Honduras ...............................4.2
SOURCE: World Economic Forum, Executive Opinion Survey
The Global Competitiveness Report 2010-2011 © 2010 World Economic Forum](https://image.slidesharecdn.com/globalcompetitivenessreportwef2010-11-100928142139-phpapp02/75/Global-competitiveness-report-wef-2010-11-453-2048.jpg)
![6.14 Degree of customer orientation
2.2: Data Tables | Section VI: Goods market efficiency
How well do companies in your country treat customers? [1 = generally treat their customers badly; 7 = are highly responsive to customers and
customer retention] | 2009–10 weighted average
RANK COUNTRY/ECONOMY SCORE 1 MEAN: 4.6 7 RANK COUNTRY/ECONOMY SCORE 1 MEAN: 4.6 7
1 Japan .....................................6.4 71 Malta .....................................4.5
2 Austria ...................................6.0 72 Greece...................................4.5
3 Switzerland ............................6.0 73 Latvia .....................................4.5
4 Sweden .................................5.8 74 Macedonia, FYR ....................4.5
5 Iceland ...................................5.7 75 South Africa...........................4.5
6 Hong Kong SAR ....................5.7 76 Vietnam .................................4.4
7 Denmark ................................5.7 77 Guyana ..................................4.4
8 Taiwan, China ........................5.6 78 Zambia...................................4.4
9 New Zealand .........................5.6 79 Panama..................................4.4
10 Belgium .................................5.6 80 Côte d’Ivoire ..........................4.4
11 Germany ................................5.6 81 Slovak Republic .....................4.4
12 Qatar......................................5.6 82 Bangladesh............................4.4
13 Canada...................................5.5 83 Madagascar ...........................4.4
14 Luxembourg ..........................5.5 84 Montenegro...........................4.3
15 Colombia ...............................5.5 85 Lesotho .................................4.3
16 United Arab Emirates ............5.5 86 Nigeria ...................................4.3
17 Norway ..................................5.4 87 Dominican Republic...............4.3
18 Singapore ..............................5.4 88 Cameroon..............................4.3
19 Ireland....................................5.4 89 Bulgaria..................................4.3
20 Australia.................................5.4 90 Uganda ..................................4.3
21 Korea, Rep.............................5.4 91 Nepal .....................................4.3
22 United States.........................5.3 92 Hungary .................................4.3
23 Malaysia ................................5.3 93 Honduras ...............................4.3
24 Thailand .................................5.3 94 Tanzania .................................4.3
25 Finland ...................................5.3 95 Swaziland ..............................4.3
26 Cyprus ...................................5.3 96 Paraguay................................4.2
27 Bahrain ..................................5.3 97 Pakistan .................................4.2
28 Netherlands ...........................5.2 98 Romania ................................4.2
29 Oman.....................................5.2 99 Croatia ...................................4.2
30 Sri Lanka................................5.2 100 Ethiopia..................................4.2
31 Saudi Arabia...........................5.2 101 Barbados ...............................4.2 441
32 El Salvador.............................5.1 102 Azerbaijan ..............................4.2
33 Turkey ....................................5.1 103 Ukraine ..................................4.2
34 Lithuania ................................5.1 104 Syria.......................................4.2
35 France....................................5.1 105 Kazakhstan ............................4.1
36 Tunisia....................................5.1 106 Benin .....................................4.1
37 Guatemala .............................5.1 107 Bosnia and Herzegovina........4.1
38 Mauritius ...............................5.1 108 Algeria ...................................4.0
39 Costa Rica .............................5.1 109 Mali........................................4.0
40 Estonia...................................5.0 110 Mozambique..........................4.0
41 Israel ......................................5.0 111 Ghana ....................................4.0
42 Philippines .............................5.0 112 Botswana ..............................4.0
43 Lebanon.................................5.0 113 Burkina Faso..........................3.9
44 United Kingdom.....................5.0 114 Iran, Islamic Rep....................3.9
45 Gambia, The ..........................5.0 115 Namibia .................................3.9
46 Slovenia .................................4.9 116 Rwanda .................................3.9
47 Peru .......................................4.9 117 Jamaica .................................3.9
48 Kenya.....................................4.9 118 Argentina ...............................3.8
49 Puerto Rico............................4.9 119 Serbia ....................................3.8
50 Brazil ......................................4.9 120 Moldova.................................3.8
51 Chile ......................................4.9 121 Mauritania..............................3.8
52 Senegal..................................4.9 122 Timor-Leste............................3.8
53 Poland....................................4.8 123 Mongolia................................3.8
54 Kuwait ...................................4.8 124 Zimbabwe..............................3.7
55 Italy ........................................4.8 125 Nicaragua...............................3.7
56 Portugal .................................4.8 126 Tajikistan ................................3.7
57 Morocco ................................4.8 127 Georgia ..................................3.7
58 Brunei Darussalam ................4.8 128 Trinidad and Tobago...............3.7
59 Czech Republic......................4.8 129 Ecuador .................................3.7
60 Indonesia ...............................4.8 130 Bolivia ....................................3.6
61 Malawi ...................................4.8 131 Libya ......................................3.6
62 Albania...................................4.7 132 Russian Federation................3.5
63 Egypt .....................................4.7 133 Kyrgyz Republic .....................3.5
64 India.......................................4.7 134 Armenia .................................3.5
65 Jordan....................................4.6 135 Burundi ..................................3.4
66 Spain......................................4.6 136 Cape Verde ............................3.4
67 Uruguay .................................4.6 137 Chad ......................................3.4
68 Mexico...................................4.6 138 Venezuela ..............................3.2
69 Cambodia ..............................4.5 139 Angola ...................................2.9
70 China .....................................4.5
SOURCE: World Economic Forum, Executive Opinion Survey
The Global Competitiveness Report 2010-2011 © 2010 World Economic Forum](https://image.slidesharecdn.com/globalcompetitivenessreportwef2010-11-100928142139-phpapp02/75/Global-competitiveness-report-wef-2010-11-454-2048.jpg)
![6.15 Buyer sophistication
2.2: Data Tables | Section VI: Goods market efficiency
In your country, how do buyers make purchasing decisions? [1 = based solely on the lowest price; 7 = based on a sophisticated analysis of
performance attributes] | 2009–10 weighted average
RANK COUNTRY/ECONOMY SCORE 1 MEAN: 3.5 7 RANK COUNTRY/ECONOMY SCORE 1 MEAN: 3.5 7
1 Japan .....................................5.2 71 Colombia ...............................3.4
2 Switzerland ............................5.2 72 Kuwait ...................................3.4
3 Sweden .................................5.0 73 El Salvador.............................3.4
4 Luxembourg ..........................4.9 74 Israel......................................3.4
5 Taiwan, China ........................4.7 75 Armenia .................................3.4
6 Canada...................................4.7 76 Uruguay .................................3.3
7 China .....................................4.6 77 Honduras ...............................3.3
8 United Kingdom.....................4.6 78 Estonia...................................3.3
9 Netherlands ...........................4.6 79 Mexico...................................3.3
10 Singapore ..............................4.6 80 Nigeria ...................................3.3
11 Korea, Rep.............................4.6 81 Kyrgyz Republic .....................3.2
12 Norway ..................................4.5 82 Venezuela ..............................3.2
13 United States.........................4.5 83 Ukraine ..................................3.2
14 Hong Kong SAR ....................4.4 84 Bulgaria..................................3.2
15 Belgium .................................4.4 85 Jordan....................................3.2
16 Australia.................................4.4 86 Latvia .....................................3.2
17 Finland ...................................4.4 87 Georgia ..................................3.2
18 Germany ................................4.4 88 Kenya.....................................3.2
19 Cyprus ...................................4.3 89 Gambia, The ..........................3.1
20 Saudi Arabia...........................4.3 90 Benin .....................................3.1
21 Denmark ................................4.3 91 Ghana ....................................3.1
22 United Arab Emirates ............4.3 92 Ecuador .................................3.1
23 Ireland....................................4.2 93 Slovak Republic .....................3.1
24 Malaysia ................................4.1 94 Moldova.................................3.1
25 Austria ...................................4.1 95 Morocco ................................3.1
26 France....................................4.1 96 Nicaragua...............................3.1
27 Chile ......................................4.1 97 Brunei Darussalam ................3.1
28 Lebanon.................................4.1 98 Albania...................................3.1
29 South Africa...........................4.1 99 Dominican Republic...............3.0
30 Puerto Rico............................4.0 100 Cape Verde ............................3.0
442 31 New Zealand .........................4.0 101 Hungary .................................3.0
32 Sri Lanka................................4.0 102 Ethiopia..................................3.0
33 Bahrain ..................................4.0 103 Zimbabwe..............................3.0
34 Italy ........................................4.0 104 Tajikistan ................................3.0
35 Indonesia ...............................3.9 105 Lithuania ................................3.0
36 Czech Republic......................3.9 106 Bangladesh............................3.0
37 Barbados ...............................3.9 107 Zambia...................................2.9
38 Iceland ...................................3.9 108 Algeria ...................................2.9
39 Qatar......................................3.9 109 Paraguay................................2.9
40 Tunisia....................................3.8 110 Macedonia, FYR ....................2.9
41 Azerbaijan ..............................3.8 111 Mozambique..........................2.9
42 Oman.....................................3.8 112 Tanzania .................................2.9
43 India.......................................3.8 113 Croatia ...................................2.9
44 Costa Rica .............................3.8 114 Turkey ....................................2.9
45 Vietnam .................................3.8 115 Swaziland ..............................2.8
46 Thailand .................................3.8 116 Mongolia................................2.8
47 Spain......................................3.8 117 Bosnia and Herzegovina........2.8
48 Panama..................................3.8 118 Timor-Leste............................2.7
49 Kazakhstan ............................3.7 119 Angola ...................................2.7
50 Russian Federation................3.7 120 Guyana ..................................2.7
51 Poland....................................3.6 121 Libya ......................................2.7
52 Brazil ......................................3.6 122 Lesotho .................................2.7
53 Cambodia ..............................3.6 123 Nepal .....................................2.7
54 Trinidad and Tobago...............3.6 124 Malawi ...................................2.6
55 Romania ................................3.6 125 Rwanda .................................2.6
56 Portugal .................................3.6 126 Egypt .....................................2.6
57 Montenegro...........................3.6 127 Syria.......................................2.5
58 Greece...................................3.6 128 Bolivia ....................................2.5
59 Malta .....................................3.6 129 Uganda ..................................2.4
60 Philippines .............................3.5 130 Mauritania..............................2.4
61 Namibia .................................3.5 131 Serbia ....................................2.4
62 Pakistan .................................3.5 132 Senegal..................................2.3
63 Slovenia .................................3.5 133 Cameroon..............................2.3
64 Iran, Islamic Rep....................3.5 134 Madagascar ...........................2.3
65 Peru .......................................3.5 135 Mali........................................2.2
66 Argentina ...............................3.5 136 Côte d’Ivoire ..........................2.1
67 Guatemala .............................3.5 137 Chad ......................................2.0
68 Mauritius ...............................3.5 138 Burundi ..................................1.9
69 Jamaica .................................3.4 139 Burkina Faso..........................1.8
70 Botswana ..............................3.4
SOURCE: World Economic Forum, Executive Opinion Survey
The Global Competitiveness Report 2010-2011 © 2010 World Economic Forum](https://image.slidesharecdn.com/globalcompetitivenessreportwef2010-11-100928142139-phpapp02/75/Global-competitiveness-report-wef-2010-11-455-2048.jpg)

![7.01 Cooperation in labor-employer relations
2.2: Data Tables | Section VII: Labor market efficiency
How would you characterize labor-employer relations in your country? [1 = generally confrontational; 7 = generally cooperative] | 2009–10
weighted average
RANK COUNTRY/ECONOMY SCORE 1 MEAN: 4.4 7 RANK COUNTRY/ECONOMY SCORE 1 MEAN: 4.4 7
1 Singapore ..............................6.2 71 Zambia...................................4.3
2 Switzerland ............................6.2 72 Honduras ...............................4.3
3 Norway ..................................5.9 73 Hungary .................................4.3
4 Iceland ...................................5.9 74 Mexico...................................4.3
5 Sweden .................................5.9 75 Guyana ..................................4.2
6 Hong Kong SAR ....................5.7 76 Madagascar ...........................4.2
7 Japan .....................................5.7 77 Georgia ..................................4.2
8 Denmark ................................5.7 78 Angola ...................................4.2
9 Netherlands ...........................5.7 79 Zimbabwe..............................4.2
10 Austria ...................................5.6 80 Cambodia ..............................4.2
11 Luxembourg ..........................5.6 81 Montenegro...........................4.2
12 Costa Rica .............................5.6 82 Macedonia, FYR ....................4.2
13 New Zealand .........................5.5 83 Kenya.....................................4.2
14 Brunei Darussalam ................5.3 84 Jordan....................................4.1
15 Finland ...................................5.3 85 Kazakhstan ............................4.1
16 Malaysia ................................5.3 86 Bangladesh............................4.1
17 United Arab Emirates ............5.3 87 Kyrgyz Republic .....................4.1
18 Germany ................................5.3 88 Poland....................................4.1
19 Taiwan, China ........................5.2 89 Mongolia................................4.1
20 Qatar......................................5.2 90 Brazil ......................................4.1
21 Cyprus ...................................5.2 91 Slovenia .................................4.1
22 Rwanda .................................5.1 92 Cape Verde ............................4.1
23 Oman.....................................5.1 93 Algeria ...................................4.1
24 Israel ......................................5.1 94 Syria.......................................4.1
25 Barbados ...............................5.0 95 Tajikistan ................................4.1
26 United Kingdom.....................5.0 96 Portugal .................................4.0
27 Gambia, The ..........................5.0 97 Senegal..................................4.0
28 Canada...................................5.0 98 Cameroon..............................4.0
29 El Salvador.............................5.0 99 Egypt .....................................4.0
30 Saudi Arabia...........................4.9 100 Tanzania .................................4.0
444 31 Guatemala .............................4.9 101 Timor-Leste............................4.0
32 Tunisia....................................4.9 102 Lesotho .................................4.0
33 United States.........................4.9 103 Spain......................................4.0
34 Thailand .................................4.9 104 Pakistan .................................4.0
35 Ireland....................................4.9 105 Ethiopia..................................4.0
36 Mauritius ...............................4.8 106 Moldova.................................4.0
37 Estonia...................................4.8 107 Paraguay................................4.0
38 Vietnam .................................4.7 108 Namibia .................................3.9
39 Chile ......................................4.7 109 Bosnia and Herzegovina........3.9
40 Malta .....................................4.7 110 Ukraine ..................................3.9
41 Dominican Republic...............4.7 111 Mali........................................3.9
42 Albania...................................4.7 112 Nigeria ...................................3.9
43 Australia.................................4.7 113 Bulgaria..................................3.9
44 Benin .....................................4.6 114 Mozambique..........................3.8
45 Kuwait ...................................4.6 115 Jamaica .................................3.8
46 Colombia ...............................4.6 116 Russian Federation................3.8
47 Indonesia ...............................4.6 117 Libya ......................................3.8
48 Botswana ..............................4.6 118 Iran, Islamic Rep....................3.8
49 India.......................................4.6 119 Turkey ....................................3.8
50 Czech Republic......................4.5 120 Morocco ................................3.7
51 Slovak Republic .....................4.5 121 Italy........................................3.7
52 Peru .......................................4.5 122 Ecuador .................................3.7
53 Armenia .................................4.5 123 Bolivia ....................................3.7
54 Puerto Rico............................4.5 124 Burkina Faso..........................3.7
55 Azerbaijan ..............................4.5 125 Burundi ..................................3.6
56 Philippines .............................4.5 126 Trinidad and Tobago...............3.6
57 Bahrain ..................................4.5 127 Greece...................................3.6
58 China .....................................4.5 128 Romania ................................3.6
59 Panama..................................4.5 129 France....................................3.5
60 Uganda ..................................4.4 130 Mauritania..............................3.5
61 Ghana ....................................4.4 131 Uruguay .................................3.5
62 Lebanon.................................4.4 132 South Africa...........................3.5
63 Malawi ...................................4.4 133 Chad ......................................3.5
64 Sri Lanka................................4.4 134 Argentina ...............................3.4
65 Belgium .................................4.4 135 Serbia ....................................3.4
66 Nicaragua...............................4.4 136 Croatia ...................................3.3
67 Lithuania ................................4.4 137 Nepal .....................................3.1
68 Swaziland ..............................4.4 138 Korea, Rep.............................3.0
69 Côte d’Ivoire ..........................4.3 139 Venezuela ..............................3.0
70 Latvia .....................................4.3
SOURCE: World Economic Forum, Executive Opinion Survey
The Global Competitiveness Report 2010-2011 © 2010 World Economic Forum](https://image.slidesharecdn.com/globalcompetitivenessreportwef2010-11-100928142139-phpapp02/75/Global-competitiveness-report-wef-2010-11-457-2048.jpg)
![7.02 Flexibility of wage determination
2.2: Data Tables | Section VII: Labor market efficiency
How are wages generally set in your country? [1 = by a centralized bargaining process; 7 = up to each individual company] | 2009–10 weighted
average
RANK COUNTRY/ECONOMY SCORE 1 MEAN: 4.9 7 RANK COUNTRY/ECONOMY SCORE 1 MEAN: 4.9 7
1 Hong Kong SAR ....................6.4 71 Morocco ................................5.1
2 Qatar......................................6.2 72 Sri Lanka................................5.1
3 Singapore ..............................6.1 73 Guyana ..................................5.1
4 Uganda ..................................6.1 74 Cameroon..............................5.0
5 Estonia...................................6.0 75 Chad ......................................5.0
6 Macedonia, FYR ....................6.0 76 Croatia ...................................5.0
7 United Arab Emirates ............6.0 77 Montenegro...........................5.0
8 Bahrain ..................................6.0 78 Russian Federation................5.0
9 Lithuania ................................5.9 79 Timor-Leste............................5.0
10 Azerbaijan ..............................5.8 80 Costa Rica .............................5.0
11 Malawi ...................................5.8 81 Kenya.....................................5.0
12 Rwanda .................................5.8 82 Romania ................................5.0
13 Mongolia................................5.8 83 Namibia .................................5.0
14 Lebanon.................................5.8 84 Paraguay................................4.9
15 Japan .....................................5.8 85 Nicaragua...............................4.9
16 Burundi ..................................5.7 86 Malta .....................................4.9
17 Kuwait ...................................5.7 87 Cambodia ..............................4.9
18 Taiwan, China ........................5.7 88 Panama..................................4.8
19 Kyrgyz Republic .....................5.7 89 Angola ...................................4.8
20 United Kingdom.....................5.7 90 Thailand .................................4.8
21 Latvia .....................................5.7 91 Zambia...................................4.7
22 Switzerland ............................5.7 92 Mexico...................................4.7
23 Brunei Darussalam ................5.7 93 Burkina Faso..........................4.7
24 Saudi Arabia...........................5.6 94 Botswana ..............................4.7
25 Chile ......................................5.6 95 Bolivia ....................................4.7
26 Georgia ..................................5.6 96 Philippines .............................4.6
27 El Salvador.............................5.6 97 Cyprus ...................................4.6
28 Israel ......................................5.6 98 Indonesia ...............................4.6
29 Vietnam .................................5.6 99 Mauritius ...............................4.6
30 Kazakhstan ............................5.6 100 Iceland ...................................4.6
31 New Zealand .........................5.6 101 Senegal..................................4.6 445
32 Peru .......................................5.5 102 Mali........................................4.6
33 Canada...................................5.5 103 Barbados ...............................4.5
34 United States.........................5.5 104 Pakistan .................................4.5
35 Hungary .................................5.5 105 Algeria ...................................4.5
36 Jordan....................................5.5 106 Trinidad and Tobago...............4.5
37 Oman.....................................5.5 107 Denmark................................4.5
38 Korea, Rep.............................5.5 108 Honduras ...............................4.5
39 Moldova.................................5.5 109 Lesotho .................................4.5
40 Bosnia and Herzegovina........5.4 110 Australia.................................4.4
41 Nigeria ...................................5.4 111 Nepal .....................................4.4
42 Gambia, The ..........................5.4 112 Luxembourg ..........................4.3
43 Côte d’Ivoire ..........................5.4 113 Swaziland ..............................4.3
44 Malaysia ................................5.4 114 Ecuador .................................4.3
45 Tajikistan ................................5.4 115 Tunisia....................................4.3
46 Cape Verde ............................5.4 116 Brazil ......................................4.3
47 Poland....................................5.4 117 Slovenia .................................4.2
48 Ethiopia..................................5.4 118 Ghana ....................................4.2
49 Slovak Republic .....................5.3 119 Portugal .................................4.2
50 Colombia ...............................5.3 120 Mozambique..........................4.1
51 Dominican Republic...............5.3 121 Tanzania .................................4.1
52 Syria.......................................5.3 122 Venezuela ..............................3.9
53 France....................................5.3 123 Libya ......................................3.7
54 Ukraine ..................................5.3 124 Spain......................................3.7
55 Turkey ....................................5.3 125 Norway ..................................3.6
56 China .....................................5.3 126 Belgium .................................3.6
57 Guatemala .............................5.3 127 Iran, Islamic Rep....................3.5
58 Benin .....................................5.3 128 Ireland....................................3.4
59 Bulgaria..................................5.2 129 Netherlands ...........................3.4
60 Egypt .....................................5.2 130 Italy........................................3.3
61 India.......................................5.2 131 South Africa...........................3.1
62 Mauritania..............................5.2 132 Finland ...................................3.1
63 Armenia .................................5.2 133 Greece...................................3.1
64 Albania...................................5.2 134 Sweden .................................3.1
65 Jamaica .................................5.2 135 Argentina ...............................3.0
66 Puerto Rico............................5.1 136 Germany................................2.9
67 Bangladesh............................5.1 137 Zimbabwe..............................2.8
68 Madagascar ...........................5.1 138 Uruguay .................................2.4
69 Czech Republic......................5.1 139 Austria ...................................2.4
70 Serbia ....................................5.1
SOURCE: World Economic Forum, Executive Opinion Survey
The Global Competitiveness Report 2010-2011 © 2010 World Economic Forum](https://image.slidesharecdn.com/globalcompetitivenessreportwef2010-11-100928142139-phpapp02/75/Global-competitiveness-report-wef-2010-11-458-2048.jpg)
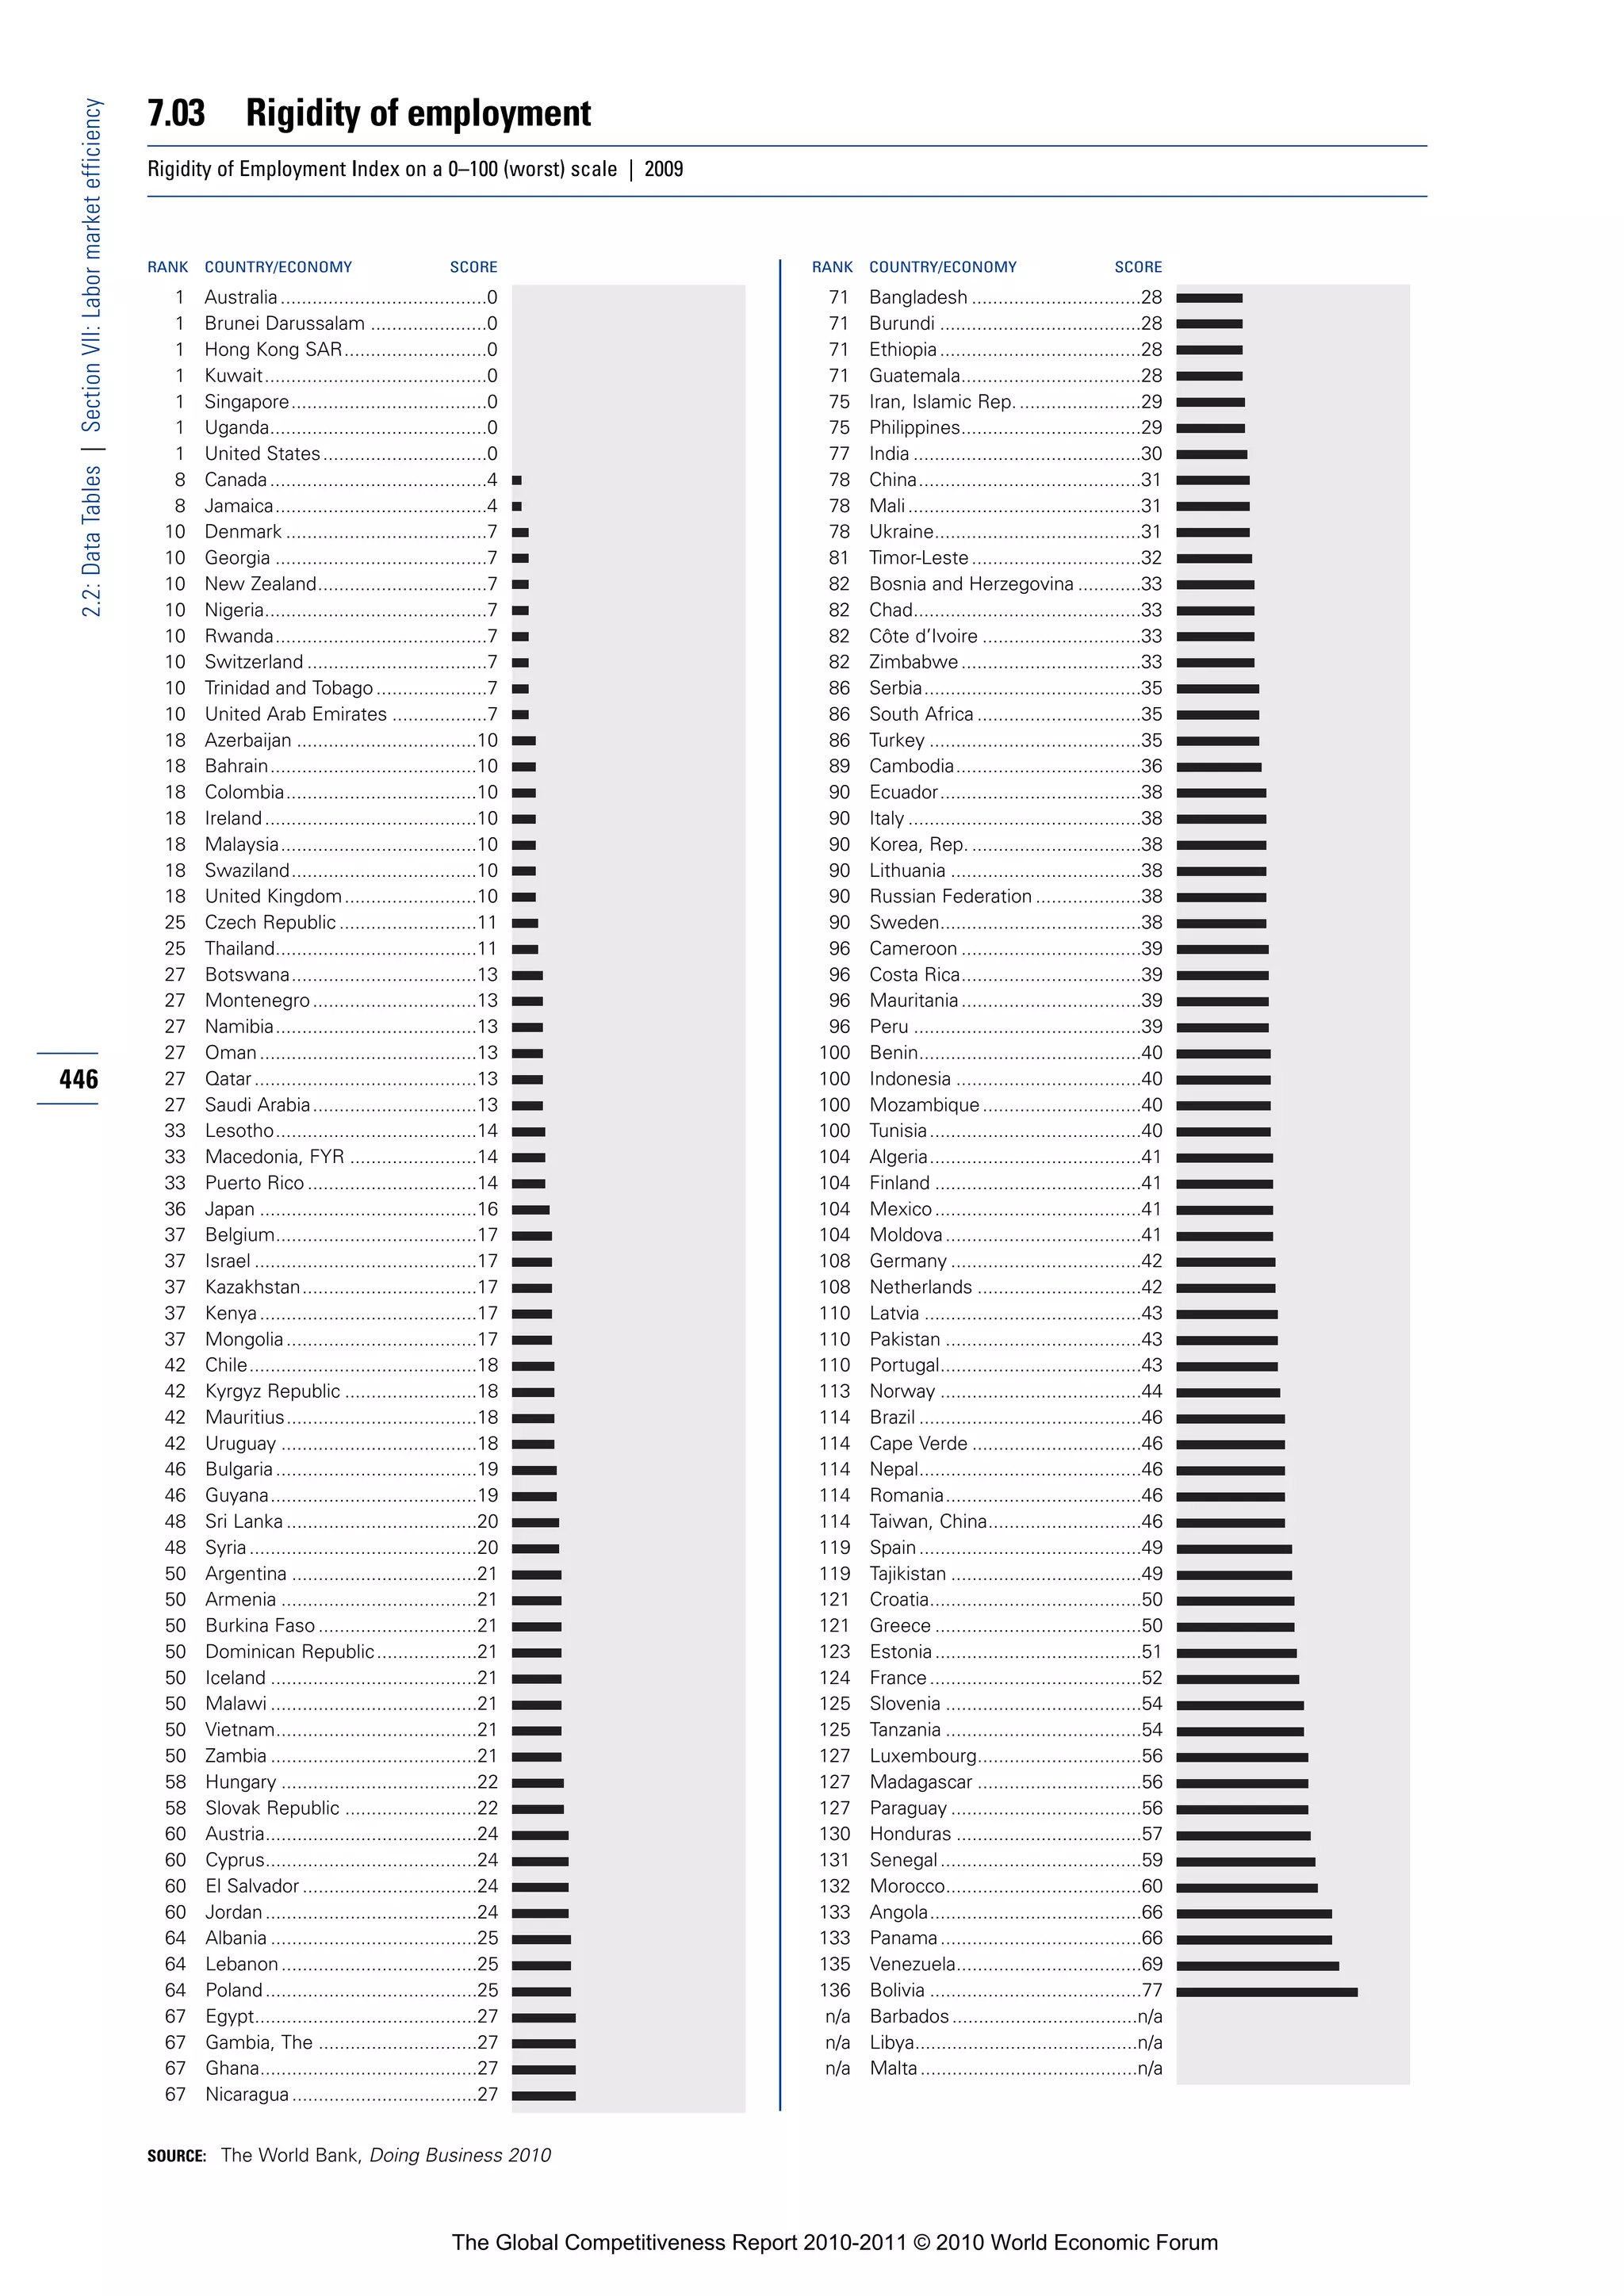
![7.04 Hiring and firing practices
2.2: Data Tables | Section VII: Labor market efficiency
How would you characterize the hiring and firing of workers in your country? [1 = impeded by regulations; 7 = flexibly determined by employers] |
2009–10 weighted average
RANK COUNTRY/ECONOMY SCORE 1 MEAN: 3.9 7 RANK COUNTRY/ECONOMY SCORE 1 MEAN: 3.9 7
1 Hong Kong SAR ....................6.0 71 Senegal..................................3.9
2 Singapore ..............................5.9 72 Chad ......................................3.9
3 Denmark ................................5.8 73 Finland ...................................3.9
4 Switzerland ............................5.7 74 Mauritius ...............................3.9
5 Iceland ...................................5.5 75 Russian Federation................3.9
6 United States.........................5.2 76 Egypt .....................................3.9
7 Uganda ..................................5.2 77 Romania ................................3.8
8 Nigeria ...................................5.2 78 Algeria ...................................3.8
9 Georgia ..................................5.2 79 Australia.................................3.8
10 Bosnia and Herzegovina........5.0 80 Serbia ....................................3.8
11 Azerbaijan ..............................5.0 81 Angola ...................................3.8
12 Kenya.....................................4.9 82 Barbados ...............................3.8
13 El Salvador.............................4.9 83 New Zealand .........................3.8
14 Qatar......................................4.9 84 Ethiopia..................................3.7
15 Canada...................................4.8 85 Ireland....................................3.7
16 Cameroon..............................4.7 86 Burundi ..................................3.7
17 United Arab Emirates ............4.7 87 Dominican Republic...............3.7
18 Ukraine ..................................4.7 88 Tanzania .................................3.7
19 Bangladesh............................4.7 89 India.......................................3.7
20 Guyana ..................................4.6 90 Iran, Islamic Rep....................3.6
21 Albania...................................4.6 91 Honduras ...............................3.5
22 Saudi Arabia...........................4.6 92 Jordan....................................3.5
23 Mongolia................................4.6 93 Malta .....................................3.5
24 Rwanda .................................4.6 94 Sri Lanka................................3.5
25 Kyrgyz Republic .....................4.6 95 Bahrain ..................................3.5
26 Taiwan, China ........................4.5 96 Swaziland ..............................3.5
27 Côte d’Ivoire ..........................4.5 97 Puerto Rico............................3.5
28 Gambia, The ..........................4.5 98 Nepal .....................................3.5
29 Kazakhstan ............................4.5 99 Syria.......................................3.4
30 Madagascar ...........................4.5 100 Moldova.................................3.4
31 Thailand .................................4.5 101 Timor-Leste............................3.4 447
32 Malawi ...................................4.5 102 Peru .......................................3.4
33 Armenia .................................4.5 103 Paraguay................................3.4
34 Vietnam .................................4.5 104 Slovak Republic .....................3.4
35 Benin .....................................4.5 105 Austria ...................................3.4
36 Zambia...................................4.4 106 Croatia ...................................3.3
37 Brunei Darussalam ................4.4 107 Lithuania ................................3.3
38 Indonesia ...............................4.4 108 Poland....................................3.3
39 Oman.....................................4.4 109 Cape Verde ............................3.3
40 Macedonia, FYR ....................4.4 110 Mozambique..........................3.3
41 Montenegro...........................4.3 111 Chile ......................................3.3
42 Bulgaria..................................4.3 112 Luxembourg ..........................3.2
43 Costa Rica .............................4.2 113 Netherlands ...........................3.2
44 Israel ......................................4.2 114 Bolivia ....................................3.2
45 Cambodia ..............................4.2 115 Korea, Rep.............................3.2
46 Mauritania..............................4.2 116 Philippines .............................3.2
47 Nicaragua...............................4.2 117 Panama..................................3.0
48 Latvia .....................................4.2 118 Uruguay .................................3.0
49 United Kingdom.....................4.2 119 Czech Republic......................3.0
50 Malaysia ................................4.2 120 Mexico...................................3.0
51 Pakistan .................................4.2 121 Japan .....................................3.0
52 Tunisia....................................4.2 122 Zimbabwe..............................3.0
53 Lebanon.................................4.2 123 Norway ..................................2.9
54 Tajikistan ................................4.2 124 Namibia .................................2.9
55 Burkina Faso..........................4.1 125 France....................................2.9
56 Estonia...................................4.1 126 Greece...................................2.9
57 Ghana ....................................4.1 127 Belgium .................................2.9
58 Mali........................................4.1 128 Sweden .................................2.9
59 Jamaica .................................4.1 129 Italy........................................2.9
60 Cyprus ...................................4.1 130 Libya ......................................2.8
61 Hungary .................................4.1 131 Brazil ......................................2.8
62 China .....................................4.1 132 Slovenia .................................2.7
63 Turkey ....................................4.0 133 Germany................................2.7
64 Guatemala .............................4.0 134 Argentina ...............................2.7
65 Kuwait ...................................4.0 135 South Africa...........................2.5
66 Morocco ................................4.0 136 Ecuador .................................2.5
67 Botswana ..............................3.9 137 Spain......................................2.4
68 Lesotho .................................3.9 138 Portugal .................................2.3
69 Trinidad and Tobago...............3.9 139 Venezuela ..............................2.2
70 Colombia ...............................3.9
SOURCE: World Economic Forum, Executive Opinion Survey
The Global Competitiveness Report 2010-2011 © 2010 World Economic Forum](https://image.slidesharecdn.com/globalcompetitivenessreportwef2010-11-100928142139-phpapp02/75/Global-competitiveness-report-wef-2010-11-460-2048.jpg)
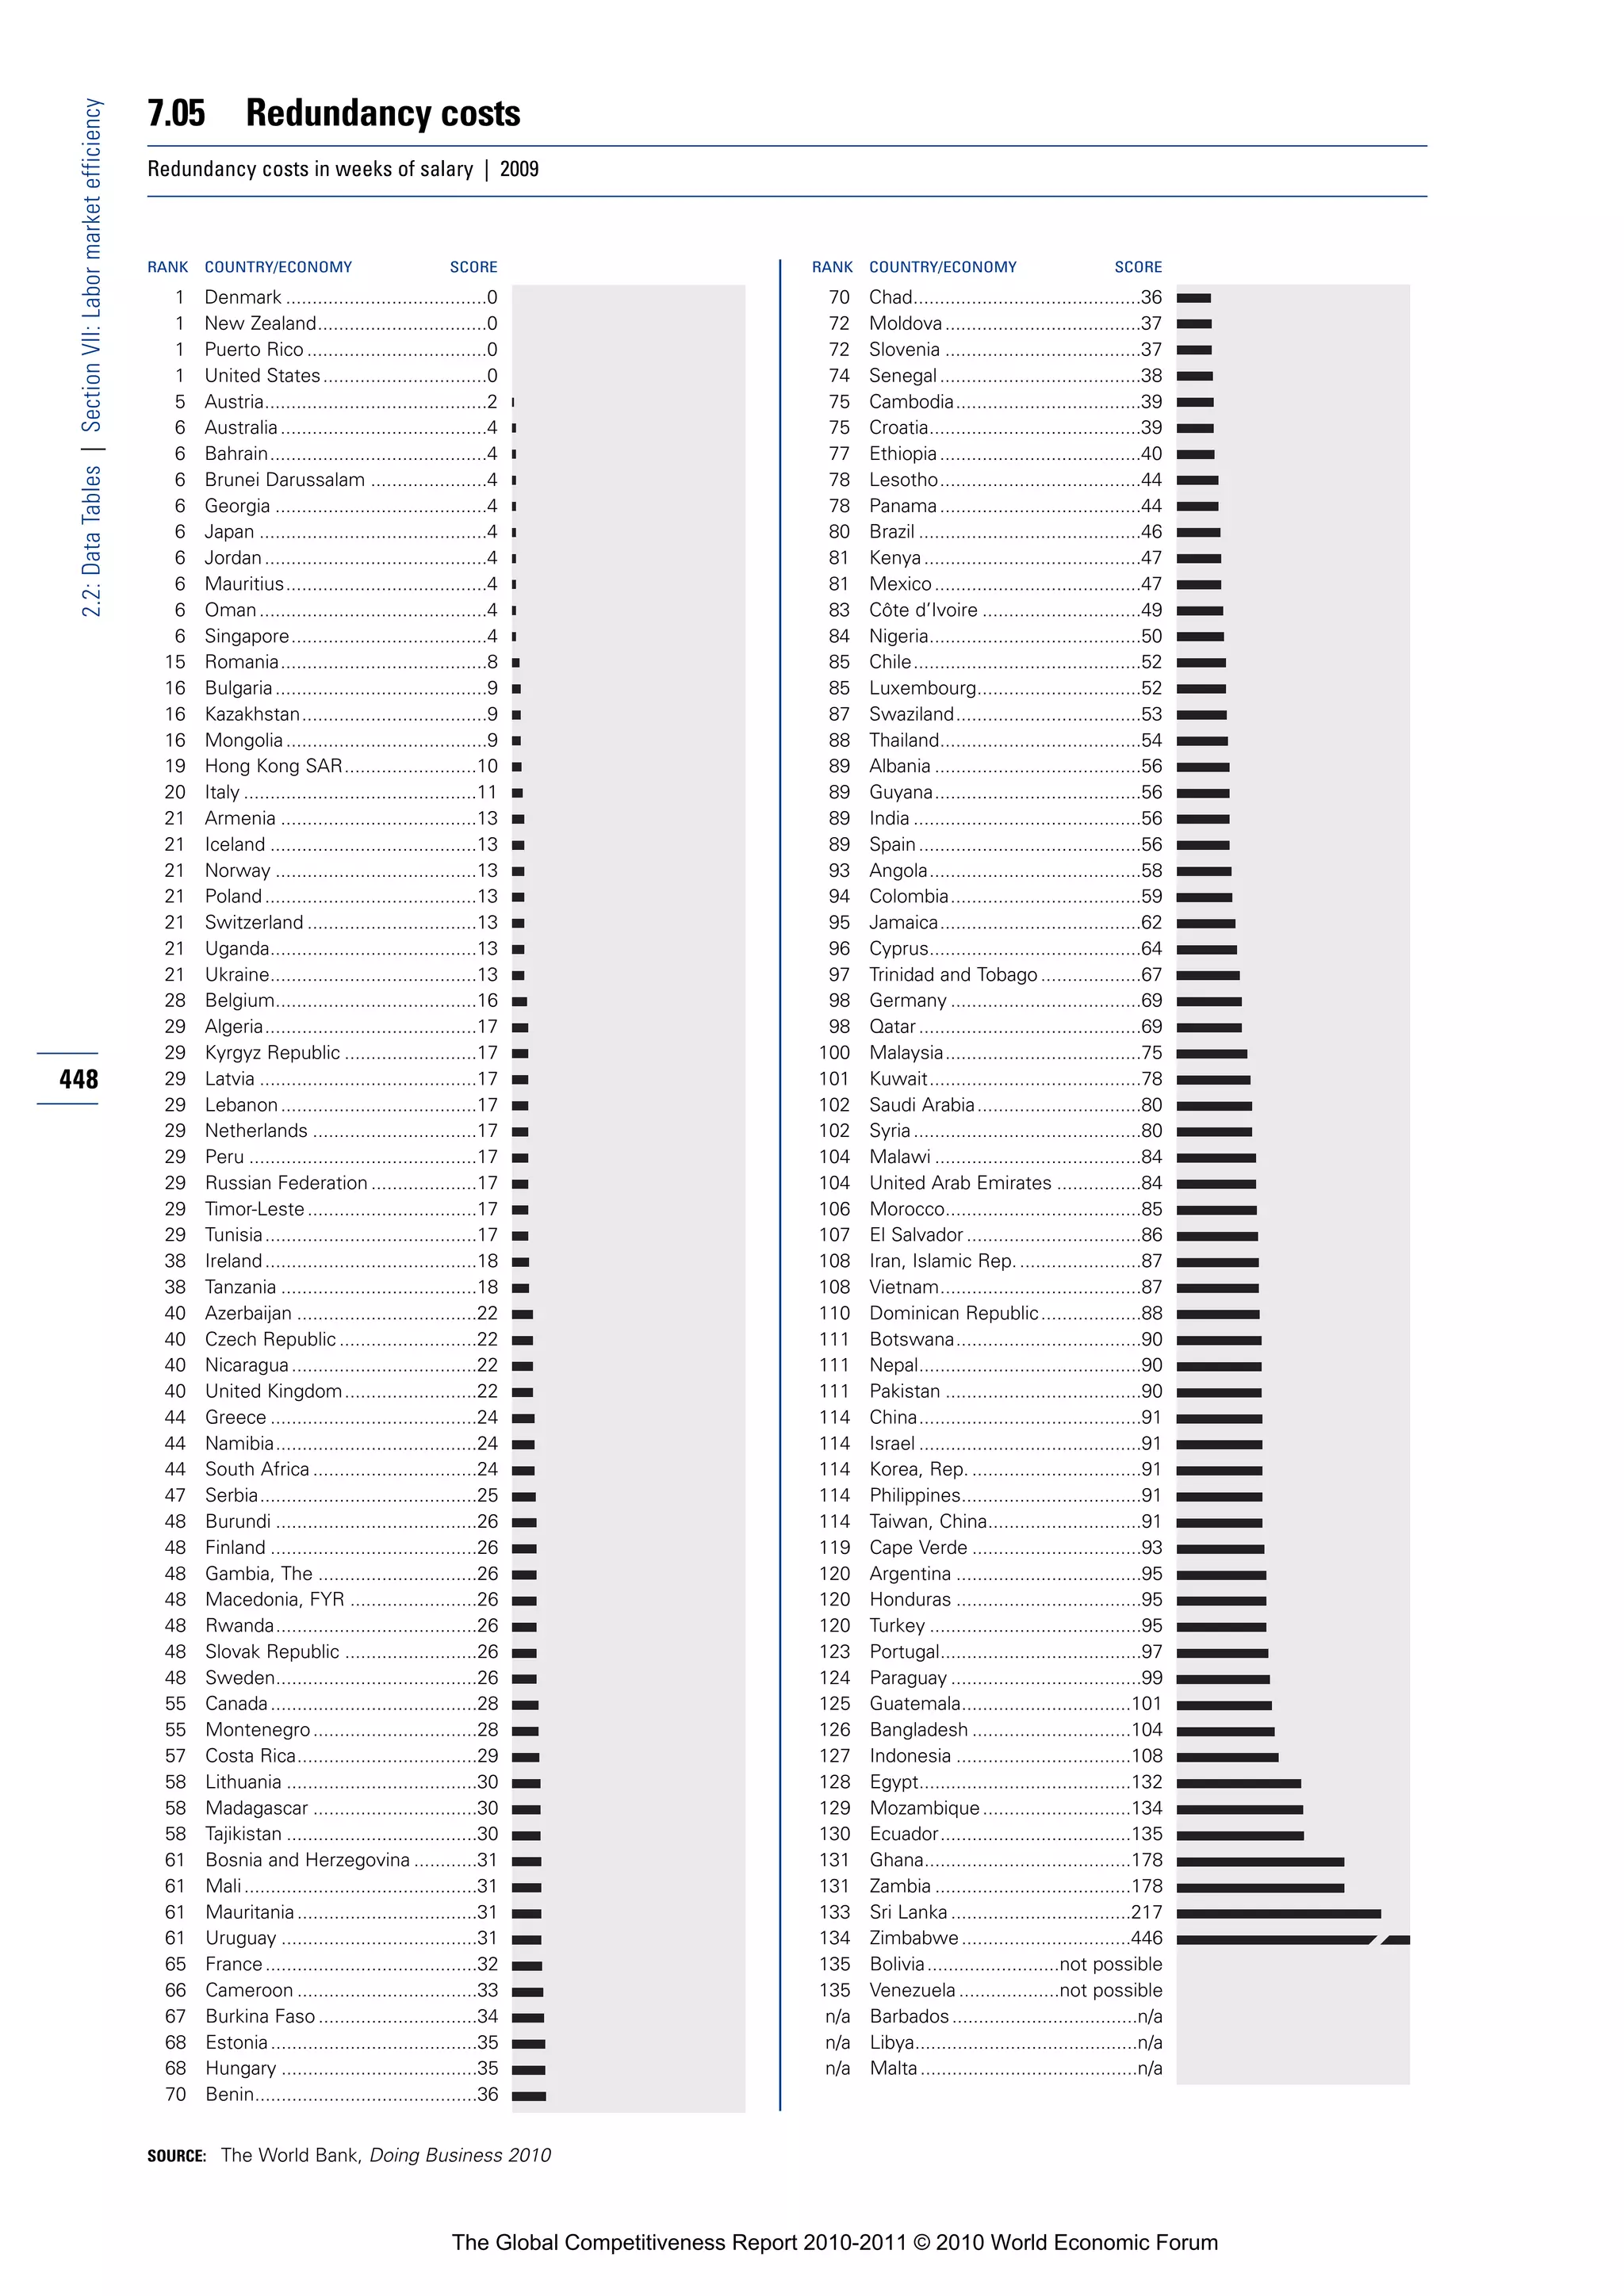
![7.06 Pay and productivity
2.2: Data Tables | Section VII: Labor market efficiency
To what extent is pay in your country related to productivity? [1 = not related to worker productivity; 7 = strongly related to worker productivity] |
2009–10 weighted average
RANK COUNTRY/ECONOMY SCORE 1 MEAN: 3.9 7 RANK COUNTRY/ECONOMY SCORE 1 MEAN: 3.9 7
1 Singapore ..............................5.6 71 Turkey ....................................3.9
2 Hong Kong SAR ....................5.5 72 Slovenia .................................3.9
3 Taiwan, China ........................5.4 73 Botswana ..............................3.9
4 Vietnam .................................5.1 74 Netherlands ...........................3.9
5 Switzerland ............................5.1 75 Austria ...................................3.9
6 Malaysia ................................5.1 76 Egypt .....................................3.9
7 Qatar......................................5.0 77 Jordan....................................3.9
8 Estonia...................................5.0 78 Nigeria ...................................3.9
9 United States.........................4.9 79 Lebanon.................................3.8
10 Slovak Republic .....................4.9 80 Guatemala .............................3.8
11 United Arab Emirates ............4.8 81 El Salvador.............................3.8
12 Japan .....................................4.8 82 Philippines .............................3.8
13 Brunei Darussalam ................4.8 83 Sweden .................................3.8
14 Saudi Arabia...........................4.8 84 Madagascar ...........................3.8
15 China .....................................4.7 85 Brazil ......................................3.7
16 Albania...................................4.7 86 Peru .......................................3.7
17 Tajikistan ................................4.7 87 Malawi ...................................3.7
18 Lithuania ................................4.7 88 Belgium .................................3.7
19 Kazakhstan ............................4.7 89 Timor-Leste............................3.7
20 Indonesia ...............................4.6 90 Ethiopia..................................3.7
21 Israel ......................................4.6 91 Serbia ....................................3.6
22 Czech Republic......................4.6 92 Barbados ...............................3.6
23 Bahrain ..................................4.6 93 Pakistan .................................3.6
24 Korea, Rep.............................4.5 94 Bangladesh............................3.5
25 United Kingdom.....................4.5 95 Côte d’Ivoire ..........................3.5
26 Ukraine ..................................4.5 96 Croatia ...................................3.5
27 Denmark ................................4.5 97 Nicaragua...............................3.5
28 Iceland ...................................4.5 98 Mexico...................................3.5
29 Thailand .................................4.5 99 Dominican Republic...............3.5
30 Canada...................................4.4 100 Syria.......................................3.5
31 Oman.....................................4.4 101 Senegal..................................3.5 449
32 Kyrgyz Republic .....................4.4 102 Zambia...................................3.4
33 Romania ................................4.4 103 Panama..................................3.4
34 New Zealand .........................4.4 104 Colombia ...............................3.4
35 Cambodia ..............................4.4 105 Algeria ...................................3.4
36 Gambia, The ..........................4.3 106 Portugal .................................3.3
37 Chile ......................................4.3 107 Namibia .................................3.3
38 Mongolia................................4.3 108 Cameroon..............................3.3
39 Azerbaijan ..............................4.3 109 Spain......................................3.3
40 Sri Lanka................................4.3 110 Honduras ...............................3.2
41 Moldova.................................4.3 111 Iran, Islamic Rep....................3.2
42 Latvia .....................................4.3 112 South Africa...........................3.2
43 Germany ................................4.3 113 Chad ......................................3.2
44 Luxembourg ..........................4.3 114 Benin .....................................3.1
45 Rwanda .................................4.2 115 Trinidad and Tobago...............3.1
46 Puerto Rico............................4.2 116 Jamaica .................................3.1
47 Russian Federation................4.2 117 Cape Verde ............................3.1
48 Hungary .................................4.2 118 Greece...................................3.1
49 Costa Rica .............................4.2 119 Ghana ....................................3.1
50 Morocco ................................4.2 120 Zimbabwe..............................3.1
51 Macedonia, FYR ....................4.2 121 Paraguay................................3.1
52 Tunisia....................................4.2 122 Bolivia ....................................3.1
53 Australia.................................4.2 123 Lesotho .................................3.1
54 Poland....................................4.2 124 Italy........................................3.1
55 France....................................4.2 125 Nepal .....................................3.0
56 Ireland....................................4.1 126 Mozambique..........................3.0
57 Kuwait ...................................4.1 127 Tanzania .................................3.0
58 Bulgaria..................................4.1 128 Burundi ..................................3.0
59 Georgia ..................................4.1 129 Bosnia and Herzegovina........3.0
60 Mauritius ...............................4.0 130 Uganda ..................................3.0
61 India.......................................4.0 131 Mali........................................2.9
62 Montenegro...........................4.0 132 Swaziland ..............................2.9
63 Armenia .................................4.0 133 Argentina ...............................2.8
64 Malta .....................................4.0 134 Uruguay .................................2.8
65 Norway ..................................4.0 135 Ecuador .................................2.7
66 Cyprus ...................................4.0 136 Venezuela ..............................2.7
67 Kenya.....................................4.0 137 Mauritania..............................2.6
68 Angola ...................................3.9 138 Burkina Faso..........................2.6
69 Finland ...................................3.9 139 Libya ......................................2.1
70 Guyana ..................................3.9
SOURCE: World Economic Forum, Executive Opinion Survey
The Global Competitiveness Report 2010-2011 © 2010 World Economic Forum](https://image.slidesharecdn.com/globalcompetitivenessreportwef2010-11-100928142139-phpapp02/75/Global-competitiveness-report-wef-2010-11-462-2048.jpg)
![7.07 Reliance on professional management
2.2: Data Tables | Section VII: Labor market efficiency
In your country, who holds senior management positions? [1 = usually relatives or friends without regard to merit; 7 = mostly professional
managers chosen for merit and qualifications] | 2009–10 weighted average
RANK COUNTRY/ECONOMY SCORE 1 MEAN: 4.4 7 RANK COUNTRY/ECONOMY SCORE 1 MEAN: 4.4 7
1 Sweden .................................6.5 71 Portugal .................................4.2
2 Norway ..................................6.3 72 Vietnam .................................4.2
3 New Zealand .........................6.2 73 Bahrain ..................................4.2
4 Finland ...................................6.1 74 Colombia ...............................4.2
5 Canada...................................6.1 75 Côte d’Ivoire ..........................4.2
6 Netherlands ...........................6.0 76 Latvia .....................................4.2
7 United Kingdom.....................6.0 77 Cyprus ...................................4.2
8 Australia.................................6.0 78 Montenegro...........................4.2
9 Singapore ..............................5.9 79 Kenya.....................................4.2
10 Switzerland ............................5.9 80 Panama..................................4.1
11 Denmark ................................5.8 81 Turkey ....................................4.1
12 Qatar......................................5.8 82 Albania...................................4.1
13 Ireland....................................5.8 83 Madagascar ...........................4.1
14 Germany ................................5.7 84 Tanzania .................................4.1
15 United States.........................5.6 85 Cameroon..............................4.1
16 Japan .....................................5.6 86 Egypt .....................................4.1
17 Belgium .................................5.5 87 Pakistan .................................4.0
18 Luxembourg ..........................5.5 88 Georgia ..................................4.0
19 South Africa...........................5.5 89 Benin .....................................4.0
20 Iceland ...................................5.4 90 Uruguay .................................4.0
21 Puerto Rico............................5.4 91 Bangladesh............................3.9
22 Austria ...................................5.3 92 Lesotho .................................3.9
23 Zimbabwe..............................5.3 93 Senegal..................................3.9
24 Israel ......................................5.3 94 El Salvador.............................3.9
25 Malaysia ................................5.3 95 Uganda ..................................3.9
26 Taiwan, China ........................5.2 96 Venezuela ..............................3.9
27 Gambia, The ..........................5.2 97 Cambodia ..............................3.9
28 Chile ......................................5.1 98 Greece...................................3.9
29 Estonia...................................5.1 99 Moldova.................................3.9
30 France....................................5.1 100 Jordan....................................3.9
450 31 Sri Lanka................................5.0 101 Russian Federation................3.9
32 Rwanda .................................5.0 102 Mexico...................................3.8
33 Czech Republic......................5.0 103 Azerbaijan ..............................3.8
34 United Arab Emirates ............5.0 104 Kuwait ...................................3.8
35 Hong Kong SAR ....................5.0 105 Morocco ................................3.7
36 Slovak Republic .....................4.9 106 Croatia ...................................3.7
37 Saudi Arabia...........................4.9 107 Honduras ...............................3.7
38 Korea, Rep.............................4.9 108 Lebanon.................................3.7
39 Namibia .................................4.9 109 Cape Verde ............................3.6
40 Tunisia....................................4.9 110 Ethiopia..................................3.6
41 Barbados ...............................4.8 111 Mozambique..........................3.6
42 Brunei Darussalam ................4.8 112 Dominican Republic...............3.6
43 Trinidad and Tobago...............4.8 113 Timor-Leste............................3.6
44 Oman.....................................4.7 114 Burkina Faso..........................3.6
45 Malawi ...................................4.7 115 Macedonia, FYR ....................3.6
46 Botswana ..............................4.7 116 Bulgaria..................................3.6
47 Philippines .............................4.7 117 Armenia .................................3.6
48 Zambia...................................4.7 118 Kazakhstan ............................3.5
49 India.......................................4.7 119 Italy........................................3.5
50 China .....................................4.7 120 Nepal .....................................3.5
51 Ghana ....................................4.7 121 Iran, Islamic Rep....................3.5
52 Brazil ......................................4.7 122 Ukraine ..................................3.5
53 Poland....................................4.6 123 Nicaragua...............................3.5
54 Lithuania ................................4.6 124 Kyrgyz Republic .....................3.4
55 Costa Rica .............................4.6 125 Mongolia................................3.4
56 Spain......................................4.6 126 Bosnia and Herzegovina........3.4
57 Indonesia ...............................4.5 127 Ecuador .................................3.4
58 Jamaica .................................4.5 128 Serbia ....................................3.3
59 Malta .....................................4.5 129 Algeria ...................................3.3
60 Thailand .................................4.5 130 Tajikistan ................................3.3
61 Peru .......................................4.5 131 Mali........................................3.3
62 Argentina ...............................4.5 132 Angola ...................................3.2
63 Romania ................................4.4 133 Syria.......................................3.2
64 Mauritius ...............................4.4 134 Paraguay................................3.1
65 Guyana ..................................4.4 135 Bolivia ....................................3.0
66 Guatemala .............................4.3 136 Burundi ..................................3.0
67 Hungary .................................4.3 137 Mauritania..............................2.9
68 Slovenia .................................4.3 138 Chad ......................................2.6
69 Swaziland ..............................4.3 139 Libya ......................................2.5
70 Nigeria ...................................4.3
SOURCE: World Economic Forum, Executive Opinion Survey
The Global Competitiveness Report 2010-2011 © 2010 World Economic Forum](https://image.slidesharecdn.com/globalcompetitivenessreportwef2010-11-100928142139-phpapp02/75/Global-competitiveness-report-wef-2010-11-463-2048.jpg)
![7.08 Brain drain
2.2: Data Tables | Section VII: Labor market efficiency
Does your country retain and attract talented people? [1 = no, the best and brightest normally leave to pursue opportunities in other countries;
7 = yes, there are many opportunities for talented people within the country] | 2009–10 weighted average
RANK COUNTRY/ECONOMY SCORE 1 MEAN: 3.5 7 RANK COUNTRY/ECONOMY SCORE 1 MEAN: 3.5 7
1 Switzerland ............................6.3 71 Malawi ...................................3.2
2 Qatar......................................6.0 72 Puerto Rico............................3.2
3 United States.........................5.9 73 Dominican Republic...............3.2
4 Singapore ..............................5.8 74 Mexico...................................3.2
5 United Arab Emirates ............5.5 75 Cape Verde ............................3.2
6 Sweden .................................5.4 76 Morocco ................................3.2
7 Norway ..................................5.3 77 Nigeria ...................................3.2
8 Hong Kong SAR ....................5.2 78 Côte d’Ivoire ..........................3.2
9 Canada...................................5.2 79 Poland....................................3.2
10 United Kingdom.....................5.2 80 Kazakhstan ............................3.1
11 Netherlands ...........................5.2 81 Zambia...................................3.1
12 Luxembourg ..........................5.1 82 Russian Federation................3.1
13 Chile ......................................5.0 83 Tanzania .................................3.1
14 Saudi Arabia...........................5.0 84 Colombia ...............................3.1
15 Bahrain ..................................5.0 85 Philippines .............................3.1
16 Costa Rica .............................4.9 86 New Zealand .........................3.0
17 Iceland ...................................4.9 87 El Salvador.............................3.0
18 Belgium .................................4.9 88 Honduras ...............................3.0
19 Ireland....................................4.8 89 Senegal..................................3.0
20 Finland ...................................4.8 90 Turkey ....................................3.0
21 Korea, Rep.............................4.8 91 Bangladesh............................2.8
22 Australia.................................4.8 92 Italy........................................2.8
23 Denmark ................................4.8 93 Latvia .....................................2.8
24 Oman.....................................4.8 94 Azerbaijan ..............................2.8
25 Taiwan, China ........................4.7 95 Madagascar ...........................2.8
26 Japan .....................................4.7 96 Ethiopia..................................2.8
27 Indonesia ...............................4.6 97 Armenia .................................2.8
28 Malaysia ................................4.6 98 Jamaica .................................2.7
29 Barbados ...............................4.5 99 Hungary .................................2.7
30 Austria ...................................4.5 100 Uganda ..................................2.7
31 Germany ................................4.5 101 Slovak Republic .....................2.7 451
32 Israel ......................................4.4 102 Nicaragua...............................2.7
33 Panama..................................4.3 103 Greece...................................2.7
34 India.......................................4.3 104 Georgia ..................................2.7
35 Rwanda .................................4.3 105 Chad ......................................2.7
36 Cyprus ...................................4.3 106 Burkina Faso..........................2.7
37 China .....................................4.3 107 Albania...................................2.7
38 Thailand .................................4.2 108 Uruguay .................................2.7
39 Brazil ......................................4.2 109 Iran, Islamic Rep....................2.7
40 Brunei Darussalam ................4.2 110 Lithuania ................................2.6
41 France....................................4.1 111 Tajikistan ................................2.6
42 Tunisia....................................4.1 112 Ecuador .................................2.5
43 Kuwait ...................................4.1 113 Lebanon.................................2.5
44 Malta .....................................4.0 114 Egypt .....................................2.5
45 Gambia, The ..........................4.0 115 Ukraine ..................................2.5
46 Botswana ..............................3.9 116 Romania ................................2.4
47 Angola ...................................3.9 117 Cameroon..............................2.4
48 Slovenia .................................3.8 118 Syria.......................................2.4
49 Guatemala .............................3.7 119 Paraguay................................2.4
50 Peru .......................................3.7 120 Mali........................................2.4
51 Sri Lanka................................3.7 121 Zimbabwe..............................2.4
52 Spain......................................3.7 122 Croatia ...................................2.3
53 Cambodia ..............................3.6 123 Mongolia................................2.3
54 Namibia .................................3.6 124 Bolivia ....................................2.2
55 Montenegro...........................3.6 125 Algeria ...................................2.2
56 Kenya.....................................3.6 126 Macedonia, FYR ....................2.2
57 Estonia...................................3.5 127 Bulgaria..................................2.2
58 Trinidad and Tobago...............3.5 128 Venezuela ..............................2.1
59 Timor-Leste............................3.5 129 Nepal .....................................2.1
60 Vietnam .................................3.5 130 Moldova.................................2.1
61 Czech Republic......................3.5 131 Guyana ..................................2.1
62 South Africa...........................3.5 132 Burundi ..................................2.1
63 Mozambique..........................3.4 133 Lesotho .................................2.0
64 Ghana ....................................3.4 134 Libya ......................................2.0
65 Portugal .................................3.4 135 Mauritania..............................2.0
66 Jordan....................................3.4 136 Serbia ....................................2.0
67 Argentina ...............................3.3 137 Swaziland ..............................2.0
68 Pakistan .................................3.3 138 Bosnia and Herzegovina........2.0
69 Benin .....................................3.3 139 Kyrgyz Republic .....................2.0
70 Mauritius ...............................3.2
SOURCE: World Economic Forum, Executive Opinion Survey
The Global Competitiveness Report 2010-2011 © 2010 World Economic Forum](https://image.slidesharecdn.com/globalcompetitivenessreportwef2010-11-100928142139-phpapp02/75/Global-competitiveness-report-wef-2010-11-464-2048.jpg)
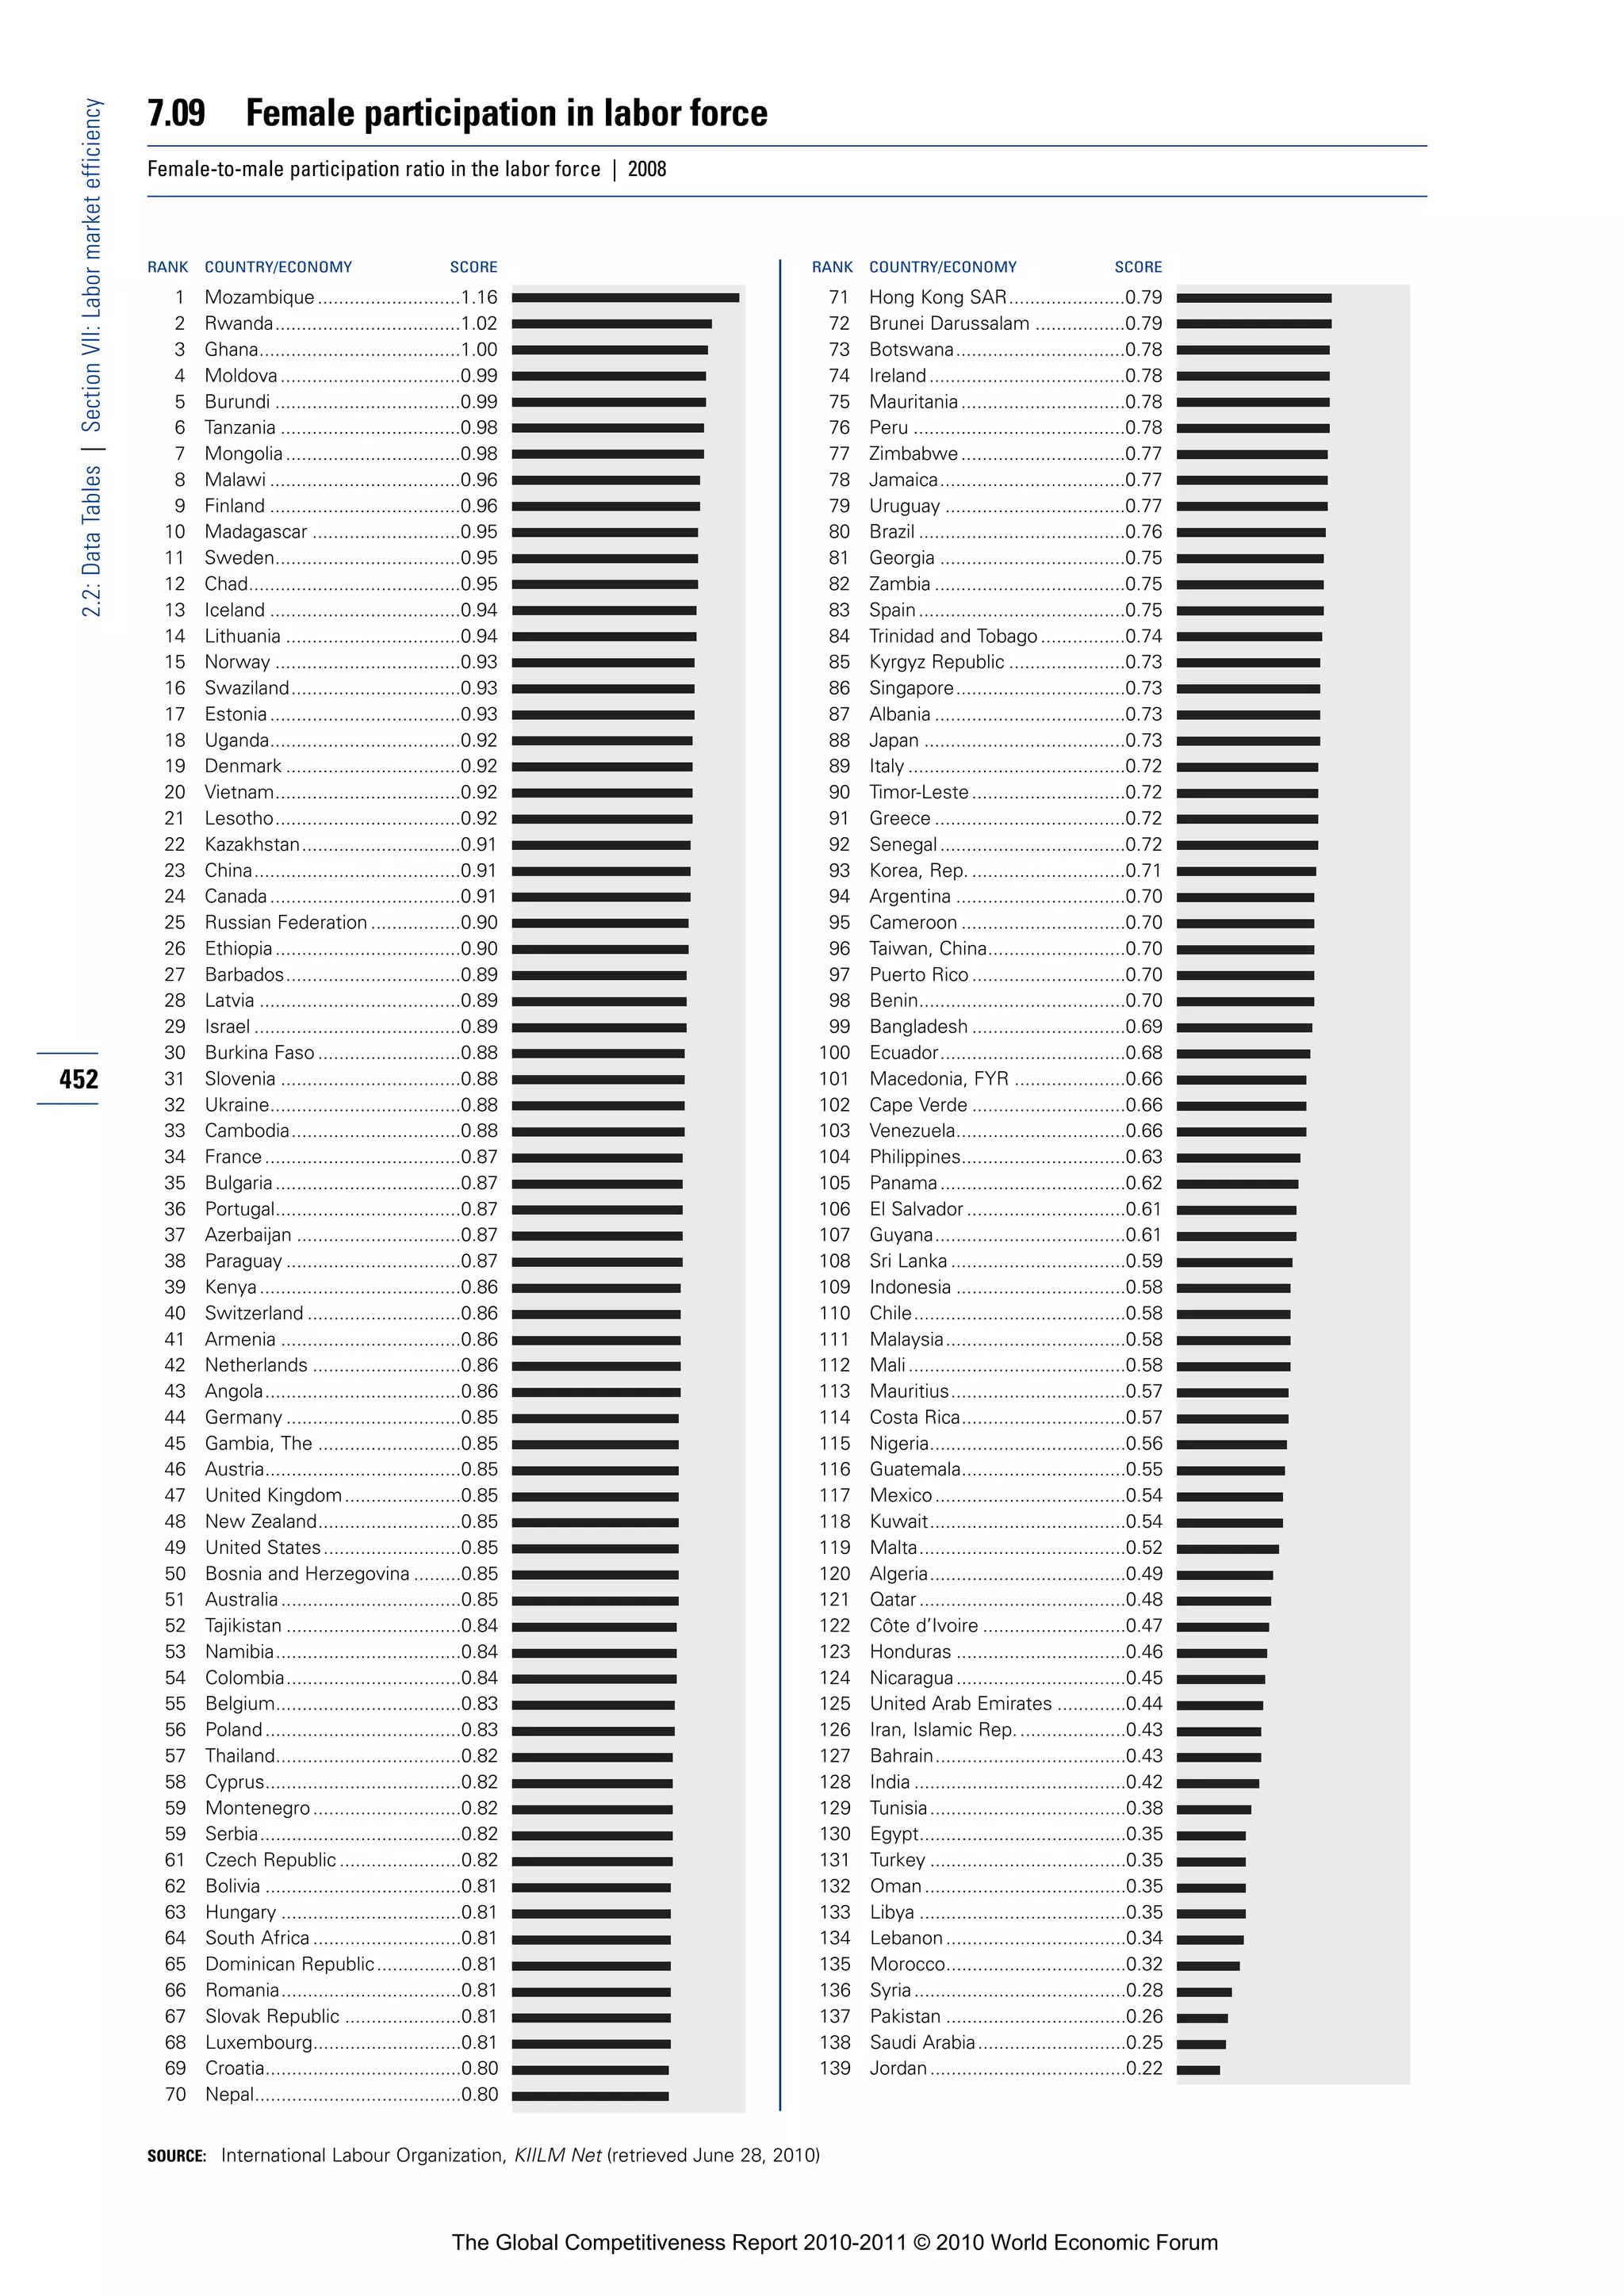
![8.01 Availability of financial services
2.2: Data Tables | Section VIII: Financial market development
To what extent does competition among providers of financial services in your country ensure the provision of financial services at affordable
prices? [1 = not at all; 7 = extremely well] | 2010
RANK COUNTRY/ECONOMY SCORE 1 MEAN: 4.6 7 RANK COUNTRY/ECONOMY SCORE 1 MEAN: 4.6 7
1 Switzerland ............................6.6 71 China .....................................4.6
2 Canada...................................6.4 72 Gambia, The ..........................4.6
3 Luxembourg ..........................6.4 73 Botswana ..............................4.5
4 Hong Kong SAR ....................6.3 74 Lithuania ................................4.5
5 United Kingdom.....................6.3 75 Paraguay................................4.5
6 Sweden .................................6.3 76 Montenegro...........................4.4
7 South Africa...........................6.2 77 Slovenia .................................4.3
8 Germany ................................6.1 78 Ghana ....................................4.3
9 Norway ..................................6.1 79 Mexico...................................4.3
10 Belgium .................................6.1 80 Uganda ..................................4.3
11 Panama..................................6.1 81 Uruguay .................................4.3
12 Finland ...................................6.0 82 Italy........................................4.3
13 Netherlands ...........................6.0 83 Croatia ...................................4.3
14 Australia.................................6.0 84 Benin .....................................4.3
15 United States.........................6.0 85 Senegal..................................4.3
16 France....................................5.9 86 Latvia .....................................4.3
17 Austria ...................................5.9 87 Vietnam .................................4.2
18 Bahrain ..................................5.8 88 Cambodia ..............................4.2
19 Chile ......................................5.8 89 Nicaragua...............................4.2
20 Singapore ..............................5.7 90 Nigeria ...................................4.2
21 Puerto Rico............................5.7 91 Guyana ..................................4.2
22 Portugal .................................5.6 92 Mozambique..........................4.2
23 Taiwan, China ........................5.6 93 Kazakhstan ............................4.1
24 Malaysia ................................5.6 94 Swaziland ..............................4.1
25 Spain......................................5.6 95 Bulgaria..................................4.1
26 Qatar......................................5.6 96 Bolivia ....................................4.1
27 Brazil ......................................5.6 97 Bangladesh............................4.1
28 Denmark ................................5.6 98 Korea, Rep.............................4.0
29 Israel ......................................5.5 99 Malawi ...................................4.0
30 Saudi Arabia...........................5.5 100 Rwanda .................................4.0
454 31 Peru .......................................5.5 101 Pakistan .................................4.0
32 United Arab Emirates ............5.4 102 Azerbaijan ..............................4.0
33 Malta .....................................5.4 103 Iceland ...................................4.0
34 Guatemala .............................5.3 104 Romania ................................3.9
35 New Zealand .........................5.3 105 Côte d’Ivoire ..........................3.9
36 Namibia .................................5.2 106 Georgia ..................................3.9
37 Cyprus ...................................5.2 107 Venezuela ..............................3.9
38 Slovak Republic .....................5.2 108 Ukraine ..................................3.8
39 Lebanon.................................5.2 109 Russian Federation................3.8
40 Thailand .................................5.2 110 Ecuador .................................3.8
41 Japan .....................................5.2 111 Serbia ....................................3.8
42 Tunisia....................................5.2 112 Mali........................................3.7
43 Estonia...................................5.1 113 Cape Verde ............................3.7
44 Mauritius ...............................5.1 114 Moldova.................................3.7
45 India.......................................5.1 115 Zimbabwe..............................3.6
46 Kuwait ...................................5.1 116 Nepal .....................................3.6
47 Czech Republic......................5.1 117 Madagascar ...........................3.6
48 Sri Lanka................................5.1 118 Tajikistan ................................3.6
49 Philippines .............................5.1 119 Bosnia and Herzegovina........3.6
50 Ireland....................................5.0 120 Tanzania .................................3.6
51 Hungary .................................5.0 121 Armenia .................................3.5
52 Turkey ....................................5.0 122 Macedonia, FYR ....................3.5
53 Kenya.....................................5.0 123 Kyrgyz Republic .....................3.5
54 Colombia ...............................4.9 124 Ethiopia..................................3.4
55 El Salvador.............................4.9 125 Argentina ...............................3.4
56 Trinidad and Tobago...............4.9 126 Mongolia................................3.4
57 Oman.....................................4.9 127 Cameroon..............................3.3
58 Barbados ...............................4.9 128 Albania...................................3.3
59 Indonesia ...............................4.8 129 Angola ...................................3.3
60 Egypt .....................................4.8 130 Syria.......................................3.3
61 Morocco ................................4.8 131 Algeria ...................................3.2
62 Poland....................................4.8 132 Burkina Faso..........................3.1
63 Jamaica .................................4.8 133 Iran, Islamic Rep....................3.0
64 Greece...................................4.7 134 Lesotho .................................3.0
65 Costa Rica .............................4.7 135 Burundi ..................................2.9
66 Honduras ...............................4.7 136 Libya ......................................2.7
67 Jordan....................................4.7 137 Mauritania..............................2.6
68 Dominican Republic...............4.7 138 Chad ......................................2.5
69 Zambia...................................4.7 139 Timor-Leste............................2.4
70 Brunei Darussalam ................4.6
SOURCE: World Economic Forum, Executive Opinion Survey
The Global Competitiveness Report 2010-2011 © 2010 World Economic Forum](https://image.slidesharecdn.com/globalcompetitivenessreportwef2010-11-100928142139-phpapp02/75/Global-competitiveness-report-wef-2010-11-467-2048.jpg)
![8.02 Affordability of financial services
2.2: Data Tables | Section VIII: Financial market development
To what extent does competition among providers of financial services in your country ensure the provision of financial services at affordable
prices? [1 = not at all; 7 = extremely well] | 2010
RANK COUNTRY/ECONOMY SCORE 1 MEAN: 4.2 7 RANK COUNTRY/ECONOMY SCORE 1 MEAN: 4.2 7
1 Switzerland ............................6.0 71 Cambodia ..............................4.1
2 Taiwan, China ........................6.0 72 Vietnam .................................4.1
3 Hong Kong SAR ....................5.8 73 Dominican Republic...............4.1
4 Panama..................................5.8 74 Zambia...................................4.1
5 Singapore ..............................5.8 75 Greece...................................4.1
6 Finland ...................................5.7 76 Latvia .....................................4.1
7 Luxembourg ..........................5.7 77 Benin .....................................4.1
8 Qatar......................................5.6 78 Slovenia .................................4.1
9 Norway ..................................5.6 79 Namibia .................................4.0
10 United Kingdom.....................5.6 80 Rwanda .................................4.0
11 Bahrain ..................................5.5 81 Senegal..................................4.0
12 Sweden .................................5.5 82 Korea, Rep.............................4.0
13 Chile ......................................5.5 83 Bolivia ....................................3.9
14 Canada...................................5.5 84 Nigeria ...................................3.9
15 Malaysia ................................5.5 85 Pakistan .................................3.9
16 France....................................5.4 86 Botswana ..............................3.9
17 Netherlands ...........................5.4 87 Nicaragua...............................3.9
18 Germany ................................5.4 88 Bangladesh............................3.9
19 Saudi Arabia...........................5.4 89 Ghana ....................................3.9
20 Belgium .................................5.3 90 Uganda ..................................3.8
21 United States.........................5.3 91 Guyana ..................................3.8
22 Puerto Rico............................5.3 92 Russian Federation................3.8
23 Spain......................................5.2 93 Mozambique..........................3.8
24 Portugal .................................5.2 94 Croatia ...................................3.8
25 Australia.................................5.1 95 Jamaica .................................3.8
26 Austria ...................................5.1 96 Czech Republic......................3.7
27 Guatemala .............................5.0 97 Zimbabwe..............................3.7
28 Oman.....................................5.0 98 Cape Verde ............................3.7
29 Thailand .................................5.0 99 Serbia ....................................3.6
30 Malta .....................................5.0 100 Romania ................................3.6
31 Tunisia....................................5.0 101 Côte d’Ivoire ..........................3.6 455
32 Peru .......................................5.0 102 Kazakhstan ............................3.6
33 Japan .....................................5.0 103 Swaziland ..............................3.6
34 United Arab Emirates ............5.0 104 Armenia .................................3.6
35 Denmark ................................5.0 105 Mexico...................................3.6
36 Lebanon.................................4.9 106 Italy........................................3.5
37 Philippines .............................4.8 107 Malawi ...................................3.5
38 India.......................................4.8 108 Georgia ..................................3.5
39 Kuwait ...................................4.8 109 Venezuela ..............................3.5
40 Turkey ....................................4.8 110 Hungary .................................3.5
41 Mauritius ...............................4.8 111 Bulgaria..................................3.5
42 Sri Lanka................................4.8 112 Macedonia, FYR ....................3.5
43 South Africa...........................4.7 113 Albania...................................3.5
44 China .....................................4.7 114 Ecuador .................................3.4
45 New Zealand .........................4.6 115 Tanzania .................................3.4
46 Cyprus ...................................4.6 116 Iceland ...................................3.4
47 Slovak Republic .....................4.6 117 Nepal .....................................3.4
48 Brunei Darussalam ................4.5 118 Tajikistan ................................3.4
49 Estonia...................................4.5 119 Ethiopia..................................3.3
50 Ireland....................................4.5 120 Bosnia and Herzegovina........3.2
51 Israel ......................................4.5 121 Argentina ...............................3.2
52 Brazil ......................................4.5 122 Ukraine ..................................3.2
53 Barbados ...............................4.5 123 Mali........................................3.2
54 Trinidad and Tobago...............4.5 124 Mongolia................................3.2
55 Costa Rica .............................4.5 125 Syria.......................................3.2
56 Morocco ................................4.5 126 Kyrgyz Republic .....................3.1
57 Paraguay ................................4.4 127 Cameroon..............................3.1
58 Jordan....................................4.4 128 Moldova.................................3.1
59 Indonesia ...............................4.4 129 Iran, Islamic Rep....................3.1
60 Honduras ...............................4.4 130 Lesotho .................................3.1
61 Gambia, The ..........................4.4 131 Madagascar ...........................2.9
62 Montenegro...........................4.3 132 Angola ...................................2.9
63 Poland....................................4.3 133 Chad ......................................2.8
64 Uruguay .................................4.3 134 Burundi ..................................2.8
65 Lithuania ................................4.3 135 Burkina Faso..........................2.7
66 Colombia ...............................4.3 136 Algeria ...................................2.7
67 Kenya.....................................4.3 137 Timor-Leste............................2.6
68 Azerbaijan ..............................4.2 138 Mauritania..............................2.6
69 Egypt .....................................4.2 139 Libya ......................................2.4
70 El Salvador.............................4.1
SOURCE: World Economic Forum, Executive Opinion Survey
The Global Competitiveness Report 2010-2011 © 2010 World Economic Forum](https://image.slidesharecdn.com/globalcompetitivenessreportwef2010-11-100928142139-phpapp02/75/Global-competitiveness-report-wef-2010-11-468-2048.jpg)
![8.03 Financing through local equity market
2.2: Data Tables | Section VIII: Financial market development
How easy is it to raise money by issuing shares on the stock market in your country? [1 = very difficult; 7 = very easy] | 2009–10 weighted
average
RANK COUNTRY/ECONOMY SCORE 1 MEAN: 3.4 7 RANK COUNTRY/ECONOMY SCORE 1 MEAN: 3.4 7
1 Qatar......................................5.2 71 Portugal .................................3.5
2 Hong Kong SAR ....................5.2 72 Colombia ...............................3.5
3 Saudi Arabia...........................4.8 73 Italy........................................3.5
4 Taiwan, China ........................4.8 74 Barbados ...............................3.4
5 Singapore ..............................4.8 75 Tanzania .................................3.4
6 France....................................4.8 76 Trinidad and Tobago...............3.4
7 South Africa...........................4.7 77 Uganda ..................................3.4
8 Canada...................................4.7 78 Paraguay................................3.4
9 Malta .....................................4.7 79 Azerbaijan ..............................3.3
10 India.......................................4.7 80 Senegal..................................3.3
11 Malaysia ................................4.7 81 Spain......................................3.3
12 Bangladesh............................4.6 82 Iran, Islamic Rep....................3.3
13 Indonesia ...............................4.6 83 Lithuania ................................3.3
14 Nepal .....................................4.6 84 Slovenia .................................3.2
15 Australia.................................4.6 85 Macedonia, FYR ....................3.2
16 Norway ..................................4.6 86 Swaziland ..............................3.2
17 Sri Lanka................................4.5 87 Burkina Faso..........................3.1
18 Oman.....................................4.4 88 Cameroon..............................3.1
19 Chile ......................................4.4 89 Romania ................................3.1
20 Sweden .................................4.4 90 Bulgaria..................................3.1
21 Kenya.....................................4.4 91 Gambia, The ..........................3.1
22 Switzerland ............................4.4 92 Rwanda .................................3.1
23 New Zealand .........................4.4 93 Mozambique..........................3.0
24 Japan .....................................4.4 94 Mexico...................................3.0
25 Tunisia....................................4.4 95 Bolivia ....................................2.9
26 Luxembourg ..........................4.3 96 Croatia ...................................2.9
27 United Arab Emirates ............4.3 97 Ecuador .................................2.8
28 Thailand .................................4.3 98 Guyana ..................................2.8
29 Egypt .....................................4.2 99 Mongolia................................2.8
30 Panama..................................4.2 100 Ethiopia..................................2.8
456 31 Morocco ................................4.2 101 Serbia ....................................2.8
32 United Kingdom.....................4.1 102 Bosnia and Herzegovina........2.8
33 Jordan....................................4.1 103 Syria.......................................2.8
34 Côte d’Ivoire ..........................4.1 104 El Salvador.............................2.8
35 Vietnam .................................4.1 105 Ireland....................................2.8
36 United States.........................4.1 106 Kazakhstan ............................2.8
37 Israel ......................................4.0 107 Russian Federation................2.7
38 Ghana ....................................4.0 108 Nicaragua...............................2.7
39 Czech Republic......................4.0 109 Tajikistan ................................2.7
40 Nigeria ...................................4.0 110 Slovak Republic .....................2.6
41 Malawi ...................................3.9 111 Hungary .................................2.6
42 Kuwait ...................................3.9 112 Brunei Darussalam ................2.6
43 Pakistan .................................3.9 113 Mali........................................2.5
44 Zimbabwe..............................3.9 114 Costa Rica .............................2.5
45 Brazil ......................................3.9 115 Lebanon.................................2.5
46 Turkey ....................................3.9 116 Latvia .....................................2.5
47 Jamaica .................................3.9 117 Dominican Republic...............2.5
48 Finland ...................................3.9 118 Argentina ...............................2.4
49 Germany ................................3.9 119 Chad ......................................2.4
50 Montenegro...........................3.9 120 Ukraine ..................................2.3
51 Bahrain ..................................3.9 121 Kyrgyz Republic .....................2.3
52 China .....................................3.8 122 Libya ......................................2.3
53 Mauritius ...............................3.8 123 Cambodia ..............................2.3
54 Zambia...................................3.8 124 Moldova.................................2.2
55 Cape Verde ............................3.8 125 Georgia ..................................2.2
56 Philippines .............................3.8 126 Guatemala .............................2.2
57 Namibia .................................3.8 127 Algeria ...................................2.2
58 Austria ...................................3.8 128 Venezuela ..............................2.1
59 Korea, Rep.............................3.8 129 Uruguay .................................2.1
60 Denmark ................................3.7 130 Lesotho .................................2.1
61 Netherlands ...........................3.7 131 Armenia .................................2.0
62 Benin .....................................3.7 132 Honduras ...............................2.0
63 Peru .......................................3.7 133 Mauritania..............................2.0
64 Poland....................................3.7 134 Iceland ...................................1.9
65 Cyprus ...................................3.6 135 Timor-Leste............................1.9
66 Greece...................................3.6 136 Madagascar ...........................1.8
67 Belgium .................................3.6 137 Albania...................................1.8
68 Estonia...................................3.6 138 Burundi ..................................1.5
69 Botswana ..............................3.6 139 Angola ...................................1.5
70 Puerto Rico............................3.6
SOURCE: World Economic Forum, Executive Opinion Survey
The Global Competitiveness Report 2010-2011 © 2010 World Economic Forum](https://image.slidesharecdn.com/globalcompetitivenessreportwef2010-11-100928142139-phpapp02/75/Global-competitiveness-report-wef-2010-11-469-2048.jpg)
![8.04 Ease of access to loans
2.2: Data Tables | Section VIII: Financial market development
How easy is it to obtain a bank loan in your country with only a good business plan and no collateral? [1 = very difficult; 7 = very easy] | 2009–10
weighted average
RANK COUNTRY/ECONOMY SCORE 1 MEAN: 2.9 7 RANK COUNTRY/ECONOMY SCORE 1 MEAN: 2.9 7
1 Qatar......................................5.0 71 Vietnam .................................2.7
2 Bahrain ..................................4.9 72 Timor-Leste............................2.7
3 Luxembourg ..........................4.7 73 Paraguay................................2.7
4 Singapore ..............................4.5 74 United Kingdom.....................2.7
5 Finland ...................................4.5 75 Barbados ...............................2.7
6 Saudi Arabia...........................4.4 76 Greece...................................2.6
7 Norway ..................................4.4 77 Turkey ....................................2.6
8 United Arab Emirates ............4.3 78 Romania ................................2.6
9 Hong Kong SAR ....................4.2 79 Bangladesh............................2.6
10 Malaysia ................................4.2 80 Dominican Republic...............2.5
11 Sweden .................................4.2 81 Croatia ...................................2.5
12 Malta .....................................4.2 82 Trinidad and Tobago...............2.5
13 Oman.....................................4.1 83 Georgia ..................................2.5
14 Indonesia ...............................4.0 84 Tajikistan ................................2.5
15 Panama..................................4.0 85 Spain......................................2.5
16 Australia.................................3.9 86 Hungary .................................2.5
17 Belgium .................................3.9 87 Libya ......................................2.5
18 Cyprus ...................................3.8 88 Nepal .....................................2.5
19 Taiwan, China ........................3.7 89 Nicaragua...............................2.5
20 Netherlands ...........................3.7 90 Albania...................................2.4
21 Kenya.....................................3.7 91 Serbia ....................................2.4
22 Switzerland ............................3.7 92 Cambodia ..............................2.4
23 Chile ......................................3.7 93 El Salvador.............................2.4
24 Canada...................................3.6 94 Guyana ..................................2.4
25 Montenegro...........................3.6 95 Costa Rica .............................2.4
26 Kuwait ...................................3.6 96 Mexico...................................2.4
27 New Zealand .........................3.6 97 Honduras ...............................2.3
28 Denmark ................................3.5 98 Senegal..................................2.3
29 Botswana ..............................3.5 99 Uganda ..................................2.3
30 Tunisia....................................3.5 100 Syria.......................................2.3
31 Thailand .................................3.4 101 Lesotho .................................2.3 457
32 Mauritius ...............................3.4 102 Bosnia and Herzegovina........2.3
33 Brunei Darussalam ................3.4 103 Cape Verde ............................2.3
34 United States.........................3.4 104 Iceland ...................................2.3
35 France....................................3.4 105 Ghana ....................................2.3
36 Lebanon.................................3.3 106 Zambia...................................2.3
37 Peru .......................................3.3 107 Russian Federation................2.3
38 Sri Lanka................................3.3 108 Ecuador .................................2.3
39 India.......................................3.3 109 Bolivia ....................................2.3
40 Pakistan .................................3.3 110 Rwanda .................................2.2
41 South Africa...........................3.2 111 Angola ...................................2.2
42 Austria ...................................3.2 112 Lithuania ................................2.2
43 Slovak Republic .....................3.2 113 Italy........................................2.2
44 Morocco ................................3.1 114 Malawi ...................................2.2
45 Puerto Rico............................3.1 115 Chad ......................................2.1
46 Japan .....................................3.1 116 Venezuela ..............................2.1
47 Czech Republic......................3.1 117 Ireland....................................2.1
48 Namibia .................................3.1 118 Korea, Rep.............................2.1
49 Egypt .....................................3.0 119 Moldova.................................2.1
50 Estonia...................................3.0 120 Ethiopia..................................2.1
51 China .....................................3.0 121 Kazakhstan ............................2.1
52 Jordan....................................3.0 122 Macedonia, FYR ....................2.1
53 Portugal .................................3.0 123 Mozambique..........................2.0
54 Israel ......................................2.9 124 Armenia .................................2.0
55 Philippines .............................2.9 125 Latvia .....................................2.0
56 Slovenia .................................2.9 126 Nigeria ...................................2.0
57 Benin .....................................2.9 127 Zimbabwe..............................2.0
58 Madagascar ...........................2.9 128 Jamaica .................................2.0
59 Poland....................................2.9 129 Kyrgyz Republic .....................2.0
60 Gambia, The ..........................2.9 130 Ukraine ..................................1.9
61 Colombia ...............................2.9 131 Mali........................................1.9
62 Bulgaria..................................2.8 132 Cameroon..............................1.9
63 Guatemala .............................2.8 133 Mauritania..............................1.8
64 Tanzania .................................2.8 134 Argentina ...............................1.7
65 Brazil ......................................2.8 135 Burundi ..................................1.6
66 Azerbaijan ..............................2.8 136 Iran, Islamic Rep....................1.6
67 Algeria ...................................2.8 137 Burkina Faso..........................1.6
68 Swaziland ..............................2.8 138 Côte d’Ivoire ..........................1.5
69 Germany ................................2.8 139 Mongolia................................1.5
70 Uruguay .................................2.7
SOURCE: World Economic Forum, Executive Opinion Survey
The Global Competitiveness Report 2010-2011 © 2010 World Economic Forum](https://image.slidesharecdn.com/globalcompetitivenessreportwef2010-11-100928142139-phpapp02/75/Global-competitiveness-report-wef-2010-11-470-2048.jpg)
![8.05 Venture capital availability
2.2: Data Tables | Section VIII: Financial market development
In your country, how easy is it for entrepreneurs with innovative but risky projects to find venture capital? [1 = very difficult; 7 = very easy] |
2009–10 weighted average
RANK COUNTRY/ECONOMY SCORE 1 MEAN: 2.7 7 RANK COUNTRY/ECONOMY SCORE 1 MEAN: 2.7 7
1 Hong Kong SAR ....................4.4 71 Bulgaria..................................2.5
2 Norway ..................................4.3 72 Macedonia, FYR ....................2.5
3 Singapore ..............................4.2 73 Gambia, The ..........................2.5
4 Finland ...................................4.2 74 Uruguay .................................2.5
5 Luxembourg ..........................4.2 75 Philippines .............................2.5
6 Qatar......................................4.1 76 Cambodia ..............................2.5
7 Sweden .................................4.0 77 Rwanda .................................2.5
8 Malaysia ................................3.9 78 Guatemala .............................2.4
9 Indonesia ...............................3.9 79 Bolivia ....................................2.4
10 Israel ......................................3.9 80 Romania ................................2.4
11 Taiwan, China ........................3.9 81 Algeria ...................................2.4
12 Australia.................................3.8 82 Kazakhstan ............................2.4
13 United States.........................3.8 83 Costa Rica .............................2.4
14 Saudi Arabia...........................3.8 84 Iceland ...................................2.4
15 Oman.....................................3.8 85 Nicaragua...............................2.4
16 United Arab Emirates ............3.7 86 Barbados ...............................2.3
17 Netherlands ...........................3.7 87 Greece...................................2.3
18 Bahrain ..................................3.7 88 Paraguay................................2.3
19 Canada...................................3.7 89 Ireland....................................2.3
20 Switzerland ............................3.5 90 Swaziland ..............................2.3
21 Tunisia....................................3.5 91 El Salvador.............................2.3
22 Kuwait ...................................3.4 92 Chad ......................................2.3
23 Cyprus ...................................3.4 93 Honduras ...............................2.3
24 Montenegro...........................3.4 94 Senegal..................................2.3
25 Belgium .................................3.3 95 Russian Federation................2.3
26 New Zealand .........................3.3 96 Mexico...................................2.3
27 China .....................................3.3 97 Bangladesh............................2.2
28 Panama..................................3.3 98 Korea, Rep.............................2.2
29 Denmark ................................3.3 99 Turkey ....................................2.2
30 Estonia...................................3.3 100 Guyana ..................................2.2
458 31 India.......................................3.2 101 Latvia .....................................2.2
32 France....................................3.2 102 Serbia ....................................2.2
33 Sri Lanka................................3.2 103 Lithuania ................................2.2
34 Chile ......................................3.2 104 Italy........................................2.2
35 Kenya.....................................3.1 105 Hungary .................................2.2
36 Malta .....................................3.1 106 Nepal .....................................2.2
37 Puerto Rico............................3.1 107 Albania...................................2.1
38 United Kingdom.....................3.0 108 Croatia ...................................2.1
39 South Africa...........................3.0 109 Georgia ..................................2.1
40 Morocco ................................3.0 110 Mozambique..........................2.1
41 Egypt .....................................3.0 111 Ghana ....................................2.1
42 Peru .......................................2.9 112 Dominican Republic...............2.1
43 Austria ...................................2.9 113 Syria.......................................2.1
44 Thailand .................................2.9 114 Ethiopia..................................2.1
45 Slovenia .................................2.9 115 Cape Verde ............................2.1
46 Brunei Darussalam ................2.9 116 Lesotho .................................2.1
47 Botswana ..............................2.9 117 Ecuador .................................2.0
48 Azerbaijan ..............................2.9 118 Zambia...................................2.0
49 Japan .....................................2.8 119 Venezuela ..............................2.0
50 Mauritius ...............................2.8 120 Nigeria ...................................2.0
51 Pakistan .................................2.8 121 Ukraine ..................................1.9
52 Germany ................................2.8 122 Uganda ..................................1.9
53 Portugal .................................2.7 123 Mauritania..............................1.9
54 Jordan....................................2.7 124 Argentina ...............................1.9
55 Libya ......................................2.7 125 Jamaica .................................1.9
56 Poland....................................2.7 126 Bosnia and Herzegovina........1.9
57 Vietnam .................................2.7 127 Moldova.................................1.9
58 Spain......................................2.6 128 Cameroon..............................1.8
59 Timor-Leste............................2.6 129 Angola ...................................1.8
60 Brazil ......................................2.6 130 Kyrgyz Republic .....................1.8
61 Slovak Republic .....................2.6 131 Armenia .................................1.8
62 Benin .....................................2.6 132 Malawi ...................................1.8
63 Czech Republic......................2.6 133 Iran, Islamic Rep....................1.8
64 Tanzania .................................2.6 134 Zimbabwe..............................1.7
65 Namibia .................................2.6 135 Mali........................................1.7
66 Colombia ...............................2.5 136 Mongolia................................1.7
67 Lebanon.................................2.5 137 Côte d’Ivoire ..........................1.6
68 Trinidad and Tobago...............2.5 138 Burkina Faso..........................1.5
69 Tajikistan ................................2.5 139 Burundi ..................................1.5
70 Madagascar ...........................2.5
SOURCE: World Economic Forum, Executive Opinion Survey
The Global Competitiveness Report 2010-2011 © 2010 World Economic Forum](https://image.slidesharecdn.com/globalcompetitivenessreportwef2010-11-100928142139-phpapp02/75/Global-competitiveness-report-wef-2010-11-471-2048.jpg)
![8.06 Restriction on capital flows
2.2: Data Tables | Section VIII: Financial market development
How restrictive are regulations in your country related to international capital flows? [1 = highly restrictive; 7 = not restrictive at all] | 2009–10
weighted average
RANK COUNTRY/ECONOMY SCORE 1 MEAN: 4.4 7 RANK COUNTRY/ECONOMY SCORE 1 MEAN: 4.4 7
1 Hong Kong SAR ....................6.5 71 Guyana ..................................4.4
2 Finland ...................................6.1 72 Brunei Darussalam ................4.4
3 Switzerland ............................6.0 73 Brazil ......................................4.4
4 Sweden .................................5.9 74 Malaysia ................................4.4
5 Lebanon.................................5.9 75 India.......................................4.4
6 Singapore ..............................5.9 76 Thailand .................................4.4
7 Uruguay .................................5.8 77 Kuwait ...................................4.3
8 Mauritius ...............................5.7 78 Cape Verde ............................4.3
9 Qatar......................................5.7 79 Honduras ...............................4.3
10 United Kingdom.....................5.7 80 Italy........................................4.3
11 Estonia...................................5.7 81 Slovenia .................................4.2
12 Bahrain ..................................5.6 82 Kenya.....................................4.2
13 Luxembourg ..........................5.6 83 Pakistan .................................4.2
14 Ireland....................................5.6 84 Egypt .....................................4.1
15 Germany ................................5.5 85 Romania ................................4.1
16 United Arab Emirates ............5.5 86 Serbia ....................................4.1
17 Austria ...................................5.4 87 Costa Rica .............................4.1
18 New Zealand .........................5.4 88 Tunisia....................................4.1
19 Netherlands ...........................5.4 89 Nigeria ...................................4.0
20 Chile ......................................5.4 90 Namibia .................................4.0
21 Portugal .................................5.4 91 Croatia ...................................4.0
22 Peru .......................................5.3 92 Benin .....................................4.0
23 Cyprus ...................................5.3 93 Swaziland ..............................4.0
24 Saudi Arabia...........................5.3 94 Korea, Rep.............................4.0
25 Czech Republic......................5.2 95 Tanzania .................................3.9
26 Norway ..................................5.2 96 Vietnam .................................3.9
27 Botswana ..............................5.2 97 Mongolia................................3.9
28 Hungary .................................5.2 98 Timor-Leste............................3.9
29 Guatemala .............................5.2 99 South Africa...........................3.9
30 Malta .....................................5.1 100 Cameroon..............................3.9
31 Panama..................................5.1 101 Taiwan, China ........................3.8 459
32 Australia.................................5.1 102 Moldova.................................3.8
33 Belgium .................................5.1 103 Macedonia, FYR ....................3.8
34 Oman.....................................5.1 104 Colombia ...............................3.8
35 Jordan....................................5.1 105 Morocco ................................3.8
36 Denmark ................................5.1 106 Kazakhstan ............................3.7
37 Montenegro...........................5.1 107 Côte d’Ivoire ..........................3.7
38 El Salvador.............................5.1 108 Lesotho .................................3.7
39 Canada...................................5.0 109 Senegal..................................3.7
40 Georgia ..................................5.0 110 Malawi ...................................3.7
41 Turkey ....................................5.0 111 Bulgaria..................................3.7
42 Mexico...................................4.9 112 Bangladesh............................3.6
43 Slovak Republic .....................4.9 113 Zimbabwe..............................3.6
44 Spain......................................4.9 114 Tajikistan ................................3.6
45 Uganda ..................................4.8 115 Nepal .....................................3.6
46 France....................................4.8 116 Bolivia ....................................3.6
47 Jamaica .................................4.8 117 Syria.......................................3.5
48 Dominican Republic...............4.8 118 Barbados ...............................3.5
49 Indonesia ...............................4.8 119 Russian Federation................3.4
50 Albania...................................4.7 120 Bosnia and Herzegovina........3.4
51 Japan .....................................4.7 121 Mozambique..........................3.4
52 Greece...................................4.7 122 Mali........................................3.3
53 Israel ......................................4.7 123 China .....................................3.3
54 Cambodia ..............................4.7 124 Iran, Islamic Rep....................3.2
55 Latvia .....................................4.7 125 Ukraine ..................................3.2
56 Paraguay ................................4.7 126 Burkina Faso..........................3.2
57 Armenia .................................4.7 127 Kyrgyz Republic .....................3.1
58 Trinidad and Tobago...............4.6 128 Mauritania..............................3.1
59 Rwanda .................................4.6 129 Ethiopia..................................3.1
60 Zambia...................................4.6 130 Chad ......................................3.0
61 Nicaragua...............................4.5 131 Madagascar ...........................3.0
62 Sri Lanka................................4.5 132 Argentina ...............................3.0
63 Puerto Rico............................4.5 133 Ecuador .................................2.9
64 Philippines .............................4.5 134 Libya ......................................2.9
65 Gambia, The ..........................4.5 135 Burundi ..................................2.7
66 Lithuania ................................4.5 136 Algeria ...................................2.3
67 Poland....................................4.5 137 Iceland ...................................2.1
68 Azerbaijan ..............................4.5 138 Angola ...................................1.9
69 United States.........................4.5 139 Venezuela ..............................1.8
70 Ghana ....................................4.5
SOURCE: World Economic Forum, Executive Opinion Survey
The Global Competitiveness Report 2010-2011 © 2010 World Economic Forum](https://image.slidesharecdn.com/globalcompetitivenessreportwef2010-11-100928142139-phpapp02/75/Global-competitiveness-report-wef-2010-11-472-2048.jpg)
![8.07 Soundness of banks
2.2: Data Tables | Section VIII: Financial market development
How would you assess the soundness of banks in your country? [1 = insolvent and may require a government bailout; 7 = generally healthy with
sound balance sheets] | 2009–10 weighted average
RANK COUNTRY/ECONOMY SCORE 1 MEAN: 5.1 7 RANK COUNTRY/ECONOMY SCORE 1 MEAN: 5.1 7
1 Canada...................................6.7 71 Mozambique..........................5.2
2 New Zealand .........................6.6 72 Estonia...................................5.2
3 Australia.................................6.5 73 Poland....................................5.2
4 Lebanon.................................6.5 74 Kenya.....................................5.1
5 Chile ......................................6.5 75 Gambia, The ..........................5.1
6 South Africa...........................6.5 76 Benin .....................................5.1
7 Panama..................................6.4 77 Japan .....................................5.1
8 Hong Kong SAR ....................6.4 78 Macedonia, FYR ....................5.1
9 Singapore ..............................6.3 79 Portugal .................................5.1
10 Malta .....................................6.3 80 Bolivia ....................................5.0
11 Finland ...................................6.3 81 Armenia .................................5.0
12 Barbados ...............................6.3 82 Bangladesh............................5.0
13 Israel ......................................6.3 83 Ecuador .................................4.9
14 Brazil ......................................6.2 84 Cameroon..............................4.9
15 Namibia .................................6.2 85 Denmark................................4.8
16 Mauritius ...............................6.1 86 Burkina Faso..........................4.8
17 Norway ..................................6.1 87 Lithuania ................................4.8
18 Peru .......................................6.0 88 Pakistan .................................4.8
19 Bahrain ..................................5.9 89 Madagascar ...........................4.8
20 Saudi Arabia...........................5.9 90 Hungary .................................4.8
21 Trinidad and Tobago...............5.9 91 Ethiopia..................................4.7
22 Costa Rica .............................5.9 92 Indonesia ...............................4.7
23 Slovak Republic .....................5.9 93 Nicaragua...............................4.7
24 Czech Republic......................5.9 94 Montenegro...........................4.7
25 India.......................................5.8 95 Rwanda .................................4.7
26 Sweden .................................5.8 96 Vietnam .................................4.7
27 Luxembourg ..........................5.8 97 Romania ................................4.7
28 Oman.....................................5.7 98 Côte d’Ivoire ..........................4.7
29 Malawi ...................................5.7 99 Korea, Rep.............................4.7
30 Thailand .................................5.7 100 Bosnia and Herzegovina........4.6
460 31 Cyprus ...................................5.7 101 Cambodia ..............................4.6
32 El Salvador.............................5.7 102 Angola ...................................4.6
33 Malaysia ................................5.7 103 Puerto Rico............................4.6
34 Colombia ...............................5.7 104 Netherlands ...........................4.6
35 Guatemala .............................5.6 105 Bulgaria..................................4.5
36 Turkey ....................................5.6 106 Moldova.................................4.5
37 Honduras ...............................5.6 107 Albania...................................4.5
38 Philippines .............................5.6 108 Lesotho .................................4.5
39 Botswana ..............................5.6 109 Georgia ..................................4.5
40 France....................................5.6 110 Slovenia .................................4.4
41 Switzerland ............................5.6 111 United States.........................4.4
42 Mexico...................................5.5 112 Germany................................4.4
43 Spain......................................5.5 113 Iran, Islamic Rep....................4.4
44 Swaziland ..............................5.5 114 Azerbaijan ..............................4.4
45 Brunei Darussalam ................5.5 115 Serbia ....................................4.4
46 Qatar......................................5.5 116 Libya ......................................4.4
47 Jamaica .................................5.5 117 Nepal .....................................4.4
48 Austria ...................................5.5 118 Timor-Leste............................4.3
49 Uruguay .................................5.4 119 Tanzania .................................4.3
50 United Arab Emirates ............5.4 120 Belgium .................................4.2
51 Jordan....................................5.4 121 Algeria ...................................4.2
52 Dominican Republic...............5.4 122 Nigeria ...................................4.1
53 Senegal..................................5.4 123 Argentina ...............................4.1
54 Cape Verde ............................5.4 124 Mauritania..............................4.1
55 Guyana ..................................5.4 125 Tajikistan ................................4.0
56 Zambia...................................5.3 126 Venezuela ..............................4.0
57 Italy ........................................5.3 127 Latvia .....................................3.9
58 Taiwan, China ........................5.3 128 Mali........................................3.9
59 Tunisia....................................5.3 129 Russian Federation................3.8
60 China .....................................5.3 130 Kyrgyz Republic .....................3.7
61 Egypt .....................................5.3 131 Kazakhstan ............................3.7
62 Paraguay ................................5.3 132 Chad ......................................3.6
63 Syria.......................................5.3 133 United Kingdom.....................3.6
64 Kuwait ...................................5.3 134 Burundi ..................................3.5
65 Ghana ....................................5.3 135 Zimbabwe..............................3.4
66 Croatia ...................................5.3 136 Mongolia................................2.9
67 Sri Lanka................................5.3 137 Iceland ...................................2.5
68 Uganda ..................................5.2 138 Ukraine ..................................2.5
69 Morocco ................................5.2 139 Ireland....................................2.0
70 Greece...................................5.2
SOURCE: World Economic Forum, Executive Opinion Survey
The Global Competitiveness Report 2010-2011 © 2010 World Economic Forum](https://image.slidesharecdn.com/globalcompetitivenessreportwef2010-11-100928142139-phpapp02/75/Global-competitiveness-report-wef-2010-11-473-2048.jpg)
![8.08 Regulation of securities exchanges
2.2: Data Tables | Section VIII: Financial market development
How would you assess the regulation and supervision of securities exchanges in your country? [1 = ineffective; 7 = effective] | 2009–10 weighted
average
RANK COUNTRY/ECONOMY SCORE 1 MEAN: 4.2 7 RANK COUNTRY/ECONOMY SCORE 1 MEAN: 4.2 7
1 South Africa...........................6.0 71 Ecuador .................................4.2
2 Sweden .................................5.9 72 Italy........................................4.1
3 Singapore ..............................5.8 73 Philippines .............................4.1
4 Norway ..................................5.7 74 Croatia ...................................4.1
5 Brazil ......................................5.7 75 Korea, Rep.............................4.1
6 Qatar......................................5.6 76 Pakistan .................................4.0
7 Finland ...................................5.6 77 Kuwait ...................................4.0
8 Luxembourg ..........................5.6 78 Panama..................................4.0
9 Switzerland ............................5.6 79 Dominican Republic...............4.0
10 Australia.................................5.5 80 Gambia, The ..........................4.0
11 Hong Kong SAR ....................5.4 81 Nicaragua...............................4.0
12 Malta .....................................5.4 82 Nigeria ...................................4.0
13 Bahrain ..................................5.4 83 Swaziland ..............................3.9
14 Denmark ................................5.3 84 Uganda ..................................3.9
15 India.......................................5.3 85 Zimbabwe..............................3.9
16 Oman.....................................5.3 86 Vietnam .................................3.9
17 France....................................5.2 87 Bolivia ....................................3.9
18 Puerto Rico............................5.2 88 Iran, Islamic Rep....................3.9
19 Malaysia ................................5.2 89 Slovak Republic .....................3.9
20 Taiwan, China ........................5.2 90 Ireland....................................3.8
21 Netherlands ...........................5.2 91 Mexico...................................3.8
22 Canada...................................5.2 92 Paraguay................................3.8
23 Jamaica .................................5.1 93 Tanzania .................................3.8
24 Barbados ...............................5.1 94 Iceland ...................................3.8
25 New Zealand .........................5.1 95 Venezuela ..............................3.7
26 Saudi Arabia...........................5.1 96 Brunei Darussalam ................3.7
27 United Arab Emirates ............5.1 97 Romania ................................3.7
28 Mauritius ...............................5.1 98 Kenya.....................................3.7
29 Jordan....................................5.0 99 Latvia .....................................3.7
30 Namibia .................................5.0 100 Costa Rica .............................3.7
31 Poland....................................5.0 101 Mozambique..........................3.7 461
32 Israel ......................................5.0 102 Syria.......................................3.7
33 Portugal .................................5.0 103 Azerbaijan ..............................3.7
34 Cyprus ...................................4.9 104 Chile ......................................3.7
35 Germany ................................4.9 105 El Salvador.............................3.6
36 Thailand .................................4.8 106 Argentina ...............................3.6
37 Sri Lanka................................4.8 107 Senegal..................................3.6
38 Tunisia....................................4.8 108 Bosnia and Herzegovina........3.6
39 Honduras ...............................4.8 109 Bulgaria..................................3.6
40 Japan .....................................4.8 110 Guyana ..................................3.6
41 Belgium .................................4.8 111 Nepal .....................................3.5
42 United Kingdom.....................4.8 112 Spain......................................3.5
43 Morocco ................................4.7 113 Colombia ...............................3.5
44 Estonia...................................4.7 114 Peru .......................................3.4
45 Austria ...................................4.7 115 Serbia ....................................3.4
46 Turkey ....................................4.6 116 Moldova.................................3.4
47 Czech Republic......................4.6 117 Burkina Faso..........................3.4
48 Montenegro...........................4.6 118 Russian Federation................3.3
49 Indonesia ...............................4.6 119 Kazakhstan ............................3.3
50 Lebanon.................................4.5 120 Cameroon..............................3.2
51 Cape Verde ............................4.5 121 Armenia .................................3.2
52 Hungary .................................4.5 122 Cambodia ..............................3.1
53 Trinidad and Tobago...............4.5 123 Ethiopia..................................3.1
54 Uruguay .................................4.5 124 Georgia ..................................3.1
55 Ghana ....................................4.5 125 Lesotho .................................2.9
56 Zambia...................................4.4 126 Tajikistan ................................2.8
57 Lithuania ................................4.4 127 Ukraine ..................................2.7
58 Bangladesh............................4.4 128 Timor-Leste............................2.7
59 Guatemala .............................4.4 129 Mongolia................................2.7
60 Botswana ..............................4.4 130 Mali........................................2.6
61 China .....................................4.4 131 Albania...................................2.6
62 Benin .....................................4.3 132 Kyrgyz Republic .....................2.6
63 Côte d’Ivoire ..........................4.3 133 Angola ...................................2.5
64 United States.........................4.3 134 Chad ......................................2.5
65 Macedonia, FYR ....................4.3 135 Libya ......................................2.4
66 Slovenia .................................4.3 136 Madagascar ...........................2.2
67 Egypt .....................................4.3 137 Algeria ...................................2.1
68 Rwanda .................................4.2 138 Mauritania..............................2.1
69 Greece...................................4.2 139 Burundi ..................................1.9
70 Malawi ...................................4.2
SOURCE: World Economic Forum, Executive Opinion Survey
The Global Competitiveness Report 2010-2011 © 2010 World Economic Forum](https://image.slidesharecdn.com/globalcompetitivenessreportwef2010-11-100928142139-phpapp02/75/Global-competitiveness-report-wef-2010-11-474-2048.jpg)
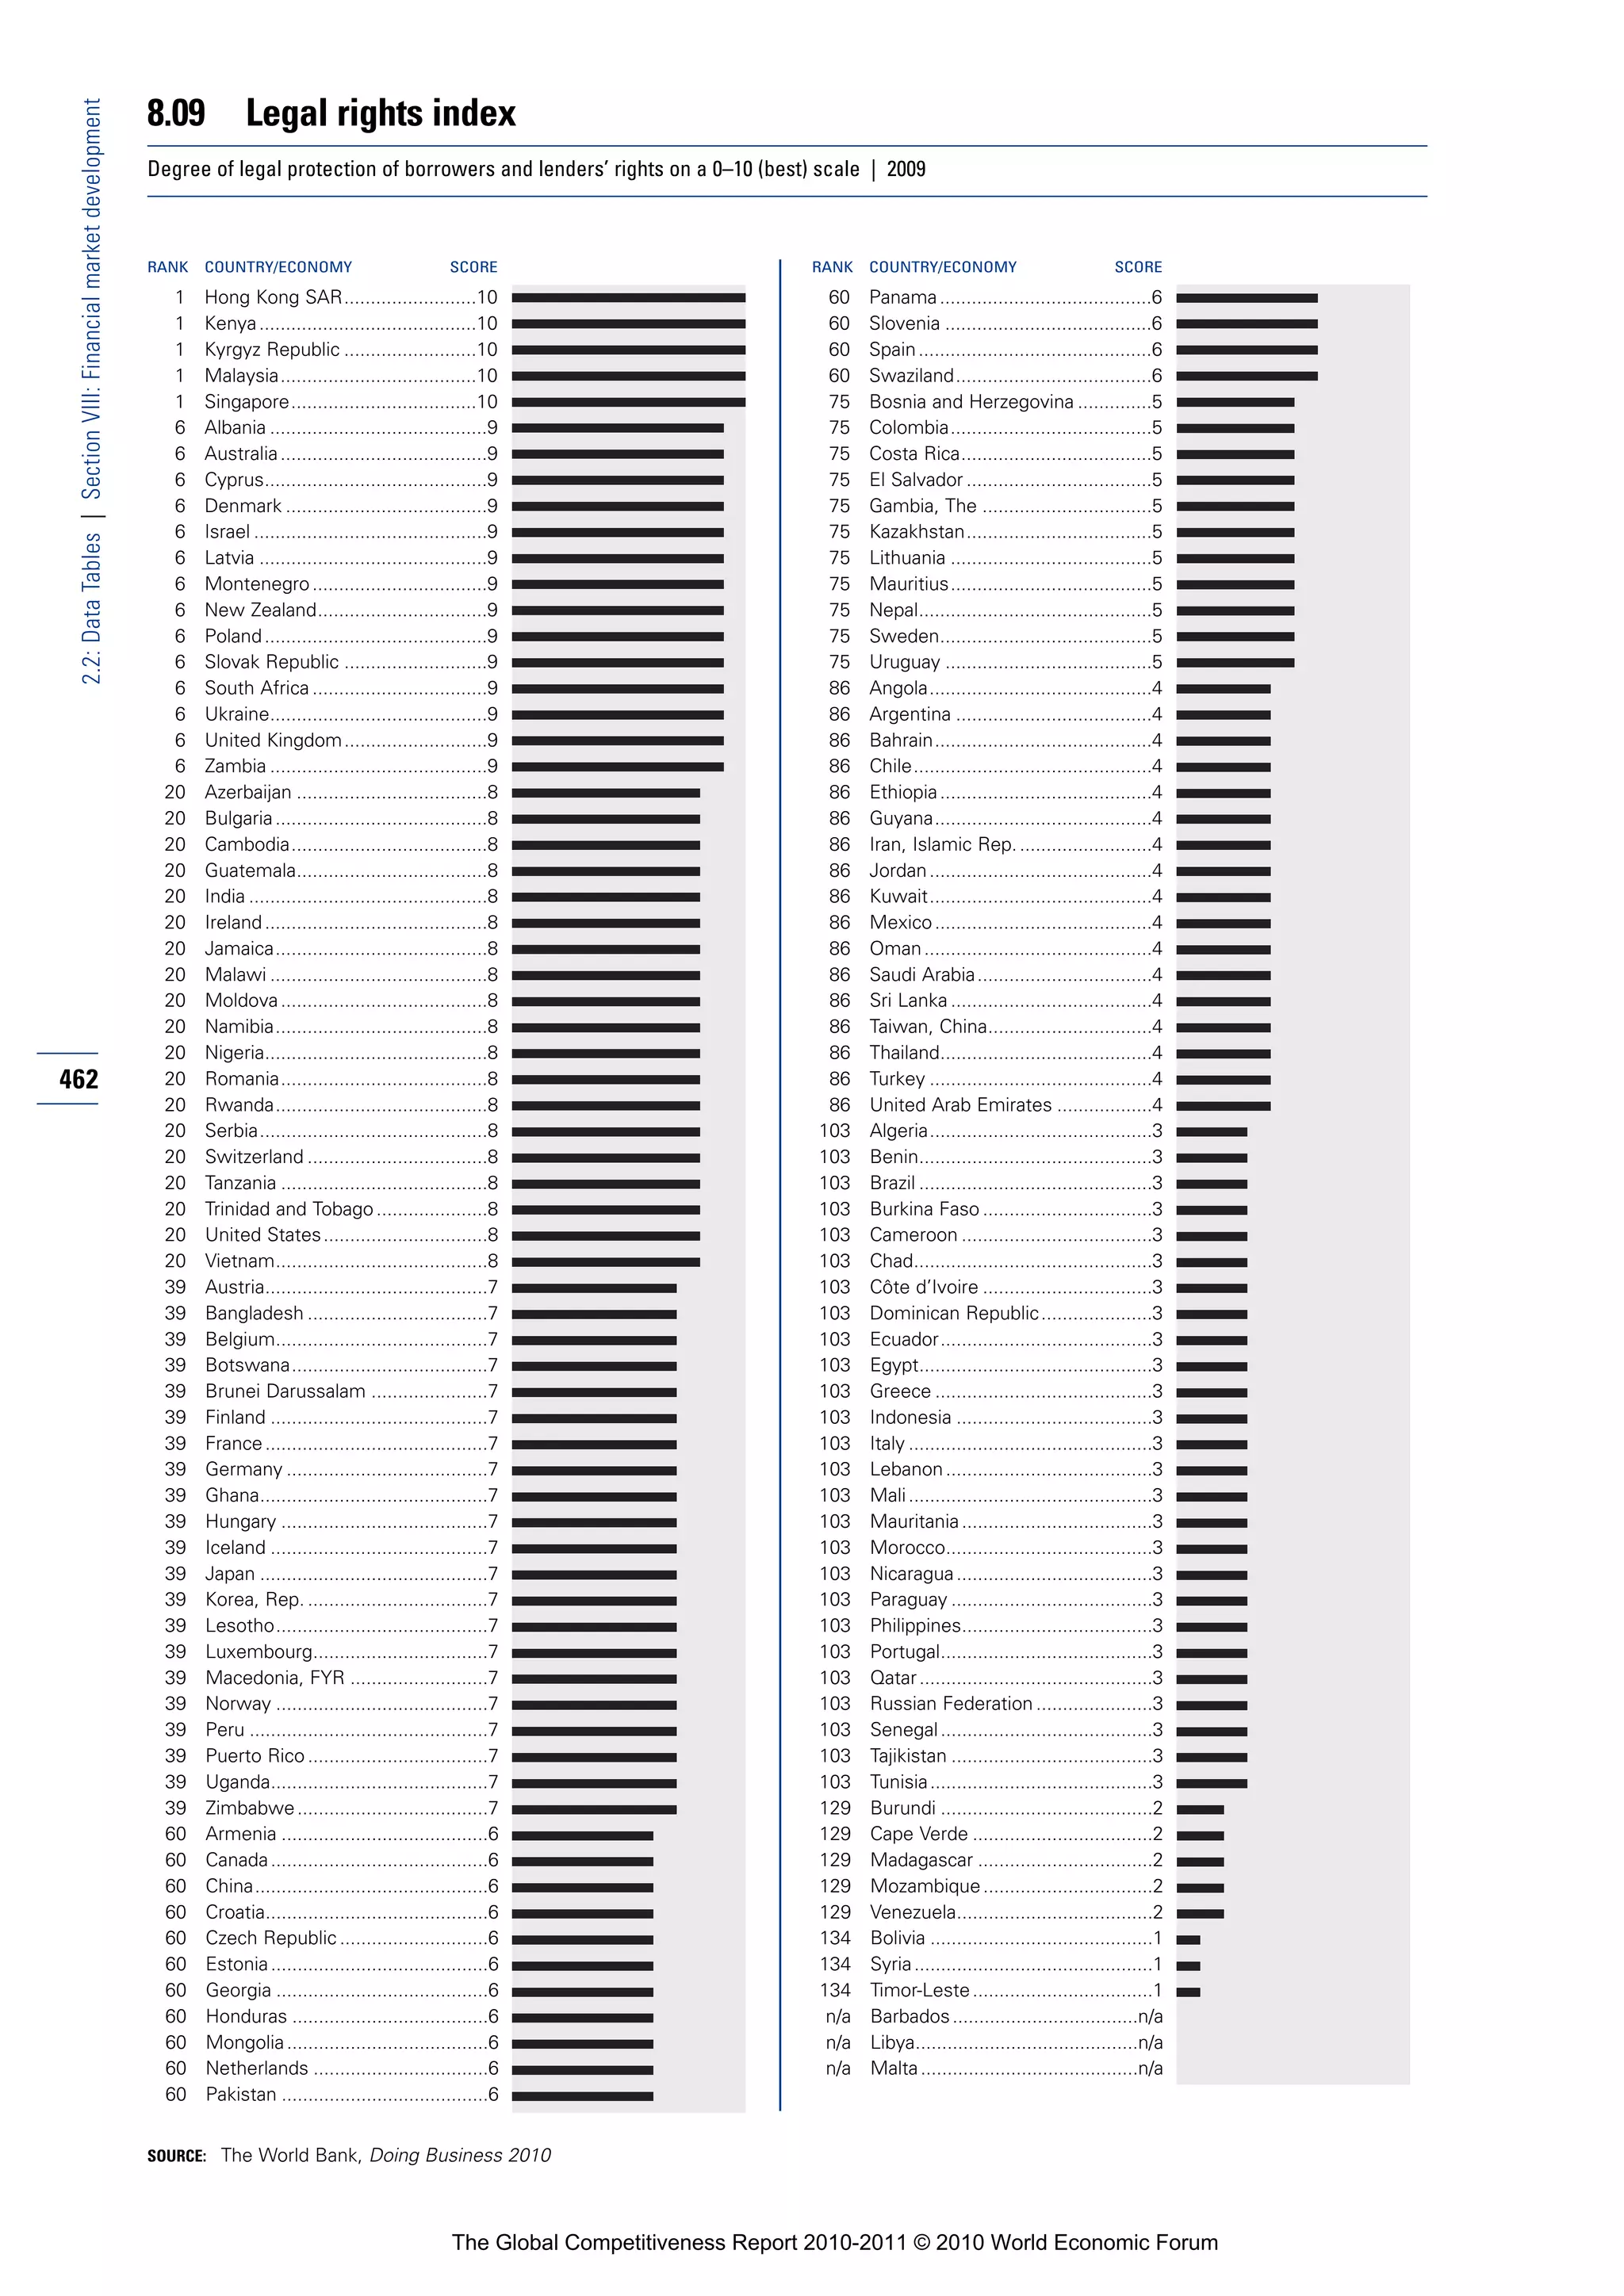

![9.01 Availability of latest technologies
2.2: Data Tables | Section IX: Technological readiness
To what extent are the latest technologies available in your country? [1 = not available; 7 = widely available] | 2009–10 weighted average
RANK COUNTRY/ECONOMY SCORE 1 MEAN: 5.1 7 RANK COUNTRY/ECONOMY SCORE 1 MEAN: 5.1 7
1 Sweden .................................6.8 71 Rwanda .................................5.0
2 Iceland ...................................6.8 72 Cape Verde ............................5.0
3 Norway ..................................6.7 73 Italy........................................5.0
4 Finland ...................................6.6 74 Mexico...................................4.9
5 Switzerland ............................6.6 75 Lebanon.................................4.9
6 Israel ......................................6.4 76 Gambia, The ..........................4.9
7 United States.........................6.4 77 Indonesia ...............................4.8
8 Austria ...................................6.4 78 Botswana ..............................4.8
9 Netherlands ...........................6.4 79 Côte d’Ivoire ..........................4.8
10 Hong Kong SAR ....................6.4 80 Macedonia, FYR ....................4.8
11 United Arab Emirates ............6.4 81 Azerbaijan ..............................4.8
12 Belgium .................................6.4 82 Kenya.....................................4.7
13 Denmark ................................6.4 83 Argentina ...............................4.7
14 Canada...................................6.4 84 Honduras ...............................4.7
15 United Kingdom.....................6.4 85 Montenegro...........................4.7
16 France....................................6.4 86 Poland....................................4.7
17 Germany ................................6.3 87 Colombia ...............................4.7
18 Japan .....................................6.3 88 Pakistan .................................4.6
19 Portugal .................................6.3 89 Zambia...................................4.6
20 Singapore ..............................6.3 90 Albania...................................4.6
21 Luxembourg ..........................6.2 91 Egypt .....................................4.6
22 Australia.................................6.1 92 Ukraine ..................................4.5
23 Korea, Rep.............................6.1 93 Uganda ..................................4.4
24 Puerto Rico............................6.1 94 China .....................................4.4
25 Qatar......................................6.1 95 Ghana ....................................4.4
26 Chile ......................................6.0 96 Libya ......................................4.4
27 New Zealand .........................6.0 97 Kazakhstan ............................4.4
28 Barbados ...............................6.0 98 Georgia ..................................4.3
29 Bahrain ..................................6.0 99 Romania ................................4.3
30 Malta .....................................6.0 100 Bulgaria..................................4.3
464 31 Estonia...................................5.8 101 Venezuela ..............................4.3
32 Spain......................................5.8 102 Vietnam .................................4.3
33 Taiwan, China ........................5.8 103 Cambodia ..............................4.3
34 Ireland....................................5.8 104 Mozambique..........................4.3
35 Malaysia ................................5.7 105 Madagascar ...........................4.3
36 Cyprus ...................................5.7 106 Ecuador .................................4.3
37 Lithuania ................................5.6 107 Guyana ..................................4.3
38 Slovenia .................................5.6 108 Malawi ...................................4.3
39 Saudi Arabia...........................5.6 109 Algeria ...................................4.2
40 Slovak Republic .....................5.6 110 Benin .....................................4.2
41 India.......................................5.6 111 Bangladesh............................4.2
42 Tunisia....................................5.6 112 Moldova.................................4.2
43 Panama..................................5.6 113 Burkina Faso..........................4.2
44 Namibia .................................5.5 114 Cameroon..............................4.2
45 Guatemala .............................5.5 115 Nigeria ...................................4.2
46 Czech Republic......................5.5 116 Bosnia and Herzegovina........4.2
47 Hungary .................................5.5 117 Serbia ....................................4.2
48 Turkey ....................................5.5 118 Mauritania..............................4.2
49 Jordan....................................5.5 119 Mongolia................................4.2
50 Brazil ......................................5.5 120 Tajikistan ................................4.2
51 South Africa...........................5.5 121 Paraguay................................4.2
52 Jamaica .................................5.5 122 Russian Federation................4.2
53 Senegal..................................5.5 123 Iran, Islamic Rep....................4.1
54 Mauritius ...............................5.4 124 Mali........................................4.1
55 Croatia ...................................5.4 125 Lesotho .................................4.1
56 Dominican Republic...............5.3 126 Syria.......................................4.0
57 Oman.....................................5.3 127 Armenia .................................3.9
58 Brunei Darussalam ................5.2 128 Nepal .....................................3.9
59 Greece...................................5.2 129 Ethiopia..................................3.9
60 Trinidad and Tobago...............5.2 130 Nicaragua...............................3.9
61 Sri Lanka................................5.2 131 Bolivia ....................................3.8
62 Philippines .............................5.1 132 Tanzania .................................3.8
63 Kuwait ...................................5.1 133 Zimbabwe..............................3.6
64 Thailand .................................5.1 134 Swaziland ..............................3.6
65 Latvia .....................................5.1 135 Kyrgyz Republic .....................3.5
66 Peru .......................................5.1 136 Timor-Leste............................3.5
67 El Salvador.............................5.1 137 Burundi ..................................3.5
68 Morocco ................................5.0 138 Angola ...................................3.4
69 Uruguay .................................5.0 139 Chad ......................................3.3
70 Costa Rica .............................5.0
SOURCE: World Economic Forum, Executive Opinion Survey
The Global Competitiveness Report 2010-2011 © 2010 World Economic Forum](https://image.slidesharecdn.com/globalcompetitivenessreportwef2010-11-100928142139-phpapp02/75/Global-competitiveness-report-wef-2010-11-477-2048.jpg)
![9.02 Firm-level technology absorption
2.2: Data Tables | Section IX: Technological readiness
To what extent do businesses in your country absorb new technology? [1 = not at all; 7 = aggressively absorb] | 2009–10 weighted average
RANK COUNTRY/ECONOMY SCORE 1 MEAN: 4.9 7 RANK COUNTRY/ECONOMY SCORE 1 MEAN: 4.9 7
1 Iceland ...................................6.5 71 Brunei Darussalam ................4.8
2 Sweden .................................6.4 72 Slovenia .................................4.8
3 Japan .....................................6.3 73 Peru .......................................4.8
4 Switzerland ............................6.3 74 Morocco ................................4.8
5 United Arab Emirates ............6.2 75 Jamaica .................................4.7
6 Norway ..................................6.2 76 Syria.......................................4.7
7 Israel ......................................6.1 77 Nigeria ...................................4.7
8 Qatar......................................6.1 78 Honduras ...............................4.6
9 Korea, Rep.............................6.1 79 Uruguay .................................4.6
10 Taiwan, China ........................6.1 80 Trinidad and Tobago...............4.6
11 United States.........................6.0 81 Botswana ..............................4.6
12 Finland ...................................6.0 82 El Salvador.............................4.6
13 Denmark ................................6.0 83 Poland....................................4.6
14 Germany ................................6.0 84 Mongolia................................4.6
15 Singapore ..............................6.0 85 Colombia ...............................4.5
16 Austria ...................................6.0 86 Zambia...................................4.5
17 New Zealand .........................5.9 87 Mexico...................................4.5
18 Hong Kong SAR ....................5.9 88 Pakistan .................................4.5
19 Australia.................................5.9 89 Latvia .....................................4.5
20 Luxembourg ..........................5.7 90 Montenegro...........................4.5
21 United Kingdom.....................5.7 91 Greece...................................4.4
22 Canada...................................5.6 92 Albania...................................4.4
23 France....................................5.6 93 Cambodia ..............................4.4
24 Puerto Rico............................5.6 94 Argentina ...............................4.4
25 Netherlands ...........................5.6 95 Cameroon..............................4.4
26 Saudi Arabia...........................5.6 96 Ukraine ..................................4.4
27 Portugal .................................5.6 97 Mozambique..........................4.4
28 Belgium .................................5.5 98 Croatia ...................................4.4
29 Jordan....................................5.5 99 Libya ......................................4.4
30 Malaysia ................................5.5 100 Mali........................................4.3
31 Malta .....................................5.5 101 Burkina Faso..........................4.3 465
32 Ireland....................................5.5 102 Italy........................................4.3
33 Tunisia....................................5.4 103 Malawi ...................................4.3
34 Barbados ...............................5.4 104 Uganda ..................................4.3
35 South Africa...........................5.4 105 Kazakhstan ............................4.3
36 Czech Republic......................5.4 106 Ecuador .................................4.3
37 Chile ......................................5.3 107 Madagascar ...........................4.2
38 Kuwait ...................................5.3 108 Romania ................................4.2
39 India.......................................5.3 109 Bangladesh............................4.2
40 Senegal..................................5.3 110 Venezuela ..............................4.2
41 Panama..................................5.3 111 Guyana ..................................4.2
42 Estonia...................................5.3 112 Ghana ....................................4.1
43 Cyprus ...................................5.3 113 Macedonia, FYR ....................4.1
44 Guatemala .............................5.2 114 Lesotho .................................4.1
45 Namibia .................................5.2 115 Benin .....................................4.1
46 Brazil ......................................5.2 116 Iran, Islamic Rep....................4.1
47 Sri Lanka................................5.2 117 Paraguay................................4.0
48 Bahrain ..................................5.2 118 Nicaragua...............................4.0
49 Spain......................................5.2 119 Bosnia and Herzegovina........4.0
50 Costa Rica .............................5.1 120 Russian Federation................4.0
51 Turkey ....................................5.1 121 Armenia .................................4.0
52 Oman.....................................5.1 122 Tajikistan ................................4.0
53 Rwanda .................................5.1 123 Tanzania .................................4.0
54 Mauritius ...............................5.1 124 Ethiopia..................................4.0
55 Slovak Republic .....................5.0 125 Georgia ..................................4.0
56 Lithuania ................................5.0 126 Zimbabwe..............................4.0
57 Dominican Republic...............5.0 127 Bulgaria..................................4.0
58 Egypt .....................................5.0 128 Algeria ...................................3.9
59 Philippines .............................5.0 129 Nepal .....................................3.9
60 Vietnam .................................5.0 130 Angola ...................................3.7
61 China .....................................4.9 131 Mauritania..............................3.7
62 Azerbaijan ..............................4.9 132 Swaziland ..............................3.7
63 Cape Verde ............................4.9 133 Moldova.................................3.7
64 Côte d’Ivoire ..........................4.9 134 Serbia ....................................3.7
65 Indonesia ...............................4.9 135 Bolivia ....................................3.7
66 Thailand .................................4.9 136 Burundi ..................................3.6
67 Kenya.....................................4.9 137 Kyrgyz Republic .....................3.5
68 Lebanon.................................4.8 138 Chad ......................................3.5
69 Gambia, The ..........................4.8 139 Timor-Leste............................3.2
70 Hungary .................................4.8
SOURCE: World Economic Forum, Executive Opinion Survey
The Global Competitiveness Report 2010-2011 © 2010 World Economic Forum](https://image.slidesharecdn.com/globalcompetitivenessreportwef2010-11-100928142139-phpapp02/75/Global-competitiveness-report-wef-2010-11-478-2048.jpg)
![9.03 FDI and technology transfer
2.2: Data Tables | Section IX: Technological readiness
To what extent does foreign direct investment (FDI) bring new technology into your country? [1 = not at all; 7 = FDI is a key source of new
technology] | 2009–10 weighted average
RANK COUNTRY/ECONOMY SCORE 1 MEAN: 4.6 7 RANK COUNTRY/ECONOMY SCORE 1 MEAN: 4.6 7
1 Ireland....................................6.3 71 Zambia...................................4.7
2 Qatar......................................6.0 72 Angola ...................................4.7
3 Singapore ..............................6.0 73 El Salvador.............................4.7
4 Costa Rica .............................5.7 74 Albania...................................4.6
5 Slovak Republic .....................5.7 75 Cyprus ...................................4.6
6 United Arab Emirates ............5.7 76 Norway ..................................4.6
7 Panama..................................5.6 77 Kenya.....................................4.6
8 Luxembourg ..........................5.5 78 Côte d’Ivoire ..........................4.6
9 Saudi Arabia...........................5.5 79 Armenia .................................4.6
10 Hong Kong SAR ....................5.4 80 China .....................................4.6
11 Bahrain ..................................5.4 81 Botswana ..............................4.6
12 Uruguay .................................5.4 82 Iceland ...................................4.5
13 Tunisia....................................5.3 83 Ghana ....................................4.5
14 Portugal .................................5.3 84 Senegal..................................4.5
15 Czech Republic......................5.3 85 Germany................................4.5
16 Malaysia ................................5.3 86 Korea, Rep.............................4.5
17 United Kingdom.....................5.3 87 Brunei Darussalam ................4.4
18 Mozambique..........................5.2 88 Philippines .............................4.4
19 Belgium .................................5.2 89 Nigeria ...................................4.4
20 Chile ......................................5.2 90 Jamaica .................................4.4
21 Malta .....................................5.2 91 Malawi ...................................4.3
22 Australia.................................5.2 92 Georgia ..................................4.3
23 Brazil ......................................5.2 93 Finland ...................................4.3
24 Sweden .................................5.2 94 Latvia .....................................4.3
25 Hungary .................................5.2 95 Tanzania .................................4.3
26 Israel ......................................5.2 96 Mongolia................................4.3
27 Taiwan, China ........................5.1 97 Madagascar ...........................4.2
28 India.......................................5.1 98 Bulgaria..................................4.2
29 Canada...................................5.1 99 Cameroon..............................4.2
30 Barbados ...............................5.1 100 Pakistan .................................4.2
466 31 Vietnam .................................5.1 101 Slovenia .................................4.2
32 Mexico...................................5.0 102 Bosnia and Herzegovina........4.2
33 Netherlands ...........................5.0 103 Benin .....................................4.1
34 Thailand .................................5.0 104 Burkina Faso..........................4.1
35 Poland....................................5.0 105 Macedonia, FYR ....................4.1
36 Jordan....................................5.0 106 Bangladesh............................4.1
37 South Africa...........................5.0 107 Ethiopia..................................4.1
38 Cambodia ..............................5.0 108 Kazakhstan ............................4.1
39 Uganda ..................................5.0 109 Greece...................................4.1
40 Estonia...................................5.0 110 Moldova.................................4.0
41 Trinidad and Tobago...............5.0 111 Croatia ...................................4.0
42 Peru .......................................5.0 112 Italy........................................4.0
43 Denmark ................................5.0 113 Serbia ....................................4.0
44 Montenegro...........................5.0 114 Iran, Islamic Rep....................4.0
45 Morocco ................................5.0 115 Argentina ...............................3.9
46 Switzerland ............................5.0 116 Guyana ..................................3.9
47 Namibia .................................5.0 117 Lebanon.................................3.9
48 Rwanda .................................5.0 118 Nicaragua...............................3.9
49 Sri Lanka................................4.9 119 Mali........................................3.9
50 Dominican Republic...............4.9 120 Russian Federation................3.9
51 France....................................4.9 121 Syria.......................................3.8
52 Oman.....................................4.9 122 Lesotho .................................3.8
53 Egypt .....................................4.9 123 Tajikistan ................................3.8
54 Indonesia ...............................4.9 124 Ukraine ..................................3.8
55 United States.........................4.9 125 Venezuela ..............................3.7
56 Mauritius ...............................4.9 126 Burundi ..................................3.7
57 Spain......................................4.9 127 Libya ......................................3.7
58 Colombia ...............................4.9 128 Nepal .....................................3.7
59 New Zealand .........................4.9 129 Algeria ...................................3.6
60 Puerto Rico............................4.9 130 Paraguay................................3.6
61 Guatemala .............................4.9 131 Ecuador .................................3.6
62 Lithuania ................................4.8 132 Chad ......................................3.5
63 Austria ...................................4.8 133 Timor-Leste............................3.5
64 Turkey ....................................4.8 134 Kuwait ...................................3.4
65 Azerbaijan ..............................4.8 135 Bolivia ....................................3.4
66 Gambia, The ..........................4.7 136 Zimbabwe..............................3.3
67 Honduras ...............................4.7 137 Mauritania..............................3.3
68 Japan .....................................4.7 138 Swaziland ..............................3.3
69 Cape Verde ............................4.7 139 Kyrgyz Republic .....................3.1
70 Romania ................................4.7
SOURCE: World Economic Forum, Executive Opinion Survey
The Global Competitiveness Report 2010-2011 © 2010 World Economic Forum](https://image.slidesharecdn.com/globalcompetitivenessreportwef2010-11-100928142139-phpapp02/75/Global-competitiveness-report-wef-2010-11-479-2048.jpg)
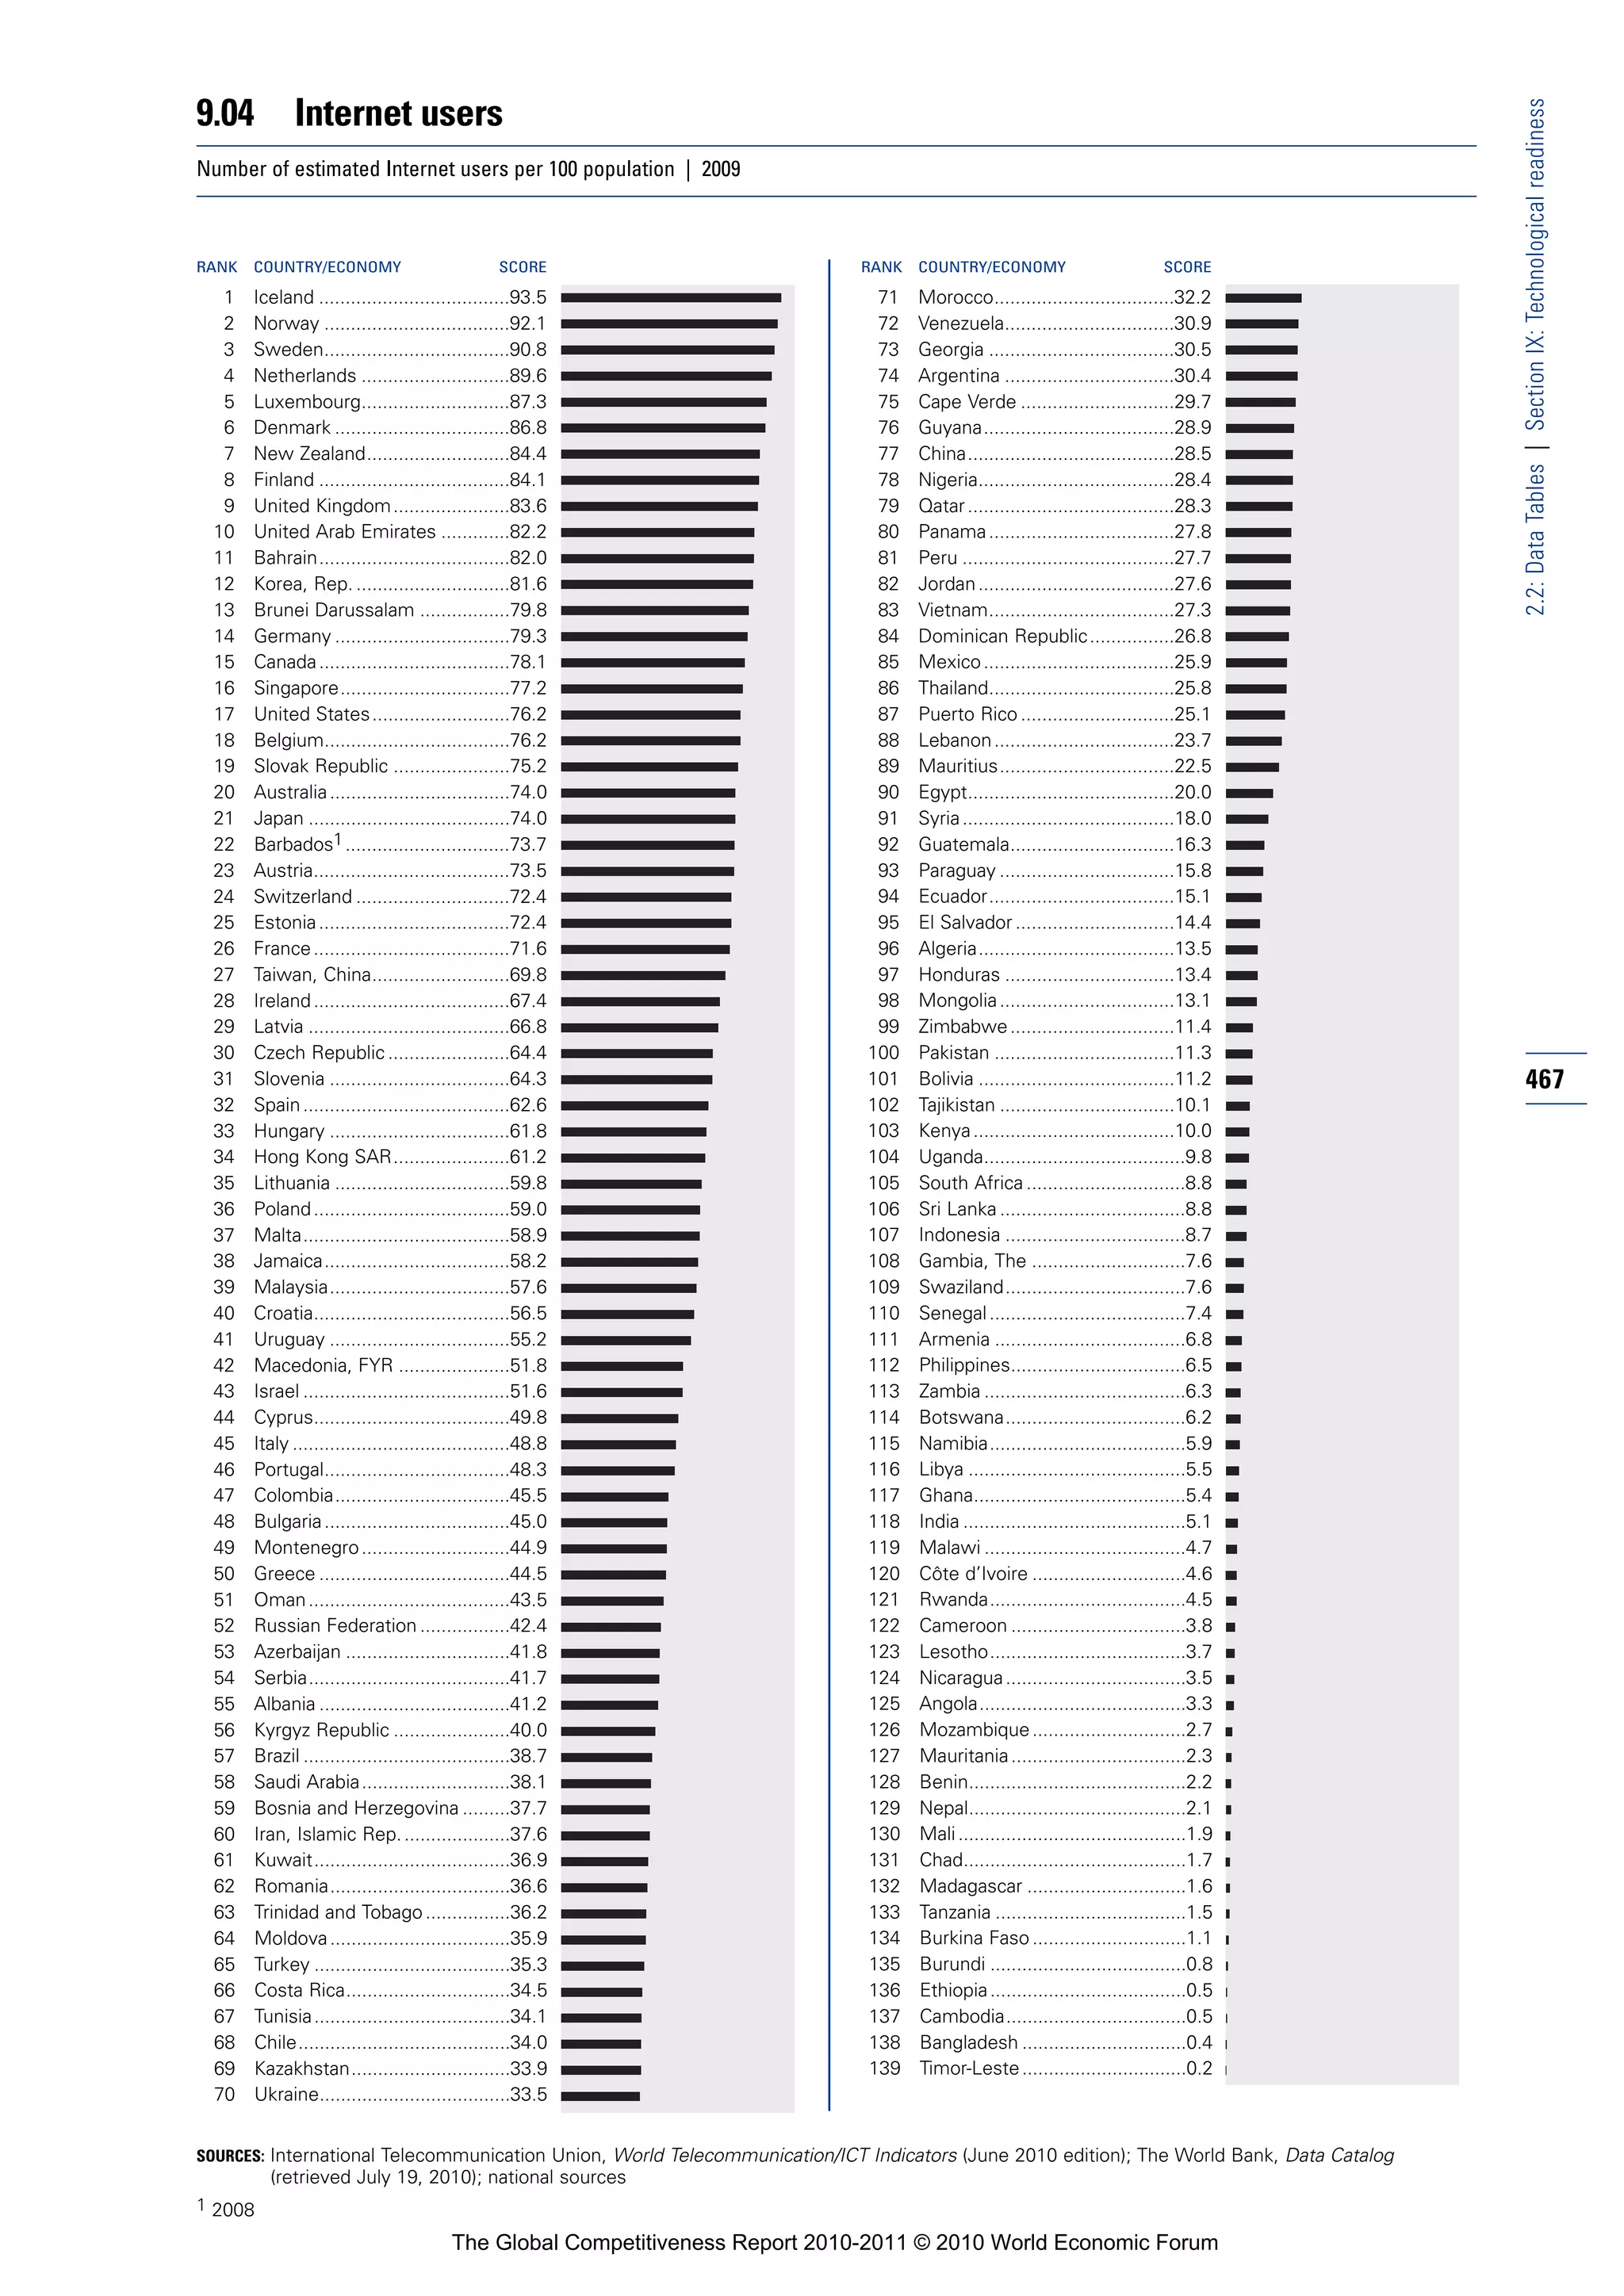
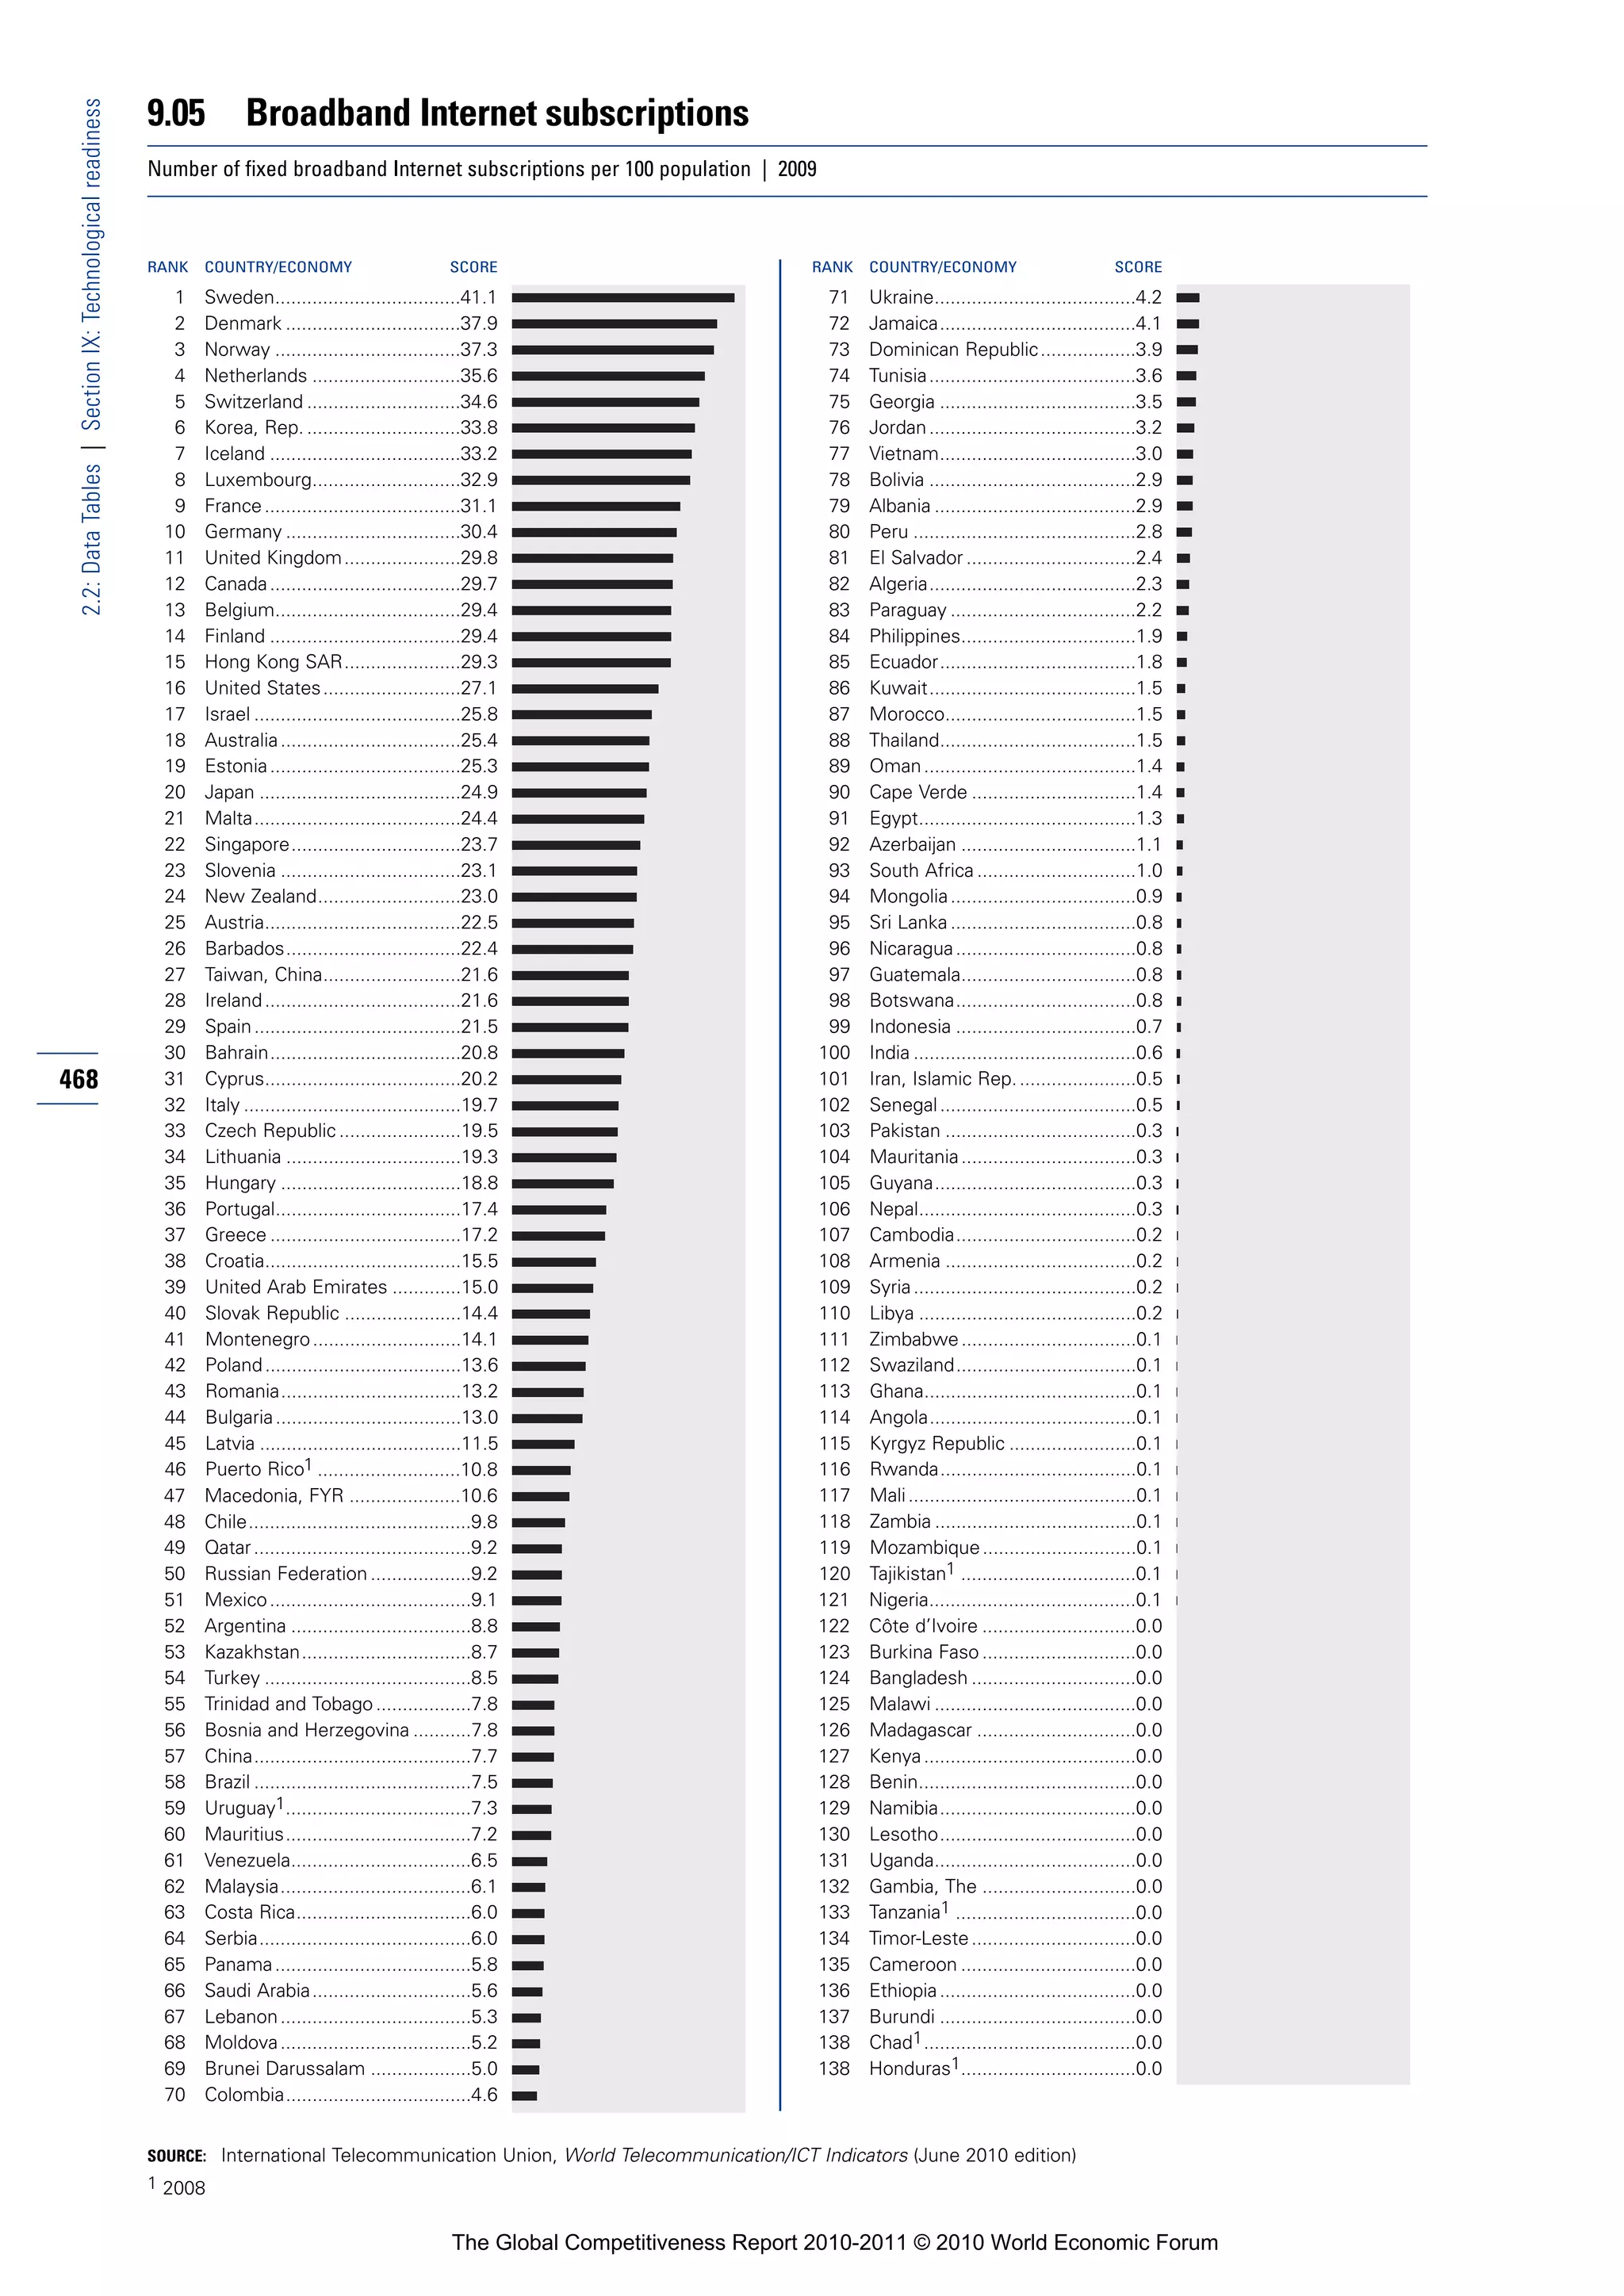
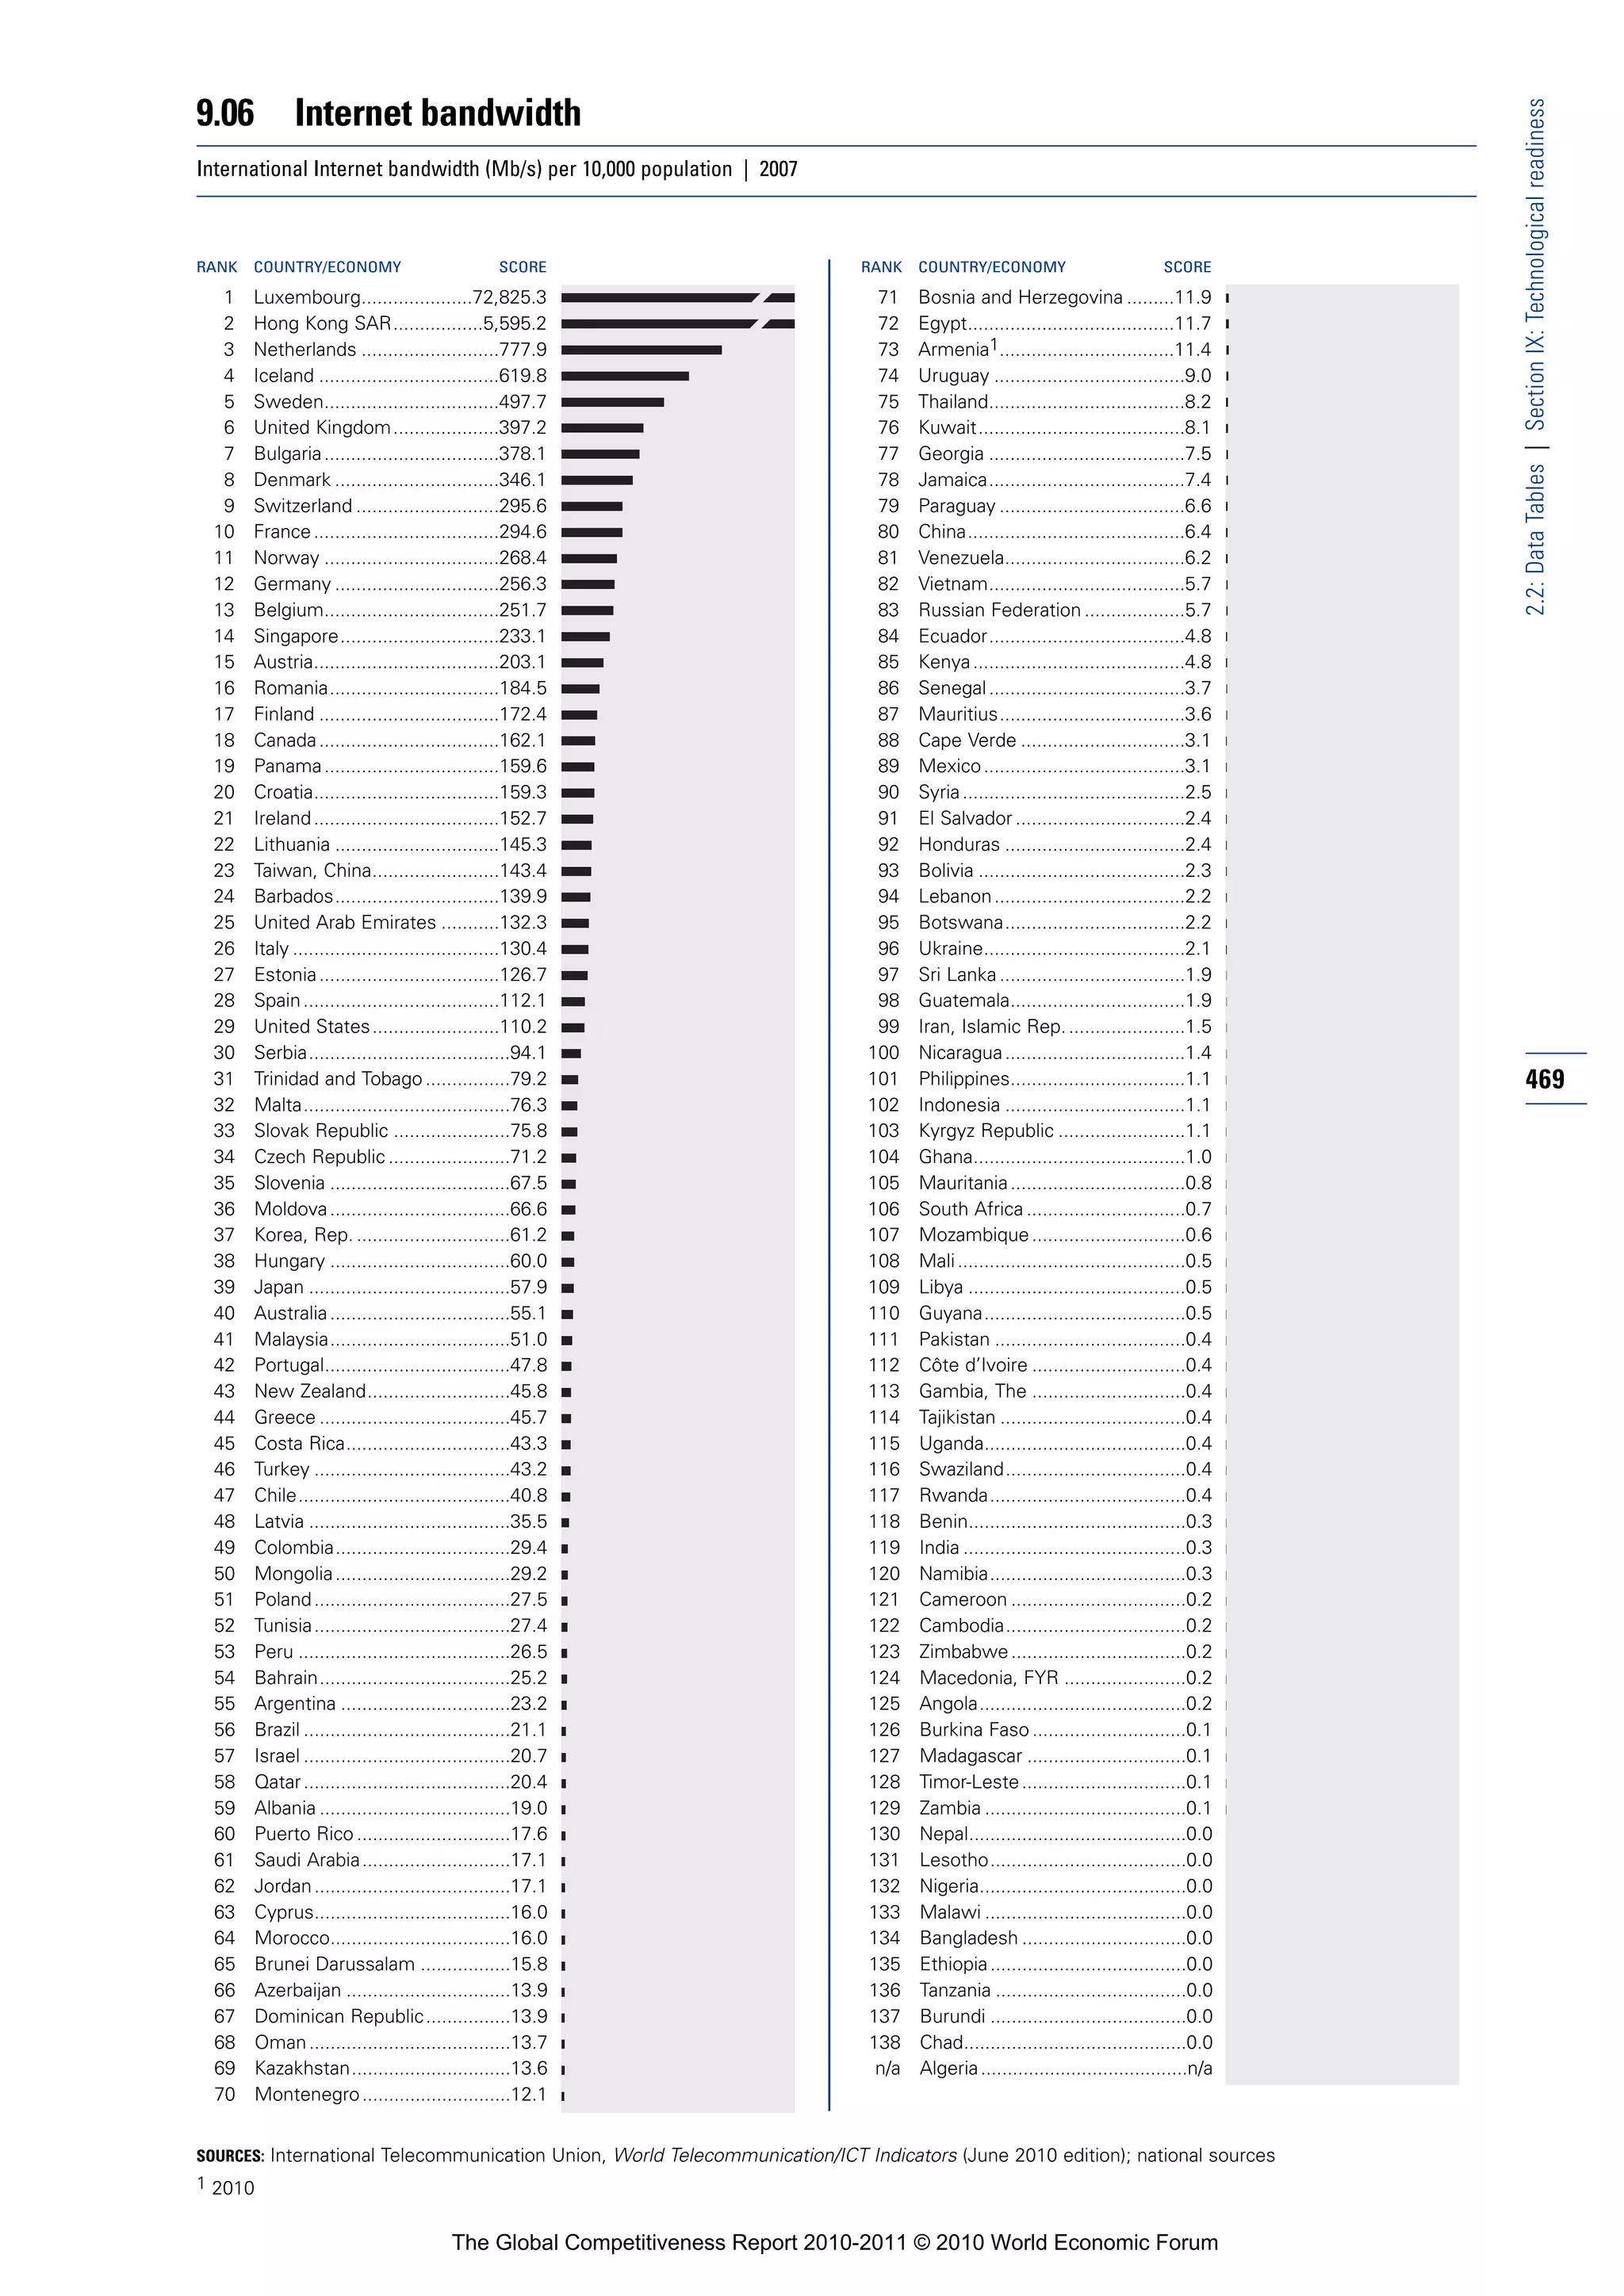

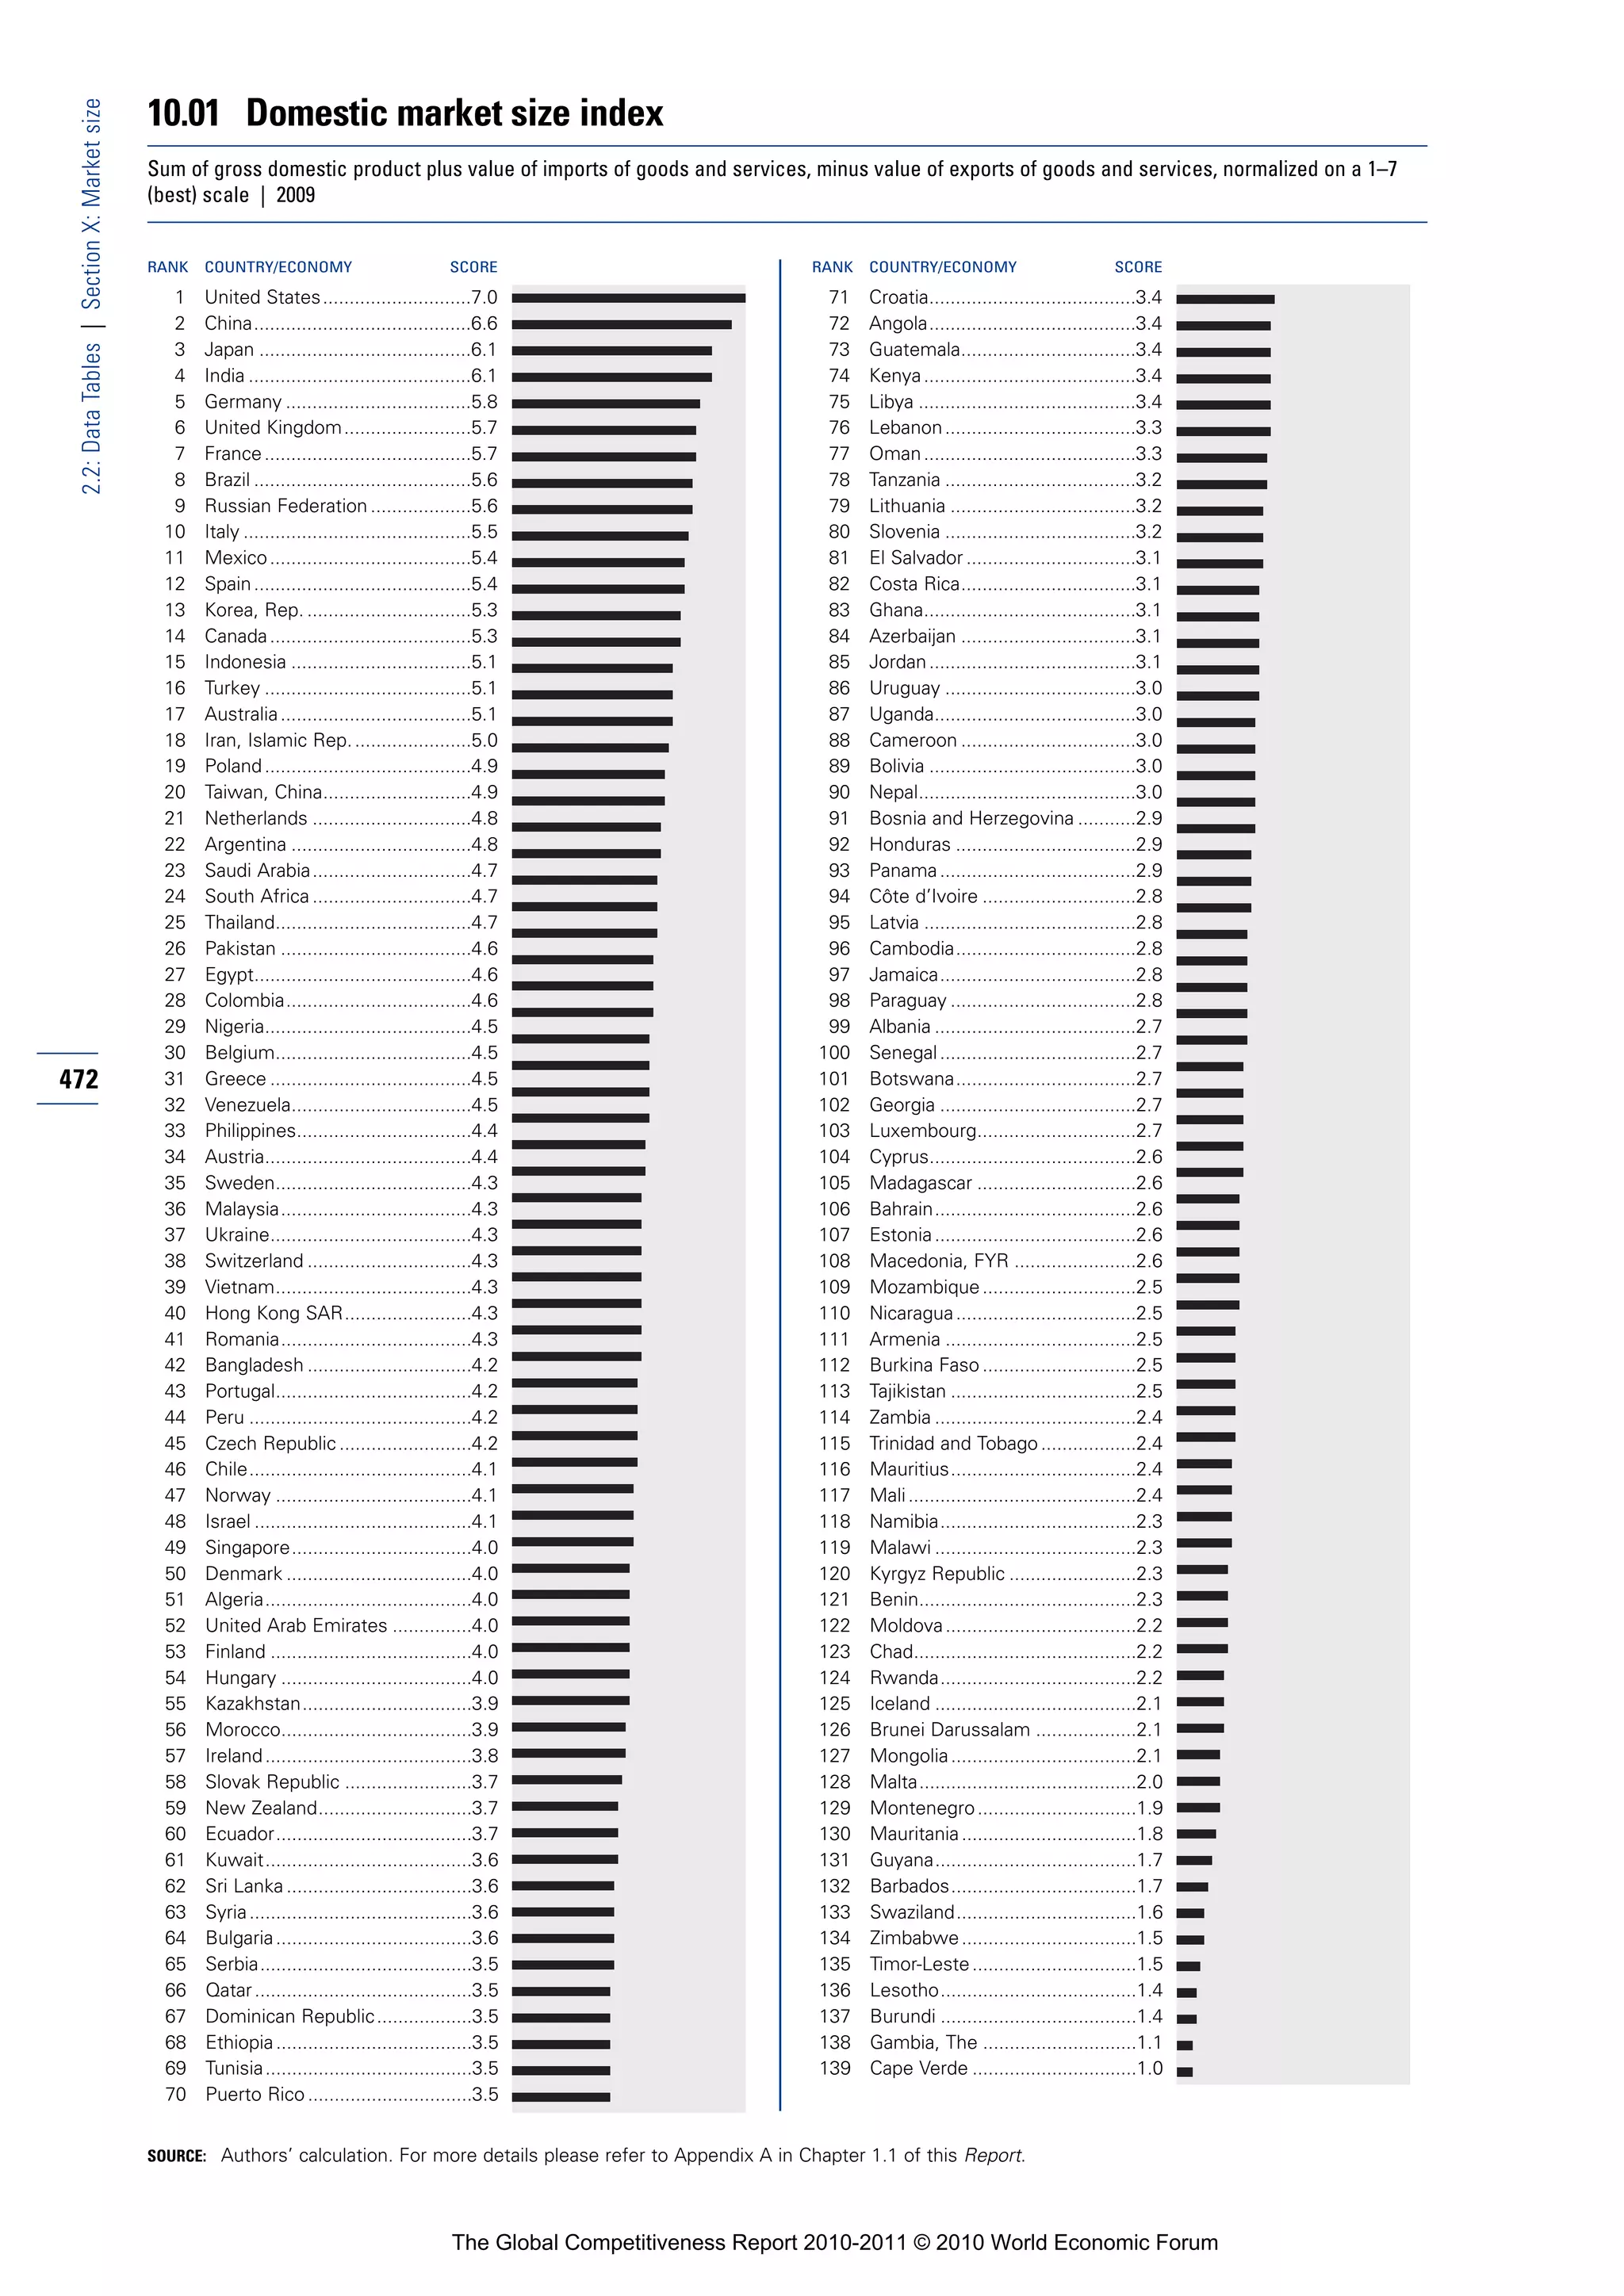
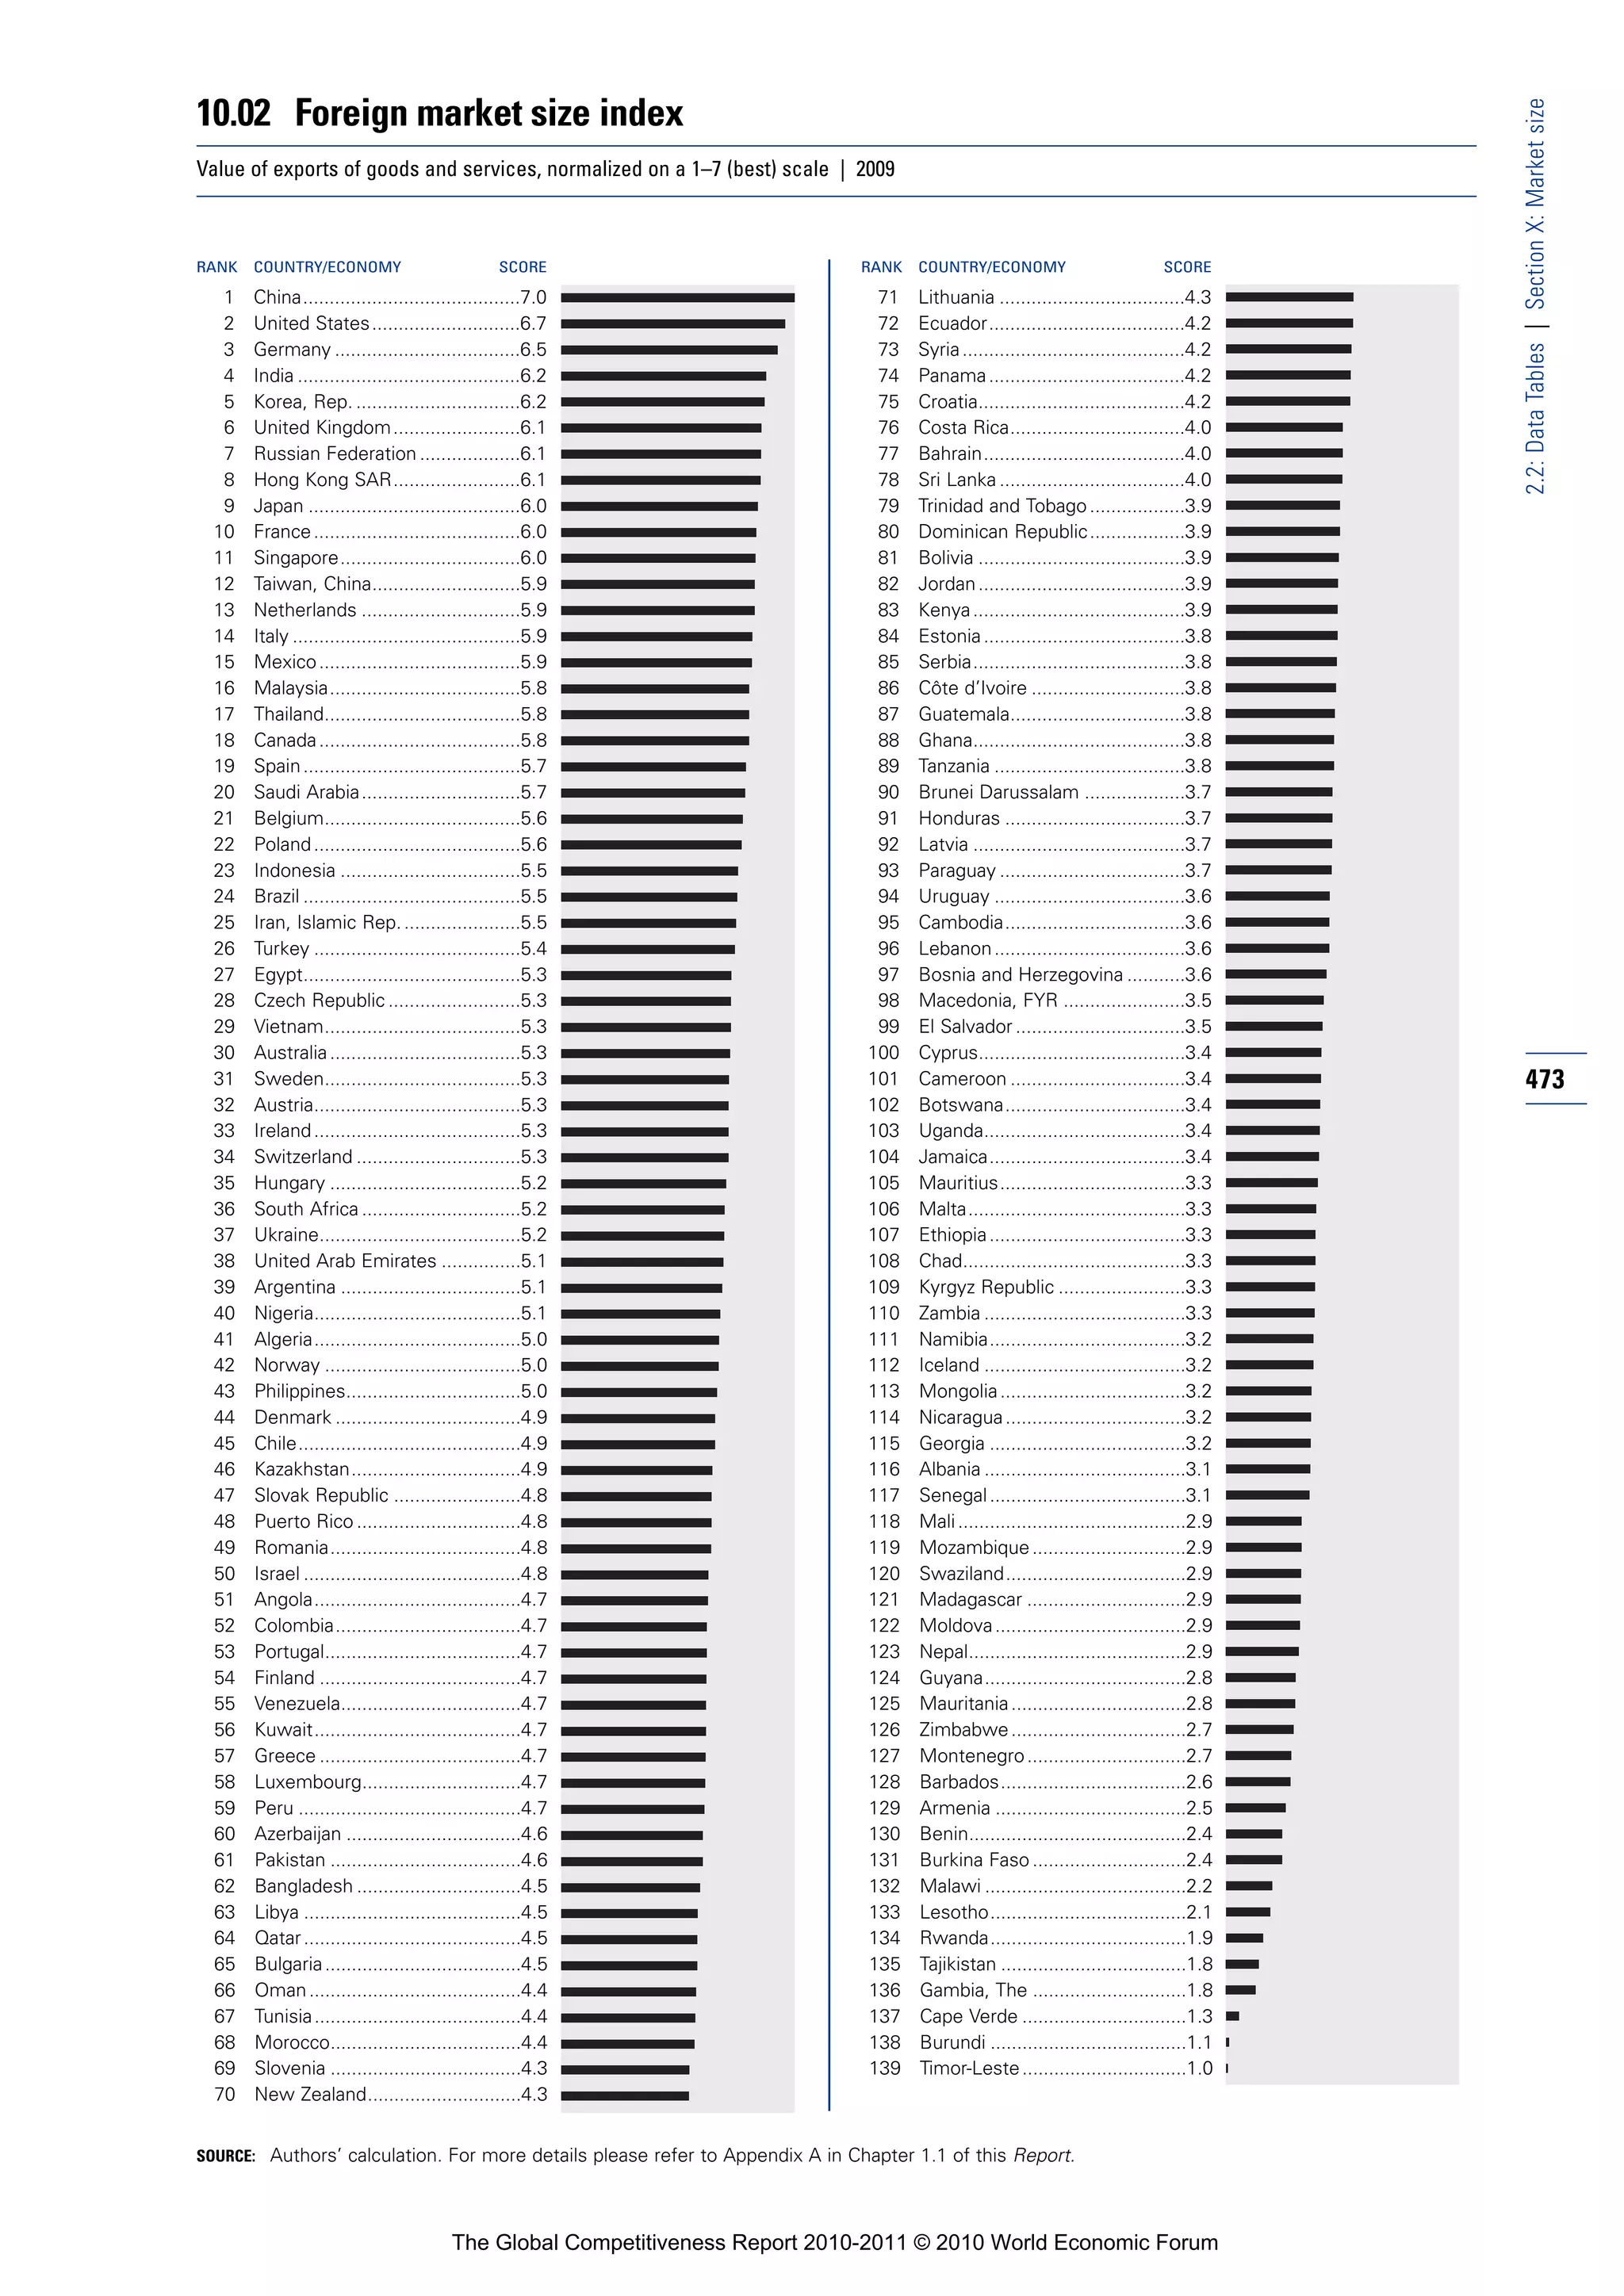
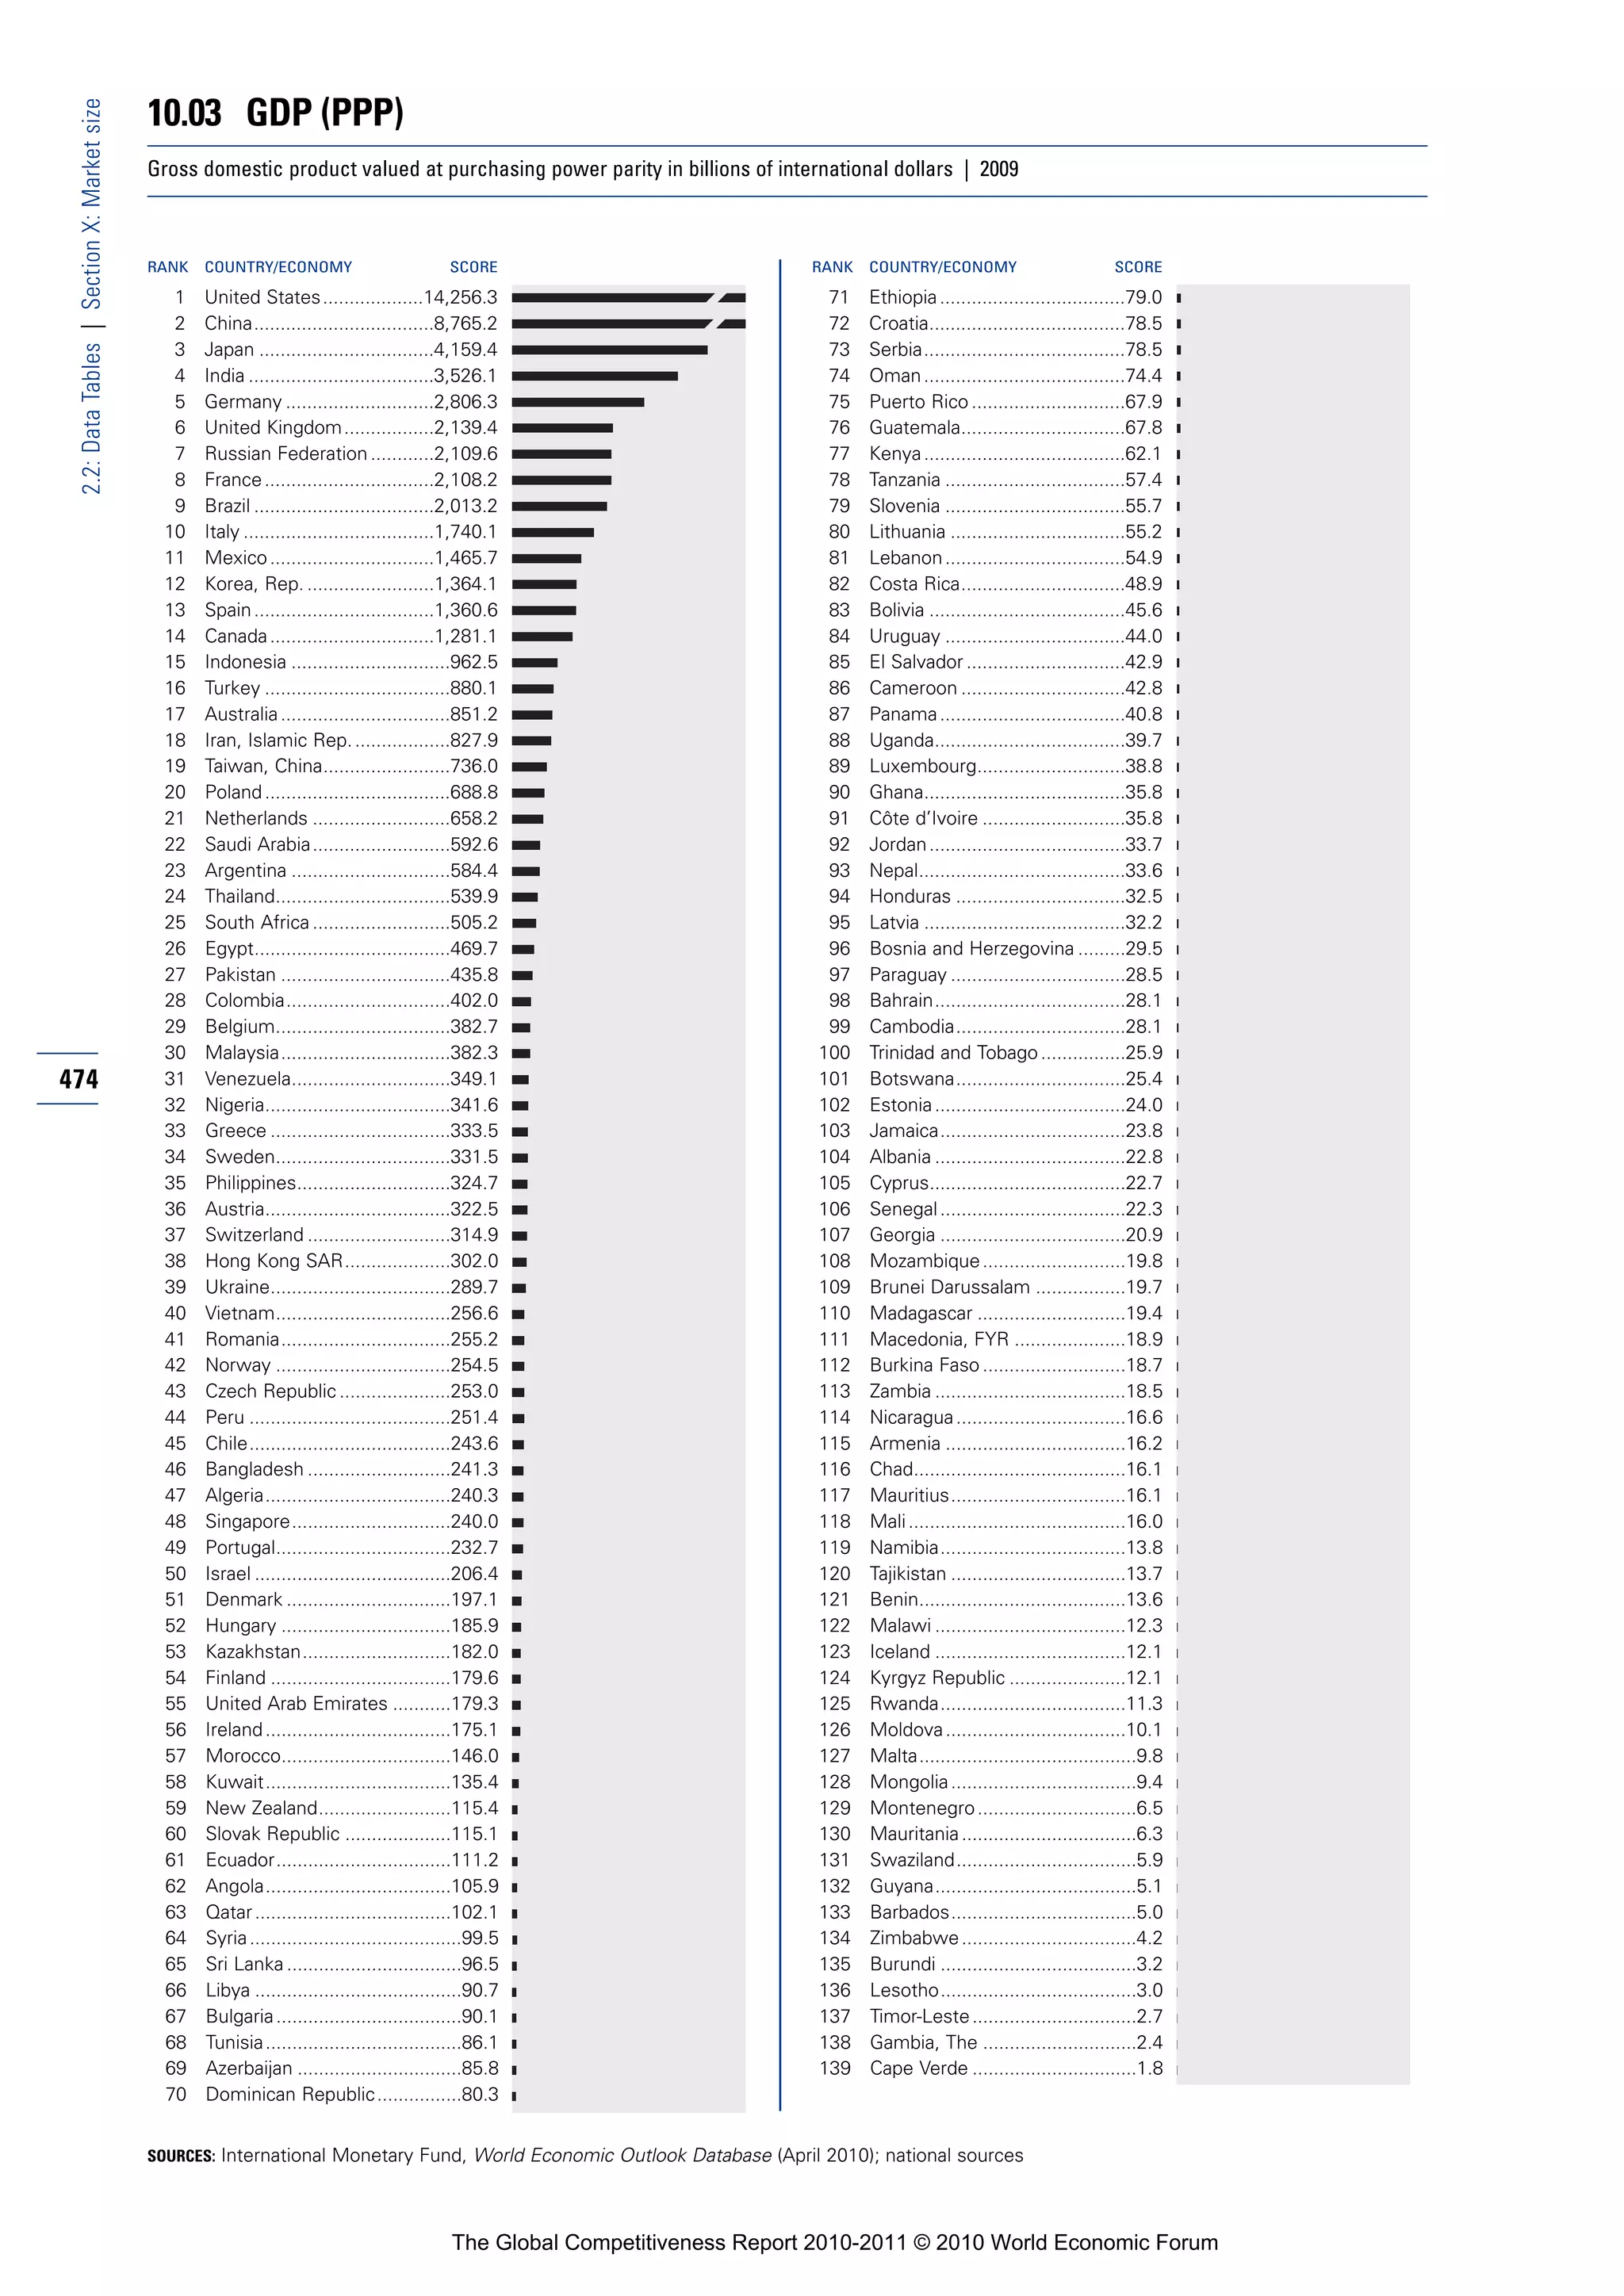
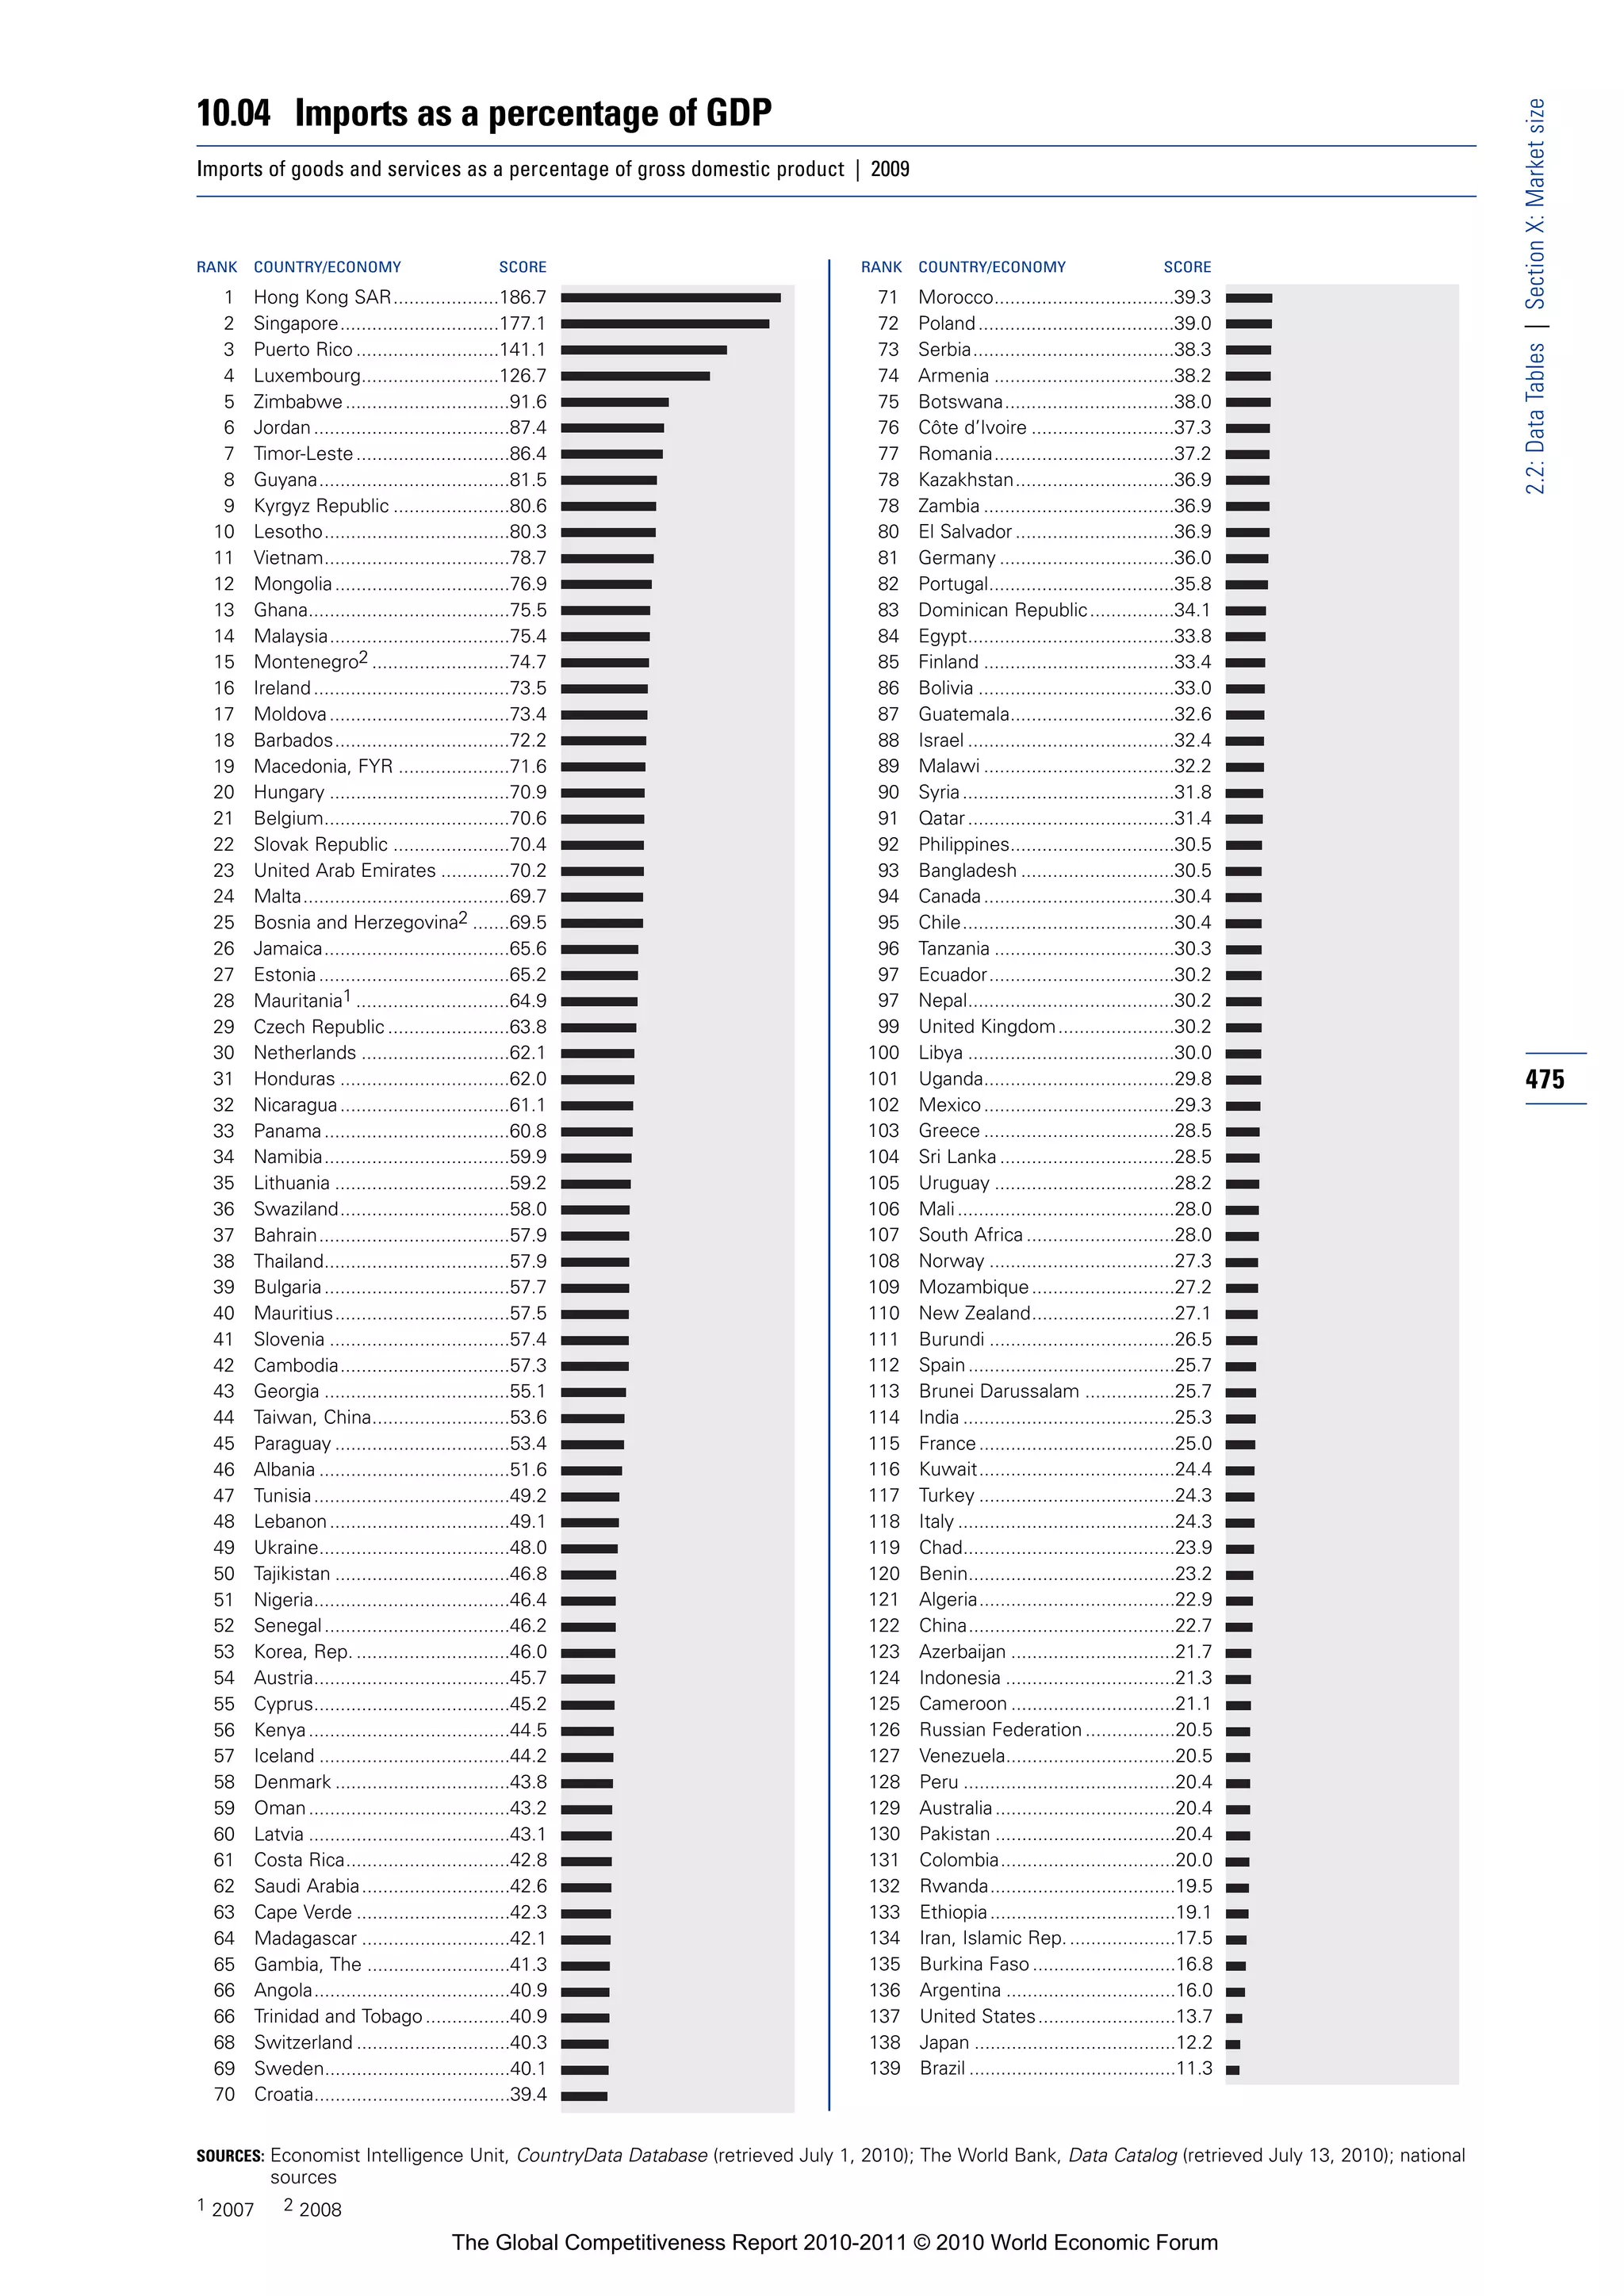
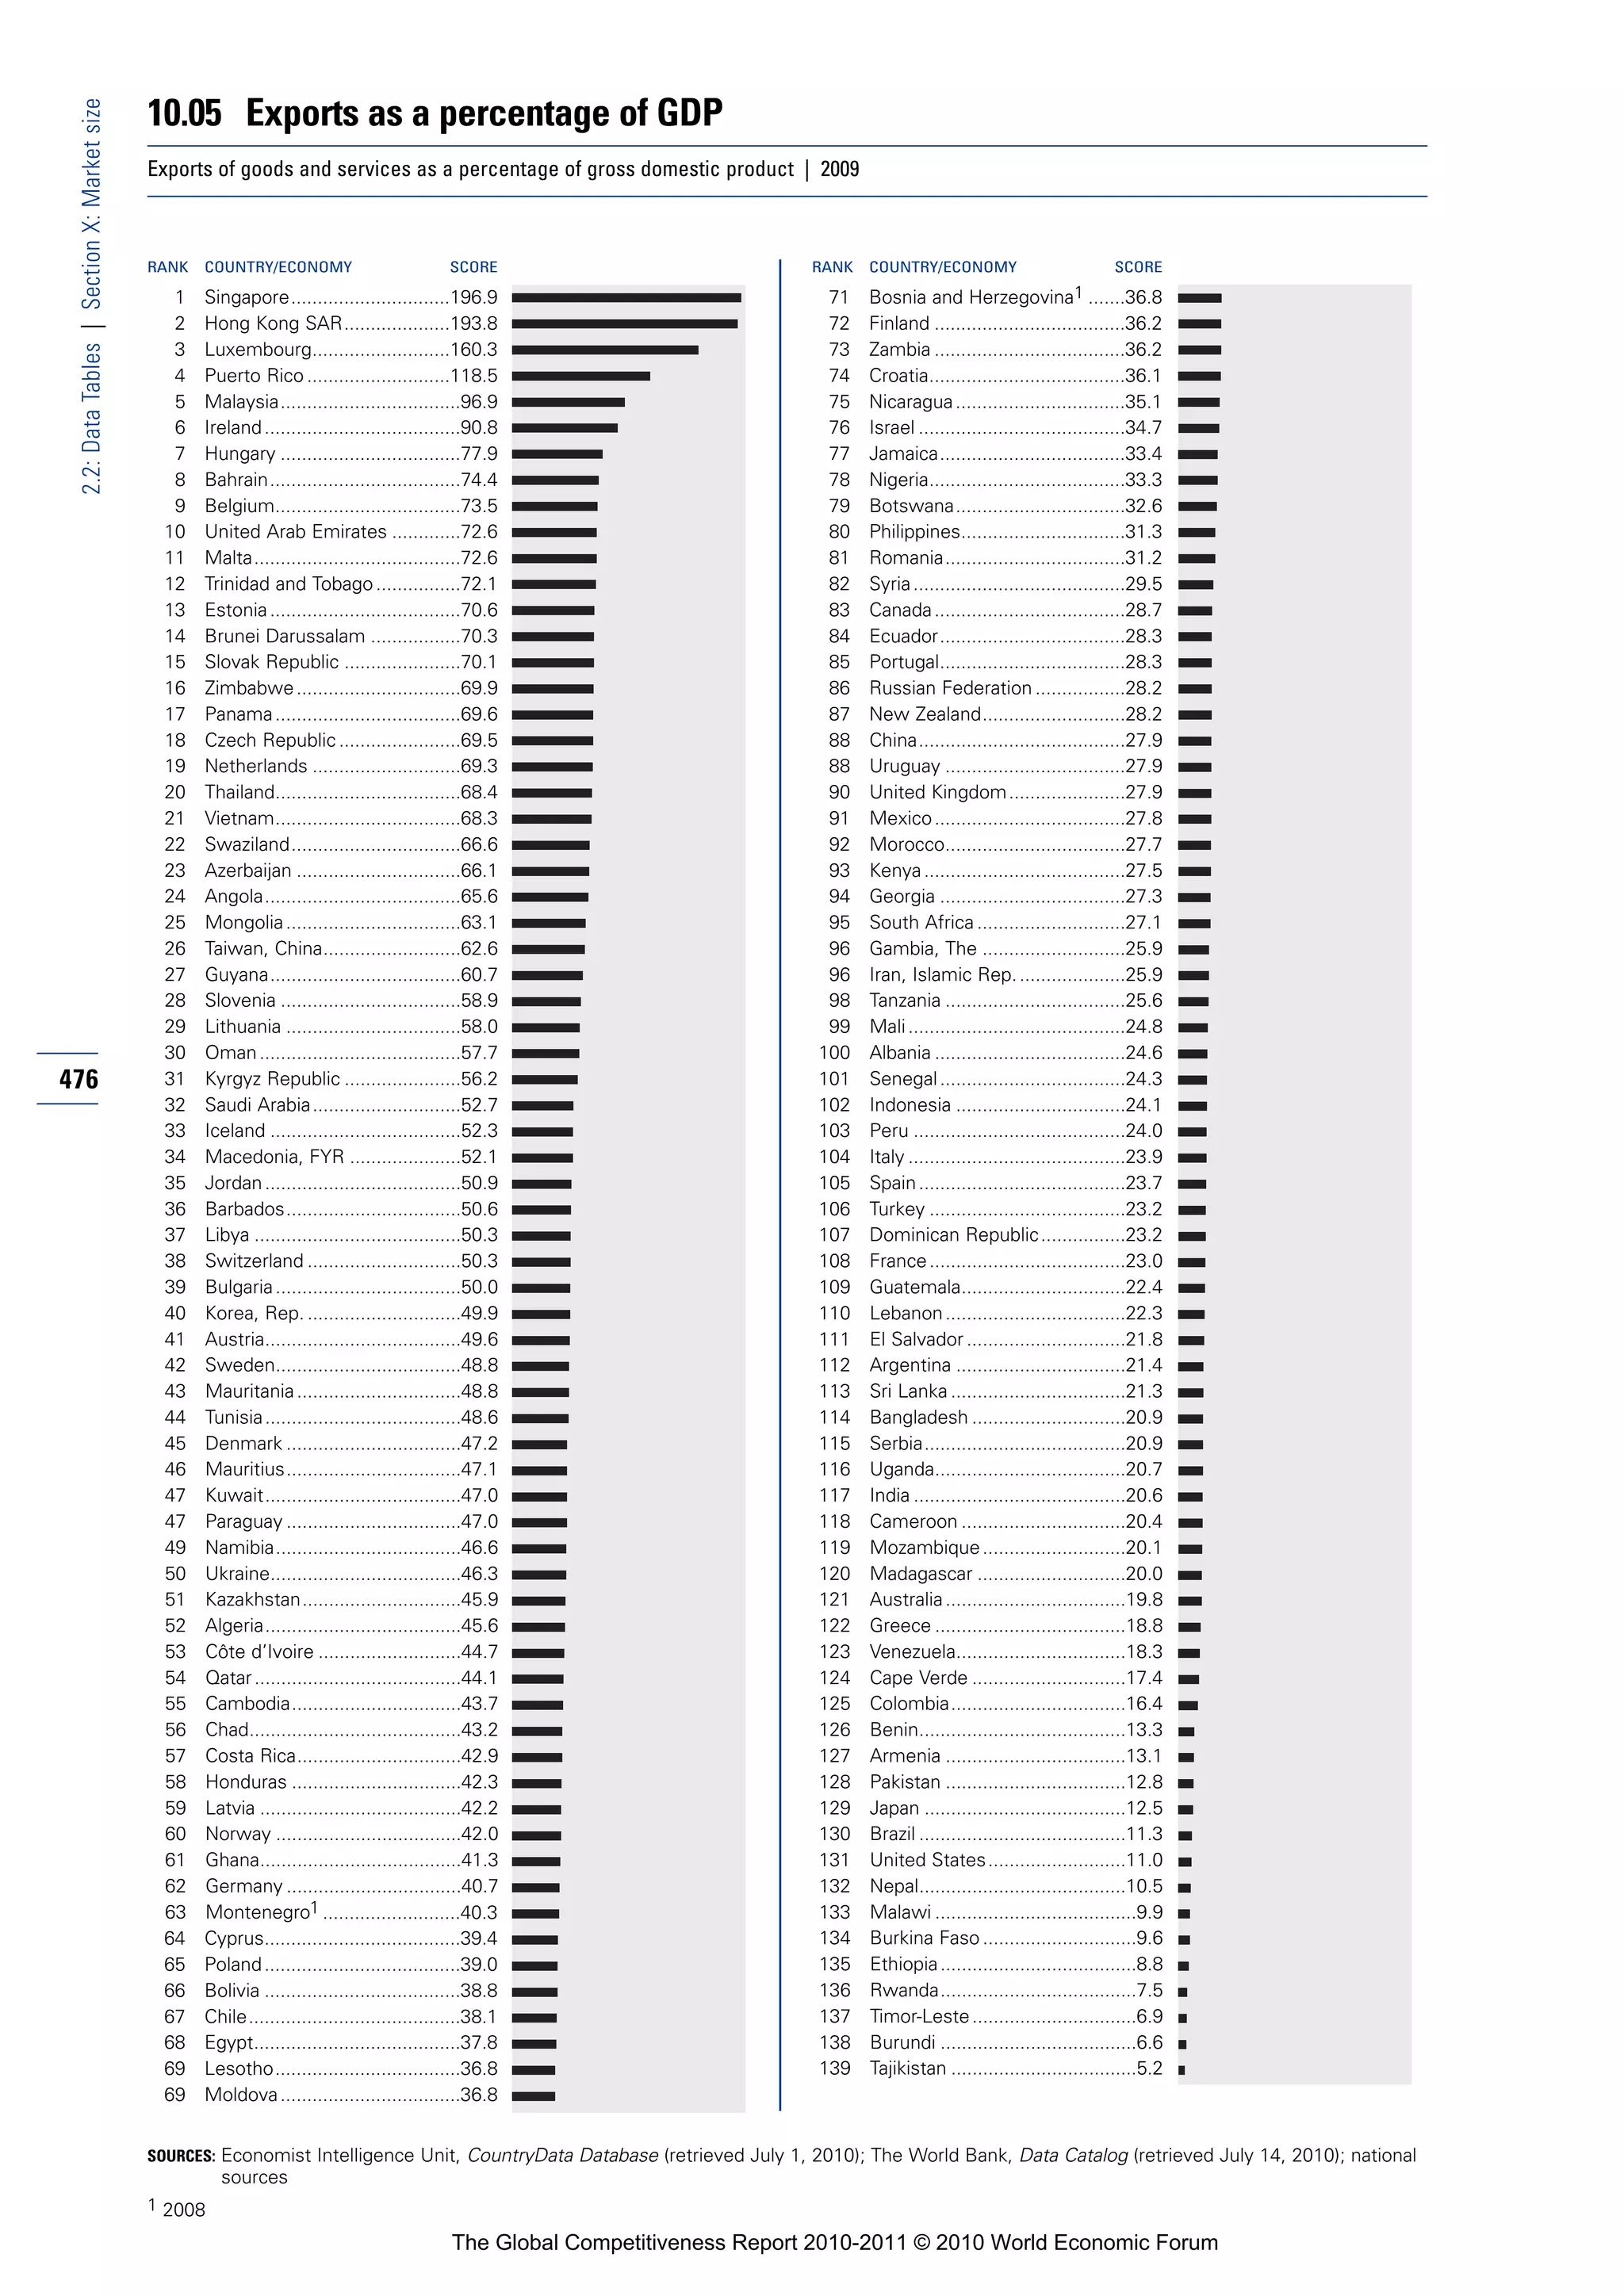
![11.01 Local supplier quantity
2.2: Data Tables | Section XI: Business sophistication
How numerous are local suppliers in your country? [1 = largely nonexistent; 7 = very numerous] | 2009–10 weighted average
RANK COUNTRY/ECONOMY SCORE 1 MEAN: 4.7 7 RANK COUNTRY/ECONOMY SCORE 1 MEAN: 4.7 7
1 Japan .....................................6.4 71 Mexico...................................4.7
2 Qatar......................................6.2 72 Bulgaria..................................4.7
3 Germany ................................6.0 73 Hungary .................................4.7
4 Taiwan, China ........................5.8 74 Oman.....................................4.7
5 Saudi Arabia...........................5.7 75 Mauritius ...............................4.7
6 Switzerland ............................5.7 76 Senegal..................................4.7
7 India.......................................5.7 77 New Zealand .........................4.7
8 Austria ...................................5.7 78 Madagascar ...........................4.6
9 Brazil ......................................5.7 79 Guyana ..................................4.6
10 Belgium .................................5.6 80 Finland ...................................4.6
11 United States.........................5.6 81 Côte d’Ivoire ..........................4.6
12 Netherlands ...........................5.6 82 Zambia...................................4.6
13 Italy ........................................5.6 83 Ghana ....................................4.6
14 Tunisia....................................5.5 84 Malawi ...................................4.6
15 Spain......................................5.5 85 Argentina ...............................4.6
16 Malta .....................................5.5 86 Serbia ....................................4.5
17 France....................................5.5 87 Pakistan .................................4.5
18 Poland....................................5.4 88 Cameroon..............................4.5
19 China .....................................5.4 89 Iceland ...................................4.5
20 Canada...................................5.4 90 Bangladesh............................4.5
21 United Arab Emirates ............5.4 91 Ukraine ..................................4.5
22 Czech Republic......................5.4 92 Honduras ...............................4.4
23 United Kingdom.....................5.4 93 Romania ................................4.4
24 Lebanon.................................5.4 94 Estonia...................................4.4
25 Korea, Rep.............................5.3 95 Azerbaijan ..............................4.4
26 Thailand .................................5.3 96 Burkina Faso..........................4.4
27 Turkey ....................................5.3 97 Barbados ...............................4.4
28 Sweden .................................5.3 98 Brunei Darussalam ................4.3
29 Malaysia ................................5.3 99 Croatia ...................................4.3
30 Nigeria ...................................5.2 100 Chad ......................................4.3
478 31 Israel ......................................5.2 101 Montenegro...........................4.3
32 Kuwait ...................................5.2 102 Burundi ..................................4.3
33 Guatemala .............................5.2 103 Russian Federation................4.3
34 Hong Kong SAR ....................5.2 104 Mali........................................4.3
35 South Africa...........................5.1 105 Libya ......................................4.3
36 Egypt .....................................5.1 106 Benin .....................................4.2
37 Australia.................................5.1 107 Bosnia and Herzegovina........4.2
38 Denmark ................................5.1 108 Luxembourg ..........................4.2
39 Slovak Republic .....................5.1 109 Tanzania .................................4.2
40 Trinidad and Tobago...............5.0 110 Armenia .................................4.2
41 Portugal .................................5.0 111 Jamaica .................................4.2
42 Mauritania..............................5.0 112 Albania...................................4.2
43 Indonesia ...............................5.0 113 Kazakhstan ............................4.2
44 Costa Rica .............................5.0 114 Paraguay................................4.1
45 Lithuania ................................5.0 115 Bahrain ..................................4.1
46 Panama..................................5.0 116 Bolivia ....................................4.1
47 Slovenia .................................5.0 117 Ecuador .................................4.1
48 Puerto Rico............................5.0 118 Ethiopia..................................4.1
49 Uganda ..................................5.0 119 Botswana ..............................4.1
50 Colombia ...............................5.0 120 Mozambique..........................4.1
51 Norway ..................................5.0 121 Nepal .....................................4.1
52 Morocco ................................5.0 122 Moldova.................................4.0
53 Cyprus ...................................5.0 123 Zimbabwe..............................4.0
54 Peru .......................................4.9 124 Uruguay .................................4.0
55 Sri Lanka................................4.9 125 Swaziland ..............................4.0
56 Iran, Islamic Rep....................4.9 126 Tajikistan ................................4.0
57 Kenya.....................................4.9 127 Namibia .................................4.0
58 Chile ......................................4.9 128 Cape Verde ............................3.9
59 Algeria ...................................4.9 129 Cambodia ..............................3.9
60 Jordan....................................4.9 130 Latvia .....................................3.9
61 Vietnam .................................4.9 131 Mongolia................................3.8
62 Ireland....................................4.9 132 Nicaragua...............................3.8
63 Singapore ..............................4.8 133 Kyrgyz Republic .....................3.7
64 Dominican Republic...............4.8 134 Timor-Leste............................3.7
65 Gambia, The ..........................4.8 135 Lesotho .................................3.6
66 Macedonia, FYR ....................4.8 136 Rwanda .................................3.6
67 Syria.......................................4.8 137 Georgia ..................................3.6
68 Philippines .............................4.8 138 Venezuela ..............................3.3
69 Greece...................................4.8 139 Angola ...................................2.5
70 El Salvador.............................4.8
SOURCE: World Economic Forum, Executive Opinion Survey
The Global Competitiveness Report 2010-2011 © 2010 World Economic Forum](https://image.slidesharecdn.com/globalcompetitivenessreportwef2010-11-100928142139-phpapp02/75/Global-competitiveness-report-wef-2010-11-491-2048.jpg)
![11.02 Local supplier quality
2.2: Data Tables | Section XI: Business sophistication
How would you assess the quality of local suppliers in your country? [1 = very poor; 7 = very good] | 2009–10 weighted average
RANK COUNTRY/ECONOMY SCORE 1 MEAN: 4.5 7 RANK COUNTRY/ECONOMY SCORE 1 MEAN: 4.5 7
1 Austria ...................................6.3 71 Bahrain ..................................4.4
2 Switzerland ............................6.2 72 Namibia .................................4.4
3 Germany ................................6.2 73 Uruguay .................................4.4
4 Japan .....................................6.2 74 Argentina ...............................4.4
5 Sweden .................................6.0 75 Brunei Darussalam ................4.4
6 Belgium .................................5.9 76 Croatia ...................................4.4
7 Canada...................................5.8 77 Guyana ..................................4.4
8 Netherlands ...........................5.8 78 Morocco ................................4.3
9 Qatar......................................5.7 79 Côte d’Ivoire ..........................4.3
10 France....................................5.7 80 Montenegro...........................4.3
11 Taiwan, China ........................5.7 81 Benin .....................................4.3
12 Norway ..................................5.6 82 Bulgaria..................................4.3
13 Denmark ................................5.6 83 Macedonia, FYR ....................4.3
14 United States.........................5.6 84 Jamaica .................................4.3
15 New Zealand .........................5.5 85 Dominican Republic...............4.2
16 Australia.................................5.5 86 Jordan....................................4.2
17 Czech Republic......................5.4 87 Bangladesh............................4.2
18 Puerto Rico............................5.4 88 Honduras ...............................4.2
19 Finland ...................................5.4 89 Egypt .....................................4.2
20 Hong Kong SAR ....................5.4 90 Uganda ..................................4.1
21 Israel ......................................5.4 91 Vietnam .................................4.1
22 South Africa...........................5.3 92 Swaziland ..............................4.1
23 Ireland....................................5.3 93 Malawi ...................................4.1
24 Saudi Arabia...........................5.3 94 Paraguay................................4.1
25 Iceland ...................................5.3 95 Pakistan .................................4.1
26 Spain......................................5.2 96 Romania ................................4.0
27 Chile ......................................5.2 97 Kazakhstan ............................4.0
28 Costa Rica .............................5.2 98 Zambia...................................4.0
29 Brazil ......................................5.2 99 Cameroon..............................4.0
30 United Kingdom.....................5.2 100 Ukraine ..................................4.0
31 Luxembourg ..........................5.2 101 Nigeria ...................................4.0 479
32 Slovenia .................................5.2 102 Azerbaijan ..............................4.0
33 Korea, Rep.............................5.2 103 Nicaragua...............................3.9
34 Cyprus ...................................5.1 104 Ecuador .................................3.9
35 Italy ........................................5.1 105 Algeria ...................................3.9
36 Estonia...................................5.1 106 Ghana ....................................3.9
37 Malaysia ................................5.1 107 Serbia ....................................3.9
38 United Arab Emirates ............5.1 108 Botswana ..............................3.9
39 Singapore ..............................5.1 109 Albania...................................3.9
40 Guatemala .............................5.0 110 Burkina Faso..........................3.9
41 Poland....................................5.0 111 Madagascar ...........................3.9
42 Colombia ...............................5.0 112 Bosnia and Herzegovina........3.9
43 Thailand .................................5.0 113 Moldova.................................3.9
44 Lithuania ................................5.0 114 Russian Federation................3.8
45 Tunisia....................................4.9 115 Tanzania .................................3.8
46 Panama..................................4.9 116 Armenia .................................3.8
47 Slovak Republic .....................4.9 117 Rwanda .................................3.8
48 Sri Lanka................................4.9 118 Bolivia ....................................3.7
49 El Salvador.............................4.9 119 Zimbabwe..............................3.7
50 Oman.....................................4.8 120 Mali........................................3.7
51 Portugal .................................4.8 121 Cambodia ..............................3.7
52 Lebanon.................................4.7 122 Kyrgyz Republic .....................3.7
53 Latvia .....................................4.7 123 Ethiopia..................................3.7
54 China .....................................4.7 124 Syria.......................................3.7
55 Mexico...................................4.7 125 Iran, Islamic Rep....................3.6
56 Barbados ...............................4.7 126 Tajikistan ................................3.6
57 Malta .....................................4.7 127 Mozambique..........................3.6
58 Gambia, The ..........................4.7 128 Burundi ..................................3.6
59 Turkey ....................................4.6 129 Venezuela ..............................3.6
60 India.......................................4.6 130 Cape Verde ............................3.5
61 Indonesia ...............................4.6 131 Georgia ..................................3.4
62 Hungary .................................4.6 132 Nepal .....................................3.4
63 Trinidad and Tobago...............4.6 133 Lesotho .................................3.4
64 Peru .......................................4.6 134 Mongolia................................3.4
65 Kuwait ...................................4.5 135 Chad ......................................3.3
66 Mauritius ...............................4.5 136 Libya ......................................3.3
67 Senegal..................................4.5 137 Mauritania..............................3.2
68 Greece...................................4.5 138 Timor-Leste............................3.0
69 Kenya.....................................4.4 139 Angola ...................................2.7
70 Philippines .............................4.4
SOURCE: World Economic Forum, Executive Opinion Survey
The Global Competitiveness Report 2010-2011 © 2010 World Economic Forum](https://image.slidesharecdn.com/globalcompetitivenessreportwef2010-11-100928142139-phpapp02/75/Global-competitiveness-report-wef-2010-11-492-2048.jpg)
![11.03 State of cluster development
2.2: Data Tables | Section XI: Business sophistication
In your country’s economy, how prevalent are well-developed and deep clusters? [1 = nonexistent; 7 = widespread in many fields] | 2009–10
weighted average
RANK COUNTRY/ECONOMY SCORE 1 MEAN: 3.6 7 RANK COUNTRY/ECONOMY SCORE 1 MEAN: 3.6 7
1 Italy ........................................5.5 71 Jordan....................................3.4
2 Japan .....................................5.4 72 Lesotho .................................3.4
3 Taiwan, China ........................5.4 73 Brunei Darussalam ................3.4
4 Switzerland ............................5.2 74 Gambia, The ..........................3.4
5 Singapore ..............................5.2 75 Tunisia....................................3.4
6 United States.........................5.1 76 Peru .......................................3.4
7 Hong Kong SAR ....................5.1 77 Honduras ...............................3.3
8 Sweden .................................5.1 78 Lebanon.................................3.3
9 Finland ...................................5.1 79 Jamaica .................................3.3
10 United Kingdom.....................5.0 80 El Salvador.............................3.3
11 Canada...................................5.0 81 Namibia .................................3.3
12 Germany ................................5.0 82 Bosnia and Herzegovina........3.2
13 Vietnam .................................4.9 83 Uruguay .................................3.2
14 Bahrain ..................................4.8 84 Trinidad and Tobago...............3.2
15 Malaysia ................................4.8 85 Kazakhstan ............................3.2
16 Luxembourg ..........................4.8 86 Nepal .....................................3.2
17 China .....................................4.7 87 Russian Federation................3.2
18 Norway ..................................4.7 88 Azerbaijan ..............................3.2
19 Netherlands ...........................4.7 89 Nicaragua...............................3.1
20 Denmark ................................4.6 90 Ghana ....................................3.1
21 Qatar......................................4.6 91 Iran, Islamic Rep....................3.1
22 Austria ...................................4.6 92 Estonia...................................3.1
23 Brazil ......................................4.5 93 Swaziland ..............................3.1
24 Indonesia ...............................4.5 94 Timor-Leste............................3.0
25 Korea, Rep.............................4.4 95 Guyana ..................................3.0
26 Belgium .................................4.3 96 Barbados ...............................3.0
27 Saudi Arabia...........................4.3 97 Mali........................................3.0
28 United Arab Emirates ............4.3 98 Georgia ..................................3.0
29 India.......................................4.2 99 Greece...................................2.9
30 France....................................4.2 100 Mozambique..........................2.9
480 31 Oman.....................................4.1 101 Hungary .................................2.9
32 Ireland....................................4.1 102 Syria.......................................2.9
33 Sri Lanka................................4.1 103 Latvia .....................................2.9
34 Thailand .................................4.1 104 Croatia ...................................2.9
35 Australia.................................4.1 105 Lithuania ................................2.9
36 Spain......................................4.1 106 Ukraine ..................................2.9
37 Mauritius ...............................4.1 107 Macedonia, FYR ....................2.9
38 Chile ......................................4.1 108 Poland....................................2.9
39 South Africa...........................4.0 109 Botswana ..............................2.9
40 Colombia ...............................4.0 110 Ecuador .................................2.9
41 Czech Republic......................4.0 111 Bolivia ....................................2.8
42 Guatemala .............................4.0 112 Bulgaria..................................2.8
43 Kenya.....................................4.0 113 Romania ................................2.8
44 Cyprus ...................................4.0 114 Ethiopia..................................2.8
45 Puerto Rico............................4.0 115 Montenegro...........................2.8
46 Pakistan .................................4.0 116 Paraguay................................2.8
47 Panama..................................3.9 117 Senegal..................................2.8
48 Nigeria ...................................3.8 118 Uganda ..................................2.8
49 Slovenia .................................3.8 119 Chad ......................................2.7
50 Mexico...................................3.8 120 Zimbabwe..............................2.7
51 Cambodia ..............................3.8 121 Kyrgyz Republic .....................2.6
52 Costa Rica .............................3.8 122 Serbia ....................................2.6
53 Bangladesh............................3.7 123 Albania...................................2.6
54 Portugal .................................3.7 124 Armenia .................................2.6
55 Philippines .............................3.7 125 Madagascar ...........................2.6
56 New Zealand .........................3.7 126 Algeria ...................................2.5
57 Malawi ...................................3.7 127 Mongolia................................2.5
58 Malta .....................................3.7 128 Tajikistan ................................2.5
59 Kuwait ...................................3.7 129 Mauritania..............................2.4
60 Iceland ...................................3.7 130 Benin .....................................2.4
61 Turkey ....................................3.6 131 Cameroon..............................2.4
62 Argentina ...............................3.6 132 Venezuela ..............................2.4
63 Dominican Republic...............3.6 133 Côte d’Ivoire ..........................2.4
64 Slovak Republic .....................3.6 134 Cape Verde ............................2.3
65 Rwanda .................................3.6 135 Moldova.................................2.3
66 Egypt .....................................3.5 136 Libya ......................................2.3
67 Israel ......................................3.5 137 Angola ...................................2.2
68 Tanzania .................................3.5 138 Burundi ..................................2.2
69 Morocco ................................3.4 139 Burkina Faso..........................1.9
70 Zambia...................................3.4
SOURCE: World Economic Forum, Executive Opinion Survey
The Global Competitiveness Report 2010-2011 © 2010 World Economic Forum](https://image.slidesharecdn.com/globalcompetitivenessreportwef2010-11-100928142139-phpapp02/75/Global-competitiveness-report-wef-2010-11-493-2048.jpg)
![11.04 Nature of competitive advantage
2.2: Data Tables | Section XI: Business sophistication
What is the nature of competitive advantage of your country’s companies in international markets based upon? [1 = low-cost or natural resources;
7 = unique products and processes] | 2009–10 weighted average
RANK COUNTRY/ECONOMY SCORE 1 MEAN: 3.6 7 RANK COUNTRY/ECONOMY SCORE 1 MEAN: 3.6 7
1 Japan .....................................6.4 71 Senegal..................................3.3
2 Switzerland ............................6.3 72 Brunei Darussalam ................3.3
3 Germany ................................6.3 73 Morocco ................................3.3
4 Finland ...................................6.0 74 New Zealand .........................3.2
5 Sweden .................................6.0 75 Lesotho .................................3.2
6 Denmark ................................5.9 76 Mongolia................................3.2
7 Israel ......................................5.8 77 Cambodia ..............................3.2
8 Netherlands ...........................5.8 78 Guyana ..................................3.2
9 United Kingdom.....................5.7 79 Namibia .................................3.2
10 Belgium .................................5.7 80 Bahrain ..................................3.1
11 Italy ........................................5.7 81 Bulgaria..................................3.1
12 Luxembourg ..........................5.7 82 Georgia ..................................3.1
13 Austria ...................................5.7 83 Colombia ...............................3.1
14 Singapore ..............................5.6 84 Pakistan .................................3.1
15 France....................................5.5 85 Mexico...................................3.1
16 Hong Kong SAR ....................5.5 86 Zambia...................................3.1
17 Ireland....................................5.3 87 South Africa...........................3.0
18 Korea, Rep.............................5.3 88 Uruguay .................................3.0
19 United States.........................5.2 89 Brazil ......................................3.0
20 Taiwan, China ........................5.1 90 Guatemala .............................3.0
21 Barbados ...............................5.1 91 Benin .....................................3.0
22 Puerto Rico............................5.0 92 Chile ......................................3.0
23 Cyprus ...................................4.6 93 Tanzania .................................3.0
24 United Arab Emirates ............4.6 94 Honduras ...............................3.0
25 Norway ..................................4.6 95 Albania...................................3.0
26 Lebanon.................................4.4 96 Romania ................................2.9
27 Costa Rica .............................4.4 97 Slovak Republic .....................2.9
28 Saudi Arabia...........................4.2 98 Russian Federation................2.9
29 Slovenia .................................4.2 99 Ukraine ..................................2.9
30 Malta .....................................4.2 100 Tajikistan ................................2.9
31 Jamaica .................................4.2 101 Timor-Leste............................2.9 481
32 Spain......................................4.1 102 Iran, Islamic Rep....................2.9
33 Indonesia ...............................4.1 103 Chad ......................................2.8
34 Malaysia ................................4.1 104 Malawi ...................................2.8
35 Egypt .....................................4.0 105 Ghana ....................................2.8
36 Azerbaijan ..............................3.9 106 Moldova.................................2.8
37 Mauritius ...............................3.9 107 Mozambique..........................2.8
38 Iceland ...................................3.9 108 Uganda ..................................2.8
39 Armenia .................................3.9 109 Peru .......................................2.8
40 Panama..................................3.9 110 Vietnam .................................2.8
41 Sri Lanka................................3.8 111 Kyrgyz Republic .....................2.7
42 Czech Republic......................3.8 112 Kazakhstan ............................2.7
43 Lithuania ................................3.8 113 Dominican Republic...............2.7
44 Tunisia....................................3.8 114 Syria.......................................2.7
45 Portugal .................................3.8 115 Angola ...................................2.7
46 Oman.....................................3.8 116 Swaziland ..............................2.7
47 Montenegro...........................3.7 117 Trinidad and Tobago...............2.6
48 China .....................................3.7 118 Bolivia ....................................2.6
49 Latvia .....................................3.6 119 Nepal .....................................2.6
50 Greece...................................3.6 120 Mauritania..............................2.6
51 Jordan....................................3.6 121 Madagascar ...........................2.6
52 Kuwait ...................................3.6 122 Bosnia and Herzegovina........2.6
53 Estonia...................................3.6 123 Côte d’Ivoire ..........................2.6
54 El Salvador.............................3.6 124 Nicaragua...............................2.6
55 Gambia, The ..........................3.6 125 Burkina Faso..........................2.6
56 Canada...................................3.5 126 Ecuador .................................2.6
57 Poland....................................3.5 127 Burundi ..................................2.6
58 Qatar......................................3.5 128 Mali........................................2.5
59 Australia.................................3.4 129 Algeria ...................................2.5
60 Croatia ...................................3.4 130 Macedonia, FYR ....................2.5
61 India.......................................3.4 131 Cameroon..............................2.5
62 Cape Verde ............................3.4 132 Ethiopia..................................2.5
63 Botswana ..............................3.4 133 Serbia ....................................2.4
64 Hungary .................................3.4 134 Argentina ...............................2.4
65 Kenya.....................................3.3 135 Paraguay................................2.4
66 Nigeria ...................................3.3 136 Zimbabwe..............................2.3
67 Philippines .............................3.3 137 Bangladesh............................2.3
68 Turkey ....................................3.3 138 Venezuela ..............................2.2
69 Rwanda .................................3.3 139 Libya ......................................2.1
70 Thailand .................................3.3
SOURCE: World Economic Forum, Executive Opinion Survey
The Global Competitiveness Report 2010-2011 © 2010 World Economic Forum](https://image.slidesharecdn.com/globalcompetitivenessreportwef2010-11-100928142139-phpapp02/75/Global-competitiveness-report-wef-2010-11-494-2048.jpg)
![11.05 Value chain breadth
2.2: Data Tables | Section XI: Business sophistication
In your country, do exporting companies have a narrow or broad presence in the value chain? [1 = narrow, primarily involved in individual steps
of the value chain (e.g., resource extraction or production); 7 = broad, present across the entire value chain (i.e., do not only produce but also
perform product design, marketing sales, logistics, and after-sales services)] | 2009–10 weighted average
RANK COUNTRY/ECONOMY SCORE 1 MEAN: 3.7 7 RANK COUNTRY/ECONOMY SCORE 1 MEAN: 3.7 7
1 Germany ................................6.3 71 Kuwait ...................................3.5
2 Japan .....................................6.3 72 Colombia ...............................3.5
3 Sweden .................................6.2 73 Moldova.................................3.5
4 Switzerland ............................6.1 74 Peru .......................................3.4
5 France....................................5.7 75 Greece...................................3.4
6 Austria ...................................5.7 76 Vietnam .................................3.4
7 Netherlands ...........................5.6 77 Bahrain ..................................3.4
8 Denmark ................................5.4 78 Australia.................................3.4
9 Finland ...................................5.3 79 Bangladesh............................3.4
10 Singapore ..............................5.3 80 Macedonia, FYR ....................3.4
11 United Kingdom.....................5.3 81 Ukraine ..................................3.4
12 Italy ........................................5.2 82 Latvia .....................................3.3
13 Hong Kong SAR ....................5.2 83 Jamaica .................................3.3
14 Korea, Rep.............................5.1 84 Guyana ..................................3.3
15 United States.........................5.1 85 Qatar......................................3.3
16 Taiwan, China ........................5.1 86 Ecuador .................................3.3
17 Luxembourg ..........................5.1 87 Rwanda .................................3.2
18 Belgium .................................5.0 88 Dominican Republic...............3.2
19 Ireland....................................4.9 89 Malawi ...................................3.2
20 Malaysia ................................4.8 90 Bulgaria..................................3.2
21 Saudi Arabia...........................4.7 91 South Africa...........................3.2
22 United Arab Emirates ............4.7 92 Argentina ...............................3.2
23 Israel ......................................4.6 93 Georgia ..................................3.2
24 Tunisia....................................4.5 94 Iran, Islamic Rep....................3.1
25 Spain......................................4.4 95 Lesotho .................................3.1
26 Indonesia ...............................4.4 96 Mozambique..........................3.1
27 Mauritius ...............................4.4 97 Trinidad and Tobago...............3.1
28 Costa Rica .............................4.4 98 Nigeria ...................................3.1
482 29 Czech Republic......................4.3 99 Cameroon..............................3.1
30 Norway ..................................4.3 100 Syria.......................................3.1
31 Puerto Rico............................4.3 101 Croatia ...................................3.1
32 Slovenia .................................4.3 102 Bolivia ....................................3.1
33 Canada...................................4.2 103 Cambodia ..............................3.1
34 Lithuania ................................4.2 104 Russian Federation................3.0
35 Lebanon.................................4.1 105 Tanzania .................................3.0
36 Sri Lanka................................4.1 106 Bosnia and Herzegovina........3.0
37 Thailand .................................4.1 107 Zambia...................................3.0
38 Malta .....................................4.1 108 Ghana ....................................3.0
39 Poland....................................4.0 109 Kazakhstan ............................3.0
40 Iceland ...................................4.0 110 Romania ................................3.0
41 China .....................................4.0 111 Brunei Darussalam ................2.9
42 India.......................................3.9 112 Paraguay................................2.9
43 Turkey ....................................3.9 113 Madagascar ...........................2.9
44 Cyprus ...................................3.9 114 Côte d’Ivoire ..........................2.9
45 Panama..................................3.9 115 Ethiopia..................................2.9
46 Hungary .................................3.8 116 Serbia ....................................2.9
47 Guatemala .............................3.8 117 Nicaragua...............................2.9
48 Chile ......................................3.8 118 Kyrgyz Republic .....................2.9
49 Mexico...................................3.8 119 Uganda ..................................2.9
50 Portugal .................................3.8 120 Mali........................................2.9
51 New Zealand .........................3.8 121 Armenia .................................2.9
52 Barbados ...............................3.8 122 Chad ......................................2.8
53 Azerbaijan ..............................3.8 123 Algeria ...................................2.8
54 Slovak Republic .....................3.8 124 Tajikistan ................................2.8
55 Senegal..................................3.8 125 Botswana ..............................2.8
56 Oman.....................................3.7 126 Mauritania..............................2.8
57 Benin .....................................3.7 127 Nepal .....................................2.7
58 Estonia...................................3.7 128 Mongolia................................2.7
59 Philippines .............................3.7 129 Albania...................................2.7
60 Brazil ......................................3.7 130 Timor-Leste............................2.7
61 El Salvador.............................3.6 131 Namibia .................................2.6
62 Jordan....................................3.6 132 Libya ......................................2.5
63 Kenya.....................................3.6 133 Burundi ..................................2.5
64 Honduras ...............................3.6 134 Zimbabwe..............................2.4
65 Uruguay .................................3.6 135 Swaziland ..............................2.4
66 Gambia, The ..........................3.6 136 Burkina Faso..........................2.4
67 Egypt .....................................3.6 137 Cape Verde ............................2.2
68 Montenegro...........................3.6 138 Venezuela ..............................2.1
69 Pakistan .................................3.5 139 Angola ...................................1.7
70 Morocco ................................3.5
SOURCE: World Economic Forum, Executive Opinion Survey
The Global Competitiveness Report 2010-2011 © 2010 World Economic Forum](https://image.slidesharecdn.com/globalcompetitivenessreportwef2010-11-100928142139-phpapp02/75/Global-competitiveness-report-wef-2010-11-495-2048.jpg)
![11.06 Control of international distribution
2.2: Data Tables | Section XI: Business sophistication
To what extent are international distribution and marketing from your country owned and controlled by domestic companies? [1 = not at all, they
take place through foreign companies; 7 = extensively, they are primarily owned and controlled by domestic companies] | 2009–10 weighted
average
RANK COUNTRY/ECONOMY SCORE 1 MEAN: 4.0 7 RANK COUNTRY/ECONOMY SCORE 1 MEAN: 4.0 7
1 Japan .....................................5.6 71 Nigeria ...................................4.0
2 Germany ................................5.5 72 Vietnam .................................4.0
3 Sweden .................................5.4 73 Benin .....................................4.0
4 Austria ...................................5.3 74 Barbados ...............................4.0
5 Iceland ...................................5.3 75 Uruguay .................................3.9
6 Switzerland ............................5.2 76 Mexico...................................3.9
7 Saudi Arabia...........................5.2 77 Ethiopia..................................3.9
8 United States.........................5.1 78 Argentina ...............................3.9
9 Lebanon.................................5.0 79 Estonia...................................3.9
10 Cyprus ...................................4.9 80 Macedonia, FYR ....................3.9
11 Netherlands ...........................4.9 81 Senegal..................................3.9
12 United Arab Emirates ............4.8 82 Honduras ...............................3.8
13 France....................................4.8 83 Guyana ..................................3.8
14 Taiwan, China ........................4.8 84 Paraguay................................3.8
15 Iran, Islamic Rep....................4.8 85 El Salvador.............................3.8
16 Denmark ................................4.8 86 Moldova.................................3.8
17 Malaysia ................................4.8 87 Malawi ...................................3.8
18 Turkey ....................................4.7 88 Georgia ..................................3.8
19 United Kingdom.....................4.7 89 Pakistan .................................3.8
20 Norway ..................................4.7 90 Puerto Rico............................3.8
21 Mauritius ...............................4.7 91 Russian Federation................3.7
22 Oman.....................................4.6 92 Croatia ...................................3.7
23 South Africa...........................4.6 93 Tanzania .................................3.7
24 Korea, Rep.............................4.6 94 Egypt .....................................3.7
25 Finland ...................................4.6 95 Kazakhstan ............................3.7
26 Kuwait ...................................4.6 96 Hungary .................................3.7
27 Brazil ......................................4.6 97 Ecuador .................................3.7
28 Hong Kong SAR ....................4.6 98 Zimbabwe..............................3.7
29 Tunisia....................................4.5 99 Ghana ....................................3.7 483
30 Slovenia .................................4.5 100 Bulgaria..................................3.7
31 Australia.................................4.5 101 Latvia .....................................3.6
32 Lithuania ................................4.5 102 Jamaica .................................3.6
33 Indonesia ...............................4.4 103 Morocco ................................3.6
34 Sri Lanka................................4.4 104 Nicaragua...............................3.6
35 Syria.......................................4.4 105 Romania ................................3.6
36 Canada...................................4.4 106 Mozambique..........................3.6
37 New Zealand .........................4.4 107 Botswana ..............................3.6
38 Bahrain ..................................4.4 108 Ukraine ..................................3.6
39 Belgium .................................4.4 109 Algeria ...................................3.6
40 Chile ......................................4.4 110 Armenia .................................3.6
41 Thailand .................................4.3 111 Bangladesh............................3.5
42 China .....................................4.3 112 Mauritania..............................3.5
43 Italy ........................................4.3 113 Nepal .....................................3.5
44 Montenegro...........................4.3 114 Zambia...................................3.5
45 Philippines .............................4.3 115 Bolivia ....................................3.5
46 Malta .....................................4.3 116 Libya ......................................3.5
47 Azerbaijan ..............................4.3 117 Czech Republic......................3.5
48 Costa Rica .............................4.3 118 Slovak Republic .....................3.5
49 Dominican Republic...............4.2 119 Namibia .................................3.4
50 Qatar......................................4.2 120 Serbia ....................................3.4
51 Jordan....................................4.2 121 Venezuela ..............................3.4
52 Albania...................................4.2 122 Mali........................................3.4
53 Kenya.....................................4.2 123 Swaziland ..............................3.3
54 Rwanda .................................4.2 124 Cambodia ..............................3.3
55 Luxembourg ..........................4.2 125 Tajikistan ................................3.3
56 Guatemala .............................4.2 126 Uganda ..................................3.2
57 Spain......................................4.2 127 Cameroon..............................3.2
58 Singapore ..............................4.1 128 Côte d’Ivoire ..........................3.2
59 Poland....................................4.1 129 Lesotho .................................3.1
60 Israel ......................................4.1 130 Bosnia and Herzegovina........3.1
61 Greece...................................4.1 131 Madagascar ...........................3.1
62 Colombia ...............................4.1 132 Timor-Leste............................3.0
63 Gambia, The ..........................4.1 133 Kyrgyz Republic .....................3.0
64 India.......................................4.1 134 Cape Verde ............................3.0
65 Portugal .................................4.1 135 Mongolia................................2.9
66 Trinidad and Tobago...............4.1 136 Burundi ..................................2.9
67 Peru .......................................4.0 137 Angola ...................................2.9
68 Brunei Darussalam ................4.0 138 Chad ......................................2.8
69 Panama..................................4.0 139 Burkina Faso..........................2.5
70 Ireland....................................4.0
SOURCE: World Economic Forum, Executive Opinion Survey
The Global Competitiveness Report 2010-2011 © 2010 World Economic Forum](https://image.slidesharecdn.com/globalcompetitivenessreportwef2010-11-100928142139-phpapp02/75/Global-competitiveness-report-wef-2010-11-496-2048.jpg)
![11.07 Production process sophistication
2.2: Data Tables | Section XI: Business sophistication
In your country, how sophisticated are production processes? [1 = not at all—labor-intensive methods or previous generations of process
technology prevail; 7 = highly—the world’s best and most efficient process technology prevails] | 2009–10 weighted average
RANK COUNTRY/ECONOMY SCORE 1 MEAN: 3.9 7 RANK COUNTRY/ECONOMY SCORE 1 MEAN: 3.9 7
1 Japan .....................................6.6 71 Morocco ................................3.6
2 Germany ................................6.5 72 Latvia .....................................3.5
3 Switzerland ............................6.4 73 Uruguay .................................3.5
4 Sweden .................................6.2 74 Peru .......................................3.5
5 Finland ...................................6.1 75 Iran, Islamic Rep....................3.5
6 Netherlands ...........................6.0 76 Pakistan .................................3.4
7 Austria ...................................5.9 77 Romania ................................3.4
8 Qatar......................................5.9 78 Ukraine ..................................3.4
9 Belgium .................................5.8 79 Brunei Darussalam ................3.4
10 Norway ..................................5.7 80 Kazakhstan ............................3.4
11 United States.........................5.7 81 Lebanon.................................3.4
12 Denmark ................................5.7 82 Namibia .................................3.4
13 France....................................5.7 83 Algeria ...................................3.4
14 Singapore ..............................5.6 84 Montenegro...........................3.4
15 Canada...................................5.5 85 Syria.......................................3.3
16 Taiwan, China ........................5.5 86 Philippines .............................3.3
17 United Kingdom.....................5.5 87 Dominican Republic...............3.3
18 Luxembourg ..........................5.4 88 Croatia ...................................3.3
19 Iceland ...................................5.4 89 Bulgaria..................................3.2
20 Puerto Rico............................5.3 90 Macedonia, FYR ....................3.2
21 Ireland....................................5.3 91 El Salvador.............................3.2
22 Israel ......................................5.2 92 Jamaica .................................3.2
23 Korea, Rep.............................5.2 93 Russian Federation................3.2
24 Australia.................................5.2 94 Venezuela ..............................3.2
25 Saudi Arabia...........................5.1 95 Senegal..................................3.2
26 New Zealand .........................4.9 96 Honduras ...............................3.2
27 Italy ........................................4.9 97 Guyana ..................................3.1
28 United Arab Emirates ............4.8 98 Nigeria ...................................3.1
29 Brazil ......................................4.7 99 Botswana ..............................3.1
30 Malaysia ................................4.6 100 Armenia .................................3.1
484 31 Chile ......................................4.6 101 Ecuador .................................3.1
32 Costa Rica .............................4.6 102 Angola ...................................3.1
33 Hong Kong SAR ....................4.6 103 Tajikistan ................................3.1
34 Czech Republic......................4.6 104 Ghana ....................................3.1
35 Slovak Republic .....................4.5 105 Bolivia ....................................3.1
36 Portugal .................................4.4 106 Zambia...................................3.0
37 Malta .....................................4.4 107 Cameroon..............................3.0
38 Turkey ....................................4.4 108 Gambia, The ..........................3.0
39 South Africa...........................4.4 109 Mongolia................................3.0
40 Spain......................................4.4 110 Benin .....................................3.0
41 Estonia...................................4.3 111 Tanzania .................................3.0
42 Slovenia .................................4.3 112 Mozambique..........................3.0
43 India.......................................4.3 113 Cape Verde ............................2.9
44 Cyprus ...................................4.3 114 Bosnia and Herzegovina........2.9
45 Oman.....................................4.2 115 Bangladesh............................2.9
46 Egypt .....................................4.1 116 Georgia ..................................2.9
47 Bahrain ..................................4.1 117 Libya ......................................2.9
48 Poland....................................4.1 118 Cambodia ..............................2.9
49 Tunisia....................................4.1 119 Côte d’Ivoire ..........................2.8
50 Mauritius ...............................4.0 120 Nicaragua...............................2.8
51 Lithuania ................................4.0 121 Rwanda .................................2.8
52 Indonesia ...............................4.0 122 Paraguay................................2.8
53 Azerbaijan ..............................4.0 123 Malawi ...................................2.8
54 Sri Lanka................................4.0 124 Swaziland ..............................2.7
55 China .....................................3.9 125 Serbia ....................................2.7
56 Hungary .................................3.9 126 Moldova.................................2.7
57 Panama..................................3.9 127 Lesotho .................................2.6
58 Argentina ...............................3.8 128 Chad ......................................2.6
59 Trinidad and Tobago...............3.8 129 Ethiopia..................................2.5
60 Thailand .................................3.8 130 Kyrgyz Republic .....................2.5
61 Mexico...................................3.8 131 Madagascar ...........................2.5
62 Guatemala .............................3.7 132 Zimbabwe..............................2.5
63 Barbados ...............................3.7 133 Mali........................................2.4
64 Albania...................................3.7 134 Uganda ..................................2.4
65 Jordan....................................3.7 135 Nepal .....................................2.3
66 Kenya.....................................3.7 136 Timor-Leste............................2.3
67 Kuwait ...................................3.7 137 Burkina Faso..........................2.3
68 Colombia ...............................3.6 138 Mauritania..............................2.3
69 Vietnam .................................3.6 139 Burundi ..................................2.2
70 Greece...................................3.6
SOURCE: World Economic Forum, Executive Opinion Survey
The Global Competitiveness Report 2010-2011 © 2010 World Economic Forum](https://image.slidesharecdn.com/globalcompetitivenessreportwef2010-11-100928142139-phpapp02/75/Global-competitiveness-report-wef-2010-11-497-2048.jpg)
![11.08 Extent of marketing
2.2: Data Tables | Section XI: Business sophistication
In your country, to what extent do companies use sophisticated marketing tools and techniques? [1 = very little; 7 = extensively] | 2009–10
weighted average
RANK COUNTRY/ECONOMY SCORE 1 MEAN: 4.1 7 RANK COUNTRY/ECONOMY SCORE 1 MEAN: 4.1 7
1 United States.........................6.0 71 Peru .......................................4.1
2 Sweden .................................6.0 72 Mexico...................................4.0
3 Switzerland ............................5.9 73 Kenya.....................................4.0
4 United Kingdom.....................5.9 74 Uruguay .................................4.0
5 Netherlands ...........................5.8 75 Jordan....................................3.9
6 Qatar......................................5.8 76 Morocco ................................3.9
7 Germany ................................5.8 77 Senegal..................................3.9
8 France....................................5.7 78 Romania ................................3.9
9 Japan .....................................5.7 79 Egypt .....................................3.9
10 Canada...................................5.7 80 Venezuela ..............................3.8
11 Denmark ................................5.6 81 Azerbaijan ..............................3.8
12 Austria ...................................5.6 82 Jamaica .................................3.8
13 Hong Kong SAR ....................5.5 83 Croatia ...................................3.8
14 Belgium .................................5.4 84 Mongolia................................3.8
15 Norway ..................................5.4 85 Kazakhstan ............................3.8
16 Australia.................................5.3 86 Colombia ...............................3.8
17 Luxembourg ..........................5.3 87 Namibia .................................3.8
18 Taiwan, China ........................5.3 88 Russian Federation................3.8
19 United Arab Emirates ............5.3 89 Côte d’Ivoire ..........................3.7
20 Singapore ..............................5.3 90 Pakistan .................................3.7
21 Puerto Rico............................5.2 91 Ukraine ..................................3.7
22 Brazil ......................................5.2 92 Mozambique..........................3.6
23 New Zealand .........................5.2 93 Brunei Darussalam ................3.6
24 Ireland....................................5.1 94 Honduras ...............................3.6
25 Iceland ...................................5.1 95 Gambia, The ..........................3.5
26 Saudi Arabia...........................5.0 96 Ghana ....................................3.5
27 Chile ......................................5.0 97 Ecuador .................................3.5
28 South Africa...........................4.9 98 Macedonia, FYR ....................3.5
29 Finland ...................................4.9 99 Bolivia ....................................3.5
30 Panama..................................4.9 100 Bulgaria..................................3.5
31 Malaysia ................................4.9 101 Cameroon..............................3.4 485
32 Korea, Rep.............................4.9 102 Georgia ..................................3.4
33 Turkey ....................................4.8 103 Nigeria ...................................3.4
34 Israel ......................................4.7 104 Tanzania .................................3.4
35 Cyprus ...................................4.7 105 Algeria ...................................3.4
36 Costa Rica .............................4.6 106 Moldova.................................3.3
37 Lebanon.................................4.6 107 Iran, Islamic Rep....................3.3
38 Spain......................................4.6 108 Bangladesh............................3.3
39 Portugal .................................4.6 109 Cambodia ..............................3.3
40 Bahrain ..................................4.6 110 Paraguay................................3.2
41 Czech Republic......................4.6 111 Zambia...................................3.2
42 Albania...................................4.6 112 Guyana ..................................3.2
43 Slovak Republic .....................4.6 113 Cape Verde ............................3.2
44 Poland....................................4.5 114 Bosnia and Herzegovina........3.2
45 Lithuania ................................4.5 115 Zimbabwe..............................3.2
46 Thailand .................................4.5 116 Kyrgyz Republic .....................3.1
47 Italy ........................................4.5 117 Botswana ..............................3.1
48 Slovenia .................................4.5 118 Benin .....................................3.1
49 China .....................................4.5 119 Armenia .................................3.1
50 Philippines .............................4.5 120 Nicaragua...............................3.1
51 Vietnam .................................4.4 121 Angola ...................................3.1
52 Hungary .................................4.4 122 Serbia ....................................3.0
53 Sri Lanka................................4.4 123 Syria.......................................3.0
54 Guatemala .............................4.4 124 Malawi ...................................3.0
55 Tunisia....................................4.4 125 Lesotho .................................3.0
56 Indonesia ...............................4.4 126 Swaziland ..............................3.0
57 India.......................................4.4 127 Rwanda .................................3.0
58 Greece...................................4.3 128 Tajikistan ................................3.0
59 Malta .....................................4.3 129 Libya ......................................2.9
60 Argentina ...............................4.3 130 Madagascar ...........................2.8
61 Estonia...................................4.3 131 Uganda ..................................2.7
62 Kuwait ...................................4.3 132 Ethiopia..................................2.7
63 Montenegro...........................4.2 133 Mali........................................2.7
64 Oman.....................................4.2 134 Nepal .....................................2.6
65 Mauritius ...............................4.2 135 Burkina Faso..........................2.5
66 Dominican Republic...............4.1 136 Chad ......................................2.4
67 Barbados ...............................4.1 137 Timor-Leste............................2.3
68 El Salvador.............................4.1 138 Burundi ..................................2.3
69 Latvia .....................................4.1 139 Mauritania..............................1.8
70 Trinidad and Tobago...............4.1
SOURCE: World Economic Forum, Executive Opinion Survey
The Global Competitiveness Report 2010-2011 © 2010 World Economic Forum](https://image.slidesharecdn.com/globalcompetitivenessreportwef2010-11-100928142139-phpapp02/75/Global-competitiveness-report-wef-2010-11-498-2048.jpg)
![11.09 Willingness to delegate authority
2.2: Data Tables | Section XI: Business sophistication
In your country, how do you assess the willingness to delegate authority to subordinates? [1 = low—top management controls all important
decisions; 7 = high—authority is mostly delegated to business unit heads and other lower-level managers] | 2009–10 weighted average
RANK COUNTRY/ECONOMY SCORE 1 MEAN: 3.7 7 RANK COUNTRY/ECONOMY SCORE 1 MEAN: 3.7 7
1 Sweden .................................6.5 71 Tanzania .................................3.6
2 Norway ..................................5.9 72 Jordan....................................3.6
3 Denmark ................................5.8 73 Latvia .....................................3.5
4 Netherlands ...........................5.7 74 Lesotho .................................3.5
5 Switzerland ............................5.2 75 Uruguay .................................3.5
6 Finland ...................................5.2 76 Albania...................................3.5
7 Canada...................................5.1 77 Thailand .................................3.5
8 United States.........................5.1 78 Portugal .................................3.5
9 Germany ................................5.0 79 Barbados ...............................3.5
10 New Zealand .........................5.0 80 Guyana ..................................3.4
11 Iceland ...................................4.9 81 Romania ................................3.4
12 Australia.................................4.9 82 Benin .....................................3.4
13 Japan .....................................4.8 83 Trinidad and Tobago...............3.4
14 Belgium .................................4.8 84 Botswana ..............................3.4
15 Luxembourg ..........................4.8 85 Pakistan .................................3.3
16 United Kingdom.....................4.8 86 Mexico...................................3.3
17 Malaysia ................................4.6 87 Azerbaijan ..............................3.3
18 Austria ...................................4.6 88 Korea, Rep.............................3.3
19 Saudi Arabia...........................4.6 89 Jamaica .................................3.3
20 United Arab Emirates ............4.6 90 Dominican Republic...............3.3
21 Singapore ..............................4.5 91 Ghana ....................................3.2
22 Puerto Rico............................4.4 92 Syria.......................................3.2
23 Ireland....................................4.3 93 Macedonia, FYR ....................3.2
24 Czech Republic......................4.3 94 Bosnia and Herzegovina........3.2
25 Estonia...................................4.3 95 Kazakhstan ............................3.2
26 Kuwait ...................................4.2 96 Morocco ................................3.2
27 Costa Rica .............................4.2 97 Italy........................................3.2
28 Israel ......................................4.2 98 Ethiopia..................................3.2
29 Bahrain ..................................4.2 99 Nicaragua...............................3.1
30 Sri Lanka................................4.2 100 Bulgaria..................................3.1
486 31 South Africa...........................4.1 101 Swaziland ..............................3.1
32 Indonesia ...............................4.1 102 Greece...................................3.1
33 Hong Kong SAR ....................4.1 103 Russian Federation................3.1
34 Slovenia .................................4.1 104 Cambodia ..............................3.1
35 Gambia, The ..........................4.1 105 Bolivia ....................................3.1
36 Montenegro...........................4.1 106 Croatia ...................................3.1
37 Panama..................................4.0 107 Venezuela ..............................3.1
38 Philippines .............................4.0 108 Hungary .................................3.0
39 Oman.....................................4.0 109 Ukraine ..................................3.0
40 Poland....................................4.0 110 Tajikistan ................................3.0
41 Qatar......................................4.0 111 Algeria ...................................3.0
42 Nigeria ...................................4.0 112 Moldova.................................3.0
43 Brazil ......................................3.9 113 Cameroon..............................3.0
44 Cyprus ...................................3.9 114 Ecuador .................................3.0
45 Slovak Republic .....................3.9 115 Georgia ..................................3.0
46 Taiwan, China ........................3.9 116 Kyrgyz Republic .....................2.9
47 France....................................3.9 117 Senegal..................................2.9
48 India.......................................3.9 118 Madagascar ...........................2.9
49 Guatemala .............................3.9 119 Uganda ..................................2.9
50 Malta .....................................3.9 120 Mozambique..........................2.9
51 Brunei Darussalam ................3.9 121 Iran, Islamic Rep....................2.9
52 Lithuania ................................3.9 122 Turkey ....................................2.8
53 Colombia ...............................3.9 123 Paraguay................................2.8
54 El Salvador.............................3.8 124 Chad ......................................2.8
55 Malawi ...................................3.7 125 Mali........................................2.8
56 Namibia .................................3.7 126 Bangladesh............................2.8
57 Egypt .....................................3.7 127 Serbia ....................................2.7
58 Mauritius ...............................3.7 128 Armenia .................................2.7
59 Honduras ...............................3.7 129 Angola ...................................2.7
60 Tunisia....................................3.7 130 Timor-Leste............................2.7
61 Spain......................................3.7 131 Nepal .....................................2.7
62 Argentina ...............................3.7 132 Cape Verde ............................2.7
63 Kenya.....................................3.6 133 Lebanon.................................2.7
64 Vietnam .................................3.6 134 Côte d’Ivoire ..........................2.5
65 Peru .......................................3.6 135 Mauritania..............................2.5
66 Zambia...................................3.6 136 Burundi ..................................2.4
67 Chile ......................................3.6 137 Mongolia................................2.4
68 China .....................................3.6 138 Burkina Faso..........................2.4
69 Zimbabwe..............................3.6 139 Libya ......................................2.3
70 Rwanda .................................3.6
SOURCE: World Economic Forum, Executive Opinion Survey
The Global Competitiveness Report 2010-2011 © 2010 World Economic Forum](https://image.slidesharecdn.com/globalcompetitivenessreportwef2010-11-100928142139-phpapp02/75/Global-competitiveness-report-wef-2010-11-499-2048.jpg)
![12.01 Capacity for innovation
2.2: Data Tables | Section XII: Innovation
In your country, how do companies obtain technology? [1 = exclusively from licensing or imitating foreign companies; 7 = by conducting formal
research and pioneering their own new products and processes] | 2009–10 weighted average
RANK COUNTRY/ECONOMY SCORE 1 MEAN: 3.2 7 RANK COUNTRY/ECONOMY SCORE 1 MEAN: 3.2 7
1 Germany ................................5.9 71 Guatemala .............................2.9
2 Japan .....................................5.8 72 Romania ................................2.9
3 Sweden .................................5.7 73 Nigeria ...................................2.9
4 Switzerland ............................5.7 74 Mongolia................................2.8
5 Finland ...................................5.6 75 Kazakhstan ............................2.8
6 United States.........................5.3 76 Mauritius ...............................2.8
7 Israel ......................................5.3 77 Senegal..................................2.8
8 France....................................5.1 78 Tanzania .................................2.8
9 Denmark ................................4.9 79 Bulgaria..................................2.8
10 Netherlands ...........................4.9 80 Philippines .............................2.8
11 Austria ...................................4.7 81 Panama..................................2.7
12 Belgium .................................4.7 82 Serbia ....................................2.7
13 Norway ..................................4.7 83 Brunei Darussalam ................2.7
14 Taiwan, China ........................4.7 84 Malawi ...................................2.7
15 United Kingdom.....................4.7 85 Bolivia ....................................2.7
16 Luxembourg ..........................4.6 86 Mexico...................................2.7
17 Singapore ..............................4.3 87 Macedonia, FYR ....................2.7
18 Korea, Rep.............................4.3 88 Tajikistan ................................2.7
19 Canada...................................4.2 89 Guyana ..................................2.7
20 Iceland ...................................4.2 90 Honduras ...............................2.7
21 China .....................................4.2 91 Moldova.................................2.7
22 Slovenia .................................4.2 92 Nicaragua...............................2.7
23 Australia.................................4.1 93 Barbados ...............................2.7
24 Czech Republic......................4.1 94 Morocco ................................2.7
25 Malaysia ................................4.1 95 Peru .......................................2.6
26 Saudi Arabia...........................4.0 96 Jordan....................................2.6
27 Italy ........................................4.0 97 Kuwait ...................................2.6
28 New Zealand .........................3.9 98 Madagascar ...........................2.6
29 Brazil ......................................3.8 99 Lebanon.................................2.6
30 Indonesia ...............................3.7 100 Albania...................................2.6
488 31 Ireland....................................3.7 101 Cambodia ..............................2.6
32 Vietnam .................................3.6 102 Cameroon..............................2.6
33 India.......................................3.6 103 Botswana ..............................2.5
34 Estonia...................................3.6 104 Zambia...................................2.5
35 United Arab Emirates ............3.6 105 Greece...................................2.5
36 Tunisia....................................3.5 106 Ethiopia..................................2.5
37 Ukraine ..................................3.5 107 Jamaica .................................2.5
38 Russian Federation................3.5 108 Mozambique..........................2.5
39 Portugal .................................3.5 109 Egypt .....................................2.5
40 Azerbaijan ..............................3.5 110 Ghana ....................................2.5
41 Sri Lanka................................3.5 111 Mali........................................2.5
42 Spain......................................3.4 112 Georgia ..................................2.4
43 Cyprus ...................................3.4 113 Namibia .................................2.4
44 Costa Rica .............................3.4 114 Ecuador .................................2.4
45 Qatar......................................3.4 115 Bangladesh............................2.4
46 Hungary .................................3.4 116 Bosnia and Herzegovina........2.4
47 South Africa...........................3.4 117 El Salvador.............................2.4
48 Lithuania ................................3.3 118 Chad ......................................2.4
49 Hong Kong SAR ....................3.3 119 Rwanda .................................2.3
50 Poland....................................3.3 120 Paraguay................................2.3
51 Montenegro...........................3.3 121 Dominican Republic...............2.3
52 Kenya.....................................3.2 122 Zimbabwe..............................2.3
53 Puerto Rico............................3.2 123 Mauritania..............................2.3
54 Malta .....................................3.1 124 Timor-Leste............................2.3
55 Turkey ....................................3.1 125 Algeria ...................................2.3
56 Thailand .................................3.1 126 Nepal .....................................2.3
57 Latvia .....................................3.1 127 Venezuela ..............................2.3
58 Pakistan .................................3.1 128 Burkina Faso..........................2.2
59 Chile ......................................3.1 129 Uganda ..................................2.2
60 Benin .....................................3.1 130 Swaziland ..............................2.2
61 Oman.....................................3.0 131 Kyrgyz Republic .....................2.2
62 Argentina ...............................3.0 132 Côte d’Ivoire ..........................2.2
63 Gambia, The ..........................3.0 133 Lesotho .................................2.2
64 Uruguay .................................3.0 134 Syria.......................................2.1
65 Armenia .................................3.0 135 Cape Verde ............................2.0
66 Croatia ...................................3.0 136 Libya ......................................2.0
67 Bahrain ..................................2.9 137 Burundi ..................................2.0
68 Iran, Islamic Rep....................2.9 138 Trinidad and Tobago...............2.0
69 Slovak Republic .....................2.9 139 Angola ...................................1.7
70 Colombia ...............................2.9
SOURCE: World Economic Forum, Executive Opinion Survey
The Global Competitiveness Report 2010-2011 © 2010 World Economic Forum](https://image.slidesharecdn.com/globalcompetitivenessreportwef2010-11-100928142139-phpapp02/75/Global-competitiveness-report-wef-2010-11-501-2048.jpg)
![12.02 Quality of scientific research institutions
2.2: Data Tables | Section XII: Innovation
How would you assess the quality of scientific research institutions in your country? [1 = very poor; 7 = the best in their field internationally] |
2009–10 weighted average
RANK COUNTRY/ECONOMY SCORE 1 MEAN: 3.8 7 RANK COUNTRY/ECONOMY SCORE 1 MEAN: 3.8 7
1 Israel ......................................6.2 71 Macedonia, FYR ....................3.5
2 Switzerland ............................6.2 72 Mali........................................3.5
3 United Kingdom.....................6.0 73 Bulgaria..................................3.5
4 United States.........................6.0 74 Zambia...................................3.5
5 Sweden .................................5.9 75 Kuwait ...................................3.5
6 Germany ................................5.9 76 Malawi ...................................3.4
7 Belgium .................................5.7 77 Azerbaijan ..............................3.4
8 Canada...................................5.7 78 Gambia, The ..........................3.4
9 Netherlands ...........................5.6 79 Pakistan .................................3.4
10 Australia.................................5.6 80 Namibia .................................3.4
11 Singapore ..............................5.5 81 Colombia ...............................3.3
12 Denmark ................................5.5 82 Botswana ..............................3.3
13 Finland ...................................5.4 83 Romania ................................3.3
14 New Zealand .........................5.3 84 Mozambique..........................3.3
15 Japan .....................................5.3 85 Benin .....................................3.3
16 Ireland....................................5.3 86 Mauritius ...............................3.3
17 Taiwan, China ........................5.2 87 Tanzania .................................3.3
18 Hungary .................................5.2 88 Greece...................................3.3
19 France....................................5.2 89 Turkey ....................................3.3
20 Austria ...................................5.1 90 Slovak Republic .....................3.3
21 Czech Republic......................5.1 91 Brunei Darussalam ................3.2
22 Qatar......................................5.1 92 Côte d’Ivoire ..........................3.2
23 Norway ..................................5.0 93 Morocco ................................3.1
24 Iceland ...................................5.0 94 Guatemala .............................3.1
25 Korea, Rep.............................4.8 95 Rwanda .................................3.1
26 Estonia...................................4.7 96 Algeria ...................................3.1
27 Slovenia .................................4.7 97 Cameroon..............................3.1
28 Portugal .................................4.7 98 Jordan....................................3.1
29 South Africa...........................4.7 99 Uganda ..................................3.0
30 India.......................................4.7 100 Tajikistan ................................3.0
31 Costa Rica .............................4.7 101 Venezuela ..............................3.0 489
32 Malaysia ................................4.7 102 Ethiopia..................................3.0
33 Puerto Rico............................4.6 103 Armenia .................................3.0
34 Luxembourg ..........................4.6 104 Bosnia and Herzegovina........3.0
35 Hong Kong SAR ....................4.5 105 Moldova.................................3.0
36 Montenegro...........................4.4 106 Cambodia ..............................2.9
37 Saudi Arabia...........................4.4 107 Zimbabwe..............................2.9
38 Tunisia....................................4.3 108 Philippines .............................2.9
39 China .....................................4.3 109 Peru .......................................2.9
40 Lithuania ................................4.2 110 Egypt .....................................2.9
41 Cyprus ...................................4.2 111 Mongolia................................2.9
42 Brazil ......................................4.2 112 Kazakhstan ............................2.9
43 Spain......................................4.2 113 Nigeria ...................................2.8
44 Indonesia ...............................4.2 114 Honduras ...............................2.8
45 United Arab Emirates ............4.1 115 Madagascar ...........................2.8
46 Argentina ...............................4.1 116 Bangladesh............................2.8
47 Poland....................................4.1 117 Bahrain ..................................2.8
48 Senegal..................................4.1 118 Lesotho .................................2.7
49 Sri Lanka................................4.1 119 Georgia ..................................2.7
50 Barbados ...............................4.0 120 Guyana ..................................2.6
51 Croatia ...................................4.0 121 Cape Verde ............................2.6
52 Iran, Islamic Rep....................4.0 122 Dominican Republic...............2.6
53 Russian Federation................3.9 123 Bolivia ....................................2.6
54 Kenya.....................................3.9 124 Chad ......................................2.6
55 Chile ......................................3.9 125 Libya ......................................2.6
56 Serbia ....................................3.9 126 Nicaragua...............................2.5
57 Oman.....................................3.9 127 Syria.......................................2.5
58 Burkina Faso..........................3.8 128 Albania...................................2.5
59 Thailand .................................3.8 129 Burundi ..................................2.5
60 Mexico...................................3.8 130 Lebanon.................................2.4
61 Latvia .....................................3.8 131 Swaziland ..............................2.4
62 Uruguay .................................3.8 132 Ecuador .................................2.4
63 Vietnam .................................3.8 133 El Salvador.............................2.3
64 Ghana ....................................3.8 134 Kyrgyz Republic .....................2.2
65 Italy ........................................3.8 135 Timor-Leste............................2.1
66 Panama..................................3.7 136 Nepal .....................................2.1
67 Jamaica .................................3.7 137 Mauritania..............................2.0
68 Ukraine ..................................3.6 138 Paraguay................................1.8
69 Trinidad and Tobago...............3.6 139 Angola ...................................1.5
70 Malta .....................................3.5
SOURCE: World Economic Forum, Executive Opinion Survey
The Global Competitiveness Report 2010-2011 © 2010 World Economic Forum](https://image.slidesharecdn.com/globalcompetitivenessreportwef2010-11-100928142139-phpapp02/75/Global-competitiveness-report-wef-2010-11-502-2048.jpg)
![12.03 Company spending on R&D
2.2: Data Tables | Section XII: Innovation
To what extent do companies in your country spend on R&D? [1 = do not spend on R&D; 7 = spend heavily on R&D] | 2009–10 weighted average
RANK COUNTRY/ECONOMY SCORE 1 MEAN: 3.2 7 RANK COUNTRY/ECONOMY SCORE 1 MEAN: 3.2 7
1 Sweden .................................6.0 71 Tanzania .................................3.0
2 Switzerland ............................5.9 72 Argentina ...............................3.0
3 Japan .....................................5.9 73 Guyana ..................................3.0
4 Germany ................................5.7 74 Egypt .....................................3.0
5 Finland ...................................5.4 75 Hungary .................................3.0
6 United States.........................5.4 76 Malawi ...................................3.0
7 Denmark ................................5.2 77 Rwanda .................................3.0
8 Singapore ..............................5.0 78 Mali........................................2.9
9 Taiwan, China ........................5.0 79 Colombia ...............................2.9
10 Luxembourg ..........................4.8 80 Brunei Darussalam ................2.9
11 Israel ......................................4.7 81 Mozambique..........................2.8
12 Korea, Rep.............................4.7 82 Cambodia ..............................2.8
13 France....................................4.7 83 Jamaica .................................2.8
14 United Kingdom.....................4.6 84 Kazakhstan ............................2.8
15 Netherlands ...........................4.6 85 Philippines .............................2.8
16 Malaysia ................................4.5 86 Gambia, The ..........................2.8
17 Norway ..................................4.4 87 Zambia...................................2.8
18 Austria ...................................4.3 88 Azerbaijan ..............................2.8
19 Belgium .................................4.3 89 Angola ...................................2.7
20 Canada...................................4.2 90 Mexico...................................2.7
21 Ireland....................................4.2 91 Albania...................................2.7
22 China .....................................4.1 92 Namibia .................................2.7
23 Australia.................................4.1 93 Côte d’Ivoire ..........................2.7
24 Saudi Arabia...........................4.1 94 Latvia .....................................2.7
25 Czech Republic......................4.0 95 Uganda ..................................2.7
26 Indonesia ...............................4.0 96 Bulgaria..................................2.7
27 Iceland ...................................3.9 97 Morocco ................................2.7
28 United Arab Emirates ............3.9 98 Honduras ...............................2.7
29 Brazil ......................................3.8 99 Barbados ...............................2.7
30 Sri Lanka................................3.8 100 Bolivia ....................................2.7
490 31 Costa Rica .............................3.8 101 Bahrain ..................................2.7
32 Slovenia .................................3.7 102 Kuwait ...................................2.7
33 Vietnam .................................3.6 103 Romania ................................2.7
34 Kenya.....................................3.6 104 Bosnia and Herzegovina........2.6
35 Tunisia....................................3.6 105 Mauritania..............................2.6
36 Hong Kong SAR ....................3.6 106 Algeria ...................................2.6
37 India.......................................3.6 107 Iran, Islamic Rep....................2.6
38 New Zealand .........................3.6 108 Serbia ....................................2.6
39 Italy ........................................3.5 109 Burkina Faso..........................2.6
40 South Africa...........................3.5 110 Mongolia................................2.6
41 Qatar......................................3.5 111 Macedonia, FYR ....................2.6
42 Benin .....................................3.4 112 Nicaragua...............................2.6
43 Cyprus ...................................3.4 113 Peru .......................................2.6
44 Montenegro...........................3.4 114 Trinidad and Tobago...............2.6
45 Portugal .................................3.4 115 Madagascar ...........................2.6
46 Estonia...................................3.3 116 Jordan....................................2.5
47 Spain......................................3.2 117 Zimbabwe..............................2.5
48 Thailand .................................3.2 118 Tajikistan ................................2.5
49 Senegal..................................3.2 119 Lebanon.................................2.5
50 Russian Federation................3.2 120 Ecuador .................................2.5
51 Oman.....................................3.2 121 Venezuela ..............................2.5
52 Chile ......................................3.2 122 El Salvador.............................2.5
53 Nigeria ...................................3.2 123 Ethiopia..................................2.5
54 Puerto Rico............................3.2 124 Dominican Republic...............2.4
55 Malta .....................................3.1 125 Paraguay................................2.4
56 Uruguay .................................3.1 126 Greece...................................2.4
57 Lithuania ................................3.1 127 Armenia .................................2.4
58 Panama..................................3.1 128 Timor-Leste............................2.4
59 Lesotho .................................3.1 129 Bangladesh............................2.4
60 Croatia ...................................3.1 130 Nepal .....................................2.4
61 Poland....................................3.0 131 Swaziland ..............................2.4
62 Turkey ....................................3.0 132 Georgia ..................................2.3
63 Cameroon..............................3.0 133 Ghana ....................................2.3
64 Mauritius ...............................3.0 134 Burundi ..................................2.3
65 Guatemala .............................3.0 135 Moldova.................................2.2
66 Chad ......................................3.0 136 Cape Verde ............................2.1
67 Pakistan .................................3.0 137 Syria.......................................2.0
68 Slovak Republic .....................3.0 138 Kyrgyz Republic .....................2.0
69 Ukraine ..................................3.0 139 Libya ......................................2.0
70 Botswana ..............................3.0
SOURCE: World Economic Forum, Executive Opinion Survey
The Global Competitiveness Report 2010-2011 © 2010 World Economic Forum](https://image.slidesharecdn.com/globalcompetitivenessreportwef2010-11-100928142139-phpapp02/75/Global-competitiveness-report-wef-2010-11-503-2048.jpg)
![12.04 University-industry collaboration in R&D
2.2: Data Tables | Section XII: Innovation
To what extent do business and universities collaborate on research and development (R&D) in your country? [1 = do not collaborate at all;
7 = collaborate extensively] | 2009–10 weighted average
RANK COUNTRY/ECONOMY SCORE 1 MEAN: 3.7 7 RANK COUNTRY/ECONOMY SCORE 1 MEAN: 3.7 7
1 United States.........................5.8 71 Serbia ....................................3.5
2 Switzerland ............................5.7 72 Ukraine ..................................3.5
3 Finland ...................................5.6 73 Latvia .....................................3.5
4 United Kingdom.....................5.6 74 Macedonia, FYR ....................3.5
5 Sweden .................................5.5 75 Croatia ...................................3.4
6 Singapore ..............................5.4 76 Venezuela ..............................3.4
7 Canada...................................5.4 77 Tanzania .................................3.4
8 Denmark ................................5.3 78 Uganda ..................................3.4
9 Germany ................................5.2 79 Malawi ...................................3.4
10 Belgium .................................5.2 80 Namibia .................................3.4
11 Netherlands ...........................5.2 81 Pakistan .................................3.4
12 Taiwan, China ........................5.2 82 Turkey ....................................3.4
13 Australia.................................5.1 83 Burkina Faso..........................3.3
14 Israel ......................................5.1 84 Panama..................................3.3
15 Luxembourg ..........................5.1 85 Philippines .............................3.3
16 Iceland ...................................5.0 86 Mongolia................................3.3
17 Ireland....................................5.0 87 Slovak Republic .....................3.3
18 Austria ...................................4.9 88 Bahrain ..................................3.3
19 Japan .....................................4.9 89 Cape Verde ............................3.3
20 Norway ..................................4.9 90 Mali........................................3.2
21 New Zealand .........................4.8 91 Honduras ...............................3.2
22 Malaysia ................................4.7 92 Azerbaijan ..............................3.2
23 Korea, Rep.............................4.7 93 Dominican Republic...............3.2
24 South Africa...........................4.6 94 Mauritius ...............................3.2
25 China .....................................4.6 95 Peru .......................................3.2
26 Hong Kong SAR ....................4.6 96 Kuwait ...................................3.2
27 Qatar......................................4.5 97 Iran, Islamic Rep....................3.2
28 Costa Rica .............................4.5 98 Ghana ....................................3.1
29 Czech Republic......................4.5 99 Jordan....................................3.1
30 Portugal .................................4.5 100 Madagascar ...........................3.1
31 Puerto Rico............................4.4 101 Ethiopia..................................3.1 491
32 Hungary .................................4.3 102 Nigeria ...................................3.1
33 Saudi Arabia...........................4.3 103 Romania ................................3.1
34 Brazil ......................................4.3 104 Morocco ................................3.1
35 Lithuania ................................4.2 105 Zimbabwe..............................3.1
36 Estonia...................................4.2 106 Benin .....................................3.1
37 Slovenia .................................4.2 107 Lesotho .................................3.1
38 Indonesia ...............................4.2 108 Tajikistan ................................3.1
39 Chile ......................................4.2 109 Lebanon.................................3.1
40 Barbados ...............................4.1 110 Bulgaria..................................3.0
41 Tunisia....................................4.1 111 Kazakhstan ............................3.0
42 Thailand .................................4.1 112 Greece...................................3.0
43 United Arab Emirates ............4.1 113 Cameroon..............................3.0
44 France....................................4.0 114 El Salvador.............................3.0
45 Cyprus ...................................4.0 115 Cambodia ..............................3.0
46 Spain......................................4.0 116 Chad ......................................3.0
47 Colombia ...............................4.0 117 Bosnia and Herzegovina........3.0
48 Mozambique..........................4.0 118 Nicaragua...............................2.9
49 Sri Lanka................................3.9 119 Algeria ...................................2.9
50 Oman.....................................3.9 120 Egypt .....................................2.8
51 Senegal..................................3.9 121 Guyana ..................................2.8
52 Montenegro...........................3.8 122 Ecuador .................................2.8
53 Argentina ...............................3.8 123 Swaziland ..............................2.8
54 Guatemala .............................3.8 124 Armenia .................................2.8
55 Kenya.....................................3.8 125 Moldova.................................2.8
56 Malta .....................................3.8 126 Bolivia ....................................2.8
57 Uruguay .................................3.8 127 Burundi ..................................2.8
58 India.......................................3.7 128 Bangladesh............................2.7
59 Mexico...................................3.7 129 Paraguay................................2.7
60 Brunei Darussalam ................3.7 130 Côte d’Ivoire ..........................2.6
61 Russian Federation................3.7 131 Libya ......................................2.6
62 Vietnam .................................3.7 132 Timor-Leste............................2.5
63 Gambia, The ..........................3.6 133 Nepal .....................................2.5
64 Poland....................................3.6 134 Georgia ..................................2.5
65 Rwanda .................................3.6 135 Mauritania..............................2.4
66 Jamaica .................................3.6 136 Angola ...................................2.4
67 Zambia...................................3.5 137 Syria.......................................2.3
68 Trinidad and Tobago...............3.5 138 Albania...................................2.2
69 Botswana ..............................3.5 139 Kyrgyz Republic .....................2.2
70 Italy ........................................3.5
SOURCE: World Economic Forum, Executive Opinion Survey
The Global Competitiveness Report 2010-2011 © 2010 World Economic Forum](https://image.slidesharecdn.com/globalcompetitivenessreportwef2010-11-100928142139-phpapp02/75/Global-competitiveness-report-wef-2010-11-504-2048.jpg)
![12.05 Government procurement of advanced technology products
2.2: Data Tables | Section XII: Innovation
Do government procurement decisions foster technological innovation in your country? [1 = no, not at all; 7 = yes, extremely effectively] |
2009–10 weighted average
RANK COUNTRY/ECONOMY SCORE 1 MEAN: 3.7 7 RANK COUNTRY/ECONOMY SCORE 1 MEAN: 3.7 7
1 Qatar......................................5.5 71 Morocco ................................3.6
2 Singapore ..............................5.4 72 Zambia...................................3.6
3 United Arab Emirates ............5.0 73 New Zealand .........................3.6
4 Luxembourg ..........................4.9 74 Tanzania .................................3.6
5 United States.........................4.7 75 Ireland....................................3.6
6 Finland ...................................4.7 76 India.......................................3.5
7 Taiwan, China ........................4.7 77 Dominican Republic...............3.5
8 Malaysia ................................4.7 78 Puerto Rico............................3.5
9 Denmark ................................4.6 79 Madagascar ...........................3.5
10 Saudi Arabia...........................4.6 80 Timor-Leste............................3.5
11 Oman.....................................4.5 81 Kenya.....................................3.5
12 China .....................................4.5 82 Russian Federation................3.5
13 Sweden .................................4.5 83 Kazakhstan ............................3.4
14 Tunisia....................................4.5 84 Pakistan .................................3.4
15 Rwanda .................................4.4 85 Namibia .................................3.4
16 Switzerland ............................4.4 86 Egypt .....................................3.4
17 Portugal .................................4.4 87 Bulgaria..................................3.4
18 Vietnam .................................4.4 88 Spain......................................3.4
19 Malta .....................................4.4 89 Honduras ...............................3.4
20 Israel ......................................4.4 90 Kuwait ...................................3.4
21 Benin .....................................4.4 91 Uganda ..................................3.4
22 Bahrain ..................................4.3 92 Jamaica .................................3.3
23 Gambia, The ..........................4.3 93 Peru .......................................3.3
24 Netherlands ...........................4.3 94 Mongolia................................3.3
25 Iceland ...................................4.3 95 Guyana ..................................3.3
26 Canada...................................4.3 96 Mexico...................................3.3
27 Hong Kong SAR ....................4.3 97 Trinidad and Tobago...............3.3
28 Montenegro...........................4.2 98 Serbia ....................................3.2
29 Cyprus ...................................4.2 99 Lesotho .................................3.2
30 Indonesia ...............................4.2 100 Côte d’Ivoire ..........................3.2
492 31 Czech Republic......................4.2 101 Ghana ....................................3.2
32 Germany ................................4.2 102 Georgia ..................................3.2
33 Brunei Darussalam ................4.2 103 South Africa...........................3.2
34 Norway ..................................4.2 104 Lithuania ................................3.2
35 Angola ...................................4.2 105 Romania ................................3.2
36 Azerbaijan ..............................4.1 106 Hungary .................................3.2
37 Australia.................................4.1 107 Nigeria ...................................3.2
38 Austria ...................................4.1 108 Greece...................................3.2
39 Korea, Rep.............................4.1 109 Cameroon..............................3.1
40 Sri Lanka................................4.1 110 Macedonia, FYR ....................3.1
41 Japan .....................................4.1 111 Latvia .....................................3.1
42 Mozambique..........................4.1 112 Ukraine ..................................3.1
43 Estonia...................................4.1 113 El Salvador.............................3.0
44 Chile ......................................4.1 114 Chad ......................................3.0
45 Senegal..................................4.0 115 Bangladesh............................3.0
46 Cape Verde ............................4.0 116 Bosnia and Herzegovina........3.0
47 Belgium .................................4.0 117 Italy........................................3.0
48 France....................................4.0 118 Ecuador .................................3.0
49 Barbados ...............................3.9 119 Syria.......................................2.9
50 Brazil ......................................3.9 120 Guatemala .............................2.9
51 Colombia ...............................3.9 121 Croatia ...................................2.9
52 Botswana ..............................3.9 122 Bolivia ....................................2.9
53 United Kingdom.....................3.8 123 Algeria ...................................2.9
54 Ethiopia..................................3.8 124 Zimbabwe..............................2.8
55 Costa Rica .............................3.8 125 Nicaragua...............................2.8
56 Panama..................................3.8 126 Libya ......................................2.8
57 Jordan....................................3.8 127 Slovak Republic .....................2.7
58 Mali........................................3.8 128 Burundi ..................................2.7
59 Thailand .................................3.7 129 Philippines .............................2.7
60 Iran, Islamic Rep....................3.7 130 Argentina ...............................2.7
61 Poland....................................3.7 131 Swaziland ..............................2.7
62 Turkey ....................................3.7 132 Paraguay................................2.6
63 Albania...................................3.7 133 Nepal .....................................2.6
64 Slovenia .................................3.7 134 Armenia .................................2.6
65 Cambodia ..............................3.7 135 Moldova.................................2.6
66 Tajikistan ................................3.7 136 Mauritania..............................2.6
67 Mauritius ...............................3.7 137 Venezuela ..............................2.4
68 Malawi ...................................3.7 138 Kyrgyz Republic .....................2.4
69 Uruguay .................................3.7 139 Lebanon.................................2.4
70 Burkina Faso..........................3.6
SOURCE: World Economic Forum, Executive Opinion Survey
The Global Competitiveness Report 2010-2011 © 2010 World Economic Forum](https://image.slidesharecdn.com/globalcompetitivenessreportwef2010-11-100928142139-phpapp02/75/Global-competitiveness-report-wef-2010-11-505-2048.jpg)
![12.06 Availability of scientists and engineers
2.2: Data Tables | Section XII: Innovation
To what extent are scientists and engineers available in your country? [1 = not at all; 7 = widely available] | 2009–10 weighted average
RANK COUNTRY/ECONOMY SCORE 1 MEAN: 4.1 7 RANK COUNTRY/ECONOMY SCORE 1 MEAN: 4.1 7
1 Finland ...................................6.0 71 Slovak Republic .....................4.0
2 Japan .....................................5.8 72 Mongolia................................4.0
3 Sweden .................................5.8 73 Slovenia .................................4.0
4 United States.........................5.7 74 Malta .....................................4.0
5 Iceland ...................................5.7 75 Bangladesh............................4.0
6 Canada...................................5.6 76 Argentina ...............................4.0
7 Tunisia....................................5.6 77 Bulgaria..................................4.0
8 Taiwan, China ........................5.5 78 Azerbaijan ..............................4.0
9 Qatar......................................5.3 79 Nigeria ...................................3.9
10 Singapore ..............................5.3 80 Pakistan .................................3.9
11 Switzerland ............................5.3 81 Luxembourg ..........................3.9
12 France....................................5.3 82 Guatemala .............................3.9
13 Belgium .................................5.2 83 Malawi ...................................3.9
14 Puerto Rico............................5.2 84 Uruguay .................................3.9
15 India.......................................5.2 85 Croatia ...................................3.8
16 Ireland....................................5.1 86 Colombia ...............................3.8
17 Israel ......................................5.1 87 Oman.....................................3.8
18 Norway ..................................5.1 88 Zambia...................................3.8
19 Denmark ................................5.1 89 Mexico...................................3.8
20 United Arab Emirates ............5.0 90 Ghana ....................................3.7
21 Greece...................................5.0 91 Kazakhstan ............................3.7
22 Netherlands ...........................5.0 92 Serbia ....................................3.7
23 Korea, Rep.............................4.9 93 Armenia .................................3.7
24 Chile ......................................4.9 94 Burkina Faso..........................3.7
25 Egypt .....................................4.9 95 Macedonia, FYR ....................3.6
26 Jordan....................................4.9 96 Philippines .............................3.6
27 Germany ................................4.8 97 Chad ......................................3.6
28 Costa Rica .............................4.8 98 Latvia .....................................3.6
29 United Kingdom.....................4.8 99 Panama..................................3.6
30 Austria ...................................4.7 100 Mali........................................3.6
31 Indonesia ...............................4.7 101 Peru .......................................3.6 493
32 Cyprus ...................................4.7 102 Uganda ..................................3.6
33 Malaysia ................................4.7 103 Mauritania..............................3.5
34 Saudi Arabia...........................4.6 104 Libya ......................................3.5
35 China .....................................4.6 105 Botswana ..............................3.5
36 Lebanon.................................4.6 106 Burundi ..................................3.5
37 Iran, Islamic Rep....................4.6 107 Cape Verde ............................3.5
38 Portugal .................................4.6 108 Rwanda .................................3.4
39 Cameroon..............................4.5 109 Venezuela ..............................3.4
40 Thailand .................................4.5 110 Brunei Darussalam ................3.4
41 Bahrain ..................................4.5 111 Tajikistan ................................3.4
42 Côte d’Ivoire ..........................4.5 112 Mauritius ...............................3.4
43 Algeria ...................................4.5 113 Tanzania .................................3.4
44 Turkey ....................................4.5 114 Honduras ...............................3.4
45 Australia.................................4.5 115 Bosnia and Herzegovina........3.3
46 Morocco ................................4.5 116 South Africa...........................3.3
47 Spain......................................4.4 117 Dominican Republic...............3.2
48 Hungary .................................4.4 118 Moldova.................................3.2
49 Sri Lanka................................4.4 119 Mozambique..........................3.2
50 Czech Republic......................4.4 120 Bolivia ....................................3.2
51 Lithuania ................................4.4 121 Cambodia ..............................3.2
52 Madagascar ...........................4.4 122 Georgia ..................................3.2
53 Ukraine ..................................4.3 123 Jamaica .................................3.1
54 Italy ........................................4.3 124 Albania...................................3.1
55 Romania ................................4.3 125 El Salvador.............................3.1
56 Russian Federation................4.3 126 Nicaragua...............................3.1
57 Kuwait ...................................4.3 127 Lesotho .................................3.1
58 Estonia...................................4.2 128 Gambia, The ..........................3.0
59 Benin .....................................4.2 129 Ethiopia..................................3.0
60 Poland....................................4.2 130 Nepal .....................................3.0
61 Senegal..................................4.2 131 Zimbabwe..............................2.9
62 Syria.......................................4.2 132 Ecuador .................................2.9
63 Montenegro...........................4.2 133 Guyana ..................................2.9
64 Hong Kong SAR ....................4.1 134 Angola ...................................2.9
65 Trinidad and Tobago...............4.1 135 Namibia .................................2.9
66 Vietnam .................................4.1 136 Kyrgyz Republic .....................2.8
67 New Zealand .........................4.1 137 Paraguay................................2.6
68 Brazil ......................................4.0 138 Timor-Leste............................2.4
69 Barbados ...............................4.0 139 Swaziland ..............................2.4
70 Kenya.....................................4.0
SOURCE: World Economic Forum, Executive Opinion Survey
The Global Competitiveness Report 2010-2011 © 2010 World Economic Forum](https://image.slidesharecdn.com/globalcompetitivenessreportwef2010-11-100928142139-phpapp02/75/Global-competitiveness-report-wef-2010-11-506-2048.jpg)
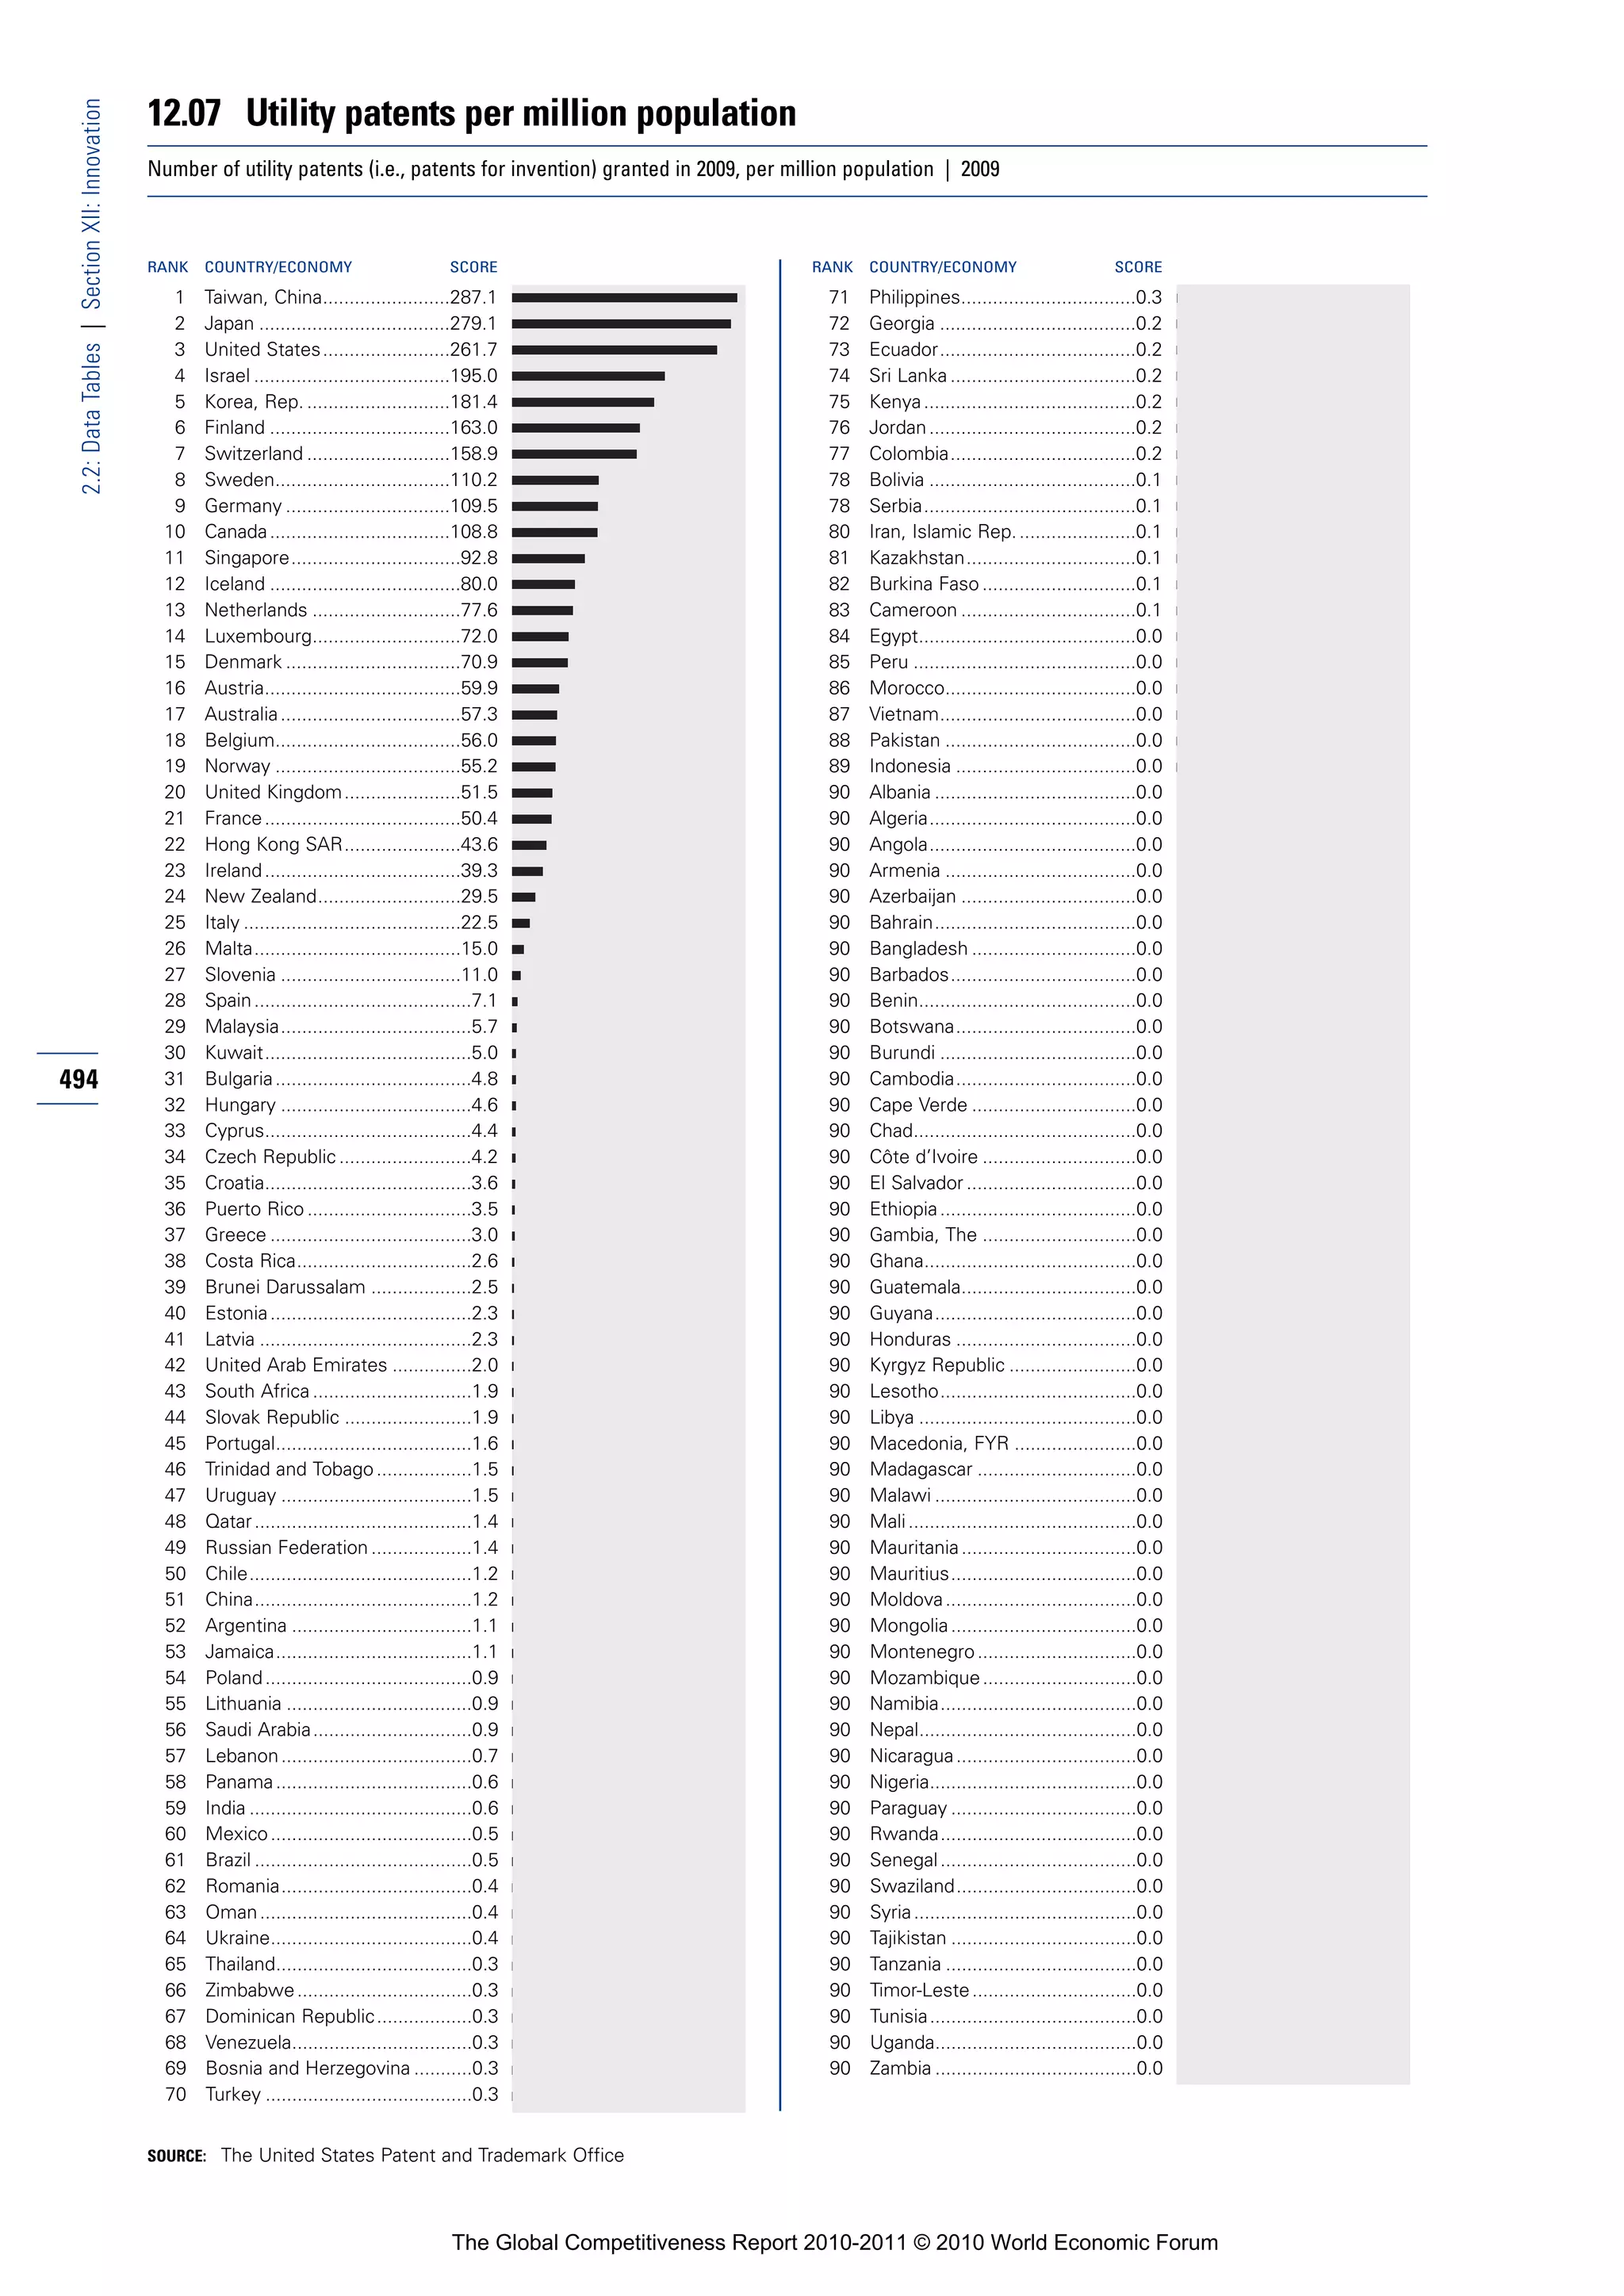


![Wef gcr report_2011-12[1]](https://cdn.slidesharecdn.com/ss_thumbnails/wefgcrreport2011-121-120107061726-phpapp02-thumbnail.jpg?width=640&height=640&fit=bounds)


