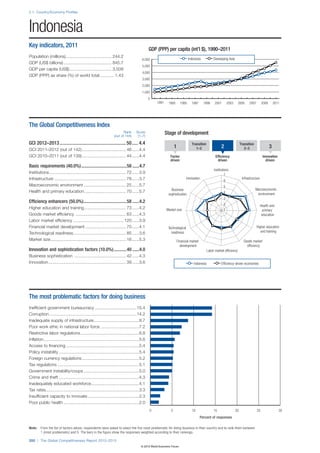
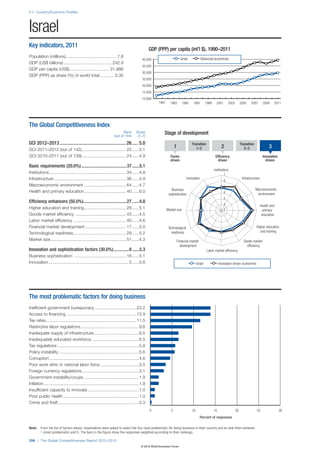
Downloaded 23 times


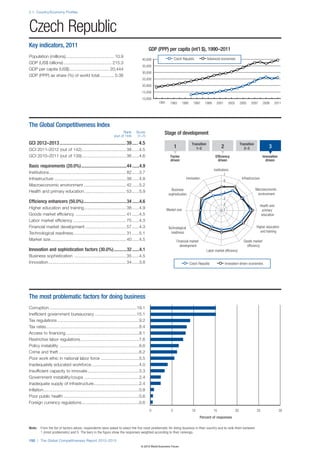
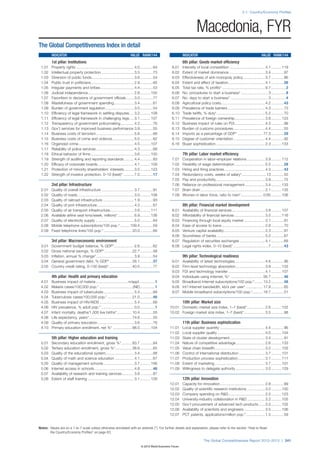
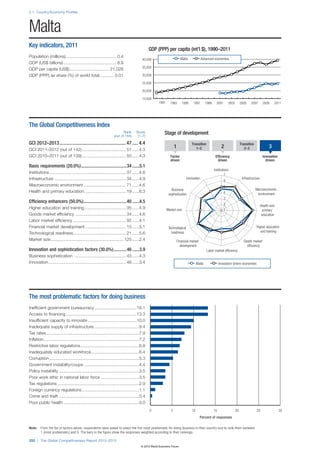
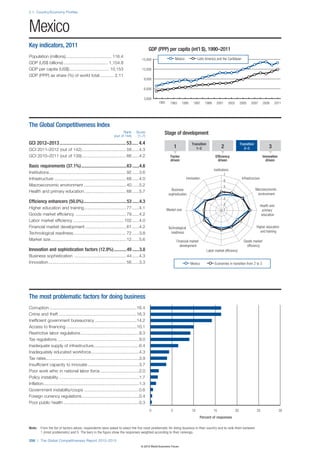
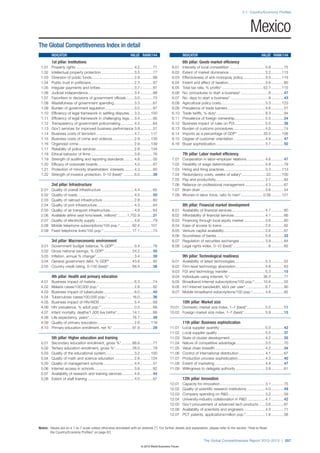
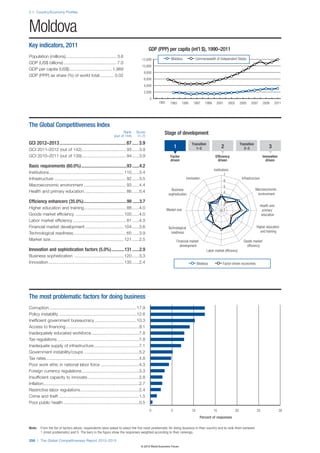
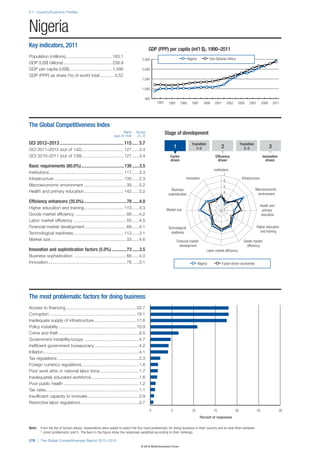
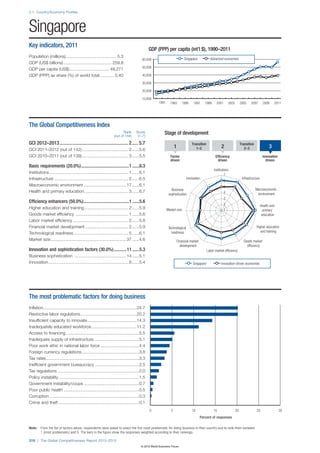
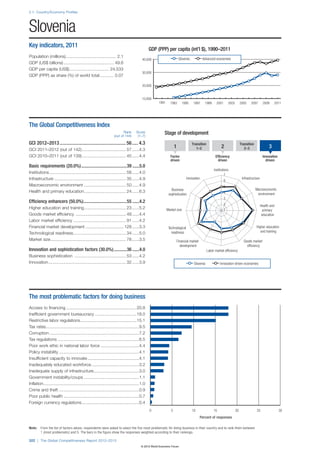
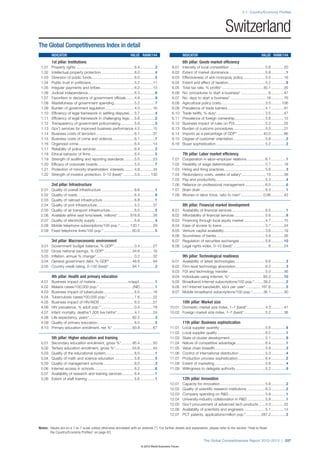
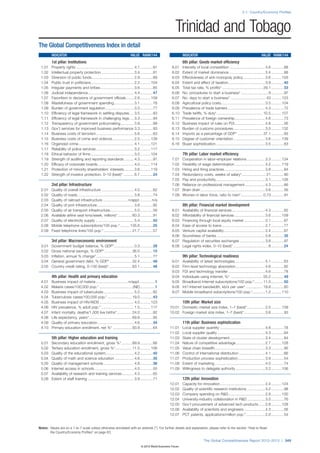
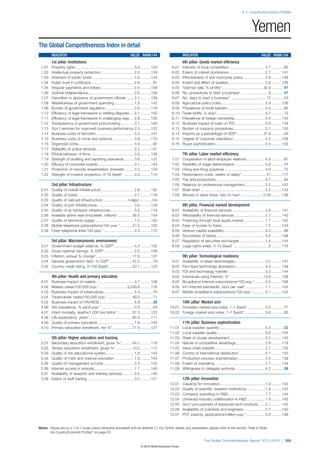
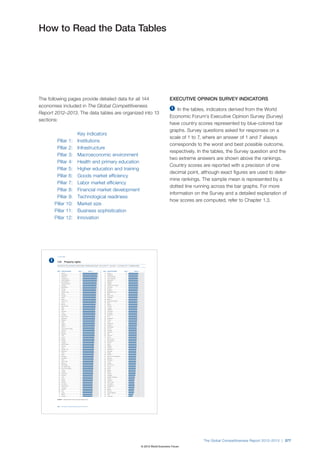
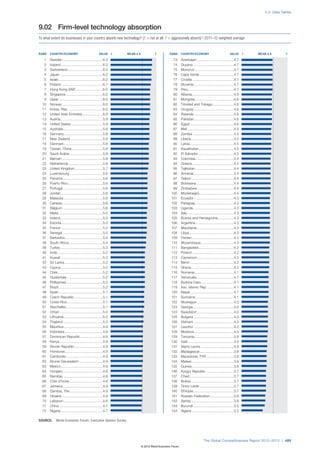
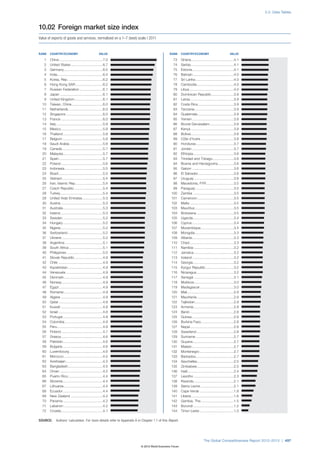
![1.1: The Global Competitiveness Index 2012–2013
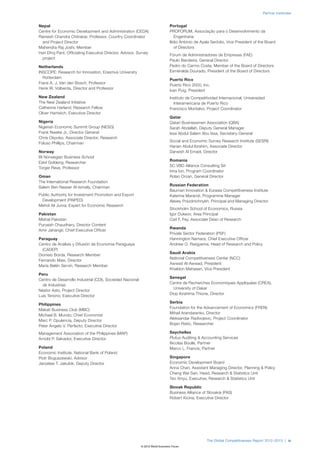
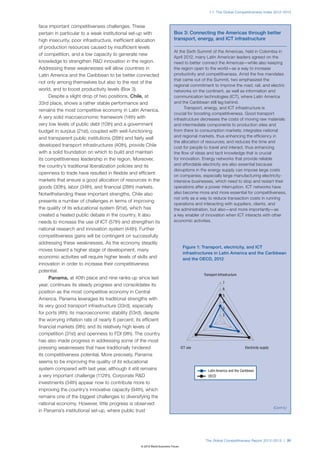
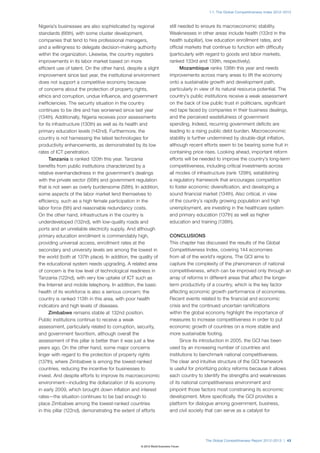
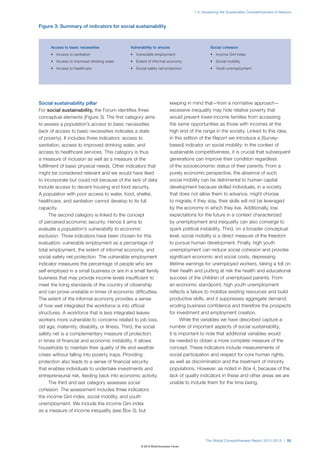
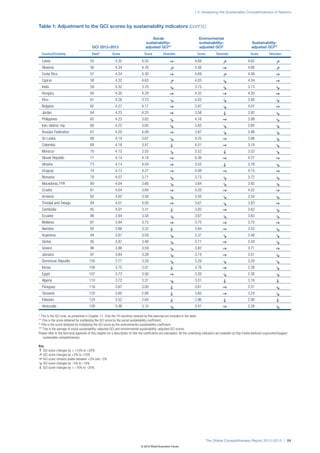
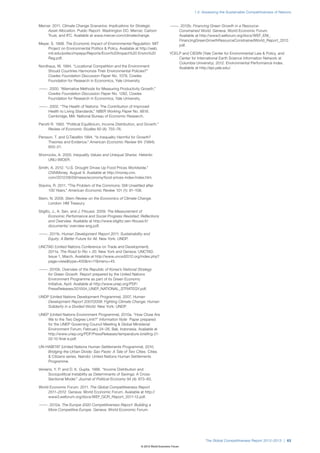
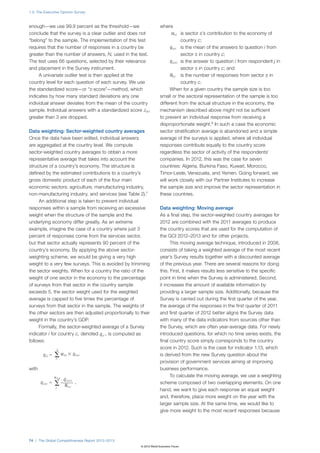
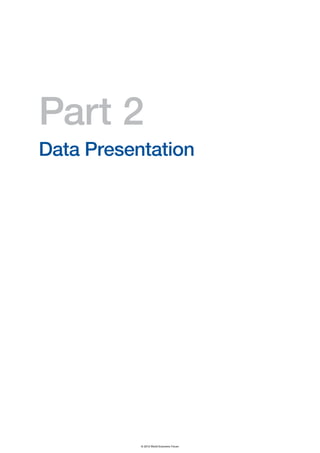
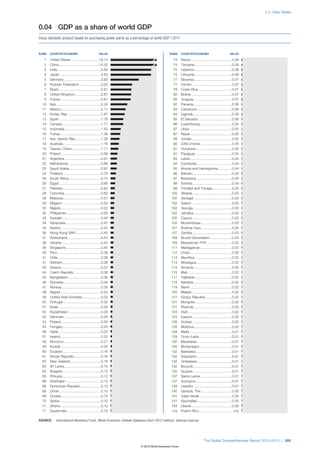
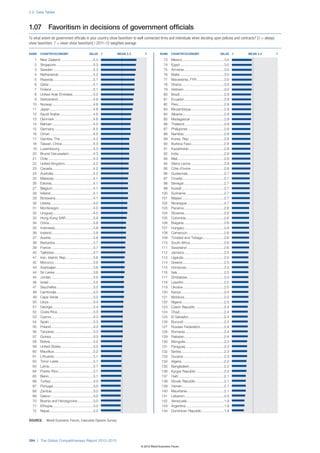
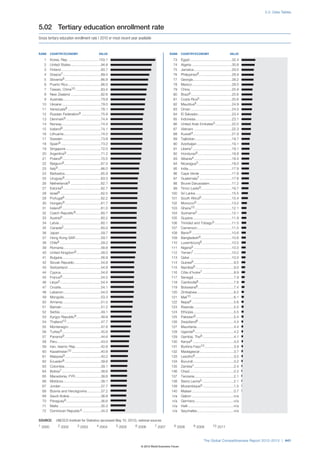
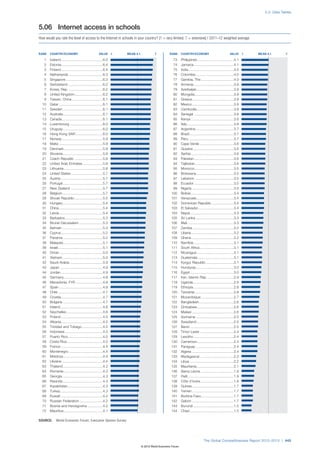
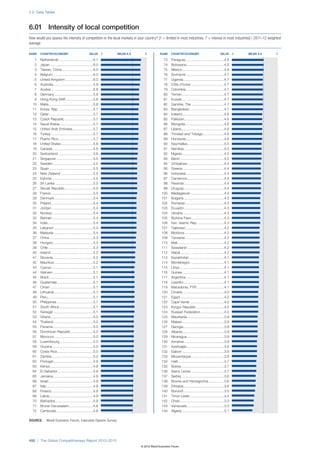
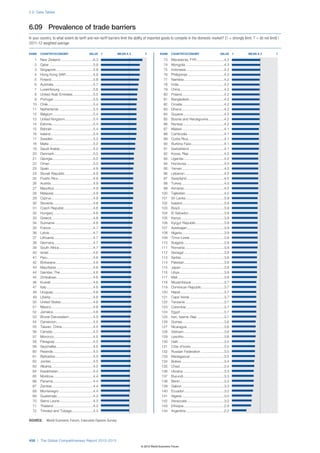
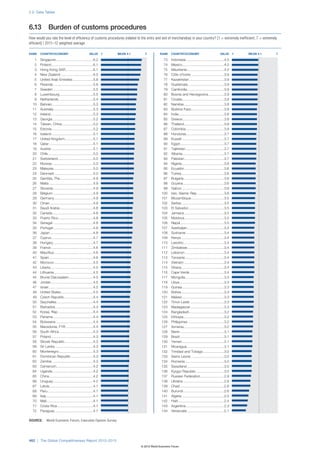
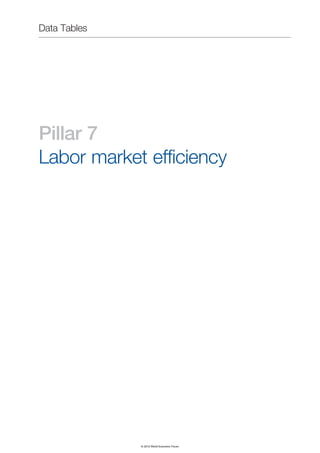
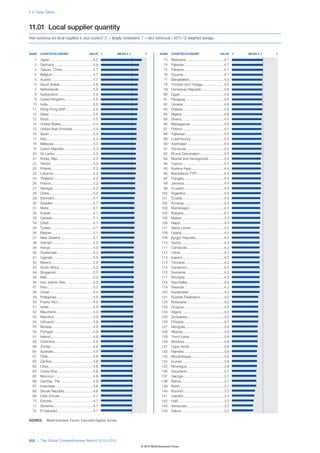
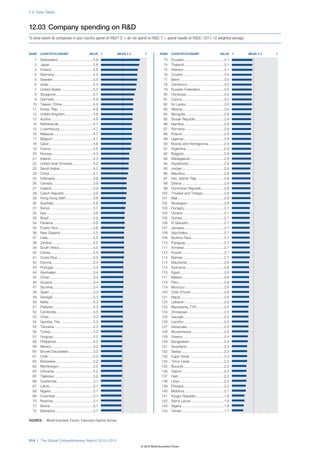
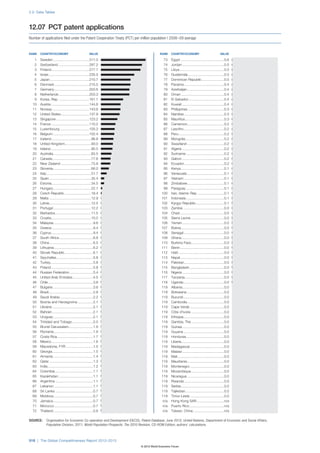
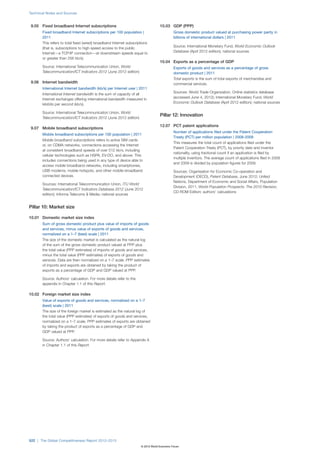
Box 1: Competitiveness from above: The GCI heat map
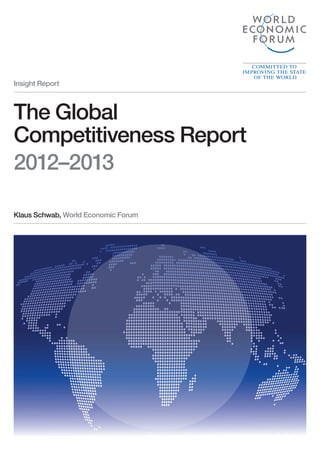
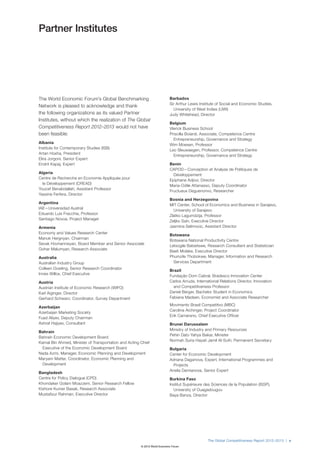
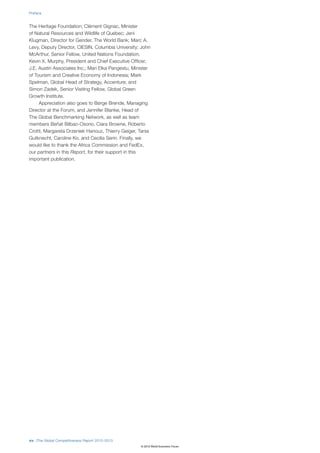
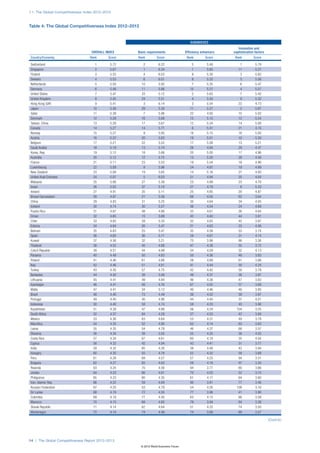
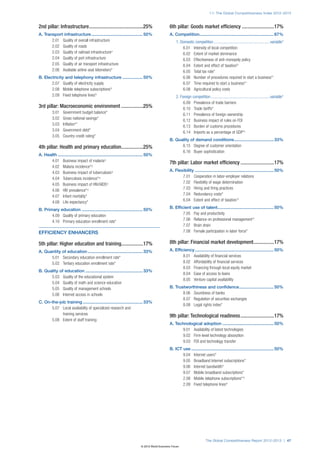
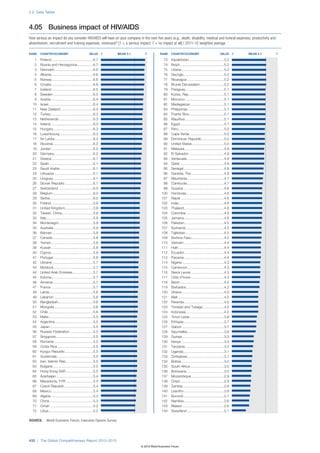
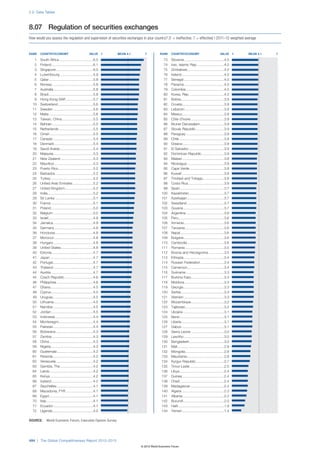
Figure 1: The GCI heat map
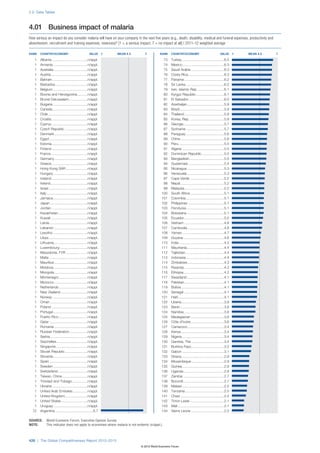
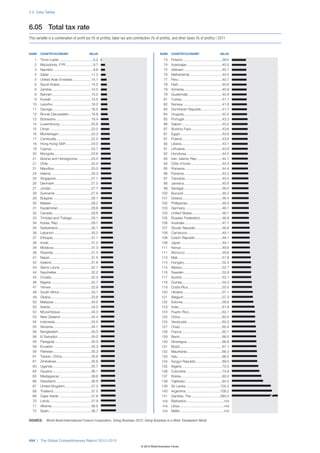
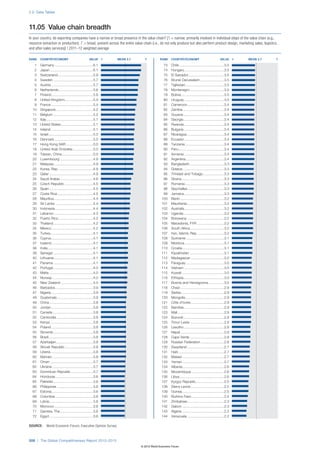
GCI score*
n [5.39,5.72†]
n [5.00,5.39[
n [4.60,5.00[
n [4.20,4.60[
n [3.80,4.20[
n [2.78††,3.80[
n Not covered
* The interval [x,y[ is inclusive of x but exclusive of y. † Highest value; †† lowest value.
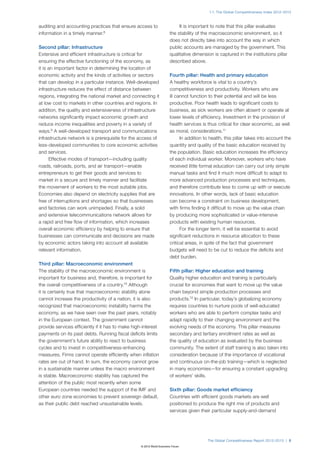
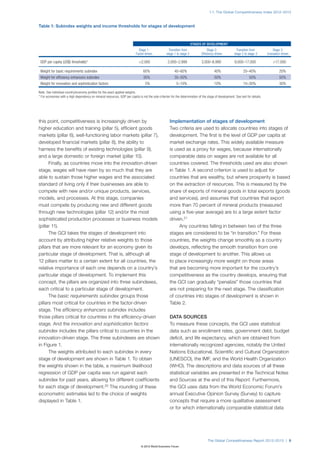
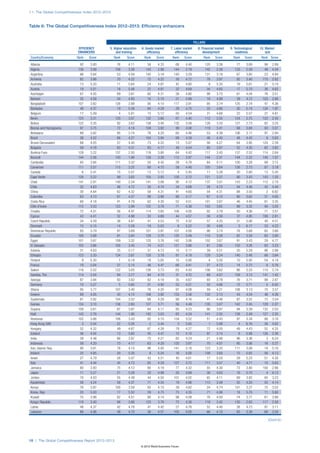
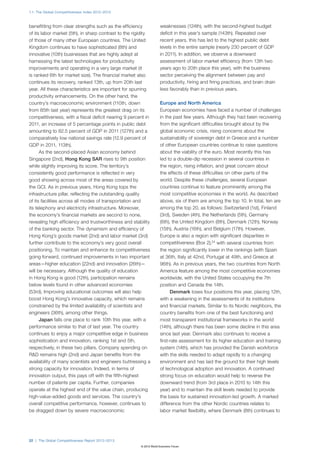
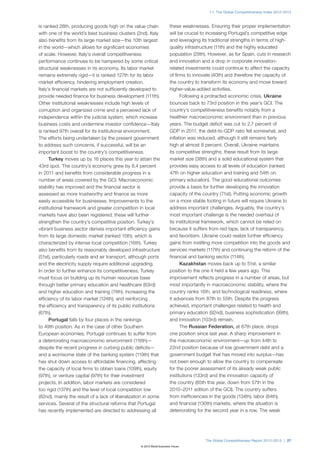
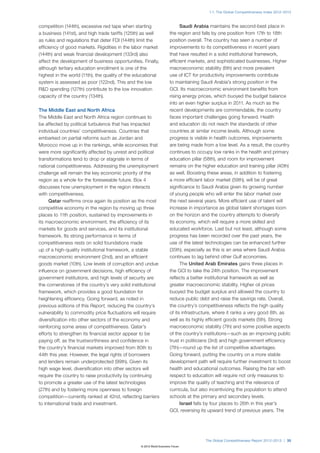
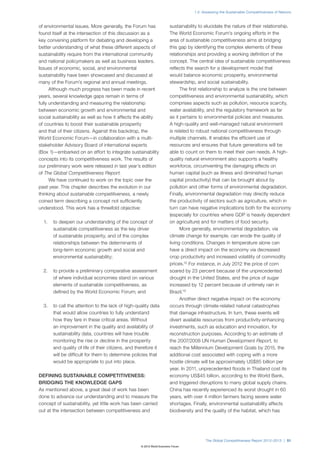
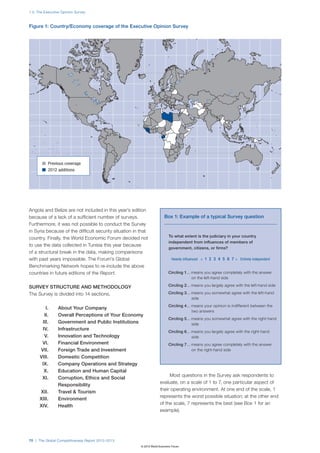
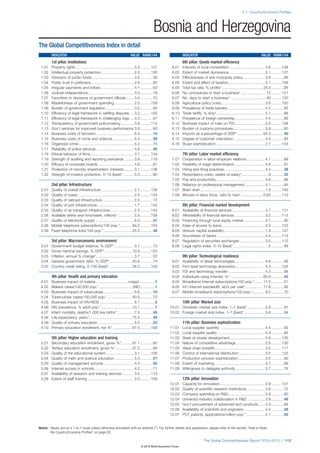
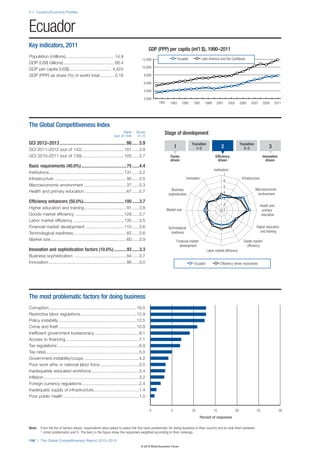
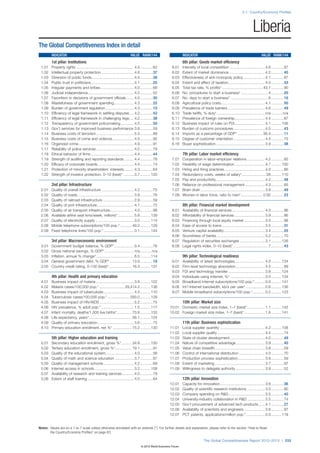
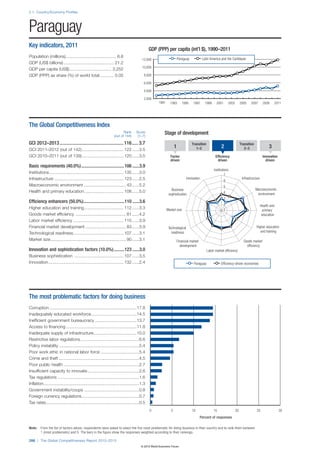
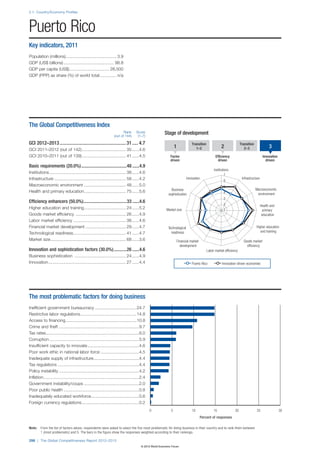
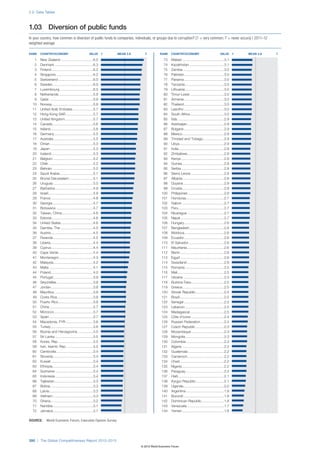
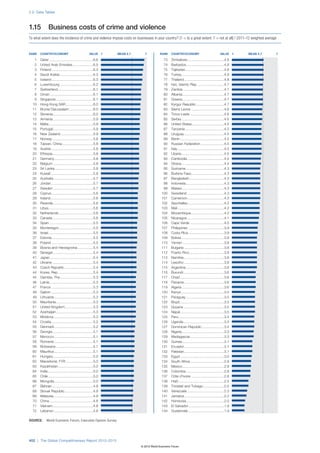
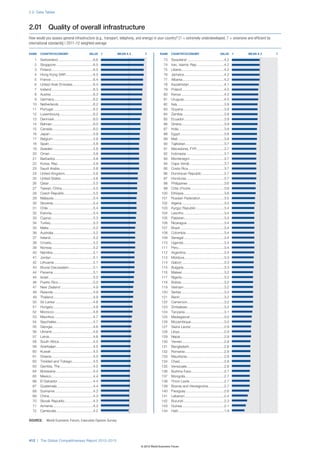
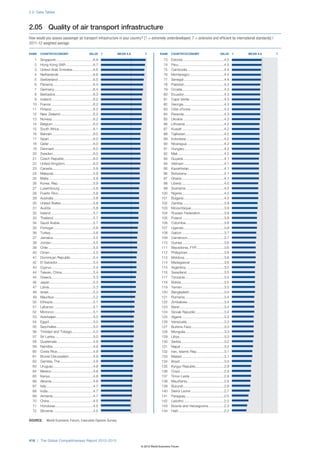
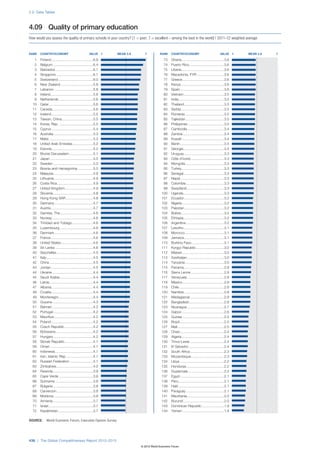
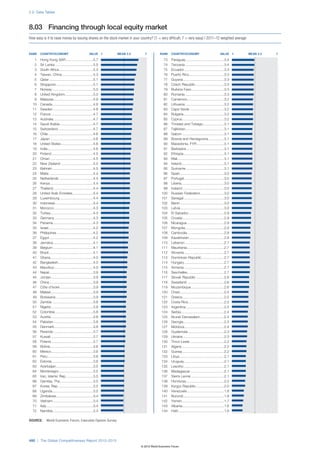
Figure 1 identifies the competitiveness “hotspots” and the “competitiveness divide” within Europe. Indeed, the lack of
regions or countries with weak performance according to the competitiveness of several of its members is among the root
Global Competitiveness Index (GCI). The 10 best-performing causes of the current difficulties in the euro zone (see Box
countries are shaded dark red. The remaining countries 2). The map also shows that within the European Union the
are colored in intermediate tones moving from orange, the traditional distinction made between the 15 original members
second-best performing group, through yellow, light blue, and the 12 countries that joined after 2004 does not hold
medium blue, and dark blue; this last color identifies the least- from a competitiveness point of view.
competitive nations according to the GCI. The map draws a mixed picture of Asia, too. Scattered
The map reveals that the hotspots remain concentrated across the region, the Asian Tigers and Japan can be
in Europe, North America, and a handful of advanced considered competitiveness hotspots. Within this group of
economies in Asia and the Pacific. Despite decades of brisk five advanced economies, Singapore, Hong Kong SAR, and
economic growth in some developing regions (such as Latin Japan enter the top 10, and Taiwan (China), and the Republic
America and Africa), the map reveals that the profound of Korea rank only a few notches behind. The developing
competitiveness gap of these regions with more advanced nations of Southeast Asia are not yet competitiveness
economies persists. This competitiveness deficit in vast champions, but their group performance is quite remarkable.
swaths of the developing world raises questions about the Led by Malaysia, all these economies achieve a GCI score
sustainability of growth patterns. above 4.0, the theoretical average of the GCI, and none of
Sub-Saharan Africa, for example, continues to face the them falls into the lowest, dark-blue category. This contrasts
biggest competitiveness challenges of all regions (see Box starkly with the situation in South Asia, where best-
5). As shown on the map, a vast majority of the continent’s performing India ranks a middling 59th and several countries
countries covered in this Report fall into the group of least- appear in dark blue, including Pakistan and Bangladesh.
competitive economies (dark blue). Out of the region’s In the Middle East and North Africa, Israel and the six
32 countries included in the GCI, only Botswana, Gabon, members of the Gulf Cooperation Council perform strongly.
Namibia, the Seychelles (medium blue), Mauritius, Rwanda, But elsewhere in the region, the lack of competitiveness of the
and South Africa (light blue) are in the next higher categories. Levantine and North African countries is worrisome. Finally,
With six of the ten best-performing countries, Northern the map also reveals that the BRICS do not form a uniform
and Western Europe is a competitiveness hotspot. The group in terms of competitiveness, as seen on the map where
assessment is considerably bleaker when looking at China is the only member appearing in a relatively strong
Southern and Eastern Europe. On the map, the patchwork of yellow.
colors—ranging from dark red to medium blue—reveals the
12 | The Global Competitiveness Report 2012–2013
© 2012 World Economic Forum](https://image.slidesharecdn.com/wefglobalcompetitivenessreport2012-13-121022150116-phpapp02/85/The-Global-Competitiveness-Report-2012-2013-28-320.jpg)
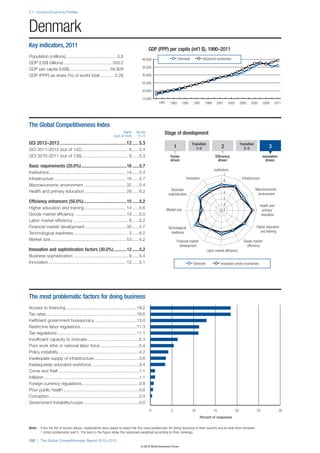
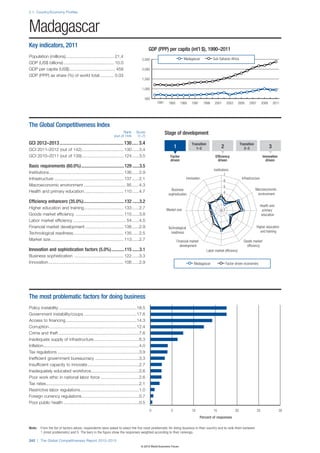
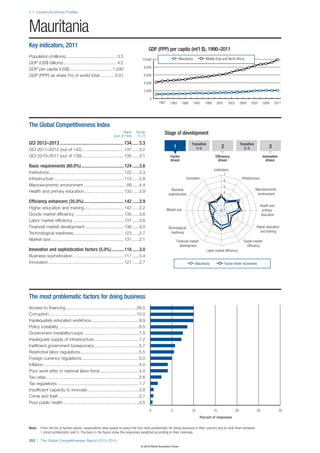
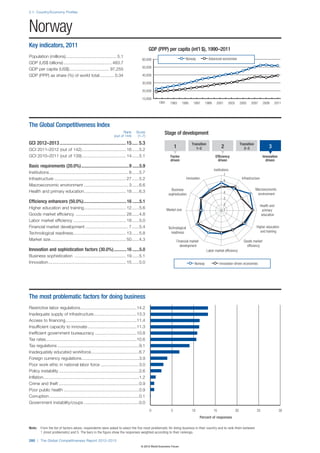
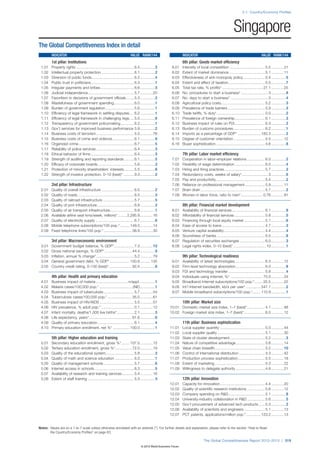
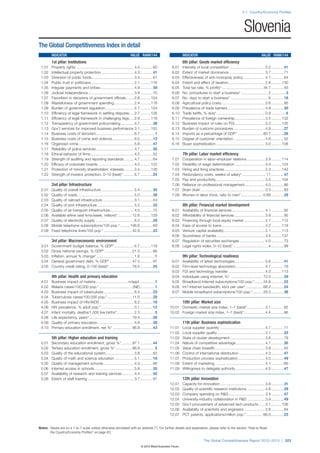
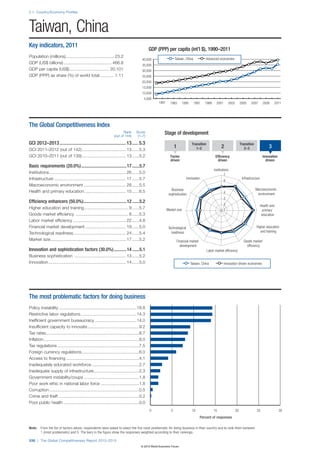
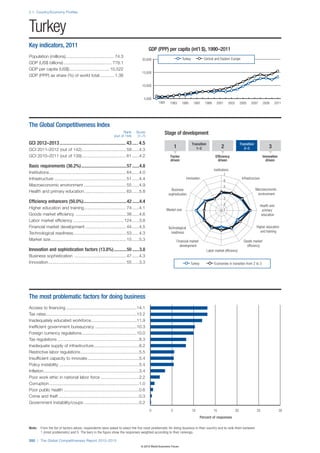
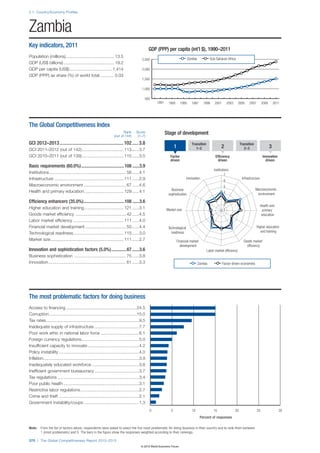
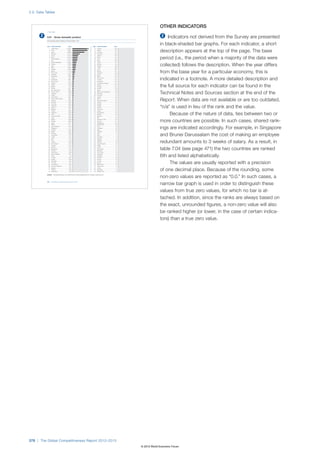
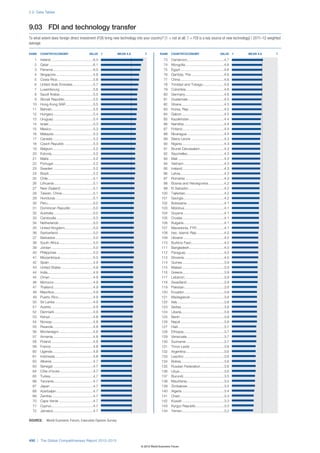
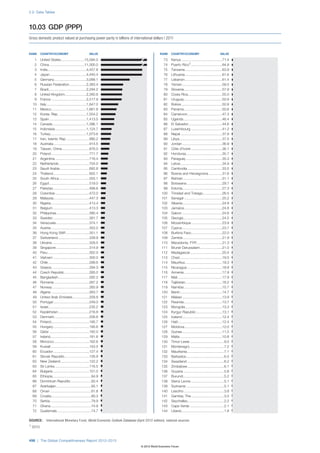
![1.1: The Global Competitiveness Index 2012–2013
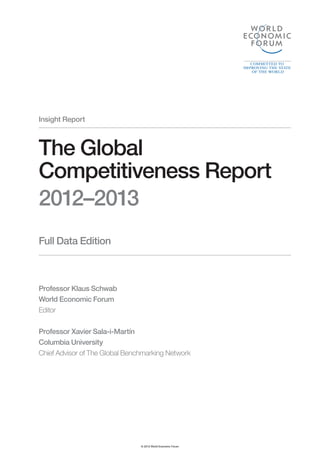
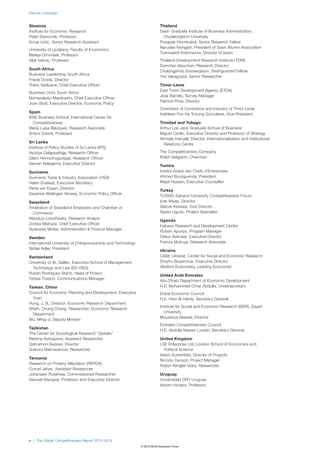
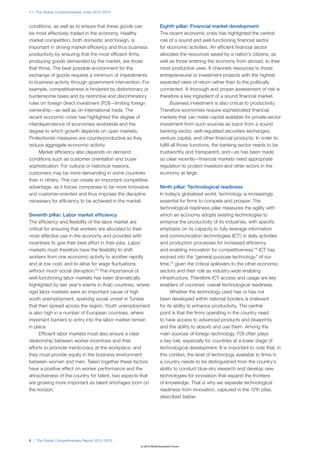
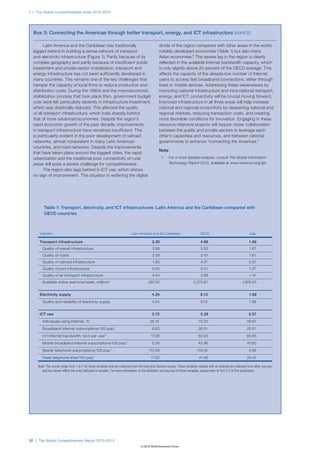
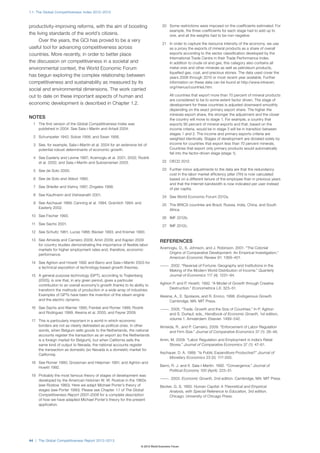
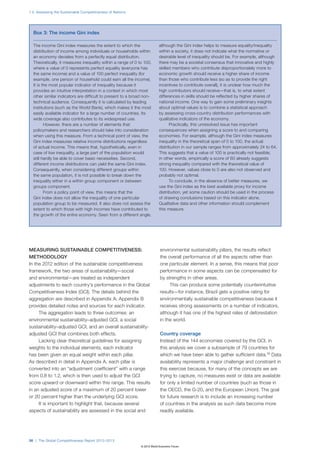
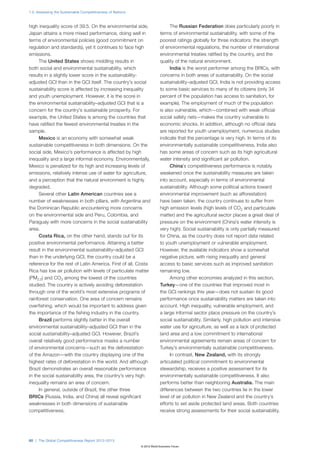
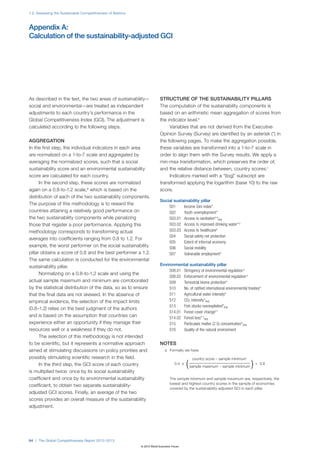
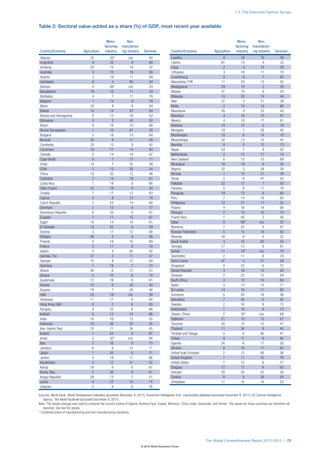
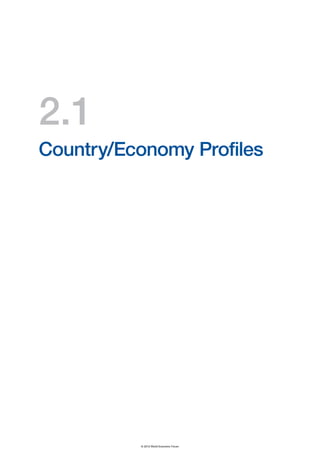
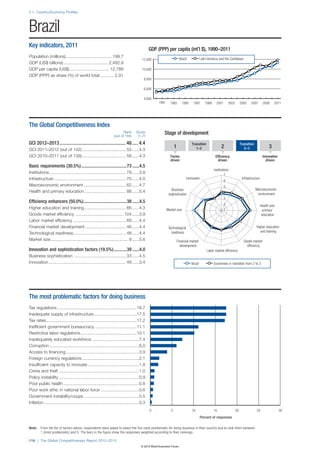
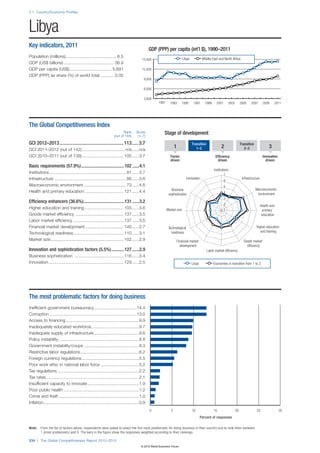
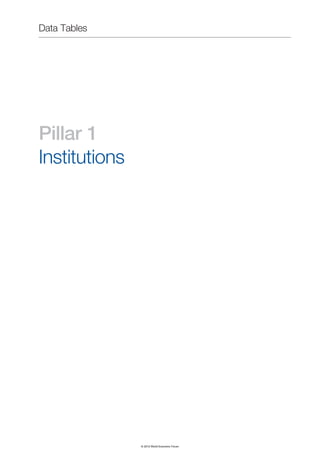
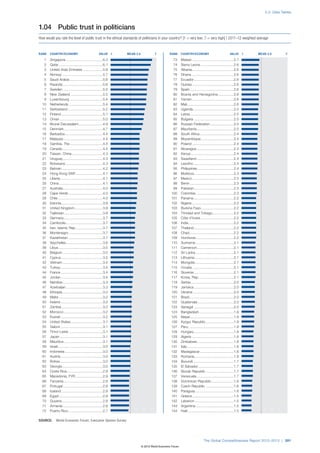
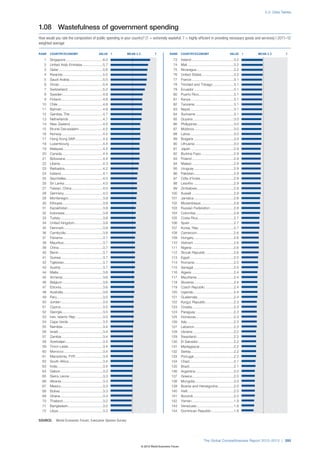
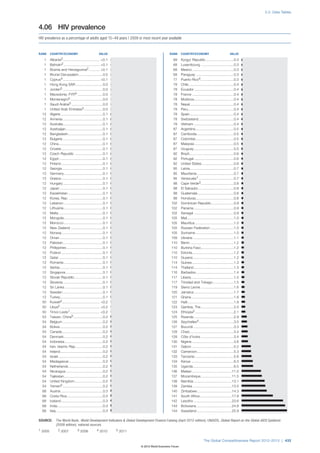
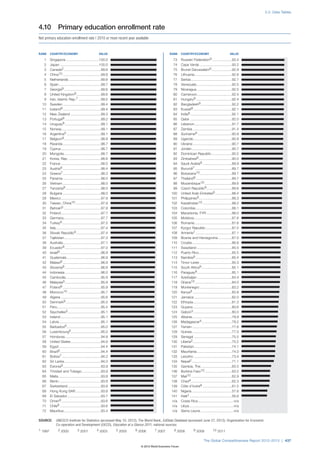
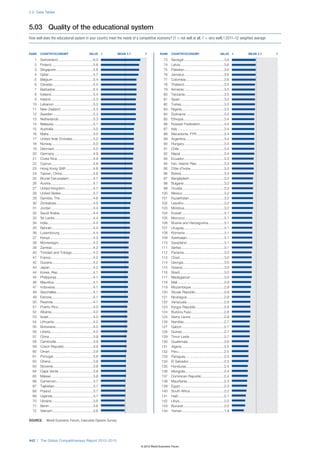
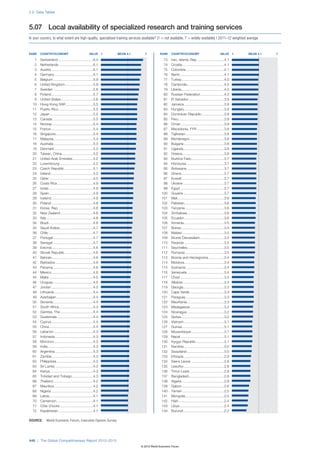
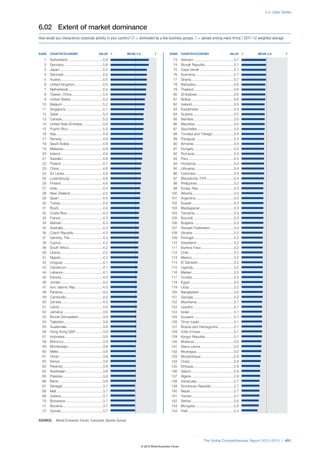
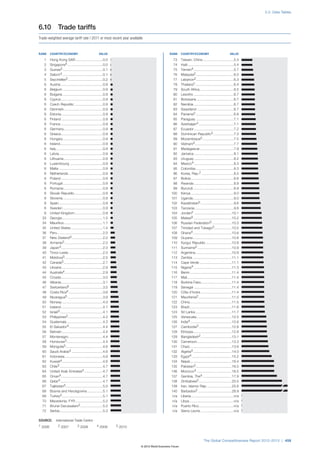
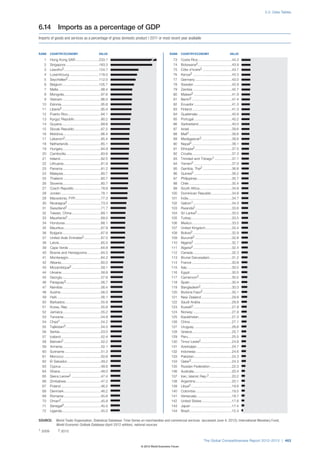
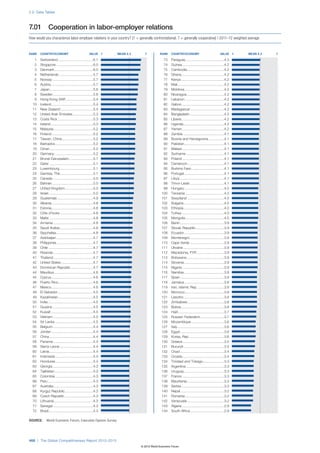
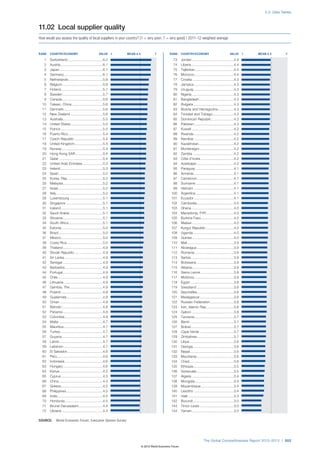
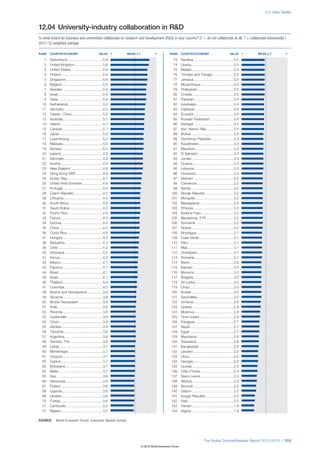
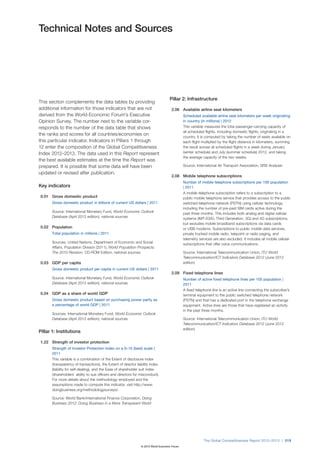
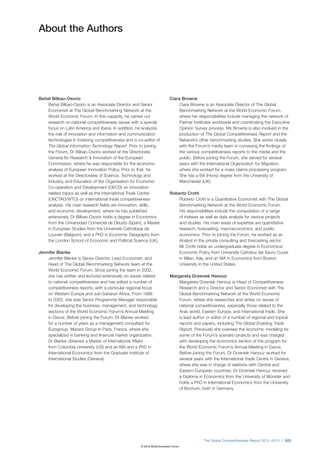
Box 2: Sovereign debt crisis, macroeconomic imbalances, and the lack of competitiveness in
Southern Europe (cont’d.)
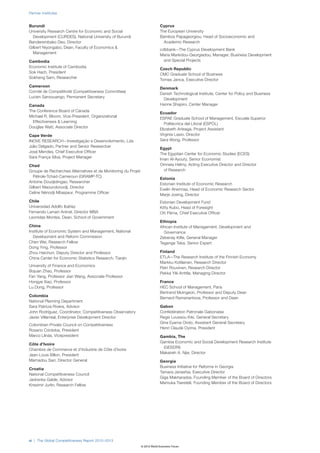
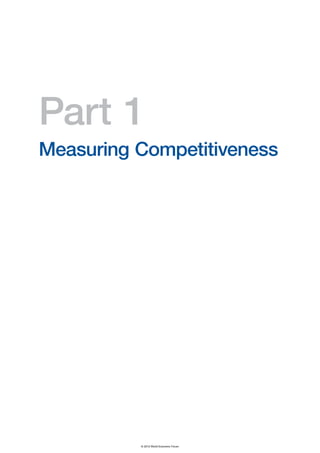
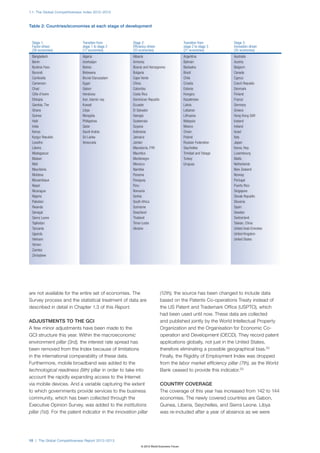
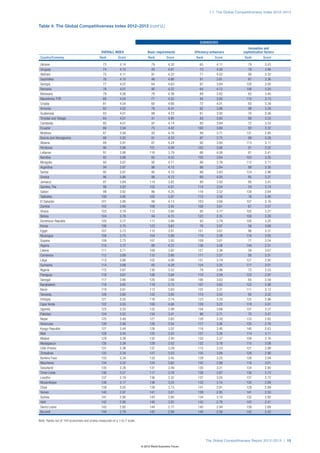
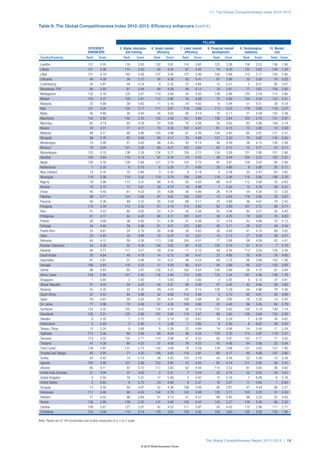
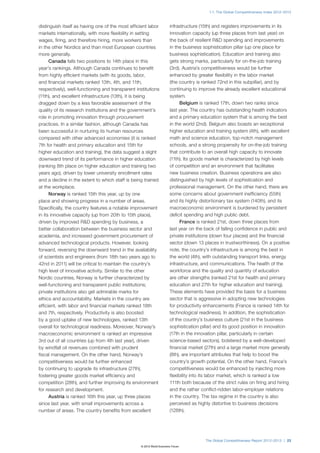
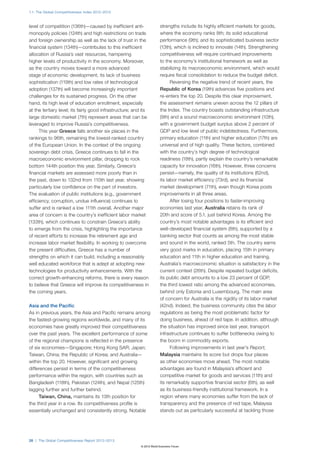
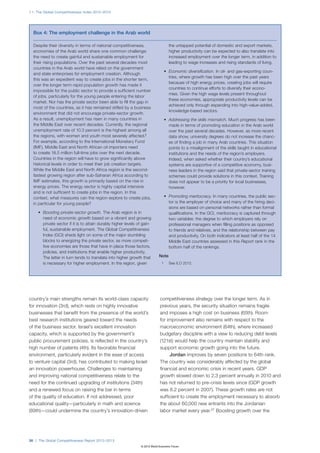
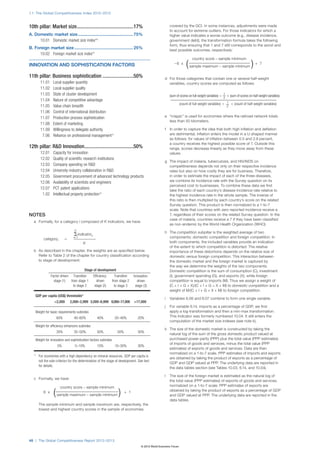
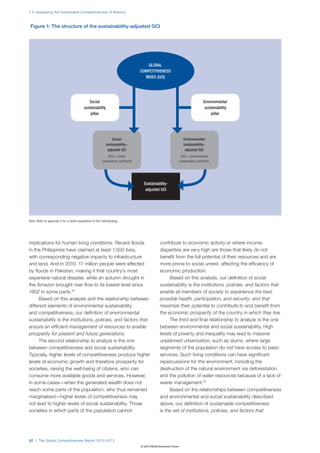
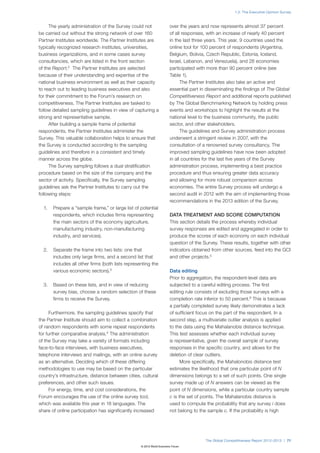
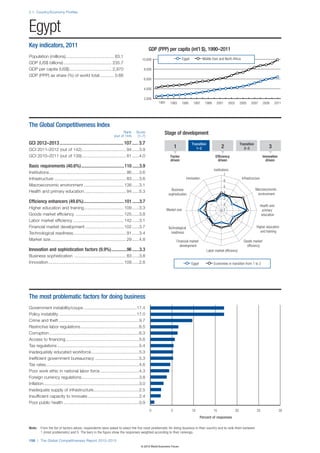
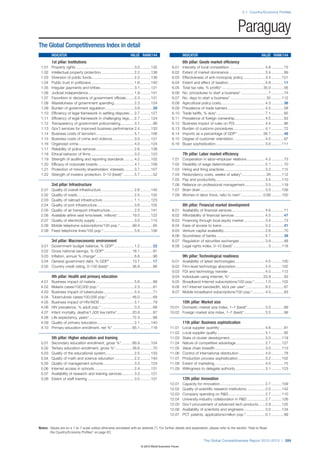
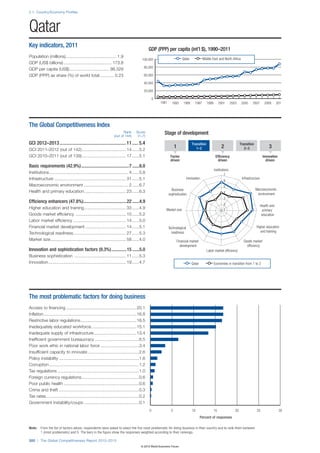
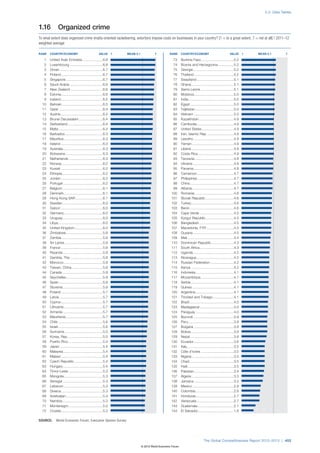
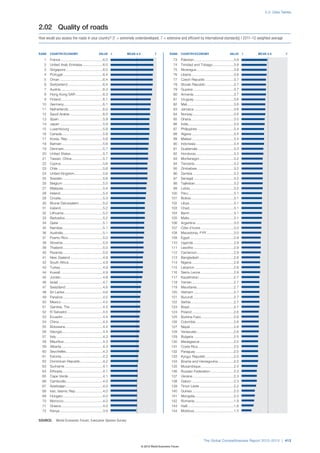
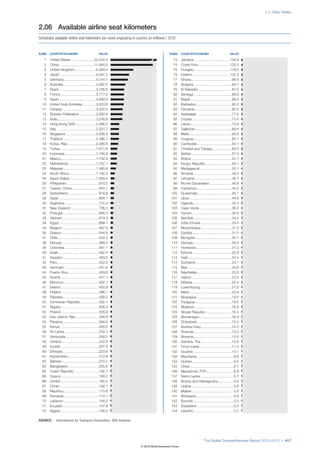
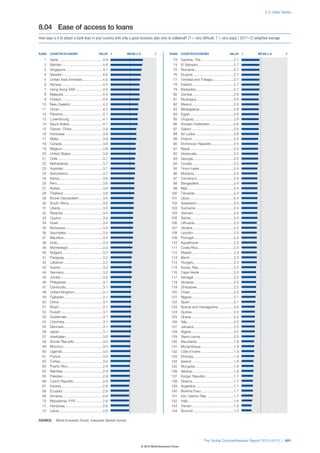
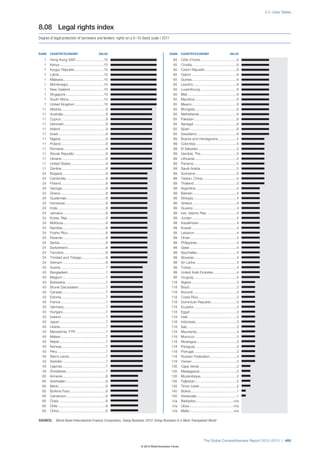
Figure 2: Competitiveness in the European Union: The GCI heat map
GCI score*
n [5.39,5.55†]
n [5.00,5.39[
n [4.60,5.00[
n [4.20,4.60[
n [3.86††,4.20[
n Non-EU countries
* The interval [x,y[ is inclusive of x but exclusive of y. † Highest value; †† lowest value.
Figure 3: Dynamics of the competitiveness divide in Western and Southern Europe
5.5
5.0
GCI score (1–7)
4.5
4.0 EU-11
Southern Europe
3.5
2008–2009 2009–2010 2010–2011 2011–2012 2012–2013
GCI edition
Note: Southern Europe includes Greece, Italy, Portugal, and Spain; EU-11 includes the original 15 member states except Greece, Italy, Portugal, and Spain.
The Global Competitiveness Report 2012–2013 | 25
© 2012 World Economic Forum](https://image.slidesharecdn.com/wefglobalcompetitivenessreport2012-13-121022150116-phpapp02/85/The-Global-Competitiveness-Report-2012-2013-41-320.jpg)
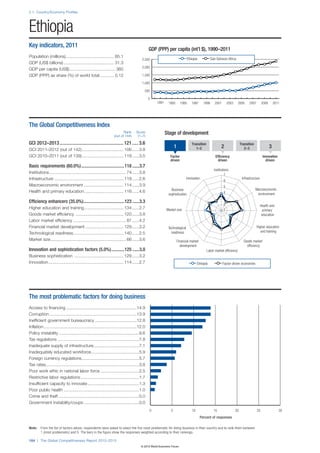
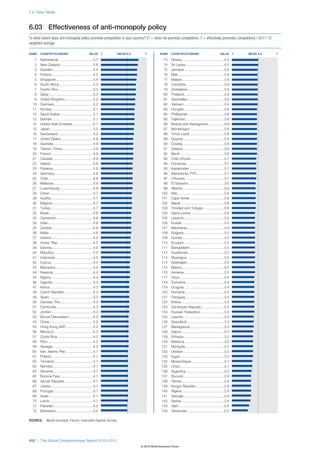
![1.2: Assessing the Sustainable Competitiveness of Nations
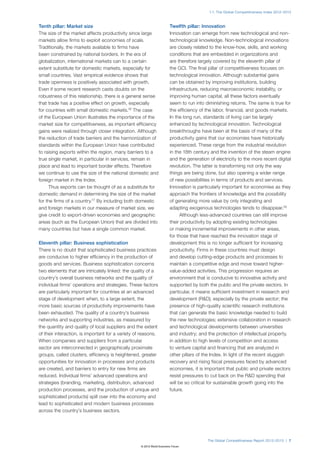
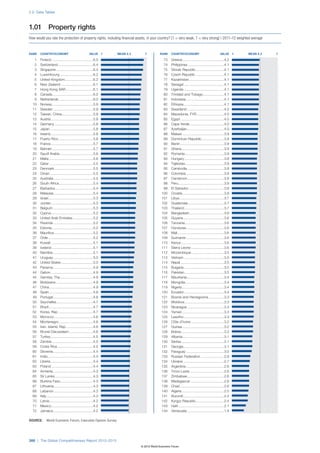
Appendix B:
Technical notes and sources for sustainability indicators
The data in this Report represent the best available S03.02 Access to improved drinking water
estimates from various national authorities, international Percent of total population with access to improved drinking
water | 2010 or most recent year available
agencies, and private sources at the time the Report Percent of the population with reasonable access to an adequate
was prepared. It is possible that some data will have amount of water from an improved source, such as a household
been revised or updated by the sources after publication. connection, public standpipe, borehole, protected well or spring,
or rainwater collection. Unimproved sources include vendors,
Throughout the Report, “n/a” denotes that the value is tanker trucks, and unprotected wells and springs. Reasonable
not available or that the available data are unreasonably access is defined as the availability of at least 20 liters per person
per day from a source within 1 kilometer of the dwelling.
outdated or do not come from a reliable source.
For each indicator, the title appears on the first line, Source: World Health Organization, World Health Statistics 2012
online database (retrieved June 5, 2012)
preceded by its number to allow for quick reference. The
numbering is the same as the one used in Appendix A. S03.03 Access to healthcare
Below is a description of each indicator or, in the case How accessible is healthcare in your country? [1 = limited—
of Executive Opinion Survey data, the full question and only the privileged have access; 7 = universal—all citizens have
access to healthcare] | 2011–12 weighted average
associated answers. If necessary, additional information
is provided underneath. Source: World Economic Forum, Executive Opinion Survey, 2011
and 2012 editions
S01 Income Gini index
S04 Social safety net protection
Measure of income inequality [0 = perfect equality; 100 =
perfect inequality] | 2010 or most recent year available In your country, does a formal social safety net provide
protection from economic insecurity due to job loss or
This indicator measures the extent to which the distribution of
disability? [1 = not at all; 7 = fully] | 2011–12 weighted average
income among individuals or households within an economy
deviates from a perfectly equal distribution. A Lorenz curve plots Source: World Economic Forum, Executive Opinion Survey, 2011
the cumulative percentage of total income received against the and 2012 editions
cumulative percentage of recipients, starting with the poorest
individual. The Gini index measures the area between the Lorenz S05 Extent of informal economy
curve and a hypothetical line of absolute equality, expressed as
How much economic activity in your country would you
a percentage of the maximum area under the line. Thus a Gini
estimate to be undeclared or unregistered? [1 = most economic
index of 0 represents perfect equality, while a value of 100 implies
activity is undeclared or unregistered; 7 = most economic
perfect inequality.
activity is declared or registered] | 2011–12 weighted average
Source: The World Bank, World Development Indicators Online
(retrieved June 1, 2012); CIA World Factbook (retrieved June 6, Source: World Economic Forum, Executive Opinion Survey, 2011
2012); national sources and 2012 editions
S02 Youth unemployment S06 Social mobility
Youth unemployment measured as the ratio of total To what extent do individuals in your country have the
unemployed youth to total labor force aged 15–24 | 2010 or opportunity to improve their economic situation through their
most recent year available. personal efforts regardless of the socioeconomic status of
their parents? [1 = little opportunity exists to improve one’s
Youth unemployment refers to the share of the labor force aged
economic situation; 7 = significant opportunity exists to
15–24 without work but available for and seeking employment.
improve one’s economic situation]
Source: International Labour Organization, Key Indicators of the
Labour Markets Net (retrieved June 5, 2012) Source: World Economic Forum, Executive Opinion Survey, 2012
edition
S03.01 Access to sanitation
Percent of total population with access to improved sanitation
facilities | 2010 or most recent year available.
Percent of the population with at least adequate access to
excreta disposal facilities that can effectively prevent human,
animal, and insect contact with excreta. Improved facilities
range from simple but protected pit latrines to flush toilets with a
sewerage connection. To be effective, facilities must be correctly
constructed and properly maintained. A logarithm transformation
is applied to the ratio of these statistics in order to spread the
data distribution.
Source: World Health Organization, World Health Statistics 2012
online database (retrieved June 5, 2012)
66 | The Global Competitiveness Report 2012–2013
© 2012 World Economic Forum](https://image.slidesharecdn.com/wefglobalcompetitivenessreport2012-13-121022150116-phpapp02/85/The-Global-Competitiveness-Report-2012-2013-82-320.jpg)
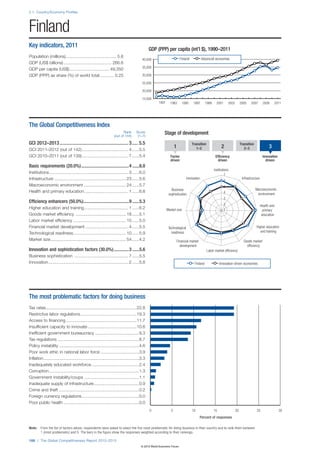
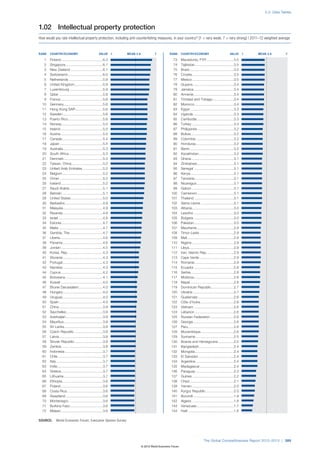
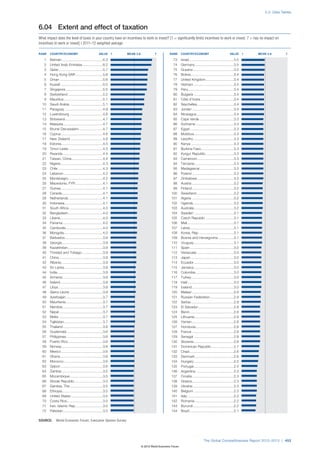
![1.2: Assessing the Sustainable Competitiveness of Nations
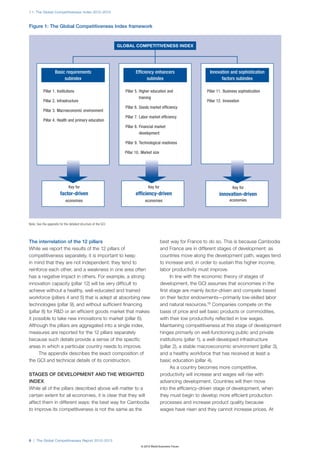
S07 Vulnerable employment S10 No. of ratified international environmental treaties
Proportion of own-account and contributing family workers in Total number of ratified environmental treaties | 2010
total employment | 2010 or most recent year available This indicator provides the total number of environmental treaties
Vulnerable employment refers to the proportion of unpaid ratified by a country. It measures the total number of international
contributing family workers and own-account workers in total treaties from a set of 25 for which a state is a participant. A state
employment. Own-account workers are those workers who, becomes a “participant” by Ratification, Formal confirmation,
working on their own account or with one or more partners, Accession, Acceptance, Definitive signature, Approval, Simplified
hold the type of job defined as a self-employed job and have procedure, Consent to be bound, Succession, and Provisional
not engaged on a continuous basis any employees to work for application (which are here grouped under the term ratification,
them during the reference period. A contributing family worker for reasons of convenience). The treaties included are: the
is a person who holds a job in a market-oriented establishment International Convention for the Regulation of Whaling, 1948
operated by a related person living in the same household and Washington; the International Convention for the Prevention
who cannot be regarded as a partner because the degree of his of Pollution of the Sea by Oil, 1954 London, as amended in
or her commitment to the operation of the establishment, in terms 1962 and 1969; the Convention on Wetlands of International
of the working time or other factors to be determined by national Importance especially as Waterfowl Habitat, 1971 Ramsar; the
circumstances, is not at a level comparable with that of the head Convention Concerning the Protection of the World Cultural and
of the establishment. Natural Heritage, 1972 Paris; the Convention on the Prevention
of Marine Pollution by Dumping of Wastes and Other Matter,
Source: The World Bank, World Development Indicators Online
1972 London, Mexico City, Moscow, Washington; the Convention
(retrieved June 1, 2012)
on International Trade in Endangered Species of Wild Fauna
and Flora, 1973 Washington; the International Convention for
S08.01 Stringency of environmental regulation the Prevention of Pollution from Ships (MARPOL) as modified
How would you assess the stringency of your country’s by the Protocol of 1978, 1978 London; the Convention on
environmental regulations? [1 = very lax; 7 = among the world’s the Conservation of Migratory Species of Wild Animals, 1979
most stringent] | 2011–12 weighted average Bonn; the United Nations Convention on the Law of the Sea,
1982 Montego Bay; the Convention on the Protection of the
Source: World Economic Forum, Executive Opinion Survey, 2011 Ozone Layer, 1985 Vienna; the Protocol on Substances that
and 2012 editions Deplete the Ozone Layer, 1987 Montreal; the Convention on
the Control of Transboundary Movements of Hazardous Wastes
S08.02 Enforcement of environmental regulation and their Disposal, 1989 Basel; the International Convention
How would you assess the enforcement of environmental on Oil Pollution Preparedness, Response and Co-operation,
regulations in your country? [1 = very lax; 7 = among the 1990 London; the United Nations Framework Convention on
world’s most rigorous] | 2011–12 weighted average Climate Change, 1992 New York; the Convention on Biological
Diversity, 1992 Rio de Janeiro; the International Convention to
Source: World Economic Forum, Executive Opinion Survey, 2011 Combat Desertification in Those Countries Experiencing Serious
and 2012 editions Drought and/or Desertification, particularly Africa, 1994 Paris; the
Agreement relating to the Implementation of Part XI of the United
S09 Terrestrial biome protection Nations Convention on the Law of the Sea of 10 December
Degree to which a country achieves the target of protecting 17 1982, 1994 New York; the Agreement relating to the Provisions
percent of each terrestrial biome within its borders | 2010 or of the United Nations Convention on the Law of the Sea relating
most recent year available to the Conservation and Management of Straddling Fish Stocks
This indicator is calculated by Columbia University’s Center for and Highly Migratory Fish Stocks, 1995 New York; the Kyoto
International Earth Science Information Network (CIESIN) by Protocol to the United Nations Framework Convention on the
overlaying the protected area mask on terrestrial biome data Climate Change, Kyoto 1997; the Rotterdam Convention on
developed by the World Wildlife Fund (WWF)’s Terrestrial Eco- the Prior Informed Consent Procedure for Certain Hazardous
regions of the World for each country. A biome is defined as a Chemicals and Pesticides in International Trade, 1998 Rotterdam;
major regional or global biotic community, such as a grassland the Cartagena Protocol of Biosafety to the Convention on
or desert, characterized chiefly by the dominant forms of plant Biological Diversity, 2000 Montreal; the Protocol on Preparedness,
life and the prevailing climate. Scores are capped at 17 percent Response and Cooperation to Pollution Incidents by Hazardous
per biome such that higher levels of protection of some biomes and Noxious Substances, 2000 London; the Stockholm
cannot be used to offset lower levels of protection of other Convention on Persistent Organic Pollutants, 2001 Stockholm;
biomes, hence the maximum level of protection a country can the International Treaty on Plant Genetic Resources for Food and
achieve is 17 percent. CIESIN uses time series of the World Agriculture, 2001 Rome; and the International Tropical Timber
Database on Protected Areas (WDPA) developed by the United Agreement 206, 1994 Geneva.
Nations Environment Programme (UNEP) World Conservation
Source: The International Union for Conservation of Nature (IUCN)
Monitoring Centre (WCMC) in 2011, which provides a spatial time
Environmental Law Centre ELIS Treaty Database
series of protected area coverage from 1990 to 2010. The WCMC
considers all nationally designated protected areas whose location
and extent is known. Boundaries were defined by polygons S11 Agricultural water intensity
where available; where they were not available, protected-area Agricultural water withdrawal as a percent of total renewable
centroids were buffered to create a circle in accordance with the water resources | 2006 or most recent year available
protected area size. The WCMC removed all overlaps between Agricultural water withdrawal as a percent of total renewable
different protected areas by dissolving the boundaries to create a water resources is calculated as: 100 × agricultural water
protected areas mask. withdrawal / total renewable water resources. In turn, total
renewable = surface renewable water + renewable water resources
Source: Yale University and Columbia University, Environmental groundwater – overlap between surface and groundwater. Where
Performance Index (EPI) 2012 edition, based on WWF World available, this indicator includes water resources coming from
Wildlife Fund USA and UNEP WCMC data desalination used for agriculture (as in Kuwait, Saudi Arabia, the
United Arab Emirates, Qatar, Bahrain, and Spain).
Source: FAO AQUASTAT database, available at http://www.fao.
org/nr/water/aquastat/main/index.stm (retrieved May 31, 2012)
The Global Competitiveness Report 2012–2013 | 67
© 2012 World Economic Forum](https://image.slidesharecdn.com/wefglobalcompetitivenessreport2012-13-121022150116-phpapp02/85/The-Global-Competitiveness-Report-2012-2013-83-320.jpg)
![1.2: Assessing the Sustainable Competitiveness of Nations
S12 CO² intensity S14.02 Forest loss
CO² intensity (kilograms of CO² per kilogram of oil equivalent Forest cover lost over the period 2000–10 based on satellite
energy use) | 2008 data | 2010
Carbon dioxide (CO2 ) emissions are those stemming from the This indicator represents the loss of forest area owing to
burning of fossil fuels and the manufacture of cement. They deforestation from either human or natural causes, such as forest
include carbon dioxide produced during consumption of solid, fires. The University of Maryland researchers used Moderate
liquid, and gas fuels and gas flaring. Energy use refers to use Resolution Imaging Spectroradiometer (MODIS) 500-meter
of primary energy before transformation to other end-use fuels, resolution satellite data to identify areas of forest disturbance,
which is equal to indigenous production plus imports and stock then used Landsat data to quantify the area of forest loss. This
changes, minus exports and fuels supplied to ships and aircraft indicator uses a baseline forest cover layer (forest cover fraction
engaged in international transport. A logarithm transformation is with a 30 percent forest cover threshold) to measure the area
applied to the ratio of these statistics in order to spread the data under forest cover in the year 2000. It then combines forest loss
distribution. estimates from Landsat for the periods 2000–05 and 2005–10 to
arrive at a total forest cover change amount for the decade. This
Source: The World Bank, World Development Indicators Online
total is then divided by the forest area estimate for 2000 to come
(retrieved June 1, 2012)
up with a percent change in forest cover over the decade. Further
details on the methods used are found in Hansen, M., S. V.
S13 Fish stocks overexploited Stehman, and P. V. Potapov. 2010. “Quantification of Global Gross
Fraction of country’s exclusive economic zone with Forest Cover Loss.” Proceedings of the National Academies
overexploited and collapsed stocks | 2006 of Science, available at www.pnas.org/cgi/doi/10.1073/
The Sea Around Us (SAU) project‘s Stock Status Plots (SSPs) pnas.0912668107. A logarithm transformation is applied to these
are created in four steps (Kleisner and Pauly, 2011). The first step statistics in order to spread the data distribution.
is to define a stock. SAU defines a stock to be a taxon (either at
Source: Yale University and Columbia University, Environmental
the species, genus, or family level of taxonomic assignment) that
Performance Index (EPI) 2012 edition, based on University of
occurs in the catch records for at least 5 consecutive years, over
Maryland data
a minimum of 10 years, and which has a total catch in an area
of at least 1,000 tonnes over the time span. In the second step,
SAU assesses the status of the stock for every year relative to the S15 Particulate matter (2.5) concentration
peak catch. SAU defines five states of stock status for a catch Population-weighted exposure to PM2.5 in micrograms per
time series. This definition is assigned to every taxon meeting cubic meter, based on satellite data | 2009
the definition of a stock for a particular spatial area considered This indicator was developed by the Battelle Memorial Institute in
(e.g., exclusive economic zones, or EEZs). Stock status states collaboration with Columbia University’s Center for International
are: (1) Developing—before the year of peak catch and less Earth Science Information Network (CIESIN) and funding from the
than 50 percent of the peak catch; (2) Exploited—before or after NASA Applied Sciences Program. Using relationships between
the year of peak catch and more than 50 percent of the peak the Moderate Resolution Imaging Spectroradiometer (MODIS)
catch; (3) Overexploited—after the year of peak catch and less Aerosol Optical Depth (AOD) and surface PM2.5 concentrations
than 50 percent but more than 10 percent of the peak catch; that were modeled by van Donkelaar et al. (2010), annual average
(4) Collapsed—after the year of peak catch and less than 10 MODIS AOD retrievals were used to estimate surface PM2.5
percent of the peak catch; (5) Rebuilding—occurs after the year concentrations from 2001 to 2010. These were averaged into
of peak catch and after the stock has collapsed, when catch three-year moving averages from 2002 to 2009 to generate
has recovered to between 10 and 50 percent of the peak. In global grids of PM2.5 concentrations. The grids were resampled to
the third step, SAU graphs the number of stocks by status by match CIESIN’s Global Rural-Urban Mapping Project (GRUMP) 1
tallying the number of stocks in a particular state in a given year kilometer population grid. The population-weighted average of the
and presenting these as percentages. In the fourth step, the PM2.5 values were used to calculate the country’s annual average
cumulative catch of stock by status in a given year is summed exposure to PM2.5 in micrograms per cubic meter. A logarithm
over all stocks and presented as a percentage in the catch transformation is applied to these statistics in order to spread the
by stock status graph. The combination of these two figures data distribution.
represents the complete Stock Status Plot. The numbers for this
indicator are taken from the overexploited and collapsed numbers Source: Yale University and Columbia University, Environmental
of stocks over total numbers of stocks per EEZ. A logarithm Performance Index (EPI) 2012 edition based on NASA MODIS
transformation is applied to these statistics in order to spread the and MISR data (van Donkelaar et al. [2010]), Battelle, and CIESIN
data distribution.
S16 Quality of the natural environment
Source: Yale University and Columbia University, Environmental How would you assess the quality of the natural environment in
Performance Index (EPI) 2012 edition based on Sea Around Us your country? [1 = extremely poor; 7 = among the world’s most
data pristine] | 2011–12 weighted average
S14.01 Forest cover change Source: World Economic Forum, Executive Opinion Survey, 2011
Percent change in forest area over the period 1990–10 | 2010 and 2012 editions
This measure represents the percent change in forest area,
applying a 10 percent crown cover as the definition of forested
areas, between time periods. We used total forest extent rather
than the extent of primary forest only. The change measure is
calculated from forest area data in 1995, 2000, 2005, and 2010.
The data are reported by national governments, and therefore
methods and data sources may vary from country to country.
Positive values indicate afforestation or reforestation, and negative
values represent deforestation.
Source: Yale University and Columbia University, Environmental
Performance Index (EPI) 2012 edition based on Sea Around Us
data
68 | The Global Competitiveness Report 2012–2013
© 2012 World Economic Forum](https://image.slidesharecdn.com/wefglobalcompetitivenessreport2012-13-121022150116-phpapp02/85/The-Global-Competitiveness-Report-2012-2013-84-320.jpg)


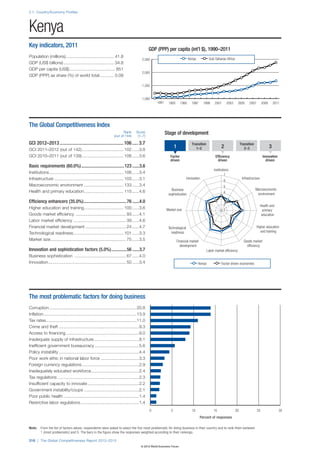

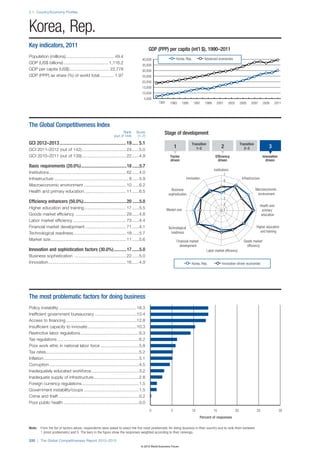


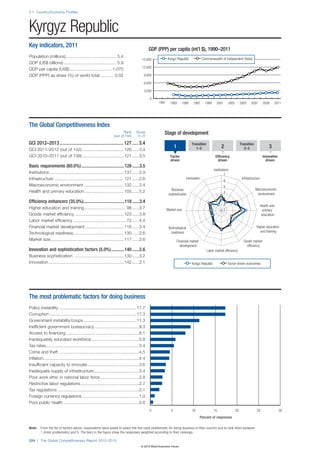


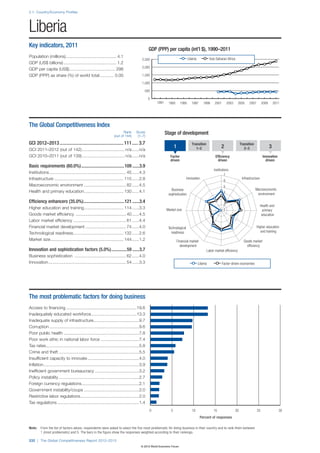


The Global Competitiveness Report 2012-2013, edited by Klaus Schwab and Xavier Sala-i-Martín, is published by the World Economic Forum and provides a comprehensive analysis of global competitiveness across countries. It includes detailed country/profiles, an index of data tables, and insights on enhancing productivity through sustainable competitiveness. The report serves as a key resource for understanding economic strengths and challenges in various nations.


![Wef gcr report_2011-12[1]](https://cdn.slidesharecdn.com/ss_thumbnails/wefgcrreport2011-121-120107061726-phpapp02-thumbnail.jpg?width=640&height=640&fit=bounds)


