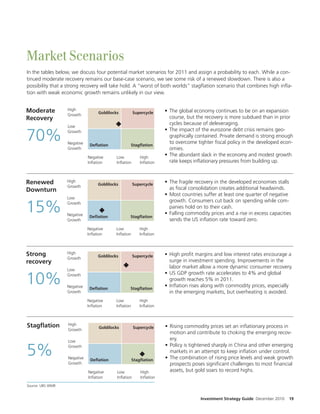
Investment Strategy Guide
Wealth Management Research


2011 Outlook


On schedule, but over budget

Global recovery on track
Equities set to outperform
Fiscal risks remain at the forefront


ab
Contents
                                             Video Feature (electronic version only) ............................ . . . . . . . . . . . 1
Publication details
                                             Focus: On Schedule, But Over Budget .......................... . . . . . . . . . . . 4
Publisher
UBS Financial Services Inc.                  Will...May...Won’t.................................................. . . . . . . . . . . 10
Wealth Management Research
1285 Avenue of the Americas, 13th Floor      Our Best Ideas....................................................... . . . . . . . . . 14
New York, NY 10019
                                             Asset Allocation Overview........................................ . . . . . . . . . 15
This report has been prepared by UBS
Financial Services Inc. (“UBS FS”) and UBS   Washington Watch ................................................ . . . . . . . . . . 16
AG. Please see important disclaimer and
disclosures at the end of the document.      Market Scenarios .................................................. . . . . . . . . . . 19
This report was published on
                                             Economic Outlook ................................................. . . . . . . . . . . 20
8 December 2010.

                                             Financial Market Performance ................................... . . . . . . . . . 23
Editor in Chief
Stephen Freedman                             Asset Classes ........................................................ . . . . . . . . . 24
Editor
Marcy Tolko
                                             Foreign Exchange................................................... . . . . . . . . . 27
Authors                                      International Markets ............................................. . . . . . . . . . 28
Mike Ryan
Stephen Freedman                             US Equities........................................................... . . . . . . . . . 32
Katherine Klingensmith
Thomas Berner                                US Fixed Income ................................................... . . . . . . . . . . 37
Brian Rose
Jeremy Zirin                                 Commodities ........................................................ . . . . . . . . . 42
David Le owitz
Joe Sawe                                     Alternative Investments ........................................... . . . . . . . . . 43
Anne Briglia
Barry McAlinden                              Detailed Asset Allocation ......................................... . . . . . . . . . 45
Donald McLauchlan
Kathleen McNamara                            Portfolio Analytics.................................................. . . . . . . . . . 47
Michael Tagliaferro
Dominic Schnider                             Additional Asset Allocation Models ............................ . . . . . . . . . . 48
Project Management
Paul Leeming                                 Tactical Asset Allocation Performance Measurement ........ . . . . . . . . . 51
John Bellomo
Chris Protasewich                            Disclaimers/Disclosures ........................................... . . . . . . . . . . 53
Desktop Publishing
George Stilabower
Courtney Leshko

A new look...
                                                                                               Video feature: To watch
We welcome your feedback on the new                                                            Chief Investment Strategist
design of this report. Email us: wmrfeed-                                                      Mike Ryan give a summary of
back@ubs.com
                                                                                               the 2011 Outlook report,
                                                                                               please click here.


                                                                                  Investment Strategy Guide December 2010              1
2011 Outlook

                                  Dear Reader,

                                  As 2010 draws to a close, a new year will soon be upon us, presenting fresh
                                  hopes, fears, opportunities and challenges for investors. Will the year ahead
                                  mark a continuation of the economic and nancial healing process that started
                                  in the latter part of 2009 and progressed steadily through 2010? Or will the
                                  recovery prove eeting and give way to renewed weakness and market
                                  volatility? Can equity markets continue grinding higher amid relative modest
            Mike Ryan             valuations and still solid earnings growth? Or will the absence of top-line
                                  growth and renewed concerns over debt problems in the developed world
                                  weigh on risk assets once again?

                                  With the Fed having already taken extraordinary measures to re ate the econ-
                                  omy and stabilize markets, there is some concern that policymakers are simply
                                  running out of options to keep things rolling along. Meanwhile, the change of
                                  Congressional leadership in Washington following the midterm elections ushers
                                  in a new era on Capitol Hill that could yet devolve into stalemate and dysfunc-
                                  tion. Finally, there are prospects for rising tensions across the globe ranging from
            Stephen Freedman      trade disputes and hostile border clashes to possible proliferation of nuclear
                                  weapons.

Coming in January                 But despite these challenges, nancial markets have endured, companies have
                                  adapted and the global economy has demonstrated both its exibility and resil-
The Decade Ahead                  iency. Markets have normalized amid the aggressive steps taken by policymakers
UBS will continue the outlook     and are poised to generate fair returns over the next 12 months. Corporate
conversation in January with      America is once again in the business of reinventing itself and has emerged
our rst ever outlook on the
                                  from the nancial crisis leaner, more ef cient and more pro table. Finally, the
decade ahead. In this new
                                  emerging markets continue to create opportunities that will yield economic
report, the global research
team examines potential
                                  and nancial bene ts across the globe.
trends, opportunities and risks
that could impact individual      We are entering the new year with a constructive outlook on risk assets —
investors over the next ten       equities in particular. While we want to remain fully informed of the risks, we
years.                            also want to be properly positioned to take advantage of the opportunities that
                                  are certain to present themselves both within and across nancial markets in
                                  the year ahead.

                                  Have a happy, healthy and prosperous new year.


                                  Mike Ryan, CFA                                    Stephen Freedman, PhD, CFA
                                  Chief Investment Strategist                       Head, Investment Strategy
                                  Head, Wealth Management Research – Americas       Wealth Management Research – Americas


                                                                                Investment Strategy Guide December 2010     3
Focus
2011 Outlook: On schedule, but over budget
Despite a broad rebound in markets                                    contributed to periodic setbacks in risk assets during this
during 2010, we opt to extend our                                     past year. So as the economy progresses from the initial
                                                                      fragile phase of the rebound to the more stable stage of
preference for risk assets by shifting                                the expansion, risk assets are likely to outperform.
back to an overweight in equities and
                                                                      Still, it’s important to keep in mind that this recovery has
retaining an overweight in credit within
                                                                      come with a pretty he y price tag. Budget de cits across
  xed income. The recent sharp run-up in                              the developed world have surged amid a combination of
equity markets, concerns over European                                falling tax receipts, expensive bailouts of the private sec-
                                                                      tor and aggressive stimulus measures. In a number of
sovereign debt and uncertainties                                      developed countries, the government debt-to-GDP ratio
associated with a new Congress could                                  has risen to levels that pose serious threats to sovereign
prompt a temporary pullback. However,                                 credit ratings (see Fig. 2). This suggests that scal belt-
                                                                      tightening is now in order. But policymakers will need to
we would view that as an opportunity                                  strike the right balance between the need to reduce de -
to add to positions given our more                                    cits and the need to sustain growth. Move too slowly,
                                                                      and some of the dif culties that weighed heavily on the
constructive intermediate-term outlook.                               eurozone could become even broader. Move too quickly,
We look for the economic recovery process to remain on                though, and the extraordinary measures put in place over
schedule in the year ahead, as lingering cyclical chal-               the past three years to re ate the economy and stabilize
lenges continue to give way to a more sustainable expan-                nancial markets will all have been for naught.
sion. Progress will still be uneven, however, as strong de-
mand drivers translate into above-trend growth within                 Against this backdrop, we express our preference for risk
the emerging markets while ongoing balance sheet re-                  assets by moving back to an overweight in equities and
pair dampens growth prospects in the developed world                  shi ing to an underweight in bonds. While stocks could
(see Fig. 1). This slow but steady improvement in the                 come under some pressure early in 2011 amid uncertain-
macro backdrop is still likely to be greeted with both                ties on the domestic political front and fears of a broad-
relief from elected of cials and cautious optimism on the             ening of the EU debt crisis, elevated risk premiums, still
part of investors. Fears of a double-dip recession                    solid earnings prospects and an accommodative


Fig. 1: Economic growth being driven by emerging markets              Fig. 2: Public debt serious threat to sovereign credit ratings
UBS GDP growth forecasts for 2011, in %                               Gross public debt in % of GDP 2010
                                                                            Japan
10                                                                             Italy
                                                                           Greece
    8                                                                     Belgium
                                                                           France
    6                                                                            US
                                                                          Portugal
    4                                                                            UK
                                                                         Germany
    2                                                                      Ireland
                                                                           Austria
    0                                                                  Netherlands
          Japan   Eurozone   UK          US   World   India   China          Spain

                                                                                       0          50            100     150       200
Source: UBS WMR, as of 6 December 2010                                Source: OECD and UBS WMR, as of 6 December 2010


4       2011 Outlook
Focus


monetary policy stance support higher equity prices over                      That’s not to suggest however, that the macro outlook is
the balance of 2011. Nevertheless, given the challenges                       completely devoid of threats or challenges. As we note in
on the scal side – especially within the eurozone – we                        the “15 developments for 2011” section, we do not see
continue to overweight emerging markets versus the de-                        any meaningful recovery in housing this year. In fact, we
veloped world. Although emerging markets are trading                          look for home prices to decline by 5% in light of a heavy
above their historical valuation levels relative to the devel-                backlog of unsold homes, continued incidence of foreclo-
oped markets (see Fig. 3), we still see room for outperfor-                   sure activity and negative housing equity conditions (see
mance. In the xed income markets, we retain our over-                         Fig. 5). While we do not look for signi cant progress on
weight on credit versus government paper as strong                            de cit reduction and expect the Bush tax cuts to be fully
corporate balance sheets and lower default rates support                      extended for the next two years – in line with the agree-
further compression in credit spreads.                                        ment recently struck between President Obama and con-
                                                                              gressional Republicans – there will still be some scal
Uneven but durable growth prospects                                           drag over a winding down of stimulus spending. And
As we’ve already noted, the economic growth prospects                         although lending standards are clearly easing, credit con-
between the developed and developing world remain                             ditions have not fully normalized, which suggests that
uneven in the a ermath of the global nancial crisis and                       banks will still be selective in extending credit to small
associated recession. However, the recovery in the US                         businesses and consumers. Overall, our economics team
appears to have progressed into a more durable expan-                         is forecasting a still below trend GDP growth rate of
sion. The deleveraging in the consumer sector has paused                      about 2.7% for the US in 2011.
for now with the savings rate leveling out at just below
the 6% mark (see Fig. 4). Meanwhile, employment pros-                         Outside the US, the growth dynamic also remains bifur-
pects show some signs of improvement as business con -                        cated. According to our global economics team, Japan is
dence strengthens amid an easing of credit conditions                         expected to slow the most among the non-US developed
and some increased visibility on the regulatory and tax                       nations, with growth decreasing by more than half, from
fronts. The extraordinary policy measures put in place by                     3.5% this past year to just 1.4% in 2011. But some so -
the Fed – including an expanded commitment to quanti-                         ening is also likely in emerging economies, where growth
tative easing – will also serve to buttress growth as still                   is expected to decelerate from 6.1% in 2010 to 5.6% in
low-debt servicing costs and rising disposable income                         2011, with China once again leading the way with GDP
also allow for a higher level of consumer spending.                           growth of 9%. The lingering e ects of the credit crisis


Fig. 3: Still reasonable valuations for Emerging Market Equities              Fig. 4: Deleveraging of consumer sector has paused for now
P/E ratio on forward 1-year consensus EPS estimates                           US personal saving as a % of disposable personal income

 25                                                                            8

 20
                                                                               6
 15

 10                                                                            4

  5
                                                                               2
  0
   1995    1997     1999     2001      2003    2005     2007    2009   2011    0
       World        Emerging Markets                                           2000          2002          2004         2006         2008   2010

Source: Thomson Datastream and UBS WMR, as of 6 December 2010                 Source: Bloomberg and UBS WMR, as of 6 December 2010


                                                                                                     Investment Strategy Guide December 2010       5
Focus


and ongoing balance sheet repair process suggest that                trade at a price/earnings multiple of 12.7x – well below
the world economy is unlikely to reduce much of the ex-              the long-term average of 15x seen during the past 20
cess capacity built up during the recession (see Fig. 6). As         years (see Fig. 8). While we’re not looking for a signi -
a result, slack in labor and capital should ease only grad-          cant re-rating in stocks, some modest expansion in mul-
ually, suggesting that in ation pressures remain excep-              tiples coupled with still solid earnings growth should
tionally well-contained across the globe — with the ex-              yield above-average returns for 2011. Equity market valu-
ception of a few regional hot spots within emerging                  ation is even more compelling when measured against
markets.                                                             the relatively meager returns available for bonds and
                                                                     cash. It must be noted that equity risk premiums cur-
The wages of fear and greed                                          rently stand at abnormally high levels which suggests
The economic outlook matters, of course, since fears of a            equity outperformance in the year ahead (see Fig. 9).
double-dip recession certainly contributed to the setbacks
in equity markets during 2010. It’s o en said that nan-              The valuation case on the credit side is a bit less compel-
cial markets are driven by two things – and two things               ling. Credit risk premiums have continued to narrow as
only – fear and greed. While this is a gross oversimpli ca-          default rates have trended lower, fears of a double-dip
tion of the multitude of variables that investors must               recession have abated and equity market volatility has
both anticipate and react to when evaluating investment              lessened. Spreads on investment grade corporate bonds
choices, it does capture the sometimes bipolar nature of             are now closing in on their longer-term historical aver-
  nancial markets. Keep in mind that the periodic shi s              age, and are only moderately above the levels seen prior
between the so-called “risk on” and “risk o ” trades                 to the crisis. Still, strong credit fundamentals and improv-
de ned the top and bottom of the trading range in                    ing business prospects should leave corporate bonds well
stocks in 2010 (see Fig. 7). If that is the case, then equity        bid. High-yield valuation is a bit more attractive, with
and credit risk premiums re ect just how much market                 spreads that still stand above the long-term average and
participants are being paid to hold risk assets – and what           pre-crisis levels (see Fig. 10). Strong corporate balance
we may expect in returns for the year ahead.                         sheets, a continued need for income and a potential
                                                                     backing up of Treasury yields support further spread
Despite a fairly broad rebound in risk assets during both            compression and outperformance in credit.
2009 and 2010, valuations in both the equity and credit
markets remain relatively attractive. US stocks currently


Fig. 5: Look for home prices to remain under pressure in 2011        Fig. 6: Plenty of excess capacity in developed economies
S&P/Case-Shiller Composite 20 Home Price Index                       Capacity Utilization, in %

 225                                                                 90

                                                                     85
 200
                                                                     80
 175                                                                 75

 150                                                                 70

                                                                     65
 125                                                                   1986     1990           1994       1998        2002        2006   2010
    2006          2007         2008          2009      2010   2011        EU Capacity Utilization       US Capacity Utilization


Source: Bloomberg and UBS WMR, as of 6 December 2010                 Source: Bloomberg, UBS WMR, as of 6 December 2010


6   2011 Outlook
Focus


More bullish but with a bias                                             tunity to time those shi s to bene t most from near-term
Although we are moving to extend our preference for                      volatility or strength in markets. Therefore, we will only
risk assets by overweighting equities, we recognize that                 indicate a short-term bias signal in circumstances when
there is room for a pullback early in the year following                 we have a reasonable conviction that a near-term market
the sharp run-up in equities since early November. We                    move is forthcoming that di ers from the general direc-
therefore have introduced a new feature to our tactical                  tion of our tactical asset allocation recommendations.
asset allocation guidance which we refer to as our
“short-term bias indicator.” This indicator is intended to               Gauging the risks
o er some shorter-term perspective for those looking to                  As we’ve already noted, neither the economic outlook
better time market entry and exit points. Not to be con-                 nor the return prospects within nancial markets are
fused with the technical trading discipline maintained by                without risk. So spots in the expansion and pullbacks in
our Chief Technical Strategist, Peter Lee, these indicators              equity and credit markets are therefore to be expected
are meant to simply complement the longer fundamental                    along the way. While many factors may have an impact
view embedded within our tactical asset allocation (TAA)                 on both growth and market returns, we view the follow-
recommendations. At present, the short-term indicator is                 ing issues as posing some of the more serious challenges
“mixed” which suggests there is a risk of a 5-10% pull-                  in the year ahead:
back in stocks early in 2011 (see Figs. 11 and 12). Those
who are more sensitive to price points may, therefore,                   • Eurozone crisis: Although the EU/IMF aid package to
wish to use this indicator for timing purposes.                            help recapitalize Irish banks has eased immediate con-
                                                                           cerns over eurozone debt, the issue will continue to
Keep in mind that our TAA views are intended to provide                      are up periodically during the year. Sovereign credit
guidance over a horizon that spans a longer (9- to                         spreads remain at elevated levels, suggesting that pres-
12-month) time frame. These views are based on our risk                    sures are mounting for other EU players – especially
and return expectations over this more extended horizon,                   Portugal. That said, concerns over the need for a bail-
and should therefore be the primary driver of tactical                     out of Spain, clearly the most important of the “at
shi s. It remains our view that investors seek guidance                    risk” countries in the EU, are overblown. The scale of
over periods that span longer than just a month. How-                      Spain’s banking problems is not as severe as Ireland’s,
ever, we also realize that the commitment of new funds                     and the state of scal de cit is nowhere near as acute
and the need for periodic rebalancing a ords the oppor-                    as Greece’s.


Fig. 7: Stocks trading within a range in 2010                            Fig. 8: Stocks’ P/E moderately cheap
S&P 500                                                                  S&P 500 P/E ratio based on 12-month forward consensus earnings

1250                                                                     25

1200
                                                                         20

1150
                                                                         15
1100
                                                                         10
1050
                                                                          5
1000                                                                       1991        1995            1999          2003       2007       2011
    Jan-10      Mar-10      May-10       Jul-10        Sep-10   Nov-10        S&P 500 P/E          Average

Source: Bloomberg and UBS WMR, as of 6 December 2010                     Source: Bloomberg and UBS WMR, as of 6 December 2010


                                                                                                Investment Strategy Guide December 2010           7
Focus


• Policy tightening within emerging markets: Con-                                    Should the atmosphere on Capitol Hill turn especially
  tinued divergence in growth prospects between the                                  toxic, this could seriously jeopardize e orts to reduce
  developing and developed nations suggests that mon-                                the budget de cit, streamline regulation and promote
  etary policy paths are also likely to di er. There is still                        an expansion in free trade. None of these would be
  some concern that China (among others) may be                                      well received by nancial markets.
  forced to tighten policy amid increased domestic price
  pressures and a building asset bubble. Although the                              ReÎlling the punchbowl
  scope of emerging markets tightening operations is                               Former Federal Reserve Chairman William McChesney
  limited, any ratcheting up of these e orts could                                 Martin, Jr. once famously quipped that the role of the
  threaten risk assets given continued reliance on the                             Fed was akin to “removing the punch bowl” just when
  emerging markets for growth.                                                     the party really got going. It would appear, however, that
                                                                                   the current Fed Chair, Ben Bernanke, is charting a radi-
• Municipal budget woes: Recent volatile conditions in                             cally di erent course. Confronted with sluggish growth,
  the municipal market have raised concerns over a                                 excess productive capacity and heavy debt balances, Ber-
  broader set of problems at the state and local levels. As                        nanke has had to resort to extraordinary measures in or-
  we point out in the “15 developments for 2011” sec-                              der to re ate the economy. In addition to e ectively
  tion, although the general obligation debt of states                             maintaining a zero-interest rate policy, the Fed has also
  such as California or cities like New York is secure, it is                      initiated a second phase of quantitative easing (com-
  possible that a high pro le municipality could be forced                         monly referred to as QE2) assets. This entails the Fed pur-
  to defer payments on its general obligation bonds. This                          chasing an additional USD 600 billion in Treasury debt in
  would likely send a chill through nancial markets and                            an e ort to keep rates low and jump-start growth. In
  prompt some “de-risking” as participants weighed the                             short, Bernanke keeps re lling the punchbowl in an ef-
  prospects for broader defaults.                                                  fort to turn wall owers into party animals.

• Political missteps: The 112th Congress will be radi-                             It’s dif cult to gauge whether or not these most recent
  cally di erent from the 111th Congress – both compo-                             e orts by the Fed will bear fruit. Although bond yields
  sitionally and ideologically. This suggests that bipartisan                      and the US dollar are likely lower than they would other-
  compromise will be harder to come by and positioning                             wise have been if the Fed had not engaged in QE2, it’s
  for political advantage could dominate the agenda.                               too early to tell if this will have a meaningful impact in


Fig. 9: Equities more attractively valued than bonds                               Fig. 10: Corporate spreads still higher than usual
Equity risk premium (earnings yield minus real bond yield)                         Credit spreads on IG and HY US Corporates, in basis points

15                                                                                  2,000

                                                  Equities attractive
10                                                                                  1,500
                                                  relative to bonds
 5                                                                                  1,000
                         Equities
                         unattractive
 0                                                                                    500
                         relative to bonds

-5                                                                                      0
  1960          1970           1980            1990              2000       2010         1996    1998   2000         2002    2004   2006     2008   2010
                                                                                           US IG      US HY            Median IG      Median HY
         US Equity Risk Premium (Forward earnings)                average

Source: DataStream, Shiller and UBS WMR, as of 6 December 2010                     Source: BoAML, UBS WMR, as of 6 December 2010


8    2011 Outlook
Focus


reinvigorating housing activity, encouraging bank lend-      Fig. 11: Corporate spreads still higher than usual
ing, bolstering equity prices and stimulating exports. On     Short-term bias        Symbol         De nition
the other hand, there is concern over the backlash that       Positive                              We expect a short-term upward
QE2 has triggered both at home and abroad. Elected of-                                              movement in the context of a broader


                                                                                       ¨
                                                                                                    range-bound market or downward trend
  cials are alarmed at the perceived overreach by the Fed,
                                                              Sideways                              We expect a short-term phase of
and the new Congress could mount a more serious chal-                                               consolidation or sideways movement
lenge to the Fed’s independence. Perhaps more concern-                                  §¨          in the context of a broader intra-year
                                                                                                    upward or downward trend
ing is the prospect that dollar weakness prompted by          Negative                              We expect a short-term downward
QE2 could ultimately trigger a wave of competitive cur-                                             movement in the context of a broader


                                                                                        ¨
rency devaluations that threaten global growth prospects.                                           range-bound market or upward trend

It may just turn out that Chairman Bernanke is unable to     Source: UBS WMR
keep re lling the punch – even if the party does show
some signs of winding down.
                                                             Fig. 12: Asset class preference
                                                             Tactical deviations from benchmark
Conclusion
                                                                                            9 to 12 month time hoziron                       Short-term
As we ponder what’s to come during the next 12                                                                                               bias
months, we recognize that new and unforeseen threats
                                                                      Equity
will likely emerge – but so too will opportunities. We
therefore opt to position ourselves to best take advan-       Fixed Income
tage of the trend we see playing out through the balance
                                                                      Cash
of the year by overweighting risk assets and continuing
to focus on those regions, sectors and asset classes          Commodities
within which the growth and return prospects are the
                                                                                –––      ––            –    n     +       ++   +++
strongest. But we also stand ready to make tactical ad-                        Underweight                                 Overweight
justments to our forecasts, projections or asset class
weightings as they become necessary due to changing
                                                             Note: Black arrows indicate changes as of this report. Thick white arrows indicate a short-
fundamentals, shi s in policy stance or signi cant repric-   term bias. Source: UBS WMR, as 8 December 2010
ing within markets. Because while both the economy and
  nancial markets appear to be on smooth roads, some
                                                             Fig. 13: Growth and inÏation
potholes and even an occasional detour are certain to lie
ahead.                                                                                  ’10F       ’11F      ’12F      ’10F      ’11F     ’12F
                                                             World                        4.1       3.7         3.8      2.9       3.0       3.5
                                                             US                           2.8       2.7         2.8      1.6       1.6       2.1
Mike Ryan, CFA, Chief Investment Strategist
                                                             Canada                       2.9       2.3         2.7      1.8       2.6       2.4
                                                             Japan                        3.5       1.4         2.0    –0.7      –0.3        0.4
                                                             Eurozone                     1.8       1.9         1.9      1.5       1.9       2.4
                                                             UK                           1.8       2.3         2.2      3.2       2.8       1.9
                                                             China                       10.0       9.0         9.0      3.3       4.3       4.0
                                                             India                        9.0       8.0         8.6      9.2       6.0       6.8
                                                             Russia                       4.1       4.8         4.5      6.9       8.5       7.7
                                                             Brazil                       7.9       5.4         5.1      5.8       5.4       4.8
                                                             Asia ex-Jp/Chi/Ind           5.3       4.3         4.3      2.7       3.2       3.2
                                                             In developing the forecasts set forth above, WMR economists worked in collaboration
                                                             with economists employed by UBS Investment Research (INV). INV is published by
                                                             UBS Investment Bank. Forecasts and estimates are current only as of the date of this
                                                             publication and may change without notice.

                                                             F: forecast, Source: UBS WMR, as of 7 December 2010


                                                                                        Investment Strategy Guide December 2010                           9
Will...May...Won’t?
15 developments for 2011

In last year’s Outlook report, we o ered up our in-           deter any further run on eurozone debt, credit default
augural list of the Îve developments that will, may           swaps surged to new post-crisis highs for several of the
and won’t happen over the following year. While               more vulnerable players in the EU even a er the Irish
our crystal ball was a bit o the mark on certain              package was announced. While this may bring some
subjects, the overall record was fairly solid. So at          relief, the respite is likely to prove only temporary. Atten-
the risk of tempting the forecasting gods once                tion is already shi ing to the other weak links in the EU
again, we reprise our list of developments this year.         – Spain and Portugal. Given Spain’s relative importance
We have tried to update the list to focus on those            in the eurozone and Germany’s reluctance to underwrite
developments that will likely have the greatest im-           any additional rescue packages, the crisis will shi from
pact on the economy, Înancial markets and policy              concerns over liquidity to fears of solvency.
choices in the year ahead. The list is far from com-
prehensive, but it does focus on the major issues             3. Corporate cash hoarding will end:
that will shape the world — at least our corner of it         Confronted with limited investment opportunities and a
— over the next 12 months.                                    still uncertain economic backdrop, corporate treasurers
                                                              became more cautious custodians of balance sheets over
                                                              the past several years. As a result, the ratio of cash as a
Five things that will happen:                                 percentage of total assets surged to multi-decade highs.
1. Equity markets will provide normalized returns:            While this may have served companies well during the
Following a year of solid if unspectacular performance,       most acute phase of the nancial crisis, these large cash
we look for stocks to provide somewhat above average          reserves have become less optimal as business conditions
returns. Still solid earnings growth, undemanding valua-      rebound and liquidity improves. With the focus now less
tion levels and a supportive monetary policy backdrop all     on survival and more on enhancing shareholder value,
suggest further solid gains in the year ahead. Some fear      we look for corporations to begin deploying these cash
that the negative impact from the end of the stimulus         balances more aggressively. While a fair portion will cer-
spending could prompt a contraction in growth, which          tainly be targeted to business investment spending and
would in turn weigh on equity prices. However, the re-        strategic acquisitions, we also look for an expansion in
engagement of the consumer, easing of credit conditions       share buybacks and increases in dividend payouts.
and an acceleration in business investment spending will
largely o set the drag from the winding down of federal       4. Geopolitical threats will intensify:
spending. However, with earnings unlikely to accelerate       In last year’s Outlook, we noted that geopolitical risks
sharply following last year’s impressive rebound, signi -     would emerge from a host of potential hot spots. We
cantly above-normal returns would require a sharp in-         focused on tensions on the Korean peninsula, increased
crease in P/E multiples. But as we note later on, the pros-   belligerence on the part of Iran, Venezuela and the ongo-
pects for a material re-rating of stocks in the a ermath      ing con ict in Afghanistan and Iraq. This year we expect
of a nancial crisis are limited.                              those threats to intensify and potentially even broaden.
                                                              Iran is edging closer to producing enough “ ssible” ma-
2. The sovereign debt crisis will grow more acute:            terial to make a nuclear warhead – and procuring a deliv-
Those who viewed the EU/IMF bailout of Greece as a sort       ery vehicle capable of hitting Western Europe. Mean-
of “ rewall” in the eurozone sovereign debt crisis must       while, North Korea has engaged in open hostilities
have been bitterly disappointed by the recent EUR 85          against South Korea in an e ort to distract attention
billion lifeline thrown to Ireland. The need for further      away from a leadership transition and a moribund econ-
massive capital injections within the banking industry        omy. But perhaps most troubling of all has been the dis-
 nally forced Ireland to submit to an EU/IMF-led bailout      closure of thwarted terror attacks on cargo aircra
package. Yet, even more disappointment lies ahead. De-        bound for the US and other Western destinations. With
spite an emergency liquidity facility that was intended to    2011 marking the tenth anniversary of the WTC and

10   2011 Outlook
Will...May...Won’t


Pentagon 9/11 attacks, the threat of further strikes will      sessment sectors, it is possible that a general-purpose
remain elevated. The risk that has recently had the big-       government with a higher public pro le may default.
gest e ect on markets – and one that will likely persist       Several cities that have been hit particularly hard both by
– is fear over the political cohesion of Europe.               the national recession and regional structural decline are
                                                               most vulnerable. Although the general obligation debt of
5. Congress will deteriorate into gridlock:                    states such as California and Illinois or cities such as New
The midterm elections ushered in an entirely new political     York and Chicago is secure, municipalities like Detroit
dynamic on Capitol Hill, as signi cant gains by Republi-       and Harrisburg could be forced to defer payments on
cans yielded a split in control of Congress. Not only does     their general obligation bonds.
the GOP now control the House, but the Democratic ma-
jority in the Senate has been narrowed considerably.           2. The economy and corporate proÎts may surprise
While both sides have claimed to want to work together         to the upside:
to nd common ground, the prospects for meaningful              Economists continue to look for sluggish growth in 2011,
progress on a host of issues, ranging from climate             with consensus forecasting 2.5% real US GDP growth.
change legislation to immigration reform, are slim.            The continued overhang from consumer deleveraging,
Meanwhile, notwithstanding the recent agreement on               nancial sector recapitalization and withdrawal of scal
continuing the Bush-era tax cuts, the two parties are          stimulus will certainly restrain growth prospects. How-
likely to clash frequently and ercely over spending and        ever, recent evidence of an improvement in business con-
tax issues. While both have pledged to reduce the de cit,        dence, more robust job creation despite a lackluster
each has embraced a fundamentally di erent approach.           November labor market report and re-engagement of the
Given the disastrous government shutdown in the wake           consumer suggests the risks are now to the upside.
of the 1994 midterm elections, Republican congressional        Meanwhile, companies have continued to reduce costs
leaders will be reluctant to overplay their hand in a simi-    as evidenced by the surprisingly strong Q3 productivity
lar manner this time around, but they will struggle with         gures. This combination of better top-line growth and
an enthusiastic freshman class eager to eschew de cit          impressive productivity gains suggest that the string of
spending. E orts to stymie funding in order to starve          stronger-than-expected earnings reports could last for
healthcare reform run the risk of a similar backlash if the    several more quarters as analysts have been slow to raise
e ort is seen as overly heavy-handed. One of the few           pro t projections.
areas in which the two parties may nd common ground
is trade policy. The impact on the economy could be            3. Emerging markets may stumble:
damaging if Congress were to pass protectionist legisla-       Most strategists, including us, continue to look for strong
tion that threatened global growth.                            growth and solid investment returns from the emerging
                                                               markets (EM) this year. We have opted to retain our over-
                                                               weight as emerging market nations continue to bene t
Five things that may happen:                                   from improving global growth prospects, but face few of
1. A high proÎle municipality may default:                     the structural headwinds confronting the developed
Credit conditions within the municipal market remain           world. However, there are apt to be a few stumbles and
challenging as the consequences of the nancial crisis          setbacks along the way as developing nations continue
and associated recession have continued to weigh on            to grapple with issues ranging from the in ationary im-
state and local nances. A combination of declining tax         pact of increased capital in ows and a rising tide of pro-
revenues, overextension of public services and under-          tectionism to the uneven transition from a purely export/
funded pension plans has le a number of municipalities         infrastructure spending-led growth model. A number of
vulnerable to signi cant ratings downgrades and debt           central banks, including China’s, have been engaged in
service interruptions. While the risk of default will remain   policy tightening in an e ort to limit in ation pressures
concentrated in the housing, healthcare and special as-        and prevent asset bubbles from building. At the same

                                                                               Investment Strategy Guide December 2010   11
Will...May...Won’t


time, there are increased tensions on the trade front as       purchases of Treasury debt, as in ation expectations
developed nations pressure large EM countries to adopt a       surged higher. Further increases in in ation fears – or
more balanced growth approach that includes encourag-          greater reluctance on the part of foreigners to under-
ing domestic demand. Keep in mind that EM are no lon-          write US debt – could prompt additional bouts of volatil-
ger trading at a deep discount to the developed world.         ity, especially on the very long end of the yield curve
So if risk factors emerge or if investors simply opt to take   which is not the primary focus of the Fed’s purchases.
some pro ts, EM could face temporary lapses of under-
performance.
                                                               Five things that will not happen:
4. Rising protectionism may trigger a trade war:               1. P/E multiples will not exceed long-term averages:
Last year, we noted that a trade war would not break           While equity markets continued to grind higher during
out, simply because it was in no one’s best interest to see    2010, the move was driven by a strong surge in corpo-
global commerce contract. However, as steady economic          rate pro ts, with S&P 500 earnings rebounding around
growth resumes and unemployment remains elevated,              35% to USD 84 per share. Valuation multiples actually
elected of cials are focusing once again on issues rang-       contracted, with the price/earnings ratio falling from
ing from protracted global trade imbalances and distor-        14.2 to 12.7 times forward 12-month consensus earn-
tive government subsidies to manipulative foreign ex-          ings estimates. There are those who now see equity
change practices and the failure to honor property rights      prices rising sharply higher as multiples expand above
and legal contracts. These issues broadly fall under the       their historical averages (roughly 15x) amid low in ation,
banner of “fair trade” rather than “free trade,” and have      accommodative policy and somewhat improved growth
created a backlash in many nations struggling with slug-       prospects. We rather expect multiples to remain some-
gish growth prospects and stubbornly high trade de cits.       what below-average in the a ermath of the nancial
While China’s reluctance to meaningfully revalue the           crisis and the uncertainty surrounding the unwinding of
remnimbi has been the most visible point of contention         extraordinarily easy monetary and scal policies.
with US of cials, the Fed’s own program to stimulate the
economy by ooding the system with liquidity through            2. The housing market will not sustain a recovery:
“quantitative easing” has drawn broad criticism as well.       Those waiting for a recovery in the housing market will
As a result, fears that a round of competitive currency        have to wait a bit longer. According to our real estate
devaluations could trigger a broader trade war can no          analyst, Jon Woloshin, the backlog of unsold homes,
longer be so easily dismissed.                                 continued high level of foreclosure activity and preva-
                                                               lence of negative housing equity will serve to limit recov-
5. Bond market volatility may increase:                        ery prospects. Our economics team expects the national
Policymakers have made it clear that the federal funds         Case-Schiller Home Price Index to decline by 5% in 2011.
rate will be kept low “for an extended period” — which         Keep in mind, however, that since housing activity is al-
we take to mean through the rst quarter of 2012.               ready at an extremely depressed level and price declines
Meanwhile, the USD 600 billion program for purchasing          are likely to be manageable, continued weakness in resi-
Treasury debt, which targets Treasury debt in the 5- to        dential real estate won’t trigger another recession. In-
10-year maturity range, will run until June — and could        stead, we look for the economy to continue to expand at
be extended even longer if the Fed deems it necessary.         a sluggish but relatively steady pace this year, despite the
This would seem to support the notion that any rate in-        overhang from housing.
creases for the coming year will be moderate in scale as
the Fed continues to play an outsized role in the bond         3. There will not be meaningful progress in deÎcit
market. But it is precisely the Fed’s intervention that        reduction:
could lead to more volatile conditions in the bond mar-        Despite encouraging e orts by the president’s bipartisan
ket. Rates rose sharply following the Fed’s initial            commission on scal reform and sincere campaign

12   2011 Outlook
Will...May...Won’t


pledges by Tea Party candidates, little meaningful prog-         4. Commodity prices will not collapse:
ress will be made this year on reducing the size of the          In the wake of the housing-inspired global nancial crisis,
budget de cit. Both parties expressed support for the            there are those obsessed with identifying the next asset
commission’s e orts, with each side embracing certain            bubble poised to burst. Given the sharp run-up in prices
                                                                                 over the past two years, commodities
                                                                                 have been cited by many (along with
  2011: Five things we believe...                                                Treasury debt, emerging markets and
                                                                                 sports memorabilia) as the next most
                                                                                 likely asset vulnerable to a collapse. While
 ...will happen           ...may happen              ... won’t happen            certain types of industrial metals and ag-
                                                                                 ricultural goods have gotten a bit pricey
 Equity markets will                                 P/E multiples will          in the near term, we do not foresee a
                          A high proÏle munic-
 provide normalized                                  not exceed long-
                          ipality may default                                    broad-based pullback in commodity
 returns                                             term averages
                                                                                 prices. In fact, our commodity strategist,
 The sovereign debt       The economy and            The housing market          Dominic Schnider, just recently raised his
 crisis will grow         corporate proÏts may       will not sustain a          target price on oil for 2011 from an aver-
 more acute               surprise to the upside     recovery                    age of USD 85 per barrel to an average
                                                                                 of USD 95 per barrel, with spikes above
                                                     There will not be           the USD 100 mark likely in the coming
 Corporate cash           Emerging markets
                                                     meaningful progress
 hoarding will end        may stumble                                            year.
                                                     in deÏcit reduction

                          Rising protectionism                                    5. InÏation will not be a problem:
 Geopolitical threats                                Commodity prices             This is another repeat performer from last
                          may trigger a trade
 will intensify                                      will not collapse
                          war                                                     year, but needs updating because of the
                                                                                  continued massive pump-priming exer-
  Congress will dete-        Bond market volatil-    InÐation will not be         cises undertaken by the Fed. With rates
  riorate into gridlock      ity may increase        a problem                    already e ectively at 0%, policymakers
                                                                                  were forced to employ more exotic mea-
                                                                                  sures to help re ate assets, stabilize -
aspects of the preliminary proposal to reduce the de cit.      nancial markets and stimulate growth. This has rekindled
However, the report did not gain enough support within         fears that in ation pressures may accelerate as re ected
the commission to be put to a vote. Neither party has yet      in the sudden jump in bond yields following the initial
put forth a credible plan for reducing the level of govern-    stage of QE2. But while in ation expectations did indeed
ment outlays, reforming entitlement spending or increas-       rise, they still remain low by almost any objective bench-
ing tax receipts – all required for any meaningful progress    mark. What’s more, with the economy still growing at a
on closing the scal shortfall. Senate Republican leaders       sluggish pace and the unemployment rate unlikely to fall
have pledged to eliminate the practice of congressional        very sharply in the near term, price pressures are apt to
earmarks which tend to in ate spending. The White              remain muted. But there’s a caveat: while price pressures
House has proposed freezing the pay of federal employ-         will remain subdued domestically, other parts of the
ees for two years. The e ect of both measures would be         world — including China — will be grappling with in a-
minimal. So while both parties have expressed willing-         tion trouble spots.
ness to leverage the commission’s work in the wake of
the eurozone debt crisis, the prospects for substantive        Michael P. Ryan, CFA, Chief Investment Strategist
progress in 2011 are limited, in light of the deep ideolog-
ical divide in Congress.

                                                                                 Investment Strategy Guide December 2010   13
Our Best Ideas at a Glance
The following list represents investment strategy recommendations that WMR believes will provide attractive
opportunities over the next 9-12 months.

Asset Classes
Preference for Equities over Bonds
Currencies
Preference for minor currencies, in particular EM, commodity producers (CAD, AUD) and Euro proxies (CHF, SEK, NOK).


  Equities                                                                             Fixed Income
  Current allocation: 49.0%                                                            Current allocation: 32.0%
  International markets                                                                Within US dollar Fixed Income
  • Emerging Market equities                                                           • High Yield Corporate bonds
  • Especially Brazil, China, Russia                                                   • Investment Grade BBB-rated
    and Taiwan                                                                           Corporates
  • UK equities                                                                        • Emerging Market USD sover-
                                                                                         eigns and quasi-sovereigns,
  Within US equities
                                                                                         with a preference for Mexico
  • Information Technology: In par-                                                      and Brazil
    ticular Hardware Technology
    and Equipment                                                                      • Emerging Market USD Corpo-
                                                                                         rates, in particular commodity
  • Consumer Staples: especially                                                         producers
    Emerging Market geared com-
    panies within Household and                                                        • Trust Preferred Securities
    Personal Products as well as                                                       Pages 30, 37
    Food, Beverage and Tobacco.
                                                                                       Alternative Investments
  • Within Industrials: Airfreight
                                                                                       Current allocation: 12.0%
    and logistics companies
                                                                                       • Included in portfolio for
  • Within Financials: Money center                                                      diversi cation purposes.
    banks, Brokers and Life Insurers
                                                                                       Page 43
  • Within Consumer Discretionary:
    Auto-related companies                                                             Commodities
                                                                                       Current allocation: 5.0%
  • Within Telecom: Wireless towers
    and data-centers                                                                   • We see upside potential for
                                                                                         crude oil, gold and selected
  • Within Energy: Oil eld services                                                      agricultural commodities.
    companies                                          Overweight
                                                                                       Page 42
                                                       Neutral
  • Preference for Growth over                         Underweight                     Cash
    Value stocks
                                                                                       Current allocation: 2.0%
  Pages 28, 32, 34
                                                                                       • Yield may be pinned near zero
                                                                                         for another 12 months.

For an explanation of current allocation, please see the note on the following page.


14   2011 Outlook
Asset Allocation Overview
 Asset Allocation Overview                                                                                      WMR Tactical View         Model Portfolio Moderate Risk Pro le (in %)


                                                                                                                                           Benchmark


                                                                                                                                                                                  Allocation
                                                                                                                                           Allocation


                                                                                                                                                        Deviation


                                                                                                                                                                                  Current
                                                                                                                                                        Tactical


                                                                                                                                                                       Change
 Equities
 Reasonable valuations make equities more attractive than the low yields o ered by bonds. We prefer             Overweight                  44.0         +5.0          S           49.0
 emerging over developed markets.

   US Equities
   We expect solid earnings growth, but 2011 consensus estimates appear too high, leaving room for              Neutral                     32.0         +0.0                      32.0
   disappointments.

   US Large Cap Value                                                                                           Moderate
   Large-cap value appears less attractive than growth.                                                         Underweight
                                                                                                                                            11.0         -1.5          T            9.5


   US Large Cap Growth                                                                                          Moderate
                                                                                                                                            11.0         +3.0          S           14.0
   Valuations and our sector tilts suggest a preference for Growth over Value.                                  Overweight


   US Mid Cap
                                                                                                                Neutral                      5.0         +0.0                       5.0
   Expensive versus large caps. Greater M&A activity could be a positive in 2011.

   US Small Cap
   Expensive versus large caps but Ênancing conditions improving. Greater M&A activity could be a               Neutral                      3.0         +0.0         S             3.0
   positive in 2011.

   US Real Estate Investment Trusts (REITs)                                                                     Moderate
   Remains expensive despite underperformance in recent weeks. Fundamentals still challenging.                  Underweight
                                                                                                                                             2.0         -1.5         T             0.5


   Non-US Developed Equities
   We see potential in UK stocks. Eurozone valuations are attractive but sovereign debt situation creates       Neutral                     10.0         +0.0         S            10.0
   risk. Japan not as expensive as it used to be but fundamentals are weak.

   Emerging Market (EM) Equities
   EM equities are more attractively valued than developed markets and more immune to Êscal risk.
                                                                                                                Overweight                   2.0         +5.0         S             7.0

 Fixed Income
 Low yields unattractive relative to equities. Fed may remain on hold throughout 2011, which should help        Underweight                 37.0         -5.0         T            32.0
 to limit the rise in long rates.

   US Fixed Income                                                                                              Moderate
   Currency considerations suggest a neutral stance versus non-US Êxed income.                                  Underweight
                                                                                                                                            29.0         -2.5         T            26.5


   Non-US Fixed Income
                                                                                                                Moderate
   The dollar should remain weak but already appears undervalued against many currencies. Japan’s
                                                                                                                Underweight
                                                                                                                                             8.0         -2.5         T             5.5
   economic woes and extremely low rates make yen debt unattractive.

 Cash (USD)
                                                                                                                Neutral                      2.0         +0.0                       2.0
 Low yields make the opportunity cost of holding cash high.

 Commodities
                                                                                                                Neutral                      5.0         +0.0                       5.0
 Demand from emerging markets should support prices, but negative roll yields likely to trim total returns.

 Alternative Investments
                                                                                                                Neutral                     12.0         +0.0                      12.0
 No tactical view. Included into portfolio for diversiÊcation purposes.

“WMR tactical deviation” legend: Overweight Underweight Neutral                                                                              “Change” legend: S Upgrade T Downgrade
Source: UBS WMR and Investment Solutions, as of 8 December 2010.                                                                                         For end notes, please see appendix.

The benchmark allocations are provided for illustrative purposes only by UBS for a hypothetical US investor with a moderate investor risk proÊle and total return objective. See “Sources of
benchmark allocations and investor risk proÊles” in the Appendix for a detailed explanation regarding the source of benchmark allocations and their suitability and the source of investor
risk proÊles. The current allocation is the sum of the benchmark allocation and the tactical deviation. See “Deviations from benchmark allocation” in the Appendix regarding the interpreta-
tion of the suggested tactical deviations from benchmark.


                                                                                                                          Investment Strategy Guide December 2010                              15
Washington Watch
The ght for scal leadership

The 112th session of Congress promises to be very                                         Leadership sets the tone
busy, but not so very productive. We expect that                                          The selection of leadership in the House for both parties
with power balanced more evenly between the two                                           promises to keep tensions high. The reelection of Nancy
parties there will be a rancorous tug-of-war. Con-                                        Pelosi as the minority leader in the House was a close
gress will accomplish little – only what it must – in                                     vote, and speaks to the decimation of the “Blue Dog”
2011. Contrary to the conventional wisdom that a                                          moderate cohort. At the helm of House Republicans is
divided government is good for markets, squab-                                            John Boehner, who represents a continuation of previous
bling in Washington may actually be negative.                                             positions but will have to reckon with a large freshman
                                                                                          class. As many of these newcomers have support from
DeÎcits, spending and jobs                                                                the Tea Party movement, Boehner will have much to con-
We expect that the next Congress will focus on de cits,                                   tend with even passing “routine” legislation to keep the
spending and jobs, with their eyes already on the 2012                                    government going.
presidential election. Both Democrats and Republicans
are claiming leadership on scal reform, but display dis-                                  Unlike most sessions, the new 112th Congress will have
tinct ideological approaches, with Democrats focused on                                   signi cant routine business to clean up a er the previous
receipts (tax increases) and Republicans on expenditures                                  session. The 111th Congress is poised to leave quite a
(spending cuts). Even as the Senate does not have to                                      few un nished a airs, potentially including only a short-
pass major tax legislation in 2011, we expect scal sus-                                   term extension of the budget bill, as well as the “extend-
tainability to dominate Washington. Interestingly, the                                    ers” bill, which includes many popular provisions. But as
bipartisan De cit Commission’s aggressive proposals to                                    the new Representatives will come with little experience
cut entitlements, the size of government, defense and                                     and lots of passion to limit excess, Research and Develop-
other politically sensitive programs, along with a restruc-                               ment and charitable contributions tax credits as well as
turing of the tax code, met with some support from both                                   Build America Bonds could at least temporarily expire.
parties (see Fig. 1). However, when it comes to taking                                    Additionally, increasing the debt ceiling could be a major
political risks and compromising, we expect that both                                     hurdle. The US government is expected to hit its self-
parties’ desire to have a “pristine” voting record to                                     imposed debt limit of just over USD 14 trillion by May of
dangle in front of voters come 2012 will block progress.                                  2011, and as the government is running large de cits
                                                                                          without the ability to take on new debt, it would close.
                                                                                          We expect the ceiling will eventually be increased, but


Fig. 1: DeÎcit Commission’s proposal improves the deÎcit                                  Fig. 2: US debt issuance near its limit
Outlays to exceed expenditures for the next decade, in % of GDP                           The debt ceiling, in USD trillion

28                                                                                        14
24                                                                                        12

20                                                                                        10
                                                                                           8
16
                                                                                           6
12
                                                                                           4
  1970          1980           1990          2000           2010           2020
      Revenues (historical)                   Outlays (historical)                         2
      Revenues (Commission's proposal)        Outlays (Commission's proposal)
                                                                                           0
      Revenues (CBO's adjusted baseline)      Outlays (CBO's adjusted baseline)
                                                                                           1996       1998      2000      2002      2004       2006   2008   2010
Note: CBO’s adjusted baseline is the CBO baseline projections adjusted for the Bush tax
cut extention and AMT indexation. Source: CBO, National Commission on Fiscal Responsi-
bility and Reform, UBS WMR, as of 3 December 2010                                         Source: Bloomberg, UBS WMR, as of 23 November 2010


16    2011 Outlook
Washington Watch


the ght could be brutal and the government could come            mandate for the Fed to seek full employment) — and
close to or actually temporarily close. History speaks to the    while they are unlikely to succeed, Fed of cials will likely
political and economic cost of such a strategy, but new          face hostility when on The Hill. Additionally, we doubt a
members will come in ready to ght and not to abide by            carbon tax or other energy legislation will make any ma-
conventional wisdom. At a minimum, Republicans may be            jor headway.
able to demand concessions from the White House for
approving a higher ceiling (see Fig. 2).                         Protectionism could rise, but chances for legislation have
                                                                 diminished. Until recently, the Obama White House
Legislation as political statement                               lacked a push for free trade. However, in an e ort to be-
The House is likely to pass and repeal many pieces of leg-       come more business-friendly, the Administration shi ed.
islation, with little expectation that such laws will make it    It inherited three Free Trade Agreements, and as of the
through the Senate, let alone the White House. For exam-         end of 2010 it pushed the FTA with South Korea; agree-
ple, we expect that the House will repeal the healthcare         ments with Colombia and Panama are pending. While
bill (but this will be ignored by the Senate) and substan-       Republicans are traditionally moderately more pro-free
tially modify the nancial sector reform bill. House Repub-       trade than Democrats, given the in uence of the Tea
licans could, however, successfully delay or alter elements      Party movement, we are unlikely to see a concerted ef-
of these bills.                                                  fort in this direction. There is still the chance that protec-
                                                                 tionism will increase, especially disputes with China, if
Tempers may are during discussions about taxes and               unemployment stays high.
spending, but that doesn’t translate into policy. Some
House Republicans have come out in favor of limiting             Sometimes a strong government helps
spending to 2008 levels. Unemployment bene ts could be           Overall, we expect a divided and divisive Congress. We
limited going forward and earmarked “pork” funding               are in an environment where strong government can be
could also be curtailed, but these changes involve rela-         a good thing for markets given the need for achieving
tively small price tags. Sacred areas, like defense, may ac-     long-term scal sustainability, eliminating uncertainty
tually be discussed, while entitlements — which make up          regarding the long-term tax code and healthcare ex-
the bulk of the expenditures — are unlikely to be curtailed      penses and even for keeping the government open.
even if there is consensus that this eventually must hap-        However, we think that Congress will struggle to pass
pen. So-called compromises may involve both sides get-           even routine legislation, let alone implement some of the
ting what they want, with an increase in spending and a          fundamental reforms now being discussed. Such a situa-
hike in taxes, but this just exacerbates the situation. The      tion suggests continuity for some areas, but promises
uncertainty about the government’s long-term scal sus-           con ict around government funding. Policy issues are
tainability threatens Treasuries and the US dollar, but is       critical to markets, but we are unlikely to see much of a
unlikely to result in a crisis in the near term.                 boost from DC.

Political divide leaves some policies untouched                  Katherine Klingensmith, Strategist
There are some areas where the party split will preclude
aggressive legislation, leaving the status quo intact. For
example, we expect that the government-sponsored en-
terprises will be debated but not privatized in the next
Congress. In addition, the role and independence of the
Federal Reserve could be a hotly debated subject, espe-
cially with the controversial increase in quantitative easing,
but we doubt legislation will be passed. Republicans have
called for reform of the Federal Reserve Act (removing the

                                                                                   Investment Strategy Guide December 2010   17
18   2011 Outlook
Market Scenarios
In the tables below, we discuss four potential market scenarios for 2011 and assign a probability to each. While a con-
tinued moderate recovery remains our base-case scenario, we see some risk of a renewed slowdown. There is also a
possibility that a strong recovery will take hold. A “worst of both worlds” stag ation scenario that combines high in a-
tion with weak economic growth remains unlikely in our view.


Moderate          High                                               • The global economy continues to be on an expansion
                                  Goldilocks          Supercycle
                  Growth
Recovery                                                               course, but the recovery is more subdued than in prior
                                                                       cycles because of deleveraging.
                  Low
                                                                     • The impact of the eurozone debt crisis remains geo-
70%               Growth

                  Negative    Deflation            Stagflation
                                                                       graphically contained. Private demand is strong enough
                                                                       to overcome tighter scal policy in the developed econ-
                  Growth                                               omies.
                             Negative      Low           High
                                                                     • The abundant slack in the economy and modest growth
                             Inflation      Inflation      Inflation      rate keeps in ationary pressures from building up.


Renewed           High                                               • The fragile recovery in the developed economies stalls
                                  Goldilocks          Supercycle
                  Growth                                               as scal consolidation creates additional headwinds.
Downturn
                                                                     • Most countries su er at least one quarter of negative
                  Low
                                                                       growth. Consumers cut back on spending while com-
15%               Growth

                  Negative    Deflation            Stagflation
                                                                       panies hold on to their cash.
                                                                     • Falling commodity prices and a rise in excess capacities
                  Growth                                               sends the US in ation rate toward zero.
                             Negative      Low           High
                             Inflation      Inflation      Inflation


Strong            High                                               • High pro t margins and low interest rates encourage a
                                  Goldilocks          Supercycle
                  Growth
recovery                                                               surge in investment spending. Improvements in the
                                                                       labor market allow a more dynamic consumer recovery.
                  Low
                                                                     • US GDP growth rate accelerates to 4% and global
10%               Growth

                  Negative    Deflation            Stagflation
                                                                       growth reaches 5% in 2011.
                                                                     • In ation rises along with commodity prices, especially
                  Growth                                               in the emerging markets, but overheating is avoided.
                             Negative      Low           High
                             Inflation      Inflation      Inflation


Stagflation        High                                               • Rising commodity prices set an in ationary process in
                                  Goldilocks          Supercycle
                  Growth
                                                                       motion and contribute to choking the emerging recov-
                  Low
                                                                       ery.
                                                                     • Policy is tightened sharply in China and other emerging
5%                Growth

                  Negative    Deflation                Stagflation
                                                                       markets in an attempt to keep in ation under control.
                                                                     • The combination of rising price levels and weak growth
                  Growth                                               prospects poses signi cant challenges to most nancial
                             Negative      Low            High         assets, but gold soars to record highs.
                             Inflation      Inflation       Inflation
Source: UBS WMR


                                                                                     Investment Strategy Guide December 2010   19
US Economic Outlook
US consumer comeback as growth engine

With the boost to production from inventory re-                                                the growth recovery and to positive job formation. As sta-
building and Îscal policy now in the past, the key                                             ble labor income growth fuels consumption, the positive
challenge in 2011 for the US economy will be to                                                feedback loop between consumption, job formation and
grow Înal private demand without crutches. Labor                                               labor income is already rmly in place. Second, the work-
income has already reacted visibly to Înal demand                                              week has risen generously since 2009 and now stands at
and related job growth and the Fed will remain                                                 about two-thirds of the way between the recession
supportive. We are therefore conÎdent that the                                                 trough and the pre-recession level. We believe businesses
US economy can withstand a possible Îscal drag                                                 will likely employ workers more vigorously once the work-
on growth.                                                                                     week has reached its pre-recession level. Finally, the
                                                                                               household savings rate has been hovering above 5% since
Show me the purchasing power                                                                   late 2008. This is strong evidence that the savings rate
We estimate that the scal package boosted real GDP                                             adjustment is over, barring any signi cant negative net
growth by about 1 percentage point (pp) and inventories                                        wealth shock. Given these developments, we expect con-
added another 1.6pps in 2010. Government spending                                              sumption to grow at a healthy clip of around 3% in 2011.
grew by “only” about 1.1%, as rising federal spending
was o set by the spending slump at local governments.                                          InÏation and the Fed
Taking into account the government’s roughly 20% share                                         The Fed has made it clear that it doesn’t plan to spoil the
in GDP and allowing for income multipliers, we think the                                       party. We think that it will follow through with buying
total impact was about 1%. We expect an only slightly                                          the full USD 600 billion in Treasuries by end of 2Q11 and,
lower government spending growth rate next year, as                                            a er allowing for some passive balance sheet tightening,
some moderation in federal spending will meet less weak-                                       it will only proactively raise rates in early 2012. This kind
ness from local governments. We expect the Bush tax cuts                                       of monetary support will be necessary to avoid the in a-
to be extended in 2011; however, one of the key risks to                                       tion rate from slipping even further. While we expect in-
our outlook for the year is a bigger scal drag on growth.                                        ation to rise moderately in 2011, we think the risk is for
So the key question remains: Will consumer purchasing                                          a fairly at in ation rate throughout the year.
power be potent enough to keep the train rolling?
                                                                                               Thomas Berner, CFA, Analyst
Trends signal sustainable consumption growth
First, labor income gauges have already visibly reacted to


Fig. 1: A er inventory boost Înal demand to drive growth                                       Fig. 2: CPI inÏation poised to rise in 2011
US real GDP growth, q/q annualized, in %                                                       US inflation (Consumer Price Index), year-over-year, in %

  10
                                                                                                6

     5                                                                                          4

     0                                                                                          2

  -5                                                                                            0

 -10                                                                                           -2
         2005       2006        2007          2008       2009          2010          2011      -4
          Consumption                                Investment in nonresidential structures
          Investment in equipment & soware          Residential investment                      2000        2002       2004           2006         2008         2010
          Inventories                                Net exports                                    CPI        Core CPI
          Government                                 Real GDP (% q/q annualized)
                                                                                               Note: Shaded region represents UBS WMR forecasts. Source: Thomson Datastream, UBS
Source: Thomson Datastream, UBS WMR, as of 2 December 2010                                     WMR, as of 3 December 2010


20       2011 Outlook
Global Economic Outlook
The big divide

The recovery in Europe stands on more solid                         pressures could continue to mount, even though the
ground, but it is still worryingly uneven between                   People’s Bank of China has been tightening policy. At
the core and peripheral countries. Chinese growth                   some stage, Chinese monetary policy will be confronted
will continue to lead the rest of Asia as well as com-              with the impossibility of having capital mobility, a xed
modity-supplying countries – but with inÏation ris-                 exchange rate and an independent (and hence
ing, tougher choices lie ahead. In Japan, 2010 is                   in ation- ghting) central bank all at the same time.
ending with a whimper but the recovery should                       Which of the three objectives will have to be abandoned
continue.                                                           will be one of the most important questions for 2011.
                                                                    Brazil has already introduced capital controls, and some
Europe: strong at the core, so on the outside                       Asian countries are starting to implement similar mea-
As the European debt crisis is not over yet, nancial mar-           sures. In our view, given the objective of the 12th Five-
kets are increasingly dividing the region’s debt into               Year Plan to reorient the Chinese economy from export-
“safe” and “unsafe.” In Germany and other successful                led growth to spur domestic demand, the ongoing real
European nations, export-fueled growth has now spilled              appreciation pressures on the Chinese yuan will be met
over to domestic demand, leading to virtuous growth                 partly by higher in ation and partly by letting the cur-
cycles. These economies could use higher interest rate              rency appreciate.
levels from the European Central Bank (ECB) to cool
growth – in stark contrast to a still depressed Southern            Japan: modest recovery should resume
Europe, where even a 1% ECB policy rate is too high.                Japanese exports slowed in the second half of 2010 as
The ECB will have to manage this situation cautiously, as           the stronger yen made it dif cult for Japanese factories
every rate hike could trigger further tensions in the euro-         to compete. In addition, domestic auto sales dropped
zone. Switzerland remains a safe haven investment, and              sharply a er the end of a government incentive scheme.
interest rates are likely to increase there, as well as in          However, these negatives should prove temporary. We
Sweden and Norway.                                                  expect the recovery to resume in 2011, especially if the
                                                                    yen weakens in line with our forecasts.
The impossible trinity in emerging markets
China continues to pull ahead a er successfully cooling             Thomas Berner, CFA, Analyst

down its economy in spring 2010, and growth in Asia is
likely to be solid as we go forward. However, in ation


Fig. 3: Healthy, sustainable level of manufacturing activity        Fig. 4: InÏation resurgence a key risk in some countries
Global real activity, standardized (mean=0, standard deviation=1)   Global CPI inflation rates, year-over-year, in %

 3                                                                  10
 2                                                                   8
 1                                                                   6
 0                                                                   4
-1                                                                   2
-2                                                                   0
-3                                                                  -2
-4                                                                  -4
  1998       2000      2002    2004      2006     2008       2010     1998       2000         2002       2004       2006         2008   2010
     US        Eurozone     UK      Japan     China                       US       Eurozone       UK        Japan       China
Source: Bloomberg, UBS WMR, as of 3 December 2010                   Source: Thomson Datastream, UBS WMR, as of 2 December 2010


                                                                                          Investment Strategy Guide December 2010          21
Economic Outlook: Chartbook
Fig. 5: Housing recovery likely to be lackluster                                          Fig. 6: House prices to fall again moderately in 2011
US housing market, left scale in % of GDP, right scale, in %                              US house prices, left scale in %, right scale in year-over-year %
 8                                                                                        4.0
                                                                                                                                                                               15
                                                                                  3.0
 6                                                                                        3.0
                                                                                                                                                                                5
                                                                                  2.0
 4                                                                                        2.0
                                                                                                                                                                               -5

 2                                                                                1.0     1.0                                                                                -15

 0                                                                                0.0     0.0                                                                                -25
  1950          1960         1970        1980         1990         2000   2010                         1980       1985      1990       1995       2000       2005     2010
          Residential real estate investment (lhs)                                                  Homeowner vacancy rate (lhs)
          Residential real estate investment (historical average) (lhs)                             S&P/Case-Shiller house price index (rhs)
          Homeowner vacancy rate (rhs)                                                              FHFA house price index (rhs)

Source: Thomson Datastream, UBS WMR, as of 3 December 2010                                Source: Thomson Datastream, UBS WMR, as of 3 December 2010


Fig. 7: Credit health has normalized                                                      Fig. 8: Net wealth has recovered, savings rate stabilized
US credit health (level) and real activity (level, inverted scale)                        US household net wealth and savings rate, in % of dispsable income
                                                                                                                                                                               3.5
105                                                                              10       14
                                                                                 20       12                                                                                   4.0
103                                                                              30       10
                                                                                                                                                                               4.5
                                                                                           8
                                                                                 40                                                                                            5.0
101                                                                                        6
                                                                                 50
                                                                                           4                                                                                   5.5
 99                                                                              60        2
                                                                                 70                                                                                            6.0
                                                                                           0
 97                                                                              80       -2                                                                                   6.5
   1975    1980       1985    1990            1995   2000      2005      2010               1950           1960        1970         1980        1990         2000       2010
    US credit health thermometer (lhs)          ISM Manufacturing PMI (rhs)                     Savings rate (lhs)            Net wealth to disposable income ratio (rhs)

Note: For full explanation of this chart, please see appendix.                            Note: Right scale is inverted
Source: Thomson Datastream, UBS WMR, as of 3 December 2010                                Source: Thomson Datastream, UBS WMR, as of 3 December 2010


Fig. 9: Federal deÎcit poised to narrow further                                           Fig. 10: Current Fed forecasts imply USD 580bn in purchases
US Federal budget balance, in % of GDP                                                    Estimated Treasury purchase amount, in USD billion

     4                                                                                    3,500                                                                        NAIRU est:
                                                                                          3,000                                                                              5.30
     0                                                                                                                                                                       5.50
                                                                                          2,500
                                                                                                                                                                             5.70
                                                                                          2,000                                                                              5.90
  -4
                                                                                          1,500                                                                              6.10
  -8                                                                                      1,000
                                                                                            500
-12
                                                                                                0
   1968           1978             1988                      1998            2008
                                                                                                    8.5     8.7      8.9      9.1     9.3      9.5     9.7     9.9
    US federal budget balance as a % of GDP
                                                                                          Note: QE2 Treasury purchase amount assuming Taylor rule approach and inËation forecast
Note: Sum of monthly federal budget balance over the past 12 months divided by current-   of 1.4%. NAIRU stands for Non-Accelerating InËation Rate of Unemployment
quarter annualized nominal GDP. Source: Bloomberg, UBS WMR, as of 3 December 2010         Source: UBS WMR, as of 3 December 2010


22       2011 Outlook
Financial Market Performance

Fig. 1: Asset Classes                                                       Fig. 2: International Equity Markets
Total return in USD and %                                                   Total return in USD and %

           US Equities                                                                  US Equity
 Non-US Dev. Equities                                                        Non-US Developed
          EM Equities                                                                        EMU
     US Fixed Income
                                                                                               UK
 Non-US Fixed Income
                                                                                            Japan
          Cash (USD)
                                                                              Emerging Markets
         Commodities
                                                                                                   -10%       -5%         0%   5%    10%       15%   20%
                      -5%          0%         5%        10%     15%   20%
     year-to-date         quarter-to-date                                           year-to-date        quarter-to-date


Source: Bloomberg, UBS WMR, as of 7 December 2010                           Source: Bloomberg, UBS WMR, as of 7 December 2010


Fig. 3: International Fixed Income                                          Fig. 4: International Equity Markets
Total return in USD and %                                                   Total return in USD and %

     US Fixed Income                                                          Large Cap Value
                                                                             Large Cap Growth
 Non-US Fixed Income
                                                                                       Large Cap
                    EMU
                                                                                        Mid Cap
                     UK                                                                Small Cap
                Japan                                                                      REITs

                      -10% -5%           0%        5%     10%   15%   20%                          0%         5%        10%    15%   20%       25%   30%
     year-to-date        quarter-to-date                                            year-to-date          quarter-to-date


Source: Bloomberg, UBS WMR, as of 7 December 2010                           Source: Bloomberg, UBS WMR, as of 7 December 2010


Fig. 5: US Fixed Income                                                     Fig. 6: Currency appreciation vs. USD
Total return in USD and %                                                   Appreciation vs. USD in %

      Treasuries                                                             EUR
             TIPS                                                            GBP
        Agencies
                                                                              JPY
   IG Corporates
  HY Corporates                                                              CAD
       Preferreds                                                            CHF
      Mortgages                                                              AUD
  EM Sovereigns
                                                                             BRL
 Municipal bonds

                -4% -2% 0% 2% 4% 6% 8% 10% 12% 14% 16%                          -10%          -5%           0%                 5%        10%         15%
     year-to-date    quarter-to-date                                             year-to-date    quarter-to-date


Source: BoAML, UBS WMR, as of 7 December 2010                               Source: Thomson Datastream, UBS WMR, as of 7 December 2010


                                                                                                        Investment Strategy Guide December 2010        23
Asset Classes
Equities to outperform bonds in 2011

Equities are on track to outperform bonds by a mar-                                           below their long-term averages. And, as discussed by
gin in 2010. As the global recovery moves into a                                              Mike Ryan in the lead article, we do not expect P/Es to
more sustainable expansion phase, we believe that                                             fully converge to these averages during the course of
equities have the potential to post higher returns                                            2011; given ongoing macro and scal uncertainties, even
than bonds over the next year. Therefore, we up-                                              a partial convergence could lead to equity market returns
grade equities to a tactical overweight and reduce                                            in excess of those achievable in other asset classes.
Îxed income to underweight.
                                                                                              Overall, the cyclical and earnings picture should pro-
Just a year ago, there was much talk of the “Lost De-                                         vide a supportive environment for equities. We expect
cade” in reference to the 2000-2009 period during which                                       earnings growth to decelerate in 2011. This is to be ex-
bond markets massively outperformed stocks. Mean-                                             pected as the earnings growth just shy of 40% which
while, a few weeks before the end of the year, stocks are                                     2010 is set to deliver can hardly be repeated without sig-
on track to outperform bonds for the second year in a                                         ni cant pro t margin expansion. Yet, we expect some
row, though the margin is thinner this time around. As                                        modest margin expansion combined with revenue
2011 approaches, we are turning more constructive on                                          growth to generate earnings growth in the high single
equities than we have been during the last three                                              digits to low double digits depending on the market. And
quarters.                                                                                     while bottom-up consensus earning estimates have
                                                                                              moved ahead of these gures, indicating some potential
First, we believe that equity valuations are moderately                                       for downward earnings revisions, the gap is not unusually
attractive. While the valuation gap is by no means com-                                       large and is not a cause for concern, in our view.
parable to the 50% upside potential that existed at the
bottom of the market in March 2009, we consider global                                        Finally, as far as timing and sentiment factors are con-
equities to be trading at about 6% below fair value. Equi-                                    cerned, we consider the current situation as fairly bal-
ties’ appeal is especially noticeable when compared to                                        anced for equities. The sentiment of individual investors
their main alternative, namely bonds. As Figure 4 indi-                                       has been improving over the last three months, suggest-
cates, the earnings yield on global equities exceeds the                                      ing that a gradual reengagement into equity markets
yield on global bonds by a margin that has only been sur-                                     may be in the making (see Fig. 6). This is compounded by
passed 5% of the time during the last 20 years. Price/                                        the Federal Reserve’s latest quantitative easing program
earnings ratios (P/E) across the major equity markets are                                     (QE2) which should entice some investors with cash ow


Fig. 1: Asset class preference                                                                Fig. 2: Asset class and regional preferences
Tactical deviations from benchmark                                                            Tactical deviations from benchmark
                                                                              Short-term
                                                                              bias
                                                                                                             US Equity
                                                                                               Non-US Developed Eq.
         Equity
                                                                                                Emerging Market Eq.
 Fixed Income                                                                                        US Fixed Income

         Cash                                                                                   Non-US Fixed Income
                                                                                                          Cash (USD)
 Commodities
                                                                                                         Commodities
                   –––      ––            –   n     +       ++   +++                                                     –––       ––            –   n   +   ++     +++
                  Underweight                                Overweight                                                  Underweight                         Overweight

Note: Black arrows indicate changes as of this report. Thick white arrows indicate a short-   Note: Arrows indicate changes as of this report.
term bias. Source: UBS WMR, as of 8 December 2010                                             Source: UBS WMR, as of 8 December 2010


24    2011 Outlook
Asset Classes


needs to look for better alternatives than low-yielding                      demand growth arising from the global expansion is
bonds in dividend-yielding portions of the stock market.                     likely to create some scarcity in selected areas such as
Among institutional investors, sentiment has been im-                        crude oil, some base metals and parts of the agricultural
proving as well without being euphoric. While risks aris-                    complex. This should create upward pressure on spot
ing from the European sovereign debt situation do pose                       prices. Yet for diversi ed commodity exposure such as
signi cant challenges, barring a dramatic worsening of                       that provided by the DJ UBS commodity index, the poten-
the situation over there, we believe that more evidence                      tial for price appreciation should be limited to around
that a gradual economic expansion is on course will likely                   10%. Moreover, investors are unlikely to reap such re-
lead to further sentiment improvement.                                       turns. Total returns to investors who typically invest di-
                                                                             rectly or indirectly (through funds) via nancial futures are
Low returns at best in bond markets                                          also determined by the term structure of future prices.
Even a er their most recent rise, bond yields are hovering                   These tend to be in what is known as a “contango”
near historical lows. We see very limited value in bond                      structure, where futures prices decline as they come close
markets, even though we do not expect a signi cant sell-                     to maturity. This means that a substantial portion of the
o in the near term. While we believe that Fed policy will                    spot return is already re ected in futures prices and will
anchor yields at low levels for most of 2011 and expect a                    de facto be eaten away, leaving only moderate total re-
largely range-bound yield environment, returns from cou-                     turns. For an overview of our preferred sectors within the
pon clipping are hardly a compelling reason to invest in                     commodity space, please consult the section on page 42.
bonds at this stage. Moreover, should the economy start
to gather steam at a greater pace than we expect, bonds                      Stephen R. Freedman, PhD, CFA, Strategist
could come under pressure. Overall, we view bonds as
unattractive, with risks clearly skewed to the downside.
As a result, we have downgraded xed income to a tacti-
cal underweight in our model portfolios.

Commodities o er selected opportunities
We see selected opportunities within commodity mar-
kets, although we are not aggressively recommending
entering the asset class at this stage. We believe that


Fig. 3: Asset class scorecard                                                Fig. 4: Stocks present signiÎcant yield advantage over bonds
Scores range from -3 (very unattractive) to +3 (very attractive)             Global earnings yield and global bond yield, in %

                      Valuation       Cyclical        Timing       Overall    12                                                                               12
Global Equities              +1            +1             +0           +1     10
                                                                                                                                                               9
Commodities                   –1            +1            +0           +0      8
Fixed Income                  –2            –1            +0           –1      6                                                                               6
                                                                               4
                                                                                                                                                               3
                                                                               2
                                                                               0                                                                               0
                                                                                1990         1994          1998          2002          2006             2010
                                                                                   Global bond yields, BarCap Global Aggregate, Yield to Worst, (lhs)
                                                                                   Global earnings yield, MSCI AC World, inverse P/E ratio, (rhs)


Source: UBS WMR, as of 8 December 2010                                       Source: Bloomberg, IBES, UBS WMR, as of 6 December 2010


                                                                                                    Investment Strategy Guide December 2010                        25
Asset Classes: Chartbook

Fig. 5: Leading indicators imply 12% global stock return                                  Fig. 6: Improving individual investor sentiment
MSCI World total return and OECD leading indicators, in %                                 AAII net bullish sentiment (individual investor survey)
60                                                                                 15       60
                                                                                                                                           Individual investors bullish
                                                                                   10
30                                                                                          30
                                                                                     5
  0                                                                                  0        0
                                                                                     -5
-30
                                                                                   -10     -30
-60                                                                                -15                     Individual investors bearish
                                                                                           -60
     1970 1975 1980 1985 1990 1995 2000 2005 2010
                                                                                               2000          2002          2004         2006           2008           2010
        MSCI World, YoY Total Return, (lhs)                                                      Net bullish sentiment       3-month average
        OECD Composite Leading Indicator, Trend Restored YoY, (rhs)                              Long-term average           Last data point

                                                                                          Source: American Association of Individual Investors, Bloomberg, UBS WMR, as of 2
Source: Bloomberg, UBS WMR, as of 6 December 2010
                                                                                          December 2010

Fig. 7: Still some equity upside according to cyclical playbook                           Fig. 8: Earnings momentum still positive but slowing
Average cycle since mid-1940’s around market bottoms (month “0”)                          12-month forward Earnings-per-share, normalized Apr-08=100
 160                                                                               65      120
                                                                                   60      100
 140
                                                                                   55       80
 120
                                                                                   50       60
 100                                                                                        40
                                                                                   45
                                                                                            20
  80                                                                               40
                                                                                              Apr-08         Oct-08         Apr-09        Oct-09         Apr-10           Oct-10
          -24 -20 -16 -12 -8 -4      0    4       8 12 16 20 24 28 32 36
                                                                                                  US                        UK                         EMU
           S&P 500       Trailing real earnings      ISM Manufacturing PMI (rhs)                  World                     Japan                      Non-US developed
                                                                                                  Emerging Markets
Source: Thomson Financial, Bloomberg, UBS WMR, as of 6 December 2010
Note: Vertical line shows number of months since March 2009 market bottom.                Source: IBES, UBS WMR, as of 6 December 2010


Fig. 9: Commodity total returns a ected by negative roll yield                            Fig. 10: Investors already have long positions in commodities
DJUBS Commodity index, return components, in %                                            Futures contracts (non-commercial) and net long as a % of open interest

  60                                                                                      2,500,000                                                                           25

  30                                                                                      1,500,000                                                                           15

      0                                                                                      500,000                                                                           5

 -30                                                                                        -500,000                                                                          -5

 -60                                                                                      -1,500,000                                                                          -15
    2000             2002          2004            2006       2008            2010                  2000         2002        2004         2006        2008        2010

            Spot return YoY        Excess return YoY         Roll yield YoY                       Long        Short          Net          Net long / open interest (rhs)


Source: Bloomberg, UBS WMR, as of 6 December 2010                                         Source: Bloomberg, UBS WMR, as of 6 December 2010


26        2011 Outlook
Foreign Exchange
Diversify carefully out of the US dollar

The US dollar has seen tremendous volatility, end-                       The euro is also not a favorite
ing the year weaker than it started and on a down-                       The euro is not the best alternative to the dollar, al-
ward trajectory. We expect the dollar to remain un-                      though some export-oriented countries will likely do very
der pressure, but the other major currencies — the                       well. Europe is challenged by members struggling to ser-
euro, the British pound and the Japanese yen — are                       vice their debts, exposing deep structural troubles within
also struggling. The profound weakness of the ma-                        the eurozone. These troubles hurt the euro’s viability as a
jor reserve currencies has pushed investors into the                     global reserve currency. We think a near-term crisis is un-
currencies of commodity producers and emerging                           likely, but expect that peripheral European countries will
markets. We expect this trend to continue, and en-                       continue to produce ugly headlines and volatility. We
courage US investors to add such exposure. That                          doubt the European Central Bank will hike rates next
said, we do not expect a dollar crisis in the near                       year, thereby keeping the euro from gaining in yield at-
term, as the alternatives remain unattractive or too                     tractiveness. We expect EURUSD to uctuate in a broad
small to challenge the dollar’s role.                                    1.50–1.20 range. Europe’s debt problems limit the euro’s
                                                                         rise above 1.50, and if it approaches 1.20, we expect
QE2 is not the dollar’s friend                                           dollar-rich Asian and Middle Eastern investors will un-
The Federal Reserve’s implementation of additional quan-                 wind their greenback exposure.
titative easing (QE2) hurts the dollar as a “safe” currency.
Before QE2, the dollar tended to fall when global eco-                   Diversify on dips
nomic conditions improved, as risk aversion fell and equi-               We continue to advise investors to seek alternatives to
ties gained (see Fig. 9 on page 31). Now, however, the                   the dollar and euro. Given the strength of alternatives
Fed has indicated it will increase money supply in adverse               (see Fig. 1) such as the Australian dollar or the Swiss
times. As a result, when the global economy rises, the                   franc, we recommend investors add these currencies on
dollar is likely to weaken because other countries o er                  any dips. Although buying into weakness carries down-
better growth — and when the economy falters, inves-                     side risk, we expect these currencies to appreciate over
tors could ee the US dollar as the Fed prints more                       the long term. Additionally, diversi ed investments in the
money. Since increases in interest rates in 2011 are                     smaller developed world and in emerging market curren-
unlikely, the US dollar is likely to continue on a down-                 cies may be prudent.
ward path.
                                                                         Katherine Klingensmith, Strategist


Fig. 1: Australian dollar and Swiss franc showing strength               Fig. 2: Low rates may keep pressure on US dollar
AUD/USD and CHF/USD exchange rates                                       Valuation according to PPP versus 3-month interest rate

 1.1                                                                                                     50
                                                                                                                       Expensive
                                                                                                                                                              AUD
                                                                                                         40
                                                                           Valuation according to PPP


 1.0                                                                                                                                        NZD
                                                                                                         30
 0.9                                                                                                     20        CHF
                                                                                                         10                 EUR SEK
 0.8                                                                                                               JPY                NOK
                                                                                                          0                    CAD
                                                                                                                         GBP                      3-month interest rate
 0.7
                                                                                                        –10
                                                                                                                   USD
 0.6                                                                                                    –20
                                                                                                                       Cheap
   2005        2006       2007        2008          2009   2010   2011                                  –30
                                                                                                              –1   0           1      2     3          4             5
       AUD/USD         CHF/USD

                                                                         Note: As of 15 November 2010
Source: Bloomberg, UBS WMR, as of 7 December 2010                        Source: Fitch, Bloomberg, UBS WMR.


                                                                                                                    Investment Strategy Guide December 2010          27
International Equities
Continue to favor emerging markets

Within global equities, we continue to favor emerg-                 BRICs are attractive, but India’s valuations are
ing markets (EM). While they are no longer that                     stretched
cheap as they were, their strong economic growth                    Within EM, we tend to focus on the BRICs (Brazil, Russia,
potential gives them an advantage over developed                    India, China). With the exception of Russia, we expect
markets. We particularly like China, Brazil and Russia.             these countries to enjoy high economic growth rates for
For investors unwilling to invest in EM equities, we                many years to come. Rather than growth potential, the
suggest developed market stocks that can beneÎt                     main attraction of the Russian equity market is that it
from EM growth. The UK looks relatively attractive                  trades on very low valuations, which compensates for the
from this viewpoint. Eurozone equities are also at-                 risky political situation. China and Brazil o er an attrac-
tractive based purely on valuations, but we maintain                tive combination of reasonable valuations and high
a cautious view due to the ongoing public debt crisis.              growth. While we are optimistic on the long-term pros-
                                                                    pects for India, valuations have become stretched and we
Economic backdrop favors emerging markets                           see better opportunities elsewhere.
As we have stressed throughout the year, emerging
markets (EM) are still trading at a discount to developed           Indonesia is another country with a large population and
markets. We expect this gap to gradually disappear                  strong growth potential. Many analysts view it as the
leading to EM outperformance, especially given EM’s                 next country to look at a er the BRICs and we agree that
solid economic backdrop. Many developed countries are               it should do well in the long run. However, its valuations
facing large budget de cits and high government debt                currently look very expensive and we recommend avoid-
levels. Most will therefore start to tighten scal policy            ing this market. While Taiwan is a developed economy, its
despite less than solid economic conditions. While we do            equity market is usually included in EM. Around half of
not expect this to derail the economic recovery, the                the market capitalization is comprised of IT companies, a
majority of developed countries are likely to experience            sector we expect to outperform in 2011. Valuations are
below-average growth in 2011. In contrast, public                   reasonable, making Taiwan one of our favorite “emerg-
  nances in most EM countries are in good condition,                ing” markets.
requiring fewer tightening measures. The biggest eco-
nomic threat to EM is higher commodity prices, especially           Developed markets: moderate earnings growth
for food, which could cause in ation to accelerate and              In most developed markets we expect moderate earnings
require tighter monetary policy.                                    growth in 2011 a er the strong recovery in 2010. Eco-


Fig. 3: Equity Regions                                              Fig. 4: Regional equity valuations and earnings momentum
Tactical deviations from benchmark                                  12-month forward PE; 3-month change in 12-month forward consensus earnings

                                                                    24                                                                                 12
 Emerging Markets
                                                                    20                                                                                 10
              UK                                                    16                                                                                  8
  Other Developed
                                                                    12                                                                                 6
                                                                     8                                                                                 4
               US
                                                                     4                                                                                 2
            Japan                                                    0                                                                                 0
                                                                     -4                                                                                -2
         Eurozone                                                             US     Eurozone     UK   Japan   Emerging Canada Australia Switzerland
                                                                                                               Markets
                    –––        ––        –   n   +    ++      +++
                     underweight                     overweight           Price/Earnings ratio (lhs)   Earnings momentum, in % (rhs)

Source: UBS WMR, as of 8 December 2010                              Source: Citigroup, Bloomberg, UBS WMR, as of 6 December 2010


28   2011 Outlook
International Equities


nomic growth should be modest and in ation rates low,                              ongoing public debt crisis is a tail risk that is too big to
so that rapid revenue growth appears unlikely. Moreover,                           ignore. If the situation further deteriorates, it could begin
pro t margins are already high by historical standards.                            to impact economic growth and corporate earnings. The
While they could improve a bit further in 2011, at some                            euro could also drop further against the US dollar, hurt-
point competitive forces will kick in and limit margin ex-                         ing performance in dollar terms.
pansion. Earnings should expand at a moderate rate but
we see some risk that consensus earnings forecasts will                            Japan not as expensive as it used to be
prove to be too optimistic.                                                        Japanese equities are not as expensive as they used to
                                                                                   be. The equity market underperformed in 2010, and
We recommend an overweight position on the UK                                      cost-cutting e orts have o set some of the impact of the
but not the eurozone                                                               stronger yen. However, we do not see any particularly
Among the developed markets, the US does not look                                  good reason for US investors to put money into the Japa-
expensive from a historical point of view. Other countries                         nese market. A weaker yen would help boost corporate
have more favorable valuations at the moment. The UK                               earnings but reduce returns in dollar terms.
and the eurozone look the most attractive based on
valuations.                                                                        Other developed market equities upgraded to
                                                                                   neutral
The UK is embarking on a four-year scal austerity plan,                            Among the other main developed equity markets, eco-
which dampens its intermediate growth prospects. How-                              nomic conditions are relatively strong in Australia and
ever, from an equity point of view, it is key to note that                         Canada, with higher commodity prices providing a boost.
about 70% of the earnings of UK-listed large-cap com-                              We see potential in Australia due to its commodity
panies come from outside the UK, with a large exposure                             exposure and undemanding valuations. In contrast, Ca-
to rapidly growing EM. UK equities include mining com-                             nadian stocks are more expensive, o setting the appeal
panies and energy stocks that are bene tting from high                             from the growth in commodity-related earnings. Switzer-
commodity prices. We are therefore constructive on the                             land has also done reasonably well, avoiding the turmoil
earnings outlook, and view the cheap valuations as an                              in the eurozone. It o ers attractive valuations but its de-
investment opportunity.                                                            fensive sector composition may place its stock market at
                                                                                   a disadvantage.
While eurozone equity valuations are also attractive, the
                                                                                   Brian Rose, PhD, Strategist


Fig. 5: Emerging market valuations                                                 Fig. 6: Recent economic data better than consensus
12-month forward PE ratios; Price to book value ratios                             Economic surprise indices
 20                                                                            8    150

 16
                                                                                    100
                                                                               6
                                                                                     50
 12
                                                                                      0
                                                                               4
  8                                                                                 -50
                                                                               2   -100
  4
                                                                                   -150
  0                                                                            0
                                                                                   -200
          China         Brazil     Russia       India     Indonesia   Taiwan
      Price/Earnings ratio (lhs)   Price/Book value ratio (rhs)                       Jan-09                  Aug-09              Mar-10       Oct-10
                                                                                        US         Eurozone         UK        Japan      G10
Source: IBES, Datastream, UBS WMR, as of 6 December 2010                           Source: Bloomberg, as of 6 December 2010


                                                                                                         Investment Strategy Guide December 2010    29
International Fixed Income
Seek exposure to emerging markets
and commodity producers
Our views on international Îxed income are closely                  In Japan, government debt levels are extremely high,
linked to the outlook for foreign exchange rates.                   while bond yields are extremely low. The yen is also one
On balance, we view foreign bonds as equally at-                    of the few currencies that we expect to depreciate signif-
tractive to US bonds. However, we do see pockets                    icantly against the dollar, hence our view of Japan as one
of opportunity in minor foreign bond markets on                     of the least attractive bond markets.
currency grounds, including emerging markets and
commodity producers.                                                The UK currently o ers slightly higher 10-year govern-
                                                                    ment bond yields than the US, but the in ation rate is
With global bond yields near historical lows, appropri-             much higher. The Bank of England has maintained very
ately choosing among international xed income markets               loose monetary policy, and in ation is likely to remain
has become paramount. The relative performance of US                high relative to most other developed economies.
and non-US xed income investments is usually domi-
nated by exchange rate movements. As noted in the FX                Emerging markets and commodity producers rela-
section, we expect the dollar to remain under downward              tively attractive
pressure in 2011. Nonetheless, we recommend a neutral               In contrast to the developed economies, most emerging
tactical stance between US and non-US bonds. Our                    markets feature relatively healthy government nances.
benchmark measure of non-US xed income consists                     Higher growth rates and younger populations make it
largely of the eurozone, Japan and the UK, all of which             easier to keep budget de cits under control, and govern-
have weak currency and bond market fundamentals.                    ment bond ratings continue to trend higher. We also
                                                                    have a positive view on emerging market currencies. In
Developed economies struggling with deÎcits                         addition, many countries issue debt denominated in US
The ongoing public debt crisis in the eurozone has                  dollars, allowing exposure without exchange rate risk.
caused bond markets to become more volatile than                    However, investing in emerging market bonds is still risky,
usual. Greece and Ireland have already sought outside               which suggests diversifying across countries. We also see
help to deal with their debt. Portugal and Spain may be             opportunities in the bond markets of commodity produc-
next in line. Economic conditions in these countries re-            ers, such as Canada and Australia. They enjoy favorable
main poor and low tax revenues will make it very dif cult           currency prospects and o er higher yields than the US.
for them to narrow their budget de cits. The situation
may continue to weigh down European bond markets.                   Brian Rose, PhD, Strategist


Fig. 7: Fixed Income Regions                                        Fig 8: Japanese yields low despite high debt
Tactical deviations from benchmarks                                 Central government debt and 10-yr bond yields

                                                                    1,000                                                                                 3.5
     Other
                                                                                                                                                          3.0
                                                                      800
       US                                                                                                                                                 2.5
                                                                      600                                                                                 2.0
       UK                                                                                                                                                 1.5
                                                                      400
                                                                                                                                                          1.0
 Eurozone                                                             200
                                                                                                                                                          0.5
     Japan                                                              0                                                                                 0.0
                                                                         1996       1998      2000      2002         2004     2006      2008      2010
              –––      ––                –   n   +   ++       +++
                underweight                          overweight             Central government debt, JPY trn (lhs)          10-yr JGB yield, in % (rhs)

Source: UBS WMR, as of 8 December 2010                              Source: Bloomberg, UBS WMR, as of 6 December 2010


30    2011 Outlook
International markets: Chartbook

Fig. 9: Dollar and equities move in opposite directions                                       Fig. 10: Equity market rally continued in 4Q
USD nominal effective exchange rate and the S&P 500                                           Equity market returns in USD and local currency

110
                                                                                                Emerging Markets
                                                                                      1,600
100                                                                                                                           Japan
                                                                                      1,200
                                                                                                                                UK
  90
                                                                                      800
                                                                                                                              EMU
  80                                                                                  400
                                                                                               Non-US Developed
  70                                                                                  0                                 US Equity
      2000          2002        2004          2006          2008          2010
        USD nominal effective exchange rate (lhs)                                                                                  0           2          4            6            8          10
        S&P 500 Index (rhs)                                                                                      Quarter-to-date returns in USD     Quarter-to-date returns in local currency


Source: Bloomberg, UBS WMR, as of 6 December 2010                                             Source: Bloomberg, UBS WMR, as of 6 December 2010


Fig. 11: ProÎt margins heading for record highs                                               Fig. 12: Developing economies have better public Înances
Profits as % of sales, 2010-2012 are UBS forecasts                                            Government debt and budget deficit, as % of GDP
                                                                                                                  120
 20                                                                                                                                                                         2010
                                                                                                                  100
                                                                                               Government debt


 15                                                                                                                 80            2000

                                                                                                                    60
 10
                                                                                                                    40
  5
                                                                                                                                      2000        2010
                                                                                                                    20
  0                                                                                                                  0
   1992             1996             2000            2004           2008              2012                                0              2         4          6               8            10
        United States         Global         Euro Zone         Emerging          UK                                                                Budget deficit
                                                                                                     Advanced economies                       Developing Economies
Source: UBS, as of 7 December 2010                                                            Source: IMF, UBS WMR, as of 2 December 2010


Fig. 13: European debt market showing stress                                                  Fig. 14: Government bonds o ering low yields
10 year government bond yields, spread over Germany, in %-pts                                 10-year government bond yields, in %

 12                                                                                           6.0
 10                                                                                           5.0
  8
                                                                                              4.0
  6
                                                                                              3.0
  4
  2                                                                                           2.0

  0                                                                                           1.0
  Jan-09                    Aug-09                   Mar-10                  Oct-10                    2008                                  2009                    2010
         Portugal          Ireland          Greece          Spain                                                  US            EMU          UK         Canada

Source: Bloomberg, UBS WMR as of 6 December 2010                                              Source: Bloomberg, as of 6 December 2010


                                                                                                                                      Investment Strategy Guide December 2010                   31
US Equities: Sectors
Focus on fundamentals

With the economy now more clearly on a sustain-                            fund these upgrades by downgrading Utilities, Telecom
able growth path, we are entering a period where                           and Healthcare (see Fig. 2).
bottom up sector fundamentals will become the
primary driver of sector performance. This stands in                       Info Tech (overweight)—low expectations
contrast to the last three years when the business                         Tech is now our favored sector within the equity markets.
cycle was the more dominant force. We favor sec-                           We like the sector’s strong product cycle-driven growth
tors that will beneÎt from global growth.                                  outlook (think smartphones and tablets), emerging mar-
                                                                           kets exposure and strong balance sheets, suggesting that
Over the past few years we have pointed out that there                     substantial cash will likely be returned to shareholders.
can be big divergences in performance between cyclical                     Despite these positive attributes, the sector trades at only
and defensive sectors of the market based on important                     a modest 4% valuation premium to the overall equity
turning points in the business cycle. Not surprisingly, de-                market. With continued growth in the global economy,
fensive sectors outperform when business conditions de-                    we think this positions the sector to surprise on the up-
teriorate but cyclical sectors outperform when the econ-                   side. Within the sector we favor Tech Hardware & Equip-
omy rebounds. With the economy now on a more                               ment as well as So ware & Services. We are neutral on
sustainable, mid-cycle growth path, history suggests in-                   Semiconductors.
vestors should look beyond the simple cyclical versus de-
fensive trade and focus more on bottom up fundamen-                        Staples (overweight)—our favorite dividend play
tals for each sector. The divergence between cyclical and                  Consumer Staples is our most preferred defensive sector.
defensive sectors is most pronounced when markets are                      In light of the sector’s high emerging market exposure
either weaker or stronger than average (see Fig. 1). As                    and strong brands in domestic markets we believe the
we move into a period of more normal returns for equity                    sector should consistently grow earnings over the next
markets, therefore, the cyclical versus defensive trade                    several years. However, the shares trade at only a modest
becomes less important.                                                    valuation premium to the market. We believe this valua-
                                                                           tion premium will likely expand. In a low interest rate
With the US consumer recovering but still facing substan-                  environment, stocks with strong dividends are becoming
tial headwinds, we believe the sectors most leveraged to                   increasingly attractive. Consumer Staples companies o er
global growth are best positioned. As a result, we are                     the best combination of current dividend yield and future
upgrading Energy, Industrials, Tech and Materials. We                      dividend growth.


Fig. 1: Cyclical stance less important in “normal” markets                 Fig. 2: Sector fundamentals to matter more as cycle matures
Average performance of cyclicals and defensives by annual S&P 500 return   Tactical deviations from benchmark

 30                                                                                  Tech
                                                                            Cons Staples
                                                                                  Energy
 15
                                                                              Industrials
                                                                               Financials
     0
                                                                                  Utilities
                                                                              Healthcare
 -15                                                                           Materials
                                                                              Cons Disc
 -30                                                                            Telecom
                Negative          0-10%        10-20%          20%+                           –––        ––              –      n    +   ++        +++
         Cyclicals   Defensives                                                                underweight                                overweight

                                                                           Source: UBS WMR, as of 6 December 2010
Source: Bloomberg and UBS WMR, as of 3 December 2010                       Note: Arrows indicate ratings changes as of this report


32        2011 Outlook
US Equities: Sectors


Industrials (overweight)—utilization rebounding                 valuation metrics and is currently trading at a 15% P/E
We upgrade Industrials to overweight in light of likely         discount versus the overall market. However, with the
continued upside in capacity utilization, which should          large pharmaceutical companies facing patent expira-
drive further gains in margins and earnings. While capac-       tions on a substantial portion of their portfolios over the
ity utilization has recovered from trough levels, it is still   next few years, earnings growth will be sluggish. The
substantially below long-term averages. Within the sec-         sector is also grappling with the prospect of further gov-
tor, we prefer transportation companies which are ben-          ernment austerity measures in Europe and policy changes
e tting from both higher utilization and improving pric-        in the US in order to reduce long-term government de -
ing power.                                                      cit projections.

Energy (overweight)—oil prices to grind higher                  Materials (underweight)—not as leveraged to
It should be no surprise that the performance of the En-        emerging markets as you might think
ergy sector is highly correlated with oil prices. With our      We upgrade the Materials sector but stay moderately
generally favorable outlook for oil prices—we expect            underweight. While certain parts of the sector should
crude oil prices to rise to USD 100 by the end of 2011—         bene t from increased global growth, the US materials
Energy stocks should enjoy a nice tailwind. We therefore        index is more leveraged to chemicals and agriculture
upgrade the sector to overweight. The sector is also lev-       products, rather than the industrial metals (such as iron
eraged to emerging market demand. Energy stocks may             ore and copper) that are in short supply in emerging mar-
deliver strong relative performance as the economic             kets. While agricultural products have seen strong pricing
recovery matures and spare capacity begins to decline.          gains, a strong harvest can easily turn prices lower.
Finally, an improvement in the outlook for re ning mar-
gins also supports our thesis.                                  Consumer Discretionary (underweight)—be selective
                                                                We prefer the Autos & Auto Components industry group
Utilities (neutral)—nice yield, but…                            and are cautious on Retailing and Consumer Durables.
We downgrade Utilities to neutral from overweight given         New vehicle sales have recovered from their trough, but
the sector’s limited exposure to global growth. We still        remain at a depressed level and should improve over the
project moderate earnings growth for the regulated              course of the next 2-3 years. The recent strong initial hol-
group. However the glut of generating capacity will only        iday sales results have boosted the shares of retailers and
slowly be worked o and power prices will likely remain          durables companies but valuations for these groups look
low, limiting earnings gains for the less regulated power       stretched. Our forecast for further increases in crude oil
generators. Sector valuation is fair.                           prices could become problematic for both groups. We
                                                                are neutral on the Media and Consumer Services groups.
Financials (neutral)—credit bubble hangover
As the economic recovery grinds higher, credit provisions       Telecom (underweight)—still structural headwinds
should continue to improve, boosting bank earnings.             While the Telecom sector sports attractive dividend yields,
However, loan growth will likely remain sluggish in the         we are concerned about the continued secular decline in
face of a tepid recovery in housing. In addition, regula-       wireline revenues and the competitive pressures in wire-
tory uncertainty is likely to continue to are up from time      less. With ve or more wireless networks in all major
to time. Within Financials we prefer the diversi ed nan-        markets, pricing pressure should remain a headwind de-
cials industry group which has the most attractive valua-       spite the strong growth in smartphones and wireless data
tions, while we are underweight the real estate sector          usage. Potentially higher interest rates are also a concern.
given high valuations and potentially rising interest rates.
                                                                Jeremy A. Zirin, CFA, Strategist, David Le owitz, CFA, Strategist,
                                                                Joe Sawe, Strategist
Healthcare (underweight)—patent cli still looms
The Healthcare sector looks inexpensive on most

                                                                                   Investment Strategy Guide December 2010           33
US Equities: Size & Style, REITs
Going for growth

We strongly favor growth over value but don’t                                    more convinced of the sustainability of the economic
think size will be a major driver of performance.                                recovery, our more favorable view on equity markets
REIT outperformance cycle appears to be over.                                    should provide a tailwind for small- and mid-cap stocks.
                                                                                 The rolling 2-year beta of small-caps is 1.23, implying
‘Tis the season for small-caps?                                                  stronger relative performance during periods of rising
Small- and mid-caps delivered impressive performance in                          markets. Second, corporations have excess cash which
2010, outpacing the gains from larger US companies.                              should support a pickup in M&A activity, bene tting
Keep in mind that smaller companies typically outper-                            smaller companies, which tend to be targets. Third, small-
form larger ones — the Russell 2000 small-cap index has                          cap earnings trends have improved over the past two
delivered stronger annual performance over the Russell                           quarters. And tactically, seasonality favors small-cap, as
1000 large-cap index 60% of the time since 1979 by an                            they typically outperform during the three-month period
average of 1.5 percentage points per year. This is not a                         from December to February and generally have stronger
market anomaly but simply the interplay between risk                             relative performance during the rst half of the year (see
and return. Small-cap returns are higher than large-caps                         Fig. 4).
in the long-run, but the volatility of those returns — and
hence the risk to investors — is higher.                                         Growth is taking o —growth stocks are, that is
                                                                                 While economic growth is only mildly re-accelerating fol-
We are closing our small-cap underweight and moving to                           lowing the “so patch” in summer 2010, the Russell
a benchmark stance across the capitalization spectrum.                           1000 Growth index has signi cantly outperformed the
Many of our arguments favoring large-caps actually re-                           Russell 1000 Value index over the past several weeks (see
main in place: large-caps are still inexpensive compared                         Fig. 5). We expect this trend to continue into 2011.
to both small- and mid-caps; larger companies have
greater exposure to faster-growing emerging economies                            Indicators continue to favor growth. As we have o en
and con dence surveys still show a divergence in the                             discussed, sector tilts strongly in uence the relative call
outlook that favors larger corporations.                                         between growth and value. Fig. 6 illustrates how it all
                                                                                 boils down to the prospects for Technology (pro-growth)
But several factors now suggest a more favorable back-                           versus Financials (pro-value). Since 1993, the correlation
drop for the smaller size segment. First, increased inves-                       between the relative performance of Tech versus Finan-
tor risk appetite favors small-caps. As we have become                           cials and the relative performance of growth versus value


Fig. 3: Favor Large-cap Growth                                                   Fig. 4: Seasonal trends favor small-caps
Tactical deviations from benchmark                                               Average index performance since 1979, in%

                                                                                  10
 Large-Cap Growth
                                                                                   8
            Mid-Cap
                                                                                   6
          Small-Cap
                                                                                   4
     Large-Cap Value
                                                                                   2
               REITs                                                               0
                          –––       ––            –       n   +   ++       +++                  First 6 months of year             Last 6 months of year
                          underweight                              overweight          Small-caps     Large-caps


Note: Arrows indicate ratings changes as of this report                          Source: Bloomberg and UBS WMR, as of 3 December 2010
Source: UBS WMR, as of 6 December 2010
34     2011 Outlook
US Equities: Size & Style, REITs


is a remarkably high 71%! By de nition, growth stocks                     try registered its strongest relative outperformance to the
are more expensive than value stocks. But growth is cur-                  S&P 500 in 2010 during the six-month period from April
rently also very cheap relative to value. Or said di erently,             to October. Why? Fig. 11 shows the path of the 10-year
the premium valuation that growth typically commands                      Treasury yield and the relative performance of the REIT
over value is much lower than normal. On average,                         industry group (to the S&P 500). Plunging interest rates
growth stocks have traded at nearly a 50% P/E premium                     — with the 10-year Treasury yield falling from 4.0% in
to value; today, that premium is just 18%.                                April to under 2.5% in October — pushed capitalization
                                                                          rates lower and thus property valuations were well sup-
To demonstrate this with real life examples, we examine                   ported. Additionally, REIT short interest began the year at
the average valuation premium that investors have been                    very elevated levels. This rare combination of improving
willing to pay for past “market darlings.” We selected                    economic fundamentals and falling interest rates, com-
one representative large-cap growth stock from the early                  bined with high short interest, proved to be the perfect
1990s (Coke), the late 1990s (P zer) and earlier this de-                 cocktail for REIT outperformance in 2010.
cade (Cisco) and compared the P/E valuation premiums
that each commanded relative to the S&P 500 to Apple,                     But the landscape is shi ing. The economy continues to
one of today’s most representative growth stocks. Apple                   chug along at a modest yet sustainably positive growth
is currently trading at a 24% premium versus the market                   rate but interest rates have backed up signi cantly over
while Coke, P zer and Cisco traded at average premiums                    the past two months. While we are not expecting inter-
of 67%, 72% and 104% respectively during their valua-                     est rates to surge further, we expect range-bound to
tion heydays.                                                             slightly higher rates in 2011, suggesting that the tail-
                                                                          winds REITs enjoyed during 2010 will not extend into the
Real Estate Investment Trusts (REIT) — falling rates                      new year. With relative REIT valuations at levels not wit-
no longer a tailwind                                                      nessed since the peak of the real estate cycle in 2007, we
In some respects, 2010 was the perfect backdrop for                       expect that REITs will lag the broad equity market in
REITs. Although economic growth was not exactly robust,                   2011.
slow and steady growth provided the necessary precondi-
tions for improvements in occupancy and rental rates and                  Jeremy A. Zirin, CFA, Strategist
                                                                          David Le owitz, CFA, Strategist
a leveling o in non-commercial mortgage delinquencies.
                                                                          Joe Sawe, Strategist
But despite the modest fundamental recovery, the indus-


Fig. 5: Growth is taking o                                                Fig. 6: Current “market darlings” P/E premium is low
Russell 1000 Growth index relative to Russell 1000 Value index            Average relative P/E premium over the S&P 500 P/E, in %

 105                                                                      120
                                                                          100
 102
                                                                            80
                                                                            60
  99
                                                                            40
  96                                                                        20
                                                                             0
  93                                                                               Coke: 1990 -      Pfizer: 1995 -      Cisco: 2000 -   Apple: Dec 2010
    Jan-10      Mar-10      May-10        Jul-10       Sep-10    Nov-10               1995              2000                2005
       Growth relative to Value

Source: Bloomberg and UBS WMR, as of 3 December 2010                      Source: FactSet and UBS WMR, as of 3 December 2010


                                                                                                Investment Strategy Guide December 2010               35
US Equities: Chartbook

Fig. 7: Cyclical vs. defensive valuations in line with history                       Fig. 8: Large-caps are inexpensive vs. small-caps
Relative P/E ratio — cyclicals vs. defensives                                        Large-cap relative to small-cap valuation

                                                                                       2
 2.0                                                                                                               Large-caps cheap relative to small-caps
                                                                                       1
 1.7
                                                                                       0
 1.4
                                                                                      -1
 1.1
                                                                                      -2
 0.8
                                                                                      -3
 0.5                                                                                                               Large-caps expensive relative to small-caps
    1973         1978      1983       1988        1993     1998    2003     2008      -4
          Relative P/E: cyclicals vs defensives          Average                        1985             1990          1995          2000              2005         2010


Source: DataStream and UBS WMR, as of 3 December 2010                                Source: Thomson Datastream, UBS WMR, as of 2 December 2010


Fig. 9: Growth vs. Value boils down to Tech vs Financials                            Fig. 10: Valuation favors Growth over Value
Relative performance of Growth vs. Value and Tech vs. Financials                     Relative premium, growth vs. value, since 1979, in %

 500                                                                          180     160

 400                                                                                  120
                                                                              150
 300
                                                                              120       80
 200
                                                                              90        40
 100

     0                                                                        60           0
       1993             1997            2001             2005        2009                         P/E Trailing      Price to Book     Price to Sales    P/E Forward (1yr)
          Tech vs. Financials (lhs)      Growth vs. Value (rhs)                             Current    Long-Term Average      Long-Term Average ex Tech Bubble


Source: Bloomberg and UBS WMR as of 3 December 2010                                  Source: Thomson Datastream, UBS WMR, as of 2 December 2010


Fig. 11: Falling rates no longer a tailwind for REITs                                Fig. 12: REIT relative valuation near peak levels
REIT relative performance to S&P 500 and 10-year T-Bond yield                        US REITs price to forward funds from operations relative to S&P 500 P/E

 130                                                                          2.25    1.6
                                                                                                                           REITs expensive
 120                                                                          2.75    1.2
 110                                                                          3.25
                                                                                      0.8
 100                                                                          3.75

  90                                                                          4.25    0.4
     Jan-10       Mar-10       May-10     Jul-10         Sep-10    Nov-10                                                  REITs inexpensive
          REIT relative performance to S&P 500 (lhs)                                  0.0
          10 Year T-Bond yield, in % (inverted, rhs)                                       1993             1997              2001             2005              2009

Source: Bloomberg and UBS WMR, as of 3 December 2010                                 Source: Bloomberg, SNL and UBS WMR, as of 3 December 2010


36       2011 Outlook
US Fixed Income
  The run is done: modest returns in 2011

   Our preference for credit over non-credit reÏects                         underweight allocations to Treasuries, TIPS, and Agencies
   our view that while absolute returns will likely be                       and have increased our underweight on Mortgages. We
   lower in 2011, Treasuries are apt to underperform                         look for the performance of Agency debentures and
   the credit-sensitive segments of the bond market.                         Agency mortgage-backed securities to be closely tied to
   In the aggregate, our overweight to credit now                            that of Treasuries, as their spreads have limited room for
   stands at +5%, o set by a 5% underweight on non-                          contraction, in our view.
   credit sectors. In the municipal market, we look for
   a modest uptick in default rates from very low his-                       Expect more modest returns
   torical levels. Systemic defaults are not expected,                       We believe double-digit total returns in credit are unlikely
   with the bulk of payment defaults likely occurring                        in 2011 as spreads have normalized to a large extent and
   in non-investment grade bonds and higher-risk sec-                        Treasury yields are likely to remain range-bound to
   tors such as land-based Înance, single-site hospi-                        slightly higher. If this interest rate path materializes, Trea-
   tals, multi-family rental housing and long-term care.                     suries are likely to produce at to slightly negative returns
   Finally, we recommend increasing duration to neu-                         for the year. Credit-related segments, on the other hand,
   tral, from underweight, based on our forecast for                         could continue to outperform Treasuries due to their
   range-bound to slightly higher Treasury yields.                           higher income streams and potential for additional
                                                                             spread-tightening, which we project will result in modest
   Asset allocation favors credit exposure                                   single-digit total returns. Overall, we look for the IG sec-
   For 2011, we are making several changes to our recom-                     tor to produce total returns of roughly 3-5% compared
   mended xed income asset allocation. We have increased                     to 7-9% for the HY segment.
   our preference for high-yield corporate bonds (HY) while
   trimming our exposure, though remaining overweight, to                    During the slow but stable recovery forecast by our econ-
   investment-grade corporates (IG). Our overweight posi-                    omists, credit spreads should continue to compress to-
   tioning on preferred securities is unchanged, while we                    ward long-term averages, though likely not reaching the
   have increased the allocation to dollar-denominated sov-                  tighter end of historical ranges. As a result, we see the
   ereign emerging market (EM) bonds, moving to modest                       potential for IG spreads to tighten by roughly 25bps
   overweight from neutral.                                                  while HY spreads may tighten by 75-100bps. Much like
                                                                             what was experienced in 2010, however, the path to
   Regarding non-credit sectors, we are maintaining our                      spread tightening is not likely to be linear but rather


   Fig. 1: USD Îxed income strategy                                          Fig. 2: Credit segments delivered double-digit returns YTD
   Tactical deviations from benchmark                                        Total return, in %

           Treasuries                                                                      Municipals
                TIPS                                                         EM sovereign bonds (USD)
            Agencies                                                                    HY corporates
           Mortgages
                                                                                           Preferreds
Inv. Grade Corporates                                                                    IG corporates
High Yield Corporates                                                                      Mortgages
   Preferred Securities                                                                      Agencies
       Emerg. Market
                                                                                                  TIPS
  Total TFI non-Credit                                                                      Treasuries
      Total TFI Credit
                          –––       ––        –   n   +       ++       +++                               -10    0      10      20     30   40   50   60
                                Underweight               Overweight
                                                                                 2009       2010 YTD

  Source: UBS WMR, as of 8 December 2010
                                                                             Source: BofA Merrill Lynch, UBS WMR, as of 3 December 2010


                                                                                                   Investment Strategy Guide December 2010           37
US Fixed Income


choppy, as macro-related headlines whipsaw market sen-                   performance. We forecast modest spread tightening that
timent. Against this backdrop, we expect HY spreads to                   should help to o set slightly higher Treasury yields. Issu-
exhibit higher beta characteristics both to the upside dur-              ance of new preferreds is likely to remain low as new
ing “risk on” periods, and to the downside, on “risk o ”                 bank regulations phase out the equity treatment previ-
periods.                                                                 ously awarded to hybrid securities. We look for many
                                                                         bank holding companies to eventually redeem many of
Aside from limited room for spread compression, we                       their trust preferreds, but view this more as a 2012-2013
view event risk as a possible reason for more limited re-                event. One of the main factors keeping us from being
turns on corporate bonds. Low absolute yields, limited                   more positive on preferreds is the continued uncertainty
growth opportunities and, in many instances, stagnant                    surrounding the European periphery, which will likely
equity prices may cause companies to pursue share-                       heighten the price volatility of European nancials that
holder-friendly initiatives. While share repurchases and                 represent roughly 25% of the preferred market.
dividend increases have been mostly implemented in a
manner that preserves credit metrics in recent years, we                 Add emerging markets (EM) exposure
would not be shocked to see these activities funded with                 We have also added credit risk by increasing our
new debt in 2011. Further, we look for a pickup in M&A                   allocation to dollar-denominated sovereign EM bonds to
activity given favorable nancing conditions. Although                    a +1% allocation from neutral. We believe that EM is
credit trends have been improving given strong balance                   likely to continue to outgrow the developed world.
sheets, a more aggressive nancial policy on the part of                  Expectations for the asset class in 2011 include
IG management teams could lead to a decline in credit                    mid- to high-single-digit total returns supported by rela-
quality and thus some spread widening in certain pockets                 tively strong fundamentals and modest net issuance of
of the market.                                                           debt. Among the risk factors that prevent us from being
                                                                         more aggressive in EM include economic instability in
Overweight preferred securities                                          Europe, which could translate into a repricing if risk aver-
We maintain our 1% overweight on preferred securities.                   sion were to rise and increased reliance on China as a
Similar to HY, we believe that the above-average coupon                  source for export growth, although the latter may be
payments that preferreds o er should help their relative                 more of a medium- to long-term issue.


Fig. 3: IG spreads remained range-bound for most of 2010                 Fig. 4: Steady decline in HY defaults implies tighter spreads
Investment-grade corporate bond spreads, in basis points                 HY credit spreads and default rates, in basis points

800                                                                       2000

600                                                                       1500

400                                                                       1000

200                                                                        500

     0
                                                                              0
      2005         2006          2007          2008        2009   2010
                                                                               1988         1992          1996          2000         2004          2008
       All IG Corporates      Industrial      Financials                          Spread       Default rate (issuer-based)

Source: Barclays Capital, UBS WMR, 6 December 2010                       Source: Deutsche Bank, Merrill Lynch, Moody’s, UBS WMR, as of 6 December 2010
                                                                         Note: Spread is based on Deutsche Bank data before 1997; Merrill Lynch a erwards


38     2011 Outlook
US Fixed Income


Interest rate outlook                                                  through June 2011, two-thirds mature in the 2- to 7-year
We expect interest rates to be range-bound for most of                 area. The size of the Fed’s purchase plan is equal to the
of 2011. Short-term yields in particular should have lim-              amount of gross issuance that the Treasury is likely to
ited upside, given the Fed’s commitment to keep the tar-               borrow. As a result, yields on Treasury bonds in the short
get federal funds rate low for an “extended period.” UBS               to intermediate maturity range should remain range-
economists do not foresee the rst increase in the federal              bound throughout most of the year. By year-end, we
funds rate until January 2012. We look for 3-month Libor               forecast the 10-year Treasury note to yield 3.25%. Given
to average 0.30% in H2 2011 before rising to 0.50% by                  our forecast for range-bound Treasury yields, we recom-
Q4 2012, as the market begins to price in expectations                 mend investors adopt a neutral duration exposure.
for Fed tightening. For investors holding positions in
money market funds, the Fed’s accommodative monetary                   Municipal bonds: a rough road ahead
policy implies that 2011 will be another year of record-               We expect the municipal bond market to exhibit less pre-
low interest rates.                                                    dictability in 2011. Since credit risk is higher, sources of
                                                                       credit enhancement are scarce and market liquidity is no
In addition to Fed policy, longer-term bond yields are in-             longer certain. Credit fundamentals will remain a key
  uenced by other factors, including the outlook for                   area of focus as state and local government issuers face
growth and in ation. Recently, the economic data have                    scal challenges throughout 2011 and beyond. Structural
met or exceeded analyst expectations. While this is wel-               budget imbalances, unfunded pension liabilities and the
come news that supports our base case for accelerating                 end of stimulus payments to states are likely to garner
growth in the year ahead, we see little on the horizon to              ongoing media attention pressuring credit quality spreads
push Treasury yields sharply higher. The output gap re-                wider, in our view. Against this backdrop, credit deterio-
mains wide and in ation pressures are likely to remain                 ration and ratings downgrades are likely to become more
subdued. Our economics team expects the unemploy-                      common. We expect headwinds for the broad muni mar-
ment rate to remain above 9% while they forecast a                     ket to linger for some time and believe credit pressure for
1.4% rise in the core Consumer Price Index.                            local governments will be more intense than at the state
                                                                       level.
The Fed’s asset purchase program will also help to tem-
per a rise in Treasury yields, in our opinion. Of the USD              We look for a modest uptick in default rates from very
600 billion in Treasury securities the Fed intends to buy              low historical levels. Systemic defaults are not expected,


Fig. 5: Prices exhibited wide trading ranges                           Fig. 6: EM debt trades roughly in line with US corporates
Preferred price changes YTD, in %                                      Credit spreads, EM sovereign debt and similarly rated US corporates, in bps
 25                                                                    1000
 20
 15                                                                     800
 10                                                                     600
  5
  0                                                                     400
 -5                                                                     200
-10
-15                                                                        0
  Jan-10       Mar-10      May-10        Jul-10     Sep-10    Nov-10        2006           2007           2008           2009           2010
       REIT Preferreds          Trust Preferreds      Non-US QDI              Corporate Index         Emerging Markets Bond Index
       DRD-Eligible             Floating-Rate

Source: Bloomberg, UBS WMR, as of 3 December 2010                      Source: BoA Merrill Lynch; JP Morgan; UBS WMR, as of 6 December 2010


                                                                                              Investment Strategy Guide December 2010                39
US Fixed Income


with the bulk of payment defaults occurring in                        focused on total returns, or who otherwise may need to
non-investment grade bonds and higher risk sectors                    sell their securities before maturity, will face greater chal-
such as land-based nance, single-site hospitals, multi-               lenges, in our view.
family rental housing and long-term care. Yet, as
discussed, it is possible that a general-purpose govern-              Back to basics
ment with a higher pro le may default in 2011. Essential              We believe investors will be best served by taking a back-
purpose revenue bonds in the water/sewer and public                   to-basics approach when constructing and reviewing mu-
utility sectors are likely to be among the most resilient             nicipal bond portfolios. Our key investment themes for
from a credit perspective. Bond insurance (which ac-                  2011 include: sticking to high-quality bonds, diversifying
counts for just 6.5% of the new issue market) is likely to            by state and sector and managing interest rate risk. Ex-
remain scarce, underscoring the importance of underly-                amples of high-quality bonds include: essential purpose
ing credit assessments.                                               revenue bonds in the water/sewer and public utility sec-
                                                                      tors, state general obligation bonds and transportation
We look for supply/demand dynamics to be less support-                agencies with well-established and demonstrably resilient
ive than in 2010. The ratio of tax-exempt supply to tax-              revenue streams.
able muni debt is likely to rise due to pending changes in
the taxable Build America Bonds (BABs) Program. At the                Anne Briglia, CFA, Strategist
same time, investor demand may so en on headline risk.                Barry McAlinden, CFA, Strategist
Changes to individual income tax rates, which have im-                Donald McLauchlan, Strategist
                                                                      Kathleen McNamara, CFA, CFP, Strategist
portant implications for investor demand, are still uncer-
                                                                      Michael Tagliaferro, CFA, Strategist
tain at this time. Over the year, we anticipate muni yields
to edge modestly higher from current levels and the yield
curve to remain relatively steep.

The persistence of a bifurcated market, given our expec-
tations for reduced liquidity for less frequently traded
bonds, is likely to create mispricing among credits o er-
ing income opportunities for investors that perform care-
ful credit analysis and monitoring. In contrast, investors


Fig. 7: US interest rate forecasts, in %                              Fig. 8: Yield curve is steep, while credit spreads are wide
                                                                      AAA, AA, A, BAA muni yield curves, in %
                                        in 3          in 6    in 12
                          8-Dec       months        months   months   6.0
 3-month LIBOR              0.30        0.30          0.30     0.50   5.0
 2-year Treasury           0.59          0.50         0.75     1.00   4.0
 5-year Treasury           1.85          1.50         1.75     2.00
                                                                      3.0
 10-year Treasury          3.24          2.75         3.00     3.25
                                                                      2.0
 30-year Treasury          4.43          4.25         4.25     4.50
                                                                      1.0
                                                                      0.0
                                                                            1        5           10          15          20         25   30
                                                                                AAA GO        AA GO          A GO          BAA GO


Source: Bloomberg, UBS WMR, as of 8 December 2010                     Source: MMD Interactive, UBS WMR, as of 2 December 2010


40    2011 Outlook
US Fixed Income: Chartbook

Fig. 1: Treasury yields to rise very gradually                                       Fig. 2: Credit rating trends have improved rapidly
Rate development and UBS WMR forecast, in %                                          Upgrades as a share of total ratings changes, in %

 7.0                                                                                  80
 6.0
 5.0                                                                                  60
 4.0
 3.0                                                                                  40
 2.0
                                                                                      20
 1.0
 0.0
                                                                                       0
    2000         2002          2004         2006           2008        2010
                                                                                        1990                1995             2000                2005                2010
       2-year Treasury note      10-year Treasury note        2011 forecast                High Yield          Investment Grade

Source: Bloomberg, UBS WMR, as of 29 November 2010                                   Source: Barclays Capital, UBS WMR, as of 6 December 2010


Fig. 3: Munis o er relative value opportunities                                      Fig 4: BABs accounted for about 26% of 2010 new issue supply
10-year AAA muni to Treasury yield ratio, in %                                       Taxable BABs new issue volume and market share

175                                                                                   35
                                                                                      30
150                                                                                   25
                                                                                      20
125                                                                                   15
                                                                                      10
100                                                                                    5
                                                                                       0
 75                                                                                          Jan-10       Mar-10          May-10       Jul-10        Sep-10     Nov-10
   2000          2002           2004          2006            2008            2010             BABs issuance, in billions      BABs/total muni issuance, in %


Source: MMD Interactive, UBS WMR, as of 3 December 2010                              Source: Thomson Reuters, UBS WMR, as of 3 December 2010


Fig. 5: TIPS breakeven inÏation rates                                                Fig. 6: European preferred yields have edged higher recently
                                                                                     Preferred yield, in %

 4.0                                                                                 10.0

 3.0                                                                                   9.0

 2.0                                                                                   8.0

 1.0                                                                                   7.0
                                                                                       6.0
 0.0
                                                                                       5.0
-1.0
                                                                                           Jan-10     Mar-10      May-10         Jul-10        Sep-10       Nov-10
    2006          2007           2008          2009           2010            2011
                                                                                             Non-US (QDI) Preferreds           Fully taxable trust preferreds
       5-year breakeven       10-year breakeven           30-year breakeven                  US DRD/QDI preferreds             Fully taxable senior notes

Source: Bloomberg, UBS WMR, as of 3 December 2010                                    Source: Bloomberg, UBS WMR, as of 6 December 2010


                                                                                                              Investment Strategy Guide December 2010                  41
Commodities
Moderate price gains in 2011
Following the sweet spot that commodities experi-                             Precious metals: high Înancial demand for now
enced in the last quarter of 2010, we believe there                           With in ationary pressures mounting in emerging mar-
is still potential for higher prices during 2011. None-                       kets and sovereign debt uncertainty intensifying, gold
theless, we believe that selectivity remains of the                           demand should trend higher and allow prices to reach
essence.                                                                      record levels. Investors’ search for real assets should pro-
                                                                              vide a solid bid. Other precious metals should manage to
Loose monetary policy and abundant liquidity should help                      see multi-decade highs as well. That said, a gold price
spur a reacceleration in commodity demand, especially                         move toward USD 1650/oz will take its toll on incremen-
from emerging markets. While developed world growth is                        tal jewelry demand and should represent an upper limit.
likely to remain moderate and bumpy, overall demand
should hold up. In addition, nancial investors in search of                   Base metals: selectivity is warranted
protection from currency and in ation risks are likely to                     Overall we expect base metal prices to rise, but only
favor commodities. Nonetheless, for broad commodity                           moderately. Attempts by the Chinese central bank to
exposures, the range of price gains we expect is unlikely                     cool the economy should limit the return potential of the
to exceed prevailing negative roll yields (arising when in-                   sector. We advise investors to stick with copper. The lack
vesting through commodity futures) by a wide enough                           of mining supply and structurally low inventories should
margin to warrant entering the asset class aggressively.                      pave the way for price moves toward USD 10000/mt.

Energy: ready to catch up a er a lost 2010                                    Agriculture: further rally in grains, pause in so s
Growing emerging market demand will drive down                                Grains should experience another round of higher prices,
OPEC spare capacity in late 2011. Considering slowing                         the key driver being corn, which bene ts from structurally
supply growth from non-OPEC countries, sliding inven-                         low inventories and lower yield per acreage. Soybeans
tories in the developed world and a more relaxed OPEC                         and wheat should experience positive spillover e ects,
stance toward higher prices, crude oil prices should                          since they compete with corn for acreage. We expect to
trade above USD 100/bbl in 2011. In contrast, natural                         see demand catch up with supply from a structural per-
gas prices should disappoint in the rst half of 2011 due                      spective driven by bio fuel and Asian demand. So com-
to ample US supply.                                                           modities (sugar, co ee, cotton and cocoa) should pause
                                                                              a er a fantastic rally in 2010 on improving supply.

                                                                              Dominic Schnider, Strategist


Fig. 1: Commodity market performance                                          Fig. 2: Commodity market performance
Total return in USD and %, commodity sectors                                  Total return in USD and %, selected commodities

        Livestock                                                                    Corn
            Sos                                                                 Soybeans
          Grains                                                                Aluminum
Precious metals                                                                    Copper
     Base metals                                                                 Crude Oil
          Energy                                                               Natural Gas
     Commodities                                                                     Gold

                -20% -10% 0%             10%      20%       30%   40%   50%               -50% -40% -30% -20% -10%                0%      10%   20%   30%
      year-to-date   quarter-to-date                                               year-to-date   quarter-to-date

Source: Bloomberg, DJ UBS, UBS WMR, as of 7 December 2010                     Source: Bloomberg, DJ UBS, UBS WMR, as of 7 December 2010


42     2011 Outlook
Alternative Investments
Diversi cation and beyond
Hedge funds                                                                       though many of these strategies in fact exhibit a net long
Overall, 2010 saw decent hedge fund performance                                   or short exposure to equity or debt markets. Fixed in-
in the higher single-digit returns. For 2011, we ex-                              come arbitrage funds tend to pro t from price anoma-
pect ongoing market volatility to provide attractive                              lies between related securities and/or bet on the evolu-
opportunities in selected parts of the hedge fund                                 tion of interest rate spreads. They are expected to bene t
space.                                                                            from arbitrage opportunities within the US Treasury mar-
                                                                                  ket emerging from dislocations that Fed quantitative eas-
Looking back, the second half of 2010 brightened up for                           ing policy is creating. Volatility arbitrage funds that, as
hedge funds. The third quarter (Q3) saw some attractive                           a group, tend to be long volatility are expected to have a
performance gains (5.2% industry-wide) bringing net as-                           challenging period as volatility remains low (the VIX has
set values close to their prior October 2007 peak. Q3 net                         been in the 20 to 25 range) and option values continue
capital in ows (USD 19 billion) were also the largest since                       to decay. Convertible arbitrage should continue to ben-
the end of 2007. The year-to-date (YTD) in ow for 2010                            e t from discrepancies and arbitrage opportunities be-
through Q3 of USD 42 billion brought industry assets un-                          tween convertible bonds and underlying stock and bond
der management to USD 1.77 trillion vs. global stock mar-                         markets irrespective of market movements.
ket capitalization of about USD 50 trillion.
                                                                                  Long/short equity fund managers are coming out of
In terms of hedge fund strategies, most of the in ows                             low net market exposure. They remain cautious and
were experienced in the relative value, event-driven and                          selective in building long positions. We expect that fun-
macro categories, while fund of funds actually saw an                             damental valuation-oriented managers may be better
out ow for the rst three quarters.                                                positioned to take advantage of sector rotations and
                                                                                  stock-speci c opportunities than technically driven
Outlook for the main hedge fund strategies                                        managers.
Relative value funds saw the largest in ows (USD 17
billion YTD) while their performance of nearly 10%                                Event-driven funds have been strong performers with
through October was ahead of the industry average. Be-                            YTD performance of 8.5% and USD 11.6 billion of new
cause they focus on capturing value from the relative                             capital through Q3. Plentiful cash on corporate balance
mispricing of related assets, these strategies can generate                       sheets, easy access to capital and increased optimism
returns independent of overall market movements, al-                              from company management are contributing to an up-


Fig. 1A: Performance of selected Hedge Fund strategies                            Fig. 1B: Performance of selected Hedge Fund strategies
Until 30 November 2010, in USD and %                                              Until 30 November 2010, in USD and %

      Equity Market Neutral                                                                 Merger Arbitrage
        Equity Hedge (Total)                                                       Distressed / Restructuring
   Fixed Income-Conv. Arb.                                                               Event-Driven (Total)
Fixed Income-Asset Backed                                                           Emerging Markets (Total)
    Fixed Income-Corporate                                                                      Macro (Total)
              Multi-Strategy                                                       Fund of Funds Composite
       Relative Value (Total)                                                     Fund Weighted Composite

                             -2     0      2      4      6     8   10   12   14                                -2     0      2     4      6      8   10   12   14
     year-to-date       quarter-to-date                                                year-to-date       quarter-to-date

Source: Bloomberg, UBS WMR, as of 30 November 2010                                Source: Bloomberg, UBS WMR, as of 30 November 2010
Note: All Êgures based on Hedge Fund Research’s HFRI indices                      Note: All Êgures based on Hedge Fund Research’s HFRI indices


                                                                                                          Investment Strategy Guide December 2010              43
Alternative Investments


tick in deal activity. Increasing company valuations could    on niche areas to deliver outperformance. All in all, we
make stock more attractive as an acquisition currency for     think that the LBO volume should continue to rise in
stock deals. Strategic buyers are expected to be more         2011. The debt market situation should remain support-
active than private equity sponsors, given easy capital       ive with interest rates unlikely to rise in the near term and
market nancing. Declining default rates are helping dis-      leverage relatively low.
tressed securities managers.
                                                              In terms of sectors we see energy as an excellent play. The
For credit strategies, opportunities are attractive from a    long-term secular trends in an industry that has experi-
fundamental perspective. However, there could be pres-        enced underinvestment may well provide a great backdrop
sures in the credit markets driven by technical factors, as   for energy-focused PE for the next decade.
new issuance remains solid. Credit risk appetite remains
strong going into the new year.                               We like emerging market-focused PE funds While it is
                                                              true that there will always be risks of asset price in ation
Macro strategies have somewhat underperformed the             and bubbles in countries in transition, especially within a
industry this year absent strong directional markets which    private fund’s 10-year life, the economic value creation
tend to bene t them. Most managers eschewed making            opportunity in these countries makes them a “must
strong bets. We expect this trend to persist going into       have” component of portfolios.
2011 and macro strategies, at least in the short term, to
continue underperforming.                                     As far as secondary private equity sales go, the last 24
                                                              months have been a disappointment. Secondaries as a
Private equity                                                group missed the boat in 2009 and then su ered a quite
While frozen credit markets created difÎcult condi-           competitive environment in 2010 given high demand for
tions for private equity in 2008 and early 2009, they         limited deal ow. However, the next 12 months will po-
have been very strong in 2010. We expect support-             tentially house a more active secondary environment.
ive credit market conditions to remain in place in
2011, which should provide a solid fundamental                Expectations for distressed corporate debt strategies
backdrop for private equity (PE).                             were high back in 2009. However, these did not entirely
                                                              come to fruition as credit quality improvements reduced
In the U.S. buyout market, transaction ow has im-             the availability of distressed securities. Unless the 2014
proved but it is nowhere close to the frenzied activity of    “wall of debt” in need of re nancing becomes a real
2006. Rebound in company valuations has been stronger         challenge, which we doubt, the prospects for this strat-
and faster than what was envisaged in early 2010; com-        egy are more muted.
pany sales by buyout funds have been strong as well, and
earnings growth has been supportive. Deal sizes have          In special situations/turnaround funds, the next leg of
been small and we expect most of the future activity to       the opportunity will be in more traditional turnaround
be in the middle market segment. We believe that, with        groups (focused on operational, not nancial, stress) and
exceptions, 2009-10 vintages of large buyouts may turn        also in groups focused on distressed nancial assets,
out to be relative disappointments with investors typically   where opportunities should arise from nancial companies
equating recession vintages with good returns. We also        unloading distressed assets from their balance sheets.
see much too much committed but undrawn capital
(around USD500 billion). With many funds just two or          For US growth capital, as the economic expansion pro-
three years away from the end of their investment pe-         ceeds, unlevered small company transactions can poten-
riod, we worry that acquisition valuations may get bid        tially be a great space in which to invest.
up, reducing future returns. In contrast, 2011 and 2012
vintages are expected to be better, with those that focus     Stephen Freedman, PhD, CFA, Strategist


44   2011 Outlook
Detailed asset allocation, with non-traditional assets (NTAs)

Investor                      Very conservative Conservative                                                                                                                                       Moderate                                                                          Moderate                                                                          Moderate                                                                          Aggressive                                                                        Very aggressive
Risk Pro le1                                                                                                                                                                                       conservative                                                                                                                                                        aggressive


                                           Cash                                   Equities                                   Cash                                   Equities                                   Cash                                   Equities                                   Cash                                   Equities                                   Cash                                   Equities                                   Cash                                   Equities                                   Cash                                   Equities
                                           Bonds                                  NTAs                                       Bonds                                  NTAs                                       Bonds                                  NTAs                                       Bonds                                  NTAs                                       Bonds                                  NTAs                                       Bonds                                  NTAs                                       Bonds                                  NTAs
                                                       WMR tactical deviation3


                                                                                                                                         WMR tactical deviation3


                                                                                                                                                                                                                           WMR tactical deviation3


                                                                                                                                                                                                                                                                                                             WMR tactical deviation3


                                                                                                                                                                                                                                                                                                                                                                                               WMR tactical deviation3


                                                                                                                                                                                                                                                                                                                                                                                                                                                                                 WMR tactical deviation3


                                                                                                                                                                                                                                                                                                                                                                                                                                                                                                                                                                   WMR tactical deviation3
                               Benchmark allocation2


                                                                                                                 Benchmark allocation2


                                                                                                                                                                                                   Benchmark allocation2


                                                                                                                                                                                                                                                                                     Benchmark allocation2


                                                                                                                                                                                                                                                                                                                                                                       Benchmark allocation2


                                                                                                                                                                                                                                                                                                                                                                                                                                                         Benchmark allocation2


                                                                                                                                                                                                                                                                                                                                                                                                                                                                                                                                           Benchmark allocation2
                                                                                           Current allocation4


                                                                                                                                                                             Current allocation4


                                                                                                                                                                                                                                                               Current allocation4


                                                                                                                                                                                                                                                                                                                                                 Current allocation4


                                                                                                                                                                                                                                                                                                                                                                                                                                   Current allocation4


                                                                                                                                                                                                                                                                                                                                                                                                                                                                                                                     Current allocation4


                                                                                                                                                                                                                                                                                                                                                                                                                                                                                                                                                                                                       Current allocation4
                                                                                 Change


                                                                                                                                                                   Change


                                                                                                                                                                                                                                                     Change


                                                                                                                                                                                                                                                                                                                                       Change


                                                                                                                                                                                                                                                                                                                                                                                                                         Change


                                                                                                                                                                                                                                                                                                                                                                                                                                                                                                           Change


                                                                                                                                                                                                                                                                                                                                                                                                                                                                                                                                                                                             Change
Traditional Assets

Equity                         0.0 +0.0                                                    0.0 19.0 +2.5 S 21.5 32.0 +4.0 S 36.0 44.0 +5.0 S 49.0 54.0 +6.0 S 60.0 62.0 +7.5 S 69.5 71.0 +2.0 S 73.0

US Equity                      0.0 +0.0                                                    0.0 14.0 +1.0 S 15.0 23.0 +0.5 S 23.5 32.0 +0.0                                                                                                                                                                                                      32.0 39.0 +0.0                                                                    39.0 44.0 +0.0                                                                    44.0 52.0 –3.0 S 49.0

  Large Cap Value              0.0 +0.0                                                    0.0 8.0 -0.5 T                                                                    7.5 8.0 –1.0 T                                                                    7.0 11.0 –1.5 T                                                                   9.5 11.0 –2.0 T                                                                   9.0 11.0 –2.0 T                                                                   9.0 13.0 –4.0 T                                                                   9.0

  Large Cap Growth             0.0 +0.0                                                    0.0 5.0 +1.5 S                                                                    6.5 8.0 +2.5 S 10.5 11.0 +3.0 S 14.0 11.0 +4.0 S 15.0 11.0 +4.0 S 15.0 13.0 +4.5 S 17.5

  Mid Cap                      0.0 +0.0                                                    0.0 1.0 +0.0 S                                                                    1.0 4.0 +0.0                                                                      4.0 5.0 +0.0                                                                      5.0 9.0 +0.0                                                                      9.0 11.0 +0.0                                                                    11.0 13.0 –0.5 T 12.5

  Small Cap                    0.0 +0.0                                                    0.0 0.0 +0.0                                                                      0.0 2.0 +0.0 S                                                                    2.0 3.0 +0.0 S                                                                    3.0 5.0 +0.0 T                                                                    5.0 7.0 +0.0 S                                                                    7.0 8.0 +0.0 S                                                                    8.0

  REITs                        0.0 +0.0                                                    0.0 0.0 +0.0                                                                      0.0 1.0 –1.0 T                                                                    0.0 2.0 –1.5 T                                                                    0.5 3.0 –2.0 T                                                                    1.0 4.0 –2.0 T                                                                    2.0 5.0 –3.0 T                                                                    2.0

Non-US Equity                  0.0 +0.0                                                    0.0 5.0 +1.5 S                                                                    6.5 9.0 +3.5 S 12.5 12.0 +5.0 S 17.0 15.0 +6.0 S 21.0 18.0 +7.5 S 25.5 19.0 +5.0 S 24.0

  Developed                    0.0 +0.0                                                    0.0 5.0 +1.5 S                                                                    6.5 8.0 +0.5 S                                                                    8.5 10.0 +0.0 S 10.0 12.0 +0.0 S 12.0 14.0 +0.5 S 14.5 14.0 –3.0 S 11.0

  Emerging Markets             0.0 +0.0                                                    0.0 0.0 +0.0                                                                      0.0 1.0 +3.0                                                                      4.0 2.0 +5.0 S                                                                    7.0 3.0 +6.0 S                                                                    9.0 4.0 +7.0 S 11.0 5.0 +8.0 S 13.0

Fixed Income                  81.0 +0.0                                                   81.0 67.0 –2.5 T 64.5 51.0 –4.0 T 47.0 37.0 –5.0 S 32.0 24.0 –6.0 T 18.0 11.0 –7.5 T                                                                                                                                                                                                                                                                                                                                       3.5 0.0 +0.0                                                                      0.0

US Fixed Income               74.0 +0.0                                                   74.0 59.0 –1.0 T 58.0 43.0 –2.0 T 41.0 29.0 –2.5 T 26.5 18.0 –3.0 T 15.0 9.0 –5.5 T                                                                                                                                                                                                                                                                                                                                        3.5 0.0 +0.0                                                                      0.0

Non-US Fixed Income            7.0 +0.0                                                    7.0 8.0 –1.5 T                                                                    6.5 8.0 –2.0 T                                                                    6.0 8.0 –2.5 S                                                                    5.5 6.0 –3.0 T                                                                    3.0 2.0 –2.0 T                                                                    0.0 0.0 +0.0                                                                      0.0

Cash (USD)                    10.0 +0.0                                                   10.0 2.0 +0.0                                                                      2.0 2.0 +0.0                                                                      2.0 2.0 +0.0                                                                      2.0 2.0 +0.0                                                                      2.0 2.0 +0.0                                                                      2.0 2.0 –2.0 T                                                                    0.0

Non-traditional Assets         9.0 +0.0                                                    9.0 12.0 +0.0                                                                    12.0 15.0 +0.0                                                                    15.0 17.0 +0.0                                                                    17.0 20.0 +0.0                                                                    20.0 25.0 +0.0                                                                    25.0 27.0 +0.0                                                                    27.0

Commodities                    2.0 +0.0                                                    2.0 3.0 +0.0                                                                      3.0 4.0 +0.0                                                                      4.0 5.0 +0.0                                                                      5.0 5.0 +0.0                                                                      5.0 6.0 +0.0                                                                      6.0 7.0 +0.0                                                                      7.0
                          5
Alternative Investments        7.0 +0.0                                                    7.0 9.0 +0.0                                                                      9.0 11.0 +0.0                                                                    11.0 12.0 +0.0                                                                    12.0 15.0 +0.0                                                                    15.0 19.0 +0.0                                                                    19.0 20.0 +0.0                                                                    20.0

“WMR tactical deviation” legend: Overweight Underweight Neutral                                                                                                                                                                                                                                                                                                                                                                                   “Change” legend: S Upgrade T Downgrade
Source: UBS WMR and Investment Solutions, as of 8 December 2010.                                                                                                                                                                                                                                                                                                                                                                                              For end notes, please see appendix.


                                                                                                                                                                                                                                                                                                                                                                       Investment Strategy Guide December 2010                                                                                                                                                                                             45
Detailed asset allocation, without non-traditional assets (NTAs)

Investor                  Very conservative Conservative                                                                                                                                      Moderate                                                                         Moderate                                                                          Moderate                                                                          Aggressive                                                                         Very aggressive
Risk Pro le1                                                                                                                                                                                  conservative                                                                                                                                                       aggressive


                                        Cash                                  Equities                                    Cash                                  Equities                                   Cash                                  Equities                                   Cash                                  Equities                                    Cash                                  Equities                                     Cash                                  Equities                                          Cash                              Equities
                                        Bonds                                                                             Bonds                                                                            Bonds                                                                            Bonds                                                                             Bonds                                                                              Bonds                                                                                   Bonds
                                                   WMR tactical deviation3


                                                                                                                                     WMR tactical deviation3


                                                                                                                                                                                                                      WMR tactical deviation3


                                                                                                                                                                                                                                                                                                       WMR tactical deviation3


                                                                                                                                                                                                                                                                                                                                                                                         WMR tactical deviation3


                                                                                                                                                                                                                                                                                                                                                                                                                                                                            WMR tactical deviation3


                                                                                                                                                                                                                                                                                                                                                                                                                                                                                                                                                              WMR tactical deviation3
                           Benchmark allocation2


                                                                                                             Benchmark allocation2


                                                                                                                                                                                              Benchmark allocation2


                                                                                                                                                                                                                                                                               Benchmark allocation2


                                                                                                                                                                                                                                                                                                                                                                 Benchmark allocation2


                                                                                                                                                                                                                                                                                                                                                                                                                                                    Benchmark allocation2


                                                                                                                                                                                                                                                                                                                                                                                                                                                                                                                                      Benchmark allocation2
                                                                                       Current allocation4


                                                                                                                                                                        Current allocation4


                                                                                                                                                                                                                                                         Current allocation4


                                                                                                                                                                                                                                                                                                                                           Current allocation4


                                                                                                                                                                                                                                                                                                                                                                                                                             Current allocation4


                                                                                                                                                                                                                                                                                                                                                                                                                                                                                                                Current allocation4


                                                                                                                                                                                                                                                                                                                                                                                                                                                                                                                                                                                                 Current allocation4
                                                                             Change


                                                                                                                                                               Change


                                                                                                                                                                                                                                                Change


                                                                                                                                                                                                                                                                                                                                 Change


                                                                                                                                                                                                                                                                                                                                                                                                                   Change


                                                                                                                                                                                                                                                                                                                                                                                                                                                                                                      Change


                                                                                                                                                                                                                                                                                                                                                                                                                                                                                                                                                                                        Change
Traditional Assets

Equity                     0.0 +0.0                                                    0.0 22.0 +2.5 S 24.5 37.0 +4.0 S 41.0 52.0 +5.0 S 57.0 67.0 +6.0 S 73.0 83.0 +7.5 S 90.5 98.0 +2.0 S 100.0

US Equity                  0.0 +0.0                                                    0.0 16.0 +1.0 S 17.0 26.0 +0.5 S 26.5 37.0 +0.0                                                                                                                                                                                                    37.0 48.0 +0.0                                                                    48.0 59.0 +0.0                                                                     59.0 72.0 –3.0 T                                                                  69.0

  Large Cap Value          0.0 +0.0                                                    0.0 9.0 -0.5 T                                                                   8.5 9.0 –1.0 T                                                                   8.0 13.0 –1.5 T 11.5 14.0 –2.0 T 12.0 15.0 –2.0 T 13.0 18.0 –4.0 T                                                                                                                                                                                                                                                                      14.0

  Large Cap Growth         0.0 +0.0                                                    0.0 6.0 +1.5 S                                                                   7.5 9.0 +2.5 S 11.5 13.0 +3.0 S 16.0 14.0 +4.0 S 18.0 15.0 +4.0 S 19.0 18.0 +4.5 S                                                                                                                                                                                                                                                                                                                                       22.5

  Mid Cap                  0.0 +0.0                                                    0.0 1.0 +0.0 S                                                                   1.0 4.0 +0.0                                                                     4.0 6.0 +0.0                                                                      6.0 11.0 +0.0                                                                    11.0 15.0 +0.0                                                                     15.0 18.0 –0.5 T                                                                  17.5

  Small Cap                0.0 +0.0                                                    0.0 0.0 +0.0                                                                     0.0 3.0 +0.0 S                                                                   3.0 3.0 +0.0 S                                                                    3.0 6.0 +0.0 S                                                                    6.0 9.0 +0.0 S                                                                     9.0 11.0 +0.0 S                                                                  11.0

  REITs                    0.0 +0.0                                                    0.0 0.0 +0.0                                                                     0.0 1.0 –1.0 T                                                                   0.0 2.0 –1.5 T                                                                    0.5 3.0 –2.0 T                                                                    1.0 5.0 –2.0 T                                                                     3.0 7.0 –3.0 T                                                                       4.0

Non–US Equity              0.0 +0.0                                                    0.0 6.0 +1.5 S                                                                   7.5 11.0 +3.5 S 14.5 15.0 +5.0 S 20.0 19.0 +6.0 S 25.0 24.0 +7.5 S 31.5 26.0 +5.0 S                                                                                                                                                                                                                                                                                                                                      31.0

  Developed                0.0 +0.0                                                    0.0 6.0 +1.5 S                                                                   7.5 9.0 +0.5 S                                                                   9.5 13.0 +0.0 S 13.0 15.0 +0.0 S 15.0 18.0 +0.5 S 18.5 20.0 –3.0 S                                                                                                                                                                                                                                                                      17.0

  Emerging Markets         0.0 +0.0                                                    0.0 0.0 +0.0                                                                     0.0 2.0 +3.0                                                                     5.0 2.0 +5.0 S                                                                    7.0 4.0 +6.0 S 10.0 6.0 +7.0 S 13.0 6.0 +8.0 S                                                                                                                                                                                                        14.0

Fixed Income             90.0 +0.0                                                    90.0 76.0 –2.5 T 73.5 61.0 –4.0 T 57.0 46.0 –5.0 T 41.0 31.0 –6.0 T 25.0 15.0 –7.5 T                                                                                                                                                                                                                                                                                                                                      7.5 0.0 +0.0                                                                         0.0

US Fixed Income          82.0 +0.0                                                    82.0 67.0 –1.0 T 66.0 51.0 –2.0 T 49.0 36.0 –2.5 T 33.5 23.0 –3.0 T 20.0 12.0 –4.5 T                                                                                                                                                                                                                                                                                                                                      7.5 0.0 +0.0                                                                         0.0

Non–US Fixed Income        8.0 +0.0                                                    8.0 9.0 –1.5 T                                                                   7.5 10.0 –2.0 T                                                                  8.0 10.0 –2.5 T                                                                   7.5 8.0 –3.0 T                                                                    5.0 3.0 –3.0 T                                                                     0.0 0.0 +0.0                                                                         0.0

Cash (USD)               10.0 +0.0                                                    10.0 2.0 +0.0                                                                     2.0 2.0 +0.0                                                                     2.0 2.0 +0.0                                                                      2.0 2.0 +0.0                                                                      2.0 2.0 +0.0                                                                       2.0 2.0 –2.0 T                                                                       0.0

“WMR tactical deviation” legend: Overweight Underweight Neutral                                                                                                                                                                                                                                                                                                                                                                                    “Change” legend: S Upgrade T Downgrade
Source: UBS WMR and Investment Solutions, as of 8 December 2010.                                                                                                                                                                                                                                                                                                                                                                                               For end notes, please see appendix.


46    2011 Outlook
Appendix
Portfolio Analytics

The portfolio analytics shown for each risk pro le’s                           In order to create the analysis shown, the rates of return
benchmark allocations are based on estimated forward-                          for each asset class are combined in the same proportion
looking return and standard deviation assumptions (capi-                       as the asset allocations illustrated (e.g., if the asset allo-
tal market assumptions), which are based on UBS propri-                        cation indicates 40% equities, then 40% of the results
etary research. The development process includes a                             shown for the allocation will be based upon the esti-
review of a variety of factors, including the return, risk,                    mated hypothetical return and standard deviation as-
correlations and historical performance of various asset                       sumptions shown below).
classes, in ation and risk premium. These capital market
assumptions do not assume any particular investment                            You should understand that the analysis shown and as-
time horizon. The process assumes a situation where the                        sumptions used are hypothetical estimates provided for
supply and demand for investments is in balance, and in                        your general information. The results are not guarantees
which expected returns of all asset classes are a re ection                    and pertain to the asset allocation and/or asset class in
of their expected risk and correlations regardless of time-                    general, not the performance of speci c securities or in-
frame. Please note that these assumptions are not guar-                        vestments. Your actual results may vary signi cantly from
antees and are subject to change. UBS has changed its                          the results shown in this report, as can the performance
risk and return assumptions in the past and may do so in                       of any individual security or investment.
the future. Neither UBS nor your Financial Advisor is re-
quired to provide you with an updated analysis based
upon changes to these or other underlying assumptions.


Risk                                               Very                       Moderate                    Moderate                        Very
Pro le ==>>                                conservative   Conservative     Conservative    Moderate      aggressive   Aggressive    aggressive
With non-traditional assets
Estimated Return                                 4.81%             5.98%         6.89%        7.65%          8.36%        9.00%          9.56%
Estimated Risk                                   3.21%             4.70%         6.71%        8.69%         10.53%        12.16%        13.81%
Without non-traditional assets
Estimated Return                                 4.46%             5.67%         6.62%        7.44%          8.33%        9.22%         10.00%
Estimated Risk                                   3.45%             4.78%         6.93%        9.17%         11.73%        14.46%        16.94%


Asset Class                         Capital Market Assumptions
                                 Estimated Risk Estimated Return
US Equity
Large Cap Value                          16.4%             8.7%
Large Cap Growth                         19.0%             9.3%
Mid Cap                                  18.4%            10.4%
Small Cap                                21.4%            10.6%
REITs                                   23.0%              9.6%
Non-US Equity
Developed markets Equities              17.7%             10.4%
Emerging markets Equities               26.6%             12.6%
US Fixed income                           3.7%             4.4%
Non-U.S. xed income                       8.8%             6.1%
Cash (USD)                                0.5%             4.0%
Commodities                             17.1%              7.6%
Alternative investments                   8.5%             8.7%


                                                                                                Investment Strategy Guide December 2010     47
Appendix
Additional Asset Allocation Models
US Taxable Fixed Income Allocation, in %
                                                                                              Benchmark                         WMR Tactical deviation2                         Current allocation3
                                                                                              allocation1                   Previous                Current
 Treasuries                                                                                          12.0                       –1.0                    –1.0                                       11.0
 TIPS (Treasury inËation-protected securities)                                                          5.0                       –1.0                           –1.0                               4.0
 Agencies                                                                                              22.0                       –1.0                           –1.0                              21.0
 Mortgages                                                                                             20.0                       –1.0                           –2.0                              18.0
 Inv. Grade Corporates                                                                                 22.0                       +2.0                           +1.0                              23.0
 High Yield Corporates                                                                                 10.0                       +1.0                           +2.0                              12.0
 Preferred Securities                                                                                   4.0                       +1.0                           +1.0                               5.0
 Emerging Market sovereign bonds in US dollar                                                           5.0                      +0.0                            +1.0                               6.0
 TFI non-Credit                                                                                       59.0                       –4.0                            –5.0                             54.0
 TFI Credit                                                                                           41.0                       +4.0                           +5.0                              46.0


Non–US Developed Equity Module, in %
                                                                                              Benchmark                         WMR Tactical deviation2                             Current allocation3
                                                                                              allocation1                   Previous                Current
 Eurozone                                                                                            28.0                       –5.0                  –15.0                                           13.0
 UK                                                                                                    20.0                     +10.0                          +25.0                                  45.0
 Japan                                                                                                 19.0                       –5.0                          –15.0                                   4.0
 Other                                                                                                 33.0                      +0.0                            +5.0                                 38.0


Non–US Fixed Income Module, in %
                                                                                              Benchmark                         WMR Tactical deviation2                             Current allocation3
                                                                                              allocation1                  Previous                 Current
 Eurozone                                                                                            43.0                      +0.0                     +0.0                                          43.0
 UK                                                                                                     9.0                     +0.0                             +0.0                                   9.0
 Japan                                                                                                 32.0                    –10.0                            –10.0                                 22.0
 Other                                                                                                 15.0                    +10.0                           +10.0                                  25.0
Source: UBS WMR and Investment Solutions, as of as of 8 December 2010
1
  The benchmark allocation refers to a moderate risk proÊle. See “Sources of Benchmark Allocations and Investor Risk ProÊles” in the Appendix for an explanation regarding the source of benchmark
  allocations and their suitability.
2
  See “Deviations from Benchmark Allocations” in the Appendix for an explanation regarding the interpretation of the suggested tactical deviations from benchmark. The “current” column refers to the
  tactical deviation that applies as of the date of this publication. The “previous” column refers to the tactical deviation that was in place at the date of the previous edition of the Investment Strategy
  Guide or the last Investment Strategy Guide Update.
3
  The current allocation column is the sum of the benchmark allocation and the WMR tactical deviation columns.


48       2011 Outlook
Appendix
Additional Asset Allocation Models
Equity Industry Group Allocation, in %
                                                                               S&P 500                               WMR Tactical deviation2                                                  Current
                                                                            Benchmark                        Numeric                         Symbol                                       allocation3
                                                                            allocation1               Previous       Current         Previous       Current
 Consumer Discretionary                                                           10.7                   -2.0          -2.0               ––            ––                                          8.7
 Auto & Components                                                                     0.8                 +0.0                  +1.0                     n                     +                   1.8
 Consumer Services                                                                     1.9                 +0.5                 +0.0                     +                      n                   1.9
 Media                                                                                 3.1                 +0.0                 +0.0                      n                     n                   3.1
 Retailing                                                                             3.8                  -1.5                 -2.0                   ––                    ––                    1.8
 Consumer, Durables & Apparel                                                          1.2                  -1.0                 -1.0                     –                     –                   0.2
 Consumer Staples                                                                   10.8                  +2.0                  +2.0                    ++                   ++                   12.8
 Food, Beverage & Tobacco                                                              6.0                 +1.0                  +1.0                    +                      +                   7.0
 Food & Staple Retailing                                                               2.4                 +0.0                 +0.0                      n                     n                   2.4
 Household & Personal Products                                                         2.4                 +1.0                  +1.0                    +                      +                   3.4
 Energy                                                                              11.8                 +0.0                  +1.0                     n                     +                  12.8
 Financials                                                                         15.8                  +0.0                 +0.0                      n                     n                  15.8
 Banks                                                                                 3.0                 +1.0                 +0.0                     +                      n                   3.0
 DiversiÊed Financials                                                                 7.5                 +0.0                  +1.0                     n                     +                   8.5
 Insurance                                                                             3.9                 +0.0                 +0.0                      n                     n                   3.9
 Real Estate                                                                           1.5                  -1.0                 -1.0                     –                     –                   0.5
 Health Care                                                                         11.0                 +0.0                   -1.0                    n                     –                  10.0
 HC Equipment & Services                                                               3.6                 +0.0                 +0.0                      n                     n                   3.6
 Pharmaceuticals & Biotechnology                                                       7.4                 +0.0                  -1.0                     n                     –                   6.4
 Industrials                                                                        10.9                  +0.0                  +1.0                     n                     +                  11.9
 Capital Goods                                                                         8.3                 +0.0                 +0.0                      n                     n                   8.3
 Commercial Services & Supplies                                                        0.6                 +0.0                 +0.0                      n                     n                   0.6
 Transportation                                                                        2.1                 +0.0                  +1.0                     n                     +                   3.1
 Information Technology                                                              19.0                 +1.0                 +2.5                      +                  +++                   21.5
 So ware & Services                                                                    9.1                 +1.0                  +1.0                    +                      +                  10.1
 Technology Hardware & Equipment                                                       7.2                 +1.0                  +1.5                    +                    ++                    8.7
 Semiconductors                                                                        2.6                  -1.0                +0.0                      –                     n                   2.6
 Materials                                                                            3.6                  -2.0                  -1.0                  ––                      –                    2.6
 Telecom                                                                              3.0                  -1.0                 -2.5                      –                –––                      0.5
 Utilities                                                                            3.3                 +2.0                 +0.0                     ++                     n                    3.3
Source: S&P, UBS WMR as of 8 December 2010
The benchmark allocation, as well as the tactical deviations, are intended to be applicable to the US equity portion of a portfolio across investor risk proÊles.
1
  The benchmark allocation is based on S&P 500 weights.
2
  See “Deviations from Benchmark Allocations” in the Appendix for an explanation regarding the interpretation of the suggested tactical deviations from benchmark. The “current” column refers to the
  tactical deviation that applies as of the date of this publication. The “previous” column refers to the tactical deviation that was in place at the date of the previous edition of the Investment Strategy
  Guide or the last Investment Strategy Guide Update.
3
  The current allocation column is the sum of the S&P 500 benchmark allocation and the WMR tactical deviation columns.


                                                                                                                                     Investment Strategy Guide December 2010                              49
Appendix
Additional Asset Allocation Models
Alternative Investment (AI) Benchmark Allocation (All gures in % of total portfolio)

                                                                                                                    Risk pro le
                                                               Very                                  Moderate                                   Moderate                                   Very
                                                       conservative         Conservative          conservative             Moderate            aggressive           Aggressive       aggressive
 Tactical Trading                                                  1.0                  1.0                   1.0                  2.0                   2.5                   3.5          4.0
 Relative Value                                                    1.5                  2.0                   2.0                  2.0                   2.0                   2.0          2.0
 Credit Strategies                                                 1.5                  2.0                   2.0                  2.0                   2.5                   3.0          3.0
 Event Driven                                                      1.5                  2.0                   2.0                  2.0                   2.0                   2.5          3.0
 Equity Hedge                                                      1.5                  2.0                   2.0                  2.0                   2.0                   3.0          3.0
 Private Equity                                                    0.0                  0.0                   2.0                  2.0                   2.0                   2.0          3.0
 Private Real Estate                                               0.0                  0.0                   0.0                  0.0                   2.0                   2.0          2.0
 Total Alternative Investments                                       7                    9                   11                    12                   15                    19           20
See “Sources of Benchmark Allocations and Investor Risk ProÊles” in the Appendix for an explanation regarding the source of the benchmark allocations and their suitability.


50     2011 Outlook
Tactical Asset Allocation Performance Measurement

As explained more fully below, tables A and E re ect the                   mation ratio is calculated as the ratio of the annualized
performance of certain tactical asset allocation recom-                    excess return over a given time period and the annual-
mendations published by WMR during the time periods                        ized standard deviation of daily excess returns over the
speci ed. Performance is calculated utilizing the returns                  same period. Additional background information regard-
of the indices identi ed, as applied to the respective                     ing the computation of the information ratio gures pro-
benchmark allocations and the benchmark with the tacti-                    vided below is available upon request.
cal shi (see detailed asset allocation tables where
benchmark allocation with tactical shi is referred to as                   The performance shown in Table A is based on the
“current allocation”). For example, if cash were allocated                 Benchmark Allocation (with nontraditional assets) for a
10% in the benchmark and 12% in the benchmark with                         hypothetical moderate risk pro le investor and the
the tactical shi , the performance of the cash index                       Benchmark with Tactical Shi (see “Sources of bench-
would provide 10% and 12% in the respective perfor-                        mark allocations and investor risk pro les” on page 46
mance computation. Performance calculations assume                         for details regarding Benchmark construction). Perfor-
that portfolios are rebalanced the day a er publication                    mance is calculated utilizing the returns of the indices
by WMR of any changes to its tactical deviations. Perfor-                  identi ed in Table B. Prior to 25 August 2008, WMR pub-
mance shown is based on total returns, but does not in-                    lished tactical asset allocation recommendations using a
clude transaction costs, such as commissions, fees, mar-                   less comprehensive set of asset classes and sectors, which
gin interest, and interest charges. Actual total returns                   makes a comparison with the current models dif cult. In
adjusted for such transaction costs will be reduced. A                     addition, since 25 August 2008, WMR has at times pub-
complete record of all the recommendations upon which                      lished a more detailed set of tactical deviations, whereby
these performance reports are based is available from                      the categories “Non-US Developed Equities” and Non-US
UBS Financial Services Inc. upon written request. Past                     Fixed Income” were further subdivided into regional
performance is not an indication of future results.                        blocks. Only the cumulative recommendations at the
                                                                           level of “Non-US Developed Equities” and “Non-US Fixed
The performance attributable to the tactical deviations is                 Income” were taken into account in calculating the per-
re ected in the column labeled “Excess return”, which                      formance shown above.
shows the di erence between the performance of the
benchmark and the performance of the benchmark with                        The performance shown in Table C is based on Bench-
the tactical shi . Unless otherwise noted below, perfor-                   mark Allocation, and the Benchmark Allocation with tac-
mance is annualized for periods of less than one year.                     tical shi (see “Sources of benchmark allocations and
The Information ratio is a risk adjusted performance mea-                  investor risk pro les” on page 50 for details regarding
sure, which adjusts the excess returns for the tracking                    Benchmark construction). Performance is calculated uti-
error risk of the tactical deviations. Speci cally the infor-              lizing the returns of the indices identi ed in Table D.


Table A: Moderate Risk ProÎle Performance Measurement

                                         Benchmark     Benchmark with      Excess return   Information     Russell 3000       Barclays Capital
                                          allocation      tactical shift                         Ratio      stock index    US Aggregate bond
                                                                                           (annualized)   (total return)   index (total return)
25 Aug. 08 to 31 Dec. 08                    -16.59%            -15.64%            0.96%           +2.0         -29.00%                  3.33%
2009 Q1                                      -5.52%              -5.45%           0.07%           +0.3         -10.80%                  0.12%
2009 Q2                                     11.18%              11.37%            0.18%           +1.0          16.82%                  1.78%
2009 Q3                                     10.44%              11.07%            0.63%           +2.1          16.31%                  3.74%
2009 Q4                                       2.99%              3.30%            0.31%           +1.2           5.90%                  0.20%
2010 Q1                                       2.74%              2.56%           -0.18%            -0.9          5.94%                  1.78%
2010 Q2                                      -4.56%             -4.87%           -0.31%            -1.4        -11.32%                  3.49%
2010 Q3                                       8.34%              7.99%           -0.35%            -2.2         11.53%                  2.48%
2010 Q4 until 7 Dec. 2010                     3.45%              3.41%           -0.04%            -0.5          8.51%                  -1.35%
 Since inception                              9.54%             11.05%            1.52%           +0.6           3.60%                 16.55%
Source: UBS WMR, as of 7 December 2010


                                                                                           Investment Strategy Guide December 2010           51
Tactical Asset Allocation Performance Measurement

Table B: IS benchmark allocations for moderate risk proÎle investor, and underlying indices (all Îgures in %)

 25 Aug 2008 to 23 Feb 2009                                                             24 Feb 2009 to present
 US Large Cap Value (Russell 1000 Value)                                   12.5         US Large Cap Value (Russell 1000 Value)                            11.0
 US Large Cap Growth (Russell 1000 Growth)                                 12.5         US Large Cap Growth (Russell 1000 Growth)                          11.0
 US Small Cap Value (Russell 2000 Value)                                    2.0         US Mid Cap (Russell Midcap)                                         5.0
 US Small Cap Growth (Russell 2000 Growth)                                  2.0         US Small Cap (Russell 2000)                                         3.0
 US REITs (FTSE NAREIT All REITs)                                           1.5         US REITs (FTSE NAREIT All REITs)                                    2.0
 Non-US Dev. Eq (MSCI Gross World ex-US)                                   10.5         Developed Markets (MSCI Gross World ex-US)                         10.0
 Emerging Markets Eq. (MSCI Gross EM USD)                                   2.0         Emerging Markets (MSCI Gross EM USD)                                2.0
 US Fixed Income (BarCap US Aggregate)                                     30.0         US Fixed Income (BarCap US Aggregate)                              29.0
 Non-US Fixed Income (BarCap Global Aggregate ex-USD)                       8.0         Non-US Fixed Income (BarCap Global Aggregate ex-USD)                8.0
 Cash (JP Morgan Cash Index USD 1 month)                                    2.0         Cash (JP Morgan Cash Index USD 1 month)                             2.0
 Commodities (DJ UBS total return index)                                    5.0         Commodities (DJ UBS total return index)                             5.0
 Alternative Investments (HFRX Equal Weighted Strategies)                  12.0         Alternative Investments (HFRX Equal Weighted Strategies)           12.0
Source: UBS WMR and Investment Solutions


Table C: WMR US dollar Taxable Fixed Income Strategy Performance measurement

                                                             Benchmark              Benchmark                Excess             Information ratio      Barclays Capital
                                                              allocation      with tactical shift            return                  (annualized)        US Aggregate
 31 Jan. 2007 to 31 Dec. 2007                                     4.69%                   4.56%              -0.12%                          -1.4                 7.01%
 2008                                                            -1.17%                   -2.11%            -0.94%                           -3.2                 5.24%
 2009                                                           11.67%                   12.96%              1.29%                             2.8                5.93%
 2010 Q1                                                          2.27%                   2.39%              0.12%                             3.7                1.78%
 2010 Q2                                                          2.70%                   2.56%              -0.14%                          -2.3                 3.49%
 2010 Q3                                                          3.51%                   3.60%              0.09%                             5.2                2.48%
 2010 Q4 to 7 Dec. 2010                                          -0.74%                  -0.72%              0.02%                             1.1                -1.35%
Source: UBS WMR, as of 7 December 2010


Table D : Benchmark allocation for US dollar Fixed Income Strategy and underlying indices used to calculate performance shown
in Table C (all Îgures in %)

                                                                                     31 Jan. 2007            31 July 2007               25 Aug 2008    31 March 2009
                                                                                  to 30 July 2007         to 24 Aug 2008           to 30 March 2009        to present
 Treasuries (BoA ML Treasury Master Index)                                                 10.0%                      12.0%                    12.0%              12.0%
 TIPS (BoA ML Treasury InËation-Linked Index)                                               5.0%                      5.0%                      5.0%               5.0%
 Agencies (BoA ML Agency Composite Master Index)                                           20.0%                      22.0%                    22.0%              22.0%
 Inv. Grade Corporates (BoA ML Corporate Master Index)                                     20.0%                      21.0%                    18.0%              22.0%
 High Yield Corporates (BoA ML High Yield Master II Constrained Index)                     10.0%                      10.0%                     8.0%              10.0%
 Preferred Securities (BoA ML Preferred Stock Fixed Index)                                 10.0%                      10.0%                    10.0%               4.0%
 Mortgages (BoA ML US Mortgage Master Index)                                               20.0%                      20.0%                    20.0%              20.0%
 Emerg. Markets (BoA ML Emerging Sovereign Plus Index)                                      0.0%                      0.0%                      5.0%               5.0%
 Cash (BoA ML US T-Bill 3-month Index)                                                      5.0%                      0.0%                      0.0%               0.0%
Source: UBS WMR and Investment Solutions


52      2011 Outlook
Appendix
End notes for table labeled detailed asset allocations with non-traditional              Non-Traditional Assets
assets (NTAs)                                                                            Nontraditional assets include commodities and alternative investments. Alterna-
1 See “Sources of benchmark allocations and investor risk pro les”on next page           tive investments, in turn, include hedge funds,private equity, real estate, and
regarding the source of investor risk pro les.                                           managed futures. Interests of alternative investment funds are sold only to quali-
2 See “Sources of benchmark allocations and investor risk pro les” on next page            ed investors, and only by means of o ering documents that include information
regarding the source of benchmark allocations and their suitability.                     about the risks, performance and expenses of alternative investment funds, and
3 See “Deviations from benchmark allocations” in the appendix regarding the              which clients are urged to read carefully before subscribing and retain. An invest-
interpretation of the suggested tactical deviations from benchmark.                      ment in an alternative investment fund is speculative and involves signi cant risks.
4 The current allocation row is the sum of the benchmark allocation and the WMR          Alternative investment funds are not mutual funds and are not subject to the
tactical deviation rows.                                                                 same regulatory requirements as mutual funds. Alternative investment funds’
5 UBS WMR considers that maintaining the benchmark allocation is appropriate             performance may be volatile, and investors may lose all or a substantial amount
for alternative investments. The recommended tactical deviation is therefore             of their investment in an alternative investment fund. Alternative investment
structurally set at 0. See “Sources of benchmark allocations and investor risk           funds may engage in leveraging and other speculative investment practices that
pro les” on next page regarding the types of alternative investments and their           may increase the risk of investment loss. Interests of alternative investment funds
suitability.                                                                             typically will be illiquid and subject to restrictions on transfer. Alternative invest-
                                                                                         ment funds may not be required to provide periodic pricing or valuation informa-
End notes for table labeled detailed asset allocations without non-tradi-                tion to investors. Alternative investment fund investment programs generally
tional assets (NTAs)                                                                     involve complex tax strategies and there may be delays in distributing tax informa-
1 See “Sources of benchmark allocations and investor risk pro les”on next page           tion to investors. Alternative investment funds are subject to high fees, including
regarding the source of investor risk pro les.                                           management fees and other fees and expenses, all of which will reduce pro ts.
2 See “Sources of benchmark allocations and investor risk pro les” on next page          Alternative investment funds may uctuate in value. An investment in an alterna-
regarding the source of benchmark allocations and their suitability.                     tive investment fund is long-term, there is generally no secondary market for the
3 See “Deviations from benchmark allocations” in the Appendix regarding the              interests of a fund, and none is expected to develop. Interests in alternative in-
interpretation of the suggested tactical deviations from benchmark.                      vestment funds are not deposits or obligations of, or guaranteed or endorsed by,
4 The current allocation row is the sum of the benchmark allocation and the WMR          any bank or other insured depository institution, and are not federally insured by
tactical deviation rows.                                                                 the Federal Deposit Insurance Corporation, the Federal Reserve Board, or any
                                                                                         other governmental agency. Prospective investors should understand these risks
Emerging Market Investments                                                              and have the nancial ability and willingness to accept them for an extended
Investors should be aware that Emerging Market assets are subject to, amongst            period of time before making an investment in an alternative investment fund
others, potential risks linked to currency volatility, abrupt changes in the cost of     and should consider an alternative investment fund as a supplement to an overall
capital and the economic growth outlook, as well as regulatory and socio-political       investment program.
risk, interest rate risk and higher credit risk. Assets can sometimes be very illiquid   In addition to the risks that apply to alternative investments generally, the follow-
and liquidity conditions can abruptly worsen. WMR generally recommends only              ing are additional risks related to an investment in these strategies:
those securities it believes have been registered under Federal U.S. registration        • Hedge Fund Risk: There are risks speci cally associated with investing in hedge
rules (Section 12 of the Securities Exchange Act of 1934) and individual State             funds, which may include risks associated with investing in short sales, options,
registration rules (commonly known as “Blue Sky” laws). Prospective investors              small-cap stocks, “junk bonds,” derivatives, distressed securities, non-U.S. secu-
should be aware that to the extent permitted under US law, WMR may from time               rities and illiquid investments.
to time recommend bonds that are not registered under US or State securities             • Hedge Fund of Funds: In addition to the risks associated with hedge funds
laws. These bonds may be issued in jurisdictions where the level of required disclo-       generally, an investor should recognize that the overall performance of a fund of
sures to be made by issuers is not as frequent or complete as that required by US          funds is dependent not only on the investment performance of the manager of
laws.                                                                                      the fund, but also on the performance of the underlying managers. The investor
                                                                                           will bear the management fees and expenses of both the fund of funds and the
For more background on emerging markets generally, see the WMR Education                   underlying hedge funds or accounts in which the fund of funds invests, which
Notes “Investing in Emerging Markets (Part 1): Equities”, 30 July 2007, “Emerging          could be signi cant.
Market Bonds: Understanding Emerging Market Bonds,” 12 August 2009 and                   • Managed Futures: There are risks speci cally associated with investing in man-
“Emerging Market Bonds: Understanding Sovereign Risk,” 17 December 2009.                   aged futures programs. For example, not all managers focus on all strategies at
                                                                                           all times, and managed futures strategies may have material directional ele-
Investors interested in holding bonds for a longer period are advised to select the        ments.
bonds of those sovereigns with the highest credit ratings (in the investment grade       • Real Estate: There are risks speci cally associated with investing in real estate
band). Such an approach should decrease the risk that an investor could end up             products and real estate investment trusts. They involve risks associated with
holding bonds on which the sovereign has defaulted. Sub-investment grade bonds             debt, adverse changes in general economic or local market conditions, changes
are recommended only for clients with a higher risk tolerance and who seek to              in governmental, tax, real estate and zoning laws or regulations, risks associated
hold higher yielding bonds for shorter periods only.                                       with capital calls and, for some real estate products, the risks associated with
                                                                                           the ability to qualify for favorable treatment under the federal tax laws.
                                                                                         • Private Equity: There are risks speci cally associated with investing in private
                                                                                           equity. Capital calls can be made on short notice, and the failure to meet capital
                                                                                           calls can result in signi cant adverse consequences including, but not limited to,
                                                                                           a total loss of investment.
                                                                                         • Foreign Exchange/Currency Risk: Investors in securities of issuers located outside


                                                                                                                 Investment Strategy Guide December 2010                     53
Appendix
  of the United States should be aware that even for securities denominated in             periods. Although some strategies employ relative value techniques, macro
  U.S. dollars, changes in the exchange rate between the U.S. dollar and the               strategies are distinct from relative value strategies in that the primary in-vest-
  issuer’s “home” currency can have unexpected e ects on the market value and              ment thesis is predicated on predicted or future movements in the underlying
  liquidity of those securities. Those securities may also be a ected by other risks       instruments, rather than realization of a valuation discrepancy between securi-
  (such as political, economic or regulatory changes) that may not be readily              ties. In a similar way, while both macro and equity hedge managers may hold
  known to a U.S. investor.                                                                equity securities, the overriding investment thesis is predicated on the impact
• Options: Options are not suitable for all investors. Please read the Options Clear-      movements in underlying macroeconomic variables may have on security prices,
  ing Corporation Publication titled “Characteristics and Risks of Standardized            as opposed to equity hedge, in which the fundamental characteristics of the
  Options Trading” and consult your tax advisor prior to investing. The Publication        company are the most signi cant and integral to investment thesis.
  can be obtained from your Financial Services Inc., Financial Advisor, or can be        • Distressed Restructuring Strategies: Employ an investment process focused on
  accessed under the Publications Section of the Option Clearing Corporation’s             corporate xed income instruments, primarily on corporate credit instruments of
  website: www.theocc.com.                                                                 companies trading at signi cant discounts to their value at issuance, or obliged
                                                                                           (par value) at maturity, as a result of either a formal bankruptcy proceeding or
Description of Certain Alternative Investment Strategies                                     nancial market perception of near-term proceedings. Managers are typically
• Equity Hedge: Investment managers who maintain positions both long and short             actively involved with the management of these companies, frequently involved
  in primarily equity and equity-derivative securities. A wide variety of investment       on creditors’ committees in negotiating the exchange of securities for alternative
  processes can be employed to arrive at an investment decision, including both            obligations, either swaps of debt, equity or hybrid securities. Managers employ
  quantitative and fundamental techniques; strategies can be broadly diversi ed            fundamental credit processes focused on valuation and asset coverage of securi-
  or narrowly focused on speci c sectors and can range broadly in terms of levels          ties of distressed rms. In most cases, portfolio exposures are concentrated in
  of net exposure, leverage employed, holding period, concentrations of market             instruments which are publicly traded, in some cases actively and in others under
  capitalizations and valuation ranges of typical portfolios. Equity hedge managers        reduced liquidity but, in general, for which a reasonable public market exists. In
  would typically maintain at least 50% and may, in some cases, be substantially           contrast to special situations, distressed strategies primarily employ debt (greater
  entirely invested in equities, both long and short.                                      than 60%) but also may maintain related equity exposure.
• Event Driven: Investment managers who maintain positions in companies cur-             • Relative Value: Investment managers who maintain positions in which the invest-
  rently or prospectively involved in corporate transactions of a wide variety includ-     ment thesis is predicated on realization of a valuation discrepancy in the relation-
  ing, but not limited to, mergers, restructurings, nancial distress, tender o ers,        ship between multiple securities. Managers employ a variety of fundamental and
  share-holder buybacks, debt exchanges, security issuance or other capital struc-         quantitative techniques to establish investment theses, and security types range
  ture adjustments. Security types can range from most senior in the capital struc-        broadly across equity, xed income, derivative or other security types. Fixed
  ture to most junior or subordinated, and frequently involve additional derivative        income strategies are typically quantitatively driven to measure the existing
  securities. Event-driven exposure includes a combination of sensitivities to equity      relationship between instruments and, in some cases, identify attractive positions
  markets, credit markets and idiosyncratic, company-speci c developments.                 in which the risk-adjusted spread between these instruments represents an
  Investment theses are typically predicated on fundamental characteristics (as            attractive opportunity for the investment manager. Relative value position may
  opposed to quantitative), with the realization of the thesis predicated on a             be involved in corporate transactions also, but as opposed to event driven expo-
  speci c development exogenous to the existing capital structure.                         sures, the investment thesis is predicated on realization of a pricing discrepancy
• Credit Arbitrage Strategies: Employ an investment process designed to isolate            between related securities, as opposed to the outcome of the corporate transac-
  attractive opportunities in corporate xed in-come securities. These include both         tion.
  senior and subordinated claims as well as bank debt and other outstanding
  obligations, structuring positions with little or no broad credit market exposure.
  These may also contain a limited exposure to government, sovereign, equity,
  convertible or other obligations, but the focus of the strategy is primarily on
    xed corporate obligations and other securities held as component positions
  within these structures. Managers typically employ fundamental credit analysis
  to evaluate the likelihood of an improvement in the issuer’s creditworthiness. In
  most cases, securities trade in liquid markets, and managers are only infre-
  quently or indirectly involved with company management. Fixed income: corpo-
  rate strategies di er from event driven; credit arbitrage in the former more
  typically involves more general market hedges, which may vary in the degree to
  which they limit xed income market exposure, while the latter typically involves
  arbitrage positions with little or no net credit market exposure, but are predi-
  cated on speci c, anticipated idiosyncratic developments.
• Macro: Investment managers who trade a broad range of strategies in which the
  investment process is predicated on movements in underlying economic vari-
  ables and the impact these have on equity, xed income, hard currency and
  commodity markets. Managers employ a variety of techniques, both discretion-
  ary and systematic analysis, combinations of top-down and bottom-up theses,
  quantitative and fundamental approaches and long- and short-term holding


54    2011 Outlook
Appendix
Explanations about Asset Classes
Sources of benchmark allocations and investor risk proÎles                                    were taken from Treasuries and Preferred Securities from Corporate Bonds. A
• Benchmark allocations represent the longer-term allocation of assets that is                level of overall risk similar to that of the original IS allocation was retained.
  deemed suitable for a particular investor. Except as described below, the bench-          • Alternative investments (AI) include hedge funds, private equity, real estate, and
  mark allocations expressed in this publication have been developed by UBS                   managed futures. The total benchmark allocation was determined by IS using
  Investment Solutions (IS), a business sector within UBS Wealth Management                   the process described above. The Wealth Management Americas Investment
  Americas that develops research-based traditional investments (e.g., managed                Committee (WMA IC) derived the AI subsector benchmark allocations by adopt-
  accounts and mutual fund options) and alternative strategies (e.g., hedge funds,            ing IS’ determination as to the appropriate subsector benchmark allocations
  private equity, and real estate) o ered to UBS clients. The benchmark allocations           with AI for the following risk pro les: conservative, moderately conservative,
  are provided for illustrative purposes only and were designed by IS for hypotheti-          moderate, moderate aggressive and aggressive. The WMA IC then developed
  cal US investors with a total return objective under seven di erent Investor Risk           subsector allocations for very conservative and very aggressive risk pro les by
  Pro les ranging from very conservative to very aggressive. In general, benchmark            taking the IS subsector weightings for conservative and aggressive risk pro le
  allocations will di er among investors according to their individual circum-                investors and applying them pro rata to the IS AI total benchmark allocations for
  stances, risk tolerance, return objectives and time horizon. Therefore, the bench-          very conservative and very aggressive, respectively. Allocations to AI as illustrated
  mark allocations in this publication may not be suitable for all investors or invest-       in this report may not be suitable for all investors. In particular, minimum net
  ment goals and should not be used as the sole basis of any investment decision.             worth requirements may apply.
  As always, please consult your UBS Financial Advisor to see how these weight-             • The background for the benchmark allocation attributed to commodities can be
  ings should be applied or modi ed according to your individual pro le and                   found in the WMR Education Note “A pragmatic approach to commodities,” 2
  investment goals.                                                                           May 2007.
• The process by which UBS Investment Solutions has derived the benchmark
  allocations can be described as follows. First, an allocation is made to broad            Deviations from benchmark allocation
  asset classes based on an investor’s risk tolerance and characteristics (such as          • The recommended tactical deviations from the benchmark are provided by
  preference for international investing). This is accomplished using optimization            WMR. They re ect our short- to medium-term assessment of market opportuni-
  methods within a mean-variance framework. Based on a proprietary set of                     ties and risks in the respective asset classes and market segments. Positive / zero
  capital market assumptions, including expected returns, risk, and correlation of            / negative tactical deviations correspond to an overweight / neutral / under-
  di erent asset classes, combinations of the broad asset classes are computed                weight stance for each respective asset class and market segment relative to
  that provide the highest level of expected return for each level of expected risk.          their benchmark allocation. The current allocation is the sum of the benchmark
  A qualitative judgmental overlay is then applied to the output of the optimiza-             allocation and the tactical deviation.
  tion process to arrive at the benchmark allocation. The capital market assump-            • Note that the regional allocations on the International Equities page are pro-
  tions used for the benchmark allocations are developed by UBS Global Asset                  vided on an unhedged basis (i.e., it is assumed that investors carry the underly-
  Management. UBS Global Asset Management is a subsidiary of UBS AG and an                    ing currency risk of such investments). Thus, the deviations from the benchmark
  af liate of UBS Financial Services Inc.                                                     re ect our views of the underlying equity and bond markets in combination with
• In addition to the benchmark allocations IS derived using the aforementioned                our assessment of the associated currencies. The two bar charts (“Equity Re-
  process, WMR determined the benchmark allocation by country of Non-US                       gions” and “Fixed Income Regions”) represent the relative attractiveness of
  Developed Equity and Non-US Fixed Income in proportion to each country’s                    countries (including the currency outlook) within a pure equity and pure xed
  market capitalization, and determined the benchmark allocation by Sector and                income portfolio, respectively. In contrast, the detailed asset allocation tables
  Industry Group of US Equity in proportion to each sector’s market capitalization.           integrate the country preferences within each asset class with the asset class
  WMR, in consultation with IS, also determined the benchmark allocation for US               preferences stated earlier in the report. As the tactical deviations at the asset
  dollar taxable xed income. It was derived from an existing moderate risk tax-               class level are attributed to countries in proportion to the countries’ market
  able xed income allocation developed by IS, which includes fewer xed income                 capitalization, the relative ranking among regions may be altered in the com-
  segments than the benchmark allocation presented here. The additional xed                   bined view.
  income segments were taken by WMR from related segments. For example, TIPS


Scale for tactical deviation charts

  Symbol            Description/De nition                     Symbol            Description/De nition                   Symbol            Description/De nition
  +                 moderate overweight vs. benchmark         –                 moderate underweight vs. benchmark      n                  neutral, i.e., on benchmark
  ++                overweight vs. benchmark                  ––                underweight vs. benchmark               n/a               not applicable
  +++               strong overweight vs. benchmark           –––               strong underweight vs. benchmark
Source: UBS WMR


                                                                                                                    Investment Strategy Guide December 2010                     55
Disclaimer
Wealth Management Research is published by Wealth Management & Swiss Bank and Wealth Management Americas, Business Divisions of UBS AG (UBS) or an af liate
thereof. In certain countries UBS AG is referred to as UBS SA. This publication is for your information only and is not intended as an o er, or a solicitation of an o er, to
buy or sell any investment or other speci c product. The analysis contained herein is based on numerous assumptions. Di erent assumptions could result in materially
di erent results. Certain services and products are subject to legal restrictions and cannot be o ered worldwide on an unrestricted basis and/or may not be eligible for sale
to all investors. All information and opinions expressed in this document were obtained from sources believed to be reliable and in good faith, but no representation or
warranty, express or implied, is made as to its accuracy or completeness (other than disclosures relating to UBS and its af liates). All information and opinions as well as
any prices indicated are currently only as of the date of this report, and are subject to change without notice. Opinions expressed herein may di er or be contrary to those
expressed by other business areas or divisions of UBS as a result of using di erent assumptions and/or criteria. At any time UBS AG and other companies in the UBS group
(or employees thereof) may have a long or short position, or deal as principal or agent, in relevant securities or provide advisory or other services to the issuer of relevant
securities or to a company connected with an issuer. Some investments may not be readily realisable since the market in the securities is illiquid and therefore valuing the
investment and identifying the risk to which you are exposed may be dif cult to quantify. UBS relies on information barriers to control the ow of information contained in
one or more areas within UBS, into other areas, units, divisions or af liates of UBS. Futures and options trading is considered risky. Past performance of an investment is no
guarantee for its future performance. Some investments may be subject to sudden and large falls in value and on realisation you may receive back less than you invested
or may be required to pay more. Changes in FX rates may have an adverse e ect on the price, value or income of an investment. We are of necessity unable to take into
account the particular investment objectives, nancial situation and needs of our individual clients and we would recommend that you take nancial and/or tax advice as
to the implications (including tax) of investing in any of the products mentioned herein. This document may not be reproduced or copies circulated without prior authority
of UBS or a subsidiary of UBS. UBS expressly prohibits the distribution and transfer of this document to third parties for any reason. UBS will not be liable for any claims or
lawsuits from any third parties arising from the use or distribution of this document. This report is for distribution only under such circumstances as may be permitted by
applicable law.

• Australia: Distributed by UBS Wealth Management Australia Ltd (Holder of Australian Financial Services License No. 231127), Chi ey Tower, 2 Chi ey Square, Sydney,
  New South Wales, NSW 2000. Bahamas: This publication is distributed to private clients of UBS (Bahamas) Ltd and is not intended for distribution to persons desig-
  nated as a Bahamian citizen or resident under the Bahamas Exchange Control Regulations. Canada: In Canada, this publication is distributed to clients of UBS Wealth
  Management Canada by UBS Investment Management Canada Inc.. Dubai: Research is issued by UBS AG Dubai Branch within the DIFC, is intended for professional
  clients only and is not for onward distribution within the United Arab Emirates. France: This publication is distributed by UBS (France) S.A., French “société anonyme”
  with share capital of € 125.726.944, 69, boulevard Haussmann F-75008 Paris, R.C.S. Paris B 421 255 670, to its clients and prospects. UBS (France) S.A. is a provider of
  investment services duly authorized according to the terms of the “Code Monétaire et Financier,” regulated by French banking and nancial authorities as the “Banque
  de France” and the “Autorité des Marchés Financiers.” Germany: The issuer under German Law is UBS Deutschland AG, Stephanstrasse 14-16, 60313 Frankfurt am
  Main. UBS Deutschland AG is authorized and regulated by the “Bundesanstalt für Finanzdienstleistungsaufsicht.“ Hong Kong: This publication is distributed to clients
  of UBS AG Hong Kong Branch by UBS AG Hong Kong Branch, a licensed bank under the Hong Kong Banking Ordinance and a registered institution under the Securities
  and Futures Ordinance. Indonesia: This research or publication is not intended and not prepared for purposes of public o ering of securities under the Indonesian
  Capital Market Law and its implementing regulations. Securities mentioned in this material have not been, and will not be, registered under the Indonesian Capital Mar-
  ket Law and regulations. Italy: This publication is distributed to the clients of UBS (Italia) S.p.A., via del vecchio politecnico 3 - Milano, an Italian bank duly authorized by
  Bank of Italy to the provision of nancial services and supervised by “Consob” and Bank of Italy. Jersey: UBS AG, Jersey Branch is regulated by the Jersey Financial
  Services Commission to carry on investment business and trust company business under the Financial Services (Jersey) Law 1998 (as amended) and to carry on banking
  business under the Banking Business (Jersey) Law 1991 (as amended). Luxembourg/Austria: This publication is not intended to constitute a public o er under Lux-
  embourg/Austrian law, but might be made available for information purposes to clients of UBS (Luxembourg) S.A./UBS (Luxembourg) S.A. Niederlassung Österreich, a
  regulated bank under the supervision of the “Commission de Surveillance du Secteur Financier” (CSSF), to which this publication has not been submitted for approval.
  Singapore: Please contact UBS AG Singapore branch, an exempt nancial adviser under the Singapore Financial Advisers Act (Cap. 110) and a wholesale bank licensed
  under the Singapore Banking Act (Cap. 19) regulated by the Monetary Authority of Singapore, in respect of any matters arising from, or in connection with, the analysis
  or report. Spain: This publication is distributed to clients of UBS Bank, S.A. by UBS Bank, S.A., a bank registered with the Bank of Spain. UAE: This research report is not
  intended to constitute an o er, sale or delivery of shares or other securities under the laws of the United Arab Emirates (UAE). The contents of this report have not been
  and will not be approved by any authority in the United Arab Emirates including the UAE Central Bank or Dubai Financial Authorities, the Emirates Securities and Com-
  modities Authority, the Dubai Financial Market, the Abu Dhabi Securities market or any other UAE exchange. UK: Approved by UBS AG, authorised and regulated in the
  UK by the Financial Services Authority. A member of the London Stock Exchange. This publication is distributed to private clients of UBS London in the UK. Where prod-
  ucts or services are provided from outside the UK they will not be covered by the UK regulatory regime or the Financial Services Compensation Scheme. USA: Distributed
  to US persons by UBS Financial Services Inc., a subsidiary of UBS AG. UBS Securities LLC is a subsidiary of UBS AG and an af liate of UBS Financial Services Inc. UBS Fi-
  nancial Services Inc. accepts responsibility for the content of a report prepared by a non-US af liate when it distributes reports to US persons. All transactions by a US
  person in the securities mentioned in this report should be e ected through a US-registered broker dealer af liated with UBS, and not through a non-US af liate.

©UBS 2010. The key symbol and UBS are among the registered and unregistered trademarks of UBS. All rights reserved.


56    2011 Outlook
©2010 UBS Financial Services Inc. All rights reserved. Member SIPC. All other trademarks, registered trademarks, service marks and registered service marks are of their
respective companies.


UBS Financial Services Inc.
www.ubs.com/ nancialservicesinc

UBS Financial Services Inc. is a subsidiary of UBS AG.
Order # X3076


ab
58    2011 Outlook

Outlook 2011

  • 1.
    Investment Strategy Guide WealthManagement Research 2011 Outlook On schedule, but over budget Global recovery on track Equities set to outperform Fiscal risks remain at the forefront ab
  • 2.
    Contents Video Feature (electronic version only) ............................ . . . . . . . . . . . 1 Publication details Focus: On Schedule, But Over Budget .......................... . . . . . . . . . . . 4 Publisher UBS Financial Services Inc. Will...May...Won’t.................................................. . . . . . . . . . . 10 Wealth Management Research 1285 Avenue of the Americas, 13th Floor Our Best Ideas....................................................... . . . . . . . . . 14 New York, NY 10019 Asset Allocation Overview........................................ . . . . . . . . . 15 This report has been prepared by UBS Financial Services Inc. (“UBS FS”) and UBS Washington Watch ................................................ . . . . . . . . . . 16 AG. Please see important disclaimer and disclosures at the end of the document. Market Scenarios .................................................. . . . . . . . . . . 19 This report was published on Economic Outlook ................................................. . . . . . . . . . . 20 8 December 2010. Financial Market Performance ................................... . . . . . . . . . 23 Editor in Chief Stephen Freedman Asset Classes ........................................................ . . . . . . . . . 24 Editor Marcy Tolko Foreign Exchange................................................... . . . . . . . . . 27 Authors International Markets ............................................. . . . . . . . . . 28 Mike Ryan Stephen Freedman US Equities........................................................... . . . . . . . . . 32 Katherine Klingensmith Thomas Berner US Fixed Income ................................................... . . . . . . . . . . 37 Brian Rose Jeremy Zirin Commodities ........................................................ . . . . . . . . . 42 David Le owitz Joe Sawe Alternative Investments ........................................... . . . . . . . . . 43 Anne Briglia Barry McAlinden Detailed Asset Allocation ......................................... . . . . . . . . . 45 Donald McLauchlan Kathleen McNamara Portfolio Analytics.................................................. . . . . . . . . . 47 Michael Tagliaferro Dominic Schnider Additional Asset Allocation Models ............................ . . . . . . . . . . 48 Project Management Paul Leeming Tactical Asset Allocation Performance Measurement ........ . . . . . . . . . 51 John Bellomo Chris Protasewich Disclaimers/Disclosures ........................................... . . . . . . . . . . 53 Desktop Publishing George Stilabower Courtney Leshko A new look... Video feature: To watch We welcome your feedback on the new Chief Investment Strategist design of this report. Email us: wmrfeed- Mike Ryan give a summary of back@ubs.com the 2011 Outlook report, please click here. Investment Strategy Guide December 2010 1
  • 3.
    2011 Outlook Dear Reader, As 2010 draws to a close, a new year will soon be upon us, presenting fresh hopes, fears, opportunities and challenges for investors. Will the year ahead mark a continuation of the economic and nancial healing process that started in the latter part of 2009 and progressed steadily through 2010? Or will the recovery prove eeting and give way to renewed weakness and market volatility? Can equity markets continue grinding higher amid relative modest Mike Ryan valuations and still solid earnings growth? Or will the absence of top-line growth and renewed concerns over debt problems in the developed world weigh on risk assets once again? With the Fed having already taken extraordinary measures to re ate the econ- omy and stabilize markets, there is some concern that policymakers are simply running out of options to keep things rolling along. Meanwhile, the change of Congressional leadership in Washington following the midterm elections ushers in a new era on Capitol Hill that could yet devolve into stalemate and dysfunc- tion. Finally, there are prospects for rising tensions across the globe ranging from Stephen Freedman trade disputes and hostile border clashes to possible proliferation of nuclear weapons. Coming in January But despite these challenges, nancial markets have endured, companies have adapted and the global economy has demonstrated both its exibility and resil- The Decade Ahead iency. Markets have normalized amid the aggressive steps taken by policymakers UBS will continue the outlook and are poised to generate fair returns over the next 12 months. Corporate conversation in January with America is once again in the business of reinventing itself and has emerged our rst ever outlook on the from the nancial crisis leaner, more ef cient and more pro table. Finally, the decade ahead. In this new emerging markets continue to create opportunities that will yield economic report, the global research team examines potential and nancial bene ts across the globe. trends, opportunities and risks that could impact individual We are entering the new year with a constructive outlook on risk assets — investors over the next ten equities in particular. While we want to remain fully informed of the risks, we years. also want to be properly positioned to take advantage of the opportunities that are certain to present themselves both within and across nancial markets in the year ahead. Have a happy, healthy and prosperous new year. Mike Ryan, CFA Stephen Freedman, PhD, CFA Chief Investment Strategist Head, Investment Strategy Head, Wealth Management Research – Americas Wealth Management Research – Americas Investment Strategy Guide December 2010 3
  • 4.
    Focus 2011 Outlook: Onschedule, but over budget Despite a broad rebound in markets contributed to periodic setbacks in risk assets during this during 2010, we opt to extend our past year. So as the economy progresses from the initial fragile phase of the rebound to the more stable stage of preference for risk assets by shifting the expansion, risk assets are likely to outperform. back to an overweight in equities and Still, it’s important to keep in mind that this recovery has retaining an overweight in credit within come with a pretty he y price tag. Budget de cits across xed income. The recent sharp run-up in the developed world have surged amid a combination of equity markets, concerns over European falling tax receipts, expensive bailouts of the private sec- tor and aggressive stimulus measures. In a number of sovereign debt and uncertainties developed countries, the government debt-to-GDP ratio associated with a new Congress could has risen to levels that pose serious threats to sovereign prompt a temporary pullback. However, credit ratings (see Fig. 2). This suggests that scal belt- tightening is now in order. But policymakers will need to we would view that as an opportunity strike the right balance between the need to reduce de - to add to positions given our more cits and the need to sustain growth. Move too slowly, and some of the dif culties that weighed heavily on the constructive intermediate-term outlook. eurozone could become even broader. Move too quickly, We look for the economic recovery process to remain on though, and the extraordinary measures put in place over schedule in the year ahead, as lingering cyclical chal- the past three years to re ate the economy and stabilize lenges continue to give way to a more sustainable expan- nancial markets will all have been for naught. sion. Progress will still be uneven, however, as strong de- mand drivers translate into above-trend growth within Against this backdrop, we express our preference for risk the emerging markets while ongoing balance sheet re- assets by moving back to an overweight in equities and pair dampens growth prospects in the developed world shi ing to an underweight in bonds. While stocks could (see Fig. 1). This slow but steady improvement in the come under some pressure early in 2011 amid uncertain- macro backdrop is still likely to be greeted with both ties on the domestic political front and fears of a broad- relief from elected of cials and cautious optimism on the ening of the EU debt crisis, elevated risk premiums, still part of investors. Fears of a double-dip recession solid earnings prospects and an accommodative Fig. 1: Economic growth being driven by emerging markets Fig. 2: Public debt serious threat to sovereign credit ratings UBS GDP growth forecasts for 2011, in % Gross public debt in % of GDP 2010 Japan 10 Italy Greece 8 Belgium France 6 US Portugal 4 UK Germany 2 Ireland Austria 0 Netherlands Japan Eurozone UK US World India China Spain 0 50 100 150 200 Source: UBS WMR, as of 6 December 2010 Source: OECD and UBS WMR, as of 6 December 2010 4 2011 Outlook
  • 5.
    Focus monetary policy stancesupport higher equity prices over That’s not to suggest however, that the macro outlook is the balance of 2011. Nevertheless, given the challenges completely devoid of threats or challenges. As we note in on the scal side – especially within the eurozone – we the “15 developments for 2011” section, we do not see continue to overweight emerging markets versus the de- any meaningful recovery in housing this year. In fact, we veloped world. Although emerging markets are trading look for home prices to decline by 5% in light of a heavy above their historical valuation levels relative to the devel- backlog of unsold homes, continued incidence of foreclo- oped markets (see Fig. 3), we still see room for outperfor- sure activity and negative housing equity conditions (see mance. In the xed income markets, we retain our over- Fig. 5). While we do not look for signi cant progress on weight on credit versus government paper as strong de cit reduction and expect the Bush tax cuts to be fully corporate balance sheets and lower default rates support extended for the next two years – in line with the agree- further compression in credit spreads. ment recently struck between President Obama and con- gressional Republicans – there will still be some scal Uneven but durable growth prospects drag over a winding down of stimulus spending. And As we’ve already noted, the economic growth prospects although lending standards are clearly easing, credit con- between the developed and developing world remain ditions have not fully normalized, which suggests that uneven in the a ermath of the global nancial crisis and banks will still be selective in extending credit to small associated recession. However, the recovery in the US businesses and consumers. Overall, our economics team appears to have progressed into a more durable expan- is forecasting a still below trend GDP growth rate of sion. The deleveraging in the consumer sector has paused about 2.7% for the US in 2011. for now with the savings rate leveling out at just below the 6% mark (see Fig. 4). Meanwhile, employment pros- Outside the US, the growth dynamic also remains bifur- pects show some signs of improvement as business con - cated. According to our global economics team, Japan is dence strengthens amid an easing of credit conditions expected to slow the most among the non-US developed and some increased visibility on the regulatory and tax nations, with growth decreasing by more than half, from fronts. The extraordinary policy measures put in place by 3.5% this past year to just 1.4% in 2011. But some so - the Fed – including an expanded commitment to quanti- ening is also likely in emerging economies, where growth tative easing – will also serve to buttress growth as still is expected to decelerate from 6.1% in 2010 to 5.6% in low-debt servicing costs and rising disposable income 2011, with China once again leading the way with GDP also allow for a higher level of consumer spending. growth of 9%. The lingering e ects of the credit crisis Fig. 3: Still reasonable valuations for Emerging Market Equities Fig. 4: Deleveraging of consumer sector has paused for now P/E ratio on forward 1-year consensus EPS estimates US personal saving as a % of disposable personal income 25 8 20 6 15 10 4 5 2 0 1995 1997 1999 2001 2003 2005 2007 2009 2011 0 World Emerging Markets 2000 2002 2004 2006 2008 2010 Source: Thomson Datastream and UBS WMR, as of 6 December 2010 Source: Bloomberg and UBS WMR, as of 6 December 2010 Investment Strategy Guide December 2010 5
  • 6.
    Focus and ongoing balancesheet repair process suggest that trade at a price/earnings multiple of 12.7x – well below the world economy is unlikely to reduce much of the ex- the long-term average of 15x seen during the past 20 cess capacity built up during the recession (see Fig. 6). As years (see Fig. 8). While we’re not looking for a signi - a result, slack in labor and capital should ease only grad- cant re-rating in stocks, some modest expansion in mul- ually, suggesting that in ation pressures remain excep- tiples coupled with still solid earnings growth should tionally well-contained across the globe — with the ex- yield above-average returns for 2011. Equity market valu- ception of a few regional hot spots within emerging ation is even more compelling when measured against markets. the relatively meager returns available for bonds and cash. It must be noted that equity risk premiums cur- The wages of fear and greed rently stand at abnormally high levels which suggests The economic outlook matters, of course, since fears of a equity outperformance in the year ahead (see Fig. 9). double-dip recession certainly contributed to the setbacks in equity markets during 2010. It’s o en said that nan- The valuation case on the credit side is a bit less compel- cial markets are driven by two things – and two things ling. Credit risk premiums have continued to narrow as only – fear and greed. While this is a gross oversimpli ca- default rates have trended lower, fears of a double-dip tion of the multitude of variables that investors must recession have abated and equity market volatility has both anticipate and react to when evaluating investment lessened. Spreads on investment grade corporate bonds choices, it does capture the sometimes bipolar nature of are now closing in on their longer-term historical aver- nancial markets. Keep in mind that the periodic shi s age, and are only moderately above the levels seen prior between the so-called “risk on” and “risk o ” trades to the crisis. Still, strong credit fundamentals and improv- de ned the top and bottom of the trading range in ing business prospects should leave corporate bonds well stocks in 2010 (see Fig. 7). If that is the case, then equity bid. High-yield valuation is a bit more attractive, with and credit risk premiums re ect just how much market spreads that still stand above the long-term average and participants are being paid to hold risk assets – and what pre-crisis levels (see Fig. 10). Strong corporate balance we may expect in returns for the year ahead. sheets, a continued need for income and a potential backing up of Treasury yields support further spread Despite a fairly broad rebound in risk assets during both compression and outperformance in credit. 2009 and 2010, valuations in both the equity and credit markets remain relatively attractive. US stocks currently Fig. 5: Look for home prices to remain under pressure in 2011 Fig. 6: Plenty of excess capacity in developed economies S&P/Case-Shiller Composite 20 Home Price Index Capacity Utilization, in % 225 90 85 200 80 175 75 150 70 65 125 1986 1990 1994 1998 2002 2006 2010 2006 2007 2008 2009 2010 2011 EU Capacity Utilization US Capacity Utilization Source: Bloomberg and UBS WMR, as of 6 December 2010 Source: Bloomberg, UBS WMR, as of 6 December 2010 6 2011 Outlook
  • 7.
    Focus More bullish butwith a bias tunity to time those shi s to bene t most from near-term Although we are moving to extend our preference for volatility or strength in markets. Therefore, we will only risk assets by overweighting equities, we recognize that indicate a short-term bias signal in circumstances when there is room for a pullback early in the year following we have a reasonable conviction that a near-term market the sharp run-up in equities since early November. We move is forthcoming that di ers from the general direc- therefore have introduced a new feature to our tactical tion of our tactical asset allocation recommendations. asset allocation guidance which we refer to as our “short-term bias indicator.” This indicator is intended to Gauging the risks o er some shorter-term perspective for those looking to As we’ve already noted, neither the economic outlook better time market entry and exit points. Not to be con- nor the return prospects within nancial markets are fused with the technical trading discipline maintained by without risk. So spots in the expansion and pullbacks in our Chief Technical Strategist, Peter Lee, these indicators equity and credit markets are therefore to be expected are meant to simply complement the longer fundamental along the way. While many factors may have an impact view embedded within our tactical asset allocation (TAA) on both growth and market returns, we view the follow- recommendations. At present, the short-term indicator is ing issues as posing some of the more serious challenges “mixed” which suggests there is a risk of a 5-10% pull- in the year ahead: back in stocks early in 2011 (see Figs. 11 and 12). Those who are more sensitive to price points may, therefore, • Eurozone crisis: Although the EU/IMF aid package to wish to use this indicator for timing purposes. help recapitalize Irish banks has eased immediate con- cerns over eurozone debt, the issue will continue to Keep in mind that our TAA views are intended to provide are up periodically during the year. Sovereign credit guidance over a horizon that spans a longer (9- to spreads remain at elevated levels, suggesting that pres- 12-month) time frame. These views are based on our risk sures are mounting for other EU players – especially and return expectations over this more extended horizon, Portugal. That said, concerns over the need for a bail- and should therefore be the primary driver of tactical out of Spain, clearly the most important of the “at shi s. It remains our view that investors seek guidance risk” countries in the EU, are overblown. The scale of over periods that span longer than just a month. How- Spain’s banking problems is not as severe as Ireland’s, ever, we also realize that the commitment of new funds and the state of scal de cit is nowhere near as acute and the need for periodic rebalancing a ords the oppor- as Greece’s. Fig. 7: Stocks trading within a range in 2010 Fig. 8: Stocks’ P/E moderately cheap S&P 500 S&P 500 P/E ratio based on 12-month forward consensus earnings 1250 25 1200 20 1150 15 1100 10 1050 5 1000 1991 1995 1999 2003 2007 2011 Jan-10 Mar-10 May-10 Jul-10 Sep-10 Nov-10 S&P 500 P/E Average Source: Bloomberg and UBS WMR, as of 6 December 2010 Source: Bloomberg and UBS WMR, as of 6 December 2010 Investment Strategy Guide December 2010 7
  • 8.
    Focus • Policy tighteningwithin emerging markets: Con- Should the atmosphere on Capitol Hill turn especially tinued divergence in growth prospects between the toxic, this could seriously jeopardize e orts to reduce developing and developed nations suggests that mon- the budget de cit, streamline regulation and promote etary policy paths are also likely to di er. There is still an expansion in free trade. None of these would be some concern that China (among others) may be well received by nancial markets. forced to tighten policy amid increased domestic price pressures and a building asset bubble. Although the ReÎlling the punchbowl scope of emerging markets tightening operations is Former Federal Reserve Chairman William McChesney limited, any ratcheting up of these e orts could Martin, Jr. once famously quipped that the role of the threaten risk assets given continued reliance on the Fed was akin to “removing the punch bowl” just when emerging markets for growth. the party really got going. It would appear, however, that the current Fed Chair, Ben Bernanke, is charting a radi- • Municipal budget woes: Recent volatile conditions in cally di erent course. Confronted with sluggish growth, the municipal market have raised concerns over a excess productive capacity and heavy debt balances, Ber- broader set of problems at the state and local levels. As nanke has had to resort to extraordinary measures in or- we point out in the “15 developments for 2011” sec- der to re ate the economy. In addition to e ectively tion, although the general obligation debt of states maintaining a zero-interest rate policy, the Fed has also such as California or cities like New York is secure, it is initiated a second phase of quantitative easing (com- possible that a high pro le municipality could be forced monly referred to as QE2) assets. This entails the Fed pur- to defer payments on its general obligation bonds. This chasing an additional USD 600 billion in Treasury debt in would likely send a chill through nancial markets and an e ort to keep rates low and jump-start growth. In prompt some “de-risking” as participants weighed the short, Bernanke keeps re lling the punchbowl in an ef- prospects for broader defaults. fort to turn wall owers into party animals. • Political missteps: The 112th Congress will be radi- It’s dif cult to gauge whether or not these most recent cally di erent from the 111th Congress – both compo- e orts by the Fed will bear fruit. Although bond yields sitionally and ideologically. This suggests that bipartisan and the US dollar are likely lower than they would other- compromise will be harder to come by and positioning wise have been if the Fed had not engaged in QE2, it’s for political advantage could dominate the agenda. too early to tell if this will have a meaningful impact in Fig. 9: Equities more attractively valued than bonds Fig. 10: Corporate spreads still higher than usual Equity risk premium (earnings yield minus real bond yield) Credit spreads on IG and HY US Corporates, in basis points 15 2,000 Equities attractive 10 1,500 relative to bonds 5 1,000 Equities unattractive 0 500 relative to bonds -5 0 1960 1970 1980 1990 2000 2010 1996 1998 2000 2002 2004 2006 2008 2010 US IG US HY Median IG Median HY US Equity Risk Premium (Forward earnings) average Source: DataStream, Shiller and UBS WMR, as of 6 December 2010 Source: BoAML, UBS WMR, as of 6 December 2010 8 2011 Outlook
  • 9.
    Focus reinvigorating housing activity,encouraging bank lend- Fig. 11: Corporate spreads still higher than usual ing, bolstering equity prices and stimulating exports. On Short-term bias Symbol De nition the other hand, there is concern over the backlash that Positive We expect a short-term upward QE2 has triggered both at home and abroad. Elected of- movement in the context of a broader ¨ range-bound market or downward trend cials are alarmed at the perceived overreach by the Fed, Sideways We expect a short-term phase of and the new Congress could mount a more serious chal- consolidation or sideways movement lenge to the Fed’s independence. Perhaps more concern- §¨ in the context of a broader intra-year upward or downward trend ing is the prospect that dollar weakness prompted by Negative We expect a short-term downward QE2 could ultimately trigger a wave of competitive cur- movement in the context of a broader ¨ rency devaluations that threaten global growth prospects. range-bound market or upward trend It may just turn out that Chairman Bernanke is unable to Source: UBS WMR keep re lling the punch – even if the party does show some signs of winding down. Fig. 12: Asset class preference Tactical deviations from benchmark Conclusion 9 to 12 month time hoziron Short-term As we ponder what’s to come during the next 12 bias months, we recognize that new and unforeseen threats Equity will likely emerge – but so too will opportunities. We therefore opt to position ourselves to best take advan- Fixed Income tage of the trend we see playing out through the balance Cash of the year by overweighting risk assets and continuing to focus on those regions, sectors and asset classes Commodities within which the growth and return prospects are the ––– –– – n + ++ +++ strongest. But we also stand ready to make tactical ad- Underweight Overweight justments to our forecasts, projections or asset class weightings as they become necessary due to changing Note: Black arrows indicate changes as of this report. Thick white arrows indicate a short- fundamentals, shi s in policy stance or signi cant repric- term bias. Source: UBS WMR, as 8 December 2010 ing within markets. Because while both the economy and nancial markets appear to be on smooth roads, some Fig. 13: Growth and inÏation potholes and even an occasional detour are certain to lie ahead. ’10F ’11F ’12F ’10F ’11F ’12F World 4.1 3.7 3.8 2.9 3.0 3.5 US 2.8 2.7 2.8 1.6 1.6 2.1 Mike Ryan, CFA, Chief Investment Strategist Canada 2.9 2.3 2.7 1.8 2.6 2.4 Japan 3.5 1.4 2.0 –0.7 –0.3 0.4 Eurozone 1.8 1.9 1.9 1.5 1.9 2.4 UK 1.8 2.3 2.2 3.2 2.8 1.9 China 10.0 9.0 9.0 3.3 4.3 4.0 India 9.0 8.0 8.6 9.2 6.0 6.8 Russia 4.1 4.8 4.5 6.9 8.5 7.7 Brazil 7.9 5.4 5.1 5.8 5.4 4.8 Asia ex-Jp/Chi/Ind 5.3 4.3 4.3 2.7 3.2 3.2 In developing the forecasts set forth above, WMR economists worked in collaboration with economists employed by UBS Investment Research (INV). INV is published by UBS Investment Bank. Forecasts and estimates are current only as of the date of this publication and may change without notice. F: forecast, Source: UBS WMR, as of 7 December 2010 Investment Strategy Guide December 2010 9
  • 10.
    Will...May...Won’t? 15 developments for2011 In last year’s Outlook report, we o ered up our in- deter any further run on eurozone debt, credit default augural list of the Îve developments that will, may swaps surged to new post-crisis highs for several of the and won’t happen over the following year. While more vulnerable players in the EU even a er the Irish our crystal ball was a bit o the mark on certain package was announced. While this may bring some subjects, the overall record was fairly solid. So at relief, the respite is likely to prove only temporary. Atten- the risk of tempting the forecasting gods once tion is already shi ing to the other weak links in the EU again, we reprise our list of developments this year. – Spain and Portugal. Given Spain’s relative importance We have tried to update the list to focus on those in the eurozone and Germany’s reluctance to underwrite developments that will likely have the greatest im- any additional rescue packages, the crisis will shi from pact on the economy, Înancial markets and policy concerns over liquidity to fears of solvency. choices in the year ahead. The list is far from com- prehensive, but it does focus on the major issues 3. Corporate cash hoarding will end: that will shape the world — at least our corner of it Confronted with limited investment opportunities and a — over the next 12 months. still uncertain economic backdrop, corporate treasurers became more cautious custodians of balance sheets over the past several years. As a result, the ratio of cash as a Five things that will happen: percentage of total assets surged to multi-decade highs. 1. Equity markets will provide normalized returns: While this may have served companies well during the Following a year of solid if unspectacular performance, most acute phase of the nancial crisis, these large cash we look for stocks to provide somewhat above average reserves have become less optimal as business conditions returns. Still solid earnings growth, undemanding valua- rebound and liquidity improves. With the focus now less tion levels and a supportive monetary policy backdrop all on survival and more on enhancing shareholder value, suggest further solid gains in the year ahead. Some fear we look for corporations to begin deploying these cash that the negative impact from the end of the stimulus balances more aggressively. While a fair portion will cer- spending could prompt a contraction in growth, which tainly be targeted to business investment spending and would in turn weigh on equity prices. However, the re- strategic acquisitions, we also look for an expansion in engagement of the consumer, easing of credit conditions share buybacks and increases in dividend payouts. and an acceleration in business investment spending will largely o set the drag from the winding down of federal 4. Geopolitical threats will intensify: spending. However, with earnings unlikely to accelerate In last year’s Outlook, we noted that geopolitical risks sharply following last year’s impressive rebound, signi - would emerge from a host of potential hot spots. We cantly above-normal returns would require a sharp in- focused on tensions on the Korean peninsula, increased crease in P/E multiples. But as we note later on, the pros- belligerence on the part of Iran, Venezuela and the ongo- pects for a material re-rating of stocks in the a ermath ing con ict in Afghanistan and Iraq. This year we expect of a nancial crisis are limited. those threats to intensify and potentially even broaden. Iran is edging closer to producing enough “ ssible” ma- 2. The sovereign debt crisis will grow more acute: terial to make a nuclear warhead – and procuring a deliv- Those who viewed the EU/IMF bailout of Greece as a sort ery vehicle capable of hitting Western Europe. Mean- of “ rewall” in the eurozone sovereign debt crisis must while, North Korea has engaged in open hostilities have been bitterly disappointed by the recent EUR 85 against South Korea in an e ort to distract attention billion lifeline thrown to Ireland. The need for further away from a leadership transition and a moribund econ- massive capital injections within the banking industry omy. But perhaps most troubling of all has been the dis- nally forced Ireland to submit to an EU/IMF-led bailout closure of thwarted terror attacks on cargo aircra package. Yet, even more disappointment lies ahead. De- bound for the US and other Western destinations. With spite an emergency liquidity facility that was intended to 2011 marking the tenth anniversary of the WTC and 10 2011 Outlook
  • 11.
    Will...May...Won’t Pentagon 9/11 attacks,the threat of further strikes will sessment sectors, it is possible that a general-purpose remain elevated. The risk that has recently had the big- government with a higher public pro le may default. gest e ect on markets – and one that will likely persist Several cities that have been hit particularly hard both by – is fear over the political cohesion of Europe. the national recession and regional structural decline are most vulnerable. Although the general obligation debt of 5. Congress will deteriorate into gridlock: states such as California and Illinois or cities such as New The midterm elections ushered in an entirely new political York and Chicago is secure, municipalities like Detroit dynamic on Capitol Hill, as signi cant gains by Republi- and Harrisburg could be forced to defer payments on cans yielded a split in control of Congress. Not only does their general obligation bonds. the GOP now control the House, but the Democratic ma- jority in the Senate has been narrowed considerably. 2. The economy and corporate proÎts may surprise While both sides have claimed to want to work together to the upside: to nd common ground, the prospects for meaningful Economists continue to look for sluggish growth in 2011, progress on a host of issues, ranging from climate with consensus forecasting 2.5% real US GDP growth. change legislation to immigration reform, are slim. The continued overhang from consumer deleveraging, Meanwhile, notwithstanding the recent agreement on nancial sector recapitalization and withdrawal of scal continuing the Bush-era tax cuts, the two parties are stimulus will certainly restrain growth prospects. How- likely to clash frequently and ercely over spending and ever, recent evidence of an improvement in business con- tax issues. While both have pledged to reduce the de cit, dence, more robust job creation despite a lackluster each has embraced a fundamentally di erent approach. November labor market report and re-engagement of the Given the disastrous government shutdown in the wake consumer suggests the risks are now to the upside. of the 1994 midterm elections, Republican congressional Meanwhile, companies have continued to reduce costs leaders will be reluctant to overplay their hand in a simi- as evidenced by the surprisingly strong Q3 productivity lar manner this time around, but they will struggle with gures. This combination of better top-line growth and an enthusiastic freshman class eager to eschew de cit impressive productivity gains suggest that the string of spending. E orts to stymie funding in order to starve stronger-than-expected earnings reports could last for healthcare reform run the risk of a similar backlash if the several more quarters as analysts have been slow to raise e ort is seen as overly heavy-handed. One of the few pro t projections. areas in which the two parties may nd common ground is trade policy. The impact on the economy could be 3. Emerging markets may stumble: damaging if Congress were to pass protectionist legisla- Most strategists, including us, continue to look for strong tion that threatened global growth. growth and solid investment returns from the emerging markets (EM) this year. We have opted to retain our over- weight as emerging market nations continue to bene t Five things that may happen: from improving global growth prospects, but face few of 1. A high proÎle municipality may default: the structural headwinds confronting the developed Credit conditions within the municipal market remain world. However, there are apt to be a few stumbles and challenging as the consequences of the nancial crisis setbacks along the way as developing nations continue and associated recession have continued to weigh on to grapple with issues ranging from the in ationary im- state and local nances. A combination of declining tax pact of increased capital in ows and a rising tide of pro- revenues, overextension of public services and under- tectionism to the uneven transition from a purely export/ funded pension plans has le a number of municipalities infrastructure spending-led growth model. A number of vulnerable to signi cant ratings downgrades and debt central banks, including China’s, have been engaged in service interruptions. While the risk of default will remain policy tightening in an e ort to limit in ation pressures concentrated in the housing, healthcare and special as- and prevent asset bubbles from building. At the same Investment Strategy Guide December 2010 11
  • 12.
    Will...May...Won’t time, there areincreased tensions on the trade front as purchases of Treasury debt, as in ation expectations developed nations pressure large EM countries to adopt a surged higher. Further increases in in ation fears – or more balanced growth approach that includes encourag- greater reluctance on the part of foreigners to under- ing domestic demand. Keep in mind that EM are no lon- write US debt – could prompt additional bouts of volatil- ger trading at a deep discount to the developed world. ity, especially on the very long end of the yield curve So if risk factors emerge or if investors simply opt to take which is not the primary focus of the Fed’s purchases. some pro ts, EM could face temporary lapses of under- performance. Five things that will not happen: 4. Rising protectionism may trigger a trade war: 1. P/E multiples will not exceed long-term averages: Last year, we noted that a trade war would not break While equity markets continued to grind higher during out, simply because it was in no one’s best interest to see 2010, the move was driven by a strong surge in corpo- global commerce contract. However, as steady economic rate pro ts, with S&P 500 earnings rebounding around growth resumes and unemployment remains elevated, 35% to USD 84 per share. Valuation multiples actually elected of cials are focusing once again on issues rang- contracted, with the price/earnings ratio falling from ing from protracted global trade imbalances and distor- 14.2 to 12.7 times forward 12-month consensus earn- tive government subsidies to manipulative foreign ex- ings estimates. There are those who now see equity change practices and the failure to honor property rights prices rising sharply higher as multiples expand above and legal contracts. These issues broadly fall under the their historical averages (roughly 15x) amid low in ation, banner of “fair trade” rather than “free trade,” and have accommodative policy and somewhat improved growth created a backlash in many nations struggling with slug- prospects. We rather expect multiples to remain some- gish growth prospects and stubbornly high trade de cits. what below-average in the a ermath of the nancial While China’s reluctance to meaningfully revalue the crisis and the uncertainty surrounding the unwinding of remnimbi has been the most visible point of contention extraordinarily easy monetary and scal policies. with US of cials, the Fed’s own program to stimulate the economy by ooding the system with liquidity through 2. The housing market will not sustain a recovery: “quantitative easing” has drawn broad criticism as well. Those waiting for a recovery in the housing market will As a result, fears that a round of competitive currency have to wait a bit longer. According to our real estate devaluations could trigger a broader trade war can no analyst, Jon Woloshin, the backlog of unsold homes, longer be so easily dismissed. continued high level of foreclosure activity and preva- lence of negative housing equity will serve to limit recov- 5. Bond market volatility may increase: ery prospects. Our economics team expects the national Policymakers have made it clear that the federal funds Case-Schiller Home Price Index to decline by 5% in 2011. rate will be kept low “for an extended period” — which Keep in mind, however, that since housing activity is al- we take to mean through the rst quarter of 2012. ready at an extremely depressed level and price declines Meanwhile, the USD 600 billion program for purchasing are likely to be manageable, continued weakness in resi- Treasury debt, which targets Treasury debt in the 5- to dential real estate won’t trigger another recession. In- 10-year maturity range, will run until June — and could stead, we look for the economy to continue to expand at be extended even longer if the Fed deems it necessary. a sluggish but relatively steady pace this year, despite the This would seem to support the notion that any rate in- overhang from housing. creases for the coming year will be moderate in scale as the Fed continues to play an outsized role in the bond 3. There will not be meaningful progress in deÎcit market. But it is precisely the Fed’s intervention that reduction: could lead to more volatile conditions in the bond mar- Despite encouraging e orts by the president’s bipartisan ket. Rates rose sharply following the Fed’s initial commission on scal reform and sincere campaign 12 2011 Outlook
  • 13.
    Will...May...Won’t pledges by TeaParty candidates, little meaningful prog- 4. Commodity prices will not collapse: ress will be made this year on reducing the size of the In the wake of the housing-inspired global nancial crisis, budget de cit. Both parties expressed support for the there are those obsessed with identifying the next asset commission’s e orts, with each side embracing certain bubble poised to burst. Given the sharp run-up in prices over the past two years, commodities have been cited by many (along with 2011: Five things we believe... Treasury debt, emerging markets and sports memorabilia) as the next most likely asset vulnerable to a collapse. While ...will happen ...may happen ... won’t happen certain types of industrial metals and ag- ricultural goods have gotten a bit pricey Equity markets will P/E multiples will in the near term, we do not foresee a A high proÏle munic- provide normalized not exceed long- ipality may default broad-based pullback in commodity returns term averages prices. In fact, our commodity strategist, The sovereign debt The economy and The housing market Dominic Schnider, just recently raised his crisis will grow corporate proÏts may will not sustain a target price on oil for 2011 from an aver- more acute surprise to the upside recovery age of USD 85 per barrel to an average of USD 95 per barrel, with spikes above There will not be the USD 100 mark likely in the coming Corporate cash Emerging markets meaningful progress hoarding will end may stumble year. in deÏcit reduction Rising protectionism 5. InÏation will not be a problem: Geopolitical threats Commodity prices This is another repeat performer from last may trigger a trade will intensify will not collapse war year, but needs updating because of the continued massive pump-priming exer- Congress will dete- Bond market volatil- InÐation will not be cises undertaken by the Fed. With rates riorate into gridlock ity may increase a problem already e ectively at 0%, policymakers were forced to employ more exotic mea- sures to help re ate assets, stabilize - aspects of the preliminary proposal to reduce the de cit. nancial markets and stimulate growth. This has rekindled However, the report did not gain enough support within fears that in ation pressures may accelerate as re ected the commission to be put to a vote. Neither party has yet in the sudden jump in bond yields following the initial put forth a credible plan for reducing the level of govern- stage of QE2. But while in ation expectations did indeed ment outlays, reforming entitlement spending or increas- rise, they still remain low by almost any objective bench- ing tax receipts – all required for any meaningful progress mark. What’s more, with the economy still growing at a on closing the scal shortfall. Senate Republican leaders sluggish pace and the unemployment rate unlikely to fall have pledged to eliminate the practice of congressional very sharply in the near term, price pressures are apt to earmarks which tend to in ate spending. The White remain muted. But there’s a caveat: while price pressures House has proposed freezing the pay of federal employ- will remain subdued domestically, other parts of the ees for two years. The e ect of both measures would be world — including China — will be grappling with in a- minimal. So while both parties have expressed willing- tion trouble spots. ness to leverage the commission’s work in the wake of the eurozone debt crisis, the prospects for substantive Michael P. Ryan, CFA, Chief Investment Strategist progress in 2011 are limited, in light of the deep ideolog- ical divide in Congress. Investment Strategy Guide December 2010 13
  • 14.
    Our Best Ideasat a Glance The following list represents investment strategy recommendations that WMR believes will provide attractive opportunities over the next 9-12 months. Asset Classes Preference for Equities over Bonds Currencies Preference for minor currencies, in particular EM, commodity producers (CAD, AUD) and Euro proxies (CHF, SEK, NOK). Equities Fixed Income Current allocation: 49.0% Current allocation: 32.0% International markets Within US dollar Fixed Income • Emerging Market equities • High Yield Corporate bonds • Especially Brazil, China, Russia • Investment Grade BBB-rated and Taiwan Corporates • UK equities • Emerging Market USD sover- eigns and quasi-sovereigns, Within US equities with a preference for Mexico • Information Technology: In par- and Brazil ticular Hardware Technology and Equipment • Emerging Market USD Corpo- rates, in particular commodity • Consumer Staples: especially producers Emerging Market geared com- panies within Household and • Trust Preferred Securities Personal Products as well as Pages 30, 37 Food, Beverage and Tobacco. Alternative Investments • Within Industrials: Airfreight Current allocation: 12.0% and logistics companies • Included in portfolio for • Within Financials: Money center diversi cation purposes. banks, Brokers and Life Insurers Page 43 • Within Consumer Discretionary: Auto-related companies Commodities Current allocation: 5.0% • Within Telecom: Wireless towers and data-centers • We see upside potential for crude oil, gold and selected • Within Energy: Oil eld services agricultural commodities. companies Overweight Page 42 Neutral • Preference for Growth over Underweight Cash Value stocks Current allocation: 2.0% Pages 28, 32, 34 • Yield may be pinned near zero for another 12 months. For an explanation of current allocation, please see the note on the following page. 14 2011 Outlook
  • 15.
    Asset Allocation Overview Asset Allocation Overview WMR Tactical View Model Portfolio Moderate Risk Pro le (in %) Benchmark Allocation Allocation Deviation Current Tactical Change Equities Reasonable valuations make equities more attractive than the low yields o ered by bonds. We prefer Overweight 44.0 +5.0 S 49.0 emerging over developed markets. US Equities We expect solid earnings growth, but 2011 consensus estimates appear too high, leaving room for Neutral 32.0 +0.0 32.0 disappointments. US Large Cap Value Moderate Large-cap value appears less attractive than growth. Underweight 11.0 -1.5 T 9.5 US Large Cap Growth Moderate 11.0 +3.0 S 14.0 Valuations and our sector tilts suggest a preference for Growth over Value. Overweight US Mid Cap Neutral 5.0 +0.0 5.0 Expensive versus large caps. Greater M&A activity could be a positive in 2011. US Small Cap Expensive versus large caps but Ênancing conditions improving. Greater M&A activity could be a Neutral 3.0 +0.0 S 3.0 positive in 2011. US Real Estate Investment Trusts (REITs) Moderate Remains expensive despite underperformance in recent weeks. Fundamentals still challenging. Underweight 2.0 -1.5 T 0.5 Non-US Developed Equities We see potential in UK stocks. Eurozone valuations are attractive but sovereign debt situation creates Neutral 10.0 +0.0 S 10.0 risk. Japan not as expensive as it used to be but fundamentals are weak. Emerging Market (EM) Equities EM equities are more attractively valued than developed markets and more immune to Êscal risk. Overweight 2.0 +5.0 S 7.0 Fixed Income Low yields unattractive relative to equities. Fed may remain on hold throughout 2011, which should help Underweight 37.0 -5.0 T 32.0 to limit the rise in long rates. US Fixed Income Moderate Currency considerations suggest a neutral stance versus non-US Êxed income. Underweight 29.0 -2.5 T 26.5 Non-US Fixed Income Moderate The dollar should remain weak but already appears undervalued against many currencies. Japan’s Underweight 8.0 -2.5 T 5.5 economic woes and extremely low rates make yen debt unattractive. Cash (USD) Neutral 2.0 +0.0 2.0 Low yields make the opportunity cost of holding cash high. Commodities Neutral 5.0 +0.0 5.0 Demand from emerging markets should support prices, but negative roll yields likely to trim total returns. Alternative Investments Neutral 12.0 +0.0 12.0 No tactical view. Included into portfolio for diversiÊcation purposes. “WMR tactical deviation” legend: Overweight Underweight Neutral “Change” legend: S Upgrade T Downgrade Source: UBS WMR and Investment Solutions, as of 8 December 2010. For end notes, please see appendix. The benchmark allocations are provided for illustrative purposes only by UBS for a hypothetical US investor with a moderate investor risk proÊle and total return objective. See “Sources of benchmark allocations and investor risk proÊles” in the Appendix for a detailed explanation regarding the source of benchmark allocations and their suitability and the source of investor risk proÊles. The current allocation is the sum of the benchmark allocation and the tactical deviation. See “Deviations from benchmark allocation” in the Appendix regarding the interpreta- tion of the suggested tactical deviations from benchmark. Investment Strategy Guide December 2010 15
  • 16.
    Washington Watch The ghtfor scal leadership The 112th session of Congress promises to be very Leadership sets the tone busy, but not so very productive. We expect that The selection of leadership in the House for both parties with power balanced more evenly between the two promises to keep tensions high. The reelection of Nancy parties there will be a rancorous tug-of-war. Con- Pelosi as the minority leader in the House was a close gress will accomplish little – only what it must – in vote, and speaks to the decimation of the “Blue Dog” 2011. Contrary to the conventional wisdom that a moderate cohort. At the helm of House Republicans is divided government is good for markets, squab- John Boehner, who represents a continuation of previous bling in Washington may actually be negative. positions but will have to reckon with a large freshman class. As many of these newcomers have support from DeÎcits, spending and jobs the Tea Party movement, Boehner will have much to con- We expect that the next Congress will focus on de cits, tend with even passing “routine” legislation to keep the spending and jobs, with their eyes already on the 2012 government going. presidential election. Both Democrats and Republicans are claiming leadership on scal reform, but display dis- Unlike most sessions, the new 112th Congress will have tinct ideological approaches, with Democrats focused on signi cant routine business to clean up a er the previous receipts (tax increases) and Republicans on expenditures session. The 111th Congress is poised to leave quite a (spending cuts). Even as the Senate does not have to few un nished a airs, potentially including only a short- pass major tax legislation in 2011, we expect scal sus- term extension of the budget bill, as well as the “extend- tainability to dominate Washington. Interestingly, the ers” bill, which includes many popular provisions. But as bipartisan De cit Commission’s aggressive proposals to the new Representatives will come with little experience cut entitlements, the size of government, defense and and lots of passion to limit excess, Research and Develop- other politically sensitive programs, along with a restruc- ment and charitable contributions tax credits as well as turing of the tax code, met with some support from both Build America Bonds could at least temporarily expire. parties (see Fig. 1). However, when it comes to taking Additionally, increasing the debt ceiling could be a major political risks and compromising, we expect that both hurdle. The US government is expected to hit its self- parties’ desire to have a “pristine” voting record to imposed debt limit of just over USD 14 trillion by May of dangle in front of voters come 2012 will block progress. 2011, and as the government is running large de cits without the ability to take on new debt, it would close. We expect the ceiling will eventually be increased, but Fig. 1: DeÎcit Commission’s proposal improves the deÎcit Fig. 2: US debt issuance near its limit Outlays to exceed expenditures for the next decade, in % of GDP The debt ceiling, in USD trillion 28 14 24 12 20 10 8 16 6 12 4 1970 1980 1990 2000 2010 2020 Revenues (historical) Outlays (historical) 2 Revenues (Commission's proposal) Outlays (Commission's proposal) 0 Revenues (CBO's adjusted baseline) Outlays (CBO's adjusted baseline) 1996 1998 2000 2002 2004 2006 2008 2010 Note: CBO’s adjusted baseline is the CBO baseline projections adjusted for the Bush tax cut extention and AMT indexation. Source: CBO, National Commission on Fiscal Responsi- bility and Reform, UBS WMR, as of 3 December 2010 Source: Bloomberg, UBS WMR, as of 23 November 2010 16 2011 Outlook
  • 17.
    Washington Watch the ghtcould be brutal and the government could come mandate for the Fed to seek full employment) — and close to or actually temporarily close. History speaks to the while they are unlikely to succeed, Fed of cials will likely political and economic cost of such a strategy, but new face hostility when on The Hill. Additionally, we doubt a members will come in ready to ght and not to abide by carbon tax or other energy legislation will make any ma- conventional wisdom. At a minimum, Republicans may be jor headway. able to demand concessions from the White House for approving a higher ceiling (see Fig. 2). Protectionism could rise, but chances for legislation have diminished. Until recently, the Obama White House Legislation as political statement lacked a push for free trade. However, in an e ort to be- The House is likely to pass and repeal many pieces of leg- come more business-friendly, the Administration shi ed. islation, with little expectation that such laws will make it It inherited three Free Trade Agreements, and as of the through the Senate, let alone the White House. For exam- end of 2010 it pushed the FTA with South Korea; agree- ple, we expect that the House will repeal the healthcare ments with Colombia and Panama are pending. While bill (but this will be ignored by the Senate) and substan- Republicans are traditionally moderately more pro-free tially modify the nancial sector reform bill. House Repub- trade than Democrats, given the in uence of the Tea licans could, however, successfully delay or alter elements Party movement, we are unlikely to see a concerted ef- of these bills. fort in this direction. There is still the chance that protec- tionism will increase, especially disputes with China, if Tempers may are during discussions about taxes and unemployment stays high. spending, but that doesn’t translate into policy. Some House Republicans have come out in favor of limiting Sometimes a strong government helps spending to 2008 levels. Unemployment bene ts could be Overall, we expect a divided and divisive Congress. We limited going forward and earmarked “pork” funding are in an environment where strong government can be could also be curtailed, but these changes involve rela- a good thing for markets given the need for achieving tively small price tags. Sacred areas, like defense, may ac- long-term scal sustainability, eliminating uncertainty tually be discussed, while entitlements — which make up regarding the long-term tax code and healthcare ex- the bulk of the expenditures — are unlikely to be curtailed penses and even for keeping the government open. even if there is consensus that this eventually must hap- However, we think that Congress will struggle to pass pen. So-called compromises may involve both sides get- even routine legislation, let alone implement some of the ting what they want, with an increase in spending and a fundamental reforms now being discussed. Such a situa- hike in taxes, but this just exacerbates the situation. The tion suggests continuity for some areas, but promises uncertainty about the government’s long-term scal sus- con ict around government funding. Policy issues are tainability threatens Treasuries and the US dollar, but is critical to markets, but we are unlikely to see much of a unlikely to result in a crisis in the near term. boost from DC. Political divide leaves some policies untouched Katherine Klingensmith, Strategist There are some areas where the party split will preclude aggressive legislation, leaving the status quo intact. For example, we expect that the government-sponsored en- terprises will be debated but not privatized in the next Congress. In addition, the role and independence of the Federal Reserve could be a hotly debated subject, espe- cially with the controversial increase in quantitative easing, but we doubt legislation will be passed. Republicans have called for reform of the Federal Reserve Act (removing the Investment Strategy Guide December 2010 17
  • 18.
    18 2011 Outlook
  • 19.
    Market Scenarios In thetables below, we discuss four potential market scenarios for 2011 and assign a probability to each. While a con- tinued moderate recovery remains our base-case scenario, we see some risk of a renewed slowdown. There is also a possibility that a strong recovery will take hold. A “worst of both worlds” stag ation scenario that combines high in a- tion with weak economic growth remains unlikely in our view. Moderate High • The global economy continues to be on an expansion Goldilocks Supercycle Growth Recovery course, but the recovery is more subdued than in prior cycles because of deleveraging. Low • The impact of the eurozone debt crisis remains geo- 70% Growth Negative Deflation Stagflation graphically contained. Private demand is strong enough to overcome tighter scal policy in the developed econ- Growth omies. Negative Low High • The abundant slack in the economy and modest growth Inflation Inflation Inflation rate keeps in ationary pressures from building up. Renewed High • The fragile recovery in the developed economies stalls Goldilocks Supercycle Growth as scal consolidation creates additional headwinds. Downturn • Most countries su er at least one quarter of negative Low growth. Consumers cut back on spending while com- 15% Growth Negative Deflation Stagflation panies hold on to their cash. • Falling commodity prices and a rise in excess capacities Growth sends the US in ation rate toward zero. Negative Low High Inflation Inflation Inflation Strong High • High pro t margins and low interest rates encourage a Goldilocks Supercycle Growth recovery surge in investment spending. Improvements in the labor market allow a more dynamic consumer recovery. Low • US GDP growth rate accelerates to 4% and global 10% Growth Negative Deflation Stagflation growth reaches 5% in 2011. • In ation rises along with commodity prices, especially Growth in the emerging markets, but overheating is avoided. Negative Low High Inflation Inflation Inflation Stagflation High • Rising commodity prices set an in ationary process in Goldilocks Supercycle Growth motion and contribute to choking the emerging recov- Low ery. • Policy is tightened sharply in China and other emerging 5% Growth Negative Deflation Stagflation markets in an attempt to keep in ation under control. • The combination of rising price levels and weak growth Growth prospects poses signi cant challenges to most nancial Negative Low High assets, but gold soars to record highs. Inflation Inflation Inflation Source: UBS WMR Investment Strategy Guide December 2010 19
  • 20.
    US Economic Outlook USconsumer comeback as growth engine With the boost to production from inventory re- the growth recovery and to positive job formation. As sta- building and Îscal policy now in the past, the key ble labor income growth fuels consumption, the positive challenge in 2011 for the US economy will be to feedback loop between consumption, job formation and grow Înal private demand without crutches. Labor labor income is already rmly in place. Second, the work- income has already reacted visibly to Înal demand week has risen generously since 2009 and now stands at and related job growth and the Fed will remain about two-thirds of the way between the recession supportive. We are therefore conÎdent that the trough and the pre-recession level. We believe businesses US economy can withstand a possible Îscal drag will likely employ workers more vigorously once the work- on growth. week has reached its pre-recession level. Finally, the household savings rate has been hovering above 5% since Show me the purchasing power late 2008. This is strong evidence that the savings rate We estimate that the scal package boosted real GDP adjustment is over, barring any signi cant negative net growth by about 1 percentage point (pp) and inventories wealth shock. Given these developments, we expect con- added another 1.6pps in 2010. Government spending sumption to grow at a healthy clip of around 3% in 2011. grew by “only” about 1.1%, as rising federal spending was o set by the spending slump at local governments. InÏation and the Fed Taking into account the government’s roughly 20% share The Fed has made it clear that it doesn’t plan to spoil the in GDP and allowing for income multipliers, we think the party. We think that it will follow through with buying total impact was about 1%. We expect an only slightly the full USD 600 billion in Treasuries by end of 2Q11 and, lower government spending growth rate next year, as a er allowing for some passive balance sheet tightening, some moderation in federal spending will meet less weak- it will only proactively raise rates in early 2012. This kind ness from local governments. We expect the Bush tax cuts of monetary support will be necessary to avoid the in a- to be extended in 2011; however, one of the key risks to tion rate from slipping even further. While we expect in- our outlook for the year is a bigger scal drag on growth. ation to rise moderately in 2011, we think the risk is for So the key question remains: Will consumer purchasing a fairly at in ation rate throughout the year. power be potent enough to keep the train rolling? Thomas Berner, CFA, Analyst Trends signal sustainable consumption growth First, labor income gauges have already visibly reacted to Fig. 1: A er inventory boost Înal demand to drive growth Fig. 2: CPI inÏation poised to rise in 2011 US real GDP growth, q/q annualized, in % US inflation (Consumer Price Index), year-over-year, in % 10 6 5 4 0 2 -5 0 -10 -2 2005 2006 2007 2008 2009 2010 2011 -4 Consumption Investment in nonresidential structures Investment in equipment & soware Residential investment 2000 2002 2004 2006 2008 2010 Inventories Net exports CPI Core CPI Government Real GDP (% q/q annualized) Note: Shaded region represents UBS WMR forecasts. Source: Thomson Datastream, UBS Source: Thomson Datastream, UBS WMR, as of 2 December 2010 WMR, as of 3 December 2010 20 2011 Outlook
  • 21.
    Global Economic Outlook Thebig divide The recovery in Europe stands on more solid pressures could continue to mount, even though the ground, but it is still worryingly uneven between People’s Bank of China has been tightening policy. At the core and peripheral countries. Chinese growth some stage, Chinese monetary policy will be confronted will continue to lead the rest of Asia as well as com- with the impossibility of having capital mobility, a xed modity-supplying countries – but with inÏation ris- exchange rate and an independent (and hence ing, tougher choices lie ahead. In Japan, 2010 is in ation- ghting) central bank all at the same time. ending with a whimper but the recovery should Which of the three objectives will have to be abandoned continue. will be one of the most important questions for 2011. Brazil has already introduced capital controls, and some Europe: strong at the core, so on the outside Asian countries are starting to implement similar mea- As the European debt crisis is not over yet, nancial mar- sures. In our view, given the objective of the 12th Five- kets are increasingly dividing the region’s debt into Year Plan to reorient the Chinese economy from export- “safe” and “unsafe.” In Germany and other successful led growth to spur domestic demand, the ongoing real European nations, export-fueled growth has now spilled appreciation pressures on the Chinese yuan will be met over to domestic demand, leading to virtuous growth partly by higher in ation and partly by letting the cur- cycles. These economies could use higher interest rate rency appreciate. levels from the European Central Bank (ECB) to cool growth – in stark contrast to a still depressed Southern Japan: modest recovery should resume Europe, where even a 1% ECB policy rate is too high. Japanese exports slowed in the second half of 2010 as The ECB will have to manage this situation cautiously, as the stronger yen made it dif cult for Japanese factories every rate hike could trigger further tensions in the euro- to compete. In addition, domestic auto sales dropped zone. Switzerland remains a safe haven investment, and sharply a er the end of a government incentive scheme. interest rates are likely to increase there, as well as in However, these negatives should prove temporary. We Sweden and Norway. expect the recovery to resume in 2011, especially if the yen weakens in line with our forecasts. The impossible trinity in emerging markets China continues to pull ahead a er successfully cooling Thomas Berner, CFA, Analyst down its economy in spring 2010, and growth in Asia is likely to be solid as we go forward. However, in ation Fig. 3: Healthy, sustainable level of manufacturing activity Fig. 4: InÏation resurgence a key risk in some countries Global real activity, standardized (mean=0, standard deviation=1) Global CPI inflation rates, year-over-year, in % 3 10 2 8 1 6 0 4 -1 2 -2 0 -3 -2 -4 -4 1998 2000 2002 2004 2006 2008 2010 1998 2000 2002 2004 2006 2008 2010 US Eurozone UK Japan China US Eurozone UK Japan China Source: Bloomberg, UBS WMR, as of 3 December 2010 Source: Thomson Datastream, UBS WMR, as of 2 December 2010 Investment Strategy Guide December 2010 21
  • 22.
    Economic Outlook: Chartbook Fig.5: Housing recovery likely to be lackluster Fig. 6: House prices to fall again moderately in 2011 US housing market, left scale in % of GDP, right scale, in % US house prices, left scale in %, right scale in year-over-year % 8 4.0 15 3.0 6 3.0 5 2.0 4 2.0 -5 2 1.0 1.0 -15 0 0.0 0.0 -25 1950 1960 1970 1980 1990 2000 2010 1980 1985 1990 1995 2000 2005 2010 Residential real estate investment (lhs) Homeowner vacancy rate (lhs) Residential real estate investment (historical average) (lhs) S&P/Case-Shiller house price index (rhs) Homeowner vacancy rate (rhs) FHFA house price index (rhs) Source: Thomson Datastream, UBS WMR, as of 3 December 2010 Source: Thomson Datastream, UBS WMR, as of 3 December 2010 Fig. 7: Credit health has normalized Fig. 8: Net wealth has recovered, savings rate stabilized US credit health (level) and real activity (level, inverted scale) US household net wealth and savings rate, in % of dispsable income 3.5 105 10 14 20 12 4.0 103 30 10 4.5 8 40 5.0 101 6 50 4 5.5 99 60 2 70 6.0 0 97 80 -2 6.5 1975 1980 1985 1990 1995 2000 2005 2010 1950 1960 1970 1980 1990 2000 2010 US credit health thermometer (lhs) ISM Manufacturing PMI (rhs) Savings rate (lhs) Net wealth to disposable income ratio (rhs) Note: For full explanation of this chart, please see appendix. Note: Right scale is inverted Source: Thomson Datastream, UBS WMR, as of 3 December 2010 Source: Thomson Datastream, UBS WMR, as of 3 December 2010 Fig. 9: Federal deÎcit poised to narrow further Fig. 10: Current Fed forecasts imply USD 580bn in purchases US Federal budget balance, in % of GDP Estimated Treasury purchase amount, in USD billion 4 3,500 NAIRU est: 3,000 5.30 0 5.50 2,500 5.70 2,000 5.90 -4 1,500 6.10 -8 1,000 500 -12 0 1968 1978 1988 1998 2008 8.5 8.7 8.9 9.1 9.3 9.5 9.7 9.9 US federal budget balance as a % of GDP Note: QE2 Treasury purchase amount assuming Taylor rule approach and inËation forecast Note: Sum of monthly federal budget balance over the past 12 months divided by current- of 1.4%. NAIRU stands for Non-Accelerating InËation Rate of Unemployment quarter annualized nominal GDP. Source: Bloomberg, UBS WMR, as of 3 December 2010 Source: UBS WMR, as of 3 December 2010 22 2011 Outlook
  • 23.
    Financial Market Performance Fig.1: Asset Classes Fig. 2: International Equity Markets Total return in USD and % Total return in USD and % US Equities US Equity Non-US Dev. Equities Non-US Developed EM Equities EMU US Fixed Income UK Non-US Fixed Income Japan Cash (USD) Emerging Markets Commodities -10% -5% 0% 5% 10% 15% 20% -5% 0% 5% 10% 15% 20% year-to-date quarter-to-date year-to-date quarter-to-date Source: Bloomberg, UBS WMR, as of 7 December 2010 Source: Bloomberg, UBS WMR, as of 7 December 2010 Fig. 3: International Fixed Income Fig. 4: International Equity Markets Total return in USD and % Total return in USD and % US Fixed Income Large Cap Value Large Cap Growth Non-US Fixed Income Large Cap EMU Mid Cap UK Small Cap Japan REITs -10% -5% 0% 5% 10% 15% 20% 0% 5% 10% 15% 20% 25% 30% year-to-date quarter-to-date year-to-date quarter-to-date Source: Bloomberg, UBS WMR, as of 7 December 2010 Source: Bloomberg, UBS WMR, as of 7 December 2010 Fig. 5: US Fixed Income Fig. 6: Currency appreciation vs. USD Total return in USD and % Appreciation vs. USD in % Treasuries EUR TIPS GBP Agencies JPY IG Corporates HY Corporates CAD Preferreds CHF Mortgages AUD EM Sovereigns BRL Municipal bonds -4% -2% 0% 2% 4% 6% 8% 10% 12% 14% 16% -10% -5% 0% 5% 10% 15% year-to-date quarter-to-date year-to-date quarter-to-date Source: BoAML, UBS WMR, as of 7 December 2010 Source: Thomson Datastream, UBS WMR, as of 7 December 2010 Investment Strategy Guide December 2010 23
  • 24.
    Asset Classes Equities tooutperform bonds in 2011 Equities are on track to outperform bonds by a mar- below their long-term averages. And, as discussed by gin in 2010. As the global recovery moves into a Mike Ryan in the lead article, we do not expect P/Es to more sustainable expansion phase, we believe that fully converge to these averages during the course of equities have the potential to post higher returns 2011; given ongoing macro and scal uncertainties, even than bonds over the next year. Therefore, we up- a partial convergence could lead to equity market returns grade equities to a tactical overweight and reduce in excess of those achievable in other asset classes. Îxed income to underweight. Overall, the cyclical and earnings picture should pro- Just a year ago, there was much talk of the “Lost De- vide a supportive environment for equities. We expect cade” in reference to the 2000-2009 period during which earnings growth to decelerate in 2011. This is to be ex- bond markets massively outperformed stocks. Mean- pected as the earnings growth just shy of 40% which while, a few weeks before the end of the year, stocks are 2010 is set to deliver can hardly be repeated without sig- on track to outperform bonds for the second year in a ni cant pro t margin expansion. Yet, we expect some row, though the margin is thinner this time around. As modest margin expansion combined with revenue 2011 approaches, we are turning more constructive on growth to generate earnings growth in the high single equities than we have been during the last three digits to low double digits depending on the market. And quarters. while bottom-up consensus earning estimates have moved ahead of these gures, indicating some potential First, we believe that equity valuations are moderately for downward earnings revisions, the gap is not unusually attractive. While the valuation gap is by no means com- large and is not a cause for concern, in our view. parable to the 50% upside potential that existed at the bottom of the market in March 2009, we consider global Finally, as far as timing and sentiment factors are con- equities to be trading at about 6% below fair value. Equi- cerned, we consider the current situation as fairly bal- ties’ appeal is especially noticeable when compared to anced for equities. The sentiment of individual investors their main alternative, namely bonds. As Figure 4 indi- has been improving over the last three months, suggest- cates, the earnings yield on global equities exceeds the ing that a gradual reengagement into equity markets yield on global bonds by a margin that has only been sur- may be in the making (see Fig. 6). This is compounded by passed 5% of the time during the last 20 years. Price/ the Federal Reserve’s latest quantitative easing program earnings ratios (P/E) across the major equity markets are (QE2) which should entice some investors with cash ow Fig. 1: Asset class preference Fig. 2: Asset class and regional preferences Tactical deviations from benchmark Tactical deviations from benchmark Short-term bias US Equity Non-US Developed Eq. Equity Emerging Market Eq. Fixed Income US Fixed Income Cash Non-US Fixed Income Cash (USD) Commodities Commodities ––– –– – n + ++ +++ ––– –– – n + ++ +++ Underweight Overweight Underweight Overweight Note: Black arrows indicate changes as of this report. Thick white arrows indicate a short- Note: Arrows indicate changes as of this report. term bias. Source: UBS WMR, as of 8 December 2010 Source: UBS WMR, as of 8 December 2010 24 2011 Outlook
  • 25.
    Asset Classes needs tolook for better alternatives than low-yielding demand growth arising from the global expansion is bonds in dividend-yielding portions of the stock market. likely to create some scarcity in selected areas such as Among institutional investors, sentiment has been im- crude oil, some base metals and parts of the agricultural proving as well without being euphoric. While risks aris- complex. This should create upward pressure on spot ing from the European sovereign debt situation do pose prices. Yet for diversi ed commodity exposure such as signi cant challenges, barring a dramatic worsening of that provided by the DJ UBS commodity index, the poten- the situation over there, we believe that more evidence tial for price appreciation should be limited to around that a gradual economic expansion is on course will likely 10%. Moreover, investors are unlikely to reap such re- lead to further sentiment improvement. turns. Total returns to investors who typically invest di- rectly or indirectly (through funds) via nancial futures are Low returns at best in bond markets also determined by the term structure of future prices. Even a er their most recent rise, bond yields are hovering These tend to be in what is known as a “contango” near historical lows. We see very limited value in bond structure, where futures prices decline as they come close markets, even though we do not expect a signi cant sell- to maturity. This means that a substantial portion of the o in the near term. While we believe that Fed policy will spot return is already re ected in futures prices and will anchor yields at low levels for most of 2011 and expect a de facto be eaten away, leaving only moderate total re- largely range-bound yield environment, returns from cou- turns. For an overview of our preferred sectors within the pon clipping are hardly a compelling reason to invest in commodity space, please consult the section on page 42. bonds at this stage. Moreover, should the economy start to gather steam at a greater pace than we expect, bonds Stephen R. Freedman, PhD, CFA, Strategist could come under pressure. Overall, we view bonds as unattractive, with risks clearly skewed to the downside. As a result, we have downgraded xed income to a tacti- cal underweight in our model portfolios. Commodities o er selected opportunities We see selected opportunities within commodity mar- kets, although we are not aggressively recommending entering the asset class at this stage. We believe that Fig. 3: Asset class scorecard Fig. 4: Stocks present signiÎcant yield advantage over bonds Scores range from -3 (very unattractive) to +3 (very attractive) Global earnings yield and global bond yield, in % Valuation Cyclical Timing Overall 12 12 Global Equities +1 +1 +0 +1 10 9 Commodities –1 +1 +0 +0 8 Fixed Income –2 –1 +0 –1 6 6 4 3 2 0 0 1990 1994 1998 2002 2006 2010 Global bond yields, BarCap Global Aggregate, Yield to Worst, (lhs) Global earnings yield, MSCI AC World, inverse P/E ratio, (rhs) Source: UBS WMR, as of 8 December 2010 Source: Bloomberg, IBES, UBS WMR, as of 6 December 2010 Investment Strategy Guide December 2010 25
  • 26.
    Asset Classes: Chartbook Fig.5: Leading indicators imply 12% global stock return Fig. 6: Improving individual investor sentiment MSCI World total return and OECD leading indicators, in % AAII net bullish sentiment (individual investor survey) 60 15 60 Individual investors bullish 10 30 30 5 0 0 0 -5 -30 -10 -30 -60 -15 Individual investors bearish -60 1970 1975 1980 1985 1990 1995 2000 2005 2010 2000 2002 2004 2006 2008 2010 MSCI World, YoY Total Return, (lhs) Net bullish sentiment 3-month average OECD Composite Leading Indicator, Trend Restored YoY, (rhs) Long-term average Last data point Source: American Association of Individual Investors, Bloomberg, UBS WMR, as of 2 Source: Bloomberg, UBS WMR, as of 6 December 2010 December 2010 Fig. 7: Still some equity upside according to cyclical playbook Fig. 8: Earnings momentum still positive but slowing Average cycle since mid-1940’s around market bottoms (month “0”) 12-month forward Earnings-per-share, normalized Apr-08=100 160 65 120 60 100 140 55 80 120 50 60 100 40 45 20 80 40 Apr-08 Oct-08 Apr-09 Oct-09 Apr-10 Oct-10 -24 -20 -16 -12 -8 -4 0 4 8 12 16 20 24 28 32 36 US UK EMU S&P 500 Trailing real earnings ISM Manufacturing PMI (rhs) World Japan Non-US developed Emerging Markets Source: Thomson Financial, Bloomberg, UBS WMR, as of 6 December 2010 Note: Vertical line shows number of months since March 2009 market bottom. Source: IBES, UBS WMR, as of 6 December 2010 Fig. 9: Commodity total returns a ected by negative roll yield Fig. 10: Investors already have long positions in commodities DJUBS Commodity index, return components, in % Futures contracts (non-commercial) and net long as a % of open interest 60 2,500,000 25 30 1,500,000 15 0 500,000 5 -30 -500,000 -5 -60 -1,500,000 -15 2000 2002 2004 2006 2008 2010 2000 2002 2004 2006 2008 2010 Spot return YoY Excess return YoY Roll yield YoY Long Short Net Net long / open interest (rhs) Source: Bloomberg, UBS WMR, as of 6 December 2010 Source: Bloomberg, UBS WMR, as of 6 December 2010 26 2011 Outlook
  • 27.
    Foreign Exchange Diversify carefullyout of the US dollar The US dollar has seen tremendous volatility, end- The euro is also not a favorite ing the year weaker than it started and on a down- The euro is not the best alternative to the dollar, al- ward trajectory. We expect the dollar to remain un- though some export-oriented countries will likely do very der pressure, but the other major currencies — the well. Europe is challenged by members struggling to ser- euro, the British pound and the Japanese yen — are vice their debts, exposing deep structural troubles within also struggling. The profound weakness of the ma- the eurozone. These troubles hurt the euro’s viability as a jor reserve currencies has pushed investors into the global reserve currency. We think a near-term crisis is un- currencies of commodity producers and emerging likely, but expect that peripheral European countries will markets. We expect this trend to continue, and en- continue to produce ugly headlines and volatility. We courage US investors to add such exposure. That doubt the European Central Bank will hike rates next said, we do not expect a dollar crisis in the near year, thereby keeping the euro from gaining in yield at- term, as the alternatives remain unattractive or too tractiveness. We expect EURUSD to uctuate in a broad small to challenge the dollar’s role. 1.50–1.20 range. Europe’s debt problems limit the euro’s rise above 1.50, and if it approaches 1.20, we expect QE2 is not the dollar’s friend dollar-rich Asian and Middle Eastern investors will un- The Federal Reserve’s implementation of additional quan- wind their greenback exposure. titative easing (QE2) hurts the dollar as a “safe” currency. Before QE2, the dollar tended to fall when global eco- Diversify on dips nomic conditions improved, as risk aversion fell and equi- We continue to advise investors to seek alternatives to ties gained (see Fig. 9 on page 31). Now, however, the the dollar and euro. Given the strength of alternatives Fed has indicated it will increase money supply in adverse (see Fig. 1) such as the Australian dollar or the Swiss times. As a result, when the global economy rises, the franc, we recommend investors add these currencies on dollar is likely to weaken because other countries o er any dips. Although buying into weakness carries down- better growth — and when the economy falters, inves- side risk, we expect these currencies to appreciate over tors could ee the US dollar as the Fed prints more the long term. Additionally, diversi ed investments in the money. Since increases in interest rates in 2011 are smaller developed world and in emerging market curren- unlikely, the US dollar is likely to continue on a down- cies may be prudent. ward path. Katherine Klingensmith, Strategist Fig. 1: Australian dollar and Swiss franc showing strength Fig. 2: Low rates may keep pressure on US dollar AUD/USD and CHF/USD exchange rates Valuation according to PPP versus 3-month interest rate 1.1 50 Expensive AUD 40 Valuation according to PPP 1.0 NZD 30 0.9 20 CHF 10 EUR SEK 0.8 JPY NOK 0 CAD GBP 3-month interest rate 0.7 –10 USD 0.6 –20 Cheap 2005 2006 2007 2008 2009 2010 2011 –30 –1 0 1 2 3 4 5 AUD/USD CHF/USD Note: As of 15 November 2010 Source: Bloomberg, UBS WMR, as of 7 December 2010 Source: Fitch, Bloomberg, UBS WMR. Investment Strategy Guide December 2010 27
  • 28.
    International Equities Continue tofavor emerging markets Within global equities, we continue to favor emerg- BRICs are attractive, but India’s valuations are ing markets (EM). While they are no longer that stretched cheap as they were, their strong economic growth Within EM, we tend to focus on the BRICs (Brazil, Russia, potential gives them an advantage over developed India, China). With the exception of Russia, we expect markets. We particularly like China, Brazil and Russia. these countries to enjoy high economic growth rates for For investors unwilling to invest in EM equities, we many years to come. Rather than growth potential, the suggest developed market stocks that can beneÎt main attraction of the Russian equity market is that it from EM growth. The UK looks relatively attractive trades on very low valuations, which compensates for the from this viewpoint. Eurozone equities are also at- risky political situation. China and Brazil o er an attrac- tractive based purely on valuations, but we maintain tive combination of reasonable valuations and high a cautious view due to the ongoing public debt crisis. growth. While we are optimistic on the long-term pros- pects for India, valuations have become stretched and we Economic backdrop favors emerging markets see better opportunities elsewhere. As we have stressed throughout the year, emerging markets (EM) are still trading at a discount to developed Indonesia is another country with a large population and markets. We expect this gap to gradually disappear strong growth potential. Many analysts view it as the leading to EM outperformance, especially given EM’s next country to look at a er the BRICs and we agree that solid economic backdrop. Many developed countries are it should do well in the long run. However, its valuations facing large budget de cits and high government debt currently look very expensive and we recommend avoid- levels. Most will therefore start to tighten scal policy ing this market. While Taiwan is a developed economy, its despite less than solid economic conditions. While we do equity market is usually included in EM. Around half of not expect this to derail the economic recovery, the the market capitalization is comprised of IT companies, a majority of developed countries are likely to experience sector we expect to outperform in 2011. Valuations are below-average growth in 2011. In contrast, public reasonable, making Taiwan one of our favorite “emerg- nances in most EM countries are in good condition, ing” markets. requiring fewer tightening measures. The biggest eco- nomic threat to EM is higher commodity prices, especially Developed markets: moderate earnings growth for food, which could cause in ation to accelerate and In most developed markets we expect moderate earnings require tighter monetary policy. growth in 2011 a er the strong recovery in 2010. Eco- Fig. 3: Equity Regions Fig. 4: Regional equity valuations and earnings momentum Tactical deviations from benchmark 12-month forward PE; 3-month change in 12-month forward consensus earnings 24 12 Emerging Markets 20 10 UK 16 8 Other Developed 12 6 8 4 US 4 2 Japan 0 0 -4 -2 Eurozone US Eurozone UK Japan Emerging Canada Australia Switzerland Markets ––– –– – n + ++ +++ underweight overweight Price/Earnings ratio (lhs) Earnings momentum, in % (rhs) Source: UBS WMR, as of 8 December 2010 Source: Citigroup, Bloomberg, UBS WMR, as of 6 December 2010 28 2011 Outlook
  • 29.
    International Equities nomic growthshould be modest and in ation rates low, ongoing public debt crisis is a tail risk that is too big to so that rapid revenue growth appears unlikely. Moreover, ignore. If the situation further deteriorates, it could begin pro t margins are already high by historical standards. to impact economic growth and corporate earnings. The While they could improve a bit further in 2011, at some euro could also drop further against the US dollar, hurt- point competitive forces will kick in and limit margin ex- ing performance in dollar terms. pansion. Earnings should expand at a moderate rate but we see some risk that consensus earnings forecasts will Japan not as expensive as it used to be prove to be too optimistic. Japanese equities are not as expensive as they used to be. The equity market underperformed in 2010, and We recommend an overweight position on the UK cost-cutting e orts have o set some of the impact of the but not the eurozone stronger yen. However, we do not see any particularly Among the developed markets, the US does not look good reason for US investors to put money into the Japa- expensive from a historical point of view. Other countries nese market. A weaker yen would help boost corporate have more favorable valuations at the moment. The UK earnings but reduce returns in dollar terms. and the eurozone look the most attractive based on valuations. Other developed market equities upgraded to neutral The UK is embarking on a four-year scal austerity plan, Among the other main developed equity markets, eco- which dampens its intermediate growth prospects. How- nomic conditions are relatively strong in Australia and ever, from an equity point of view, it is key to note that Canada, with higher commodity prices providing a boost. about 70% of the earnings of UK-listed large-cap com- We see potential in Australia due to its commodity panies come from outside the UK, with a large exposure exposure and undemanding valuations. In contrast, Ca- to rapidly growing EM. UK equities include mining com- nadian stocks are more expensive, o setting the appeal panies and energy stocks that are bene tting from high from the growth in commodity-related earnings. Switzer- commodity prices. We are therefore constructive on the land has also done reasonably well, avoiding the turmoil earnings outlook, and view the cheap valuations as an in the eurozone. It o ers attractive valuations but its de- investment opportunity. fensive sector composition may place its stock market at a disadvantage. While eurozone equity valuations are also attractive, the Brian Rose, PhD, Strategist Fig. 5: Emerging market valuations Fig. 6: Recent economic data better than consensus 12-month forward PE ratios; Price to book value ratios Economic surprise indices 20 8 150 16 100 6 50 12 0 4 8 -50 2 -100 4 -150 0 0 -200 China Brazil Russia India Indonesia Taiwan Price/Earnings ratio (lhs) Price/Book value ratio (rhs) Jan-09 Aug-09 Mar-10 Oct-10 US Eurozone UK Japan G10 Source: IBES, Datastream, UBS WMR, as of 6 December 2010 Source: Bloomberg, as of 6 December 2010 Investment Strategy Guide December 2010 29
  • 30.
    International Fixed Income Seekexposure to emerging markets and commodity producers Our views on international Îxed income are closely In Japan, government debt levels are extremely high, linked to the outlook for foreign exchange rates. while bond yields are extremely low. The yen is also one On balance, we view foreign bonds as equally at- of the few currencies that we expect to depreciate signif- tractive to US bonds. However, we do see pockets icantly against the dollar, hence our view of Japan as one of opportunity in minor foreign bond markets on of the least attractive bond markets. currency grounds, including emerging markets and commodity producers. The UK currently o ers slightly higher 10-year govern- ment bond yields than the US, but the in ation rate is With global bond yields near historical lows, appropri- much higher. The Bank of England has maintained very ately choosing among international xed income markets loose monetary policy, and in ation is likely to remain has become paramount. The relative performance of US high relative to most other developed economies. and non-US xed income investments is usually domi- nated by exchange rate movements. As noted in the FX Emerging markets and commodity producers rela- section, we expect the dollar to remain under downward tively attractive pressure in 2011. Nonetheless, we recommend a neutral In contrast to the developed economies, most emerging tactical stance between US and non-US bonds. Our markets feature relatively healthy government nances. benchmark measure of non-US xed income consists Higher growth rates and younger populations make it largely of the eurozone, Japan and the UK, all of which easier to keep budget de cits under control, and govern- have weak currency and bond market fundamentals. ment bond ratings continue to trend higher. We also have a positive view on emerging market currencies. In Developed economies struggling with deÎcits addition, many countries issue debt denominated in US The ongoing public debt crisis in the eurozone has dollars, allowing exposure without exchange rate risk. caused bond markets to become more volatile than However, investing in emerging market bonds is still risky, usual. Greece and Ireland have already sought outside which suggests diversifying across countries. We also see help to deal with their debt. Portugal and Spain may be opportunities in the bond markets of commodity produc- next in line. Economic conditions in these countries re- ers, such as Canada and Australia. They enjoy favorable main poor and low tax revenues will make it very dif cult currency prospects and o er higher yields than the US. for them to narrow their budget de cits. The situation may continue to weigh down European bond markets. Brian Rose, PhD, Strategist Fig. 7: Fixed Income Regions Fig 8: Japanese yields low despite high debt Tactical deviations from benchmarks Central government debt and 10-yr bond yields 1,000 3.5 Other 3.0 800 US 2.5 600 2.0 UK 1.5 400 1.0 Eurozone 200 0.5 Japan 0 0.0 1996 1998 2000 2002 2004 2006 2008 2010 ––– –– – n + ++ +++ underweight overweight Central government debt, JPY trn (lhs) 10-yr JGB yield, in % (rhs) Source: UBS WMR, as of 8 December 2010 Source: Bloomberg, UBS WMR, as of 6 December 2010 30 2011 Outlook
  • 31.
    International markets: Chartbook Fig.9: Dollar and equities move in opposite directions Fig. 10: Equity market rally continued in 4Q USD nominal effective exchange rate and the S&P 500 Equity market returns in USD and local currency 110 Emerging Markets 1,600 100 Japan 1,200 UK 90 800 EMU 80 400 Non-US Developed 70 0 US Equity 2000 2002 2004 2006 2008 2010 USD nominal effective exchange rate (lhs) 0 2 4 6 8 10 S&P 500 Index (rhs) Quarter-to-date returns in USD Quarter-to-date returns in local currency Source: Bloomberg, UBS WMR, as of 6 December 2010 Source: Bloomberg, UBS WMR, as of 6 December 2010 Fig. 11: ProÎt margins heading for record highs Fig. 12: Developing economies have better public Înances Profits as % of sales, 2010-2012 are UBS forecasts Government debt and budget deficit, as % of GDP 120 20 2010 100 Government debt 15 80 2000 60 10 40 5 2000 2010 20 0 0 1992 1996 2000 2004 2008 2012 0 2 4 6 8 10 United States Global Euro Zone Emerging UK Budget deficit Advanced economies Developing Economies Source: UBS, as of 7 December 2010 Source: IMF, UBS WMR, as of 2 December 2010 Fig. 13: European debt market showing stress Fig. 14: Government bonds o ering low yields 10 year government bond yields, spread over Germany, in %-pts 10-year government bond yields, in % 12 6.0 10 5.0 8 4.0 6 3.0 4 2 2.0 0 1.0 Jan-09 Aug-09 Mar-10 Oct-10 2008 2009 2010 Portugal Ireland Greece Spain US EMU UK Canada Source: Bloomberg, UBS WMR as of 6 December 2010 Source: Bloomberg, as of 6 December 2010 Investment Strategy Guide December 2010 31
  • 32.
    US Equities: Sectors Focuson fundamentals With the economy now more clearly on a sustain- fund these upgrades by downgrading Utilities, Telecom able growth path, we are entering a period where and Healthcare (see Fig. 2). bottom up sector fundamentals will become the primary driver of sector performance. This stands in Info Tech (overweight)—low expectations contrast to the last three years when the business Tech is now our favored sector within the equity markets. cycle was the more dominant force. We favor sec- We like the sector’s strong product cycle-driven growth tors that will beneÎt from global growth. outlook (think smartphones and tablets), emerging mar- kets exposure and strong balance sheets, suggesting that Over the past few years we have pointed out that there substantial cash will likely be returned to shareholders. can be big divergences in performance between cyclical Despite these positive attributes, the sector trades at only and defensive sectors of the market based on important a modest 4% valuation premium to the overall equity turning points in the business cycle. Not surprisingly, de- market. With continued growth in the global economy, fensive sectors outperform when business conditions de- we think this positions the sector to surprise on the up- teriorate but cyclical sectors outperform when the econ- side. Within the sector we favor Tech Hardware & Equip- omy rebounds. With the economy now on a more ment as well as So ware & Services. We are neutral on sustainable, mid-cycle growth path, history suggests in- Semiconductors. vestors should look beyond the simple cyclical versus de- fensive trade and focus more on bottom up fundamen- Staples (overweight)—our favorite dividend play tals for each sector. The divergence between cyclical and Consumer Staples is our most preferred defensive sector. defensive sectors is most pronounced when markets are In light of the sector’s high emerging market exposure either weaker or stronger than average (see Fig. 1). As and strong brands in domestic markets we believe the we move into a period of more normal returns for equity sector should consistently grow earnings over the next markets, therefore, the cyclical versus defensive trade several years. However, the shares trade at only a modest becomes less important. valuation premium to the market. We believe this valua- tion premium will likely expand. In a low interest rate With the US consumer recovering but still facing substan- environment, stocks with strong dividends are becoming tial headwinds, we believe the sectors most leveraged to increasingly attractive. Consumer Staples companies o er global growth are best positioned. As a result, we are the best combination of current dividend yield and future upgrading Energy, Industrials, Tech and Materials. We dividend growth. Fig. 1: Cyclical stance less important in “normal” markets Fig. 2: Sector fundamentals to matter more as cycle matures Average performance of cyclicals and defensives by annual S&P 500 return Tactical deviations from benchmark 30 Tech Cons Staples Energy 15 Industrials Financials 0 Utilities Healthcare -15 Materials Cons Disc -30 Telecom Negative 0-10% 10-20% 20%+ ––– –– – n + ++ +++ Cyclicals Defensives underweight overweight Source: UBS WMR, as of 6 December 2010 Source: Bloomberg and UBS WMR, as of 3 December 2010 Note: Arrows indicate ratings changes as of this report 32 2011 Outlook
  • 33.
    US Equities: Sectors Industrials(overweight)—utilization rebounding valuation metrics and is currently trading at a 15% P/E We upgrade Industrials to overweight in light of likely discount versus the overall market. However, with the continued upside in capacity utilization, which should large pharmaceutical companies facing patent expira- drive further gains in margins and earnings. While capac- tions on a substantial portion of their portfolios over the ity utilization has recovered from trough levels, it is still next few years, earnings growth will be sluggish. The substantially below long-term averages. Within the sec- sector is also grappling with the prospect of further gov- tor, we prefer transportation companies which are ben- ernment austerity measures in Europe and policy changes e tting from both higher utilization and improving pric- in the US in order to reduce long-term government de - ing power. cit projections. Energy (overweight)—oil prices to grind higher Materials (underweight)—not as leveraged to It should be no surprise that the performance of the En- emerging markets as you might think ergy sector is highly correlated with oil prices. With our We upgrade the Materials sector but stay moderately generally favorable outlook for oil prices—we expect underweight. While certain parts of the sector should crude oil prices to rise to USD 100 by the end of 2011— bene t from increased global growth, the US materials Energy stocks should enjoy a nice tailwind. We therefore index is more leveraged to chemicals and agriculture upgrade the sector to overweight. The sector is also lev- products, rather than the industrial metals (such as iron eraged to emerging market demand. Energy stocks may ore and copper) that are in short supply in emerging mar- deliver strong relative performance as the economic kets. While agricultural products have seen strong pricing recovery matures and spare capacity begins to decline. gains, a strong harvest can easily turn prices lower. Finally, an improvement in the outlook for re ning mar- gins also supports our thesis. Consumer Discretionary (underweight)—be selective We prefer the Autos & Auto Components industry group Utilities (neutral)—nice yield, but… and are cautious on Retailing and Consumer Durables. We downgrade Utilities to neutral from overweight given New vehicle sales have recovered from their trough, but the sector’s limited exposure to global growth. We still remain at a depressed level and should improve over the project moderate earnings growth for the regulated course of the next 2-3 years. The recent strong initial hol- group. However the glut of generating capacity will only iday sales results have boosted the shares of retailers and slowly be worked o and power prices will likely remain durables companies but valuations for these groups look low, limiting earnings gains for the less regulated power stretched. Our forecast for further increases in crude oil generators. Sector valuation is fair. prices could become problematic for both groups. We are neutral on the Media and Consumer Services groups. Financials (neutral)—credit bubble hangover As the economic recovery grinds higher, credit provisions Telecom (underweight)—still structural headwinds should continue to improve, boosting bank earnings. While the Telecom sector sports attractive dividend yields, However, loan growth will likely remain sluggish in the we are concerned about the continued secular decline in face of a tepid recovery in housing. In addition, regula- wireline revenues and the competitive pressures in wire- tory uncertainty is likely to continue to are up from time less. With ve or more wireless networks in all major to time. Within Financials we prefer the diversi ed nan- markets, pricing pressure should remain a headwind de- cials industry group which has the most attractive valua- spite the strong growth in smartphones and wireless data tions, while we are underweight the real estate sector usage. Potentially higher interest rates are also a concern. given high valuations and potentially rising interest rates. Jeremy A. Zirin, CFA, Strategist, David Le owitz, CFA, Strategist, Joe Sawe, Strategist Healthcare (underweight)—patent cli still looms The Healthcare sector looks inexpensive on most Investment Strategy Guide December 2010 33
  • 34.
    US Equities: Size& Style, REITs Going for growth We strongly favor growth over value but don’t more convinced of the sustainability of the economic think size will be a major driver of performance. recovery, our more favorable view on equity markets REIT outperformance cycle appears to be over. should provide a tailwind for small- and mid-cap stocks. The rolling 2-year beta of small-caps is 1.23, implying ‘Tis the season for small-caps? stronger relative performance during periods of rising Small- and mid-caps delivered impressive performance in markets. Second, corporations have excess cash which 2010, outpacing the gains from larger US companies. should support a pickup in M&A activity, bene tting Keep in mind that smaller companies typically outper- smaller companies, which tend to be targets. Third, small- form larger ones — the Russell 2000 small-cap index has cap earnings trends have improved over the past two delivered stronger annual performance over the Russell quarters. And tactically, seasonality favors small-cap, as 1000 large-cap index 60% of the time since 1979 by an they typically outperform during the three-month period average of 1.5 percentage points per year. This is not a from December to February and generally have stronger market anomaly but simply the interplay between risk relative performance during the rst half of the year (see and return. Small-cap returns are higher than large-caps Fig. 4). in the long-run, but the volatility of those returns — and hence the risk to investors — is higher. Growth is taking o —growth stocks are, that is While economic growth is only mildly re-accelerating fol- We are closing our small-cap underweight and moving to lowing the “so patch” in summer 2010, the Russell a benchmark stance across the capitalization spectrum. 1000 Growth index has signi cantly outperformed the Many of our arguments favoring large-caps actually re- Russell 1000 Value index over the past several weeks (see main in place: large-caps are still inexpensive compared Fig. 5). We expect this trend to continue into 2011. to both small- and mid-caps; larger companies have greater exposure to faster-growing emerging economies Indicators continue to favor growth. As we have o en and con dence surveys still show a divergence in the discussed, sector tilts strongly in uence the relative call outlook that favors larger corporations. between growth and value. Fig. 6 illustrates how it all boils down to the prospects for Technology (pro-growth) But several factors now suggest a more favorable back- versus Financials (pro-value). Since 1993, the correlation drop for the smaller size segment. First, increased inves- between the relative performance of Tech versus Finan- tor risk appetite favors small-caps. As we have become cials and the relative performance of growth versus value Fig. 3: Favor Large-cap Growth Fig. 4: Seasonal trends favor small-caps Tactical deviations from benchmark Average index performance since 1979, in% 10 Large-Cap Growth 8 Mid-Cap 6 Small-Cap 4 Large-Cap Value 2 REITs 0 ––– –– – n + ++ +++ First 6 months of year Last 6 months of year underweight overweight Small-caps Large-caps Note: Arrows indicate ratings changes as of this report Source: Bloomberg and UBS WMR, as of 3 December 2010 Source: UBS WMR, as of 6 December 2010 34 2011 Outlook
  • 35.
    US Equities: Size& Style, REITs is a remarkably high 71%! By de nition, growth stocks try registered its strongest relative outperformance to the are more expensive than value stocks. But growth is cur- S&P 500 in 2010 during the six-month period from April rently also very cheap relative to value. Or said di erently, to October. Why? Fig. 11 shows the path of the 10-year the premium valuation that growth typically commands Treasury yield and the relative performance of the REIT over value is much lower than normal. On average, industry group (to the S&P 500). Plunging interest rates growth stocks have traded at nearly a 50% P/E premium — with the 10-year Treasury yield falling from 4.0% in to value; today, that premium is just 18%. April to under 2.5% in October — pushed capitalization rates lower and thus property valuations were well sup- To demonstrate this with real life examples, we examine ported. Additionally, REIT short interest began the year at the average valuation premium that investors have been very elevated levels. This rare combination of improving willing to pay for past “market darlings.” We selected economic fundamentals and falling interest rates, com- one representative large-cap growth stock from the early bined with high short interest, proved to be the perfect 1990s (Coke), the late 1990s (P zer) and earlier this de- cocktail for REIT outperformance in 2010. cade (Cisco) and compared the P/E valuation premiums that each commanded relative to the S&P 500 to Apple, But the landscape is shi ing. The economy continues to one of today’s most representative growth stocks. Apple chug along at a modest yet sustainably positive growth is currently trading at a 24% premium versus the market rate but interest rates have backed up signi cantly over while Coke, P zer and Cisco traded at average premiums the past two months. While we are not expecting inter- of 67%, 72% and 104% respectively during their valua- est rates to surge further, we expect range-bound to tion heydays. slightly higher rates in 2011, suggesting that the tail- winds REITs enjoyed during 2010 will not extend into the Real Estate Investment Trusts (REIT) — falling rates new year. With relative REIT valuations at levels not wit- no longer a tailwind nessed since the peak of the real estate cycle in 2007, we In some respects, 2010 was the perfect backdrop for expect that REITs will lag the broad equity market in REITs. Although economic growth was not exactly robust, 2011. slow and steady growth provided the necessary precondi- tions for improvements in occupancy and rental rates and Jeremy A. Zirin, CFA, Strategist David Le owitz, CFA, Strategist a leveling o in non-commercial mortgage delinquencies. Joe Sawe, Strategist But despite the modest fundamental recovery, the indus- Fig. 5: Growth is taking o Fig. 6: Current “market darlings” P/E premium is low Russell 1000 Growth index relative to Russell 1000 Value index Average relative P/E premium over the S&P 500 P/E, in % 105 120 100 102 80 60 99 40 96 20 0 93 Coke: 1990 - Pfizer: 1995 - Cisco: 2000 - Apple: Dec 2010 Jan-10 Mar-10 May-10 Jul-10 Sep-10 Nov-10 1995 2000 2005 Growth relative to Value Source: Bloomberg and UBS WMR, as of 3 December 2010 Source: FactSet and UBS WMR, as of 3 December 2010 Investment Strategy Guide December 2010 35
  • 36.
    US Equities: Chartbook Fig.7: Cyclical vs. defensive valuations in line with history Fig. 8: Large-caps are inexpensive vs. small-caps Relative P/E ratio — cyclicals vs. defensives Large-cap relative to small-cap valuation 2 2.0 Large-caps cheap relative to small-caps 1 1.7 0 1.4 -1 1.1 -2 0.8 -3 0.5 Large-caps expensive relative to small-caps 1973 1978 1983 1988 1993 1998 2003 2008 -4 Relative P/E: cyclicals vs defensives Average 1985 1990 1995 2000 2005 2010 Source: DataStream and UBS WMR, as of 3 December 2010 Source: Thomson Datastream, UBS WMR, as of 2 December 2010 Fig. 9: Growth vs. Value boils down to Tech vs Financials Fig. 10: Valuation favors Growth over Value Relative performance of Growth vs. Value and Tech vs. Financials Relative premium, growth vs. value, since 1979, in % 500 180 160 400 120 150 300 120 80 200 90 40 100 0 60 0 1993 1997 2001 2005 2009 P/E Trailing Price to Book Price to Sales P/E Forward (1yr) Tech vs. Financials (lhs) Growth vs. Value (rhs) Current Long-Term Average Long-Term Average ex Tech Bubble Source: Bloomberg and UBS WMR as of 3 December 2010 Source: Thomson Datastream, UBS WMR, as of 2 December 2010 Fig. 11: Falling rates no longer a tailwind for REITs Fig. 12: REIT relative valuation near peak levels REIT relative performance to S&P 500 and 10-year T-Bond yield US REITs price to forward funds from operations relative to S&P 500 P/E 130 2.25 1.6 REITs expensive 120 2.75 1.2 110 3.25 0.8 100 3.75 90 4.25 0.4 Jan-10 Mar-10 May-10 Jul-10 Sep-10 Nov-10 REITs inexpensive REIT relative performance to S&P 500 (lhs) 0.0 10 Year T-Bond yield, in % (inverted, rhs) 1993 1997 2001 2005 2009 Source: Bloomberg and UBS WMR, as of 3 December 2010 Source: Bloomberg, SNL and UBS WMR, as of 3 December 2010 36 2011 Outlook
  • 37.
    US Fixed Income The run is done: modest returns in 2011 Our preference for credit over non-credit reÏects underweight allocations to Treasuries, TIPS, and Agencies our view that while absolute returns will likely be and have increased our underweight on Mortgages. We lower in 2011, Treasuries are apt to underperform look for the performance of Agency debentures and the credit-sensitive segments of the bond market. Agency mortgage-backed securities to be closely tied to In the aggregate, our overweight to credit now that of Treasuries, as their spreads have limited room for stands at +5%, o set by a 5% underweight on non- contraction, in our view. credit sectors. In the municipal market, we look for a modest uptick in default rates from very low his- Expect more modest returns torical levels. Systemic defaults are not expected, We believe double-digit total returns in credit are unlikely with the bulk of payment defaults likely occurring in 2011 as spreads have normalized to a large extent and in non-investment grade bonds and higher-risk sec- Treasury yields are likely to remain range-bound to tors such as land-based Înance, single-site hospi- slightly higher. If this interest rate path materializes, Trea- tals, multi-family rental housing and long-term care. suries are likely to produce at to slightly negative returns Finally, we recommend increasing duration to neu- for the year. Credit-related segments, on the other hand, tral, from underweight, based on our forecast for could continue to outperform Treasuries due to their range-bound to slightly higher Treasury yields. higher income streams and potential for additional spread-tightening, which we project will result in modest Asset allocation favors credit exposure single-digit total returns. Overall, we look for the IG sec- For 2011, we are making several changes to our recom- tor to produce total returns of roughly 3-5% compared mended xed income asset allocation. We have increased to 7-9% for the HY segment. our preference for high-yield corporate bonds (HY) while trimming our exposure, though remaining overweight, to During the slow but stable recovery forecast by our econ- investment-grade corporates (IG). Our overweight posi- omists, credit spreads should continue to compress to- tioning on preferred securities is unchanged, while we ward long-term averages, though likely not reaching the have increased the allocation to dollar-denominated sov- tighter end of historical ranges. As a result, we see the ereign emerging market (EM) bonds, moving to modest potential for IG spreads to tighten by roughly 25bps overweight from neutral. while HY spreads may tighten by 75-100bps. Much like what was experienced in 2010, however, the path to Regarding non-credit sectors, we are maintaining our spread tightening is not likely to be linear but rather Fig. 1: USD Îxed income strategy Fig. 2: Credit segments delivered double-digit returns YTD Tactical deviations from benchmark Total return, in % Treasuries Municipals TIPS EM sovereign bonds (USD) Agencies HY corporates Mortgages Preferreds Inv. Grade Corporates IG corporates High Yield Corporates Mortgages Preferred Securities Agencies Emerg. Market TIPS Total TFI non-Credit Treasuries Total TFI Credit ––– –– – n + ++ +++ -10 0 10 20 30 40 50 60 Underweight Overweight 2009 2010 YTD Source: UBS WMR, as of 8 December 2010 Source: BofA Merrill Lynch, UBS WMR, as of 3 December 2010 Investment Strategy Guide December 2010 37
  • 38.
    US Fixed Income choppy,as macro-related headlines whipsaw market sen- performance. We forecast modest spread tightening that timent. Against this backdrop, we expect HY spreads to should help to o set slightly higher Treasury yields. Issu- exhibit higher beta characteristics both to the upside dur- ance of new preferreds is likely to remain low as new ing “risk on” periods, and to the downside, on “risk o ” bank regulations phase out the equity treatment previ- periods. ously awarded to hybrid securities. We look for many bank holding companies to eventually redeem many of Aside from limited room for spread compression, we their trust preferreds, but view this more as a 2012-2013 view event risk as a possible reason for more limited re- event. One of the main factors keeping us from being turns on corporate bonds. Low absolute yields, limited more positive on preferreds is the continued uncertainty growth opportunities and, in many instances, stagnant surrounding the European periphery, which will likely equity prices may cause companies to pursue share- heighten the price volatility of European nancials that holder-friendly initiatives. While share repurchases and represent roughly 25% of the preferred market. dividend increases have been mostly implemented in a manner that preserves credit metrics in recent years, we Add emerging markets (EM) exposure would not be shocked to see these activities funded with We have also added credit risk by increasing our new debt in 2011. Further, we look for a pickup in M&A allocation to dollar-denominated sovereign EM bonds to activity given favorable nancing conditions. Although a +1% allocation from neutral. We believe that EM is credit trends have been improving given strong balance likely to continue to outgrow the developed world. sheets, a more aggressive nancial policy on the part of Expectations for the asset class in 2011 include IG management teams could lead to a decline in credit mid- to high-single-digit total returns supported by rela- quality and thus some spread widening in certain pockets tively strong fundamentals and modest net issuance of of the market. debt. Among the risk factors that prevent us from being more aggressive in EM include economic instability in Overweight preferred securities Europe, which could translate into a repricing if risk aver- We maintain our 1% overweight on preferred securities. sion were to rise and increased reliance on China as a Similar to HY, we believe that the above-average coupon source for export growth, although the latter may be payments that preferreds o er should help their relative more of a medium- to long-term issue. Fig. 3: IG spreads remained range-bound for most of 2010 Fig. 4: Steady decline in HY defaults implies tighter spreads Investment-grade corporate bond spreads, in basis points HY credit spreads and default rates, in basis points 800 2000 600 1500 400 1000 200 500 0 0 2005 2006 2007 2008 2009 2010 1988 1992 1996 2000 2004 2008 All IG Corporates Industrial Financials Spread Default rate (issuer-based) Source: Barclays Capital, UBS WMR, 6 December 2010 Source: Deutsche Bank, Merrill Lynch, Moody’s, UBS WMR, as of 6 December 2010 Note: Spread is based on Deutsche Bank data before 1997; Merrill Lynch a erwards 38 2011 Outlook
  • 39.
    US Fixed Income Interestrate outlook through June 2011, two-thirds mature in the 2- to 7-year We expect interest rates to be range-bound for most of area. The size of the Fed’s purchase plan is equal to the of 2011. Short-term yields in particular should have lim- amount of gross issuance that the Treasury is likely to ited upside, given the Fed’s commitment to keep the tar- borrow. As a result, yields on Treasury bonds in the short get federal funds rate low for an “extended period.” UBS to intermediate maturity range should remain range- economists do not foresee the rst increase in the federal bound throughout most of the year. By year-end, we funds rate until January 2012. We look for 3-month Libor forecast the 10-year Treasury note to yield 3.25%. Given to average 0.30% in H2 2011 before rising to 0.50% by our forecast for range-bound Treasury yields, we recom- Q4 2012, as the market begins to price in expectations mend investors adopt a neutral duration exposure. for Fed tightening. For investors holding positions in money market funds, the Fed’s accommodative monetary Municipal bonds: a rough road ahead policy implies that 2011 will be another year of record- We expect the municipal bond market to exhibit less pre- low interest rates. dictability in 2011. Since credit risk is higher, sources of credit enhancement are scarce and market liquidity is no In addition to Fed policy, longer-term bond yields are in- longer certain. Credit fundamentals will remain a key uenced by other factors, including the outlook for area of focus as state and local government issuers face growth and in ation. Recently, the economic data have scal challenges throughout 2011 and beyond. Structural met or exceeded analyst expectations. While this is wel- budget imbalances, unfunded pension liabilities and the come news that supports our base case for accelerating end of stimulus payments to states are likely to garner growth in the year ahead, we see little on the horizon to ongoing media attention pressuring credit quality spreads push Treasury yields sharply higher. The output gap re- wider, in our view. Against this backdrop, credit deterio- mains wide and in ation pressures are likely to remain ration and ratings downgrades are likely to become more subdued. Our economics team expects the unemploy- common. We expect headwinds for the broad muni mar- ment rate to remain above 9% while they forecast a ket to linger for some time and believe credit pressure for 1.4% rise in the core Consumer Price Index. local governments will be more intense than at the state level. The Fed’s asset purchase program will also help to tem- per a rise in Treasury yields, in our opinion. Of the USD We look for a modest uptick in default rates from very 600 billion in Treasury securities the Fed intends to buy low historical levels. Systemic defaults are not expected, Fig. 5: Prices exhibited wide trading ranges Fig. 6: EM debt trades roughly in line with US corporates Preferred price changes YTD, in % Credit spreads, EM sovereign debt and similarly rated US corporates, in bps 25 1000 20 15 800 10 600 5 0 400 -5 200 -10 -15 0 Jan-10 Mar-10 May-10 Jul-10 Sep-10 Nov-10 2006 2007 2008 2009 2010 REIT Preferreds Trust Preferreds Non-US QDI Corporate Index Emerging Markets Bond Index DRD-Eligible Floating-Rate Source: Bloomberg, UBS WMR, as of 3 December 2010 Source: BoA Merrill Lynch; JP Morgan; UBS WMR, as of 6 December 2010 Investment Strategy Guide December 2010 39
  • 40.
    US Fixed Income withthe bulk of payment defaults occurring in focused on total returns, or who otherwise may need to non-investment grade bonds and higher risk sectors sell their securities before maturity, will face greater chal- such as land-based nance, single-site hospitals, multi- lenges, in our view. family rental housing and long-term care. Yet, as discussed, it is possible that a general-purpose govern- Back to basics ment with a higher pro le may default in 2011. Essential We believe investors will be best served by taking a back- purpose revenue bonds in the water/sewer and public to-basics approach when constructing and reviewing mu- utility sectors are likely to be among the most resilient nicipal bond portfolios. Our key investment themes for from a credit perspective. Bond insurance (which ac- 2011 include: sticking to high-quality bonds, diversifying counts for just 6.5% of the new issue market) is likely to by state and sector and managing interest rate risk. Ex- remain scarce, underscoring the importance of underly- amples of high-quality bonds include: essential purpose ing credit assessments. revenue bonds in the water/sewer and public utility sec- tors, state general obligation bonds and transportation We look for supply/demand dynamics to be less support- agencies with well-established and demonstrably resilient ive than in 2010. The ratio of tax-exempt supply to tax- revenue streams. able muni debt is likely to rise due to pending changes in the taxable Build America Bonds (BABs) Program. At the Anne Briglia, CFA, Strategist same time, investor demand may so en on headline risk. Barry McAlinden, CFA, Strategist Changes to individual income tax rates, which have im- Donald McLauchlan, Strategist Kathleen McNamara, CFA, CFP, Strategist portant implications for investor demand, are still uncer- Michael Tagliaferro, CFA, Strategist tain at this time. Over the year, we anticipate muni yields to edge modestly higher from current levels and the yield curve to remain relatively steep. The persistence of a bifurcated market, given our expec- tations for reduced liquidity for less frequently traded bonds, is likely to create mispricing among credits o er- ing income opportunities for investors that perform care- ful credit analysis and monitoring. In contrast, investors Fig. 7: US interest rate forecasts, in % Fig. 8: Yield curve is steep, while credit spreads are wide AAA, AA, A, BAA muni yield curves, in % in 3 in 6 in 12 8-Dec months months months 6.0 3-month LIBOR 0.30 0.30 0.30 0.50 5.0 2-year Treasury 0.59 0.50 0.75 1.00 4.0 5-year Treasury 1.85 1.50 1.75 2.00 3.0 10-year Treasury 3.24 2.75 3.00 3.25 2.0 30-year Treasury 4.43 4.25 4.25 4.50 1.0 0.0 1 5 10 15 20 25 30 AAA GO AA GO A GO BAA GO Source: Bloomberg, UBS WMR, as of 8 December 2010 Source: MMD Interactive, UBS WMR, as of 2 December 2010 40 2011 Outlook
  • 41.
    US Fixed Income:Chartbook Fig. 1: Treasury yields to rise very gradually Fig. 2: Credit rating trends have improved rapidly Rate development and UBS WMR forecast, in % Upgrades as a share of total ratings changes, in % 7.0 80 6.0 5.0 60 4.0 3.0 40 2.0 20 1.0 0.0 0 2000 2002 2004 2006 2008 2010 1990 1995 2000 2005 2010 2-year Treasury note 10-year Treasury note 2011 forecast High Yield Investment Grade Source: Bloomberg, UBS WMR, as of 29 November 2010 Source: Barclays Capital, UBS WMR, as of 6 December 2010 Fig. 3: Munis o er relative value opportunities Fig 4: BABs accounted for about 26% of 2010 new issue supply 10-year AAA muni to Treasury yield ratio, in % Taxable BABs new issue volume and market share 175 35 30 150 25 20 125 15 10 100 5 0 75 Jan-10 Mar-10 May-10 Jul-10 Sep-10 Nov-10 2000 2002 2004 2006 2008 2010 BABs issuance, in billions BABs/total muni issuance, in % Source: MMD Interactive, UBS WMR, as of 3 December 2010 Source: Thomson Reuters, UBS WMR, as of 3 December 2010 Fig. 5: TIPS breakeven inÏation rates Fig. 6: European preferred yields have edged higher recently Preferred yield, in % 4.0 10.0 3.0 9.0 2.0 8.0 1.0 7.0 6.0 0.0 5.0 -1.0 Jan-10 Mar-10 May-10 Jul-10 Sep-10 Nov-10 2006 2007 2008 2009 2010 2011 Non-US (QDI) Preferreds Fully taxable trust preferreds 5-year breakeven 10-year breakeven 30-year breakeven US DRD/QDI preferreds Fully taxable senior notes Source: Bloomberg, UBS WMR, as of 3 December 2010 Source: Bloomberg, UBS WMR, as of 6 December 2010 Investment Strategy Guide December 2010 41
  • 42.
    Commodities Moderate price gainsin 2011 Following the sweet spot that commodities experi- Precious metals: high Înancial demand for now enced in the last quarter of 2010, we believe there With in ationary pressures mounting in emerging mar- is still potential for higher prices during 2011. None- kets and sovereign debt uncertainty intensifying, gold theless, we believe that selectivity remains of the demand should trend higher and allow prices to reach essence. record levels. Investors’ search for real assets should pro- vide a solid bid. Other precious metals should manage to Loose monetary policy and abundant liquidity should help see multi-decade highs as well. That said, a gold price spur a reacceleration in commodity demand, especially move toward USD 1650/oz will take its toll on incremen- from emerging markets. While developed world growth is tal jewelry demand and should represent an upper limit. likely to remain moderate and bumpy, overall demand should hold up. In addition, nancial investors in search of Base metals: selectivity is warranted protection from currency and in ation risks are likely to Overall we expect base metal prices to rise, but only favor commodities. Nonetheless, for broad commodity moderately. Attempts by the Chinese central bank to exposures, the range of price gains we expect is unlikely cool the economy should limit the return potential of the to exceed prevailing negative roll yields (arising when in- sector. We advise investors to stick with copper. The lack vesting through commodity futures) by a wide enough of mining supply and structurally low inventories should margin to warrant entering the asset class aggressively. pave the way for price moves toward USD 10000/mt. Energy: ready to catch up a er a lost 2010 Agriculture: further rally in grains, pause in so s Growing emerging market demand will drive down Grains should experience another round of higher prices, OPEC spare capacity in late 2011. Considering slowing the key driver being corn, which bene ts from structurally supply growth from non-OPEC countries, sliding inven- low inventories and lower yield per acreage. Soybeans tories in the developed world and a more relaxed OPEC and wheat should experience positive spillover e ects, stance toward higher prices, crude oil prices should since they compete with corn for acreage. We expect to trade above USD 100/bbl in 2011. In contrast, natural see demand catch up with supply from a structural per- gas prices should disappoint in the rst half of 2011 due spective driven by bio fuel and Asian demand. So com- to ample US supply. modities (sugar, co ee, cotton and cocoa) should pause a er a fantastic rally in 2010 on improving supply. Dominic Schnider, Strategist Fig. 1: Commodity market performance Fig. 2: Commodity market performance Total return in USD and %, commodity sectors Total return in USD and %, selected commodities Livestock Corn Sos Soybeans Grains Aluminum Precious metals Copper Base metals Crude Oil Energy Natural Gas Commodities Gold -20% -10% 0% 10% 20% 30% 40% 50% -50% -40% -30% -20% -10% 0% 10% 20% 30% year-to-date quarter-to-date year-to-date quarter-to-date Source: Bloomberg, DJ UBS, UBS WMR, as of 7 December 2010 Source: Bloomberg, DJ UBS, UBS WMR, as of 7 December 2010 42 2011 Outlook
  • 43.
    Alternative Investments Diversi cationand beyond Hedge funds though many of these strategies in fact exhibit a net long Overall, 2010 saw decent hedge fund performance or short exposure to equity or debt markets. Fixed in- in the higher single-digit returns. For 2011, we ex- come arbitrage funds tend to pro t from price anoma- pect ongoing market volatility to provide attractive lies between related securities and/or bet on the evolu- opportunities in selected parts of the hedge fund tion of interest rate spreads. They are expected to bene t space. from arbitrage opportunities within the US Treasury mar- ket emerging from dislocations that Fed quantitative eas- Looking back, the second half of 2010 brightened up for ing policy is creating. Volatility arbitrage funds that, as hedge funds. The third quarter (Q3) saw some attractive a group, tend to be long volatility are expected to have a performance gains (5.2% industry-wide) bringing net as- challenging period as volatility remains low (the VIX has set values close to their prior October 2007 peak. Q3 net been in the 20 to 25 range) and option values continue capital in ows (USD 19 billion) were also the largest since to decay. Convertible arbitrage should continue to ben- the end of 2007. The year-to-date (YTD) in ow for 2010 e t from discrepancies and arbitrage opportunities be- through Q3 of USD 42 billion brought industry assets un- tween convertible bonds and underlying stock and bond der management to USD 1.77 trillion vs. global stock mar- markets irrespective of market movements. ket capitalization of about USD 50 trillion. Long/short equity fund managers are coming out of In terms of hedge fund strategies, most of the in ows low net market exposure. They remain cautious and were experienced in the relative value, event-driven and selective in building long positions. We expect that fun- macro categories, while fund of funds actually saw an damental valuation-oriented managers may be better out ow for the rst three quarters. positioned to take advantage of sector rotations and stock-speci c opportunities than technically driven Outlook for the main hedge fund strategies managers. Relative value funds saw the largest in ows (USD 17 billion YTD) while their performance of nearly 10% Event-driven funds have been strong performers with through October was ahead of the industry average. Be- YTD performance of 8.5% and USD 11.6 billion of new cause they focus on capturing value from the relative capital through Q3. Plentiful cash on corporate balance mispricing of related assets, these strategies can generate sheets, easy access to capital and increased optimism returns independent of overall market movements, al- from company management are contributing to an up- Fig. 1A: Performance of selected Hedge Fund strategies Fig. 1B: Performance of selected Hedge Fund strategies Until 30 November 2010, in USD and % Until 30 November 2010, in USD and % Equity Market Neutral Merger Arbitrage Equity Hedge (Total) Distressed / Restructuring Fixed Income-Conv. Arb. Event-Driven (Total) Fixed Income-Asset Backed Emerging Markets (Total) Fixed Income-Corporate Macro (Total) Multi-Strategy Fund of Funds Composite Relative Value (Total) Fund Weighted Composite -2 0 2 4 6 8 10 12 14 -2 0 2 4 6 8 10 12 14 year-to-date quarter-to-date year-to-date quarter-to-date Source: Bloomberg, UBS WMR, as of 30 November 2010 Source: Bloomberg, UBS WMR, as of 30 November 2010 Note: All Êgures based on Hedge Fund Research’s HFRI indices Note: All Êgures based on Hedge Fund Research’s HFRI indices Investment Strategy Guide December 2010 43
  • 44.
    Alternative Investments tick indeal activity. Increasing company valuations could on niche areas to deliver outperformance. All in all, we make stock more attractive as an acquisition currency for think that the LBO volume should continue to rise in stock deals. Strategic buyers are expected to be more 2011. The debt market situation should remain support- active than private equity sponsors, given easy capital ive with interest rates unlikely to rise in the near term and market nancing. Declining default rates are helping dis- leverage relatively low. tressed securities managers. In terms of sectors we see energy as an excellent play. The For credit strategies, opportunities are attractive from a long-term secular trends in an industry that has experi- fundamental perspective. However, there could be pres- enced underinvestment may well provide a great backdrop sures in the credit markets driven by technical factors, as for energy-focused PE for the next decade. new issuance remains solid. Credit risk appetite remains strong going into the new year. We like emerging market-focused PE funds While it is true that there will always be risks of asset price in ation Macro strategies have somewhat underperformed the and bubbles in countries in transition, especially within a industry this year absent strong directional markets which private fund’s 10-year life, the economic value creation tend to bene t them. Most managers eschewed making opportunity in these countries makes them a “must strong bets. We expect this trend to persist going into have” component of portfolios. 2011 and macro strategies, at least in the short term, to continue underperforming. As far as secondary private equity sales go, the last 24 months have been a disappointment. Secondaries as a Private equity group missed the boat in 2009 and then su ered a quite While frozen credit markets created difÎcult condi- competitive environment in 2010 given high demand for tions for private equity in 2008 and early 2009, they limited deal ow. However, the next 12 months will po- have been very strong in 2010. We expect support- tentially house a more active secondary environment. ive credit market conditions to remain in place in 2011, which should provide a solid fundamental Expectations for distressed corporate debt strategies backdrop for private equity (PE). were high back in 2009. However, these did not entirely come to fruition as credit quality improvements reduced In the U.S. buyout market, transaction ow has im- the availability of distressed securities. Unless the 2014 proved but it is nowhere close to the frenzied activity of “wall of debt” in need of re nancing becomes a real 2006. Rebound in company valuations has been stronger challenge, which we doubt, the prospects for this strat- and faster than what was envisaged in early 2010; com- egy are more muted. pany sales by buyout funds have been strong as well, and earnings growth has been supportive. Deal sizes have In special situations/turnaround funds, the next leg of been small and we expect most of the future activity to the opportunity will be in more traditional turnaround be in the middle market segment. We believe that, with groups (focused on operational, not nancial, stress) and exceptions, 2009-10 vintages of large buyouts may turn also in groups focused on distressed nancial assets, out to be relative disappointments with investors typically where opportunities should arise from nancial companies equating recession vintages with good returns. We also unloading distressed assets from their balance sheets. see much too much committed but undrawn capital (around USD500 billion). With many funds just two or For US growth capital, as the economic expansion pro- three years away from the end of their investment pe- ceeds, unlevered small company transactions can poten- riod, we worry that acquisition valuations may get bid tially be a great space in which to invest. up, reducing future returns. In contrast, 2011 and 2012 vintages are expected to be better, with those that focus Stephen Freedman, PhD, CFA, Strategist 44 2011 Outlook
  • 45.
    Detailed asset allocation,with non-traditional assets (NTAs) Investor Very conservative Conservative Moderate Moderate Moderate Aggressive Very aggressive Risk Pro le1 conservative aggressive Cash Equities Cash Equities Cash Equities Cash Equities Cash Equities Cash Equities Cash Equities Bonds NTAs Bonds NTAs Bonds NTAs Bonds NTAs Bonds NTAs Bonds NTAs Bonds NTAs WMR tactical deviation3 WMR tactical deviation3 WMR tactical deviation3 WMR tactical deviation3 WMR tactical deviation3 WMR tactical deviation3 WMR tactical deviation3 Benchmark allocation2 Benchmark allocation2 Benchmark allocation2 Benchmark allocation2 Benchmark allocation2 Benchmark allocation2 Benchmark allocation2 Current allocation4 Current allocation4 Current allocation4 Current allocation4 Current allocation4 Current allocation4 Current allocation4 Change Change Change Change Change Change Change Traditional Assets Equity 0.0 +0.0 0.0 19.0 +2.5 S 21.5 32.0 +4.0 S 36.0 44.0 +5.0 S 49.0 54.0 +6.0 S 60.0 62.0 +7.5 S 69.5 71.0 +2.0 S 73.0 US Equity 0.0 +0.0 0.0 14.0 +1.0 S 15.0 23.0 +0.5 S 23.5 32.0 +0.0 32.0 39.0 +0.0 39.0 44.0 +0.0 44.0 52.0 –3.0 S 49.0 Large Cap Value 0.0 +0.0 0.0 8.0 -0.5 T 7.5 8.0 –1.0 T 7.0 11.0 –1.5 T 9.5 11.0 –2.0 T 9.0 11.0 –2.0 T 9.0 13.0 –4.0 T 9.0 Large Cap Growth 0.0 +0.0 0.0 5.0 +1.5 S 6.5 8.0 +2.5 S 10.5 11.0 +3.0 S 14.0 11.0 +4.0 S 15.0 11.0 +4.0 S 15.0 13.0 +4.5 S 17.5 Mid Cap 0.0 +0.0 0.0 1.0 +0.0 S 1.0 4.0 +0.0 4.0 5.0 +0.0 5.0 9.0 +0.0 9.0 11.0 +0.0 11.0 13.0 –0.5 T 12.5 Small Cap 0.0 +0.0 0.0 0.0 +0.0 0.0 2.0 +0.0 S 2.0 3.0 +0.0 S 3.0 5.0 +0.0 T 5.0 7.0 +0.0 S 7.0 8.0 +0.0 S 8.0 REITs 0.0 +0.0 0.0 0.0 +0.0 0.0 1.0 –1.0 T 0.0 2.0 –1.5 T 0.5 3.0 –2.0 T 1.0 4.0 –2.0 T 2.0 5.0 –3.0 T 2.0 Non-US Equity 0.0 +0.0 0.0 5.0 +1.5 S 6.5 9.0 +3.5 S 12.5 12.0 +5.0 S 17.0 15.0 +6.0 S 21.0 18.0 +7.5 S 25.5 19.0 +5.0 S 24.0 Developed 0.0 +0.0 0.0 5.0 +1.5 S 6.5 8.0 +0.5 S 8.5 10.0 +0.0 S 10.0 12.0 +0.0 S 12.0 14.0 +0.5 S 14.5 14.0 –3.0 S 11.0 Emerging Markets 0.0 +0.0 0.0 0.0 +0.0 0.0 1.0 +3.0 4.0 2.0 +5.0 S 7.0 3.0 +6.0 S 9.0 4.0 +7.0 S 11.0 5.0 +8.0 S 13.0 Fixed Income 81.0 +0.0 81.0 67.0 –2.5 T 64.5 51.0 –4.0 T 47.0 37.0 –5.0 S 32.0 24.0 –6.0 T 18.0 11.0 –7.5 T 3.5 0.0 +0.0 0.0 US Fixed Income 74.0 +0.0 74.0 59.0 –1.0 T 58.0 43.0 –2.0 T 41.0 29.0 –2.5 T 26.5 18.0 –3.0 T 15.0 9.0 –5.5 T 3.5 0.0 +0.0 0.0 Non-US Fixed Income 7.0 +0.0 7.0 8.0 –1.5 T 6.5 8.0 –2.0 T 6.0 8.0 –2.5 S 5.5 6.0 –3.0 T 3.0 2.0 –2.0 T 0.0 0.0 +0.0 0.0 Cash (USD) 10.0 +0.0 10.0 2.0 +0.0 2.0 2.0 +0.0 2.0 2.0 +0.0 2.0 2.0 +0.0 2.0 2.0 +0.0 2.0 2.0 –2.0 T 0.0 Non-traditional Assets 9.0 +0.0 9.0 12.0 +0.0 12.0 15.0 +0.0 15.0 17.0 +0.0 17.0 20.0 +0.0 20.0 25.0 +0.0 25.0 27.0 +0.0 27.0 Commodities 2.0 +0.0 2.0 3.0 +0.0 3.0 4.0 +0.0 4.0 5.0 +0.0 5.0 5.0 +0.0 5.0 6.0 +0.0 6.0 7.0 +0.0 7.0 5 Alternative Investments 7.0 +0.0 7.0 9.0 +0.0 9.0 11.0 +0.0 11.0 12.0 +0.0 12.0 15.0 +0.0 15.0 19.0 +0.0 19.0 20.0 +0.0 20.0 “WMR tactical deviation” legend: Overweight Underweight Neutral “Change” legend: S Upgrade T Downgrade Source: UBS WMR and Investment Solutions, as of 8 December 2010. For end notes, please see appendix. Investment Strategy Guide December 2010 45
  • 46.
    Detailed asset allocation,without non-traditional assets (NTAs) Investor Very conservative Conservative Moderate Moderate Moderate Aggressive Very aggressive Risk Pro le1 conservative aggressive Cash Equities Cash Equities Cash Equities Cash Equities Cash Equities Cash Equities Cash Equities Bonds Bonds Bonds Bonds Bonds Bonds Bonds WMR tactical deviation3 WMR tactical deviation3 WMR tactical deviation3 WMR tactical deviation3 WMR tactical deviation3 WMR tactical deviation3 WMR tactical deviation3 Benchmark allocation2 Benchmark allocation2 Benchmark allocation2 Benchmark allocation2 Benchmark allocation2 Benchmark allocation2 Benchmark allocation2 Current allocation4 Current allocation4 Current allocation4 Current allocation4 Current allocation4 Current allocation4 Current allocation4 Change Change Change Change Change Change Change Traditional Assets Equity 0.0 +0.0 0.0 22.0 +2.5 S 24.5 37.0 +4.0 S 41.0 52.0 +5.0 S 57.0 67.0 +6.0 S 73.0 83.0 +7.5 S 90.5 98.0 +2.0 S 100.0 US Equity 0.0 +0.0 0.0 16.0 +1.0 S 17.0 26.0 +0.5 S 26.5 37.0 +0.0 37.0 48.0 +0.0 48.0 59.0 +0.0 59.0 72.0 –3.0 T 69.0 Large Cap Value 0.0 +0.0 0.0 9.0 -0.5 T 8.5 9.0 –1.0 T 8.0 13.0 –1.5 T 11.5 14.0 –2.0 T 12.0 15.0 –2.0 T 13.0 18.0 –4.0 T 14.0 Large Cap Growth 0.0 +0.0 0.0 6.0 +1.5 S 7.5 9.0 +2.5 S 11.5 13.0 +3.0 S 16.0 14.0 +4.0 S 18.0 15.0 +4.0 S 19.0 18.0 +4.5 S 22.5 Mid Cap 0.0 +0.0 0.0 1.0 +0.0 S 1.0 4.0 +0.0 4.0 6.0 +0.0 6.0 11.0 +0.0 11.0 15.0 +0.0 15.0 18.0 –0.5 T 17.5 Small Cap 0.0 +0.0 0.0 0.0 +0.0 0.0 3.0 +0.0 S 3.0 3.0 +0.0 S 3.0 6.0 +0.0 S 6.0 9.0 +0.0 S 9.0 11.0 +0.0 S 11.0 REITs 0.0 +0.0 0.0 0.0 +0.0 0.0 1.0 –1.0 T 0.0 2.0 –1.5 T 0.5 3.0 –2.0 T 1.0 5.0 –2.0 T 3.0 7.0 –3.0 T 4.0 Non–US Equity 0.0 +0.0 0.0 6.0 +1.5 S 7.5 11.0 +3.5 S 14.5 15.0 +5.0 S 20.0 19.0 +6.0 S 25.0 24.0 +7.5 S 31.5 26.0 +5.0 S 31.0 Developed 0.0 +0.0 0.0 6.0 +1.5 S 7.5 9.0 +0.5 S 9.5 13.0 +0.0 S 13.0 15.0 +0.0 S 15.0 18.0 +0.5 S 18.5 20.0 –3.0 S 17.0 Emerging Markets 0.0 +0.0 0.0 0.0 +0.0 0.0 2.0 +3.0 5.0 2.0 +5.0 S 7.0 4.0 +6.0 S 10.0 6.0 +7.0 S 13.0 6.0 +8.0 S 14.0 Fixed Income 90.0 +0.0 90.0 76.0 –2.5 T 73.5 61.0 –4.0 T 57.0 46.0 –5.0 T 41.0 31.0 –6.0 T 25.0 15.0 –7.5 T 7.5 0.0 +0.0 0.0 US Fixed Income 82.0 +0.0 82.0 67.0 –1.0 T 66.0 51.0 –2.0 T 49.0 36.0 –2.5 T 33.5 23.0 –3.0 T 20.0 12.0 –4.5 T 7.5 0.0 +0.0 0.0 Non–US Fixed Income 8.0 +0.0 8.0 9.0 –1.5 T 7.5 10.0 –2.0 T 8.0 10.0 –2.5 T 7.5 8.0 –3.0 T 5.0 3.0 –3.0 T 0.0 0.0 +0.0 0.0 Cash (USD) 10.0 +0.0 10.0 2.0 +0.0 2.0 2.0 +0.0 2.0 2.0 +0.0 2.0 2.0 +0.0 2.0 2.0 +0.0 2.0 2.0 –2.0 T 0.0 “WMR tactical deviation” legend: Overweight Underweight Neutral “Change” legend: S Upgrade T Downgrade Source: UBS WMR and Investment Solutions, as of 8 December 2010. For end notes, please see appendix. 46 2011 Outlook
  • 47.
    Appendix Portfolio Analytics The portfolioanalytics shown for each risk pro le’s In order to create the analysis shown, the rates of return benchmark allocations are based on estimated forward- for each asset class are combined in the same proportion looking return and standard deviation assumptions (capi- as the asset allocations illustrated (e.g., if the asset allo- tal market assumptions), which are based on UBS propri- cation indicates 40% equities, then 40% of the results etary research. The development process includes a shown for the allocation will be based upon the esti- review of a variety of factors, including the return, risk, mated hypothetical return and standard deviation as- correlations and historical performance of various asset sumptions shown below). classes, in ation and risk premium. These capital market assumptions do not assume any particular investment You should understand that the analysis shown and as- time horizon. The process assumes a situation where the sumptions used are hypothetical estimates provided for supply and demand for investments is in balance, and in your general information. The results are not guarantees which expected returns of all asset classes are a re ection and pertain to the asset allocation and/or asset class in of their expected risk and correlations regardless of time- general, not the performance of speci c securities or in- frame. Please note that these assumptions are not guar- vestments. Your actual results may vary signi cantly from antees and are subject to change. UBS has changed its the results shown in this report, as can the performance risk and return assumptions in the past and may do so in of any individual security or investment. the future. Neither UBS nor your Financial Advisor is re- quired to provide you with an updated analysis based upon changes to these or other underlying assumptions. Risk Very Moderate Moderate Very Pro le ==>> conservative Conservative Conservative Moderate aggressive Aggressive aggressive With non-traditional assets Estimated Return 4.81% 5.98% 6.89% 7.65% 8.36% 9.00% 9.56% Estimated Risk 3.21% 4.70% 6.71% 8.69% 10.53% 12.16% 13.81% Without non-traditional assets Estimated Return 4.46% 5.67% 6.62% 7.44% 8.33% 9.22% 10.00% Estimated Risk 3.45% 4.78% 6.93% 9.17% 11.73% 14.46% 16.94% Asset Class Capital Market Assumptions Estimated Risk Estimated Return US Equity Large Cap Value 16.4% 8.7% Large Cap Growth 19.0% 9.3% Mid Cap 18.4% 10.4% Small Cap 21.4% 10.6% REITs 23.0% 9.6% Non-US Equity Developed markets Equities 17.7% 10.4% Emerging markets Equities 26.6% 12.6% US Fixed income 3.7% 4.4% Non-U.S. xed income 8.8% 6.1% Cash (USD) 0.5% 4.0% Commodities 17.1% 7.6% Alternative investments 8.5% 8.7% Investment Strategy Guide December 2010 47
  • 48.
    Appendix Additional Asset AllocationModels US Taxable Fixed Income Allocation, in % Benchmark WMR Tactical deviation2 Current allocation3 allocation1 Previous Current Treasuries 12.0 –1.0 –1.0 11.0 TIPS (Treasury inËation-protected securities) 5.0 –1.0 –1.0 4.0 Agencies 22.0 –1.0 –1.0 21.0 Mortgages 20.0 –1.0 –2.0 18.0 Inv. Grade Corporates 22.0 +2.0 +1.0 23.0 High Yield Corporates 10.0 +1.0 +2.0 12.0 Preferred Securities 4.0 +1.0 +1.0 5.0 Emerging Market sovereign bonds in US dollar 5.0 +0.0 +1.0 6.0 TFI non-Credit 59.0 –4.0 –5.0 54.0 TFI Credit 41.0 +4.0 +5.0 46.0 Non–US Developed Equity Module, in % Benchmark WMR Tactical deviation2 Current allocation3 allocation1 Previous Current Eurozone 28.0 –5.0 –15.0 13.0 UK 20.0 +10.0 +25.0 45.0 Japan 19.0 –5.0 –15.0 4.0 Other 33.0 +0.0 +5.0 38.0 Non–US Fixed Income Module, in % Benchmark WMR Tactical deviation2 Current allocation3 allocation1 Previous Current Eurozone 43.0 +0.0 +0.0 43.0 UK 9.0 +0.0 +0.0 9.0 Japan 32.0 –10.0 –10.0 22.0 Other 15.0 +10.0 +10.0 25.0 Source: UBS WMR and Investment Solutions, as of as of 8 December 2010 1 The benchmark allocation refers to a moderate risk proÊle. See “Sources of Benchmark Allocations and Investor Risk ProÊles” in the Appendix for an explanation regarding the source of benchmark allocations and their suitability. 2 See “Deviations from Benchmark Allocations” in the Appendix for an explanation regarding the interpretation of the suggested tactical deviations from benchmark. The “current” column refers to the tactical deviation that applies as of the date of this publication. The “previous” column refers to the tactical deviation that was in place at the date of the previous edition of the Investment Strategy Guide or the last Investment Strategy Guide Update. 3 The current allocation column is the sum of the benchmark allocation and the WMR tactical deviation columns. 48 2011 Outlook
  • 49.
    Appendix Additional Asset AllocationModels Equity Industry Group Allocation, in % S&P 500 WMR Tactical deviation2 Current Benchmark Numeric Symbol allocation3 allocation1 Previous Current Previous Current Consumer Discretionary 10.7 -2.0 -2.0 –– –– 8.7 Auto & Components 0.8 +0.0 +1.0 n + 1.8 Consumer Services 1.9 +0.5 +0.0 + n 1.9 Media 3.1 +0.0 +0.0 n n 3.1 Retailing 3.8 -1.5 -2.0 –– –– 1.8 Consumer, Durables & Apparel 1.2 -1.0 -1.0 – – 0.2 Consumer Staples 10.8 +2.0 +2.0 ++ ++ 12.8 Food, Beverage & Tobacco 6.0 +1.0 +1.0 + + 7.0 Food & Staple Retailing 2.4 +0.0 +0.0 n n 2.4 Household & Personal Products 2.4 +1.0 +1.0 + + 3.4 Energy 11.8 +0.0 +1.0 n + 12.8 Financials 15.8 +0.0 +0.0 n n 15.8 Banks 3.0 +1.0 +0.0 + n 3.0 DiversiÊed Financials 7.5 +0.0 +1.0 n + 8.5 Insurance 3.9 +0.0 +0.0 n n 3.9 Real Estate 1.5 -1.0 -1.0 – – 0.5 Health Care 11.0 +0.0 -1.0 n – 10.0 HC Equipment & Services 3.6 +0.0 +0.0 n n 3.6 Pharmaceuticals & Biotechnology 7.4 +0.0 -1.0 n – 6.4 Industrials 10.9 +0.0 +1.0 n + 11.9 Capital Goods 8.3 +0.0 +0.0 n n 8.3 Commercial Services & Supplies 0.6 +0.0 +0.0 n n 0.6 Transportation 2.1 +0.0 +1.0 n + 3.1 Information Technology 19.0 +1.0 +2.5 + +++ 21.5 So ware & Services 9.1 +1.0 +1.0 + + 10.1 Technology Hardware & Equipment 7.2 +1.0 +1.5 + ++ 8.7 Semiconductors 2.6 -1.0 +0.0 – n 2.6 Materials 3.6 -2.0 -1.0 –– – 2.6 Telecom 3.0 -1.0 -2.5 – ––– 0.5 Utilities 3.3 +2.0 +0.0 ++ n 3.3 Source: S&P, UBS WMR as of 8 December 2010 The benchmark allocation, as well as the tactical deviations, are intended to be applicable to the US equity portion of a portfolio across investor risk proÊles. 1 The benchmark allocation is based on S&P 500 weights. 2 See “Deviations from Benchmark Allocations” in the Appendix for an explanation regarding the interpretation of the suggested tactical deviations from benchmark. The “current” column refers to the tactical deviation that applies as of the date of this publication. The “previous” column refers to the tactical deviation that was in place at the date of the previous edition of the Investment Strategy Guide or the last Investment Strategy Guide Update. 3 The current allocation column is the sum of the S&P 500 benchmark allocation and the WMR tactical deviation columns. Investment Strategy Guide December 2010 49
  • 50.
    Appendix Additional Asset AllocationModels Alternative Investment (AI) Benchmark Allocation (All gures in % of total portfolio) Risk pro le Very Moderate Moderate Very conservative Conservative conservative Moderate aggressive Aggressive aggressive Tactical Trading 1.0 1.0 1.0 2.0 2.5 3.5 4.0 Relative Value 1.5 2.0 2.0 2.0 2.0 2.0 2.0 Credit Strategies 1.5 2.0 2.0 2.0 2.5 3.0 3.0 Event Driven 1.5 2.0 2.0 2.0 2.0 2.5 3.0 Equity Hedge 1.5 2.0 2.0 2.0 2.0 3.0 3.0 Private Equity 0.0 0.0 2.0 2.0 2.0 2.0 3.0 Private Real Estate 0.0 0.0 0.0 0.0 2.0 2.0 2.0 Total Alternative Investments 7 9 11 12 15 19 20 See “Sources of Benchmark Allocations and Investor Risk ProÊles” in the Appendix for an explanation regarding the source of the benchmark allocations and their suitability. 50 2011 Outlook
  • 51.
    Tactical Asset AllocationPerformance Measurement As explained more fully below, tables A and E re ect the mation ratio is calculated as the ratio of the annualized performance of certain tactical asset allocation recom- excess return over a given time period and the annual- mendations published by WMR during the time periods ized standard deviation of daily excess returns over the speci ed. Performance is calculated utilizing the returns same period. Additional background information regard- of the indices identi ed, as applied to the respective ing the computation of the information ratio gures pro- benchmark allocations and the benchmark with the tacti- vided below is available upon request. cal shi (see detailed asset allocation tables where benchmark allocation with tactical shi is referred to as The performance shown in Table A is based on the “current allocation”). For example, if cash were allocated Benchmark Allocation (with nontraditional assets) for a 10% in the benchmark and 12% in the benchmark with hypothetical moderate risk pro le investor and the the tactical shi , the performance of the cash index Benchmark with Tactical Shi (see “Sources of bench- would provide 10% and 12% in the respective perfor- mark allocations and investor risk pro les” on page 46 mance computation. Performance calculations assume for details regarding Benchmark construction). Perfor- that portfolios are rebalanced the day a er publication mance is calculated utilizing the returns of the indices by WMR of any changes to its tactical deviations. Perfor- identi ed in Table B. Prior to 25 August 2008, WMR pub- mance shown is based on total returns, but does not in- lished tactical asset allocation recommendations using a clude transaction costs, such as commissions, fees, mar- less comprehensive set of asset classes and sectors, which gin interest, and interest charges. Actual total returns makes a comparison with the current models dif cult. In adjusted for such transaction costs will be reduced. A addition, since 25 August 2008, WMR has at times pub- complete record of all the recommendations upon which lished a more detailed set of tactical deviations, whereby these performance reports are based is available from the categories “Non-US Developed Equities” and Non-US UBS Financial Services Inc. upon written request. Past Fixed Income” were further subdivided into regional performance is not an indication of future results. blocks. Only the cumulative recommendations at the level of “Non-US Developed Equities” and “Non-US Fixed The performance attributable to the tactical deviations is Income” were taken into account in calculating the per- re ected in the column labeled “Excess return”, which formance shown above. shows the di erence between the performance of the benchmark and the performance of the benchmark with The performance shown in Table C is based on Bench- the tactical shi . Unless otherwise noted below, perfor- mark Allocation, and the Benchmark Allocation with tac- mance is annualized for periods of less than one year. tical shi (see “Sources of benchmark allocations and The Information ratio is a risk adjusted performance mea- investor risk pro les” on page 50 for details regarding sure, which adjusts the excess returns for the tracking Benchmark construction). Performance is calculated uti- error risk of the tactical deviations. Speci cally the infor- lizing the returns of the indices identi ed in Table D. Table A: Moderate Risk ProÎle Performance Measurement Benchmark Benchmark with Excess return Information Russell 3000 Barclays Capital allocation tactical shift Ratio stock index US Aggregate bond (annualized) (total return) index (total return) 25 Aug. 08 to 31 Dec. 08 -16.59% -15.64% 0.96% +2.0 -29.00% 3.33% 2009 Q1 -5.52% -5.45% 0.07% +0.3 -10.80% 0.12% 2009 Q2 11.18% 11.37% 0.18% +1.0 16.82% 1.78% 2009 Q3 10.44% 11.07% 0.63% +2.1 16.31% 3.74% 2009 Q4 2.99% 3.30% 0.31% +1.2 5.90% 0.20% 2010 Q1 2.74% 2.56% -0.18% -0.9 5.94% 1.78% 2010 Q2 -4.56% -4.87% -0.31% -1.4 -11.32% 3.49% 2010 Q3 8.34% 7.99% -0.35% -2.2 11.53% 2.48% 2010 Q4 until 7 Dec. 2010 3.45% 3.41% -0.04% -0.5 8.51% -1.35% Since inception 9.54% 11.05% 1.52% +0.6 3.60% 16.55% Source: UBS WMR, as of 7 December 2010 Investment Strategy Guide December 2010 51
  • 52.
    Tactical Asset AllocationPerformance Measurement Table B: IS benchmark allocations for moderate risk proÎle investor, and underlying indices (all Îgures in %) 25 Aug 2008 to 23 Feb 2009 24 Feb 2009 to present US Large Cap Value (Russell 1000 Value) 12.5 US Large Cap Value (Russell 1000 Value) 11.0 US Large Cap Growth (Russell 1000 Growth) 12.5 US Large Cap Growth (Russell 1000 Growth) 11.0 US Small Cap Value (Russell 2000 Value) 2.0 US Mid Cap (Russell Midcap) 5.0 US Small Cap Growth (Russell 2000 Growth) 2.0 US Small Cap (Russell 2000) 3.0 US REITs (FTSE NAREIT All REITs) 1.5 US REITs (FTSE NAREIT All REITs) 2.0 Non-US Dev. Eq (MSCI Gross World ex-US) 10.5 Developed Markets (MSCI Gross World ex-US) 10.0 Emerging Markets Eq. (MSCI Gross EM USD) 2.0 Emerging Markets (MSCI Gross EM USD) 2.0 US Fixed Income (BarCap US Aggregate) 30.0 US Fixed Income (BarCap US Aggregate) 29.0 Non-US Fixed Income (BarCap Global Aggregate ex-USD) 8.0 Non-US Fixed Income (BarCap Global Aggregate ex-USD) 8.0 Cash (JP Morgan Cash Index USD 1 month) 2.0 Cash (JP Morgan Cash Index USD 1 month) 2.0 Commodities (DJ UBS total return index) 5.0 Commodities (DJ UBS total return index) 5.0 Alternative Investments (HFRX Equal Weighted Strategies) 12.0 Alternative Investments (HFRX Equal Weighted Strategies) 12.0 Source: UBS WMR and Investment Solutions Table C: WMR US dollar Taxable Fixed Income Strategy Performance measurement Benchmark Benchmark Excess Information ratio Barclays Capital allocation with tactical shift return (annualized) US Aggregate 31 Jan. 2007 to 31 Dec. 2007 4.69% 4.56% -0.12% -1.4 7.01% 2008 -1.17% -2.11% -0.94% -3.2 5.24% 2009 11.67% 12.96% 1.29% 2.8 5.93% 2010 Q1 2.27% 2.39% 0.12% 3.7 1.78% 2010 Q2 2.70% 2.56% -0.14% -2.3 3.49% 2010 Q3 3.51% 3.60% 0.09% 5.2 2.48% 2010 Q4 to 7 Dec. 2010 -0.74% -0.72% 0.02% 1.1 -1.35% Source: UBS WMR, as of 7 December 2010 Table D : Benchmark allocation for US dollar Fixed Income Strategy and underlying indices used to calculate performance shown in Table C (all Îgures in %) 31 Jan. 2007 31 July 2007 25 Aug 2008 31 March 2009 to 30 July 2007 to 24 Aug 2008 to 30 March 2009 to present Treasuries (BoA ML Treasury Master Index) 10.0% 12.0% 12.0% 12.0% TIPS (BoA ML Treasury InËation-Linked Index) 5.0% 5.0% 5.0% 5.0% Agencies (BoA ML Agency Composite Master Index) 20.0% 22.0% 22.0% 22.0% Inv. Grade Corporates (BoA ML Corporate Master Index) 20.0% 21.0% 18.0% 22.0% High Yield Corporates (BoA ML High Yield Master II Constrained Index) 10.0% 10.0% 8.0% 10.0% Preferred Securities (BoA ML Preferred Stock Fixed Index) 10.0% 10.0% 10.0% 4.0% Mortgages (BoA ML US Mortgage Master Index) 20.0% 20.0% 20.0% 20.0% Emerg. Markets (BoA ML Emerging Sovereign Plus Index) 0.0% 0.0% 5.0% 5.0% Cash (BoA ML US T-Bill 3-month Index) 5.0% 0.0% 0.0% 0.0% Source: UBS WMR and Investment Solutions 52 2011 Outlook
  • 53.
    Appendix End notes fortable labeled detailed asset allocations with non-traditional Non-Traditional Assets assets (NTAs) Nontraditional assets include commodities and alternative investments. Alterna- 1 See “Sources of benchmark allocations and investor risk pro les”on next page tive investments, in turn, include hedge funds,private equity, real estate, and regarding the source of investor risk pro les. managed futures. Interests of alternative investment funds are sold only to quali- 2 See “Sources of benchmark allocations and investor risk pro les” on next page ed investors, and only by means of o ering documents that include information regarding the source of benchmark allocations and their suitability. about the risks, performance and expenses of alternative investment funds, and 3 See “Deviations from benchmark allocations” in the appendix regarding the which clients are urged to read carefully before subscribing and retain. An invest- interpretation of the suggested tactical deviations from benchmark. ment in an alternative investment fund is speculative and involves signi cant risks. 4 The current allocation row is the sum of the benchmark allocation and the WMR Alternative investment funds are not mutual funds and are not subject to the tactical deviation rows. same regulatory requirements as mutual funds. Alternative investment funds’ 5 UBS WMR considers that maintaining the benchmark allocation is appropriate performance may be volatile, and investors may lose all or a substantial amount for alternative investments. The recommended tactical deviation is therefore of their investment in an alternative investment fund. Alternative investment structurally set at 0. See “Sources of benchmark allocations and investor risk funds may engage in leveraging and other speculative investment practices that pro les” on next page regarding the types of alternative investments and their may increase the risk of investment loss. Interests of alternative investment funds suitability. typically will be illiquid and subject to restrictions on transfer. Alternative invest- ment funds may not be required to provide periodic pricing or valuation informa- End notes for table labeled detailed asset allocations without non-tradi- tion to investors. Alternative investment fund investment programs generally tional assets (NTAs) involve complex tax strategies and there may be delays in distributing tax informa- 1 See “Sources of benchmark allocations and investor risk pro les”on next page tion to investors. Alternative investment funds are subject to high fees, including regarding the source of investor risk pro les. management fees and other fees and expenses, all of which will reduce pro ts. 2 See “Sources of benchmark allocations and investor risk pro les” on next page Alternative investment funds may uctuate in value. An investment in an alterna- regarding the source of benchmark allocations and their suitability. tive investment fund is long-term, there is generally no secondary market for the 3 See “Deviations from benchmark allocations” in the Appendix regarding the interests of a fund, and none is expected to develop. Interests in alternative in- interpretation of the suggested tactical deviations from benchmark. vestment funds are not deposits or obligations of, or guaranteed or endorsed by, 4 The current allocation row is the sum of the benchmark allocation and the WMR any bank or other insured depository institution, and are not federally insured by tactical deviation rows. the Federal Deposit Insurance Corporation, the Federal Reserve Board, or any other governmental agency. Prospective investors should understand these risks Emerging Market Investments and have the nancial ability and willingness to accept them for an extended Investors should be aware that Emerging Market assets are subject to, amongst period of time before making an investment in an alternative investment fund others, potential risks linked to currency volatility, abrupt changes in the cost of and should consider an alternative investment fund as a supplement to an overall capital and the economic growth outlook, as well as regulatory and socio-political investment program. risk, interest rate risk and higher credit risk. Assets can sometimes be very illiquid In addition to the risks that apply to alternative investments generally, the follow- and liquidity conditions can abruptly worsen. WMR generally recommends only ing are additional risks related to an investment in these strategies: those securities it believes have been registered under Federal U.S. registration • Hedge Fund Risk: There are risks speci cally associated with investing in hedge rules (Section 12 of the Securities Exchange Act of 1934) and individual State funds, which may include risks associated with investing in short sales, options, registration rules (commonly known as “Blue Sky” laws). Prospective investors small-cap stocks, “junk bonds,” derivatives, distressed securities, non-U.S. secu- should be aware that to the extent permitted under US law, WMR may from time rities and illiquid investments. to time recommend bonds that are not registered under US or State securities • Hedge Fund of Funds: In addition to the risks associated with hedge funds laws. These bonds may be issued in jurisdictions where the level of required disclo- generally, an investor should recognize that the overall performance of a fund of sures to be made by issuers is not as frequent or complete as that required by US funds is dependent not only on the investment performance of the manager of laws. the fund, but also on the performance of the underlying managers. The investor will bear the management fees and expenses of both the fund of funds and the For more background on emerging markets generally, see the WMR Education underlying hedge funds or accounts in which the fund of funds invests, which Notes “Investing in Emerging Markets (Part 1): Equities”, 30 July 2007, “Emerging could be signi cant. Market Bonds: Understanding Emerging Market Bonds,” 12 August 2009 and • Managed Futures: There are risks speci cally associated with investing in man- “Emerging Market Bonds: Understanding Sovereign Risk,” 17 December 2009. aged futures programs. For example, not all managers focus on all strategies at all times, and managed futures strategies may have material directional ele- Investors interested in holding bonds for a longer period are advised to select the ments. bonds of those sovereigns with the highest credit ratings (in the investment grade • Real Estate: There are risks speci cally associated with investing in real estate band). Such an approach should decrease the risk that an investor could end up products and real estate investment trusts. They involve risks associated with holding bonds on which the sovereign has defaulted. Sub-investment grade bonds debt, adverse changes in general economic or local market conditions, changes are recommended only for clients with a higher risk tolerance and who seek to in governmental, tax, real estate and zoning laws or regulations, risks associated hold higher yielding bonds for shorter periods only. with capital calls and, for some real estate products, the risks associated with the ability to qualify for favorable treatment under the federal tax laws. • Private Equity: There are risks speci cally associated with investing in private equity. Capital calls can be made on short notice, and the failure to meet capital calls can result in signi cant adverse consequences including, but not limited to, a total loss of investment. • Foreign Exchange/Currency Risk: Investors in securities of issuers located outside Investment Strategy Guide December 2010 53
  • 54.
    Appendix ofthe United States should be aware that even for securities denominated in periods. Although some strategies employ relative value techniques, macro U.S. dollars, changes in the exchange rate between the U.S. dollar and the strategies are distinct from relative value strategies in that the primary in-vest- issuer’s “home” currency can have unexpected e ects on the market value and ment thesis is predicated on predicted or future movements in the underlying liquidity of those securities. Those securities may also be a ected by other risks instruments, rather than realization of a valuation discrepancy between securi- (such as political, economic or regulatory changes) that may not be readily ties. In a similar way, while both macro and equity hedge managers may hold known to a U.S. investor. equity securities, the overriding investment thesis is predicated on the impact • Options: Options are not suitable for all investors. Please read the Options Clear- movements in underlying macroeconomic variables may have on security prices, ing Corporation Publication titled “Characteristics and Risks of Standardized as opposed to equity hedge, in which the fundamental characteristics of the Options Trading” and consult your tax advisor prior to investing. The Publication company are the most signi cant and integral to investment thesis. can be obtained from your Financial Services Inc., Financial Advisor, or can be • Distressed Restructuring Strategies: Employ an investment process focused on accessed under the Publications Section of the Option Clearing Corporation’s corporate xed income instruments, primarily on corporate credit instruments of website: www.theocc.com. companies trading at signi cant discounts to their value at issuance, or obliged (par value) at maturity, as a result of either a formal bankruptcy proceeding or Description of Certain Alternative Investment Strategies nancial market perception of near-term proceedings. Managers are typically • Equity Hedge: Investment managers who maintain positions both long and short actively involved with the management of these companies, frequently involved in primarily equity and equity-derivative securities. A wide variety of investment on creditors’ committees in negotiating the exchange of securities for alternative processes can be employed to arrive at an investment decision, including both obligations, either swaps of debt, equity or hybrid securities. Managers employ quantitative and fundamental techniques; strategies can be broadly diversi ed fundamental credit processes focused on valuation and asset coverage of securi- or narrowly focused on speci c sectors and can range broadly in terms of levels ties of distressed rms. In most cases, portfolio exposures are concentrated in of net exposure, leverage employed, holding period, concentrations of market instruments which are publicly traded, in some cases actively and in others under capitalizations and valuation ranges of typical portfolios. Equity hedge managers reduced liquidity but, in general, for which a reasonable public market exists. In would typically maintain at least 50% and may, in some cases, be substantially contrast to special situations, distressed strategies primarily employ debt (greater entirely invested in equities, both long and short. than 60%) but also may maintain related equity exposure. • Event Driven: Investment managers who maintain positions in companies cur- • Relative Value: Investment managers who maintain positions in which the invest- rently or prospectively involved in corporate transactions of a wide variety includ- ment thesis is predicated on realization of a valuation discrepancy in the relation- ing, but not limited to, mergers, restructurings, nancial distress, tender o ers, ship between multiple securities. Managers employ a variety of fundamental and share-holder buybacks, debt exchanges, security issuance or other capital struc- quantitative techniques to establish investment theses, and security types range ture adjustments. Security types can range from most senior in the capital struc- broadly across equity, xed income, derivative or other security types. Fixed ture to most junior or subordinated, and frequently involve additional derivative income strategies are typically quantitatively driven to measure the existing securities. Event-driven exposure includes a combination of sensitivities to equity relationship between instruments and, in some cases, identify attractive positions markets, credit markets and idiosyncratic, company-speci c developments. in which the risk-adjusted spread between these instruments represents an Investment theses are typically predicated on fundamental characteristics (as attractive opportunity for the investment manager. Relative value position may opposed to quantitative), with the realization of the thesis predicated on a be involved in corporate transactions also, but as opposed to event driven expo- speci c development exogenous to the existing capital structure. sures, the investment thesis is predicated on realization of a pricing discrepancy • Credit Arbitrage Strategies: Employ an investment process designed to isolate between related securities, as opposed to the outcome of the corporate transac- attractive opportunities in corporate xed in-come securities. These include both tion. senior and subordinated claims as well as bank debt and other outstanding obligations, structuring positions with little or no broad credit market exposure. These may also contain a limited exposure to government, sovereign, equity, convertible or other obligations, but the focus of the strategy is primarily on xed corporate obligations and other securities held as component positions within these structures. Managers typically employ fundamental credit analysis to evaluate the likelihood of an improvement in the issuer’s creditworthiness. In most cases, securities trade in liquid markets, and managers are only infre- quently or indirectly involved with company management. Fixed income: corpo- rate strategies di er from event driven; credit arbitrage in the former more typically involves more general market hedges, which may vary in the degree to which they limit xed income market exposure, while the latter typically involves arbitrage positions with little or no net credit market exposure, but are predi- cated on speci c, anticipated idiosyncratic developments. • Macro: Investment managers who trade a broad range of strategies in which the investment process is predicated on movements in underlying economic vari- ables and the impact these have on equity, xed income, hard currency and commodity markets. Managers employ a variety of techniques, both discretion- ary and systematic analysis, combinations of top-down and bottom-up theses, quantitative and fundamental approaches and long- and short-term holding 54 2011 Outlook
  • 55.
    Appendix Explanations about AssetClasses Sources of benchmark allocations and investor risk proÎles were taken from Treasuries and Preferred Securities from Corporate Bonds. A • Benchmark allocations represent the longer-term allocation of assets that is level of overall risk similar to that of the original IS allocation was retained. deemed suitable for a particular investor. Except as described below, the bench- • Alternative investments (AI) include hedge funds, private equity, real estate, and mark allocations expressed in this publication have been developed by UBS managed futures. The total benchmark allocation was determined by IS using Investment Solutions (IS), a business sector within UBS Wealth Management the process described above. The Wealth Management Americas Investment Americas that develops research-based traditional investments (e.g., managed Committee (WMA IC) derived the AI subsector benchmark allocations by adopt- accounts and mutual fund options) and alternative strategies (e.g., hedge funds, ing IS’ determination as to the appropriate subsector benchmark allocations private equity, and real estate) o ered to UBS clients. The benchmark allocations with AI for the following risk pro les: conservative, moderately conservative, are provided for illustrative purposes only and were designed by IS for hypotheti- moderate, moderate aggressive and aggressive. The WMA IC then developed cal US investors with a total return objective under seven di erent Investor Risk subsector allocations for very conservative and very aggressive risk pro les by Pro les ranging from very conservative to very aggressive. In general, benchmark taking the IS subsector weightings for conservative and aggressive risk pro le allocations will di er among investors according to their individual circum- investors and applying them pro rata to the IS AI total benchmark allocations for stances, risk tolerance, return objectives and time horizon. Therefore, the bench- very conservative and very aggressive, respectively. Allocations to AI as illustrated mark allocations in this publication may not be suitable for all investors or invest- in this report may not be suitable for all investors. In particular, minimum net ment goals and should not be used as the sole basis of any investment decision. worth requirements may apply. As always, please consult your UBS Financial Advisor to see how these weight- • The background for the benchmark allocation attributed to commodities can be ings should be applied or modi ed according to your individual pro le and found in the WMR Education Note “A pragmatic approach to commodities,” 2 investment goals. May 2007. • The process by which UBS Investment Solutions has derived the benchmark allocations can be described as follows. First, an allocation is made to broad Deviations from benchmark allocation asset classes based on an investor’s risk tolerance and characteristics (such as • The recommended tactical deviations from the benchmark are provided by preference for international investing). This is accomplished using optimization WMR. They re ect our short- to medium-term assessment of market opportuni- methods within a mean-variance framework. Based on a proprietary set of ties and risks in the respective asset classes and market segments. Positive / zero capital market assumptions, including expected returns, risk, and correlation of / negative tactical deviations correspond to an overweight / neutral / under- di erent asset classes, combinations of the broad asset classes are computed weight stance for each respective asset class and market segment relative to that provide the highest level of expected return for each level of expected risk. their benchmark allocation. The current allocation is the sum of the benchmark A qualitative judgmental overlay is then applied to the output of the optimiza- allocation and the tactical deviation. tion process to arrive at the benchmark allocation. The capital market assump- • Note that the regional allocations on the International Equities page are pro- tions used for the benchmark allocations are developed by UBS Global Asset vided on an unhedged basis (i.e., it is assumed that investors carry the underly- Management. UBS Global Asset Management is a subsidiary of UBS AG and an ing currency risk of such investments). Thus, the deviations from the benchmark af liate of UBS Financial Services Inc. re ect our views of the underlying equity and bond markets in combination with • In addition to the benchmark allocations IS derived using the aforementioned our assessment of the associated currencies. The two bar charts (“Equity Re- process, WMR determined the benchmark allocation by country of Non-US gions” and “Fixed Income Regions”) represent the relative attractiveness of Developed Equity and Non-US Fixed Income in proportion to each country’s countries (including the currency outlook) within a pure equity and pure xed market capitalization, and determined the benchmark allocation by Sector and income portfolio, respectively. In contrast, the detailed asset allocation tables Industry Group of US Equity in proportion to each sector’s market capitalization. integrate the country preferences within each asset class with the asset class WMR, in consultation with IS, also determined the benchmark allocation for US preferences stated earlier in the report. As the tactical deviations at the asset dollar taxable xed income. It was derived from an existing moderate risk tax- class level are attributed to countries in proportion to the countries’ market able xed income allocation developed by IS, which includes fewer xed income capitalization, the relative ranking among regions may be altered in the com- segments than the benchmark allocation presented here. The additional xed bined view. income segments were taken by WMR from related segments. For example, TIPS Scale for tactical deviation charts Symbol Description/De nition Symbol Description/De nition Symbol Description/De nition + moderate overweight vs. benchmark – moderate underweight vs. benchmark n neutral, i.e., on benchmark ++ overweight vs. benchmark –– underweight vs. benchmark n/a not applicable +++ strong overweight vs. benchmark ––– strong underweight vs. benchmark Source: UBS WMR Investment Strategy Guide December 2010 55
  • 56.
    Disclaimer Wealth Management Researchis published by Wealth Management & Swiss Bank and Wealth Management Americas, Business Divisions of UBS AG (UBS) or an af liate thereof. In certain countries UBS AG is referred to as UBS SA. This publication is for your information only and is not intended as an o er, or a solicitation of an o er, to buy or sell any investment or other speci c product. The analysis contained herein is based on numerous assumptions. Di erent assumptions could result in materially di erent results. Certain services and products are subject to legal restrictions and cannot be o ered worldwide on an unrestricted basis and/or may not be eligible for sale to all investors. All information and opinions expressed in this document were obtained from sources believed to be reliable and in good faith, but no representation or warranty, express or implied, is made as to its accuracy or completeness (other than disclosures relating to UBS and its af liates). All information and opinions as well as any prices indicated are currently only as of the date of this report, and are subject to change without notice. Opinions expressed herein may di er or be contrary to those expressed by other business areas or divisions of UBS as a result of using di erent assumptions and/or criteria. At any time UBS AG and other companies in the UBS group (or employees thereof) may have a long or short position, or deal as principal or agent, in relevant securities or provide advisory or other services to the issuer of relevant securities or to a company connected with an issuer. Some investments may not be readily realisable since the market in the securities is illiquid and therefore valuing the investment and identifying the risk to which you are exposed may be dif cult to quantify. UBS relies on information barriers to control the ow of information contained in one or more areas within UBS, into other areas, units, divisions or af liates of UBS. Futures and options trading is considered risky. Past performance of an investment is no guarantee for its future performance. Some investments may be subject to sudden and large falls in value and on realisation you may receive back less than you invested or may be required to pay more. Changes in FX rates may have an adverse e ect on the price, value or income of an investment. We are of necessity unable to take into account the particular investment objectives, nancial situation and needs of our individual clients and we would recommend that you take nancial and/or tax advice as to the implications (including tax) of investing in any of the products mentioned herein. This document may not be reproduced or copies circulated without prior authority of UBS or a subsidiary of UBS. UBS expressly prohibits the distribution and transfer of this document to third parties for any reason. UBS will not be liable for any claims or lawsuits from any third parties arising from the use or distribution of this document. This report is for distribution only under such circumstances as may be permitted by applicable law. • Australia: Distributed by UBS Wealth Management Australia Ltd (Holder of Australian Financial Services License No. 231127), Chi ey Tower, 2 Chi ey Square, Sydney, New South Wales, NSW 2000. Bahamas: This publication is distributed to private clients of UBS (Bahamas) Ltd and is not intended for distribution to persons desig- nated as a Bahamian citizen or resident under the Bahamas Exchange Control Regulations. Canada: In Canada, this publication is distributed to clients of UBS Wealth Management Canada by UBS Investment Management Canada Inc.. Dubai: Research is issued by UBS AG Dubai Branch within the DIFC, is intended for professional clients only and is not for onward distribution within the United Arab Emirates. France: This publication is distributed by UBS (France) S.A., French “société anonyme” with share capital of € 125.726.944, 69, boulevard Haussmann F-75008 Paris, R.C.S. Paris B 421 255 670, to its clients and prospects. UBS (France) S.A. is a provider of investment services duly authorized according to the terms of the “Code Monétaire et Financier,” regulated by French banking and nancial authorities as the “Banque de France” and the “Autorité des Marchés Financiers.” Germany: The issuer under German Law is UBS Deutschland AG, Stephanstrasse 14-16, 60313 Frankfurt am Main. UBS Deutschland AG is authorized and regulated by the “Bundesanstalt für Finanzdienstleistungsaufsicht.“ Hong Kong: This publication is distributed to clients of UBS AG Hong Kong Branch by UBS AG Hong Kong Branch, a licensed bank under the Hong Kong Banking Ordinance and a registered institution under the Securities and Futures Ordinance. Indonesia: This research or publication is not intended and not prepared for purposes of public o ering of securities under the Indonesian Capital Market Law and its implementing regulations. Securities mentioned in this material have not been, and will not be, registered under the Indonesian Capital Mar- ket Law and regulations. Italy: This publication is distributed to the clients of UBS (Italia) S.p.A., via del vecchio politecnico 3 - Milano, an Italian bank duly authorized by Bank of Italy to the provision of nancial services and supervised by “Consob” and Bank of Italy. Jersey: UBS AG, Jersey Branch is regulated by the Jersey Financial Services Commission to carry on investment business and trust company business under the Financial Services (Jersey) Law 1998 (as amended) and to carry on banking business under the Banking Business (Jersey) Law 1991 (as amended). Luxembourg/Austria: This publication is not intended to constitute a public o er under Lux- embourg/Austrian law, but might be made available for information purposes to clients of UBS (Luxembourg) S.A./UBS (Luxembourg) S.A. Niederlassung Österreich, a regulated bank under the supervision of the “Commission de Surveillance du Secteur Financier” (CSSF), to which this publication has not been submitted for approval. Singapore: Please contact UBS AG Singapore branch, an exempt nancial adviser under the Singapore Financial Advisers Act (Cap. 110) and a wholesale bank licensed under the Singapore Banking Act (Cap. 19) regulated by the Monetary Authority of Singapore, in respect of any matters arising from, or in connection with, the analysis or report. Spain: This publication is distributed to clients of UBS Bank, S.A. by UBS Bank, S.A., a bank registered with the Bank of Spain. UAE: This research report is not intended to constitute an o er, sale or delivery of shares or other securities under the laws of the United Arab Emirates (UAE). The contents of this report have not been and will not be approved by any authority in the United Arab Emirates including the UAE Central Bank or Dubai Financial Authorities, the Emirates Securities and Com- modities Authority, the Dubai Financial Market, the Abu Dhabi Securities market or any other UAE exchange. UK: Approved by UBS AG, authorised and regulated in the UK by the Financial Services Authority. A member of the London Stock Exchange. This publication is distributed to private clients of UBS London in the UK. Where prod- ucts or services are provided from outside the UK they will not be covered by the UK regulatory regime or the Financial Services Compensation Scheme. USA: Distributed to US persons by UBS Financial Services Inc., a subsidiary of UBS AG. UBS Securities LLC is a subsidiary of UBS AG and an af liate of UBS Financial Services Inc. UBS Fi- nancial Services Inc. accepts responsibility for the content of a report prepared by a non-US af liate when it distributes reports to US persons. All transactions by a US person in the securities mentioned in this report should be e ected through a US-registered broker dealer af liated with UBS, and not through a non-US af liate. ©UBS 2010. The key symbol and UBS are among the registered and unregistered trademarks of UBS. All rights reserved. 56 2011 Outlook
  • 57.
    ©2010 UBS FinancialServices Inc. All rights reserved. Member SIPC. All other trademarks, registered trademarks, service marks and registered service marks are of their respective companies. UBS Financial Services Inc. www.ubs.com/ nancialservicesinc UBS Financial Services Inc. is a subsidiary of UBS AG. Order # X3076 ab 58 2011 Outlook