Download as PDF, PPTX


This document discusses the importance of database experiments for optimizing PostgreSQL performance and presents a structured approach to conducting these experiments. It introduces the nancy CLI tool developed by PostgreSQL.ai for automating database experimentation and outlines best practices for performance analysis, including configuration tuning and workload evaluation. Additionally, it highlights real-life examples demonstrating the impact of specific configurations on database performance.
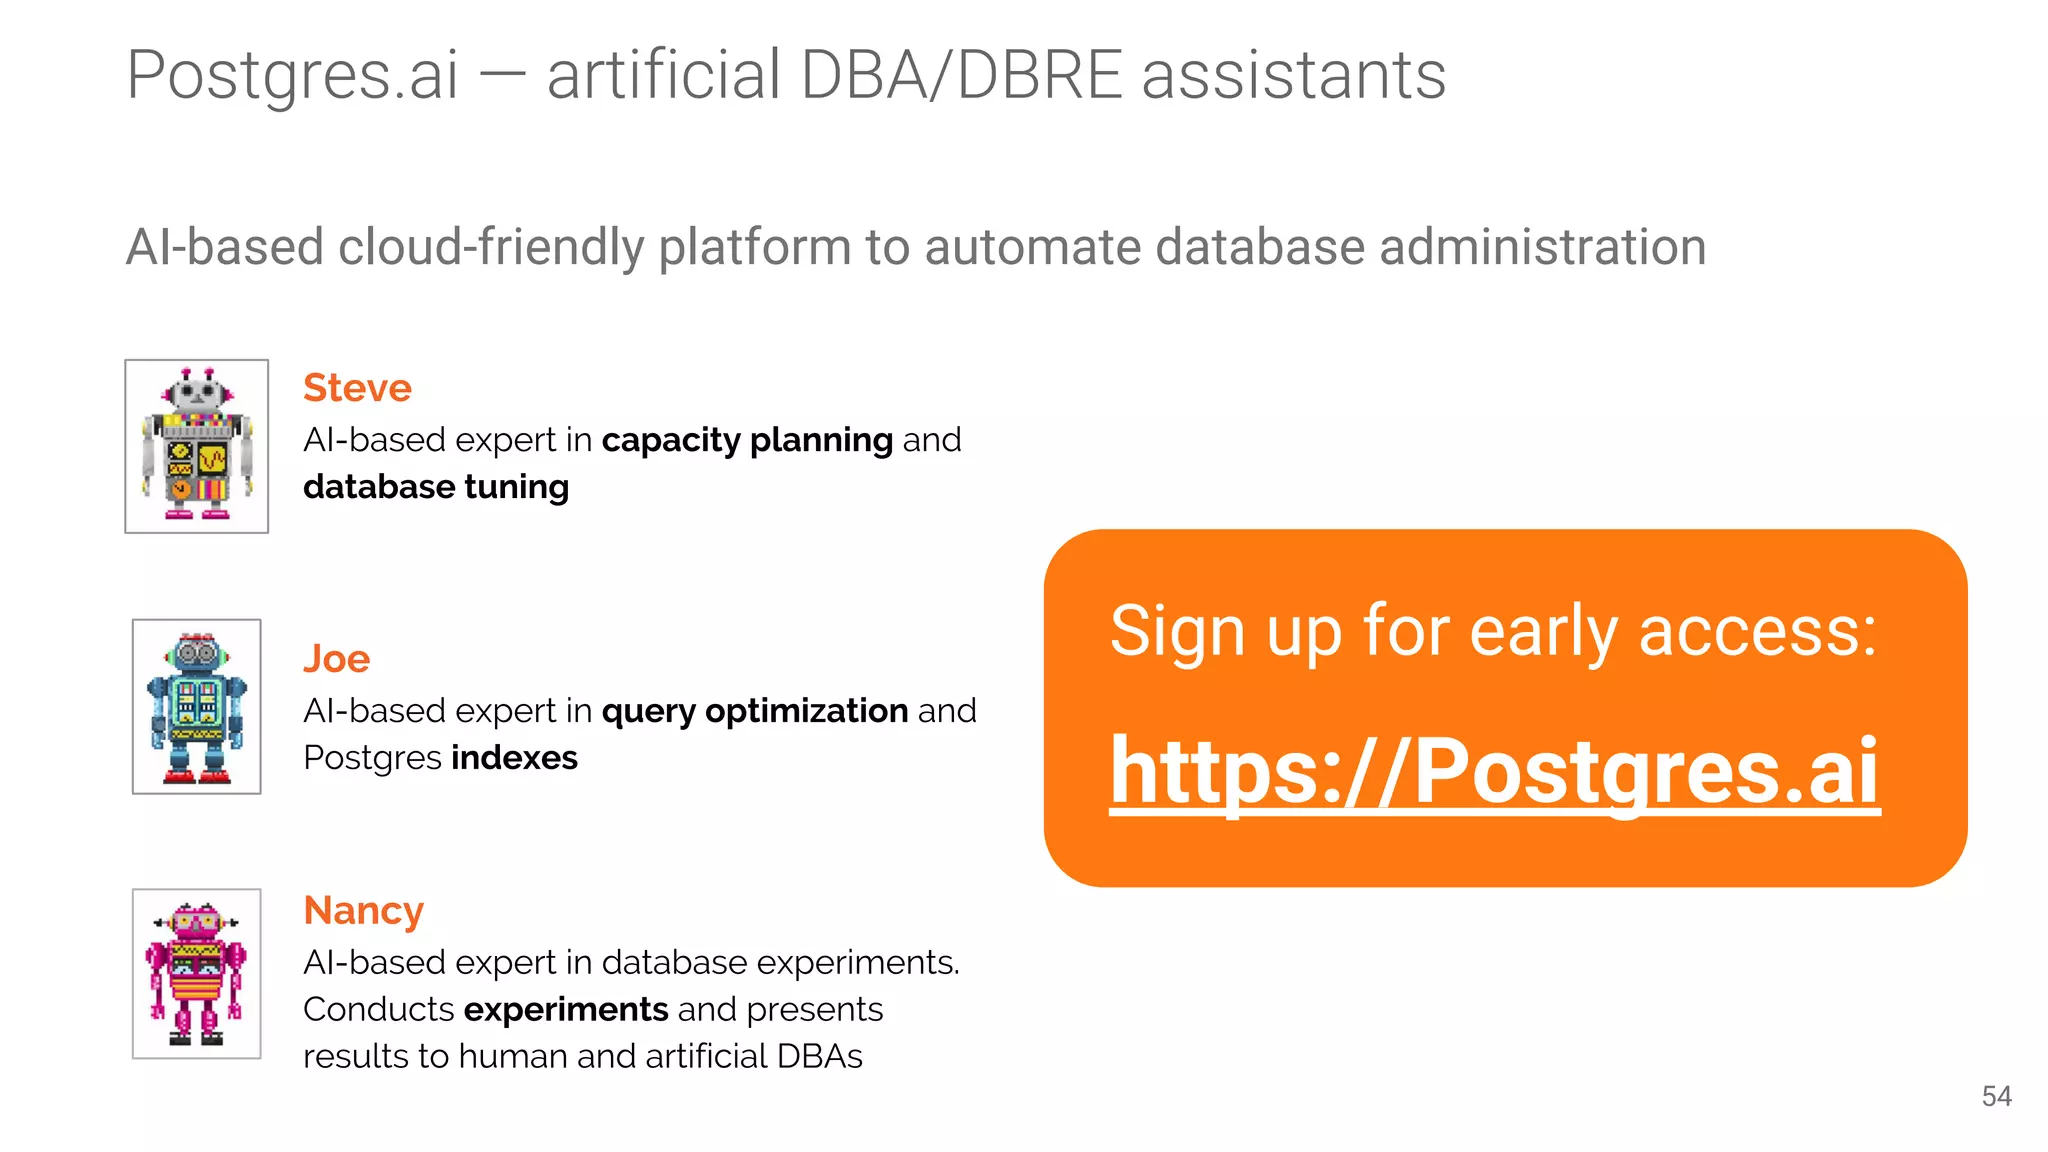
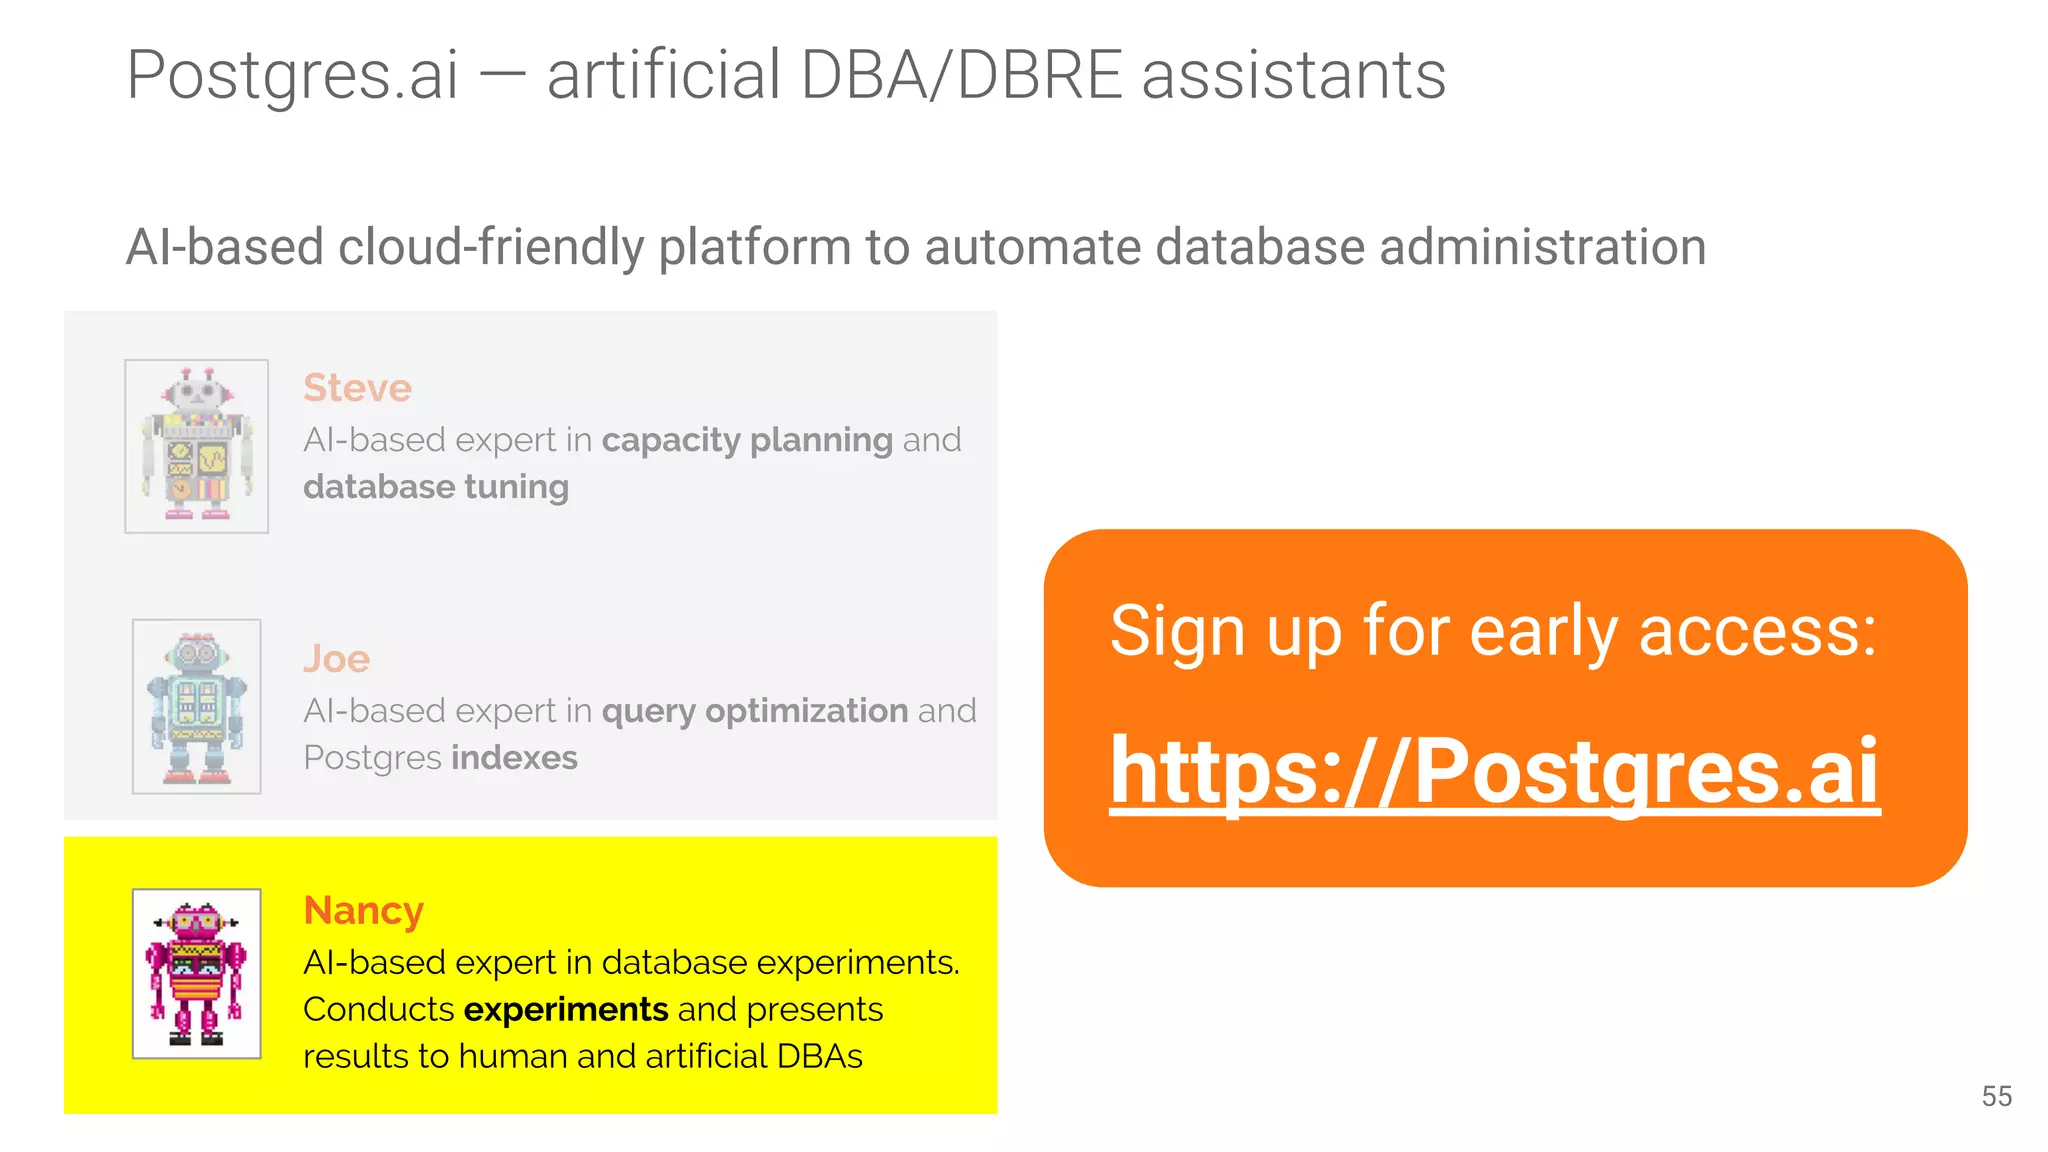
Overview of the presentation's focus on database experiments, speaker's expertise and background in PostgreSQL.
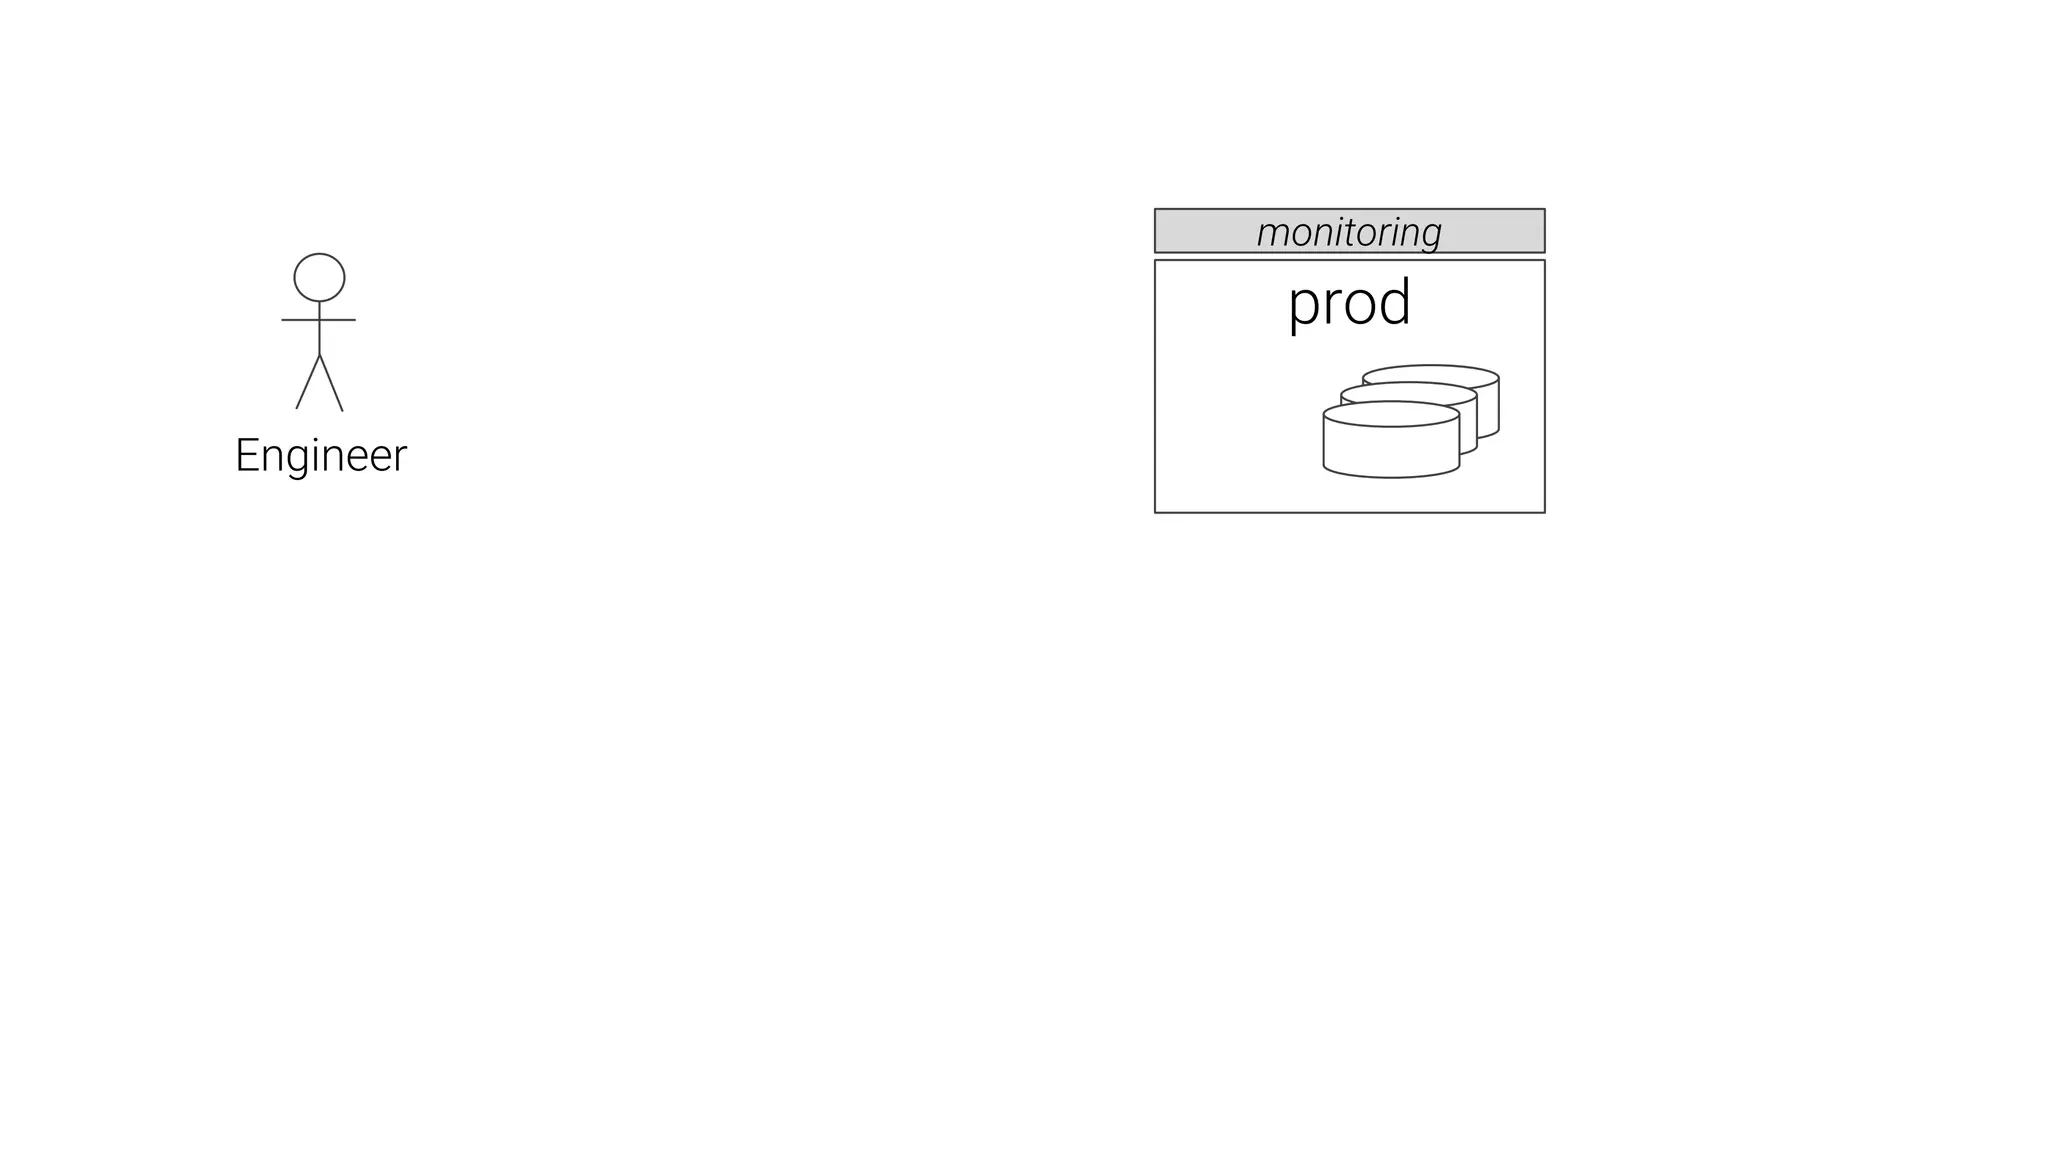
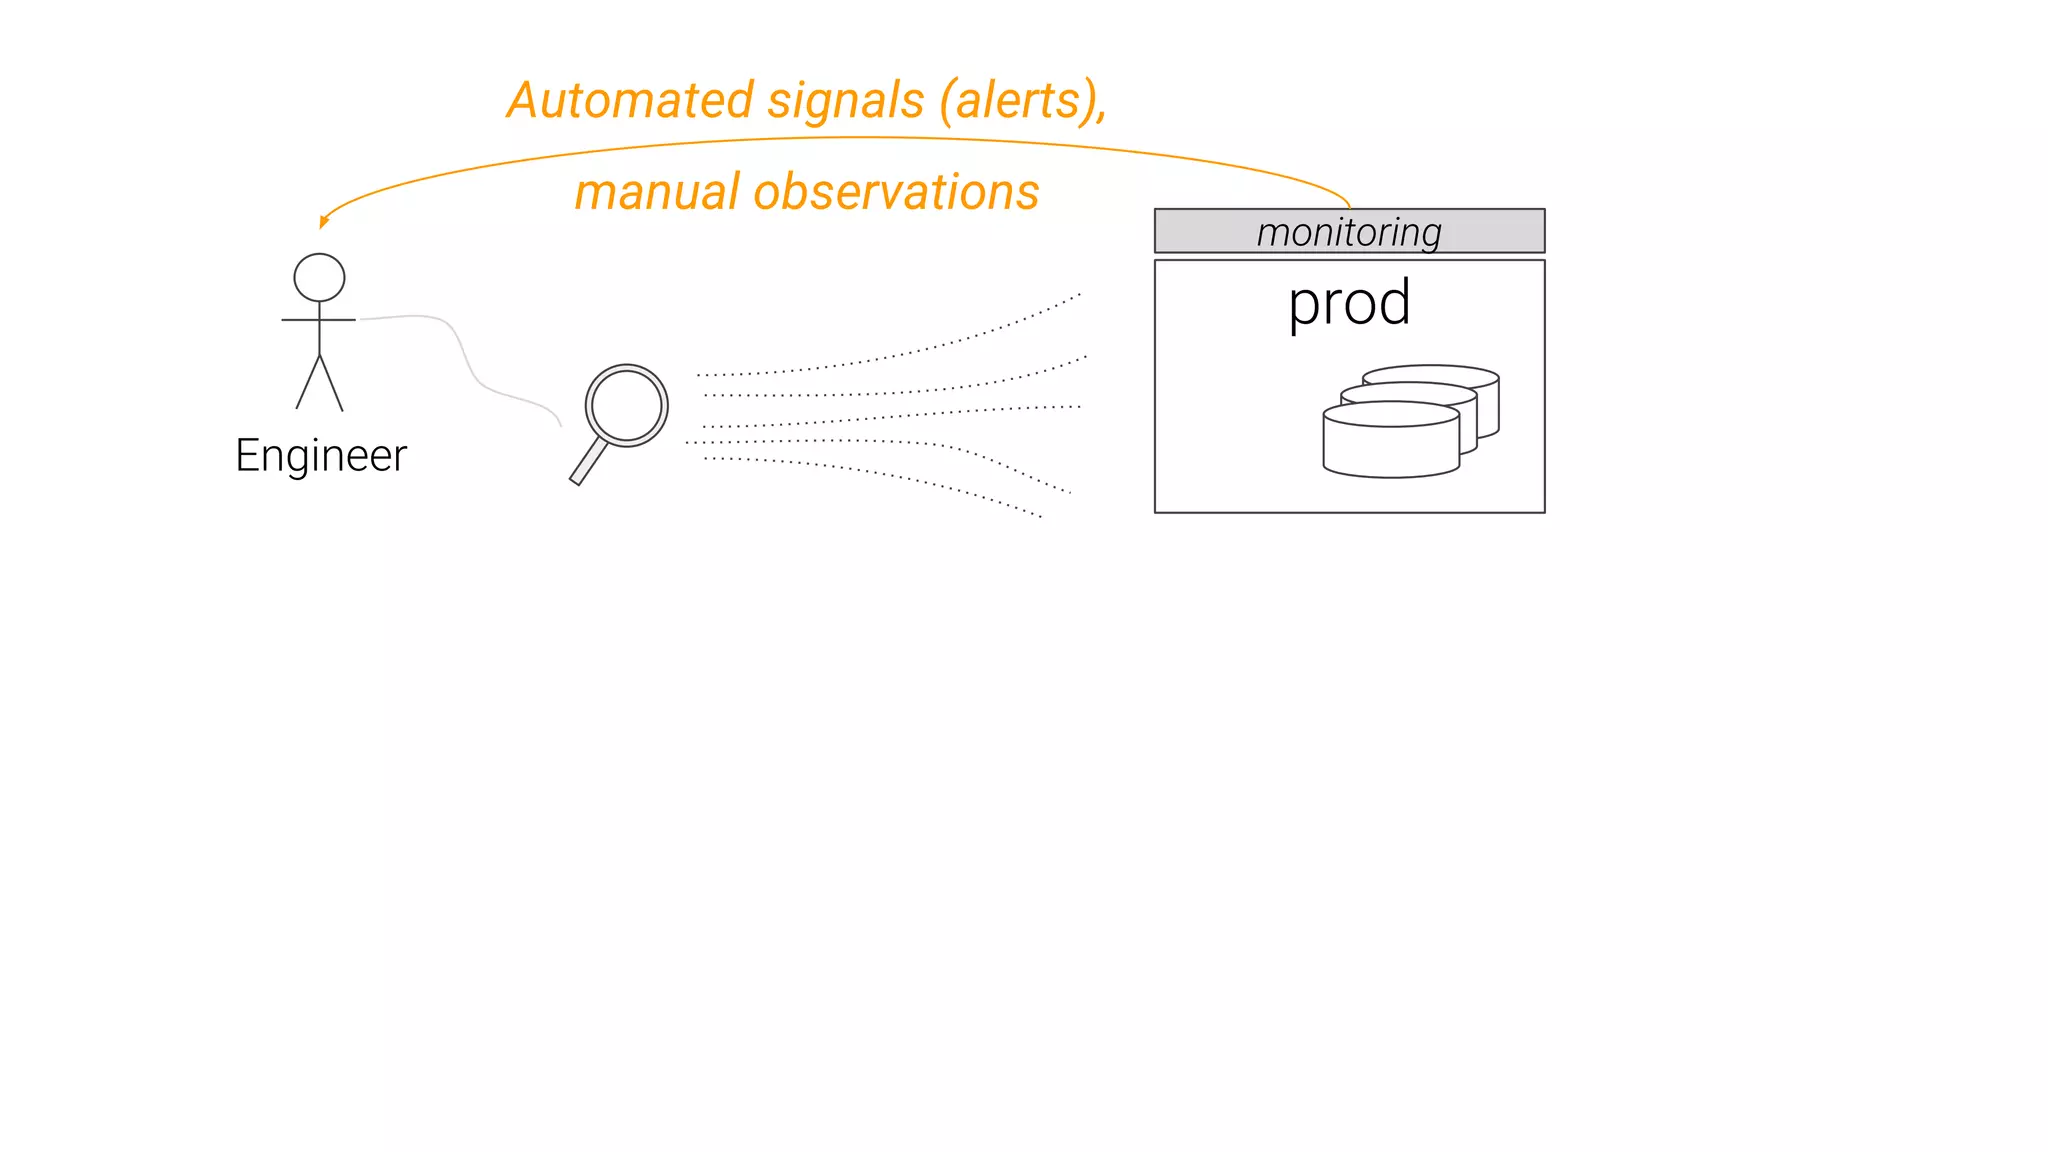
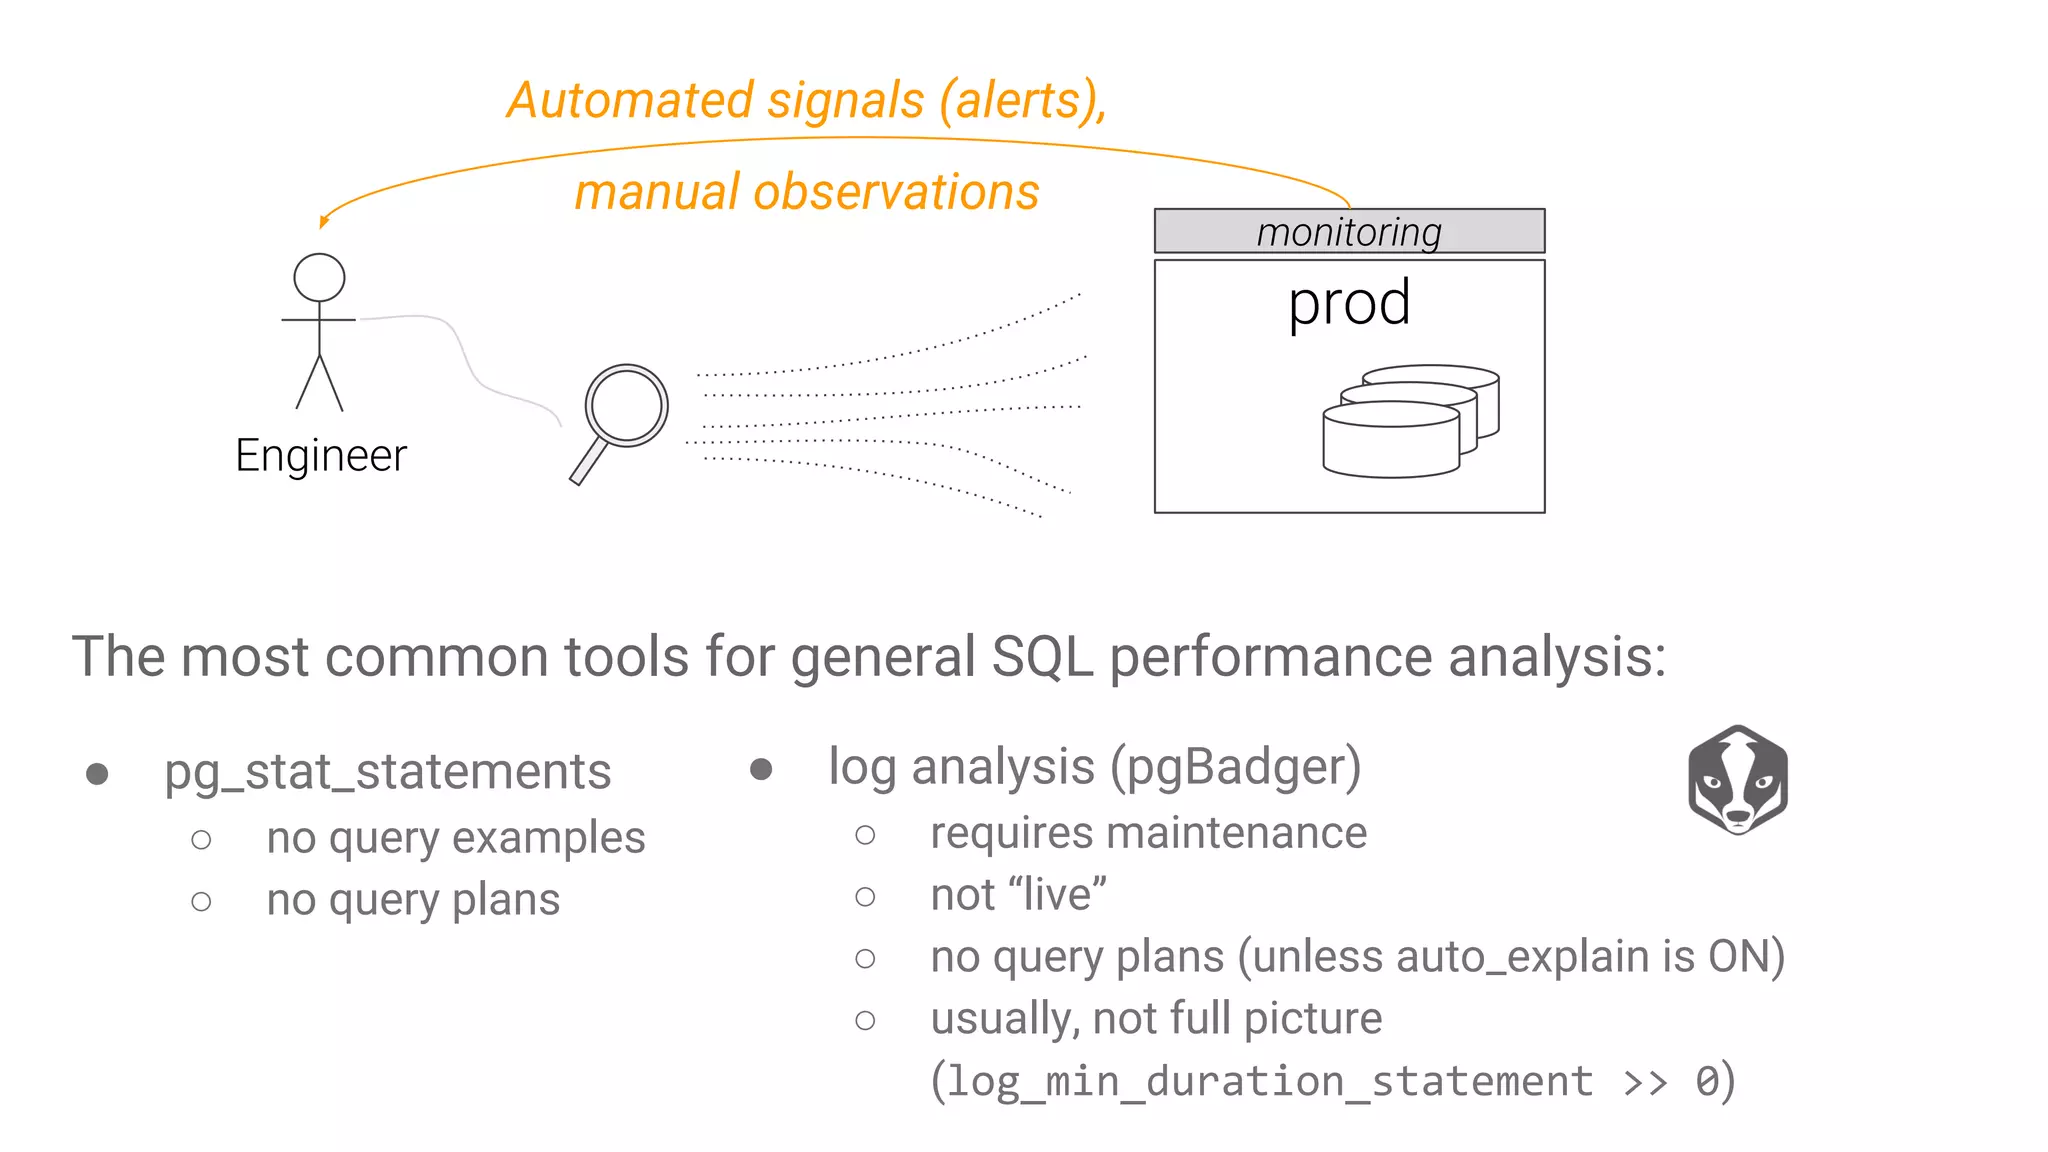
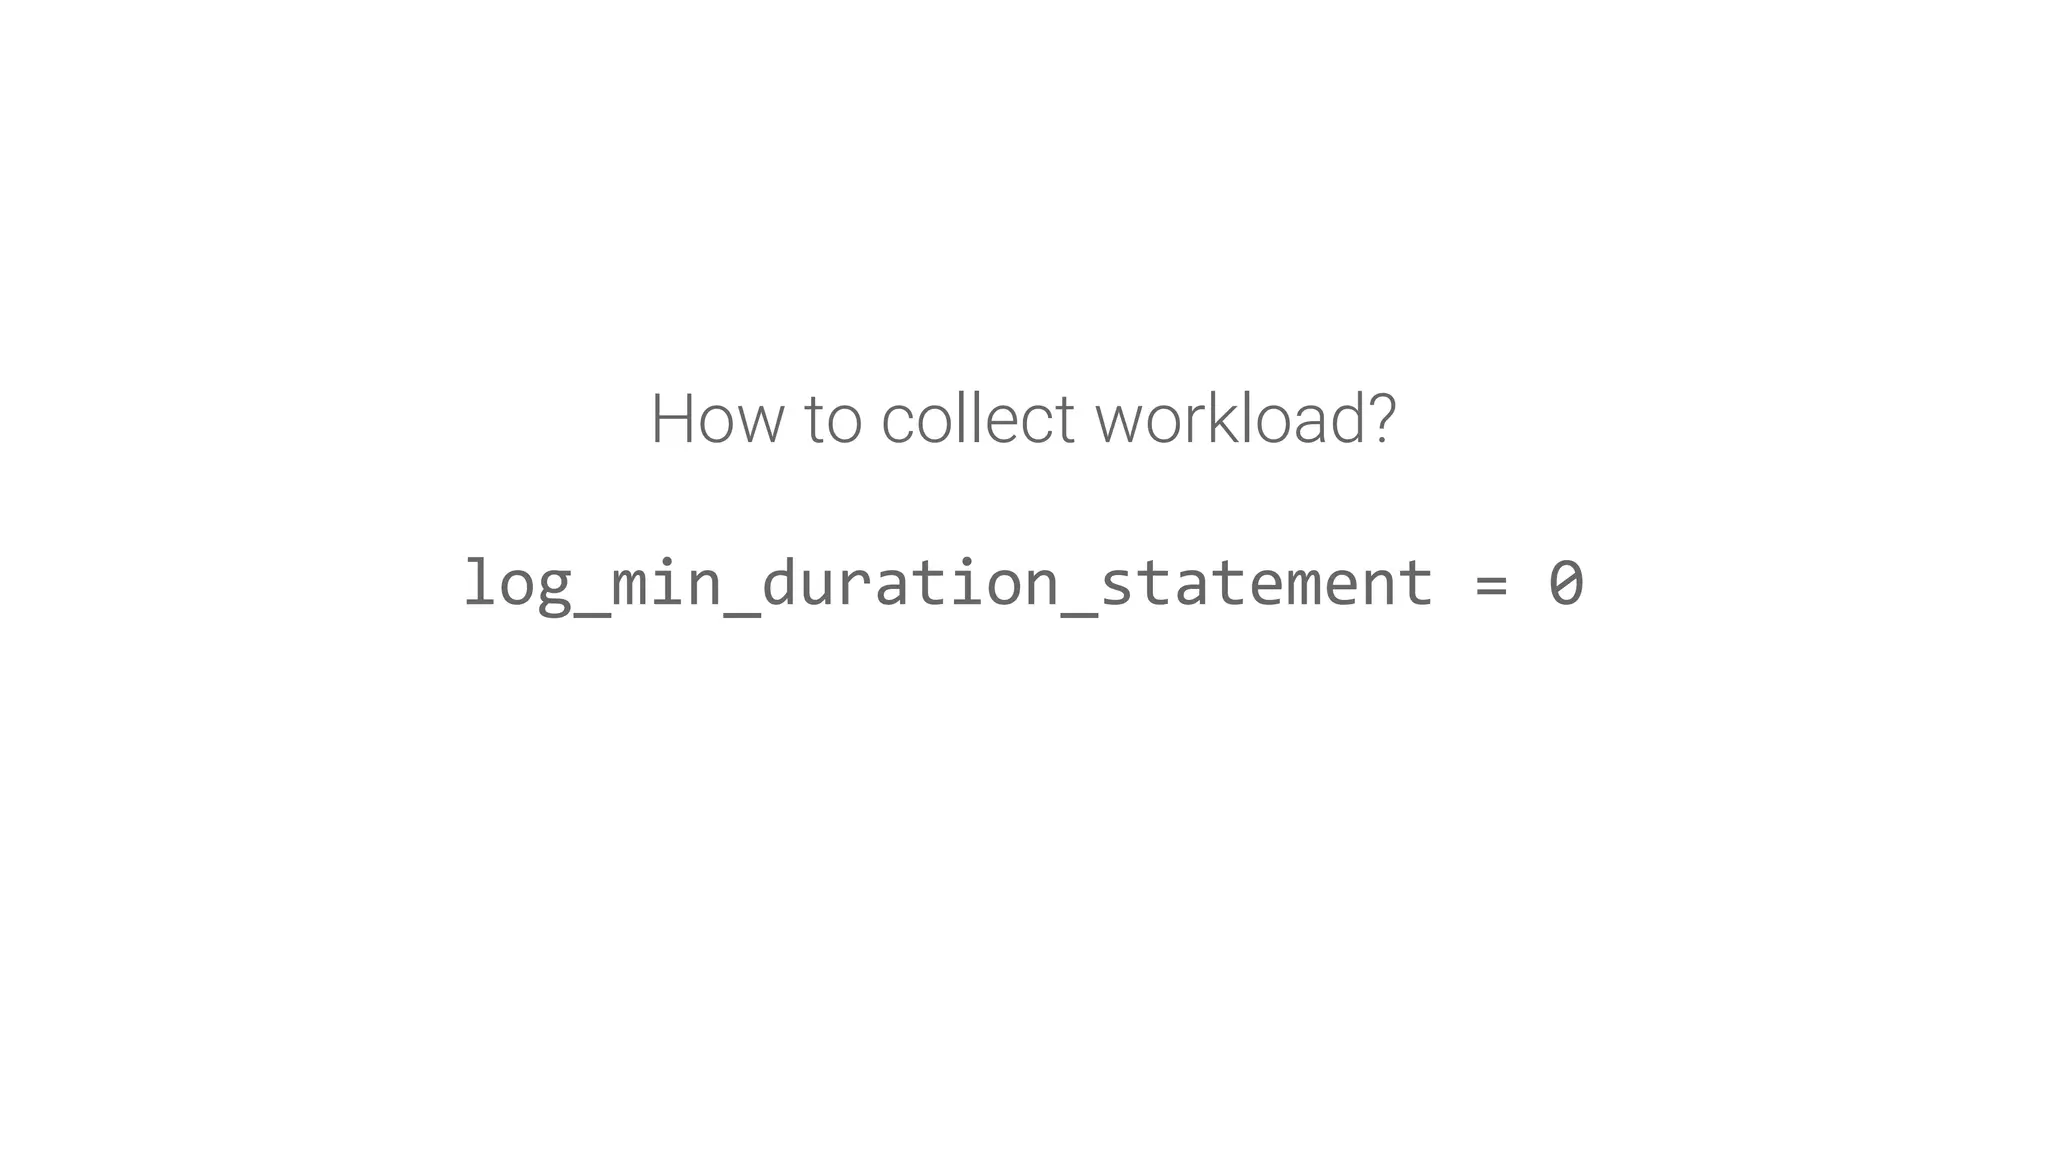
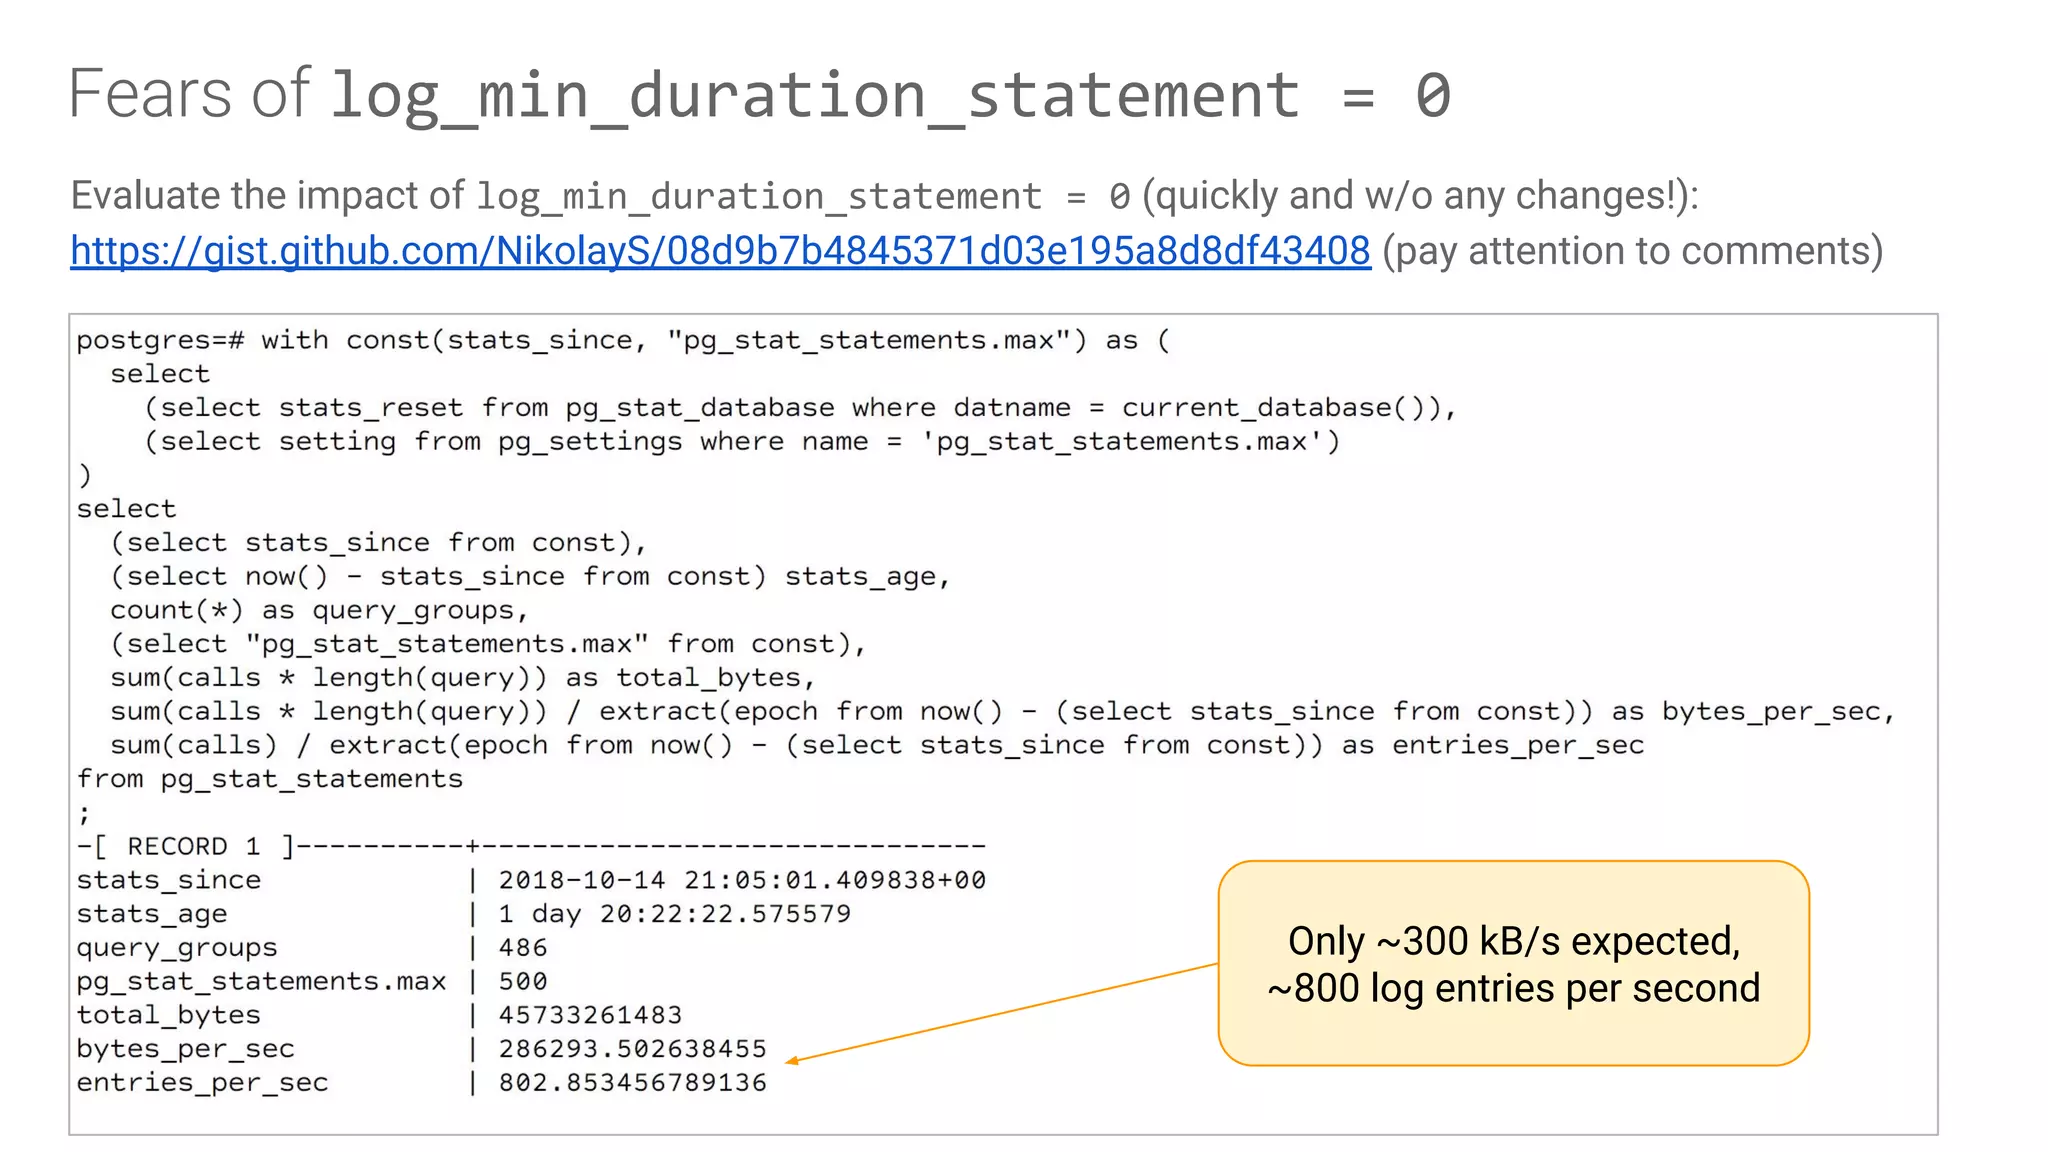
Importance of identifying SQL performance issues using monitoring tools such as pg_stat_statements and log analysis.
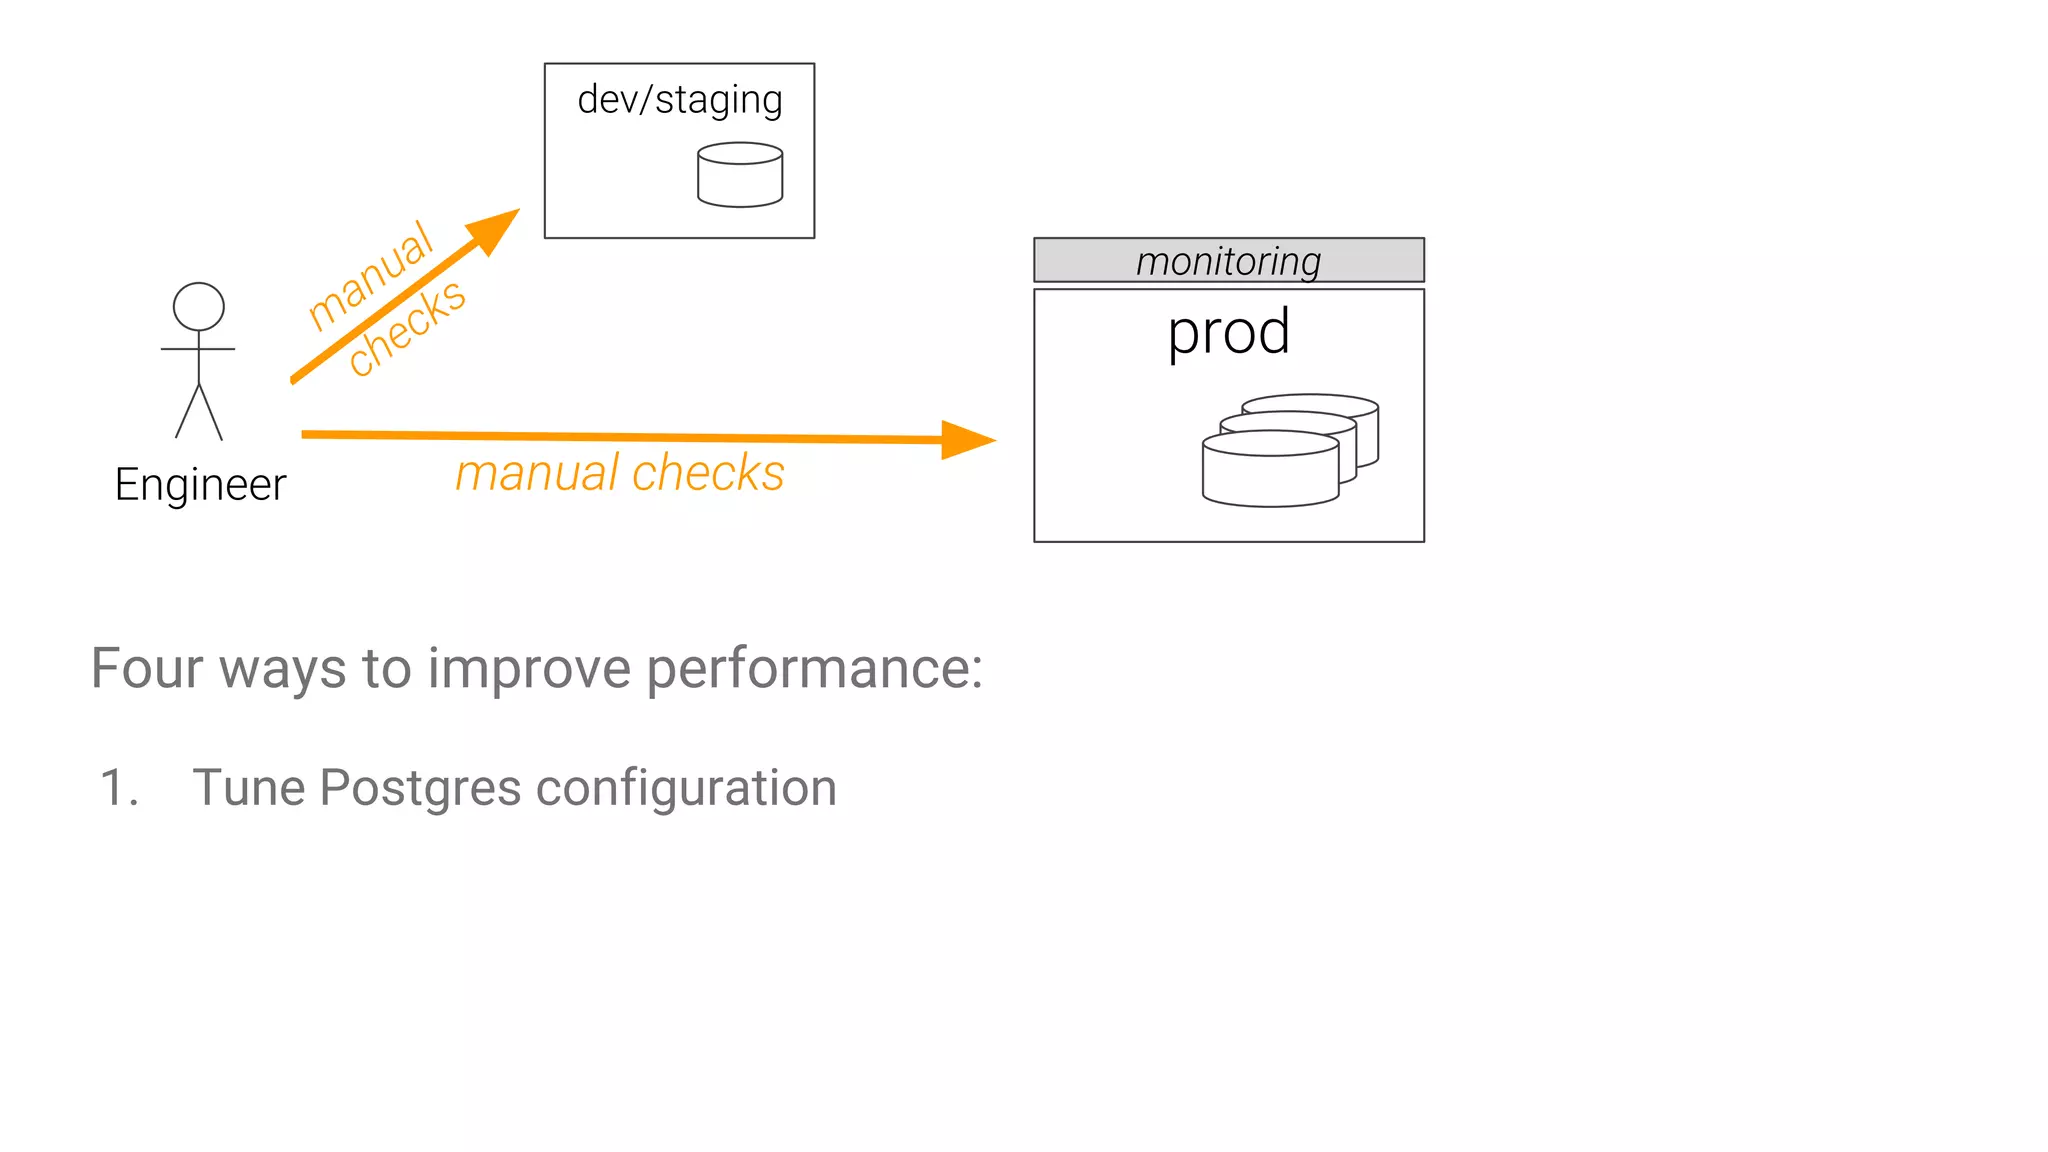
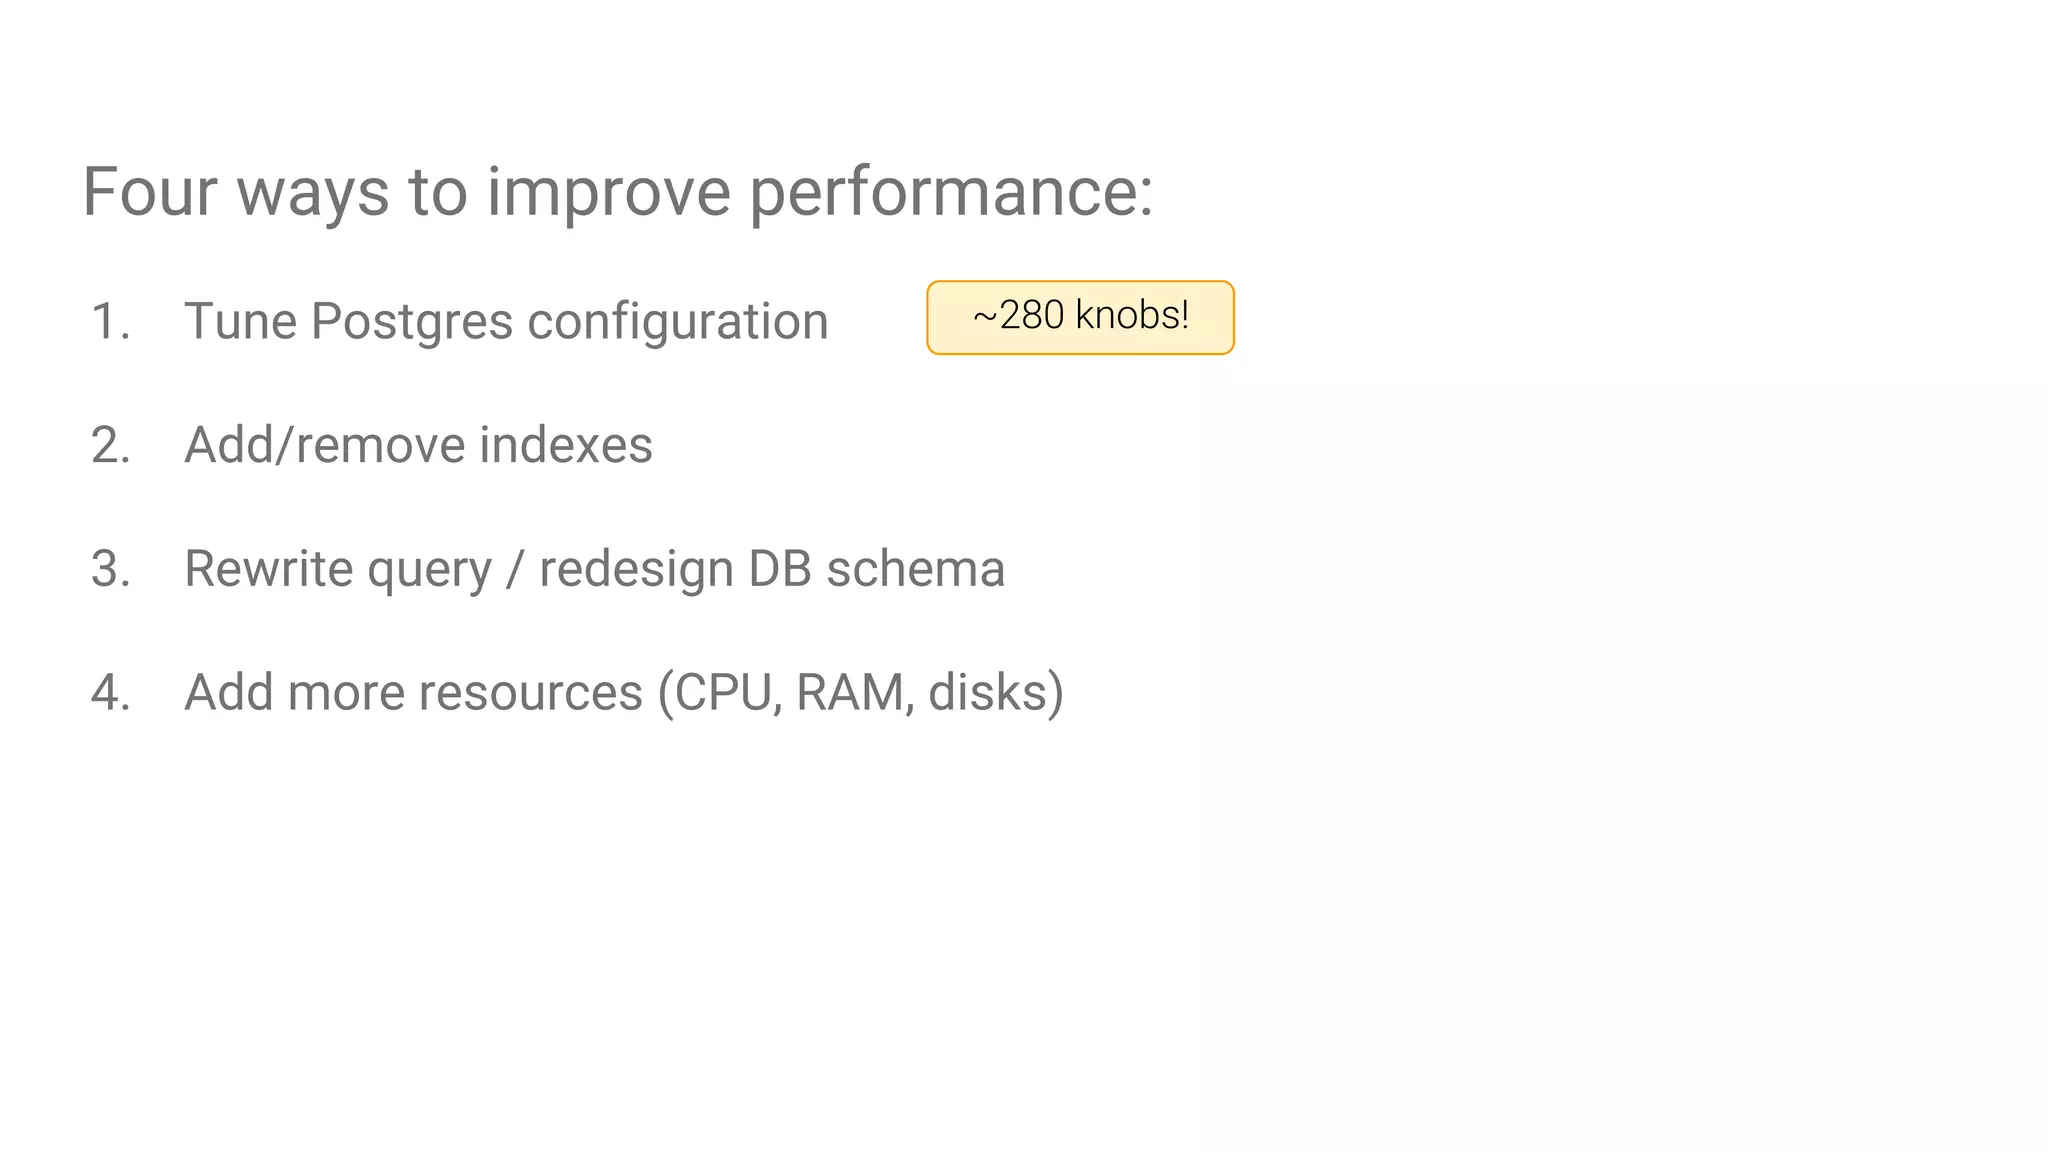
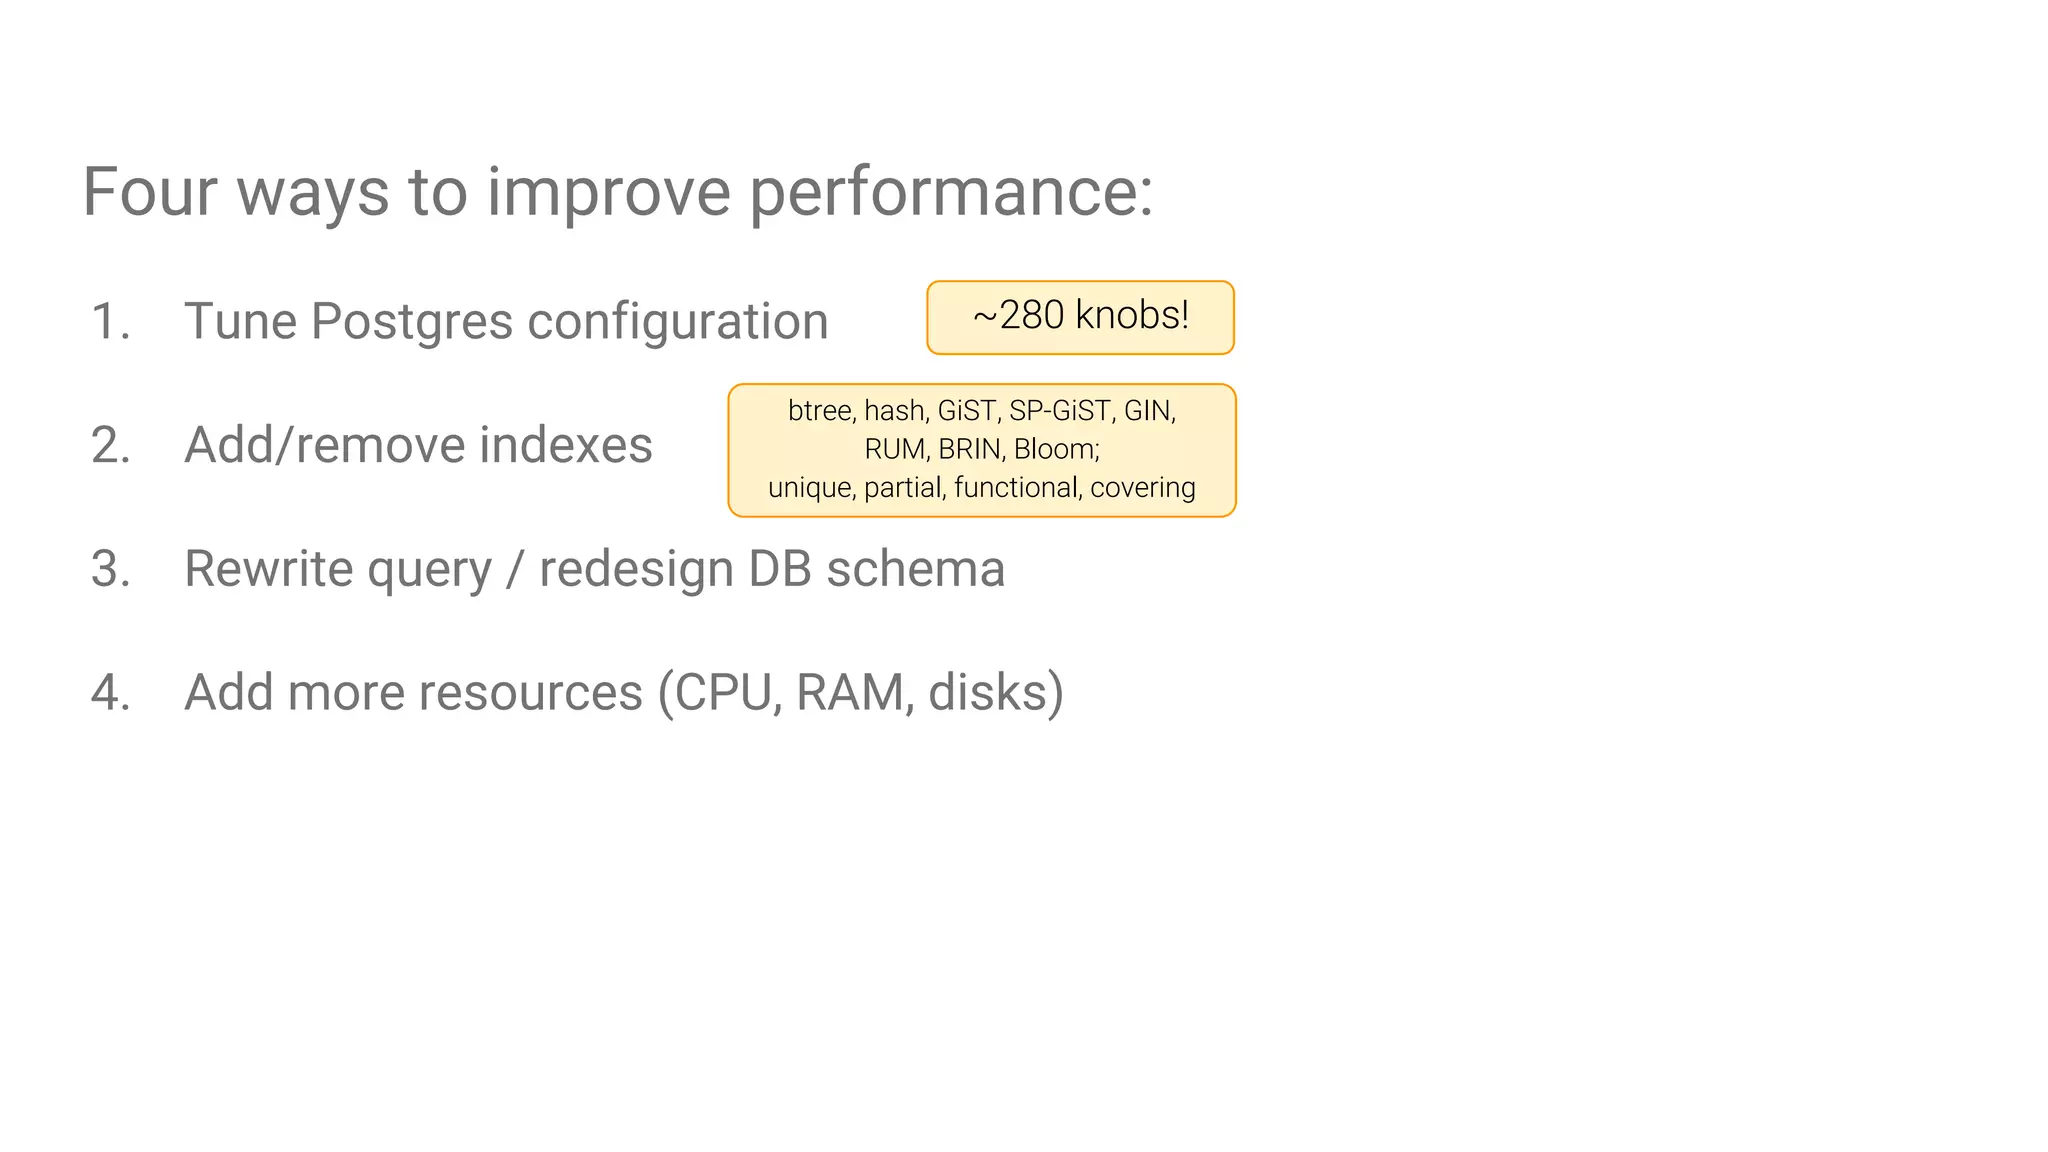
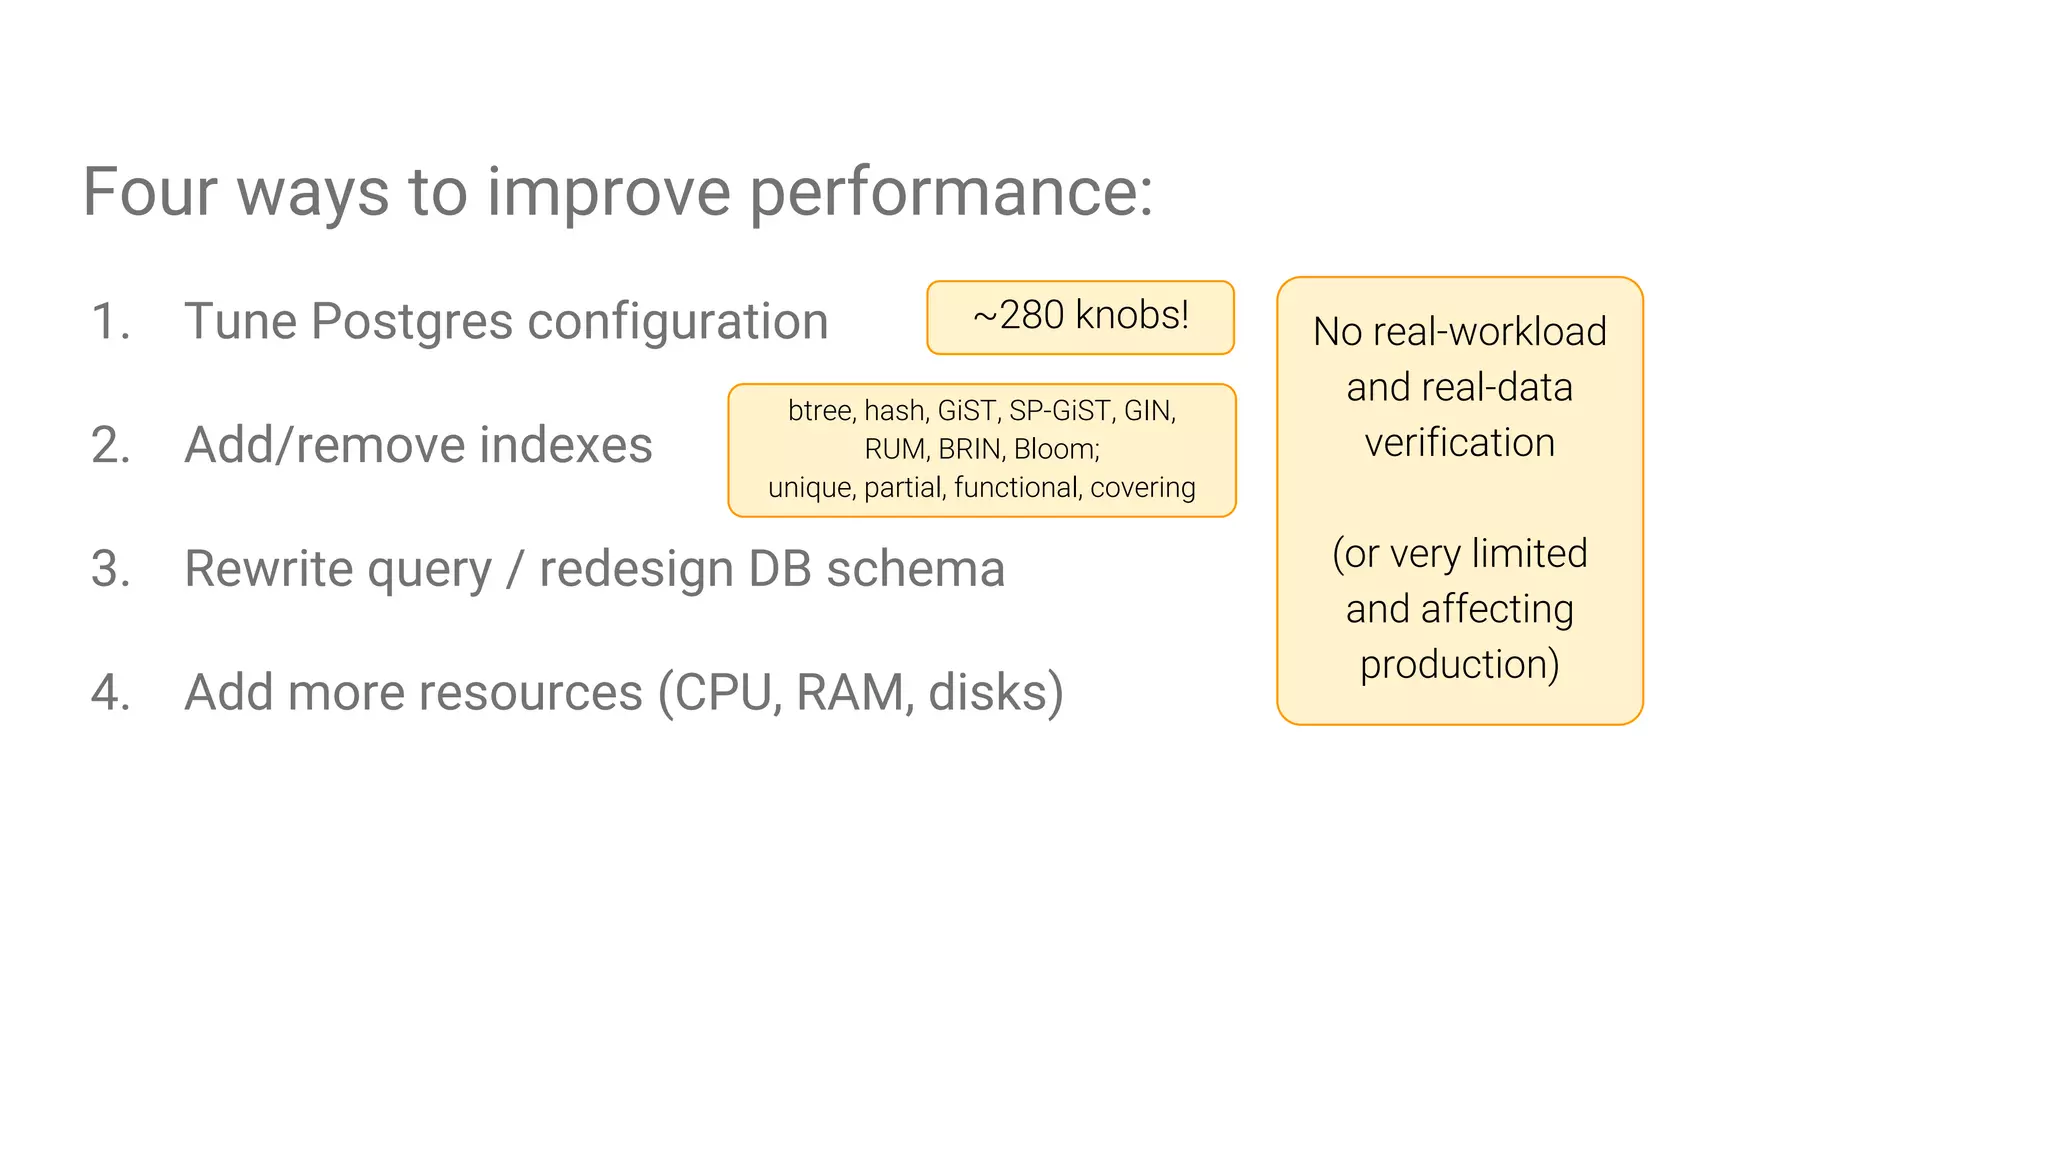
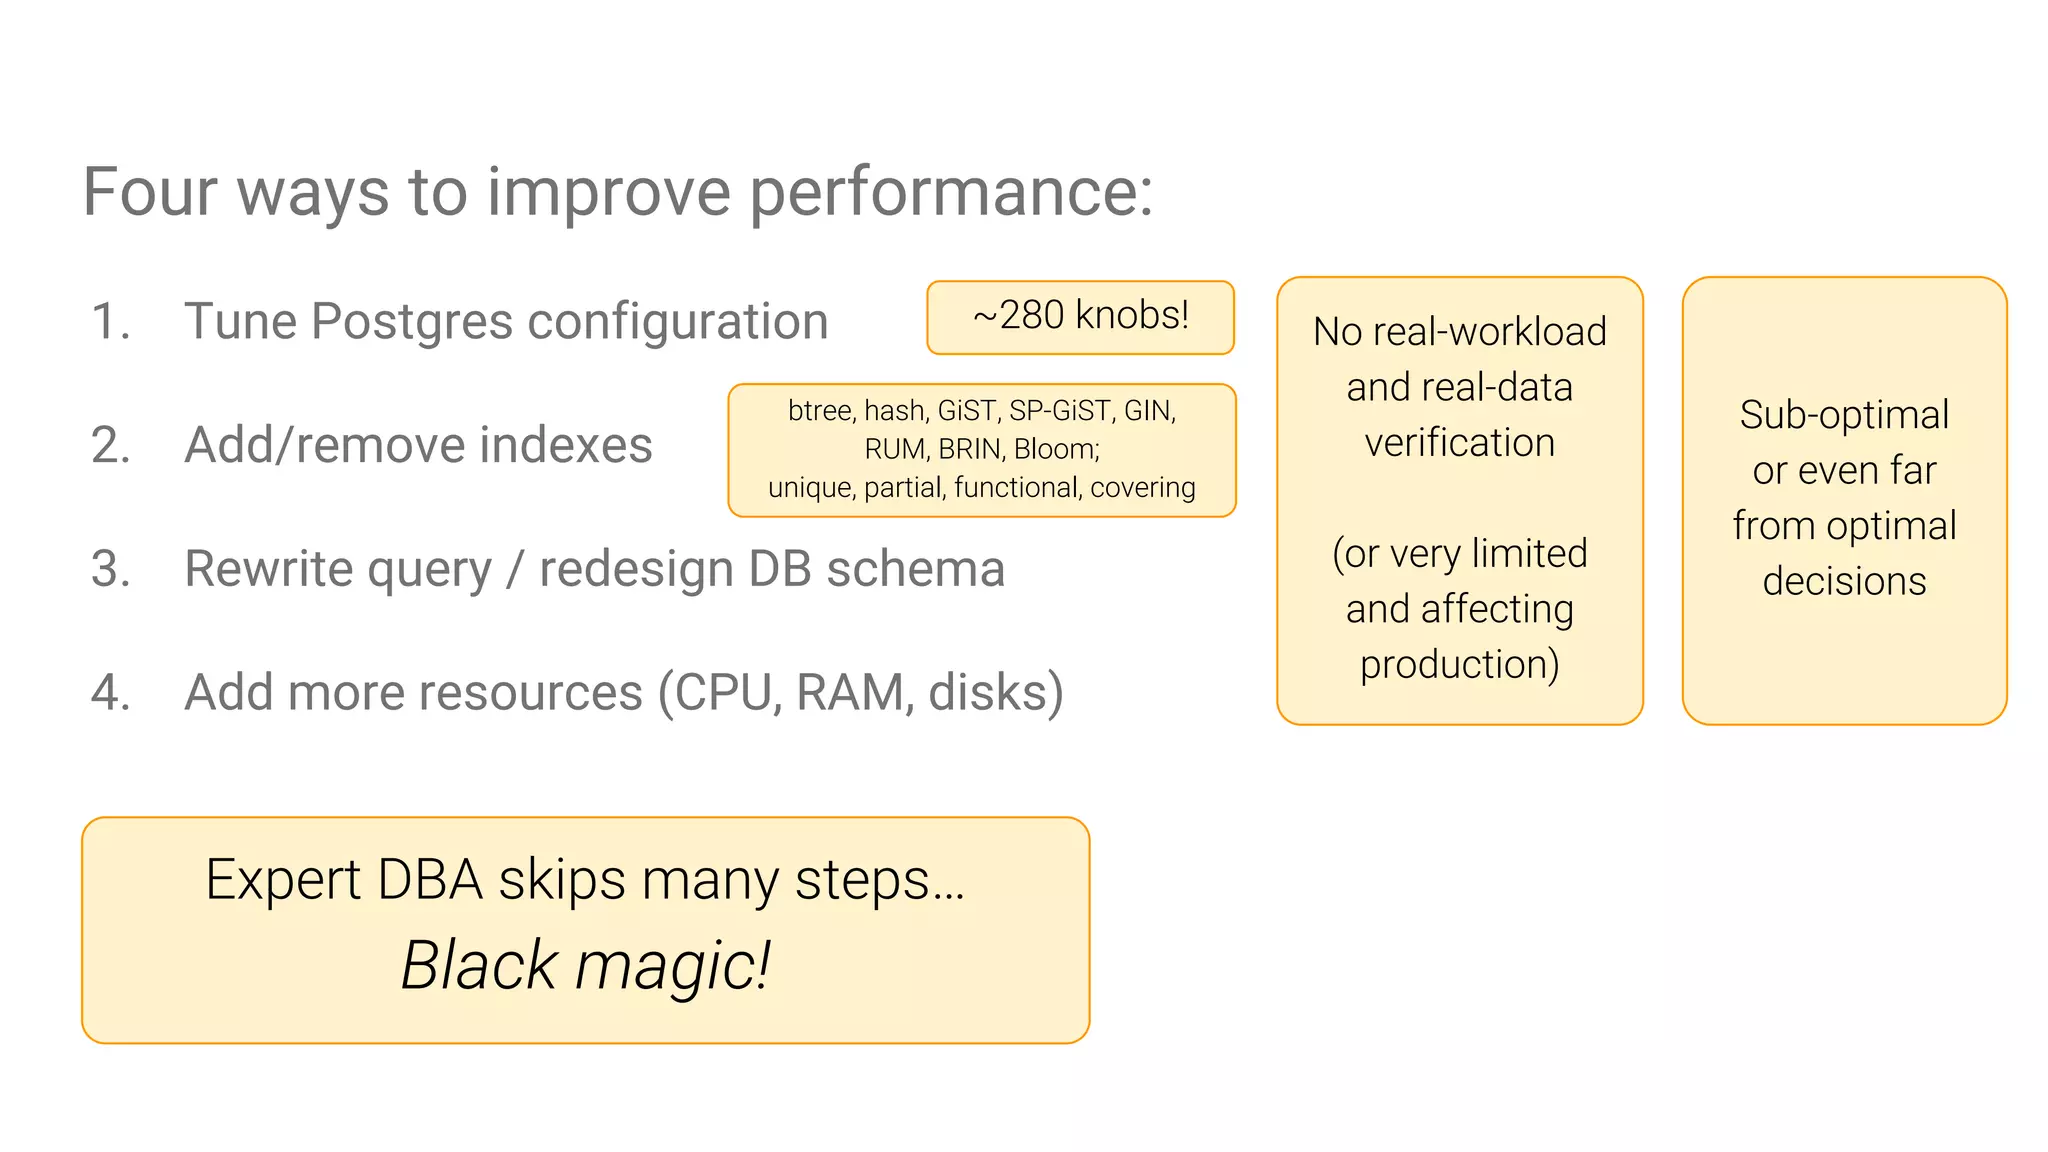
Methods to enhance SQL performance, including tuning configurations, index management, and resource allocation, with emphasis on best practices.
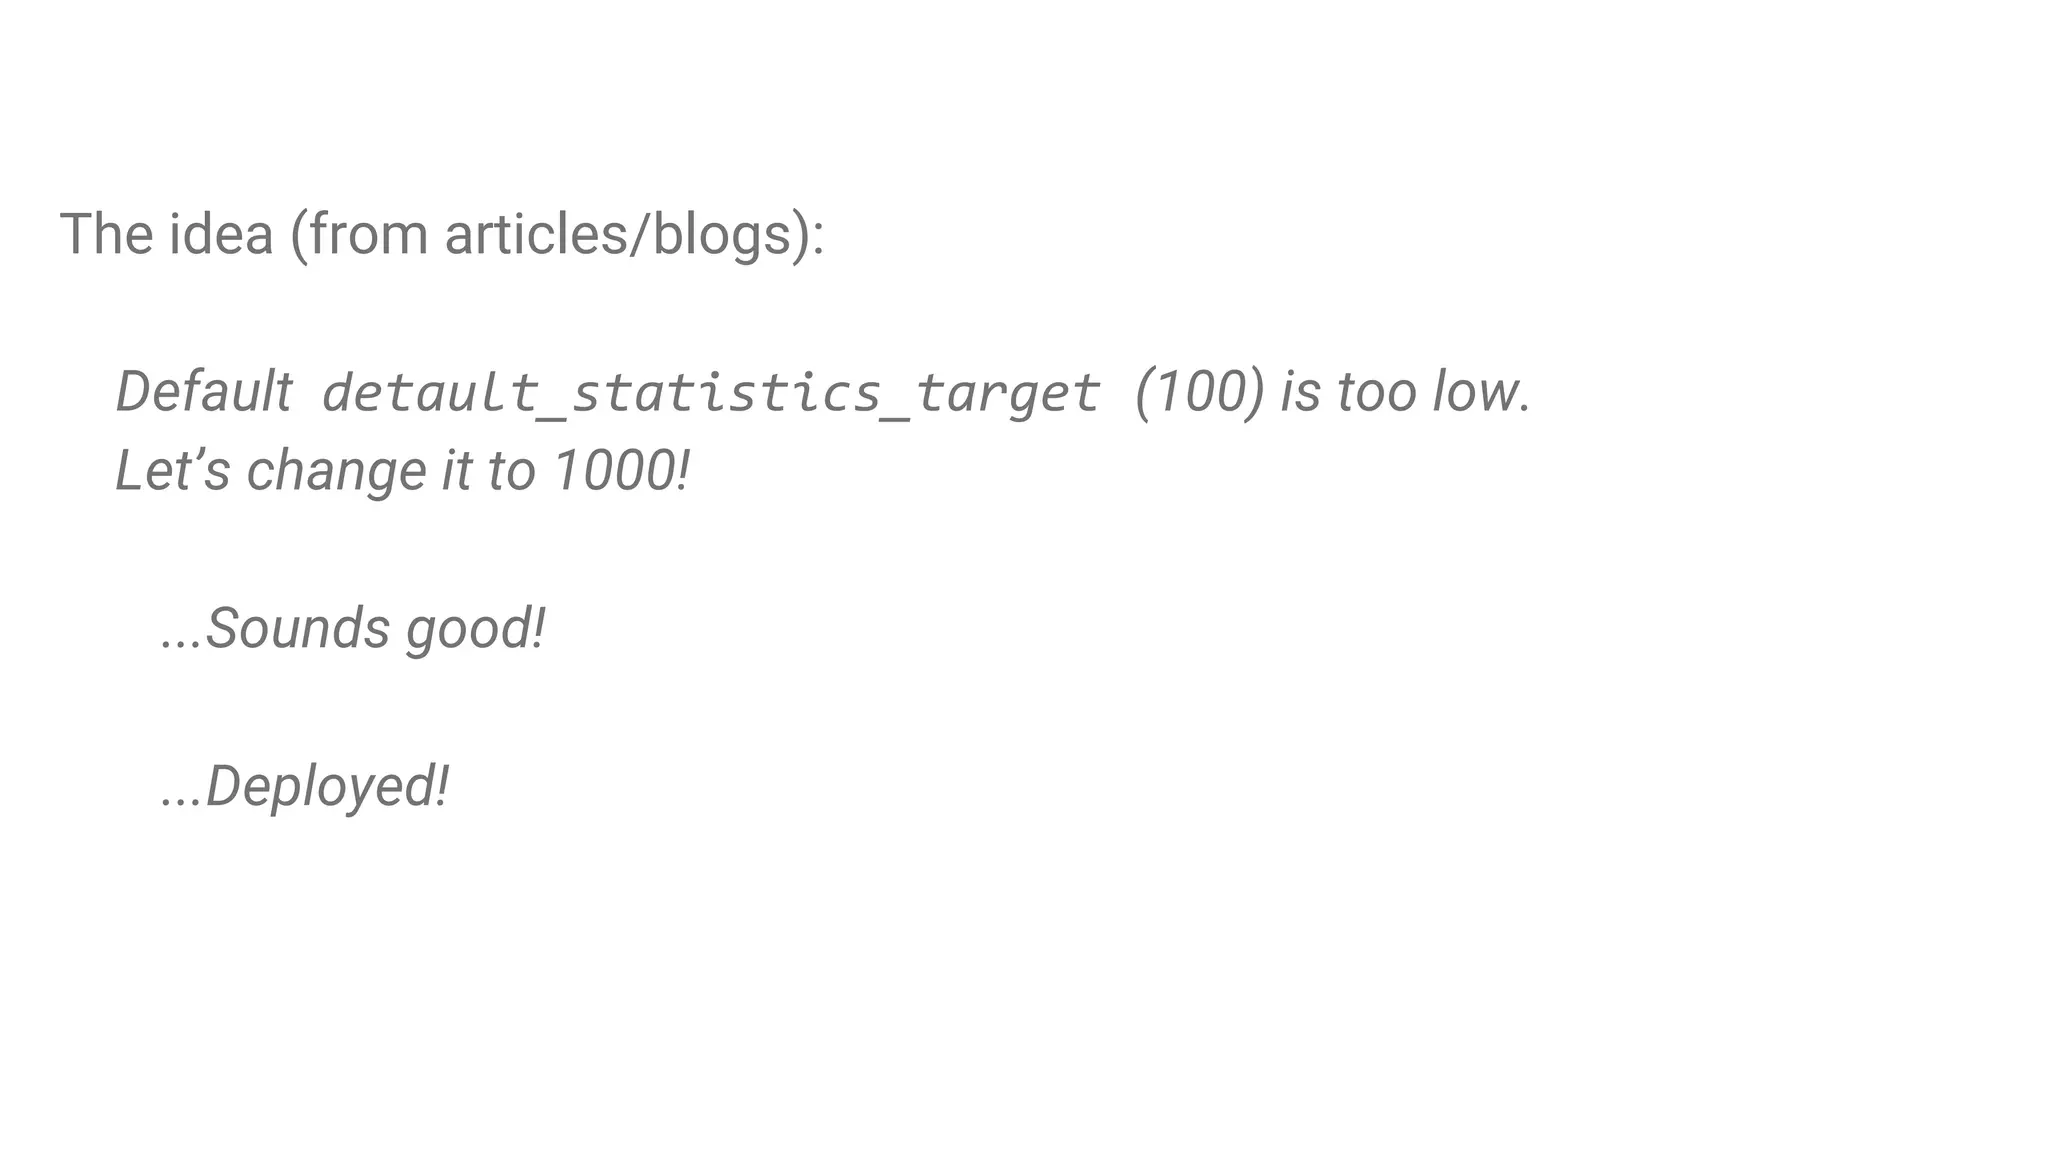
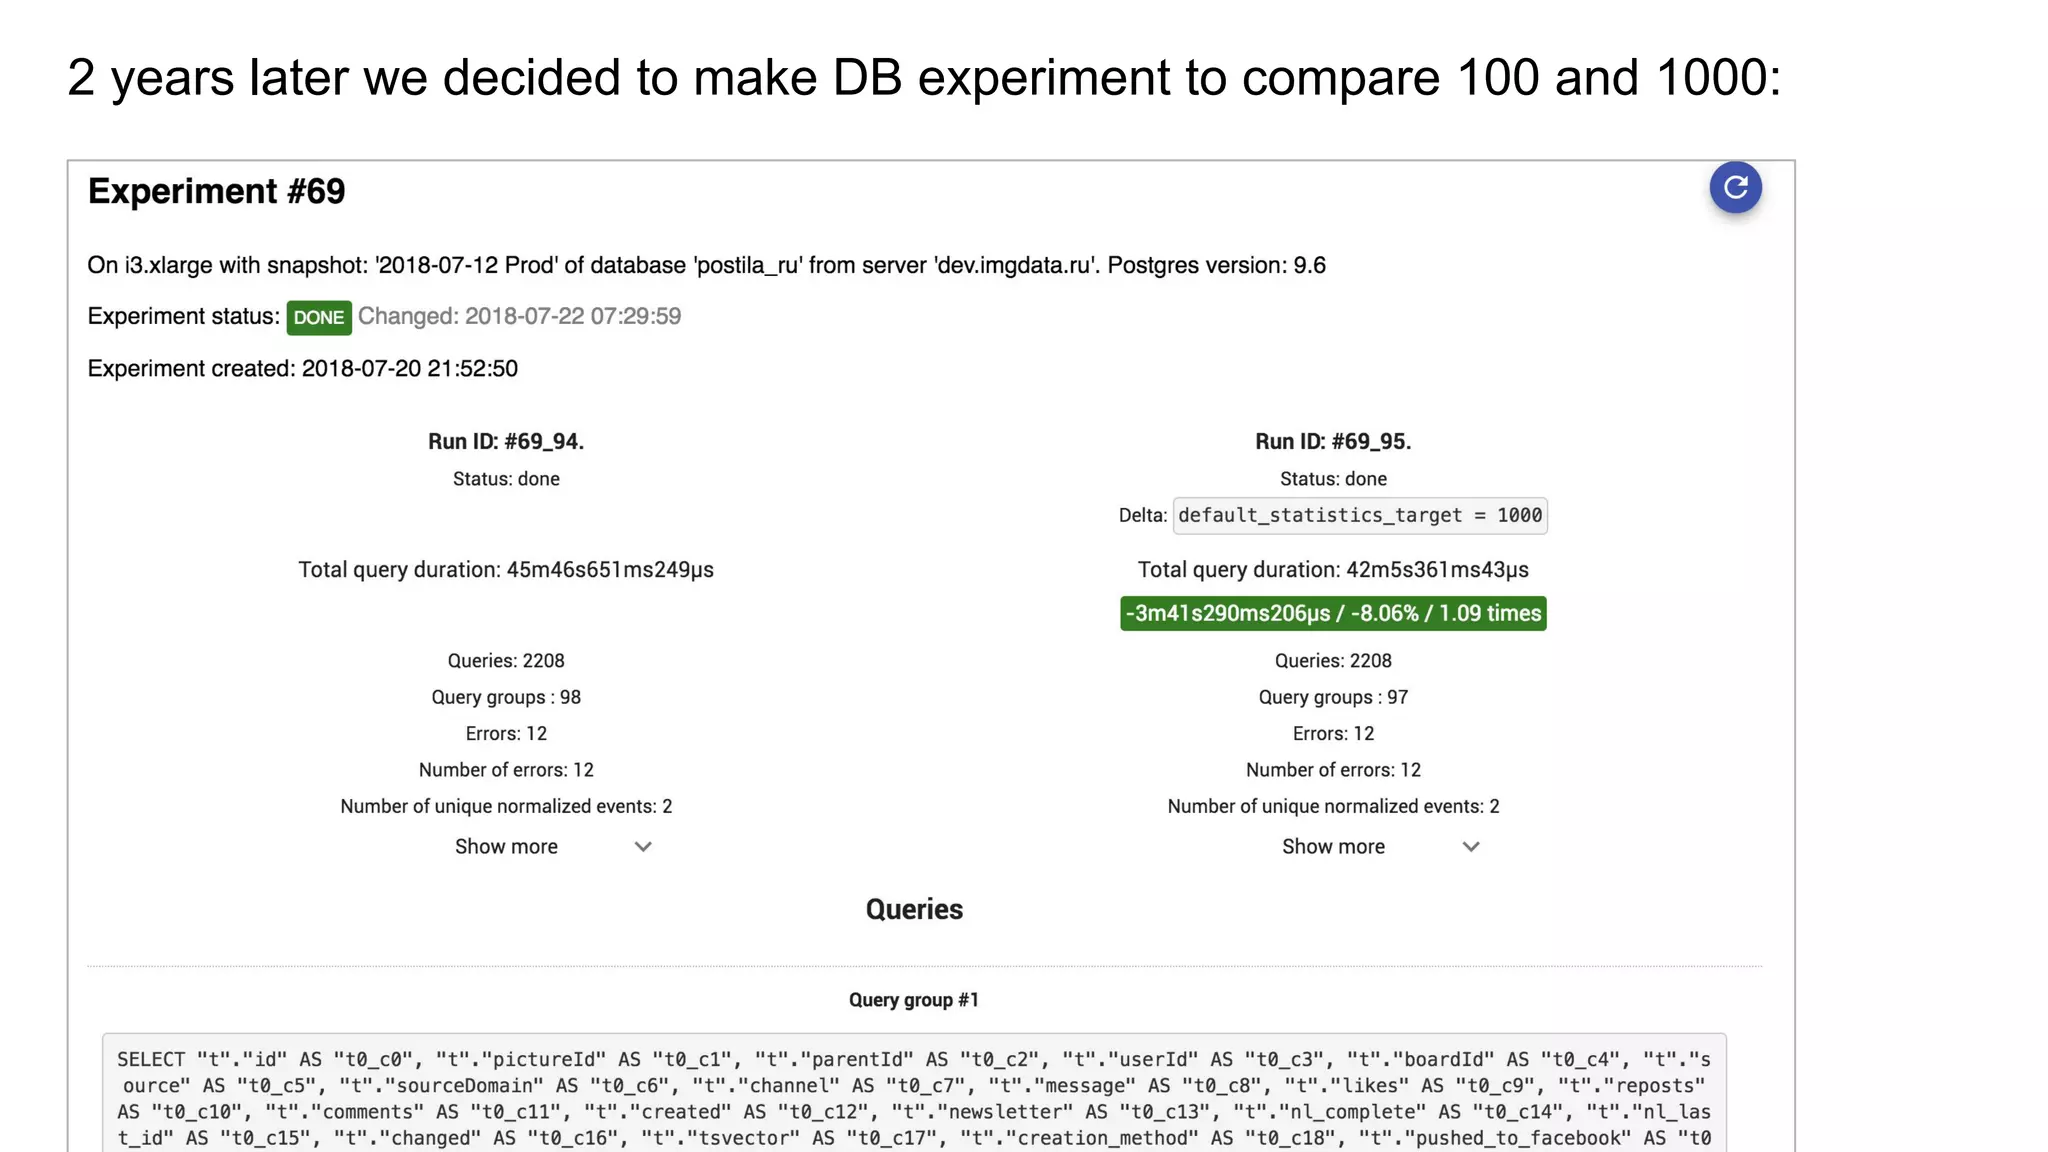
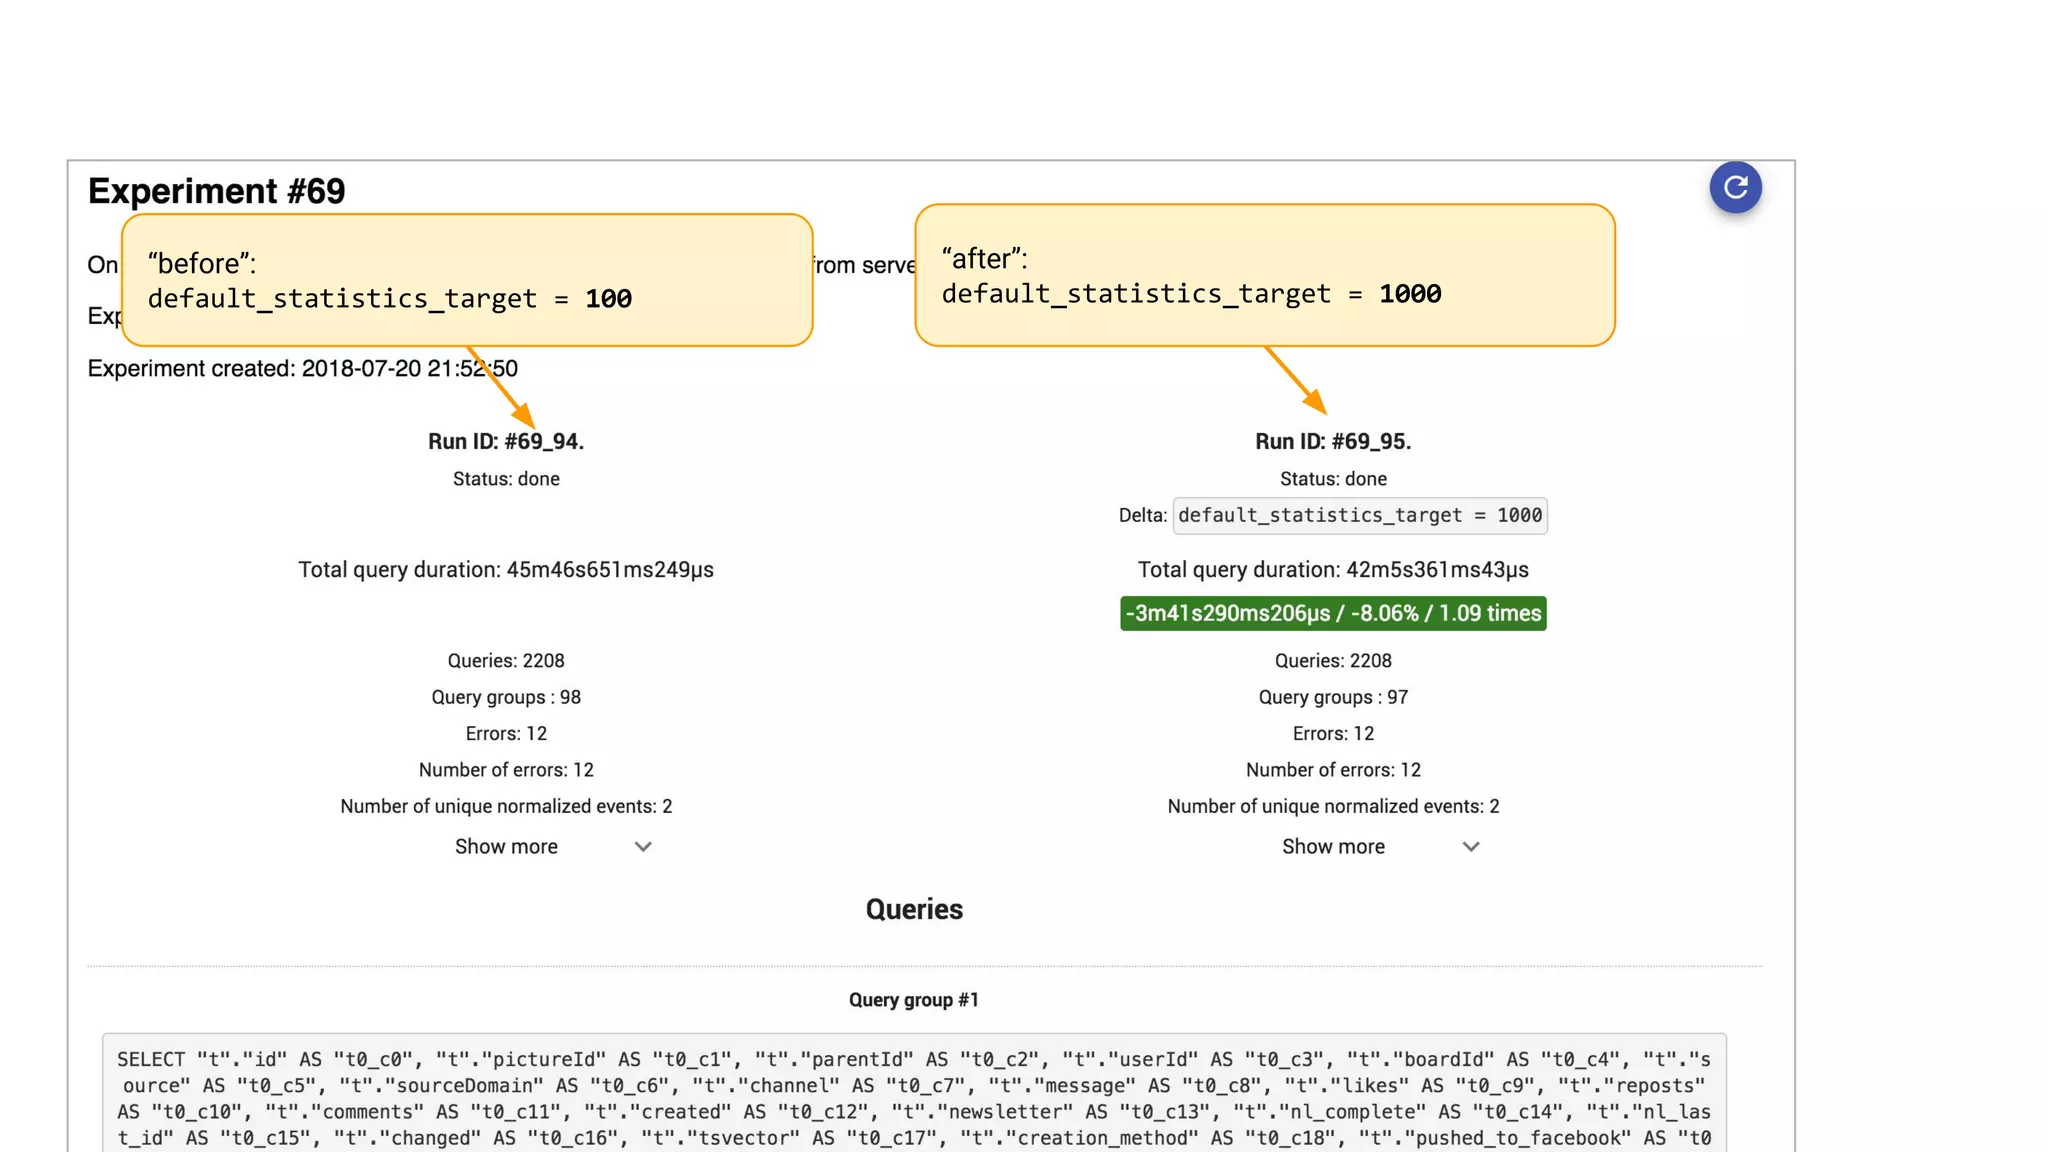
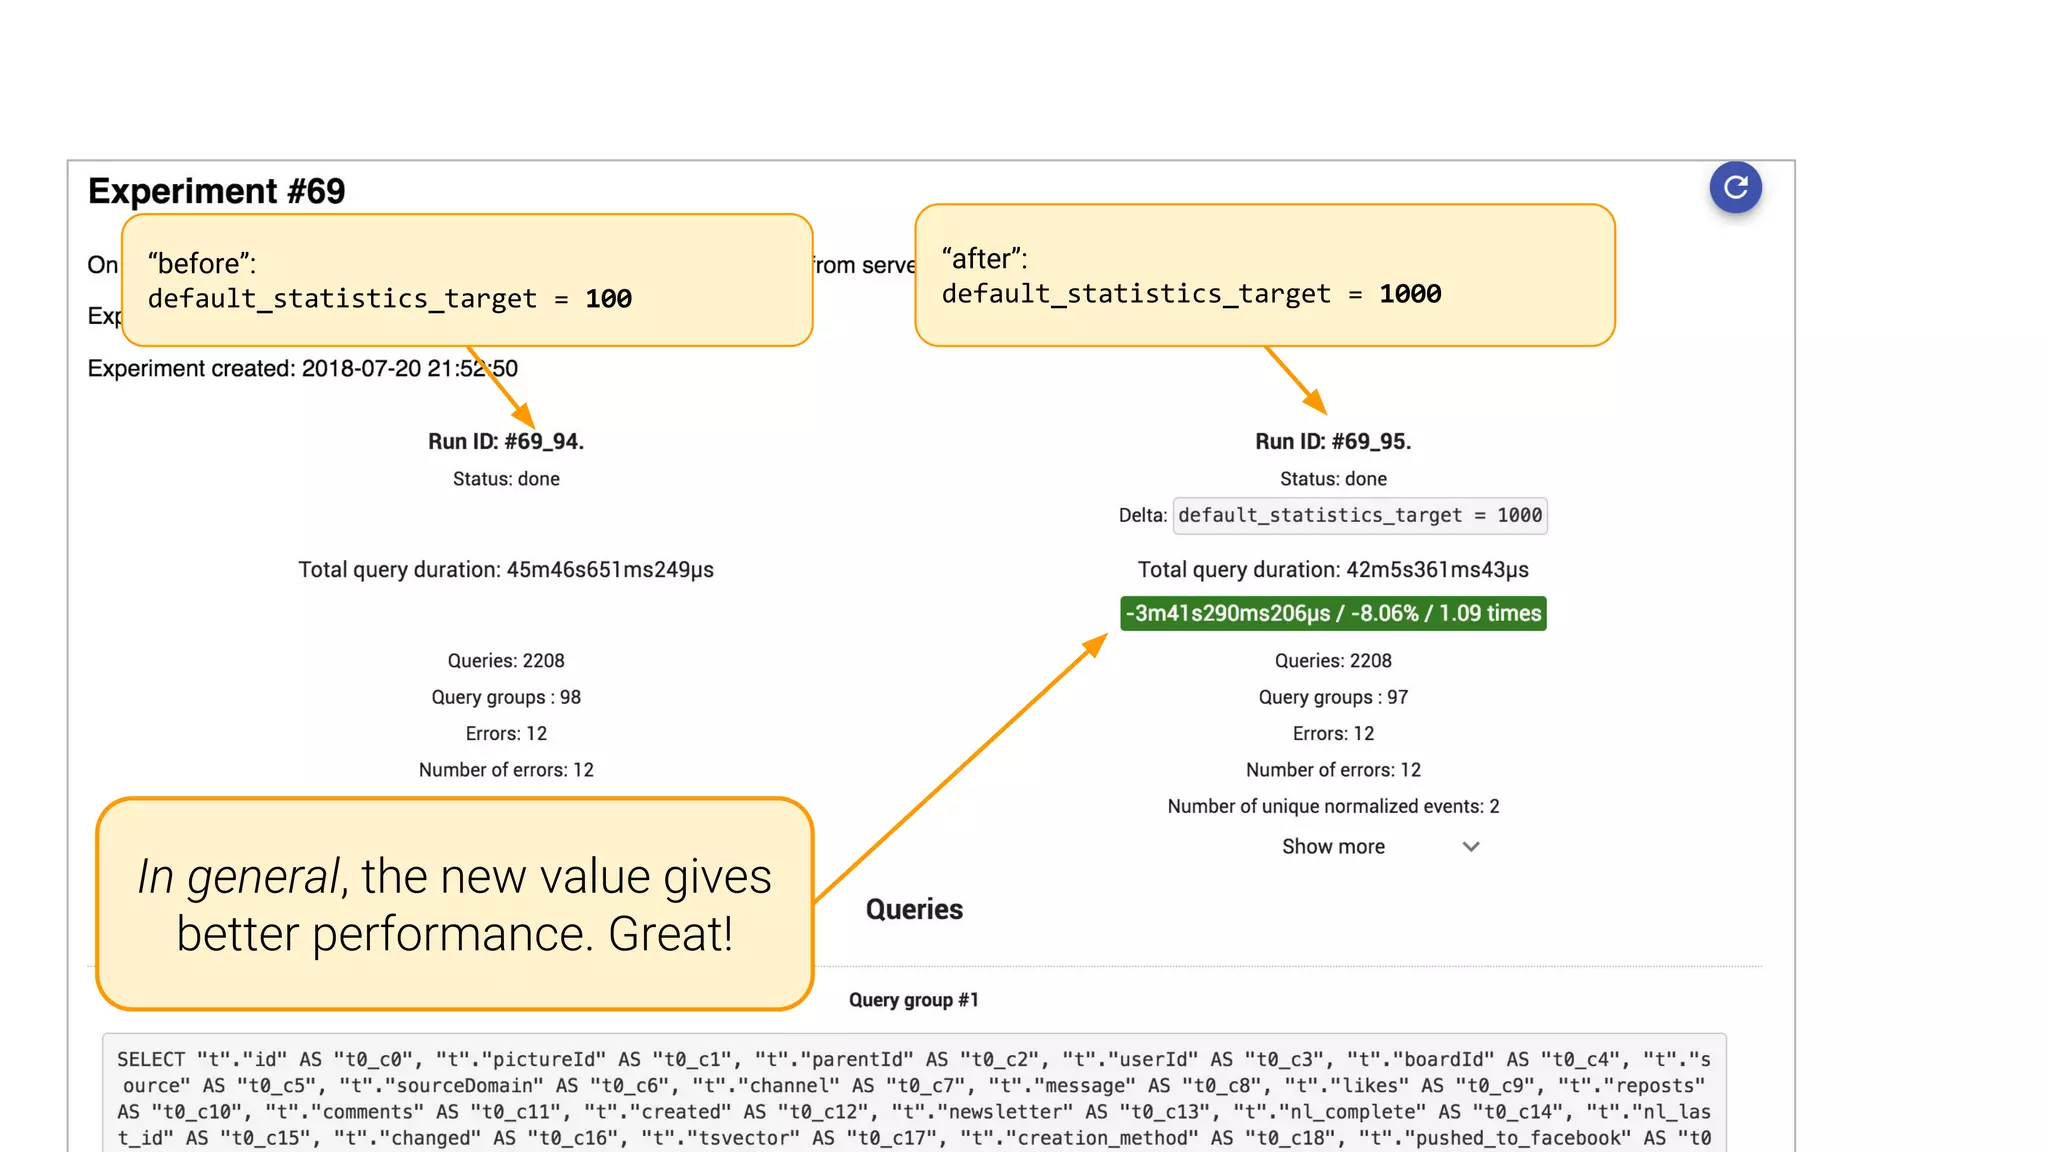
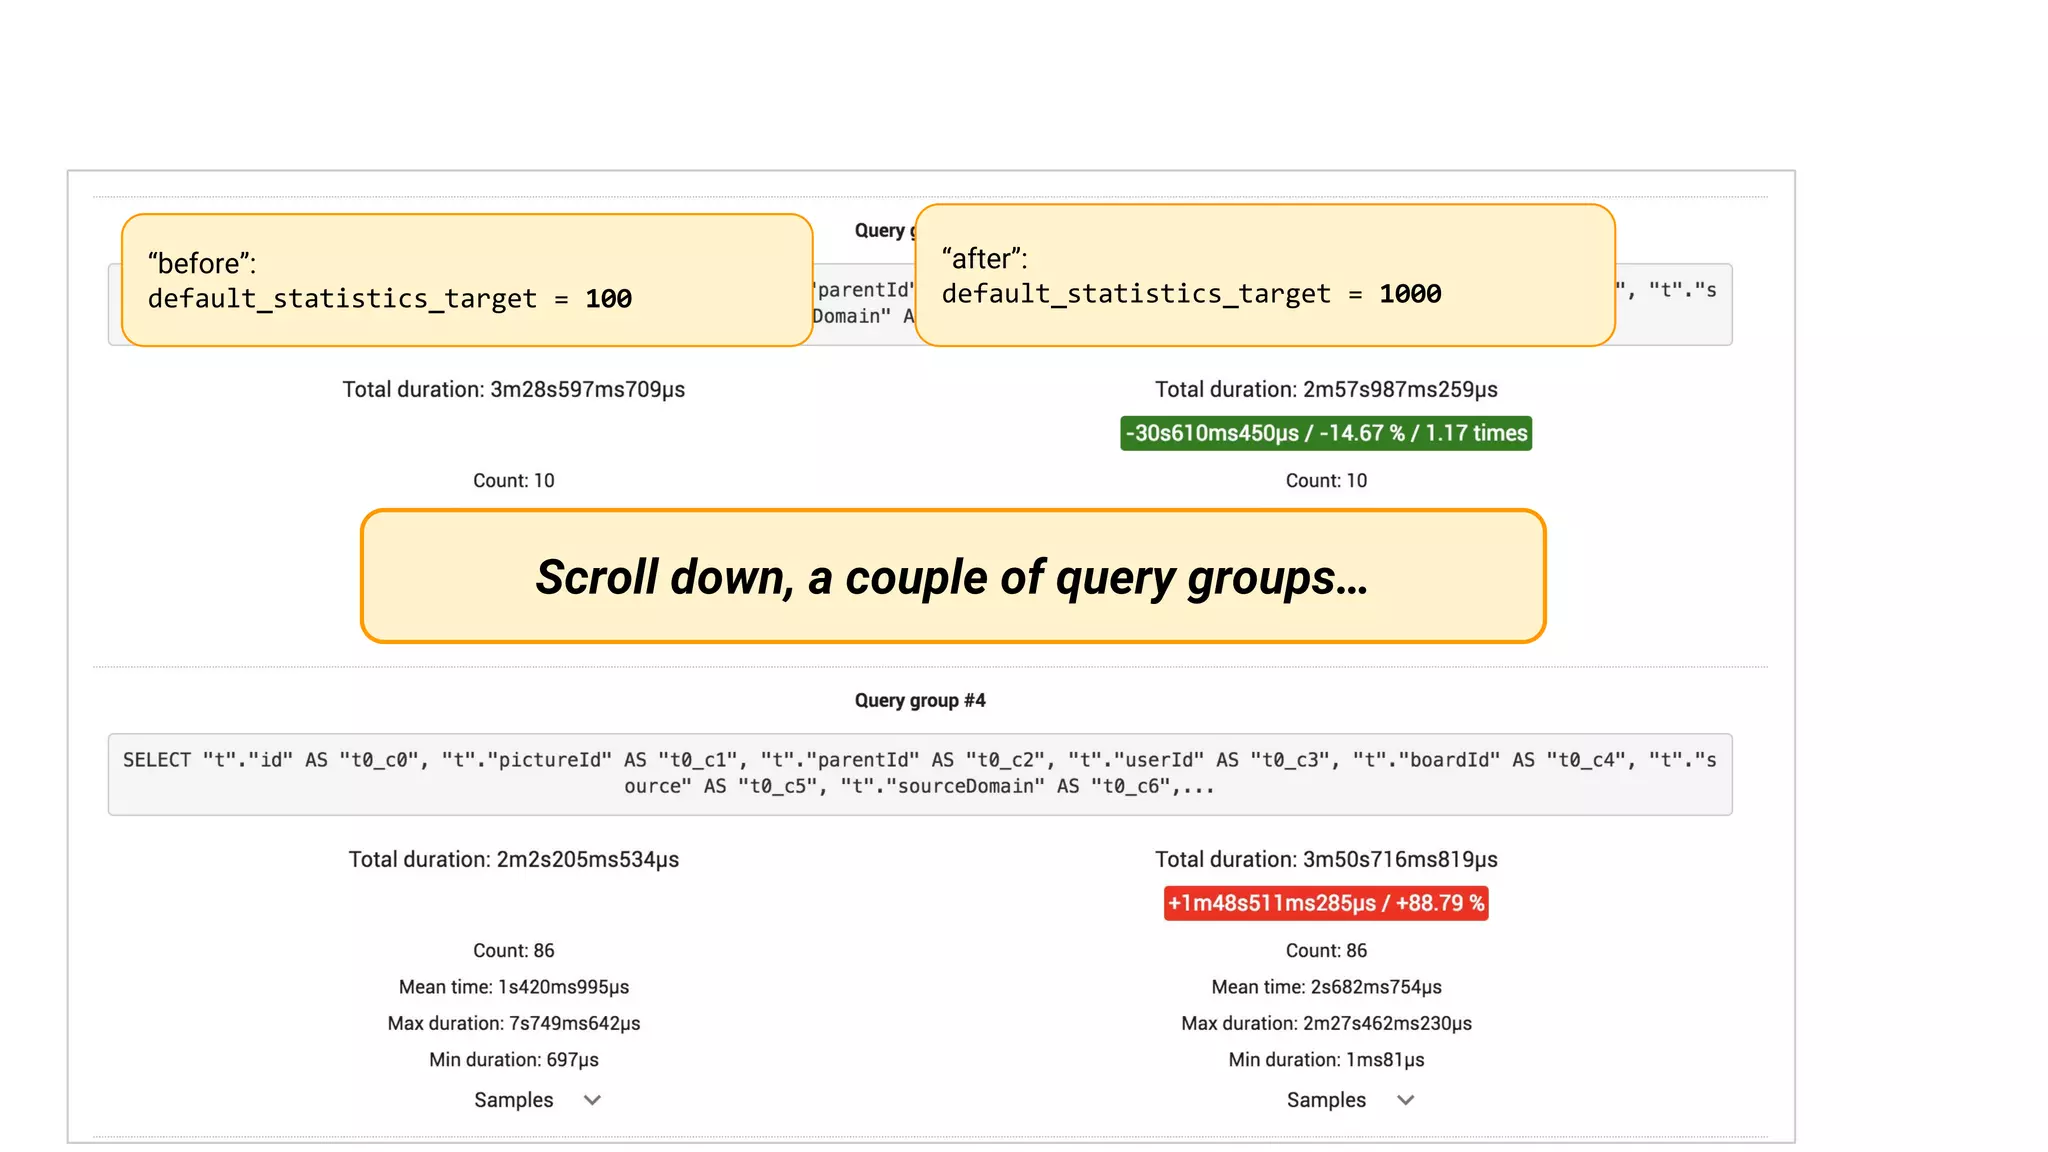
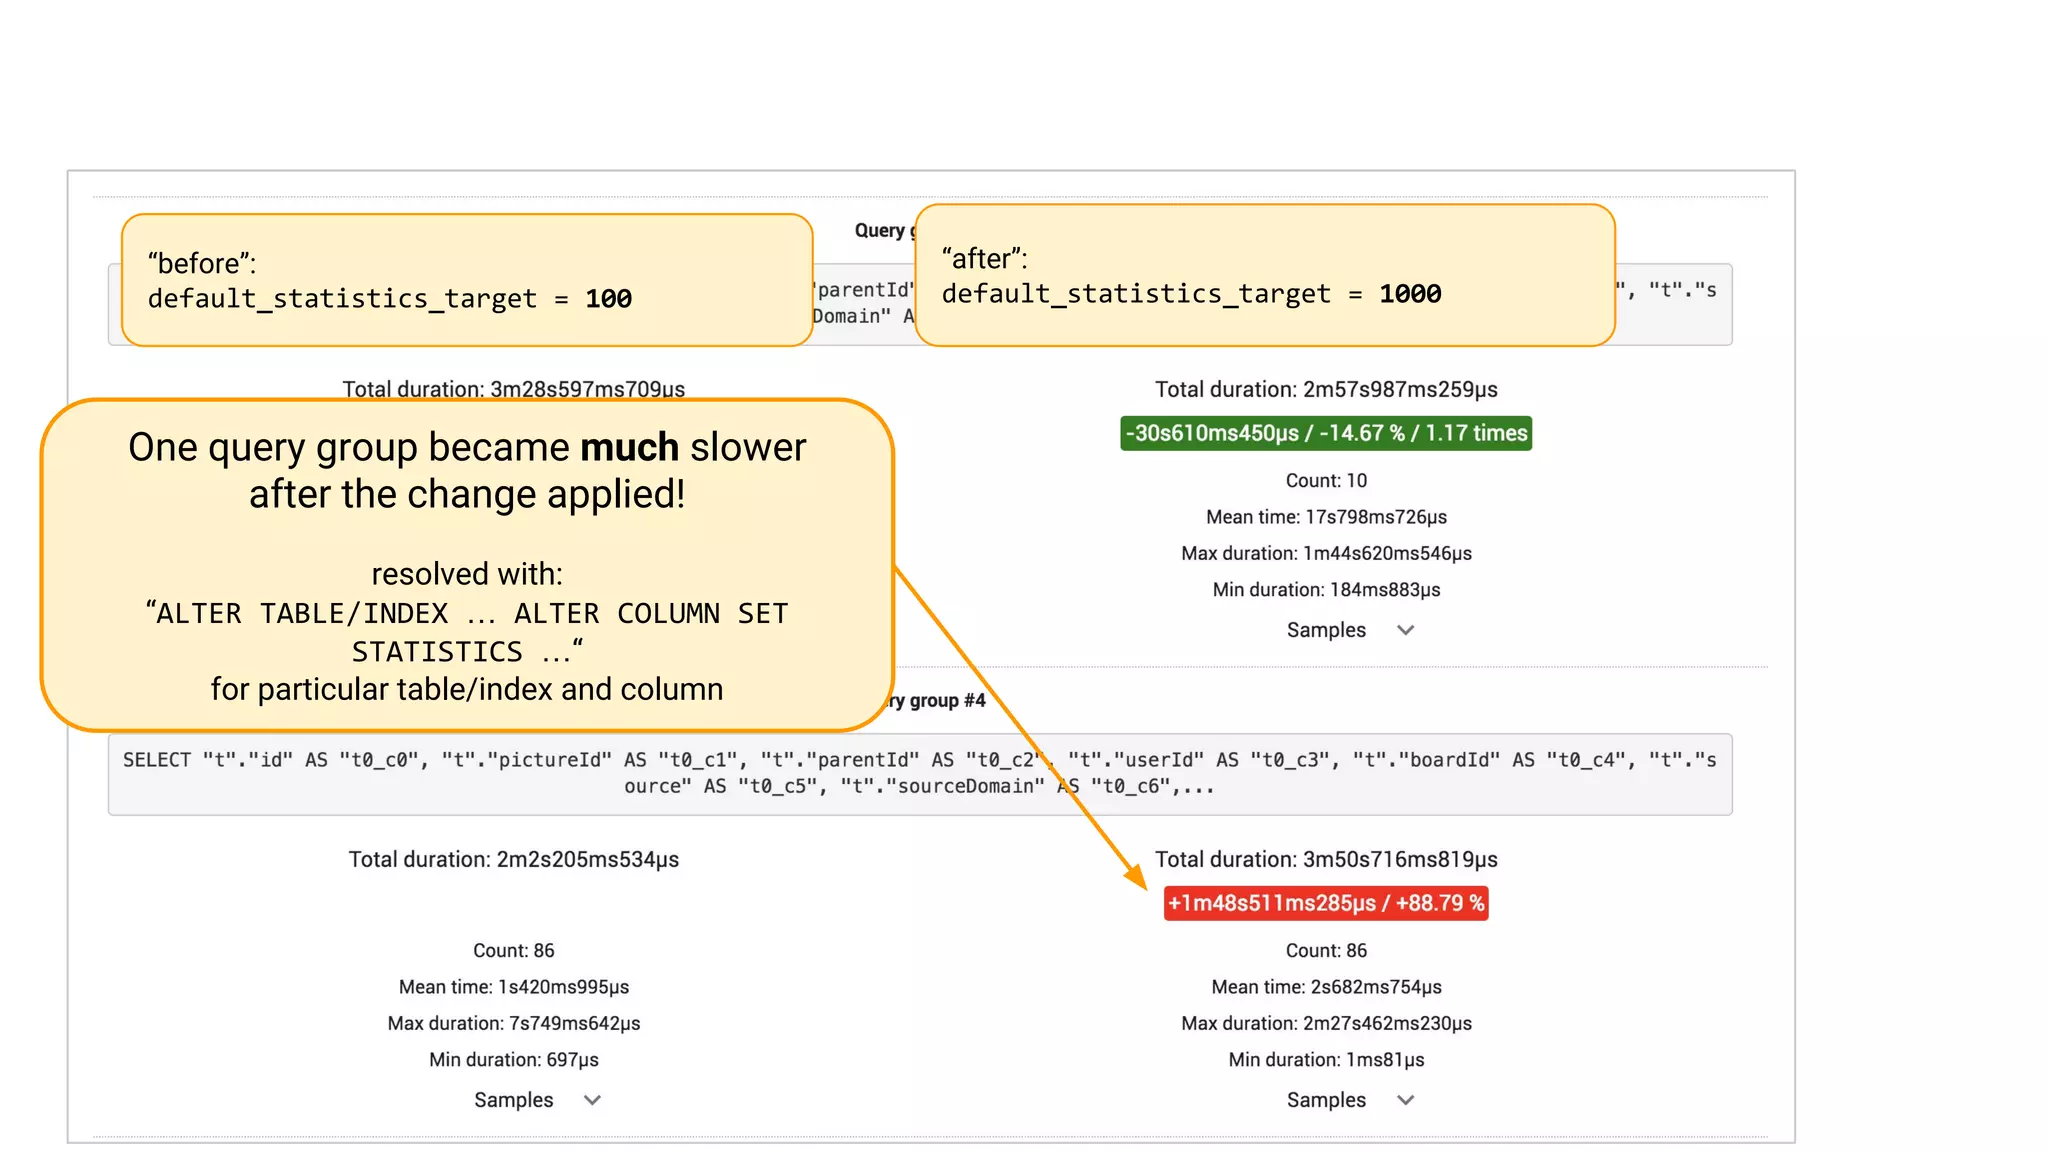
A case study on adjusting default_statistics_target with results demonstrating varying impacts on SQL performance.
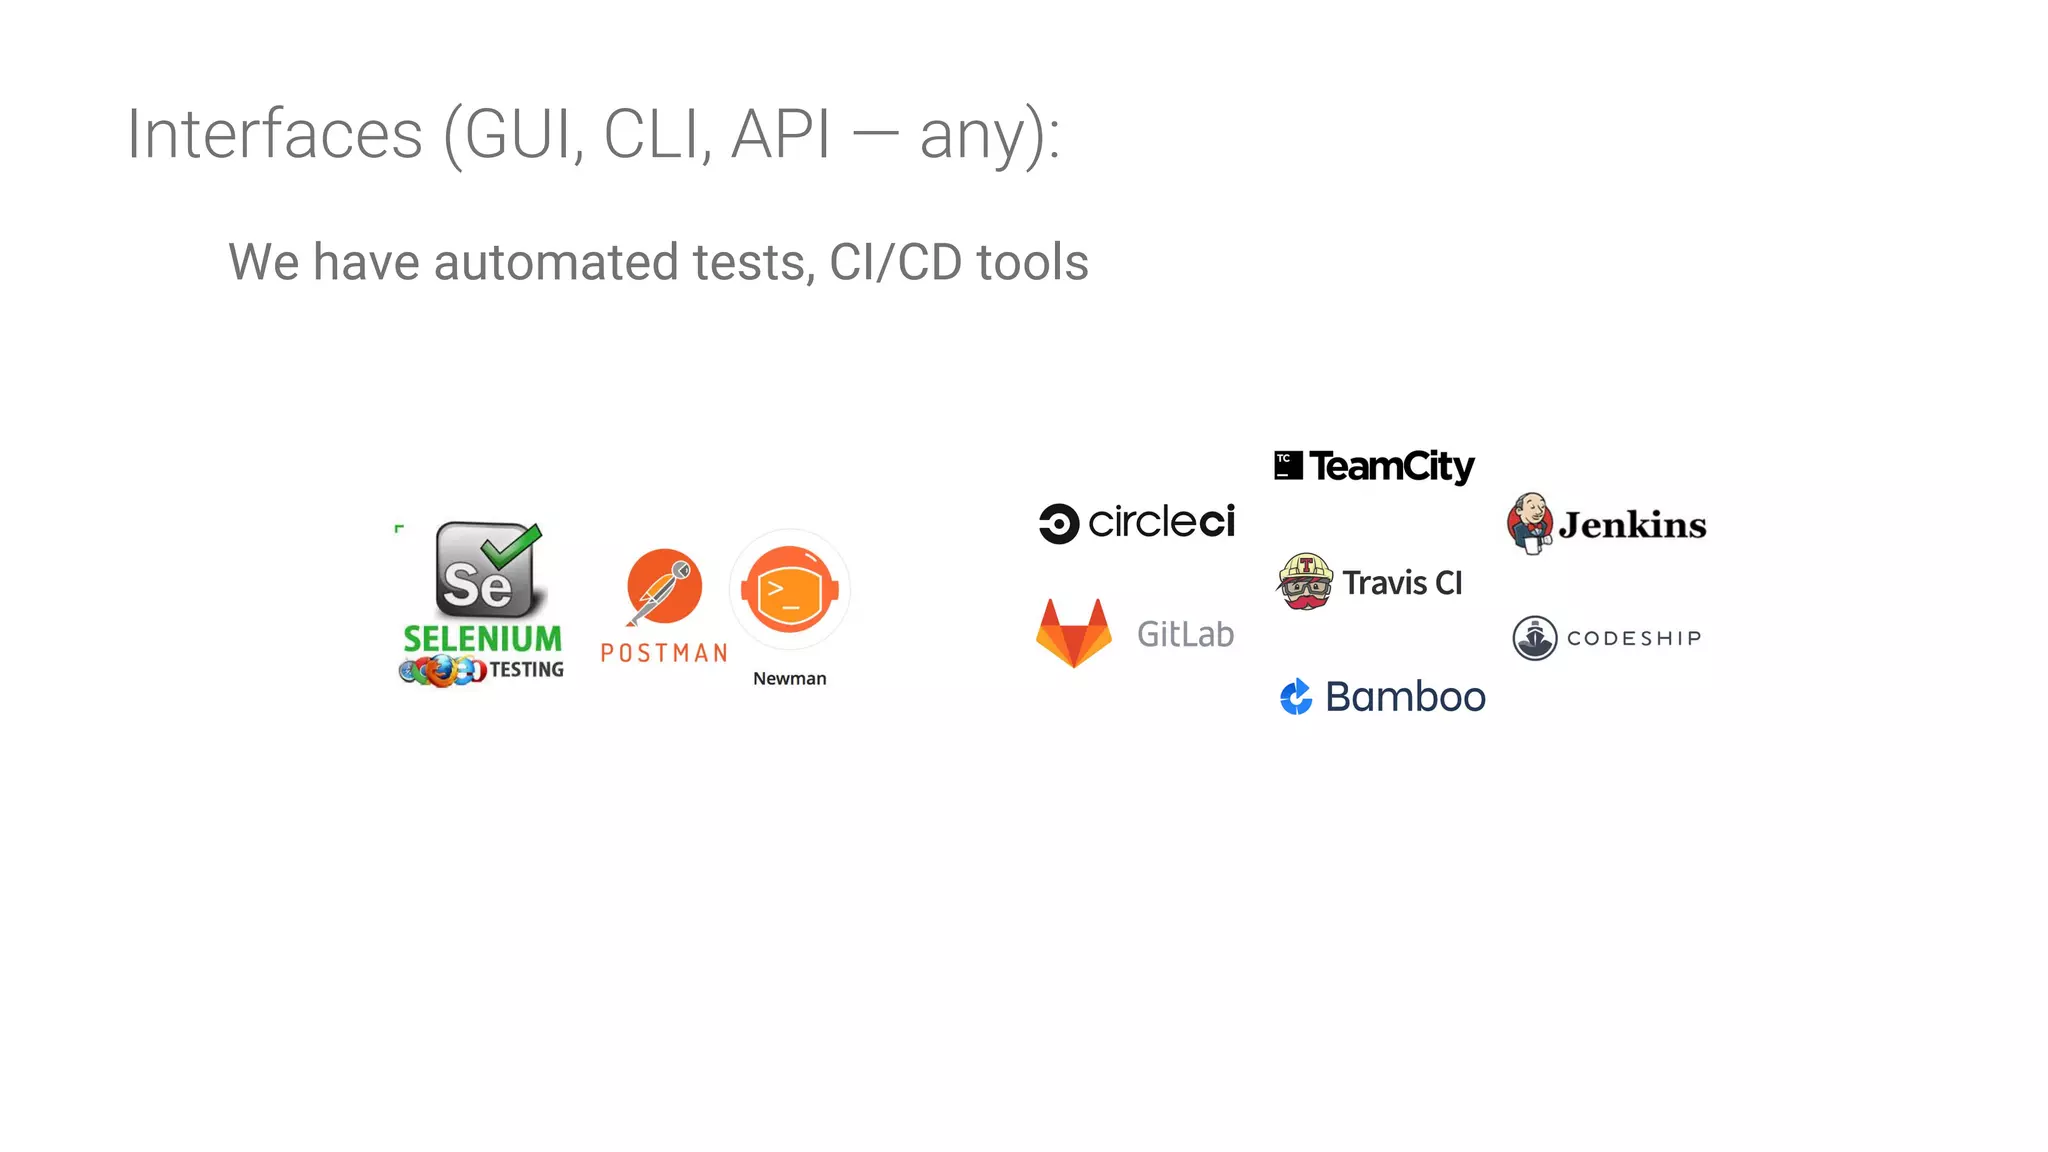
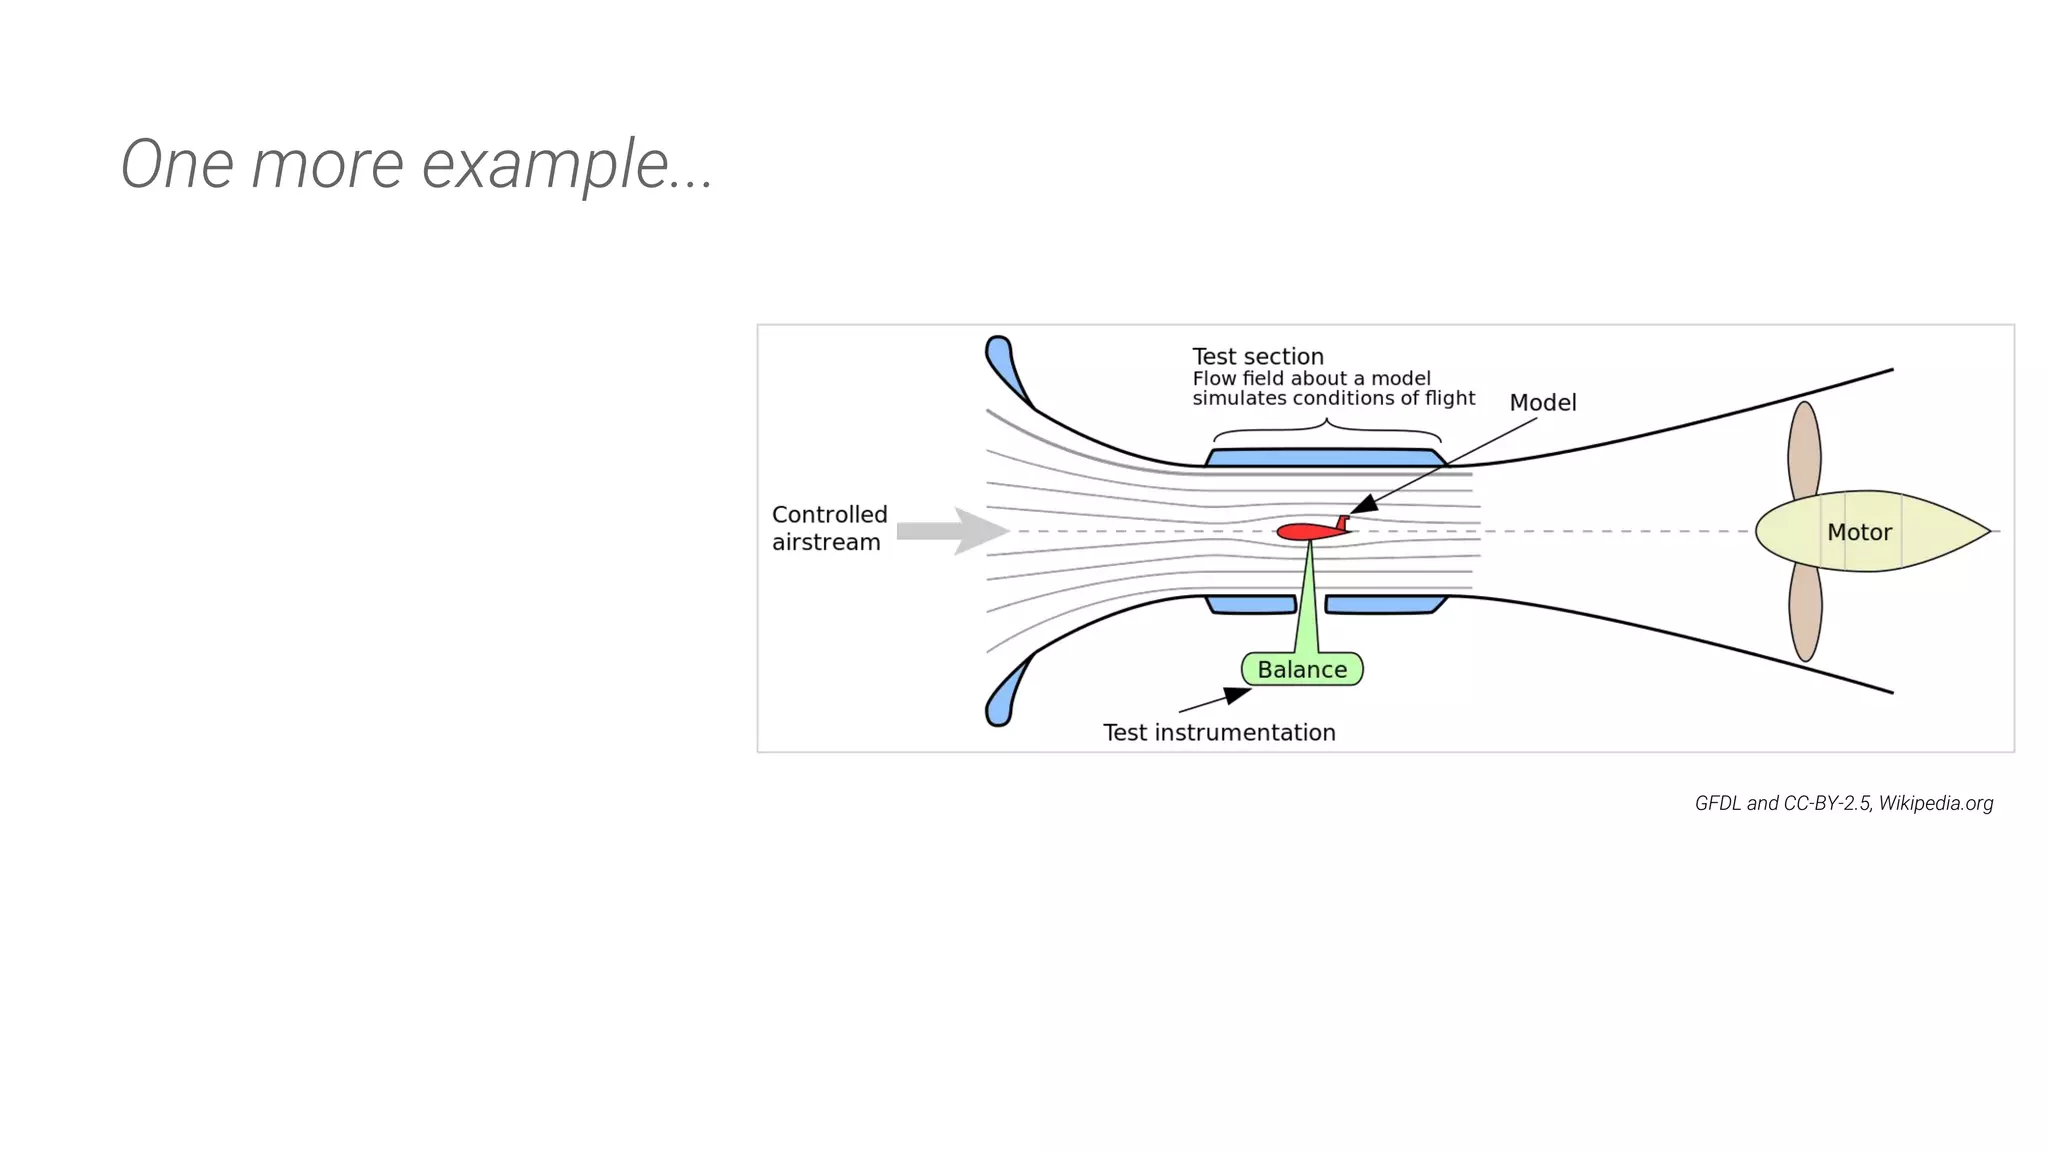
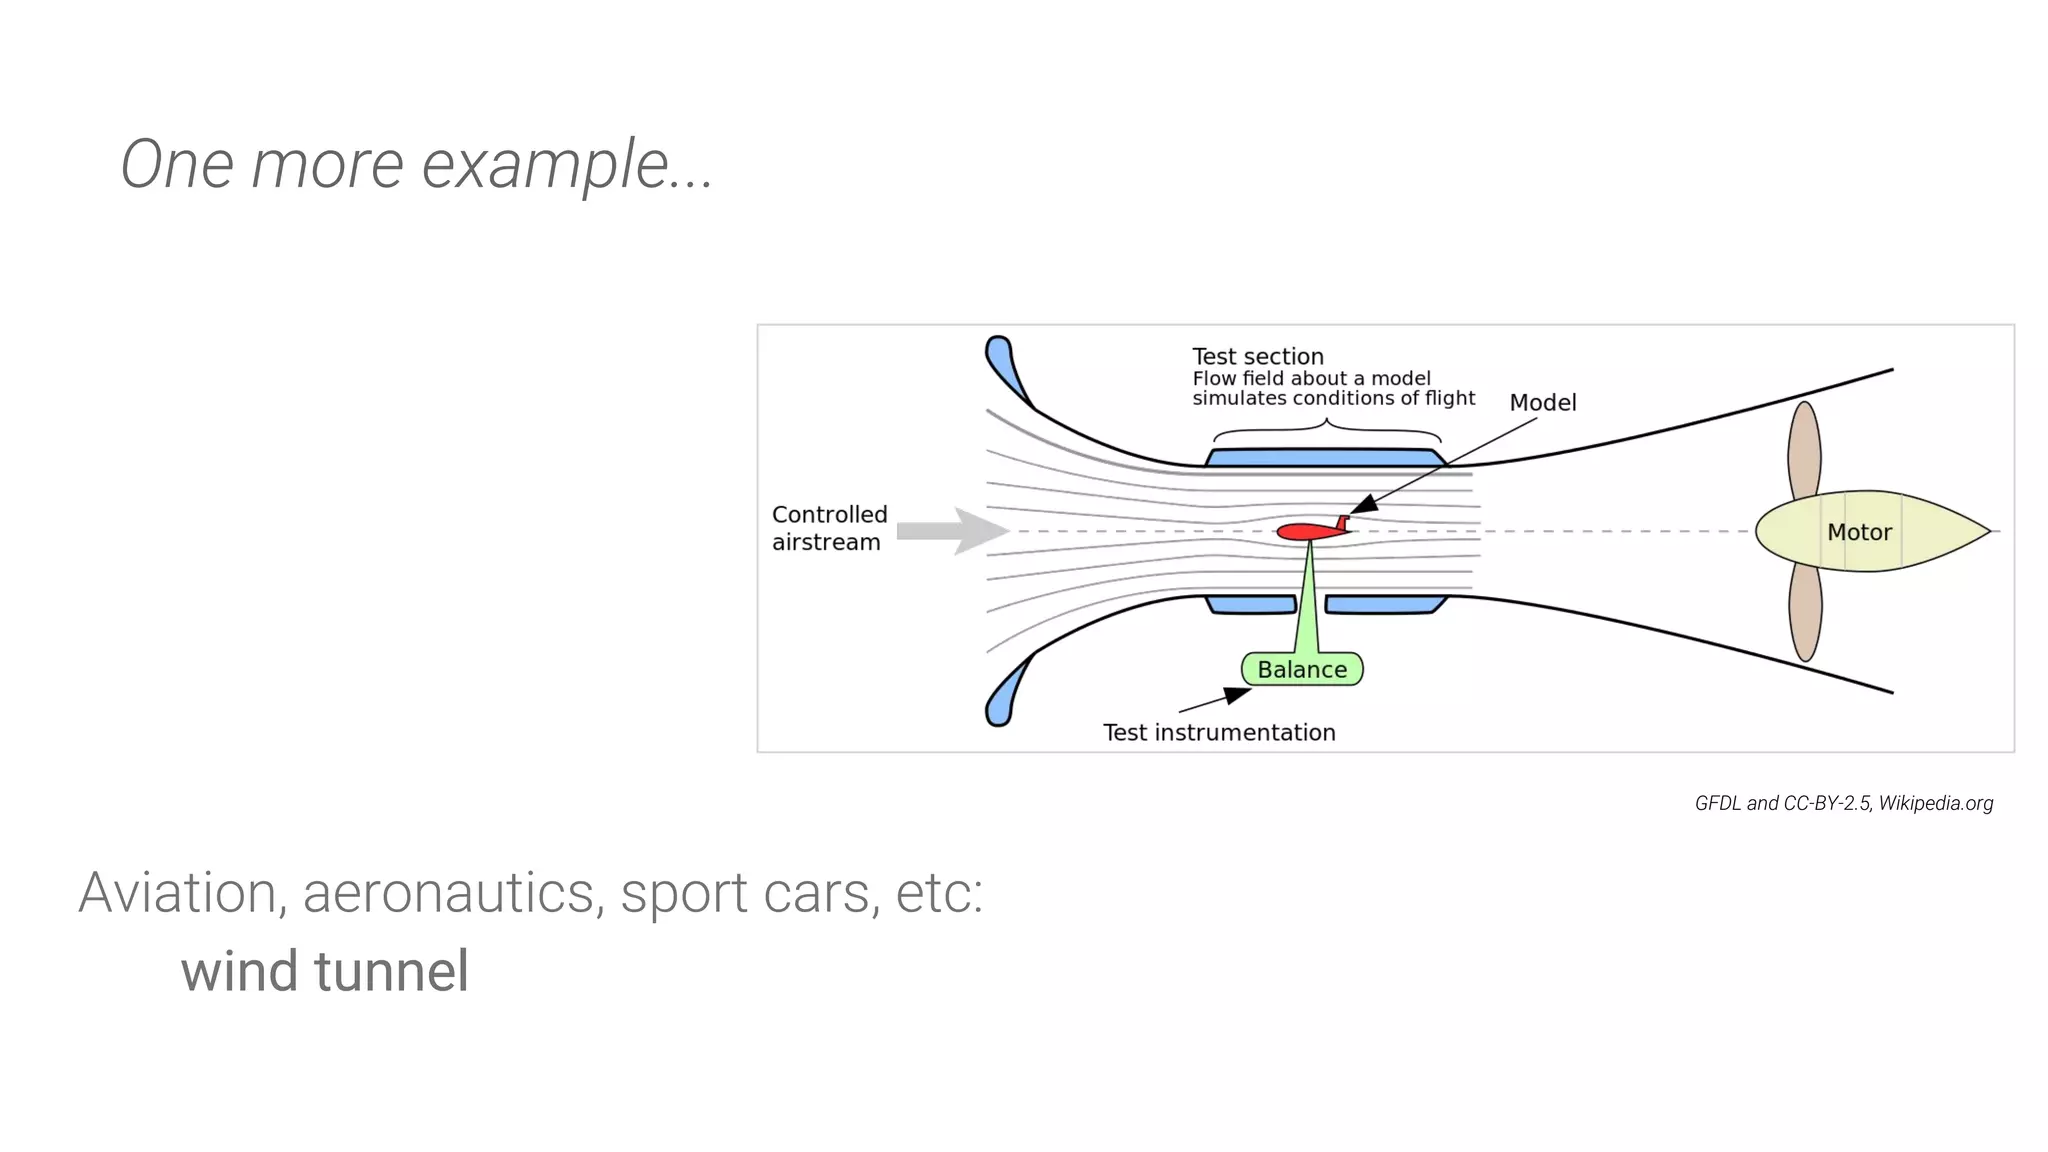
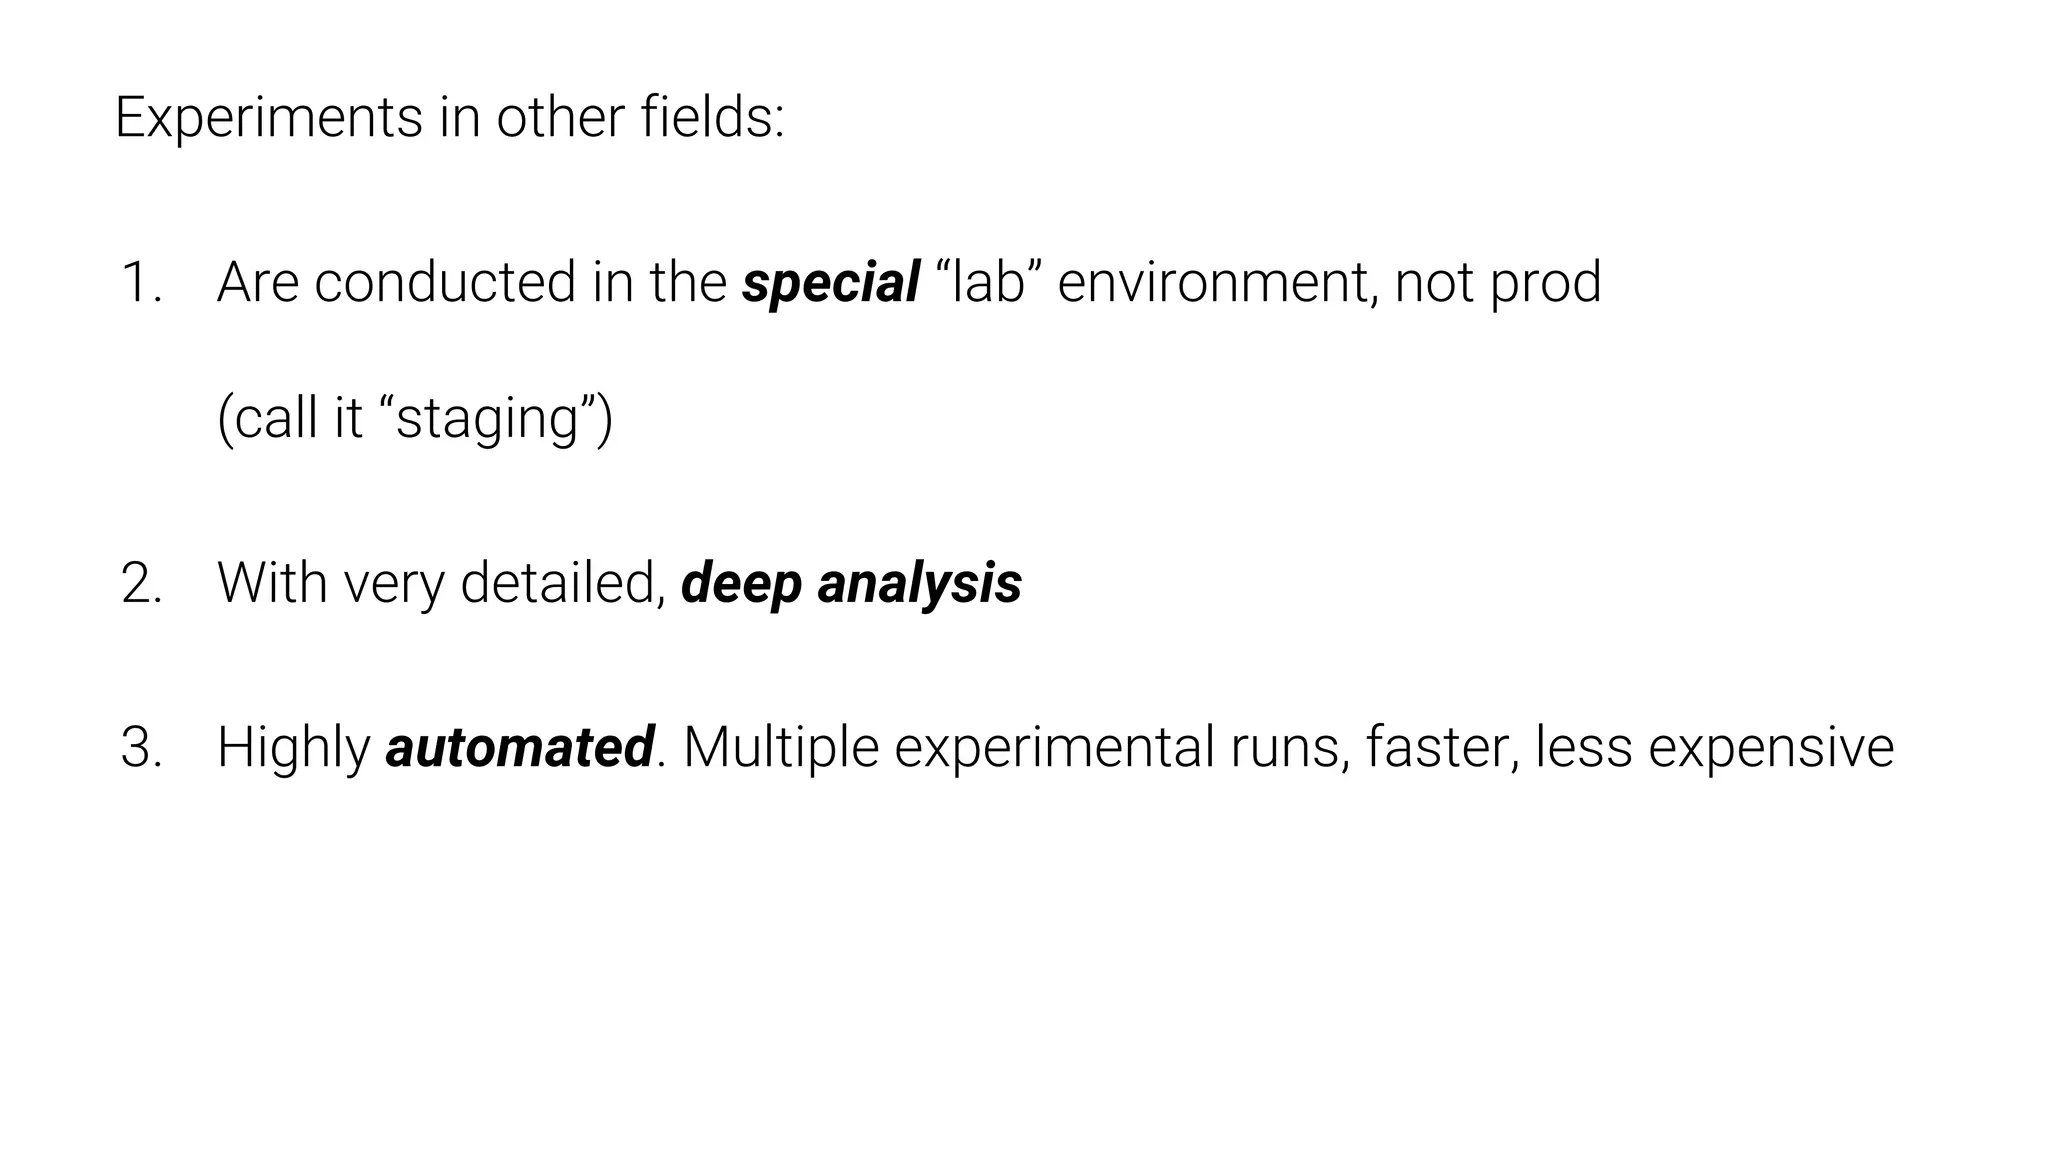
Drawing parallels between database change management and automated testing frameworks used in other industries.
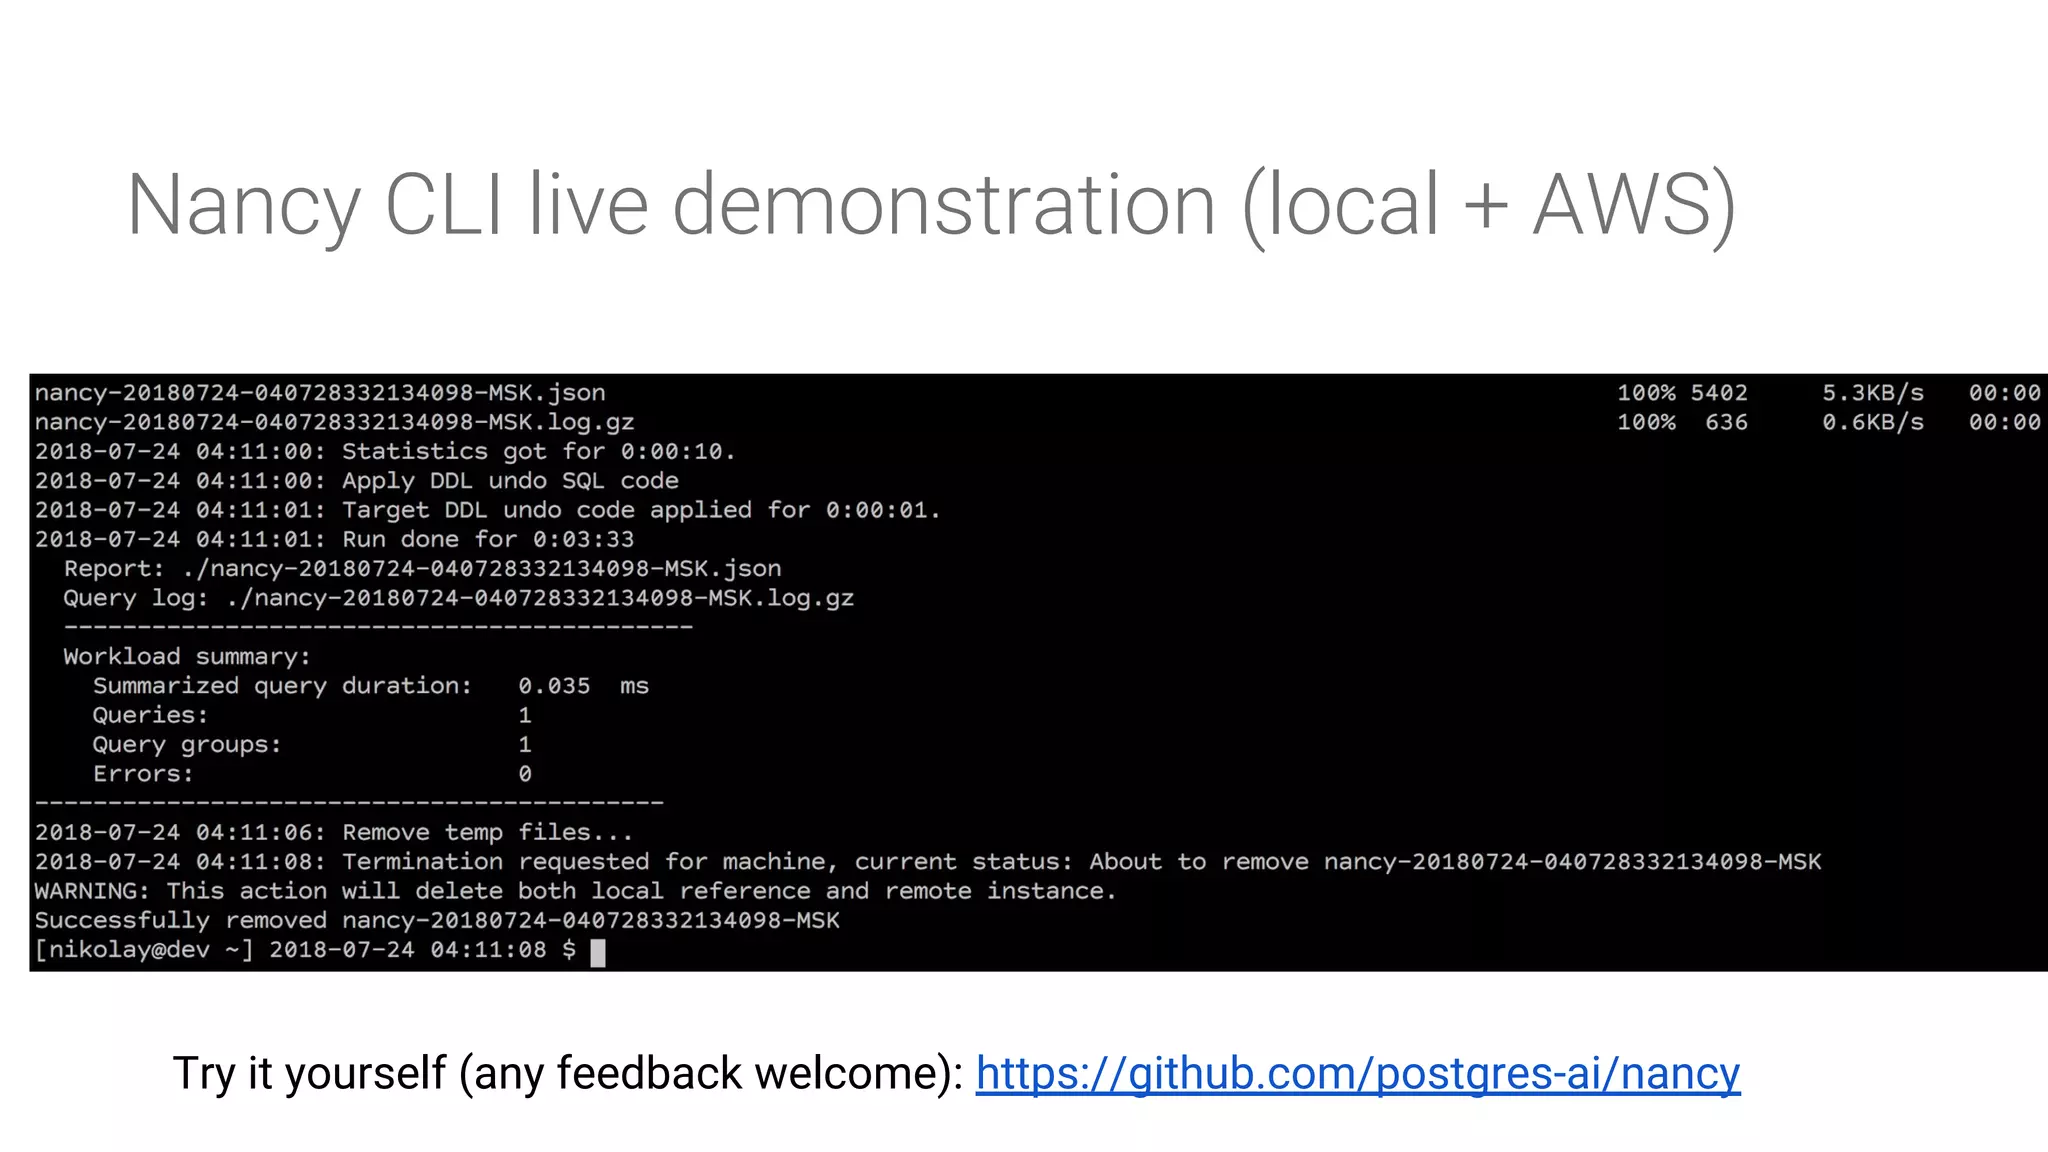
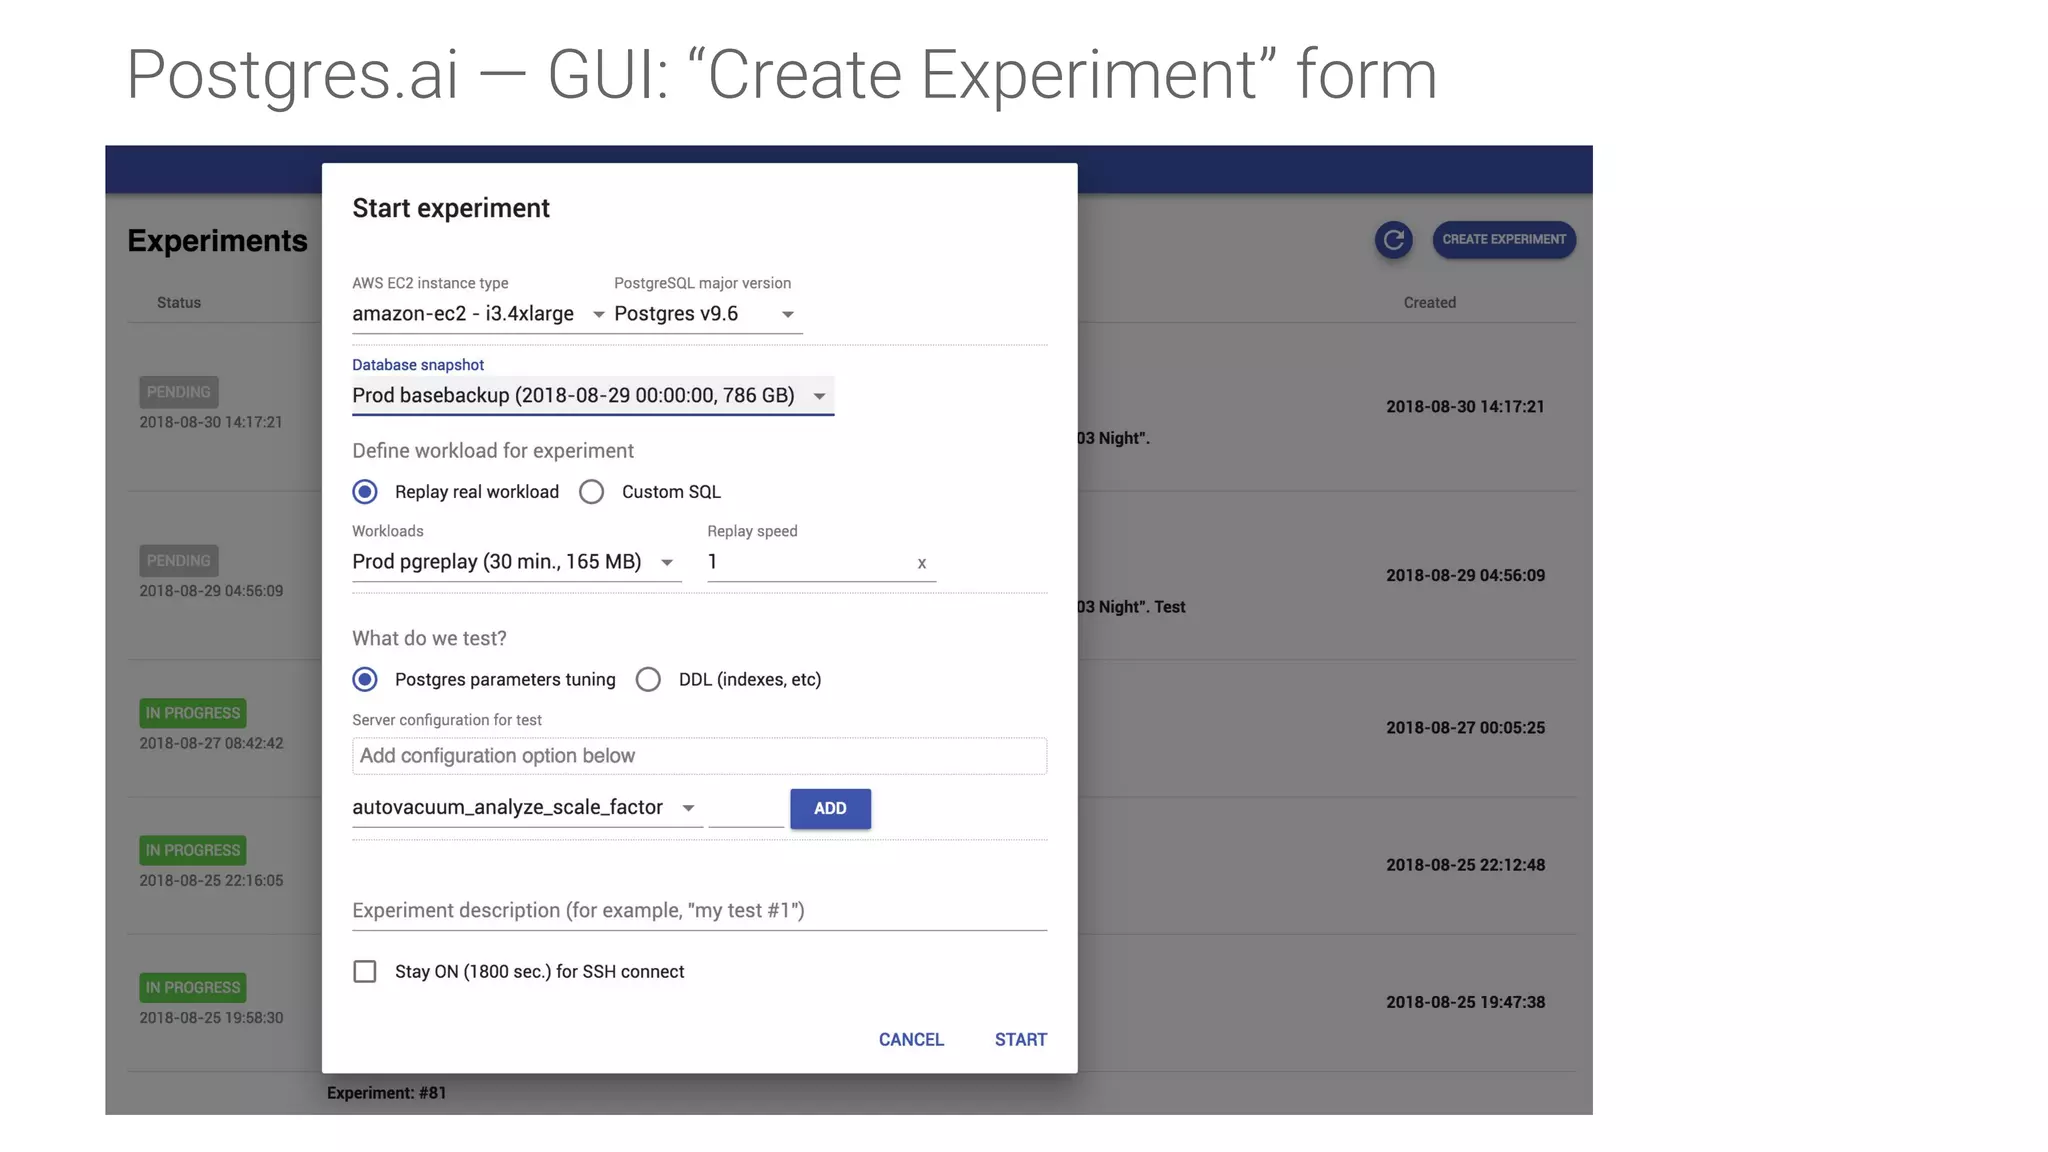
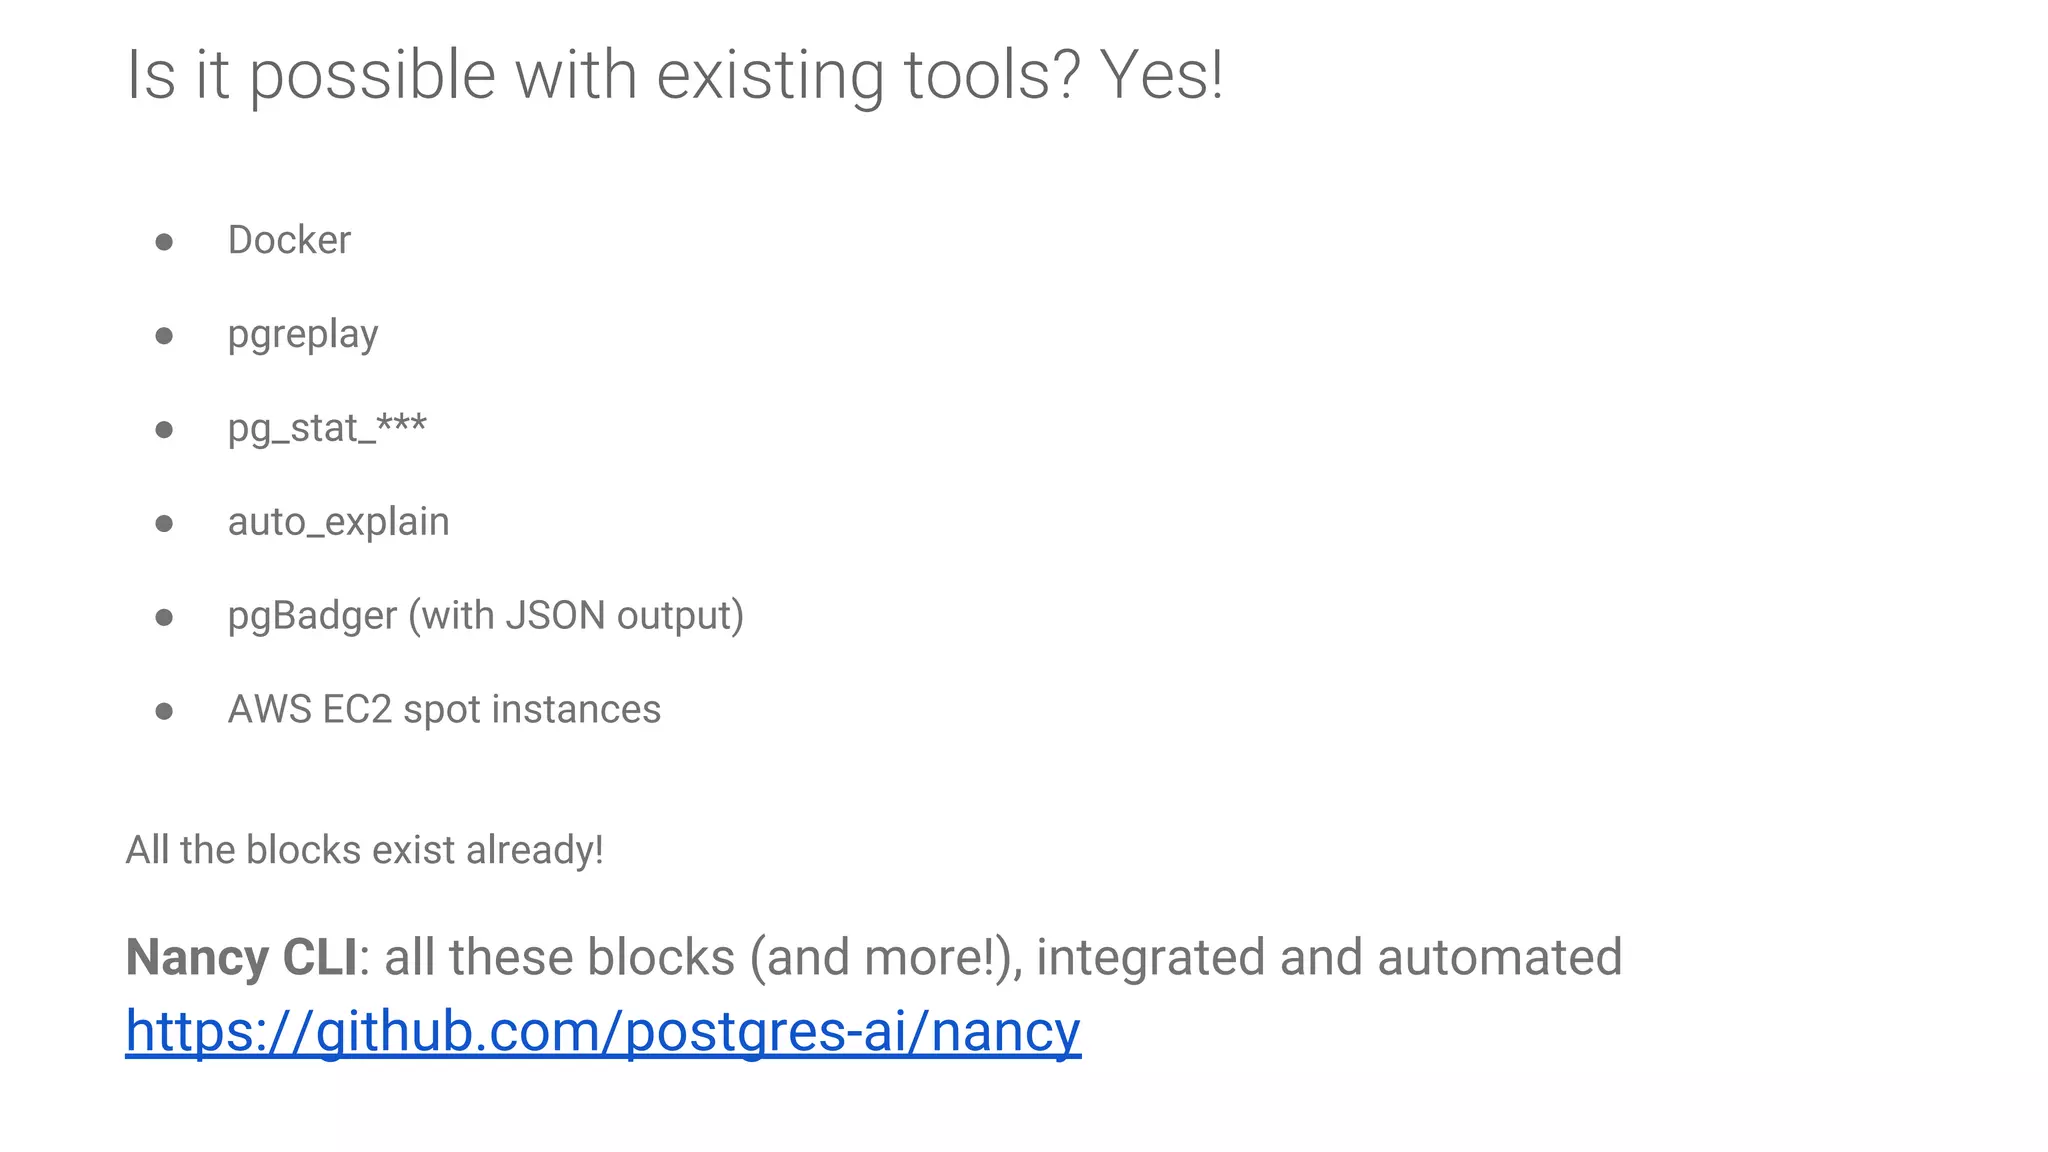
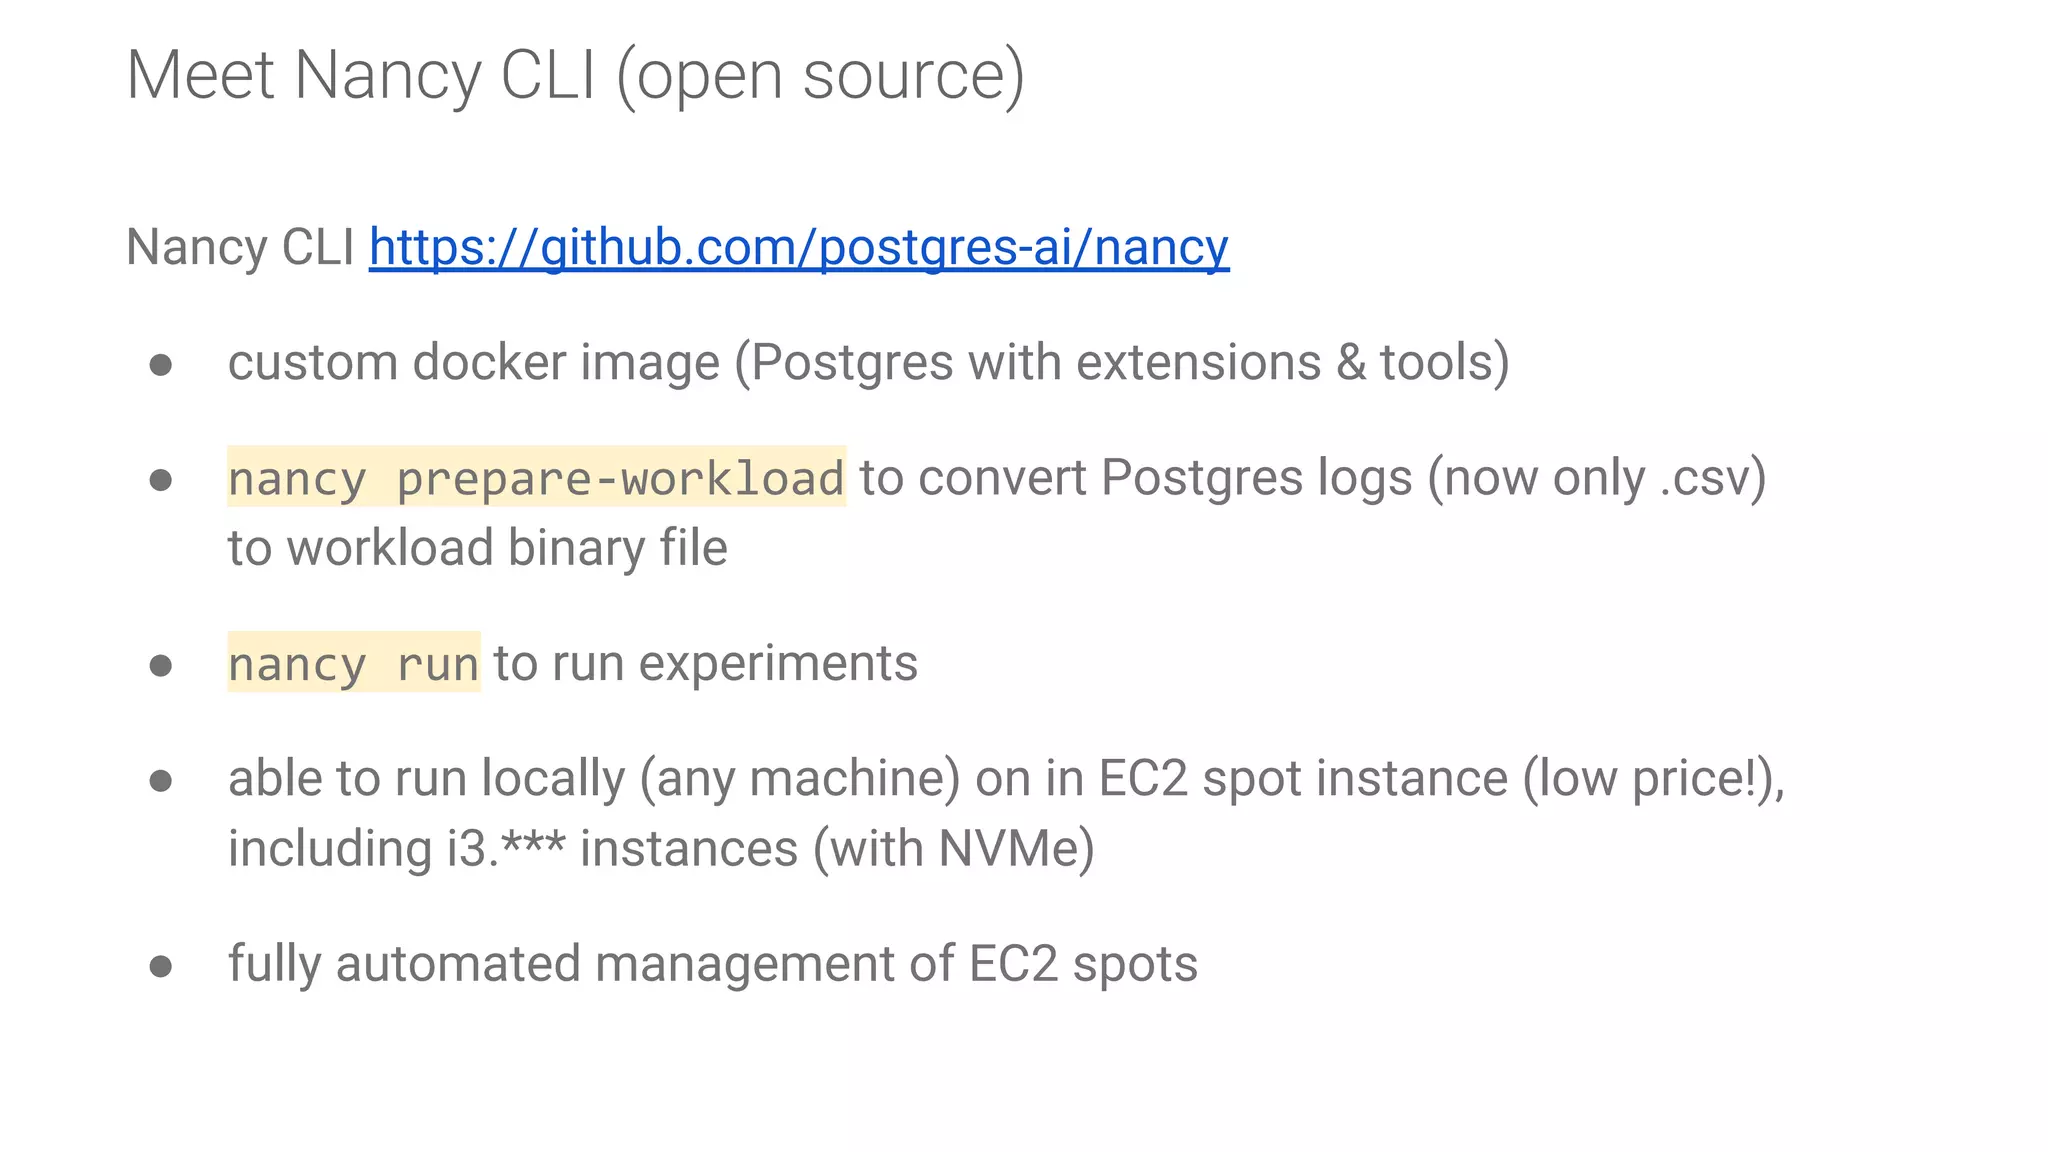
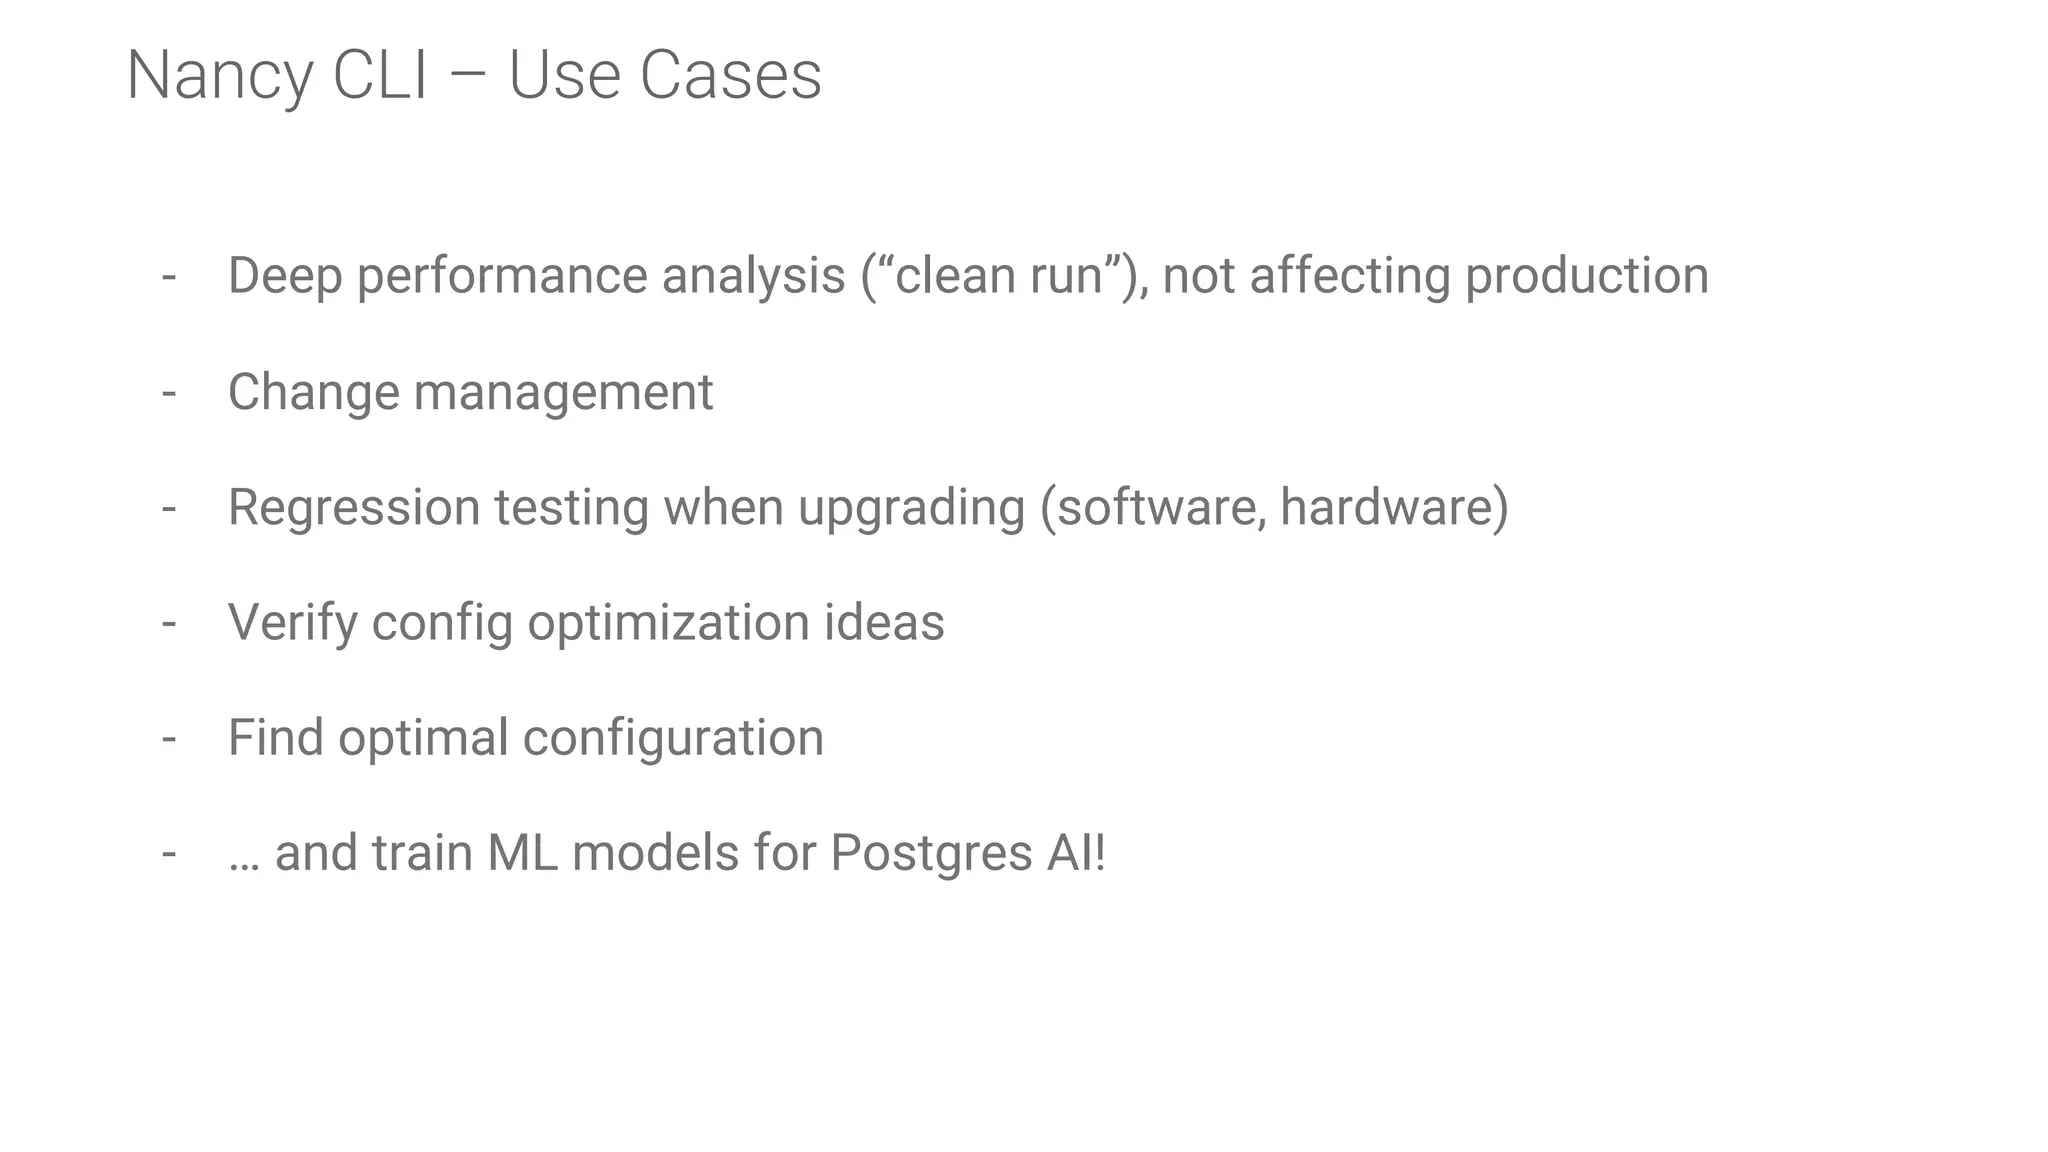
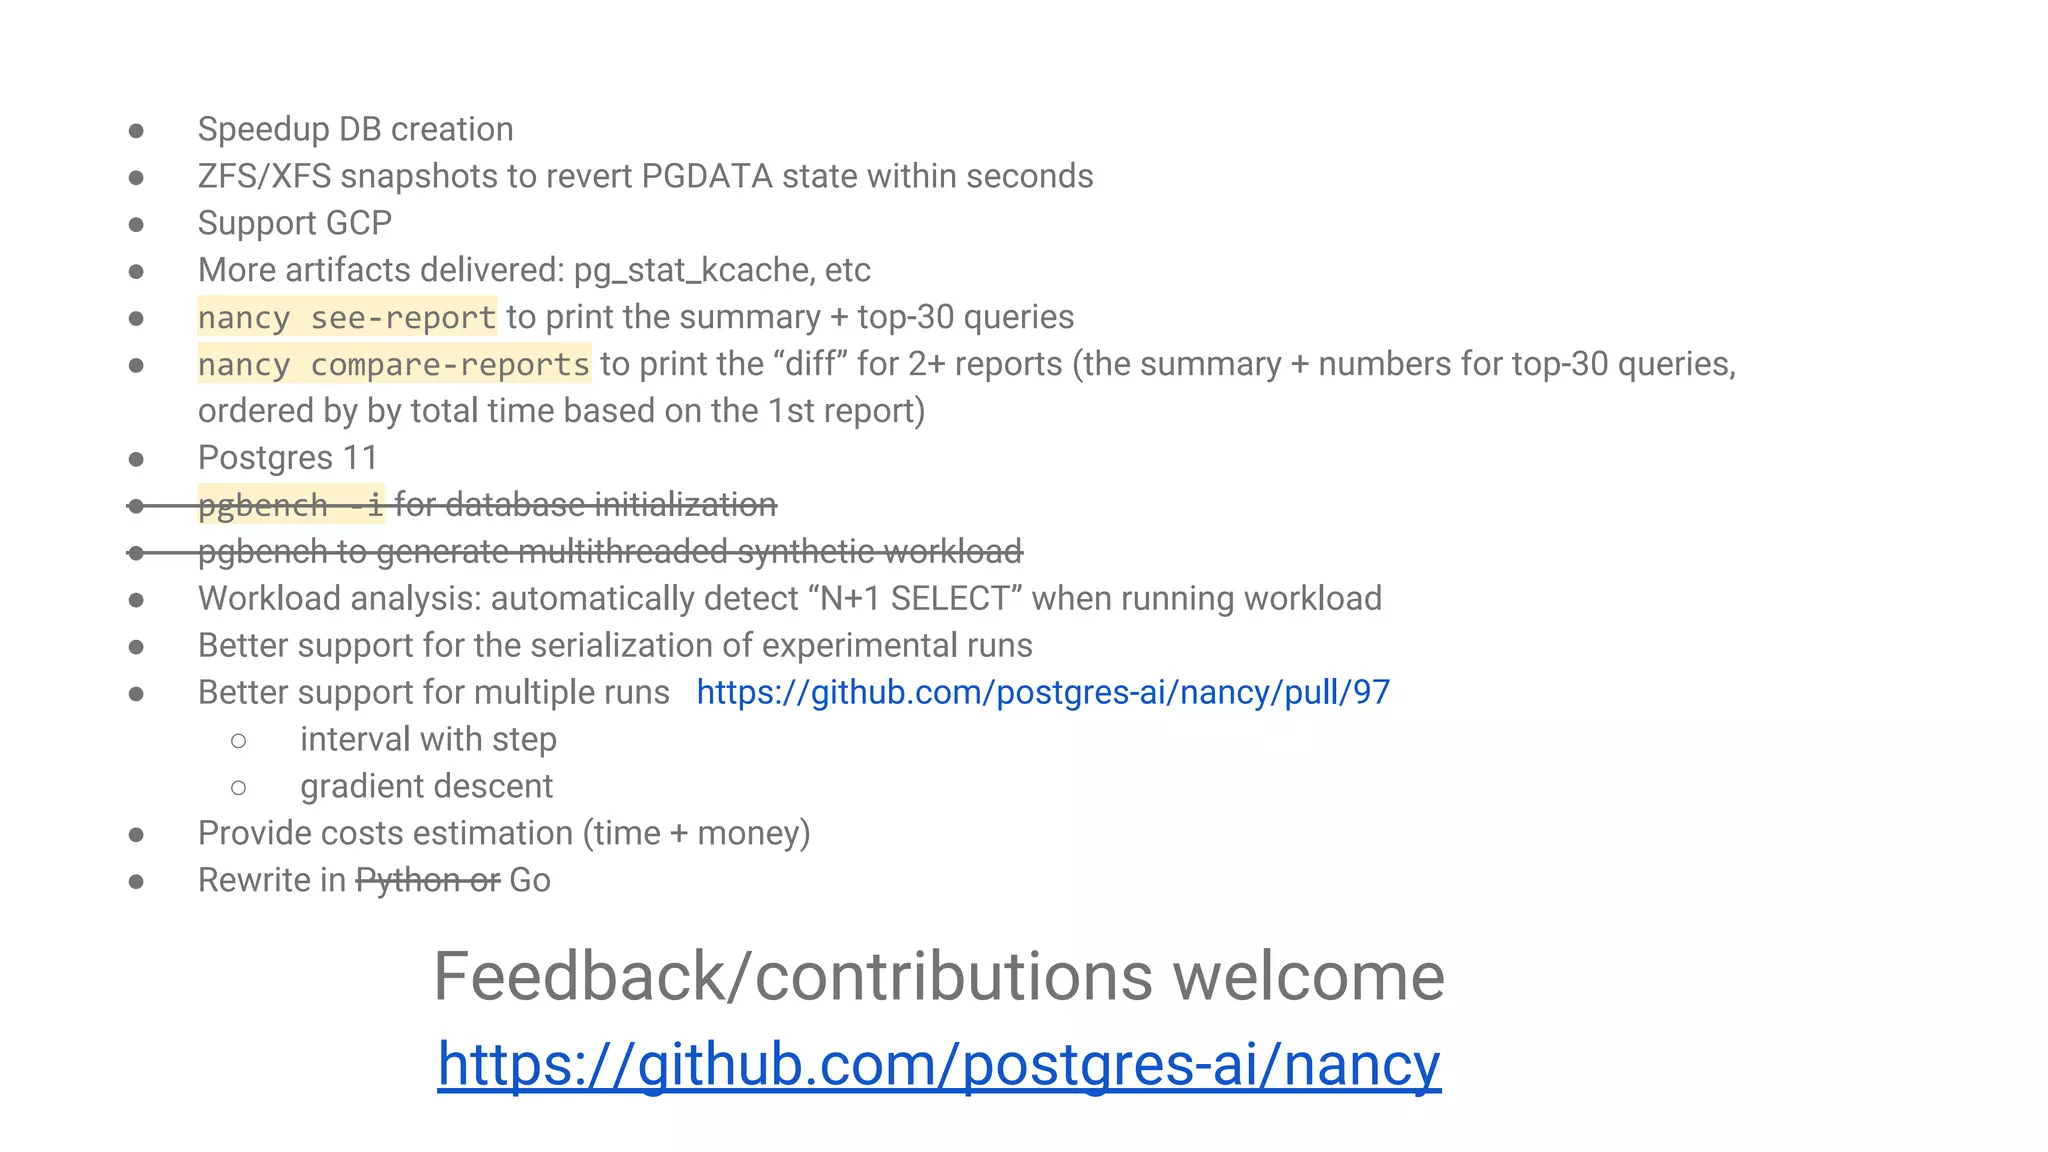
Live demonstration of Nancy CLI, a tool for conducting database experiments within various environments.
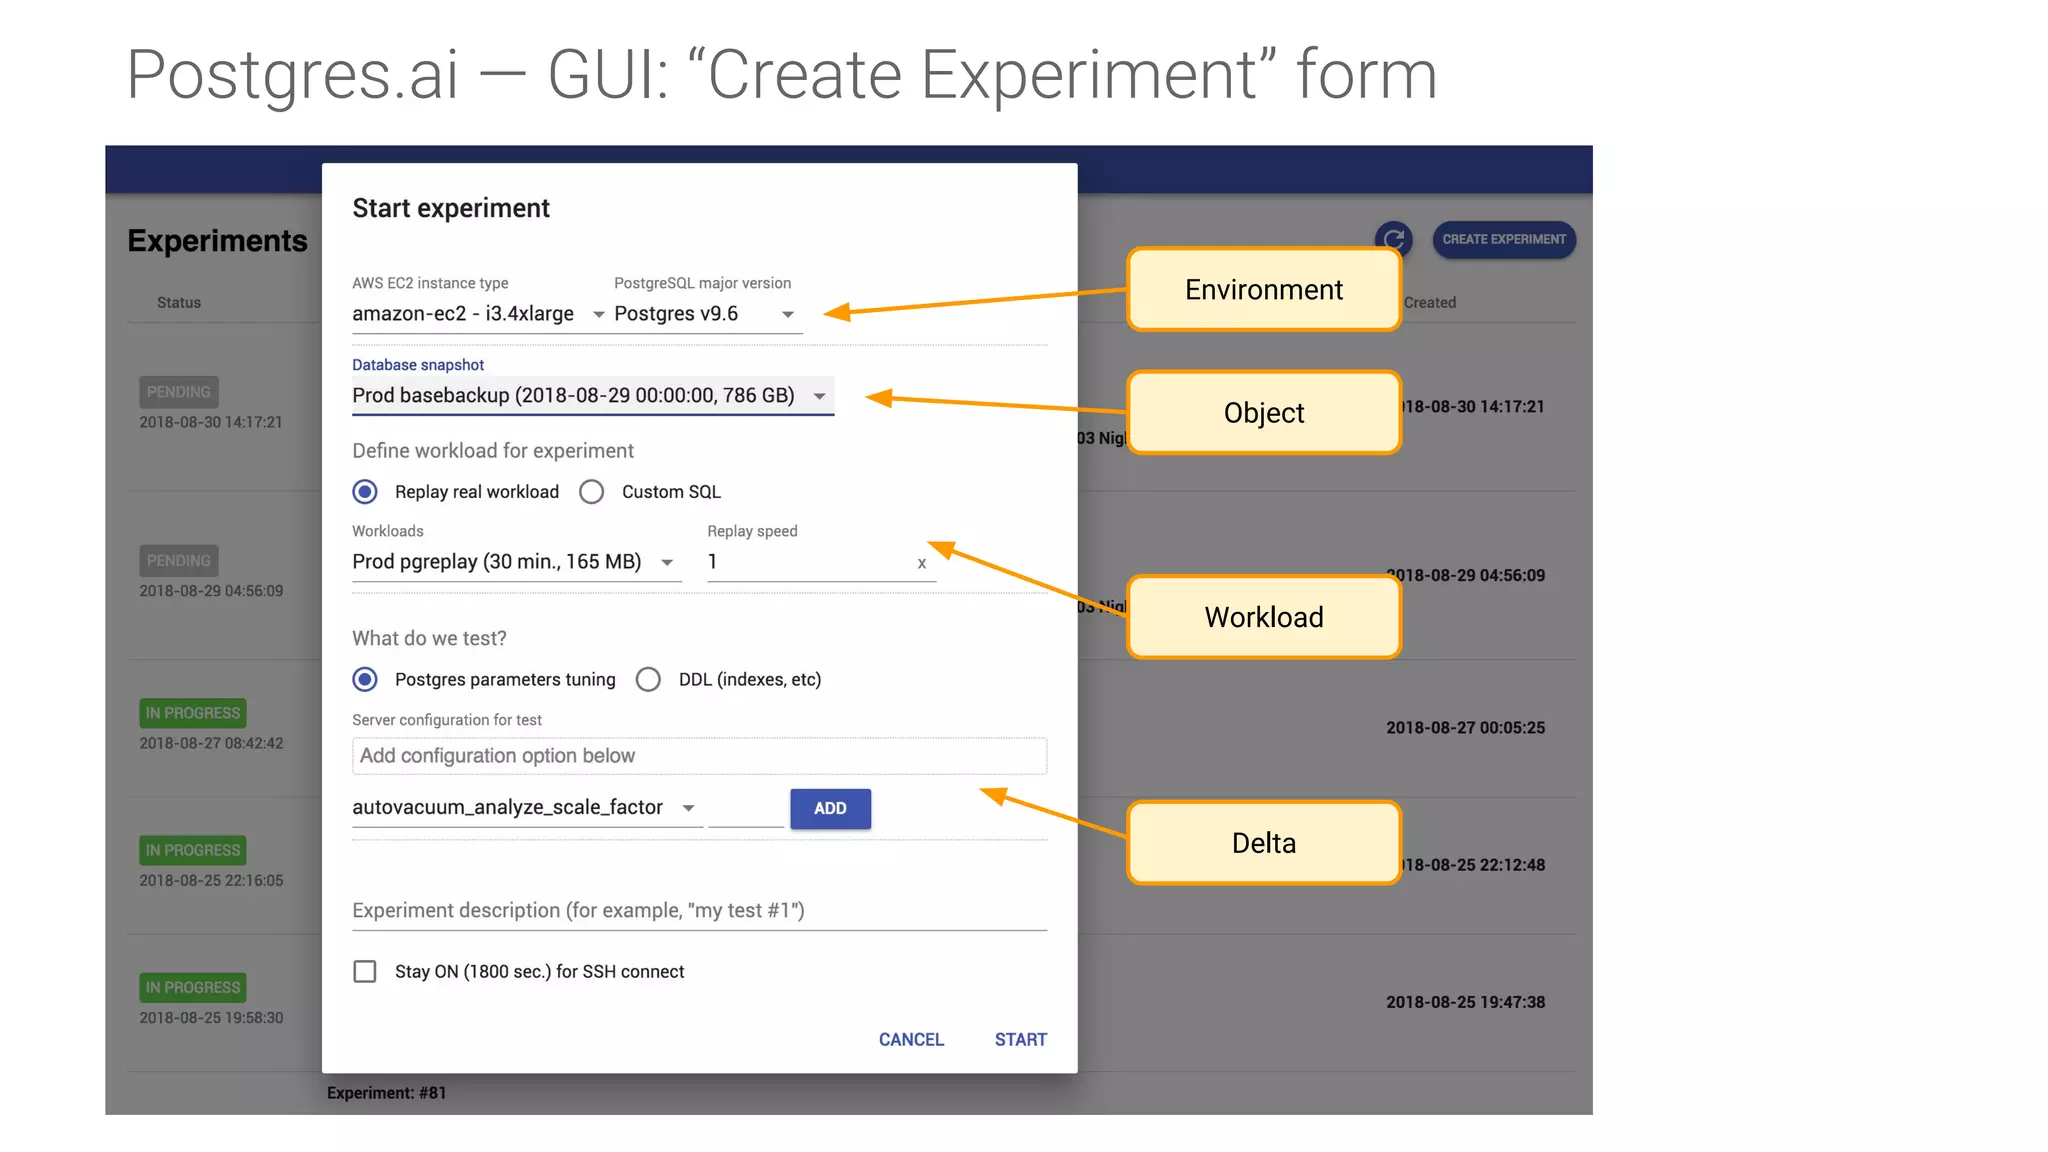
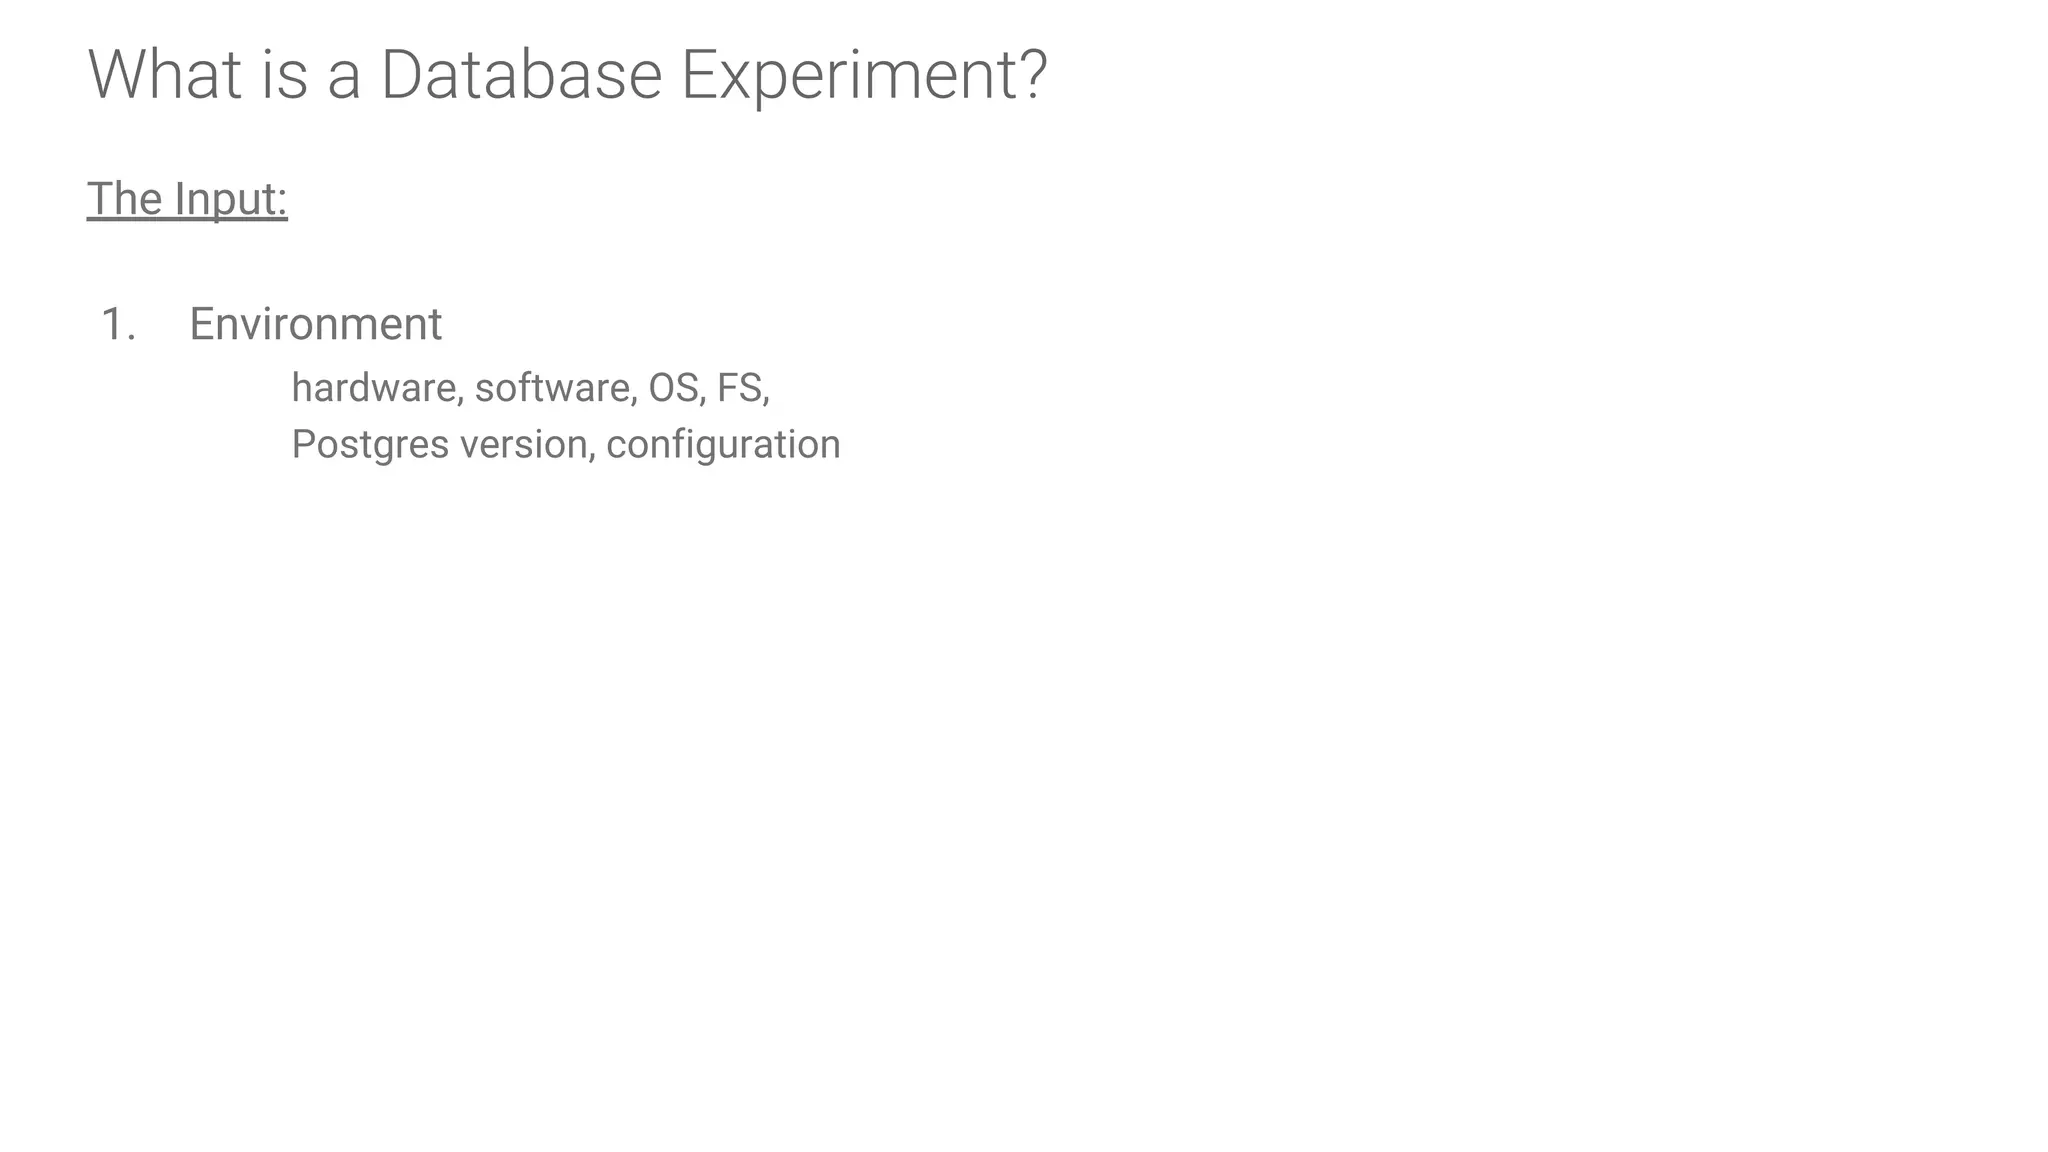
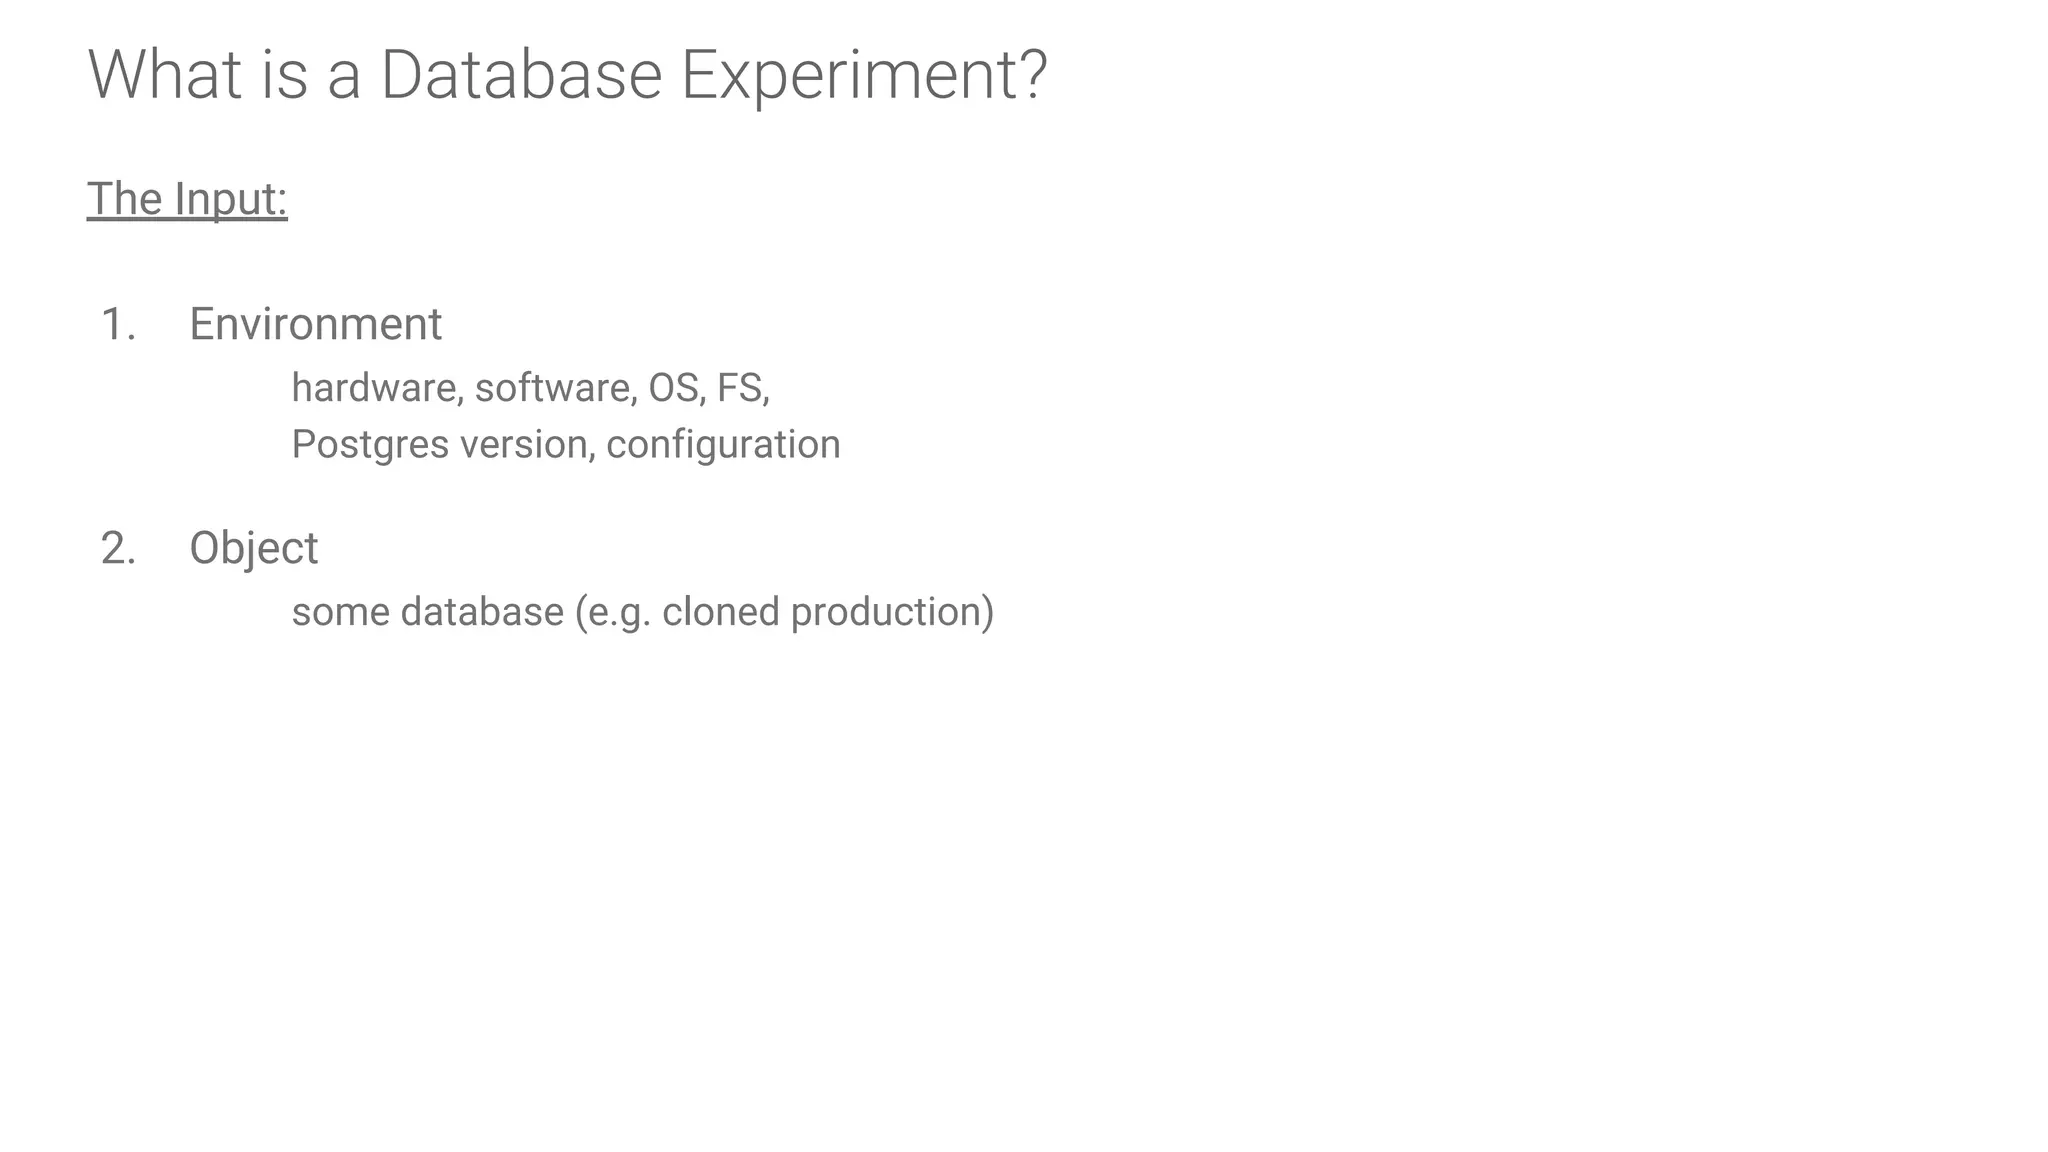
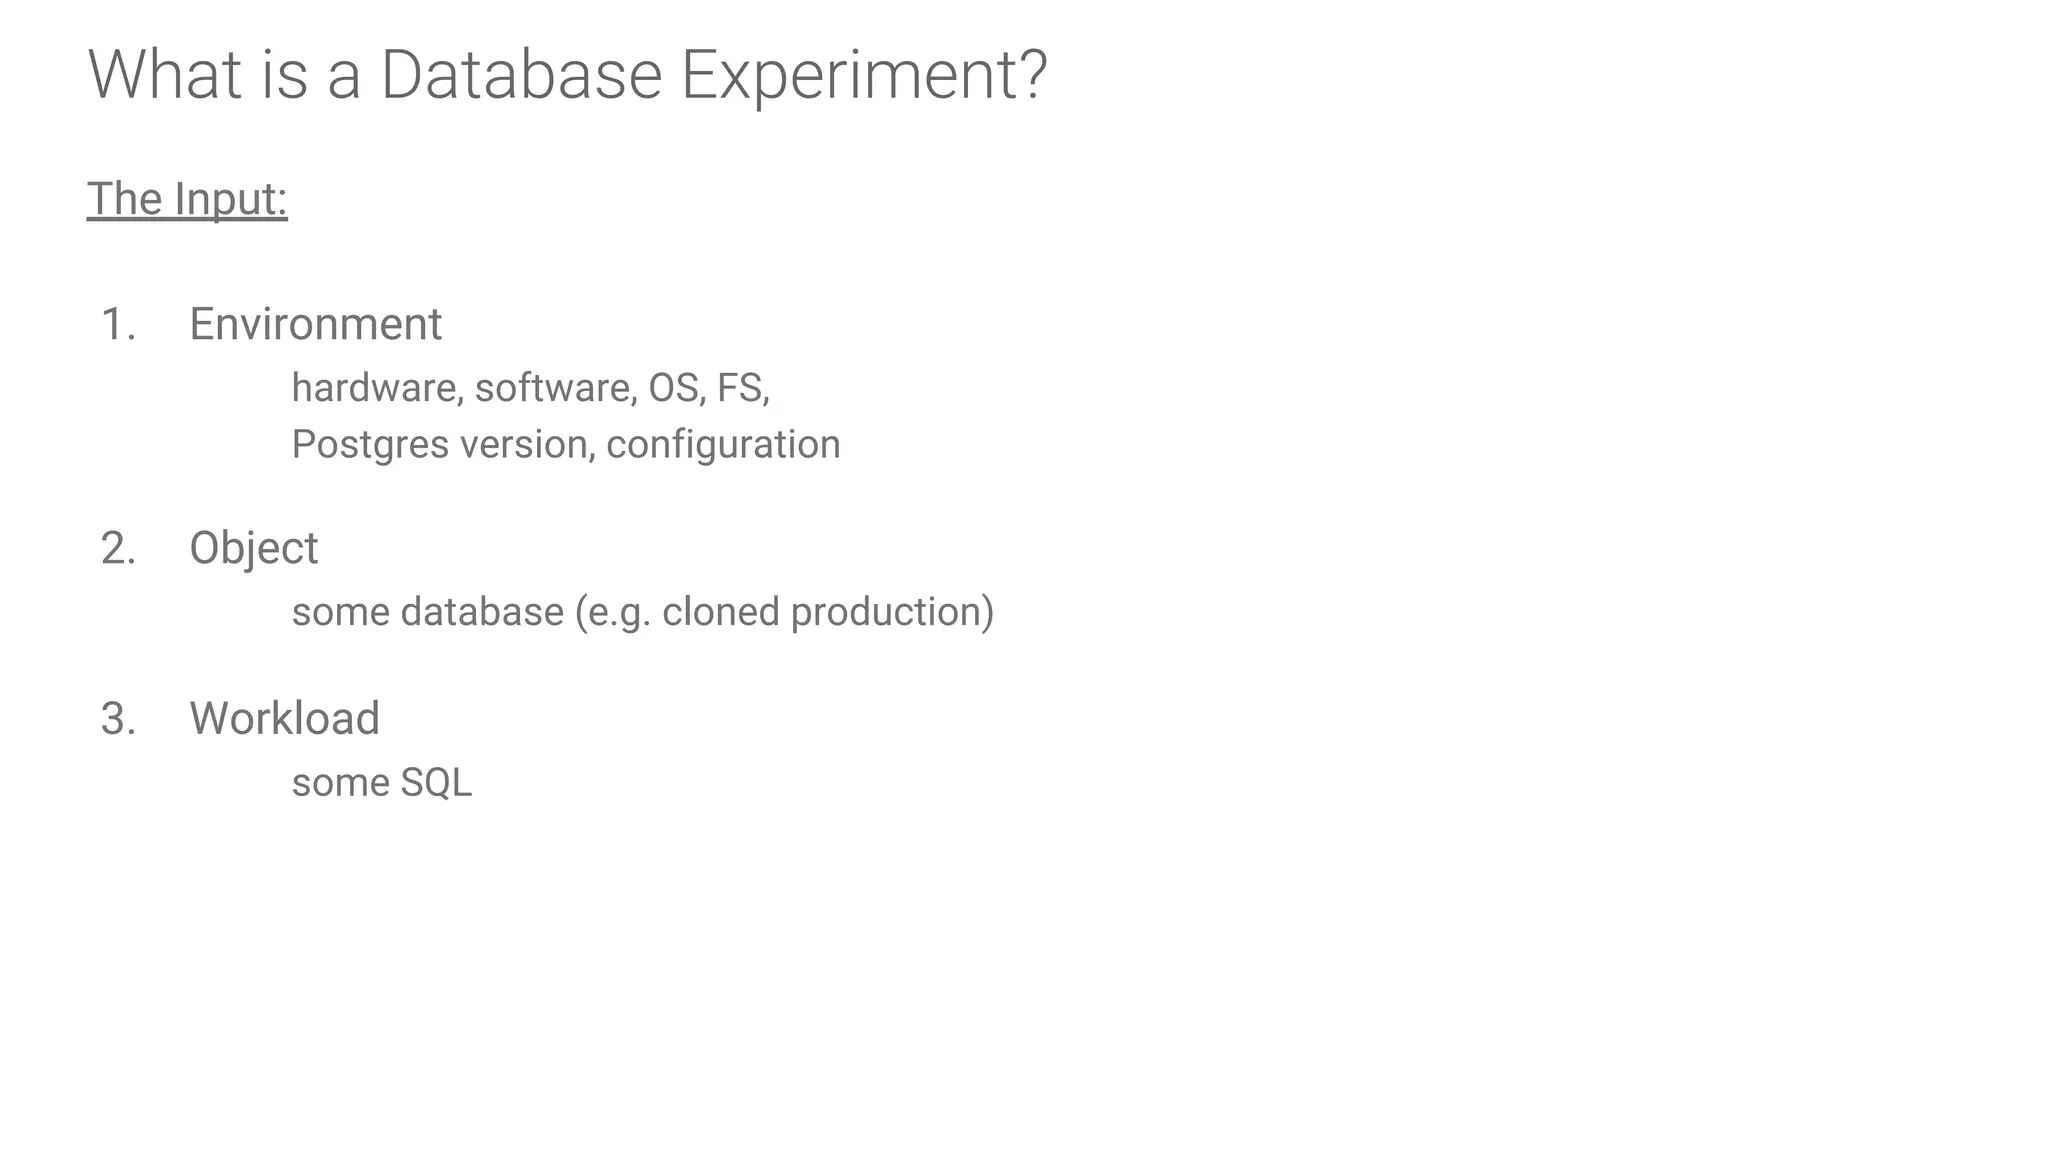
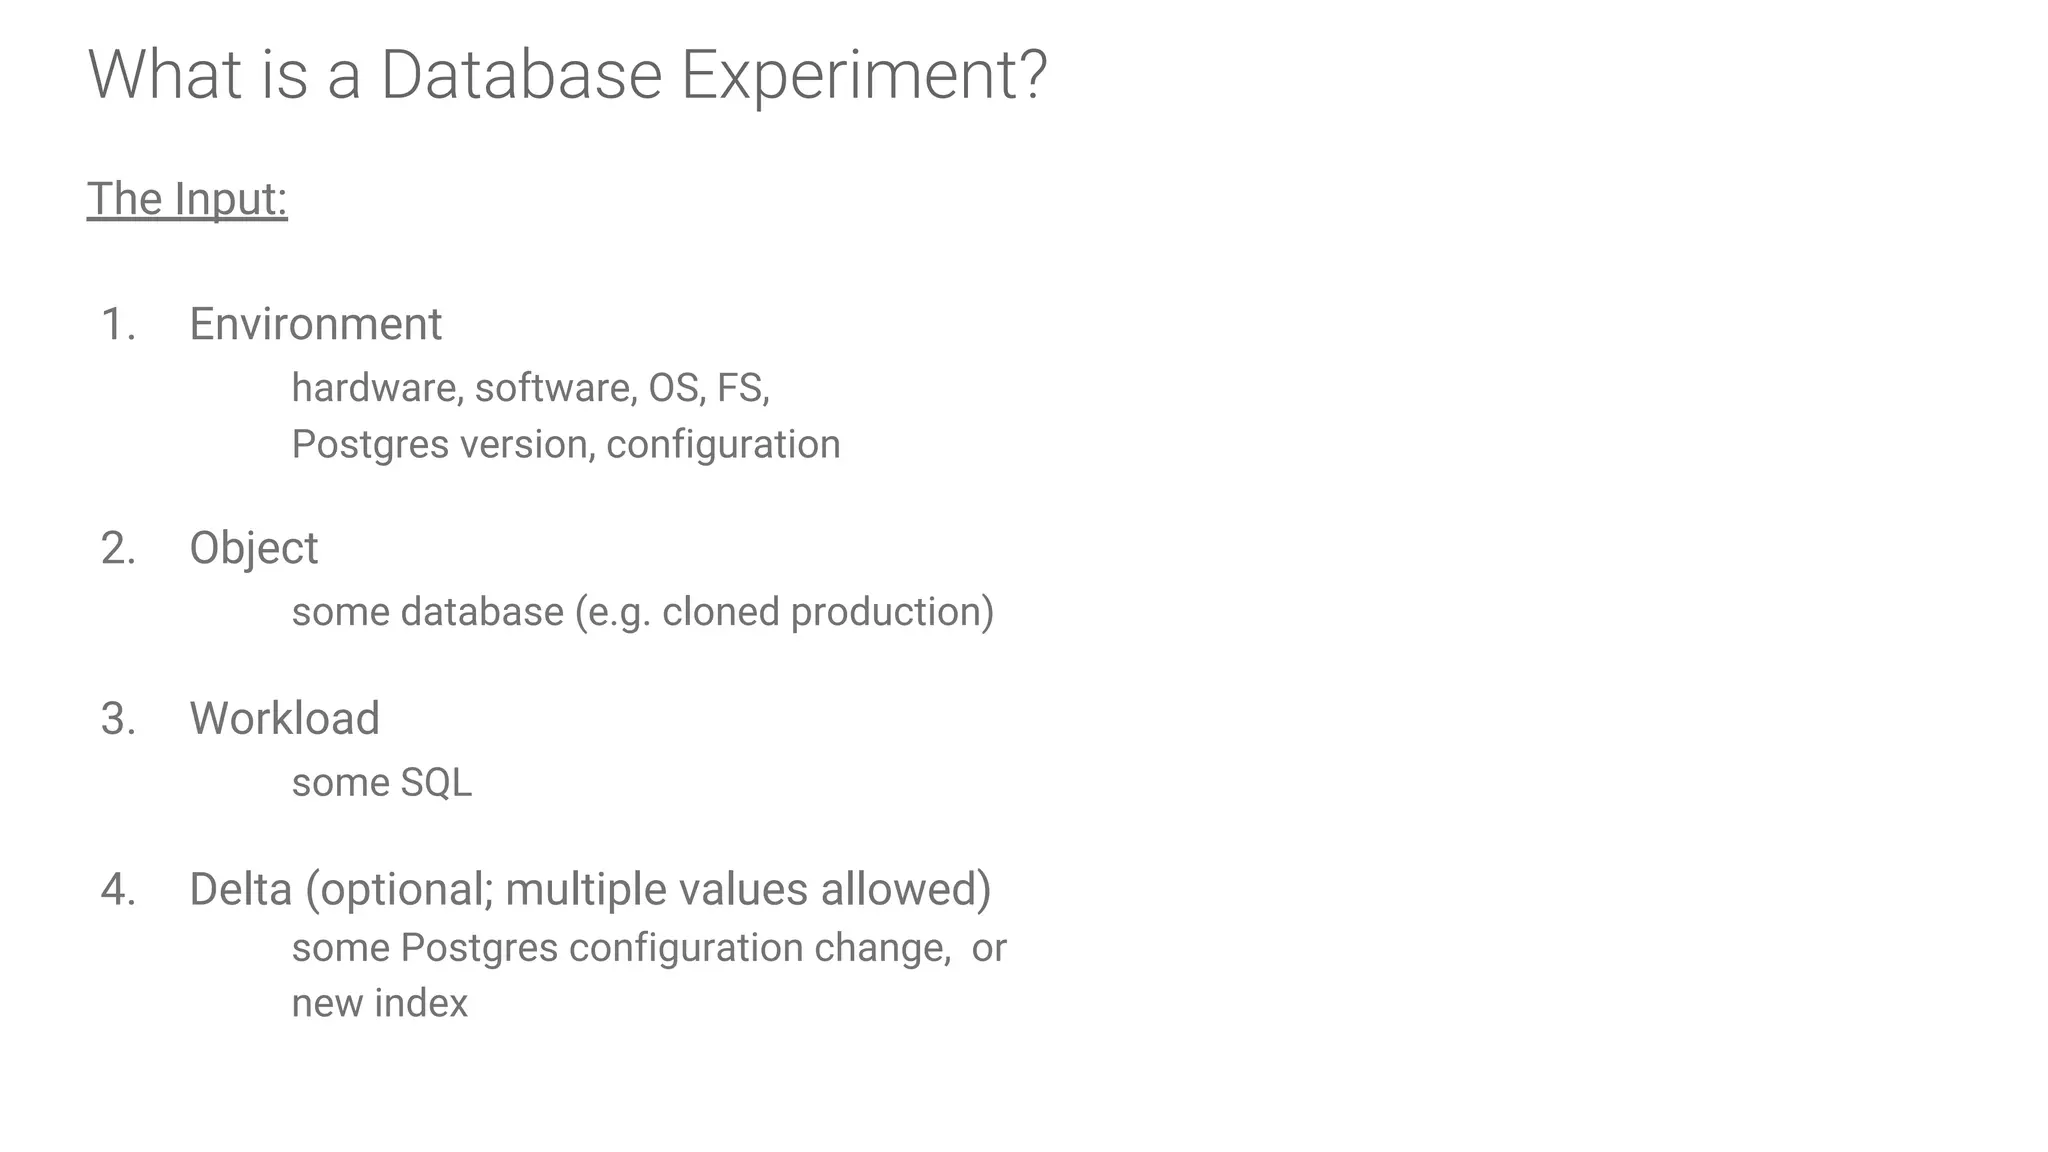
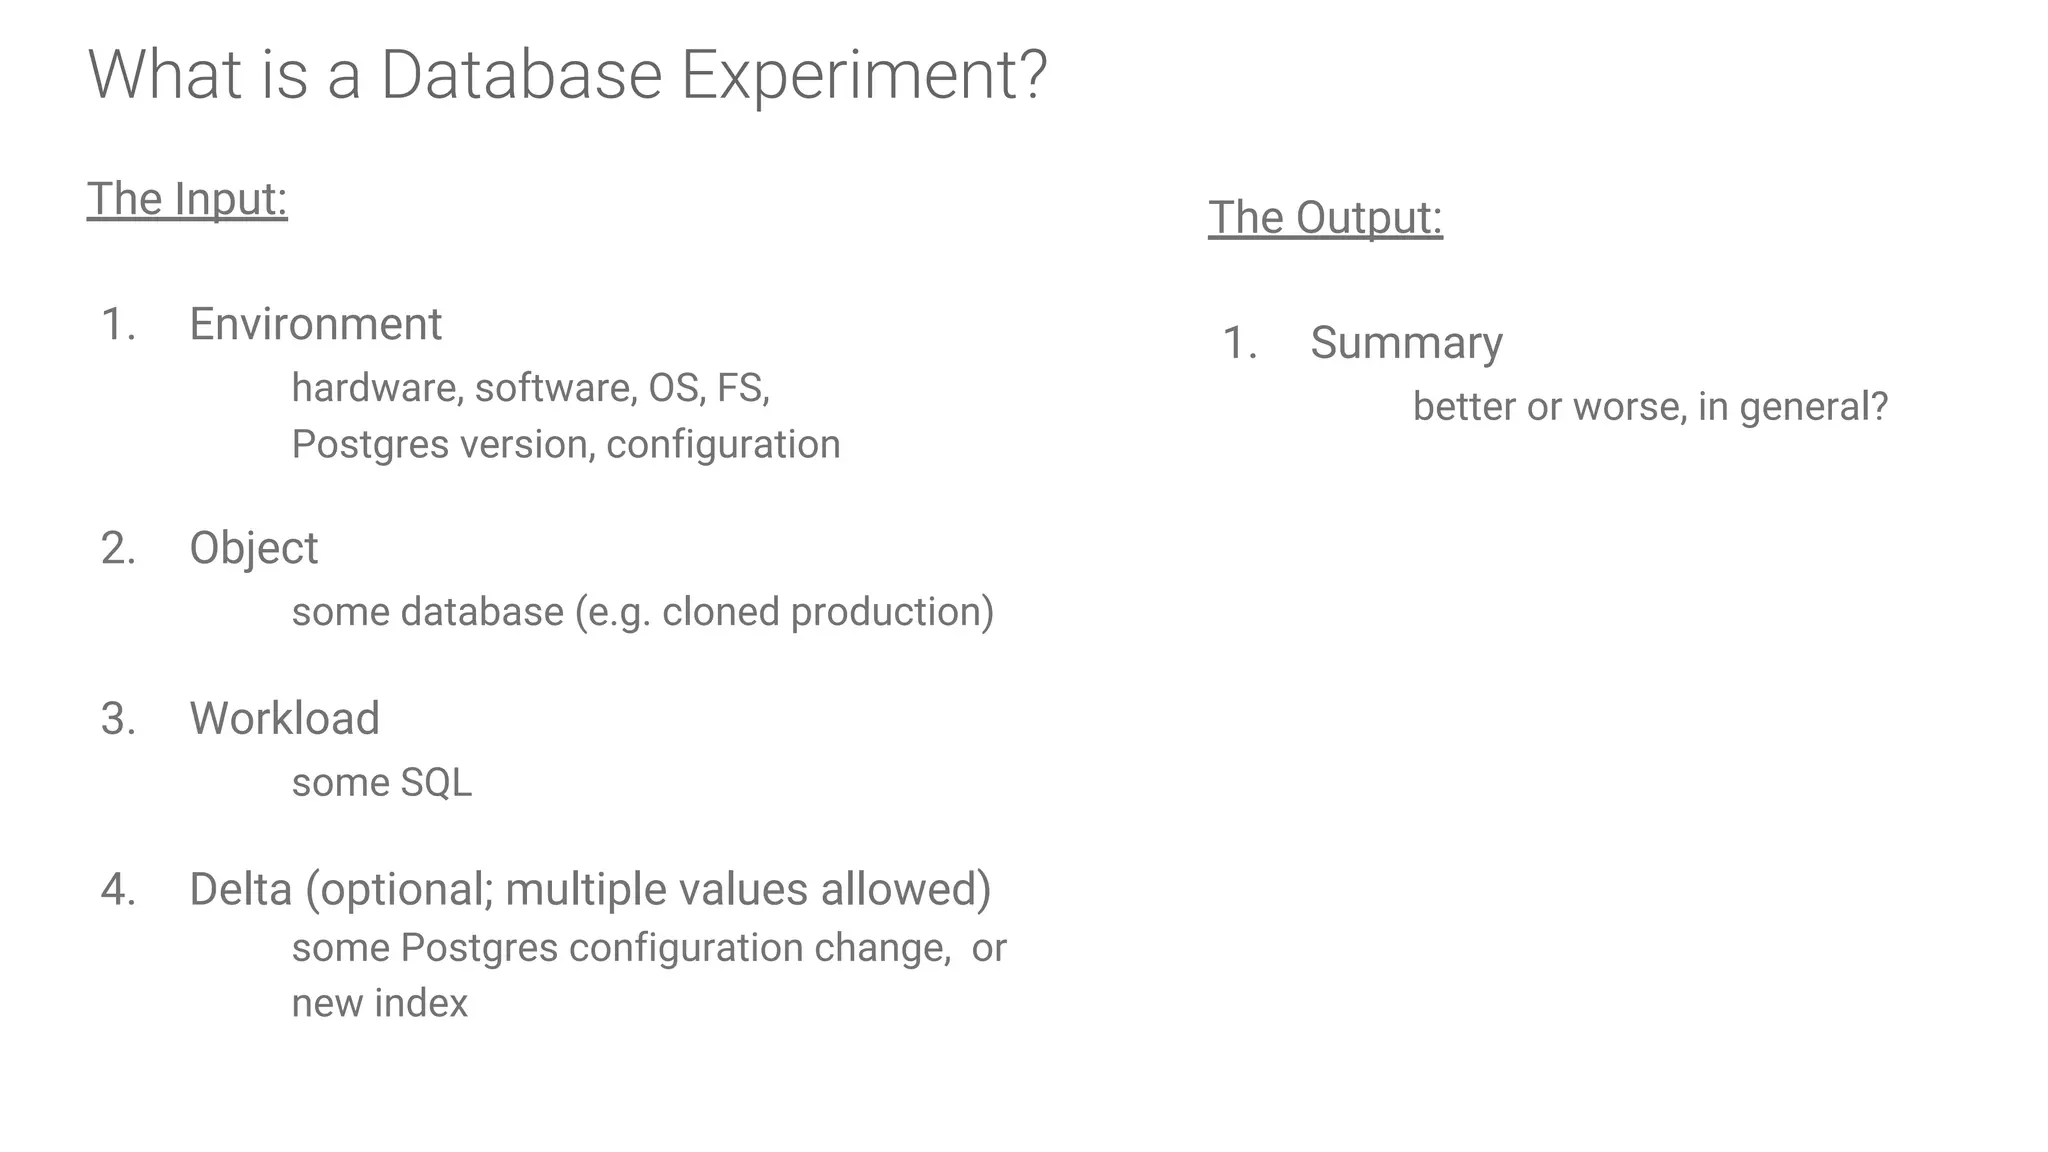
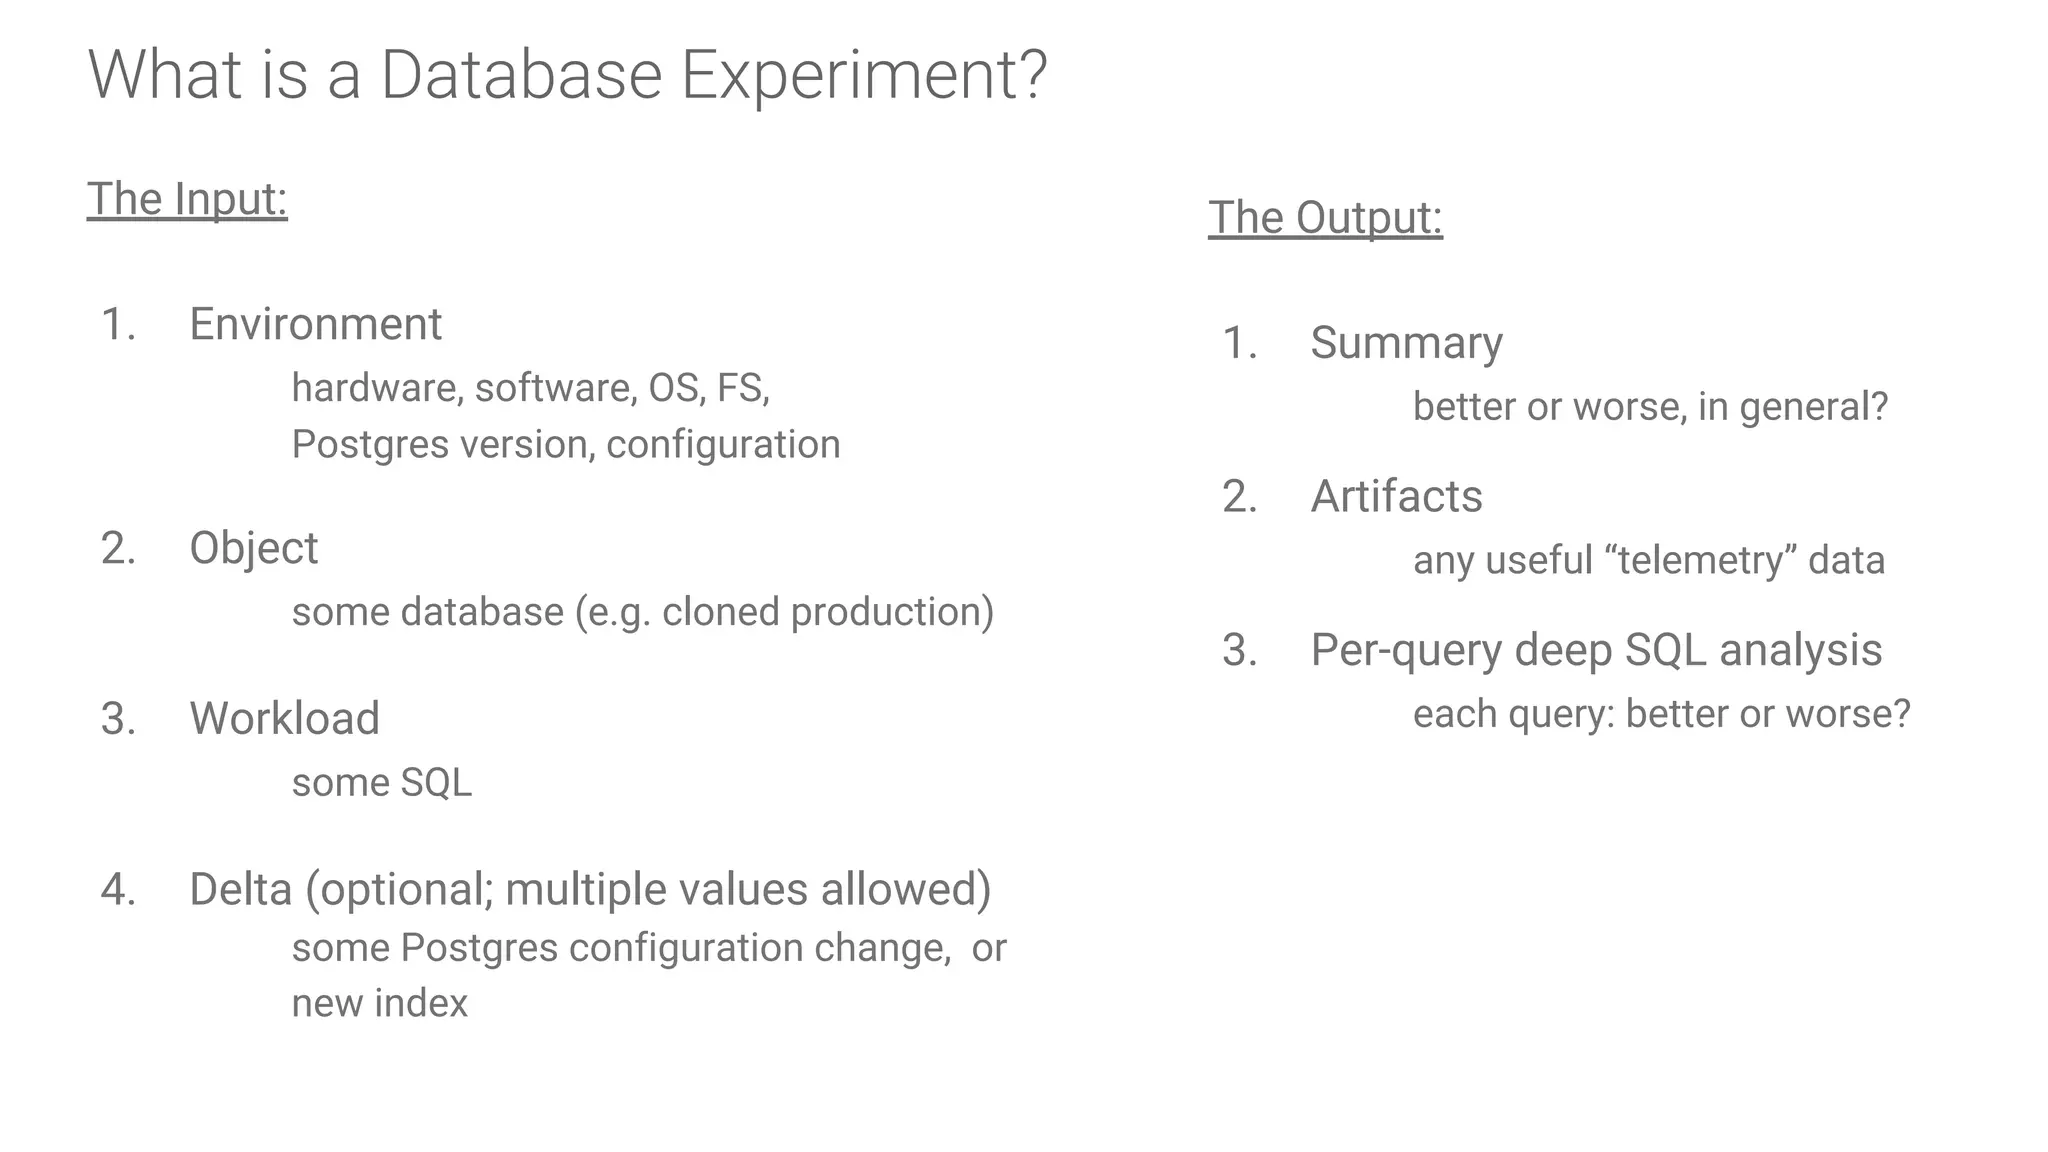
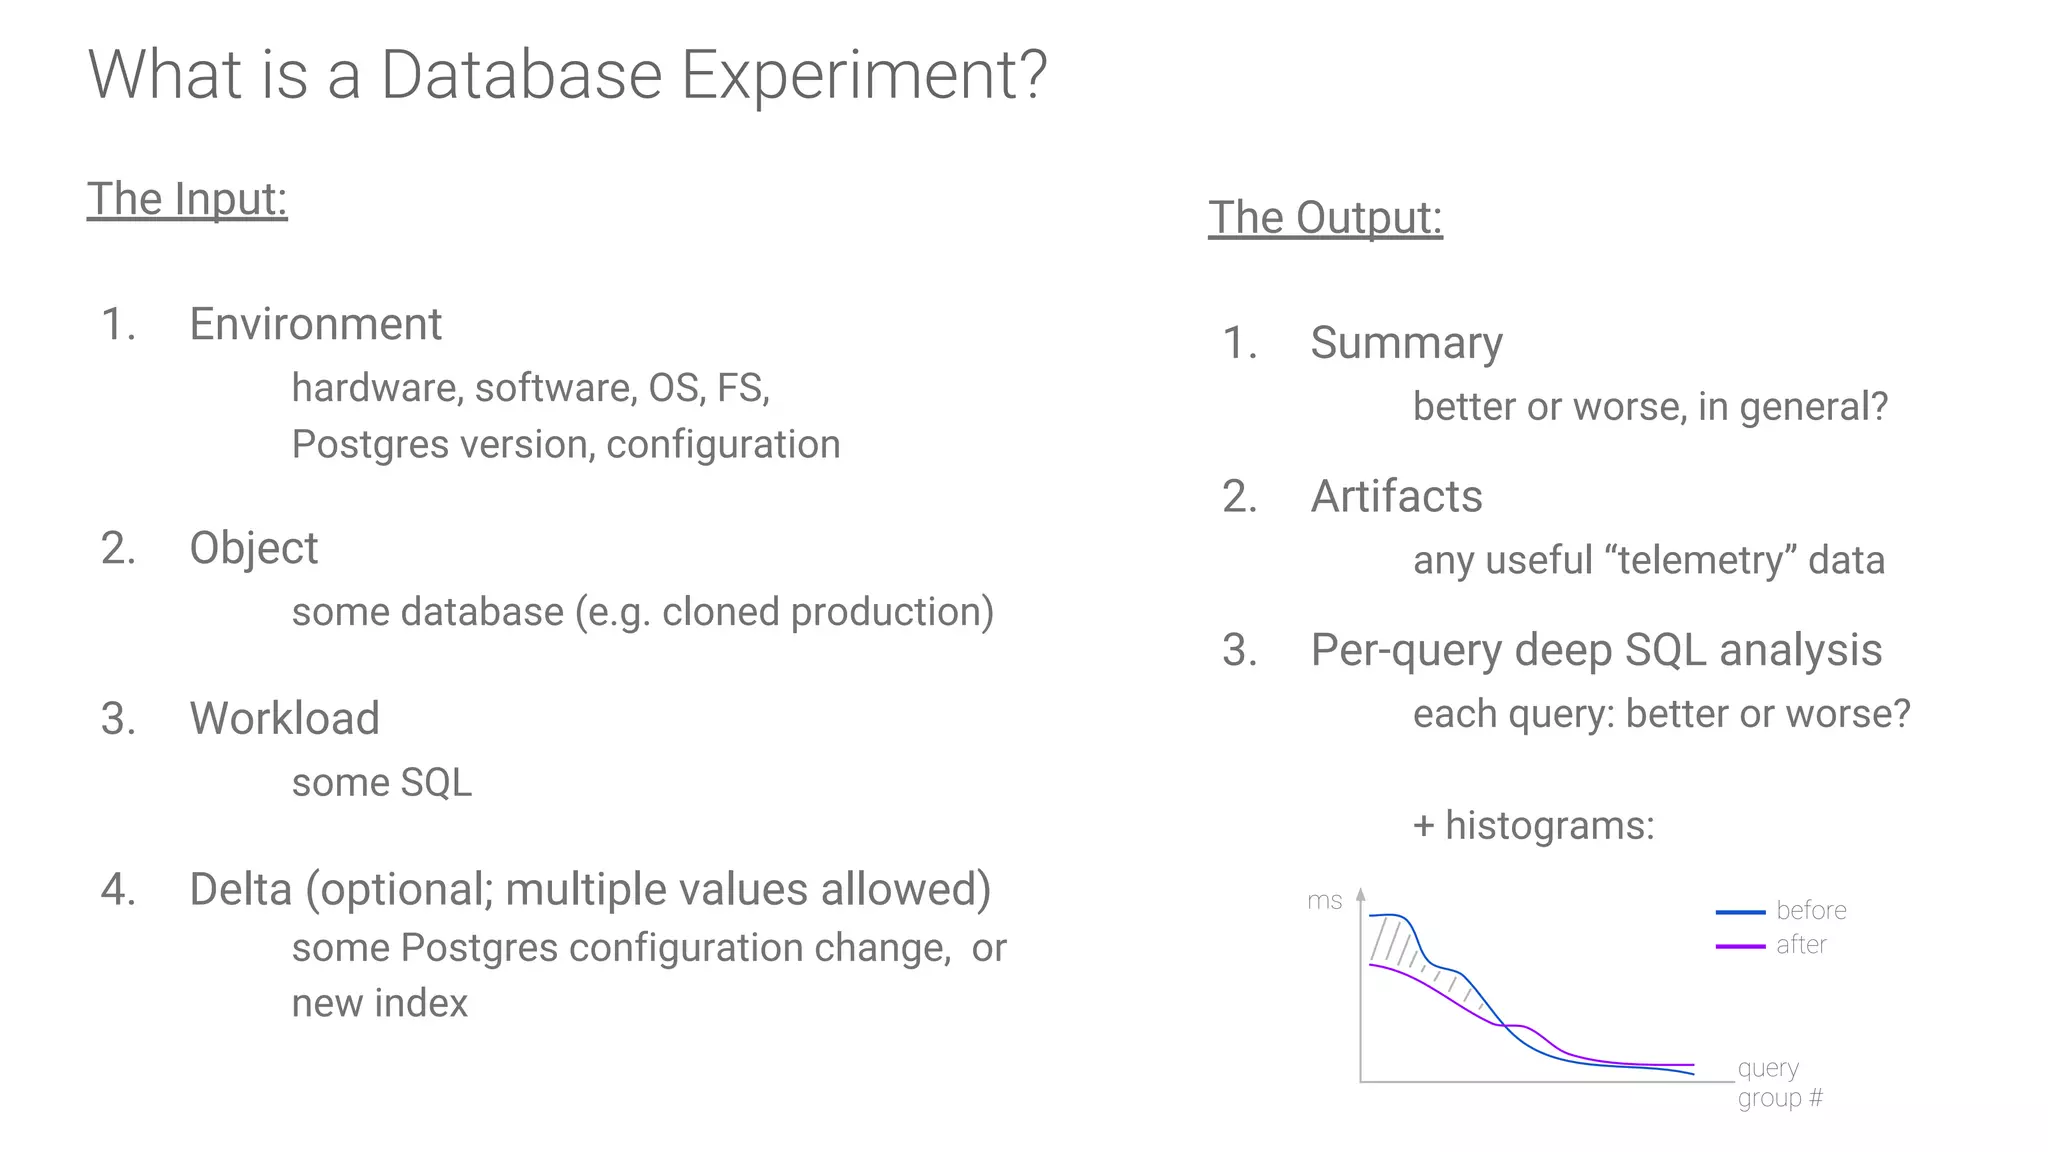
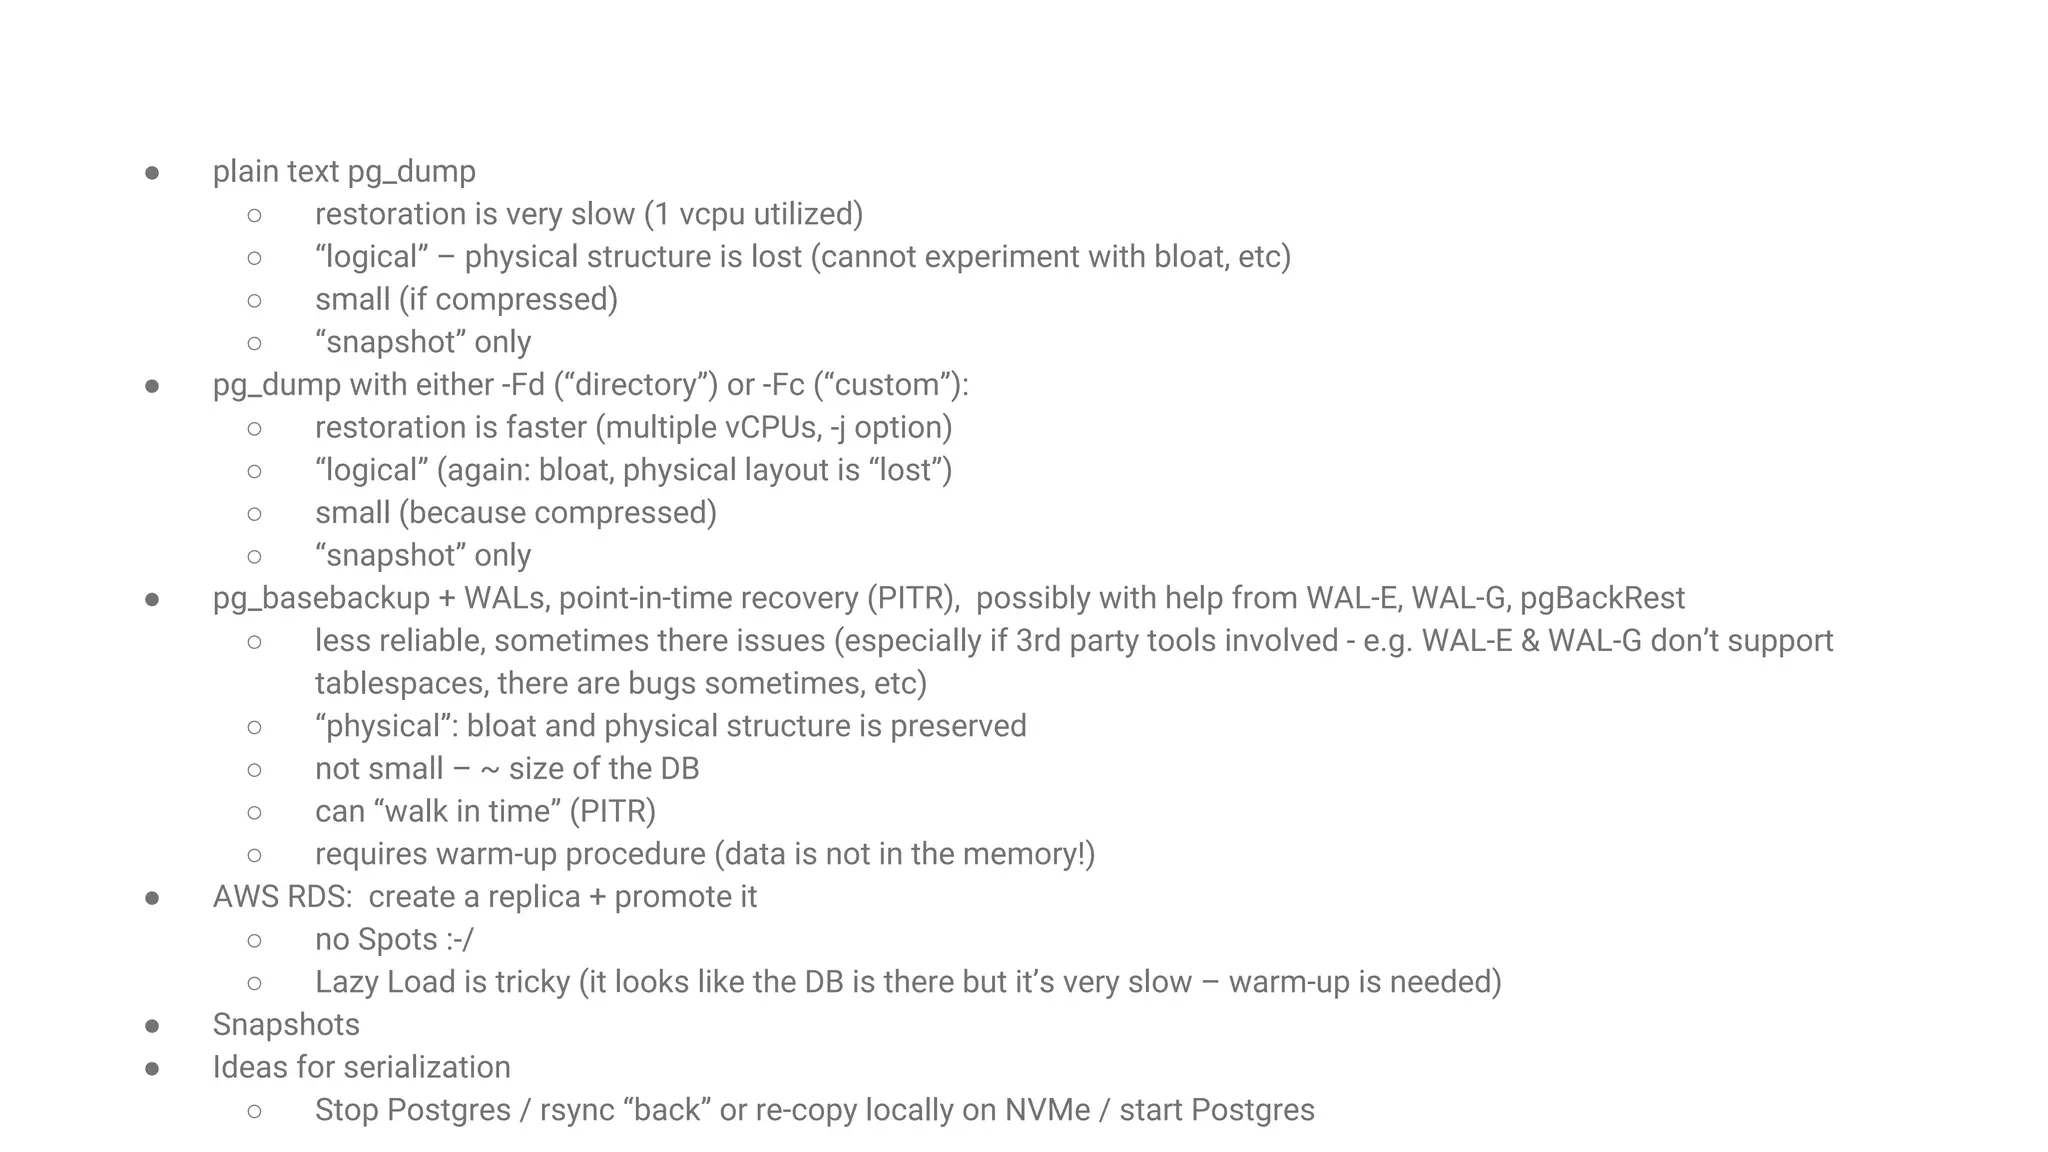
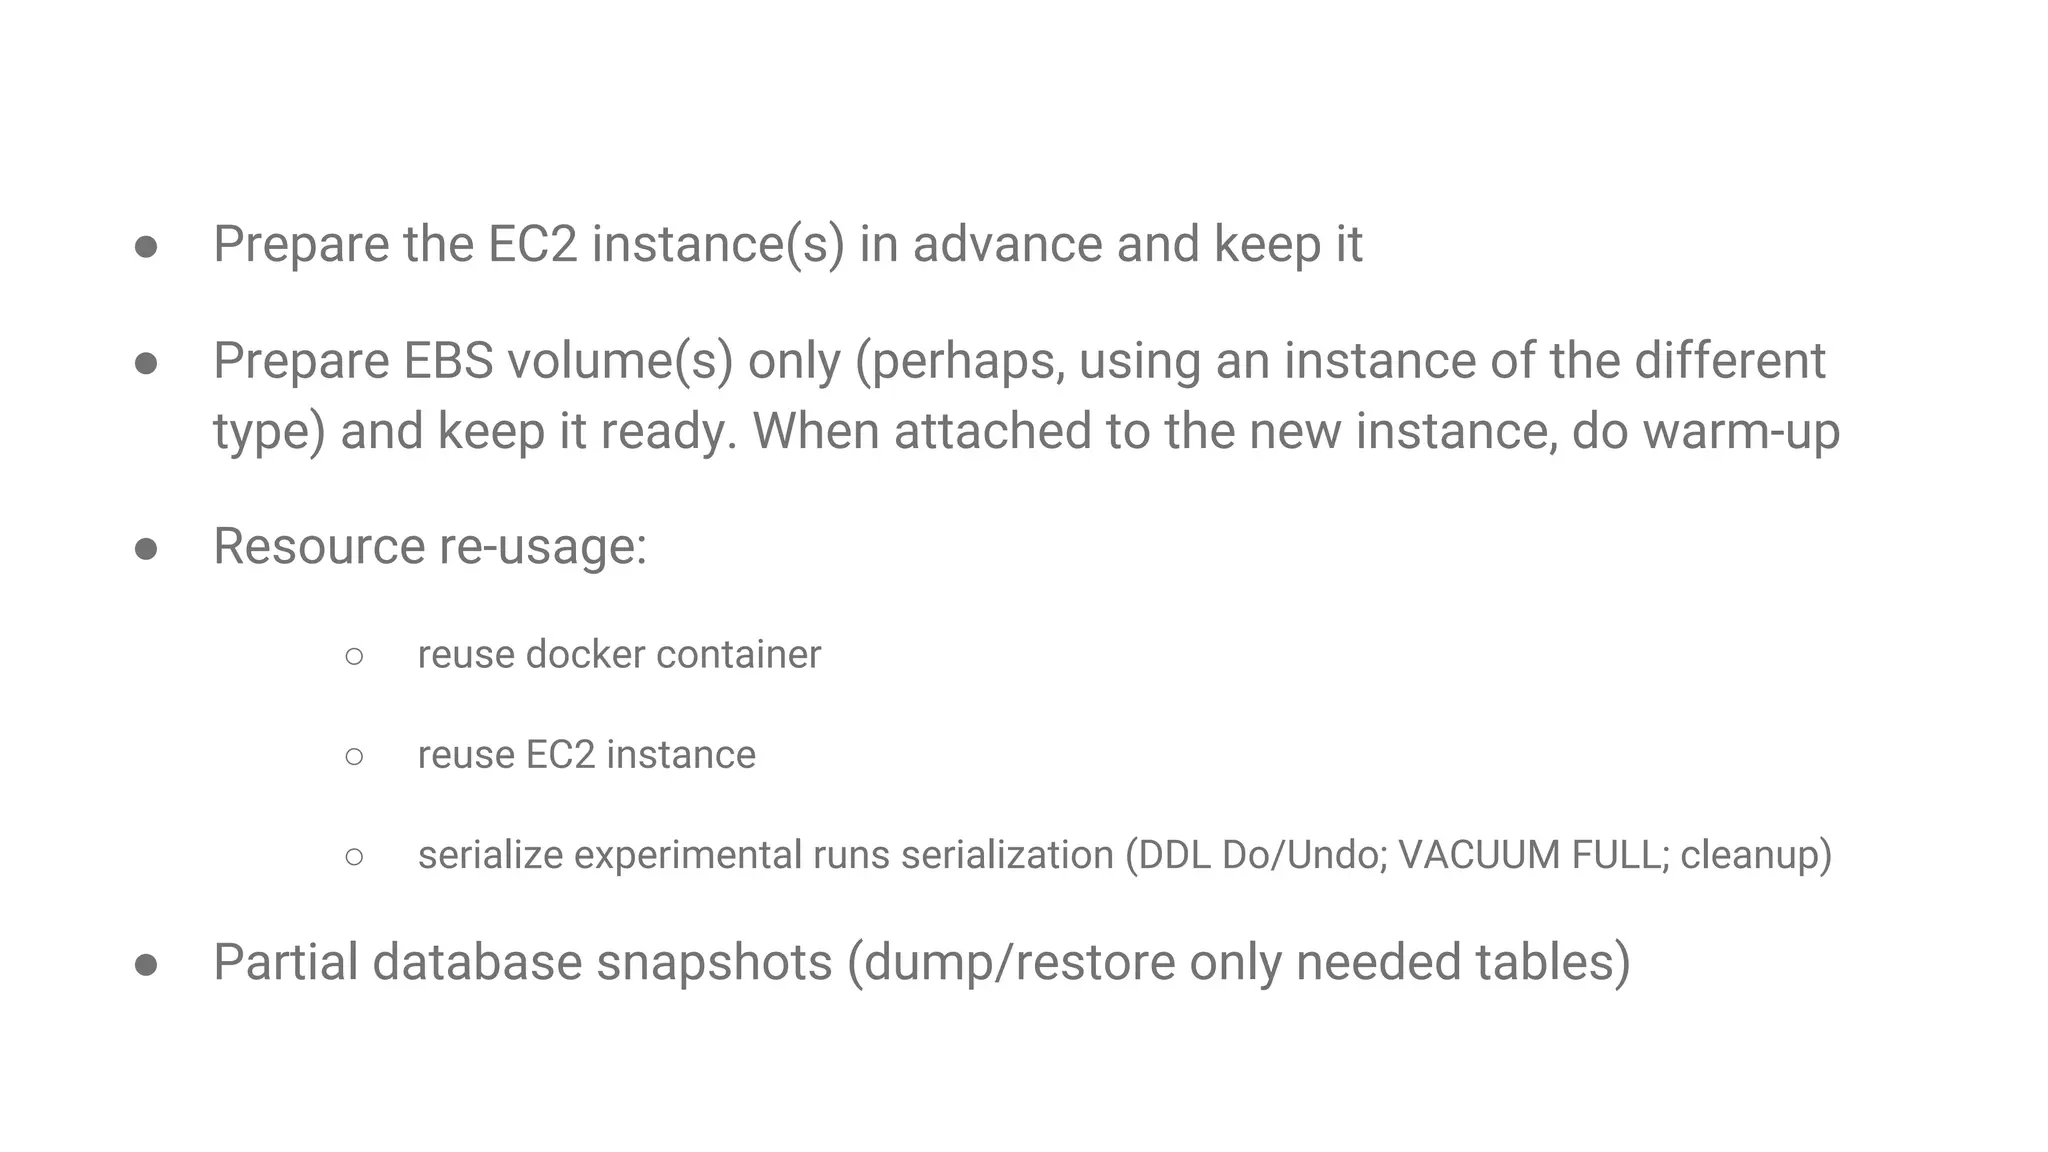
Components and structure of a database experiment, detailing input requirements like environment, object, workload, and delta.
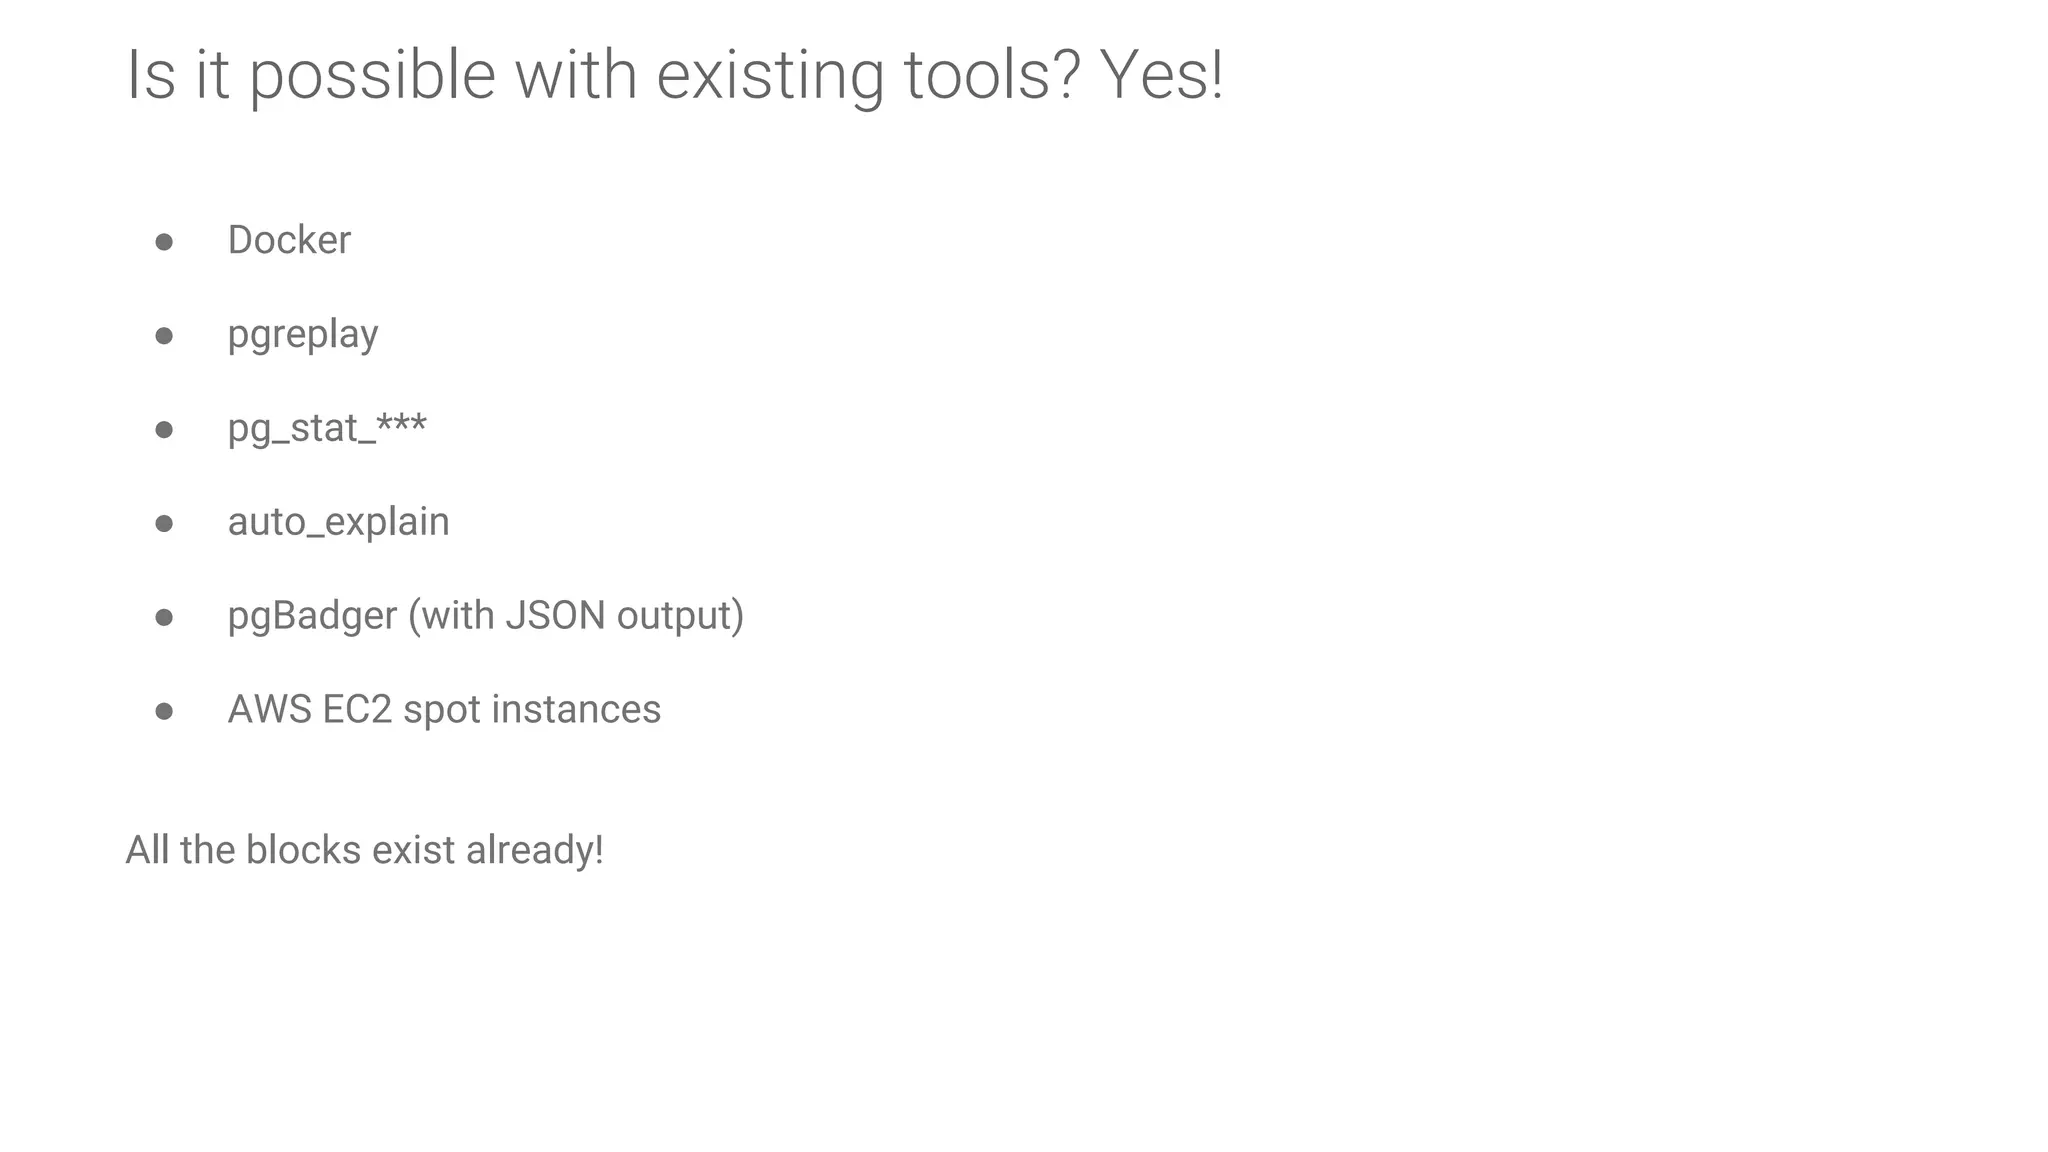
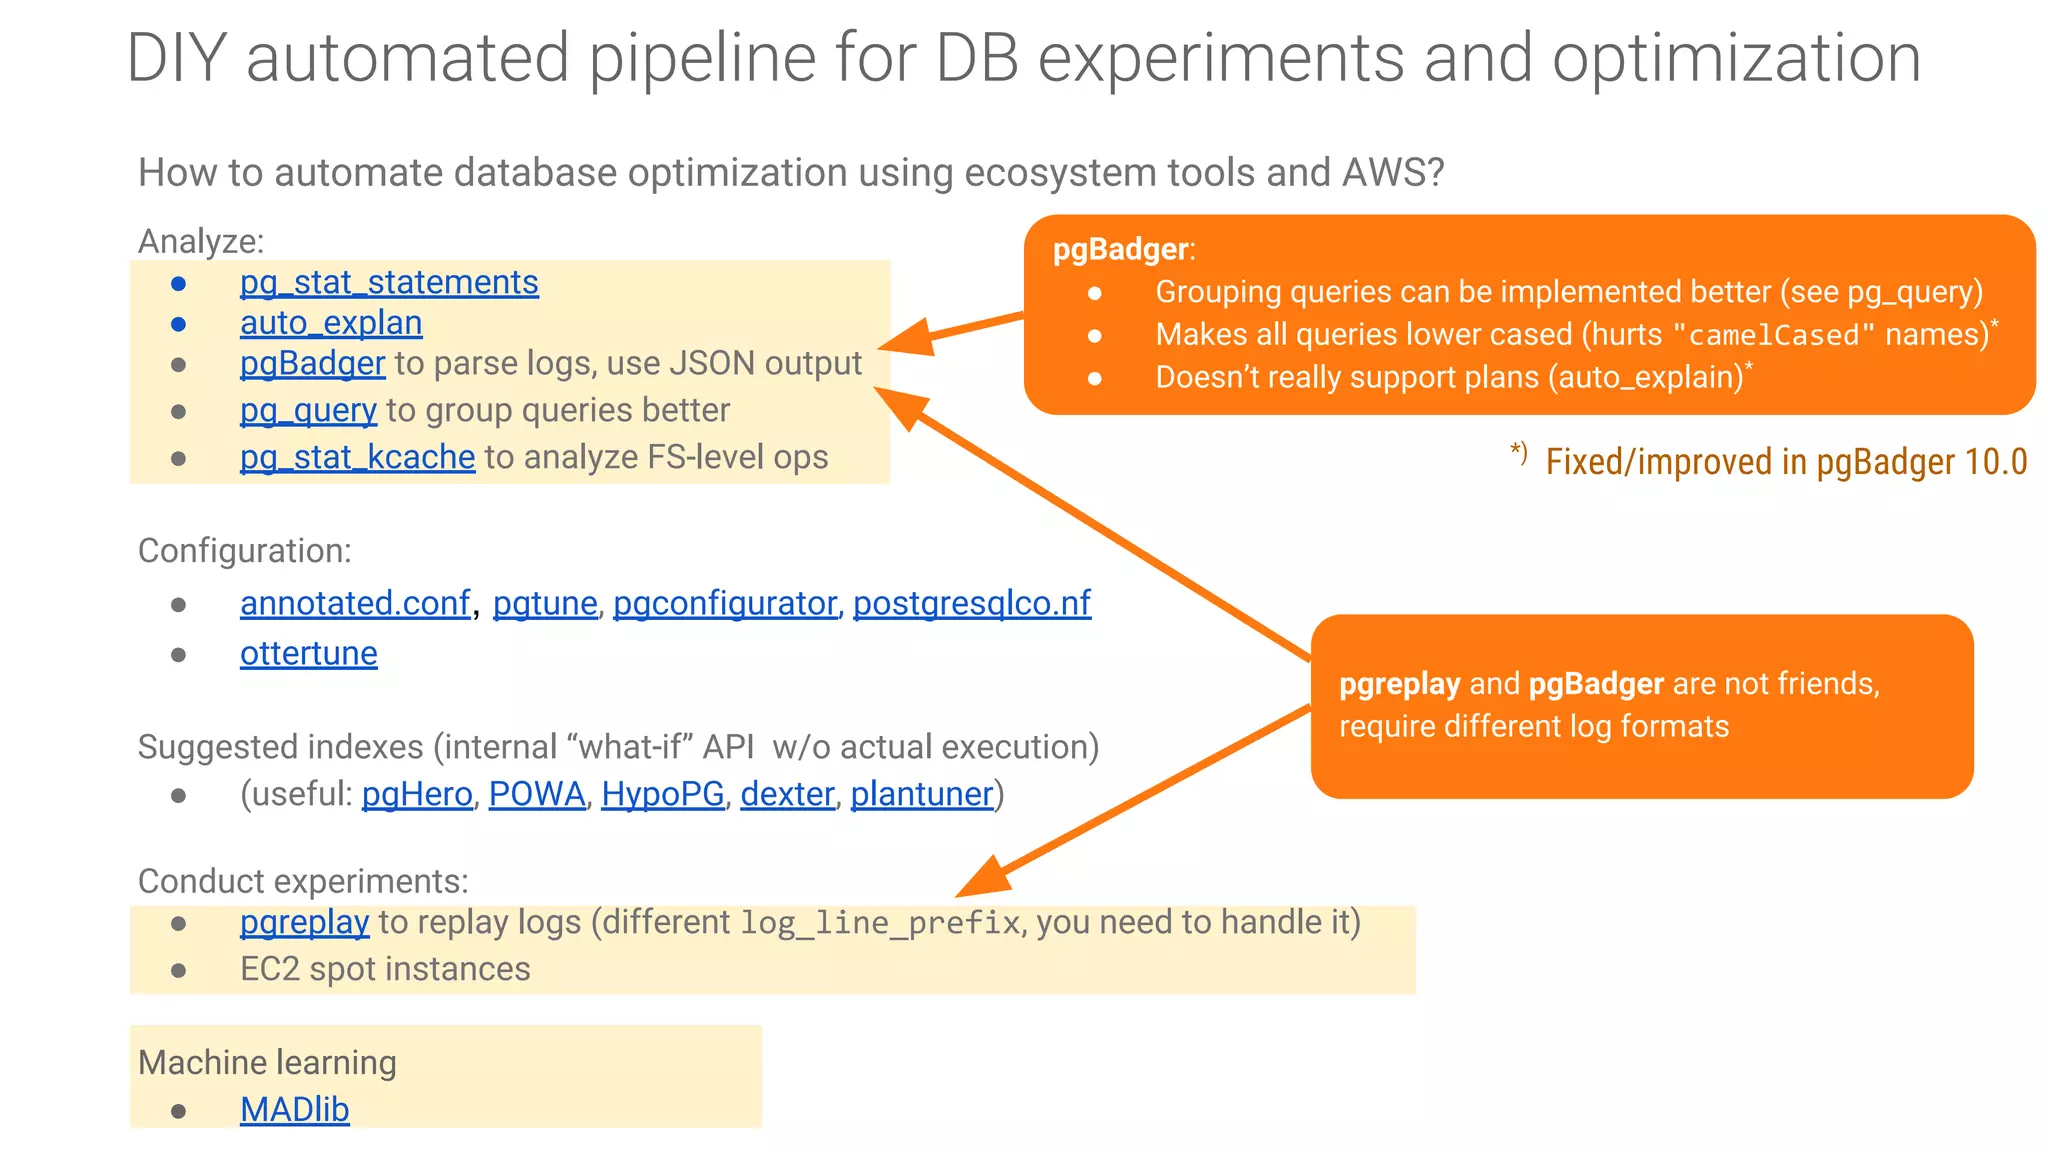
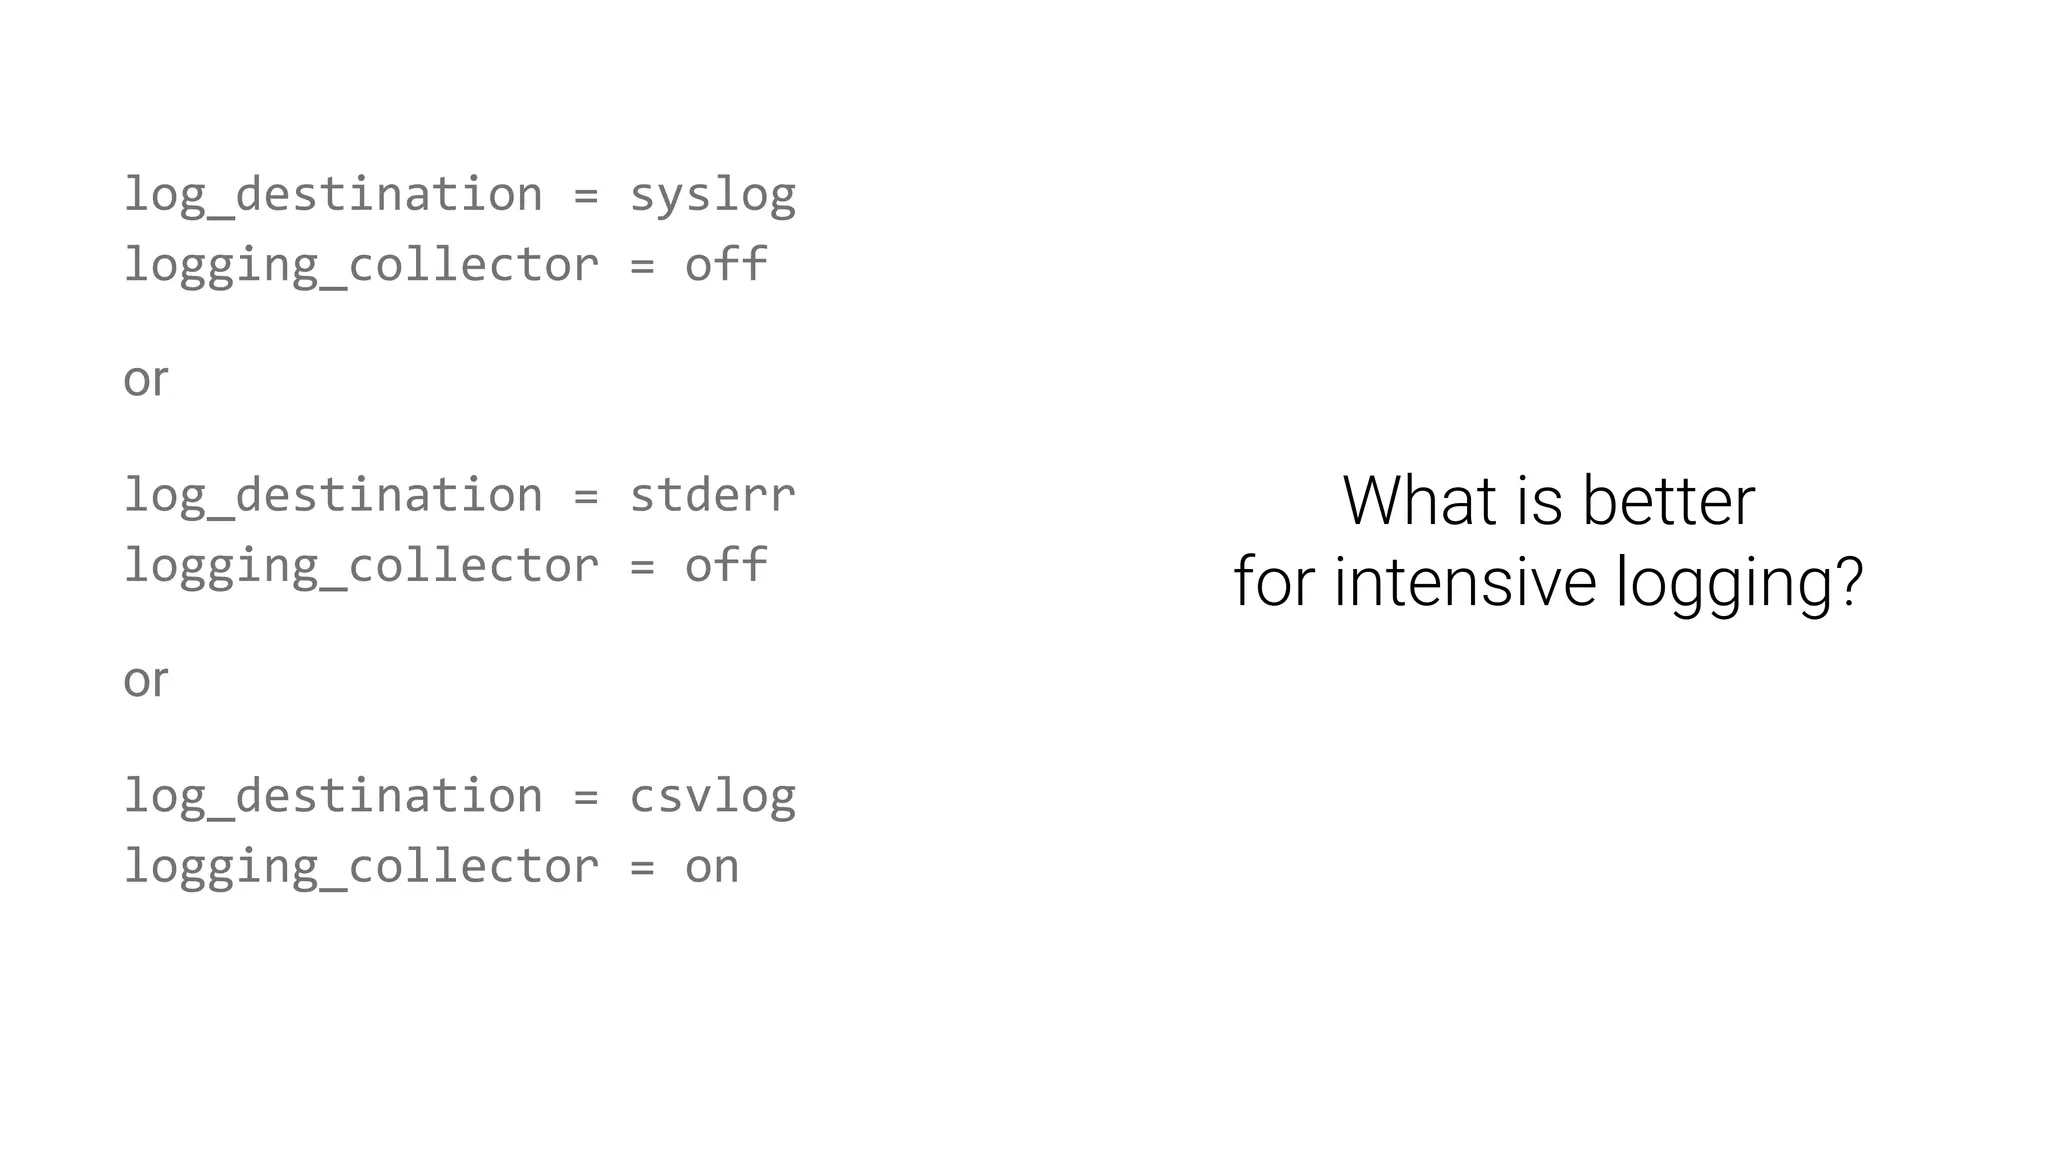
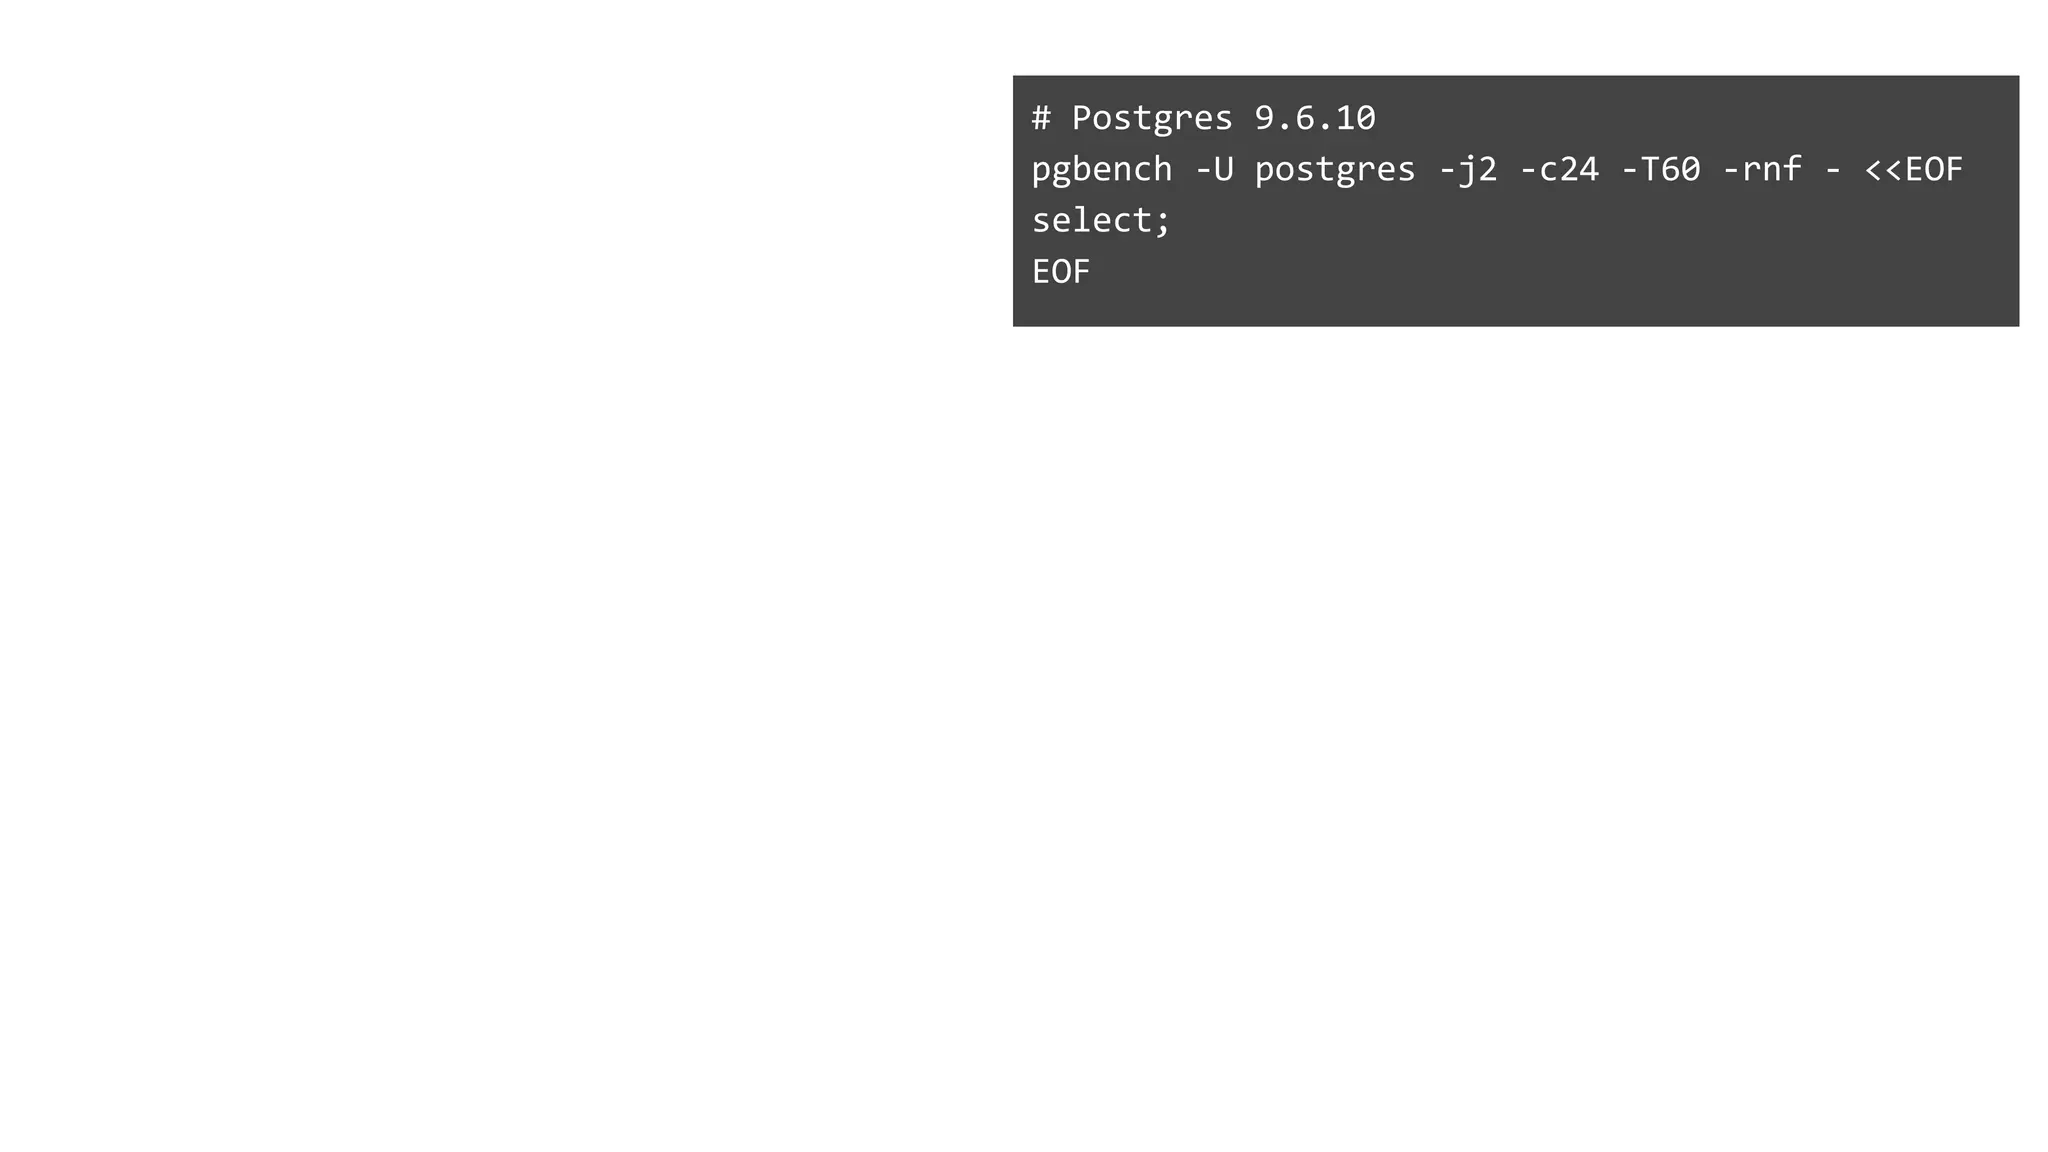
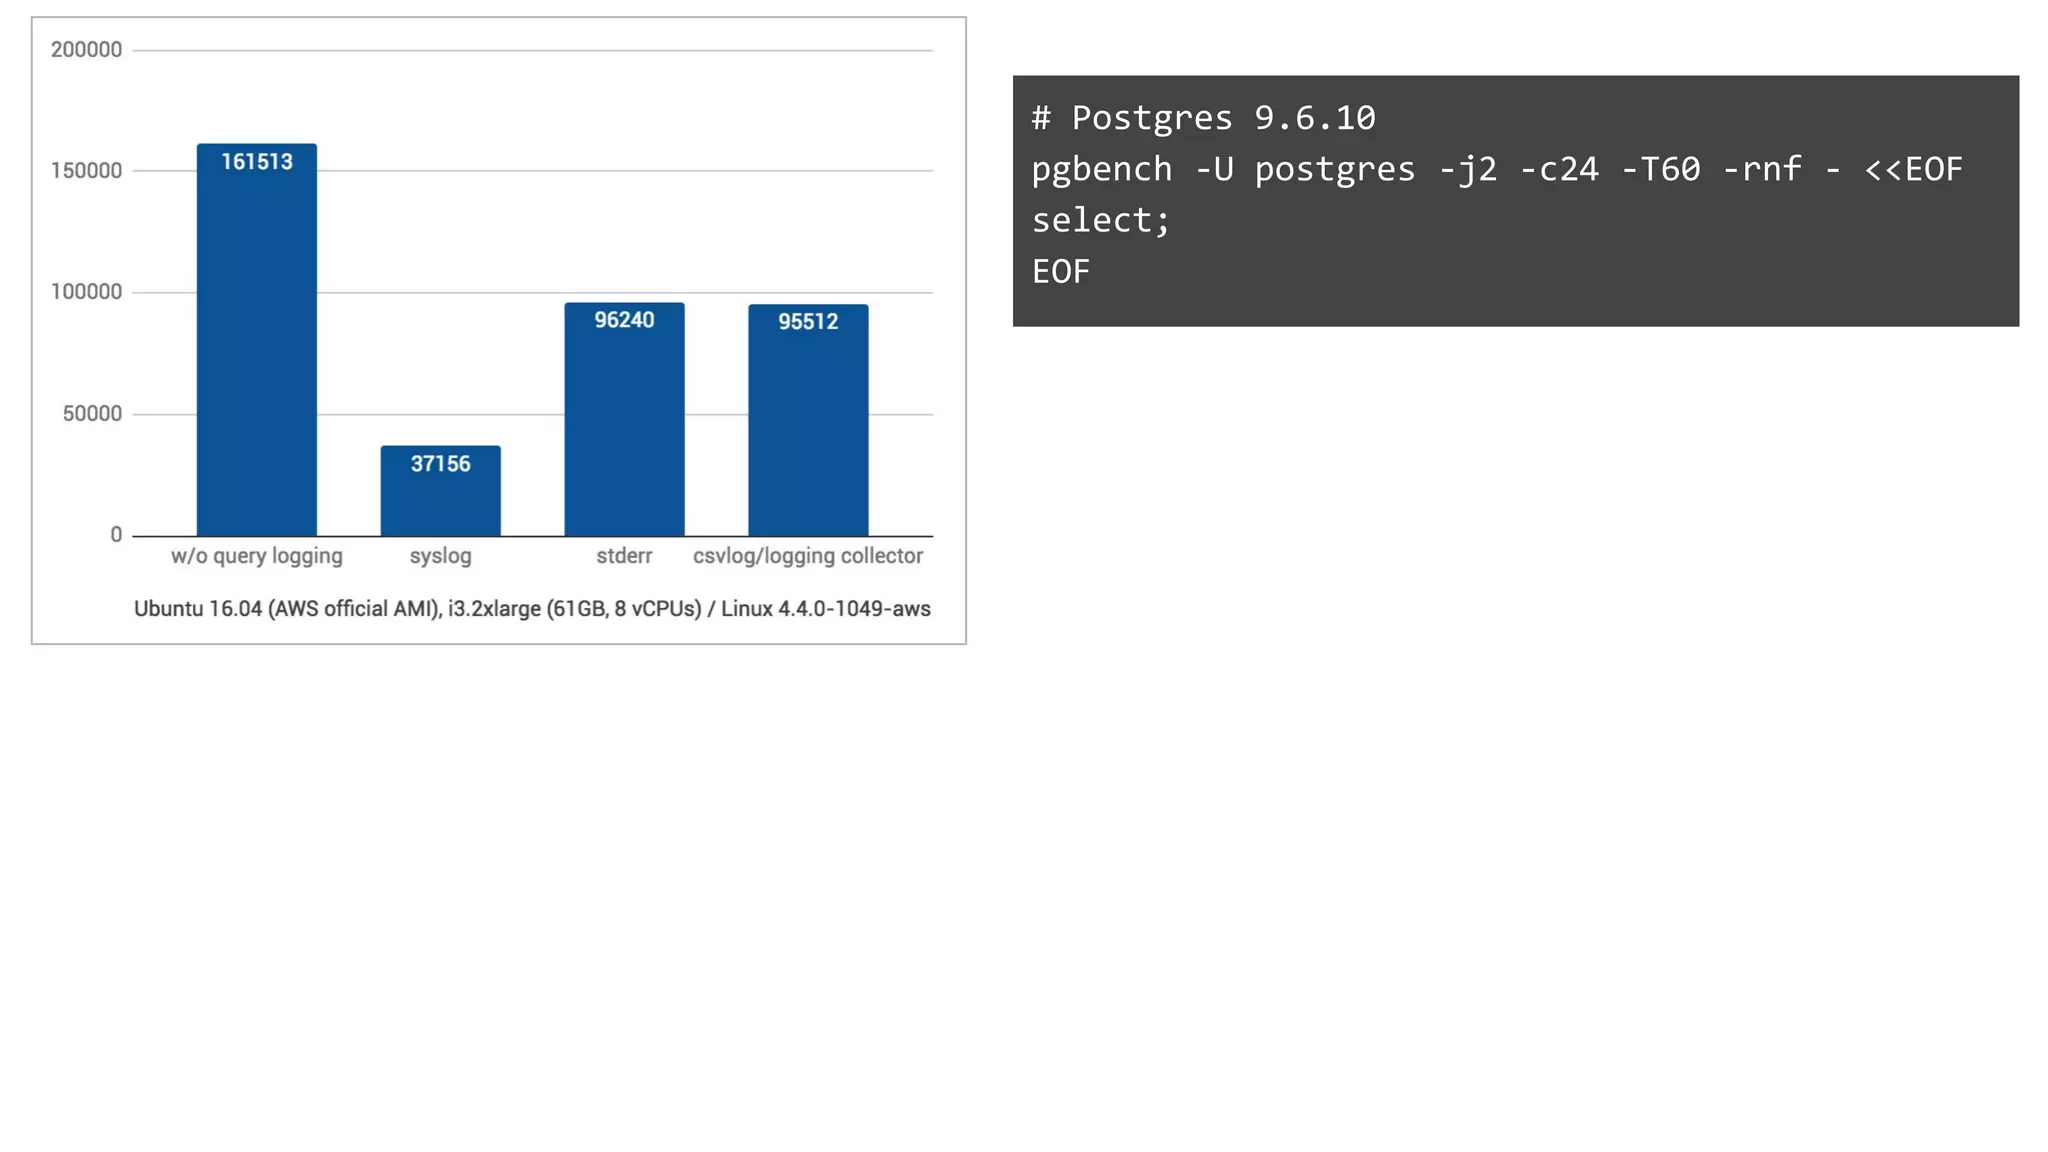
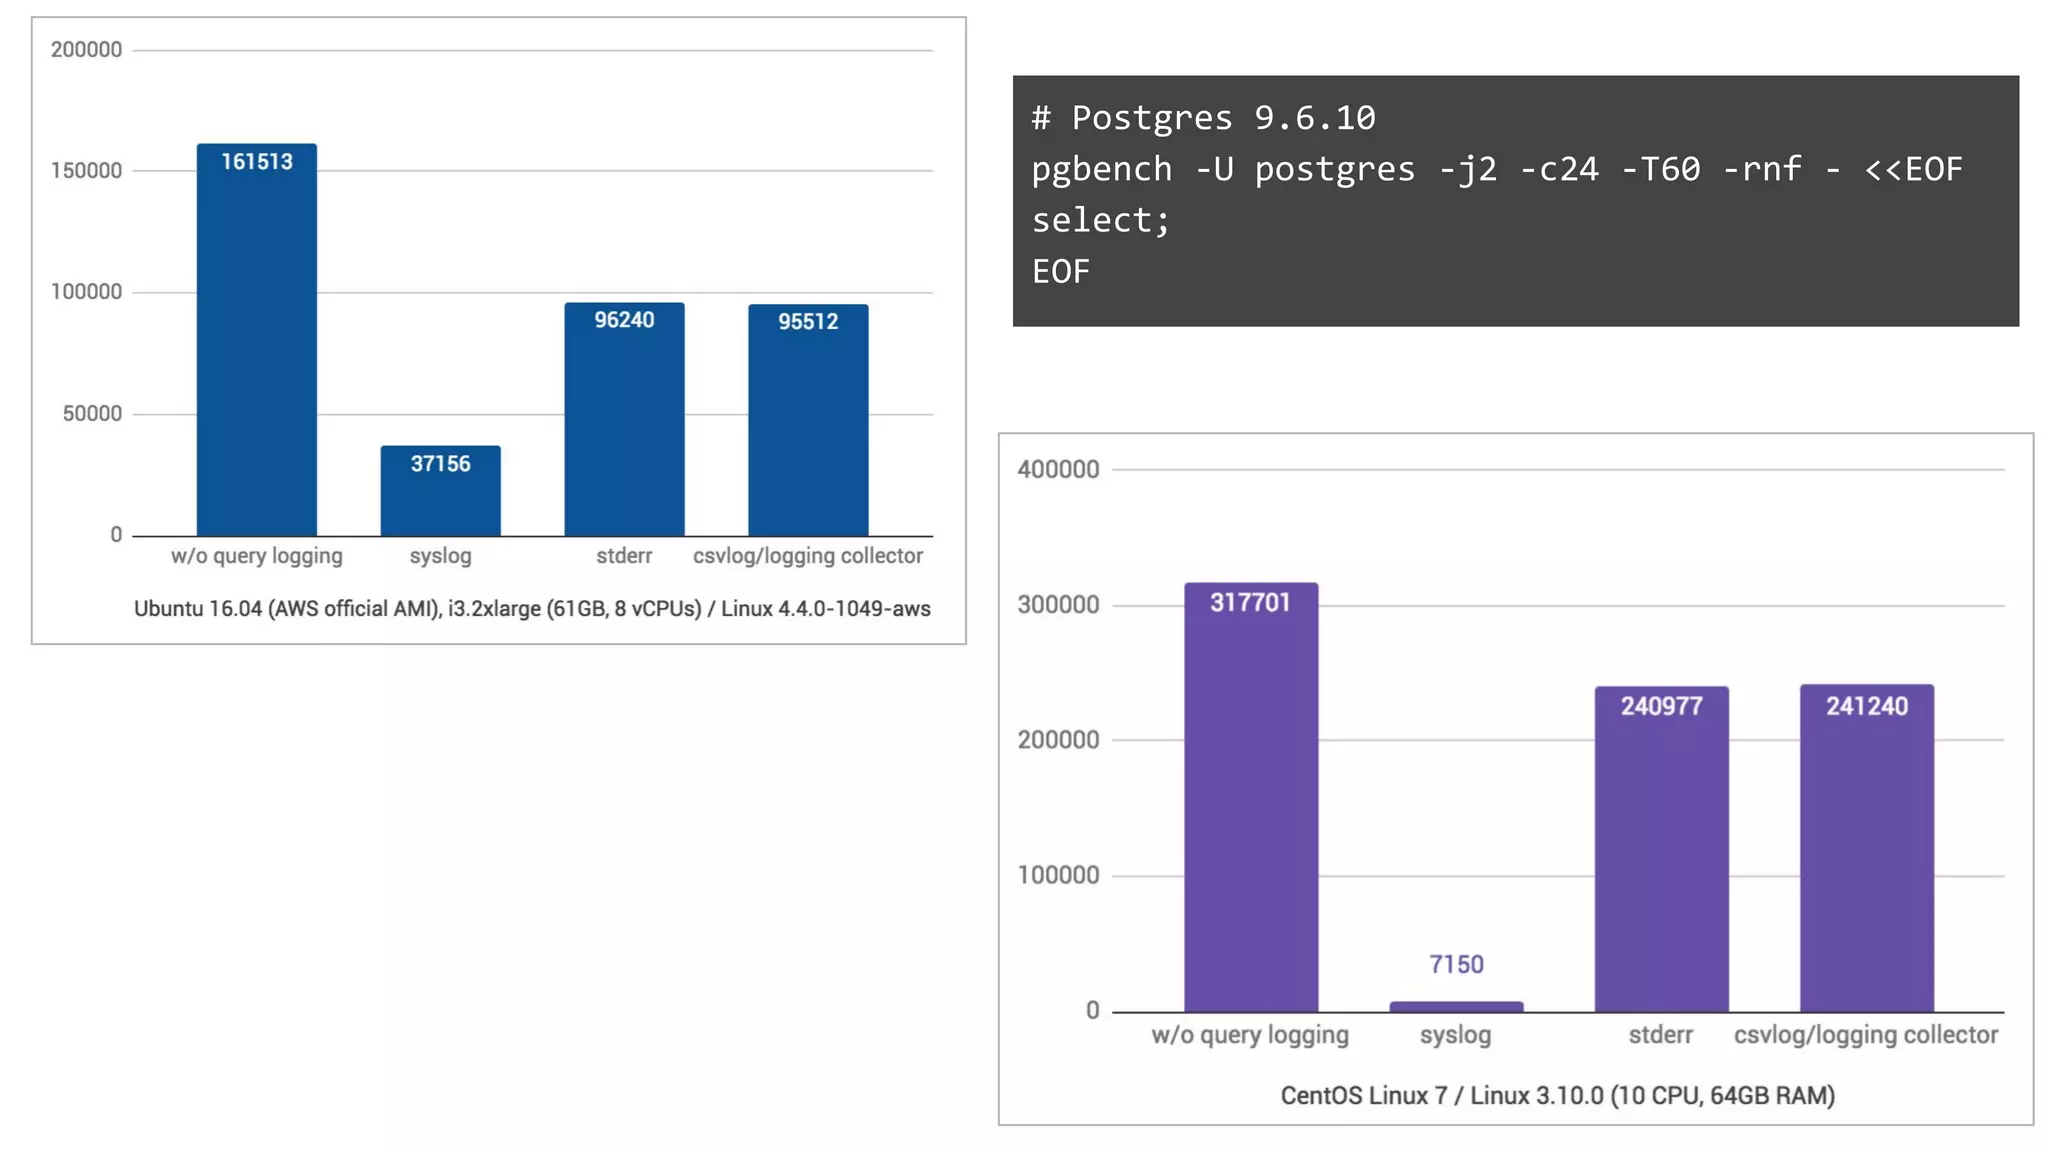
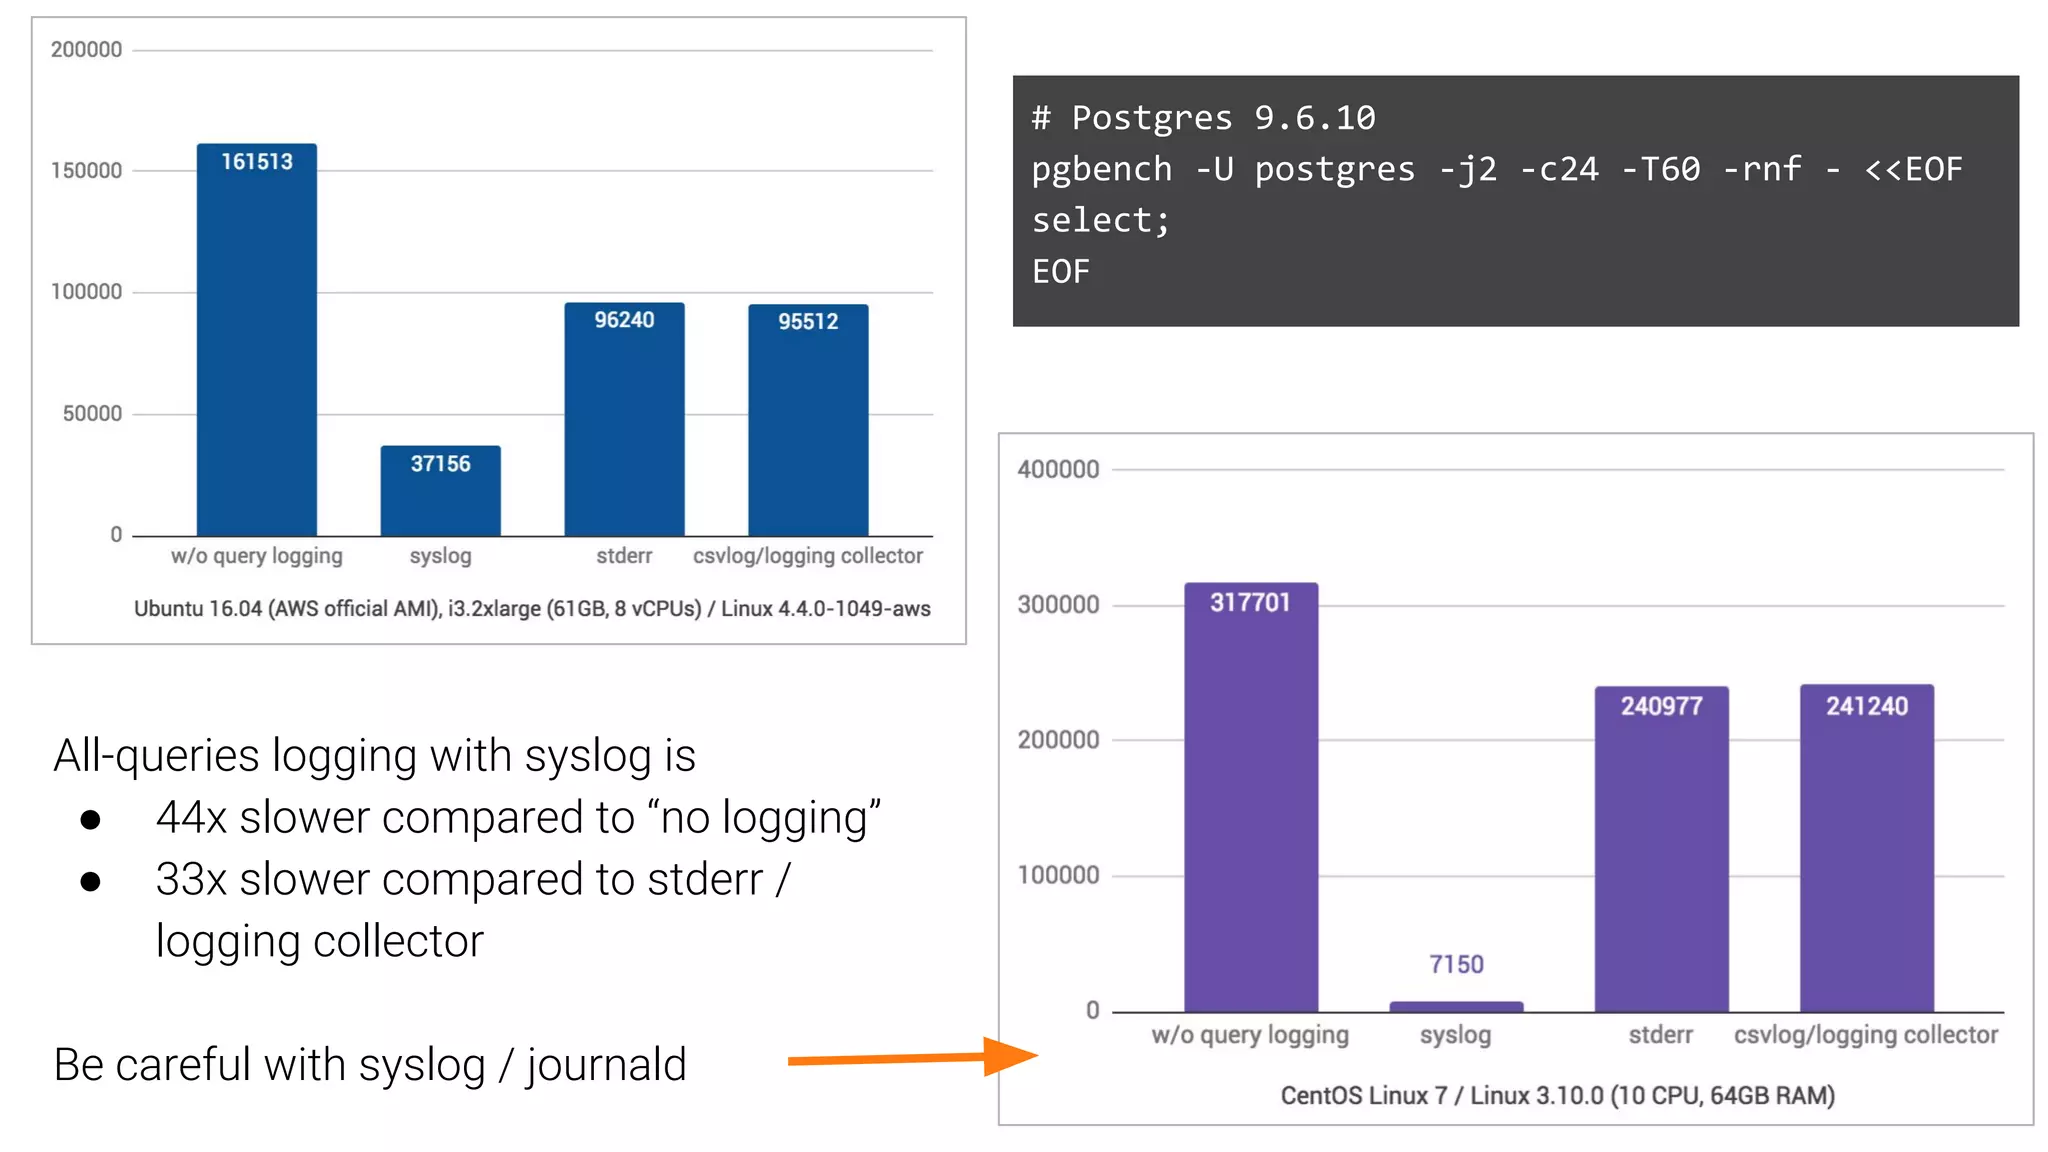
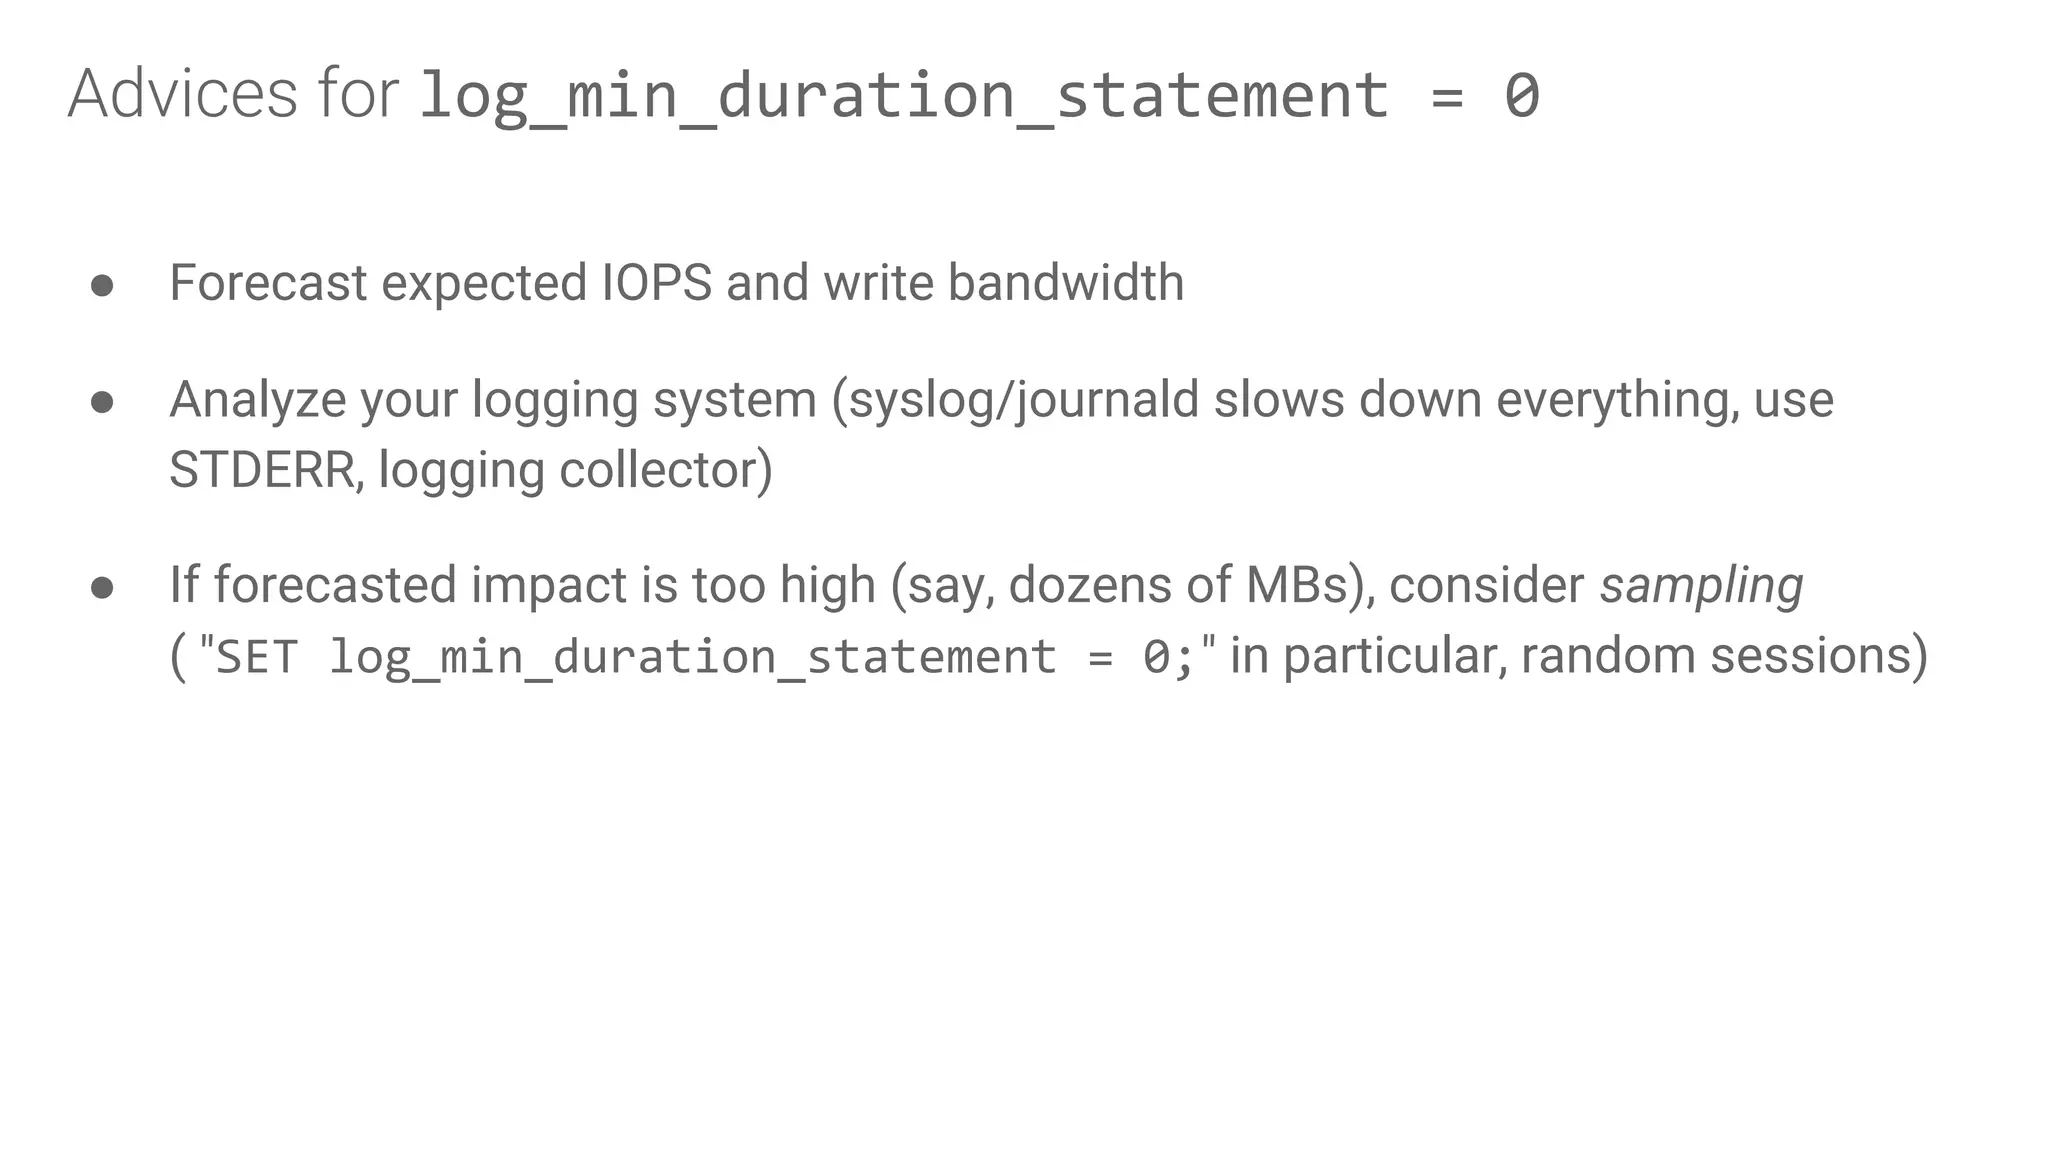
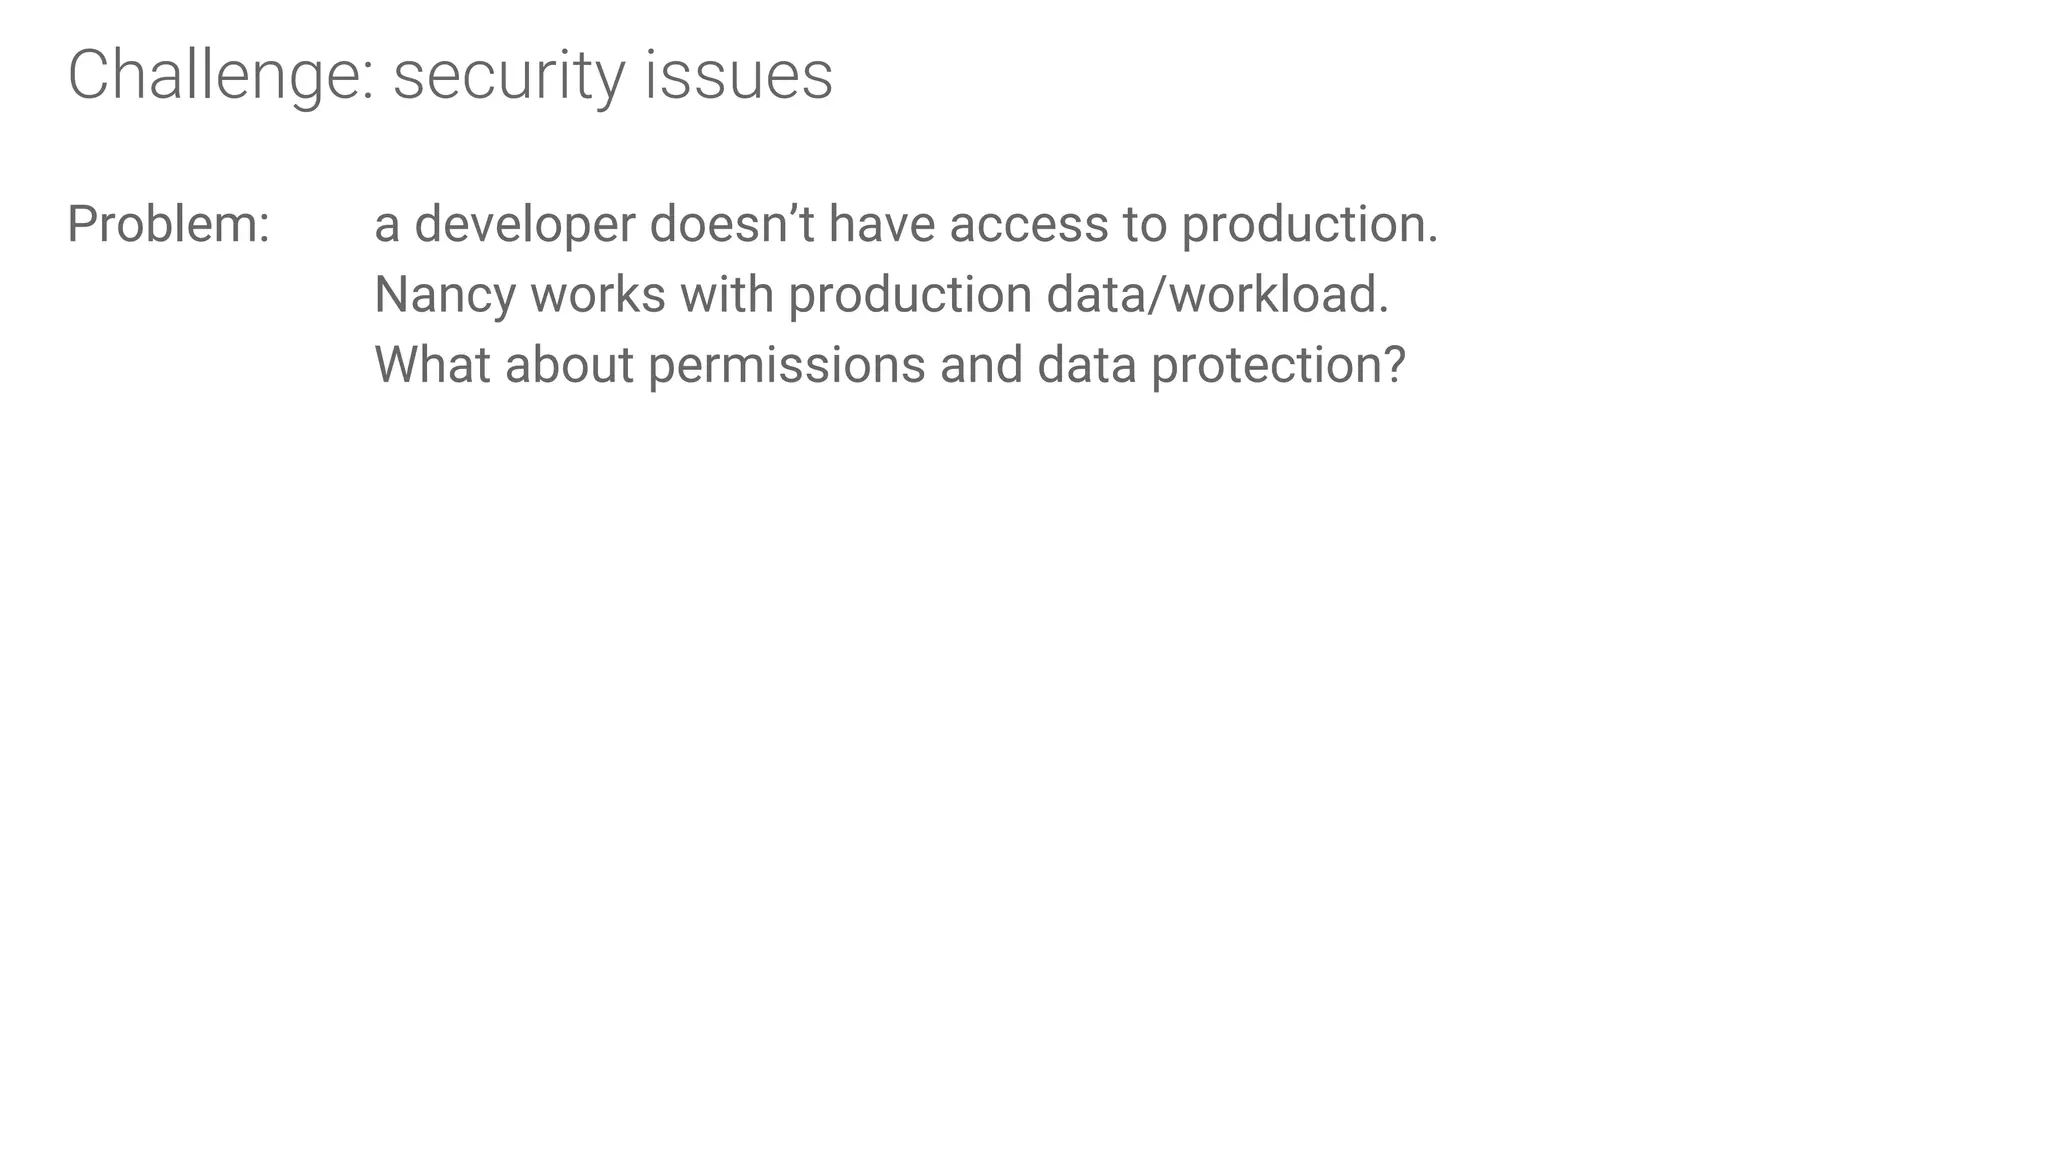
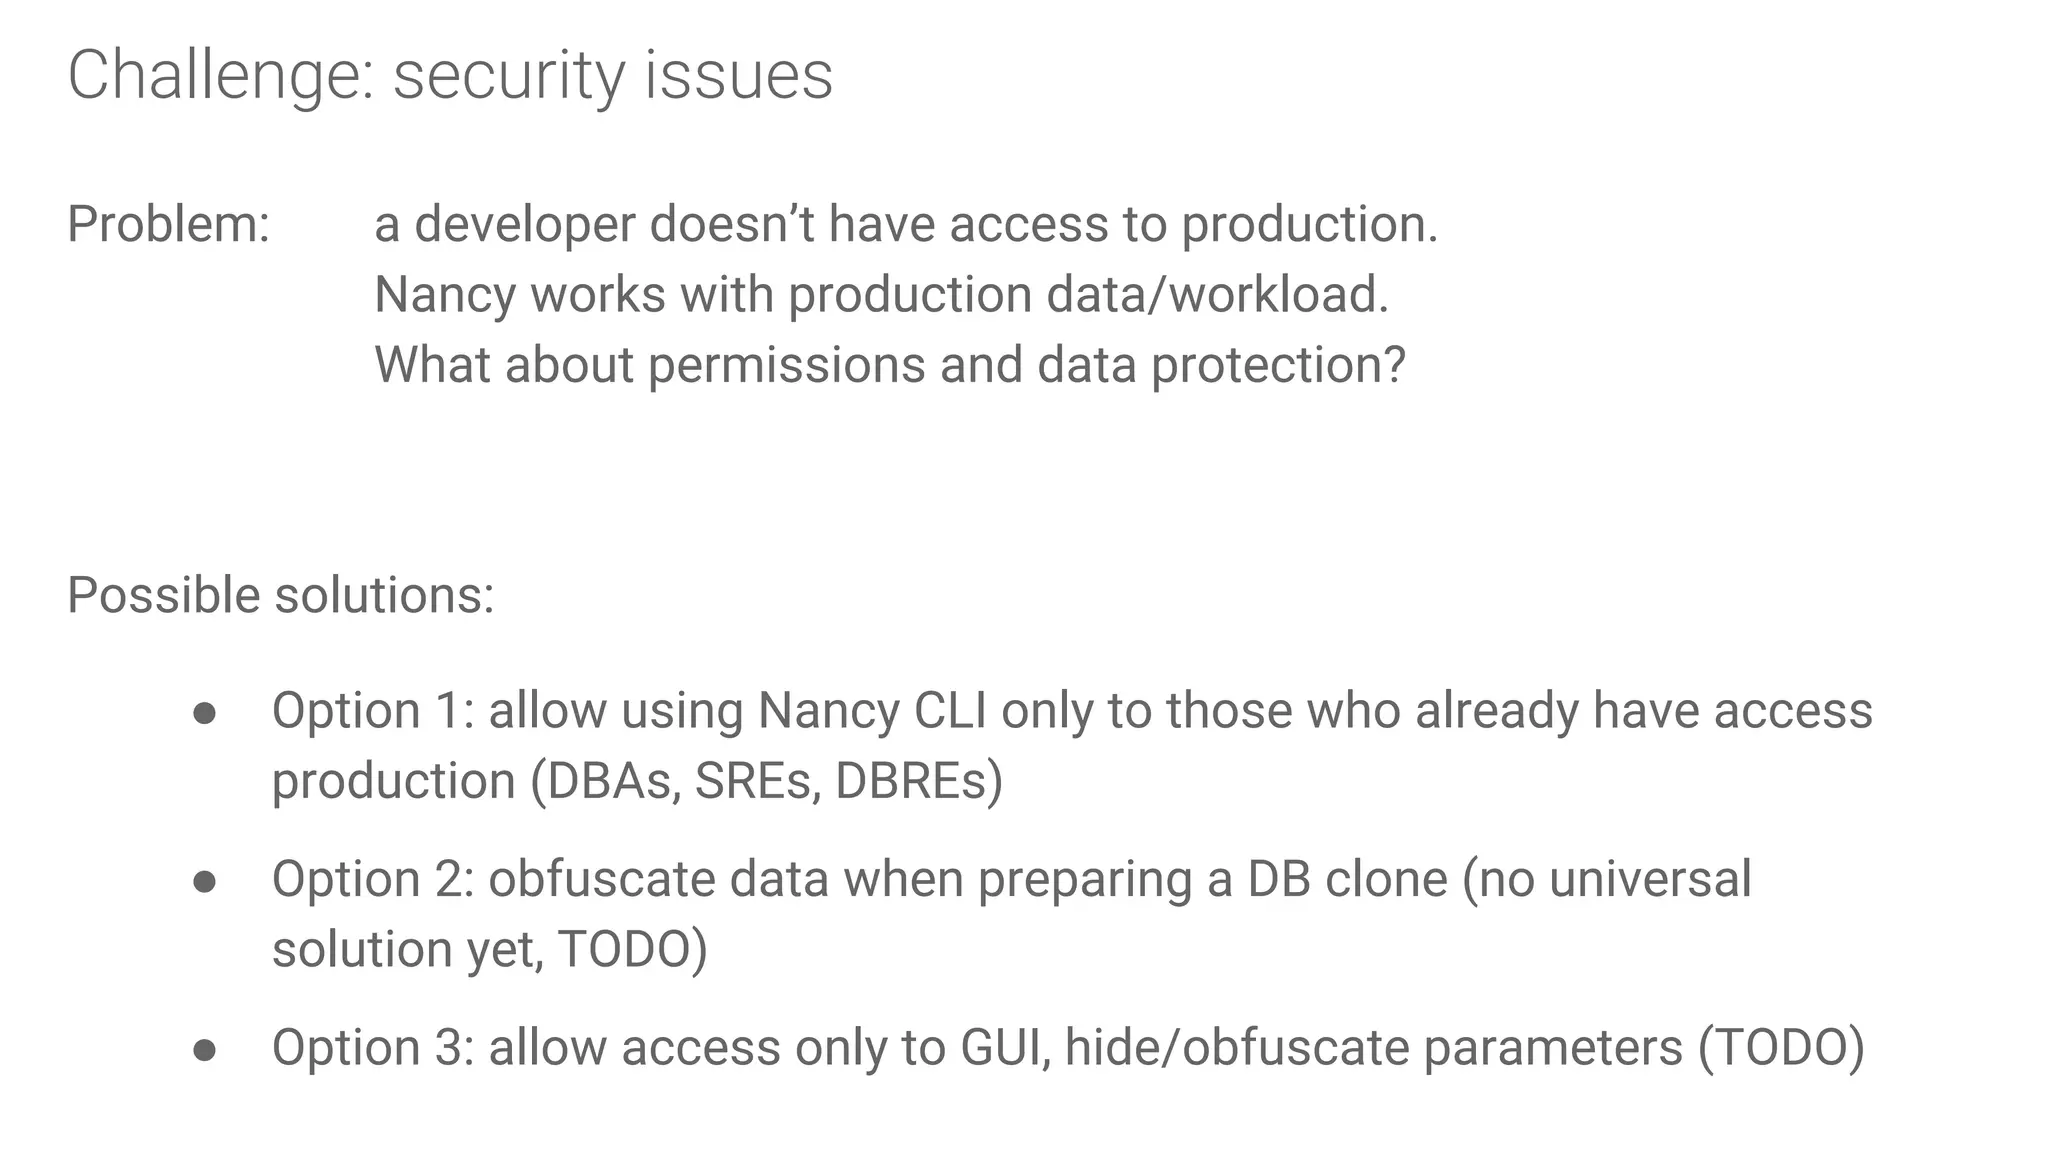
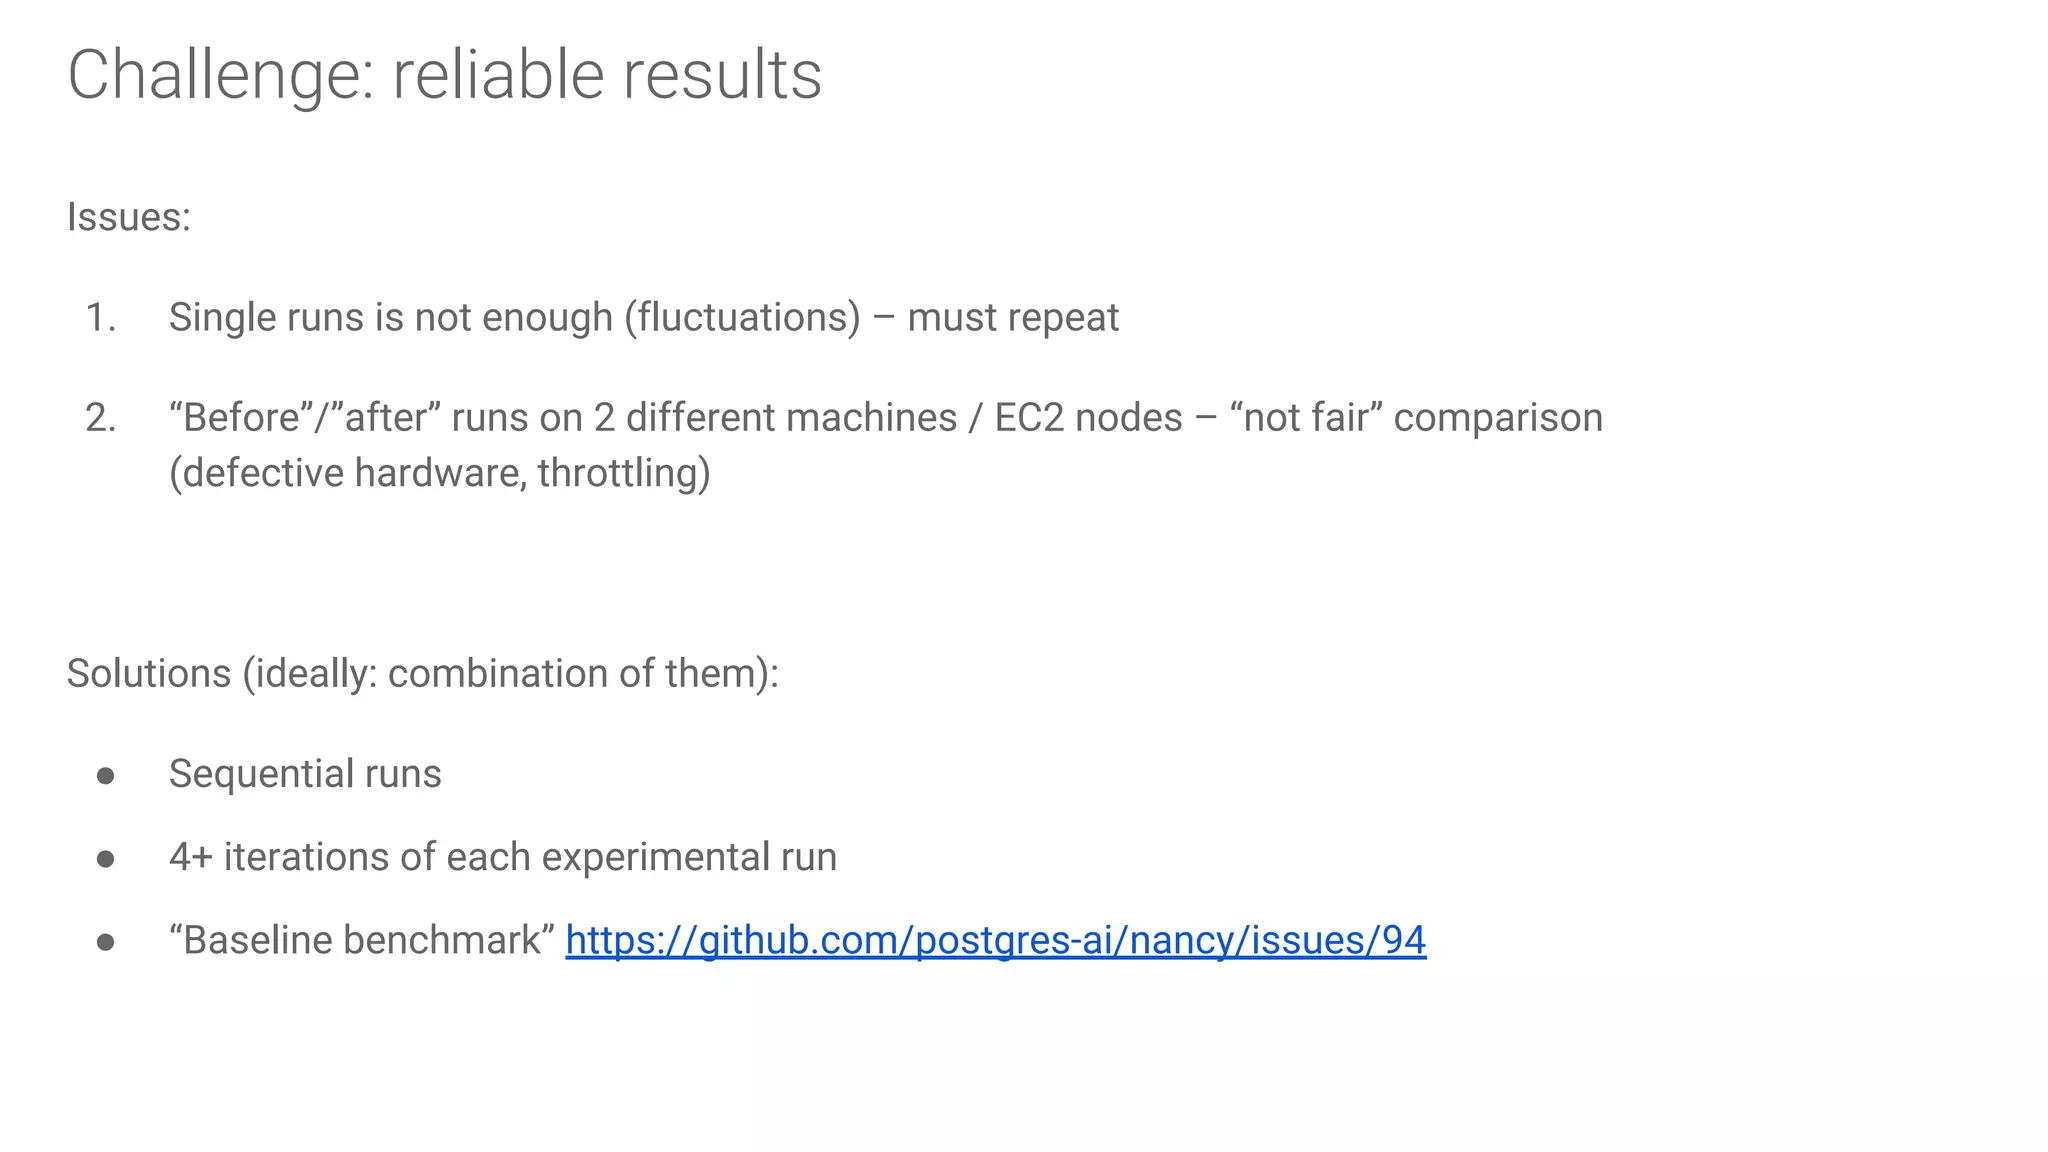
Discussion on leveraging pre-existing tools to facilitate database experimentation and automation, including their integration.Challenges faced in conducting experiments and managing databases effectively, including logging impacts and security concerns.


![[2C1] 아파치 피그를 위한 테즈 연산 엔진 개발하기 최종](https://cdn.slidesharecdn.com/ss_thumbnails/2b1-140929191628-phpapp01-thumbnail.jpg?width=640&height=640&fit=bounds)


![[2D1]Elasticsearch 성능 최적화](https://cdn.slidesharecdn.com/ss_thumbnails/2d1elasticsearch-140929192211-phpapp02-thumbnail.jpg?width=640&height=640&fit=bounds)
![[2C6]SQLite DB 의 입출력 특성분석 : Android 와 Tizen 사례](https://cdn.slidesharecdn.com/ss_thumbnails/2c6sqlitedb-androidtizen-140930021205-phpapp02-thumbnail.jpg?width=640&height=640&fit=bounds)


![[BDD 2025 - Full-Stack Development] PHP in AI Age: The Laravel Way. (Rizqy Hi...](https://cdn.slidesharecdn.com/ss_thumbnails/fs-phpinaiagethelaravelway-251125012602-ef9d330e-thumbnail.jpg?width=640&height=640&fit=bounds)


![[DevFest Strasbourg 2025] - NodeJs Can do that !!](https://cdn.slidesharecdn.com/ss_thumbnails/devfeststrasbourg2025-nodejscandothat-251127142731-da65b6fd-thumbnail.jpg?width=640&height=640&fit=bounds)


![[BDD 2025 - Artificial Intelligence] AI for the Underdogs: Innovation for Sma...](https://cdn.slidesharecdn.com/ss_thumbnails/ai-aifortheunderdogsinnovationforsmallbusinesses-251124030839-72a599a4-thumbnail.jpg?width=640&height=640&fit=bounds)