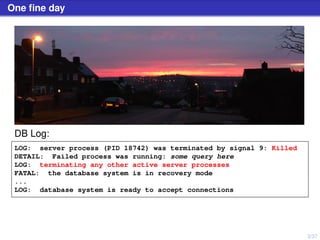
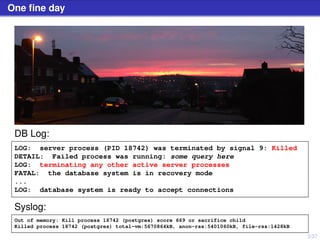
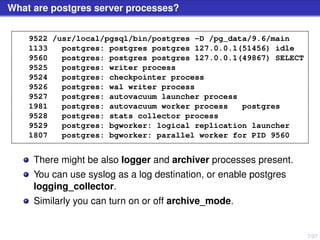
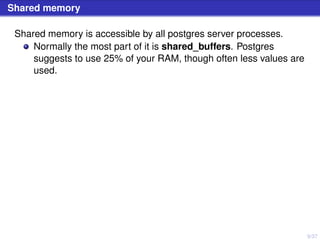
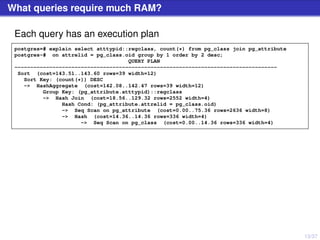
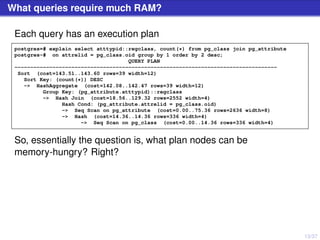
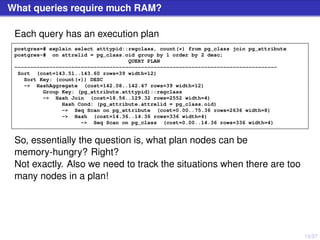
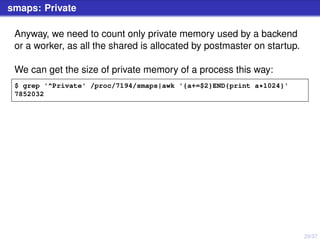
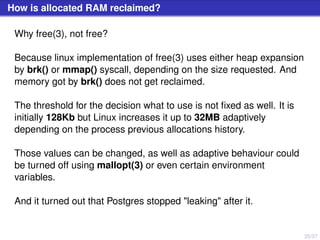
In 40 minutes the audience will learn a variety of ways to make postgresql database suddenly go out of memory on a box with half a terabyte of RAM.
Developer's and DBA's best practices for preventing this will also be discussed, as well as a bit of Postgres and Linux memory management internals.
The paperback version is available on lulu.com there http://goo.gl/fraa8o
This is the first volume of the postgresql database administration book. The book covers the steps for installing, configuring and administering a PostgreSQL 9.3 on Linux debian. The book covers the logical and physical aspect of PostgreSQL. Two chapters are dedicated to the backup/restore topic.
This ppt was used by Devrim at pgDay Asia 2017. He talked about some important facts about WAL - Transaction Logs or xlogs in PostgreSQL. Some of these can really come handy on a bad day
This presentation covers a number of the way that you can tune PostgreSQL to better handle high write workloads. We will cover both application and database tuning methods as each type can have substantial benefits but can also interact in unexpected ways when you are operating at scale. On the application side we will look at write batching, use of GUID's, general index structure, the cost of additional indexes and impact of working set size. For the database we will see how wal compression, auto vacuum and checkpoint settings as well as a number of other configuration parameters can greatly affect the write performance of your database and application.
Spencer Christensen
There are many aspects to managing an RDBMS. Some of these are handled by an experienced DBA, but there are a good many things that any sys admin should be able to take care of if they know what to look for.
This presentation will cover basics of managing Postgres, including creating database clusters, overview of configuration, and logging. We will also look at tools to help monitor Postgres and keep an eye on what is going on. Some of the tools we will review are:
* pgtop
* pg_top
* pgfouine
* check_postgres.pl.
Check_postgres.pl is a great tool that can plug into your Nagios or Cacti monitoring systems, giving you even better visibility into your databases.
This presentation covers all aspects of PostgreSQL administration, including installation, security, file structure, configuration, reporting, backup, daily maintenance, monitoring activity, disk space computations, and disaster recovery. It shows how to control host connectivity, configure the server, find the query being run by each session, and find the disk space used by each database.
All about Zookeeper and ClickHouse Keeper.pdfAltinity Ltd
ClickHouse clusters depend on ZooKeeper to handle replication and distributed DDL commands. In this Altinity webinar, we’ll explain why ZooKeeper is necessary, how it works, and introduce the new built-in replacement named ClickHouse Keeper. You’ll learn practical tips to care for ZooKeeper in sickness and health. You’ll also learn how/when to use ClickHouse Keeper. We will share our recommendations for keeping that happy as well.
In-memory OLTP storage with persistence and transaction supportAlexander Korotkov
Nowadays it becomes evident that single storage engine can't be "one size fits all". PostgreSQL community starts its movement towards pluggable storages. Significant restriction which is imposed in the current approach is compatibility. We consider pluggable storages to be compatible with (at least some) existing index access methods. That means we've long way to go, because we have to extend our index AMs before we can add corresponding features in the pluggable storages themselves.
In this talk we would like look this problem from another angle, and see what can we achieve if we try to make storage completely from scratch (using FDW interface for prototyping). Thus, we would show you a prototype of in-memory OLTP storage with transaction support and snapshot isolation. Internally it's implemented as index-organized table (B-tree) with undo log and optional persistence. That means it's quite different from what we have in PostgreSQL now.
The proved by benchmarks advantages of this in-memory storage are: better multicore scalability (thanks to no buffer manager), reduced bloat (thanks to undo log) and optimized IO (thank to logical WAL logging).
Presentation that I gave as a guest lecture for a summer intensive development course at nod coworking in Dallas, TX. The presentation targets beginning web developers with little, to no experience in databases, SQL, or PostgreSQL. I cover the creation of a database, creating records, reading/querying records, updating records, destroying records, joining tables, and a brief introduction to transactions.
PostgreSQL Replication High Availability MethodsMydbops
This slides illustrates the need for replication in PostgreSQL, why do you need a replication DB topology, terminologies, replication nodes and many more.
This presentation is for those who are familiar with databases and SQL, but want to learn how to move processing from their applications into the database to improve consistency, administration, and performance. Topics covered include advanced SQL features like referential integrity constraints, ANSI joins, views, rules, and triggers. The presentation also explains how to create server-side functions, operators, and custom data types in PostgreSQL.
Why PostgreSQL for Analytics Infrastructure (DW)?Huy Nguyen
Talk given at Grokking TechTalk 14 - Database Systems
Why starting out with Postgres for reporting/analytics database.
Huy Nguyen
CTO of Holistics.io - BI & Infrastructure SaaS.
The latest version of my PostgreSQL introduction for IL-TechTalks, a free service to introduce the Israeli hi-tech community to new and interesting technologies. In this talk, I describe the history and licensing of PostgreSQL, its built-in capabilities, and some of the new things that were added in the 9.1 and 9.2 releases which make it an attractive option for many applications.
My experience with embedding PostgreSQLJignesh Shah
At my current company, we embed PostgreSQL based technologies in various applications shipped as shrink-wrapped software. In this session we talk about the experience of embedding PostgreSQL where it is not directly exposed to end-user and the issues encountered on how they were resolved.
We will talk about business reasons,technical architecture of deployments, upgrades, security processes on how to work with embedded PostgreSQL databases.
SCALE 15x Minimizing PostgreSQL Major Version Upgrade DowntimeJeff Frost
Let's face it, major version upgrades can be a pain. Most people are familiar with the dump/restore method, but if your database happens to be larger than a few GB, the downtime required for dump/restore is likely going to exceed your maximum maintenance window.
We'll briefly explore upgrade options including dump/restore, pg_upgrade and logical replication tools like Slony and why I think Slony is currently the best option. Then we'll run through a tutorial on how to use slony for a major version upgrade with minimal downtime.
You can find the scripts used in the demos here:
https://github.com/jfrost/scale-15x-talk
Speedrunning the Open Street Map osm2pgsql LoaderGregSmith458515
The Open Street Map project provides invaluable data that keeps driving users toward the PostGIS and PostgreSQL stacks. Loading today’s full Planet data set takes a 120GB XML file and unrolls it into over a terabyte of database data. Crunchy’s benchmark labs have followed the expansion of that Planet data over the last six database releases, as the re-ignition of the CPU wars combined with parallel execution features landing in the database. We’ll take a look at that data evolution, which server configurations worked, and which metrics techniques still matter in the all SSD era.
This technical presentation by EDB Dave Thomas, Systems Engineer provides an overview of:
1) BGWriter/Writer Process
2) Wall Writer Process
3) Stats Collector Process
4) Autovacuum Launch Process
5) Syslogger Process/Logger process
6) Archiver Process
7) WAL Send/Receive Processes
Testing Persistent Storage Performance in Kubernetes with SherlockScyllaDB
Getting to understand your Kubernetes storage capabilities is important in order to run a proper cluster in production. In this session I will demonstrate how to use Sherlock, an open source platform written to test persistent NVMe/TCP storage in Kubernetes, either via synthetic workload or via variety of databases, all easily done and summarized to give you an estimate of what your IOPS, Latency and Throughput your storage can provide to the Kubernetes cluster.
Dave Williams - Nagios Log Server - Practical ExperienceNagios
Dave Williams - Nagios Log Server - Practical Experience. -
This session will detail the green field deployment of Nagios Log Server in a client environment consisting of HP LAN Switches, 3PAR disk storage, HP Blade Chassis with Flex Fabric using
VMware, Hyper-V, Exchange & Citrix.
Automate Oracle database patches and upgrades using Fleet Provisioning and Pa...Nelson Calero
Each new version of the Oracle database includes improvements in the upgrade and patching utilities, forcing us to update our procedures to incorporate these changes.
The Fleet Provisioning & Patching (FPP, formerly RHP) utility, together with the change in its licensing announced at OOW 2019 that makes it free in RAC, now makes it possible to centrally manage the software life cycle.
This presentation shows examples of how to use FPP and different configuration options.
eBay has large, multi-purpose Hadoop clusters with many petabytes of data. eBay Inc?s many subsidiaries and applications give rise to fascinating, complex scenarios for authentication, audit, access control, data protection, data safety, and privacy. To fulfill these complex requirements, security is enabled on Hadoop clusters at eBay. We have been experimenting with and implementing in our production systems several techniques to 1) Set up and operate large clusters (thousands of nodes) efficiently and effectively for a thousand users, and 2)Enable security transparently without impacting user jobs or over-burdening users with inconvenient restrictions Based on our experiments, we have assembled some effective ?best? practices for deploying, operating and using secure Hadoop?clusters. In this presentation, we explain these methods and rules-of-thumb that efficiently and effectively: 1)Set up reliable, scalable Infrastructure to enable strong security for large clusters 2)Set up a very large secure Hadoop cluster in a scalable, zero-touch automated way 3)Update software and configuration on the cluster efficiently while minimizing ?drift? among machines 4)Keep Hadoop services up and running with minimum human intervention 5)Manage user Access to Hadoop clusters? 6)Control access to data and other resources 7)Process highly confidential data using map-reduce programs
This talk is divided into multiple parts, starting with a basic introduction into the popular opensource database management software postgresql.
Building upon that operational aspects of a postgresql cluster instance will be discussed with a focus on what can, should and must be monitored and what kind of tools and nagios related plugins are available.
The final part of the talk gives an insight into the complex and distributed nature of the postgresql.org infrastructure and how nagios plays a crucial role as the central monitoring and alerting platform for the sysadmin team.
Performing quantitative software analytics studies can be an immensely rewarding activity for scientists performing empirical research. However, such studies often pose numerous engineering challenges. The researcher must hunt down appropriate data sets, devise bespoke collection and processing tools, and optimise performance to match the size of the collected data. I will discuss principles and strategies that can be used to deal with these problems, and present examples of associated tools and techniques. Some particularly effective strategies associated with data set construction involve recursion, web searching, synthesis, probing, instrumentation, and the nurturing of alliances. On the processing front approaches include the opportunistic scavenging of tool front-ends, the exploratory development of pipelines, as well as the exploitation of tool interoperability, scripting languages, and their rich libraries. The required performance can be obtained through parallelism, stream processing, the judicious use of low-level facilities, and the choice of appropriate samples. I will finish the presentation with an overview of open problems and challenges in software analytics in vertical domains, data analysis, and under-represented stakeholders.
GTIDs were introduced to solve replication problems and improve database consistency in MySQL database replication.
When, accidentally, transactions occur on a replica, this introduces GTIDs on that replica that don't exist on the master. When, on a master failover, this replica becomes the new master, and the corresponding binlogs of the errant GTIDs are already purged, replication breaks on the replicas of this new master, because those missing GTIDs can't be retrieved from the binlogs of this new master.
This presentation will talk about GTIDs and how to detect errant GTIDs on a replica (before the corresponding binlogs are purged) and how to look at the corresponding transactions in the binlogs. I'll give some examples of transactions that could happen on a replica that didn't originate from a primary node, explain how this is possible and share some tips on how to avoid this.
Basic understanding of MySQL database replication is assumed.
This presentation was at Percona Live 2019 in Austin, Texas.
https://www.percona.com/live/19/sessions/errant-gtids-breaking-replication-how-to-detect-and-avoid-them
06-04-2024 - NYC Tech Week - Discussion on Vector Databases, Unstructured Data and AI
Round table discussion of vector databases, unstructured data, ai, big data, real-time, robots and Milvus.
A lively discussion with NJ Gen AI Meetup Lead, Prasad and Procure.FYI's Co-Found
Explore our comprehensive data analysis project presentation on predicting product ad campaign performance. Learn how data-driven insights can optimize your marketing strategies and enhance campaign effectiveness. Perfect for professionals and students looking to understand the power of data analysis in advertising. for more details visit: https://bostoninstituteofanalytics.org/data-science-and-artificial-intelligence/
Data Centers - Striving Within A Narrow Range - Research Report - MCG - May 2...pchutichetpong
M Capital Group (“MCG”) expects to see demand and the changing evolution of supply, facilitated through institutional investment rotation out of offices and into work from home (“WFH”), while the ever-expanding need for data storage as global internet usage expands, with experts predicting 5.3 billion users by 2023. These market factors will be underpinned by technological changes, such as progressing cloud services and edge sites, allowing the industry to see strong expected annual growth of 13% over the next 4 years.
Whilst competitive headwinds remain, represented through the recent second bankruptcy filing of Sungard, which blames “COVID-19 and other macroeconomic trends including delayed customer spending decisions, insourcing and reductions in IT spending, energy inflation and reduction in demand for certain services”, the industry has seen key adjustments, where MCG believes that engineering cost management and technological innovation will be paramount to success.
MCG reports that the more favorable market conditions expected over the next few years, helped by the winding down of pandemic restrictions and a hybrid working environment will be driving market momentum forward. The continuous injection of capital by alternative investment firms, as well as the growing infrastructural investment from cloud service providers and social media companies, whose revenues are expected to grow over 3.6x larger by value in 2026, will likely help propel center provision and innovation. These factors paint a promising picture for the industry players that offset rising input costs and adapt to new technologies.
According to M Capital Group: “Specifically, the long-term cost-saving opportunities available from the rise of remote managing will likely aid value growth for the industry. Through margin optimization and further availability of capital for reinvestment, strong players will maintain their competitive foothold, while weaker players exit the market to balance supply and demand.”
3. 2/37
One fine day early in the morning
You are woken up by SMS
Bz-z-z! Something is wrong with your live system.
4. 2/37
One fine day early in the morning
You are woken up by SMS
Bz-z-z! Something is wrong with your live system.
You have a look into the logs . . .
5. 3/37
One fine day
DB Log:
LOG: server process (PID 18742) was terminated by signal 9: Killed
DETAIL: Failed process was running: some query here
LOG: terminating any other active server processes
FATAL: the database system is in recovery mode
...
LOG: database system is ready to accept connections
6. 3/37
One fine day
DB Log:
LOG: server process (PID 18742) was terminated by signal 9: Killed
DETAIL: Failed process was running: some query here
LOG: terminating any other active server processes
FATAL: the database system is in recovery mode
...
LOG: database system is ready to accept connections
Syslog:
Out of memory: Kill process 18742 (postgres) score 669 or sacrifice child
Killed process 18742 (postgres) total-vm:5670864kB, anon-rss:5401060kB, file-rss:1428kB
8. 5/37
Outline
1 What are postgres server processes?
2 What processes use much RAM and why?
3 What queries require much RAM?
4 How to we measure the amount of RAM used?
5 How is allocated RAM reclaimed?
10. 7/37
What are postgres server processes?
9522 /usr/local/pgsql/bin/postgres -D /pg_data/9.6/main
1133 postgres: postgres postgres 127.0.0.1(51456) idle
9560 postgres: postgres postgres 127.0.0.1(49867) SELECT
9525 postgres: writer process
9524 postgres: checkpointer process
9526 postgres: wal writer process
9527 postgres: autovacuum launcher process
1981 postgres: autovacuum worker process postgres
9528 postgres: stats collector process
9529 postgres: bgworker: logical replication launcher
1807 postgres: bgworker: parallel worker for PID 9560
11. 7/37
What are postgres server processes?
-> 9522 /usr/local/pgsql/bin/postgres -D /pg_data/9.6/main
1133 postgres: postgres postgres 127.0.0.1(51456) idle
9560 postgres: postgres postgres 127.0.0.1(49867) SELECT
9525 postgres: writer process
9524 postgres: checkpointer process
9526 postgres: wal writer process
9527 postgres: autovacuum launcher process
1981 postgres: autovacuum worker process postgres
9528 postgres: stats collector process
9529 postgres: bgworker: logical replication launcher
1807 postgres: bgworker: parallel worker for PID 9560
"The" postgres server process aka postmaster
Performs bootstrap
Allocates shared memory including shared buffers
Listens to sockets
Spawns backends and other server processes
12. 7/37
What are postgres server processes?
9522 /usr/local/pgsql/bin/postgres -D /pg_data/9.6/main
-> 1133 postgres: postgres postgres 127.0.0.1(51456) idle
-> 9560 postgres: postgres postgres 127.0.0.1(49867) SELECT
9525 postgres: writer process
9524 postgres: checkpointer process
9526 postgres: wal writer process
9527 postgres: autovacuum launcher process
1981 postgres: autovacuum worker process postgres
9528 postgres: stats collector process
9529 postgres: bgworker: logical replication launcher
1807 postgres: bgworker: parallel worker for PID 9560
Backend processes: these are the ones that perform queries
One process per client connection, so no more than
max_connections of them it total
A connection pooler can be used between clients and servers to
limit the number of server backends
Standalone ones are Pgpool-II, pgbouncer, crunchydb
13. 7/37
What are postgres server processes?
9522 /usr/local/pgsql/bin/postgres -D /pg_data/9.6/main
1133 postgres: postgres postgres 127.0.0.1(51456) idle
9560 postgres: postgres postgres 127.0.0.1(49867) SELECT
-> 9525 postgres: writer process
9524 postgres: checkpointer process
9526 postgres: wal writer process
9527 postgres: autovacuum launcher process
1981 postgres: autovacuum worker process postgres
9528 postgres: stats collector process
9529 postgres: bgworker: logical replication launcher
1807 postgres: bgworker: parallel worker for PID 9560
Writer process aka bgwriter (8.0+)
Writes dirty buffer pages to disk using LRU algorithm
Aims to free buffer pages before backends run out of them
But under certain circumstances, backends still have to do it by
their own
14. 7/37
What are postgres server processes?
9522 /usr/local/pgsql/bin/postgres -D /pg_data/9.6/main
1133 postgres: postgres postgres 127.0.0.1(51456) idle
9560 postgres: postgres postgres 127.0.0.1(49867) SELECT
9525 postgres: writer process
-> 9524 postgres: checkpointer process
9526 postgres: wal writer process
9527 postgres: autovacuum launcher process
1981 postgres: autovacuum worker process postgres
9528 postgres: stats collector process
9529 postgres: bgworker: logical replication launcher
1807 postgres: bgworker: parallel worker for PID 9560
Checkpointer process (9.2+)
Checkpoints are forced dirty disk pages flushes. Checkpointer
process issues them every so often to guarantee that changes
committed before certain point in time have been persisted.
In case of server crash the recovery process start from the last
checkpoint completed.
15. 7/37
What are postgres server processes?
9522 /usr/local/pgsql/bin/postgres -D /pg_data/9.6/main
1133 postgres: postgres postgres 127.0.0.1(51456) idle
9560 postgres: postgres postgres 127.0.0.1(49867) SELECT
9525 postgres: writer process
9524 postgres: checkpointer process
-> 9526 postgres: wal writer process
9527 postgres: autovacuum launcher process
1981 postgres: autovacuum worker process postgres
9528 postgres: stats collector process
9529 postgres: bgworker: logical replication launcher
1807 postgres: bgworker: parallel worker for PID 9560
WAL Writer process (8.3+)
Writes and fsyncs WAL segments
Backends could have done it by their own when
synchronous_commit=on (and actually did before 8.3)
When synchronous_commit=off – acutal commits get delayed
no more than wal_writer_delay and processed batchwise
16. 7/37
What are postgres server processes?
9522 /usr/local/pgsql/bin/postgres -D /pg_data/9.6/main
1133 postgres: postgres postgres 127.0.0.1(51456) idle
9560 postgres: postgres postgres 127.0.0.1(49867) SELECT
9525 postgres: writer process
9524 postgres: checkpointer process
9526 postgres: wal writer process
-> 9527 postgres: autovacuum launcher process
-> 1981 postgres: autovacuum worker process postgres
9528 postgres: stats collector process
9529 postgres: bgworker: logical replication launcher
1807 postgres: bgworker: parallel worker for PID 9560
Autovacuum launcher process launches autovacuum workers:
To VACUUM a table when it contains rows with very old
transaction ids to prevent transaction IDs wraparound
To VACUUM a table when certain number of table rows were
updated/deleted
To ANALYZE a table when certain number of rows were inserted
17. 7/37
What are postgres server processes?
9522 /usr/local/pgsql/bin/postgres -D /pg_data/9.6/main
1133 postgres: postgres postgres 127.0.0.1(51456) idle
9560 postgres: postgres postgres 127.0.0.1(49867) SELECT
9525 postgres: writer process
9524 postgres: checkpointer process
9526 postgres: wal writer process
9527 postgres: autovacuum launcher process
1981 postgres: autovacuum worker process postgres
-> 9528 postgres: stats collector process
9529 postgres: bgworker: logical replication launcher
1807 postgres: bgworker: parallel worker for PID 9560
Statistic collector handles requests from other postgres processes
to write data into pg_stat_* system catalogs
18. 7/37
What are postgres server processes?
9522 /usr/local/pgsql/bin/postgres -D /pg_data/9.6/main
1133 postgres: postgres postgres 127.0.0.1(51456) idle
9560 postgres: postgres postgres 127.0.0.1(49867) SELECT
9525 postgres: writer process
9524 postgres: checkpointer process
9526 postgres: wal writer process
9527 postgres: autovacuum launcher process
1981 postgres: autovacuum worker process postgres
9528 postgres: stats collector process
-> 9529 postgres: bgworker: logical replication launcher
-> 1807 postgres: bgworker: parallel worker for PID 9560
Background workers aka bgworkers are custom processes
spawned and terminated by postgres. No more than
max_worker_processes of them. Can be used for
Parallel query execution: backends launch them on demand
Logical replication
Custom add-on background jobs, such as pg_squeeze
19. 7/37
What are postgres server processes?
9522 /usr/local/pgsql/bin/postgres -D /pg_data/9.6/main
1133 postgres: postgres postgres 127.0.0.1(51456) idle
9560 postgres: postgres postgres 127.0.0.1(49867) SELECT
9525 postgres: writer process
9524 postgres: checkpointer process
9526 postgres: wal writer process
9527 postgres: autovacuum launcher process
1981 postgres: autovacuum worker process postgres
9528 postgres: stats collector process
9529 postgres: bgworker: logical replication launcher
1807 postgres: bgworker: parallel worker for PID 9560
There might be also logger and archiver processes present.
You can use syslog as a log destination, or enable postgres
logging_collector.
Similarly you can turn on or off archive_mode.
22. 9/37
Shared memory
Shared memory is accessible by all postgres server processes.
Normally the most part of it is shared_buffers. Postgres
suggests to use 25% of your RAM, though often less values are
used.
23. 9/37
Shared memory
Shared memory is accessible by all postgres server processes.
Normally the most part of it is shared_buffers. Postgres
suggests to use 25% of your RAM, though often less values are
used.
The wal_buffers are normally much smaller, 1/32 of
shared_buffers is default. Anyway, you are allowed to set it to
arbitrarily large value.
24. 9/37
Shared memory
Shared memory is accessible by all postgres server processes.
Normally the most part of it is shared_buffers. Postgres
suggests to use 25% of your RAM, though often less values are
used.
The wal_buffers are normally much smaller, 1/32 of
shared_buffers is default. Anyway, you are allowed to set it to
arbitrarily large value.
The amount of memory used for table and advisory locks is
about 270 × max_locks_per_transaction
×(max_connections+max_prepared_transactions) bytes
You are probably safe, unless you are doing something tricky
using lots advisory locks and increase
max_locks_per_transaction to really large values.
25. 9/37
Shared memory
Shared memory is accessible by all postgres server processes.
Normally the most part of it is shared_buffers. Postgres
suggests to use 25% of your RAM, though often less values are
used.
The wal_buffers are normally much smaller, 1/32 of
shared_buffers is default. Anyway, you are allowed to set it to
arbitrarily large value.
The amount of memory used for table and advisory locks is
about 270 × max_locks_per_transaction
×(max_connections+max_prepared_transactions) bytes
You are probably safe, unless you are doing something tricky
using lots advisory locks and increase
max_locks_per_transaction to really large values.
Same for max_pred_locks_per_transaction — predicate
locks are used only for non-default transaction isolation levels,
make sure not to increase this setting too much.
26. 10/37
Autovacuum workers
No more than autovacuum_max_workers workers, each uses
maintenance_work_mem or autovacuum_work_mem of
RAM
Ideally, your tables are not too large and your RAM is not too
small, so you can afford setting autovacuum_work_mem to
reflect your smallest table size
Practically, you will autovacuum_work_mem to cover all the
small tables in your DB, whatever that means
27. 11/37
Backends and their bgworkers
Backends and their bgworkers are the most important, as there
might be quite a few of them, namely max_connections and
max_workers
28. 11/37
Backends and their bgworkers
Backends and their bgworkers are the most important, as there
might be quite a few of them, namely max_connections and
max_workers
The work_mem parameter limits the amount of RAM used per
operation, i. e. per execution plan node, not per statement
29. 11/37
Backends and their bgworkers
Backends and their bgworkers are the most important, as there
might be quite a few of them, namely max_connections and
max_workers
The work_mem parameter limits the amount of RAM used per
operation, i. e. per execution plan node, not per statement
It actually doesn’t work reliably . . .
31. 13/37
What queries require much RAM?
Each query has an execution plan
postgres=# explain select atttypid::regclass, count(*) from pg_class join pg_attribute
postgres-# on attrelid = pg_class.oid group by 1 order by 2 desc;
QUERY PLAN
-----------------------------------------------------------------------------------
Sort (cost=143.51..143.60 rows=39 width=12)
Sort Key: (count(*)) DESC
-> HashAggregate (cost=142.08..142.47 rows=39 width=12)
Group Key: (pg_attribute.atttypid)::regclass
-> Hash Join (cost=18.56..129.32 rows=2552 width=4)
Hash Cond: (pg_attribute.attrelid = pg_class.oid)
-> Seq Scan on pg_attribute (cost=0.00..75.36 rows=2636 width=8)
-> Hash (cost=14.36..14.36 rows=336 width=4)
-> Seq Scan on pg_class (cost=0.00..14.36 rows=336 width=4)
32. 13/37
What queries require much RAM?
Each query has an execution plan
postgres=# explain select atttypid::regclass, count(*) from pg_class join pg_attribute
postgres-# on attrelid = pg_class.oid group by 1 order by 2 desc;
QUERY PLAN
-----------------------------------------------------------------------------------
Sort (cost=143.51..143.60 rows=39 width=12)
Sort Key: (count(*)) DESC
-> HashAggregate (cost=142.08..142.47 rows=39 width=12)
Group Key: (pg_attribute.atttypid)::regclass
-> Hash Join (cost=18.56..129.32 rows=2552 width=4)
Hash Cond: (pg_attribute.attrelid = pg_class.oid)
-> Seq Scan on pg_attribute (cost=0.00..75.36 rows=2636 width=8)
-> Hash (cost=14.36..14.36 rows=336 width=4)
-> Seq Scan on pg_class (cost=0.00..14.36 rows=336 width=4)
So, essentially the question is, what plan nodes can be
memory-hungry? Right?
33. 13/37
What queries require much RAM?
Each query has an execution plan
postgres=# explain select atttypid::regclass, count(*) from pg_class join pg_attribute
postgres-# on attrelid = pg_class.oid group by 1 order by 2 desc;
QUERY PLAN
-----------------------------------------------------------------------------------
Sort (cost=143.51..143.60 rows=39 width=12)
Sort Key: (count(*)) DESC
-> HashAggregate (cost=142.08..142.47 rows=39 width=12)
Group Key: (pg_attribute.atttypid)::regclass
-> Hash Join (cost=18.56..129.32 rows=2552 width=4)
Hash Cond: (pg_attribute.attrelid = pg_class.oid)
-> Seq Scan on pg_attribute (cost=0.00..75.36 rows=2636 width=8)
-> Hash (cost=14.36..14.36 rows=336 width=4)
-> Seq Scan on pg_class (cost=0.00..14.36 rows=336 width=4)
So, essentially the question is, what plan nodes can be
memory-hungry? Right?
Not exactly. Also we need to track the situations when there are too
many nodes in a plan!
35. 15/37
Nodes: stream-like
Some nodes are more or less stream-like. They don’t accumulate
data from underlying nodes and produce nodes one by one, so they
have no chance to allocate too much memory.
Examples of such nodes include
Sequential scan, Index Scan
Nested Loop and Merge Join
Append and Merge Append
Unique (of a sorted input)
Sounds safe?
36. 15/37
Nodes: stream-like
Some nodes are more or less stream-like. They don’t accumulate
data from underlying nodes and produce nodes one by one, so they
have no chance to allocate too much memory.
Examples of such nodes include
Sequential scan, Index Scan
Nested Loop and Merge Join
Append and Merge Append
Unique (of a sorted input)
Sounds safe? Even a single row can be quite large.
Maximal size for individual postgres value is around 1GB, so this
query requires 5GB:
WITH cte_1g as (select repeat('a', 1024*1024*1024 - 100) as a1g)
SELECT *
FROM cte_1g a, cte_1g b, cte_1g c, cte_1g d, cte_1g e;
37. 16/37
Nodes: controlled
Some of the other nodes actively use RAM but control the amount
used. They have a fallback behaviour to switch to if they realise
they cannot fit work_mem.
Sort node switches from quicksort to sort-on-disk
CTE and materialize nodes use temporary files if needed
Group Aggregation with DISTINCT keyword can use temporary
files
Beware of out of disk space problems.
38. 16/37
Nodes: controlled
Some of the other nodes actively use RAM but control the amount
used. They have a fallback behaviour to switch to if they realise
they cannot fit work_mem.
Sort node switches from quicksort to sort-on-disk
CTE and materialize nodes use temporary files if needed
Group Aggregation with DISTINCT keyword can use temporary
files
Beware of out of disk space problems.
Also
Exact Bitmap Scan falls back to Lossy Bitmap Scan
Hash Join switches to batchwise processing if it encounters
more data than expected
39. 17/37
Nodes: unsafe
They are Hash Agg, hashed SubPlan and (rarely) Hash Join can use
unlimited amount of RAM.
Optimizer normally avoids them when it estimates them to process
huge sets, but it can easily be wrong.
How to make the estimates wrong:
CREATE TABLE t (a int, b int);
INSERT INTO t SELECT 0, b from generate_series(1, (10^7)::int) b;
ANALYZE t;
INSERT INTO t SELECT 1, b from generate_series(1, (5*10^5)::int) b;
After this, autovacuum won’t update stats, as it treats the second
insert as small w r. t. the number of rows already present.
postgres=# EXPLAIN (ANALYZE, TIMING OFF) SELECT * FROM t WHERE a = 1;
QUERY PLAN
-----------------------------------------------------------------------------------
Seq Scan on t (cost=0.00..177712.39 rows=1 width=8) (rows=500000 loops=1)
Filter: (a = 1)
Rows Removed by Filter: 10000000
Planning time: 0.059 ms
Execution time: 769.508 ms
40. 18/37
Unsafe nodes: hashed SubPlan
Then we run the following query
postgres=# EXPLAIN (ANALYZE, TIMING OFF)
postgres-# SELECT * FROM t WHERE b NOT IN (SELECT b FROM t WHERE a = 1);
QUERY PLAN
---------------------------------------------------------------------------------------------
Seq Scan on t (cost=177712.39..355424.78 rows=5250056 width=8) (actual rows=9500000 loops=1)
Filter: (NOT (hashed SubPlan 1))
Rows Removed by Filter: 1000000
SubPlan 1
-> Seq Scan on t t_1 (cost=0.00..177712.39 rows=1 width=4) (actual rows=500000 loops=1)
Filter: (a = 1)
Rows Removed by Filter: 10000000
Planning time: 0.126 ms
Execution time: 3239.730 ms
and get a half-million set hashed.
The backend used 60MB of RAM while work_mem was only 4MB.
Sounds not too bad, but . . .
41. 19/37
Unsafe nodes: hashed SubPlan and partitioned table
For a partitioned table it hashes the same condition separately for
each partition!
postgres=# EXPLAIN SELECT * FROM t WHERE b NOT IN (SELECT b FROM t1 WHERE a = 1);
QUERY PLAN
--------------------------------------------------------------------------
Append (cost=135449.03..1354758.02 rows=3567432 width=8)
-> Seq Scan on t (cost=135449.03..135449.03 rows=1 width=8)
Filter: (NOT (hashed SubPlan 1))
SubPlan 1
-> Seq Scan on t1 t1_1 (cost=0.00..135449.03 rows=1 width=4)
Filter: (a = 1)
-> Seq Scan on t2 (cost=135449.03..135487.28 rows=1130 width=8)
Filter: (NOT (hashed SubPlan 1))
-> Seq Scan on t3 (cost=135449.03..135487.28 rows=1130 width=8)
Filter: (NOT (hashed SubPlan 1))
-> Seq Scan on t4 (cost=135449.03..135487.28 rows=1130 width=8)
Filter: (NOT (hashed SubPlan 1))
-> Seq Scan on t5 (cost=135449.03..135487.28 rows=1130 width=8)
Filter: (NOT (hashed SubPlan 1))
-> Seq Scan on t6 (cost=135449.03..135487.28 rows=1130 width=8)
Filter: (NOT (hashed SubPlan 1))
-> Seq Scan on t7 (cost=135449.03..135487.28 rows=1130 width=8)
Filter: (NOT (hashed SubPlan 1))
-> Seq Scan on t8 (cost=135449.03..135487.28 rows=1130 width=8)
Filter: (NOT (hashed SubPlan 1))
-> Seq Scan on t1 (cost=135449.03..270898.05 rows=3559521 width=8)
Filter: (NOT (hashed SubPlan 1))
This is going to be fixed in PostgreSQL 10
42. 20/37
Unsafe nodes: hashed SubPlan and partitioned table
For now the workaround is to use dirty hacks:
postgres=# explain
postgres-# SELECT * FROM (TABLE t OFFSET 0) s WHERE b NOT IN (SELECT b FROM t1 WHERE a = 1);
QUERY PLAN
-------------------------------------------------------------------------
Subquery Scan on _ (cost=135449.03..342514.44 rows=3567432 width=8)
Filter: (NOT (hashed SubPlan 1))
-> Append (cost=0.00..117879.62 rows=7134863 width=8)
-> Seq Scan on t (cost=0.00..0.00 rows=1 width=8)
-> Seq Scan on t2 (cost=0.00..32.60 rows=2260 width=8)
-> Seq Scan on t3 (cost=0.00..32.60 rows=2260 width=8)
-> Seq Scan on t4 (cost=0.00..32.60 rows=2260 width=8)
-> Seq Scan on t5 (cost=0.00..32.60 rows=2260 width=8)
-> Seq Scan on t6 (cost=0.00..32.60 rows=2260 width=8)
-> Seq Scan on t7 (cost=0.00..32.60 rows=2260 width=8)
-> Seq Scan on t8 (cost=0.00..32.60 rows=2260 width=8)
-> Seq Scan on t1 (cost=0.00..117651.42 rows=7119042 width=8)
SubPlan 1
-> Seq Scan on t1 t1_1 (cost=0.00..135449.03 rows=1 width=4)
Filter: (a = 1)
Memory usage was reduced 9 times, also it works much faster.
43. 21/37
Unsafe nodes: Hash Aggregation
Estimates for groupping are sometimes unreliable at all. Random
numbers chosen by a fair dice roll:
postgres=# explain (analyze, timing off) select b, count(*)
postgres-# from (table t union all table t) u group by 1;
QUERY PLAN
-------------------------------------------------------------------
HashAggregate (... rows=200 ... ) (actual rows=10000000 ...)
Group Key: t.b
-> Append (... rows=19999954 ...) (actual rows=20000000 ...)
-> Seq Scan on t (... rows=9999977 ... ) (actual ... )
-> Seq Scan on t t_1 (... rows=9999977 ... ) (actual ... )
Planning time: 0.141 ms
Execution time: 14523.303 ms
. . . and uses several gigs of RAM for the hash table!
44. 22/37
Unsafe nodes: Hash Join
Hash Joins can use more memory than expected if there are many
collisions on the hashed side:
postgres=# explain (analyze, costs off)
postgres-# select * from t t1 join t t2 on t1.b = t2.b where t1.a = 1;
QUERY PLAN
--------------------------------------------------------------------------------------------
Hash Join (actual time=873.321..4223.080 rows=1000000 loops=1)
Hash Cond: (t2.b = t1.b)
-> Seq Scan on t t2 (actual time=0.048..755.195 rows=10500000 loops=1)
-> Hash (actual time=873.163..873.163 rows=500000 loops=1)
Buckets: 131072 (originally 1024) Batches: 8 (originally 1) Memory Usage: 3465kB
-> Seq Scan on t t1 (actual time=748.700..803.665 rows=500000 loops=1)
Filter: (a = 1)
Rows Removed by Filter: 10000000
postgres=# explain (analyze, costs off)
postgres-# select * from t t1 join t t2 on t1.b % 1 = t2.b where t1.a = 1;
QUERY PLAN
---------------------------------------------------------------------------------------------
Hash Join (actual time=3542.413..3542.413 rows=0 loops=1)
Hash Cond: (t2.b = (t1.b % 1))
-> Seq Scan on t t2 (actual time=0.053..732.095 rows=10500000 loops=1)
-> Hash (actual time=888.131..888.131 rows=500000 loops=1)
Buckets: 131072 (originally 1024) Batches: 2 (originally 1) Memory Usage: 19532kB
-> Seq Scan on t t1 (actual time=753.244..812.959 rows=500000 loops=1)
Filter: (a = 1)
Rows Removed by Filter: 10000000
45. 23/37
Unsafe nodes: array_agg
And just one more random fact.
array_agg used at least 1Kb per array before a fix in Postgres 9.5
Funny, isn’t it: on small arrays array_agg_distinct from
count_distinct extension is faster than built-in array_agg.
48. 25/37
How to we measure the amount of RAM used?
top? ps? htop? atop?
49. 25/37
How to we measure the amount of RAM used?
top? ps? htop? atop? No. They show private and shared memory
together.
50. 25/37
How to we measure the amount of RAM used?
top? ps? htop? atop? No. They show private and shared memory
together.
We have to look into /proc filesystem, namely /proc/pid/smaps
51. 26/37
smaps
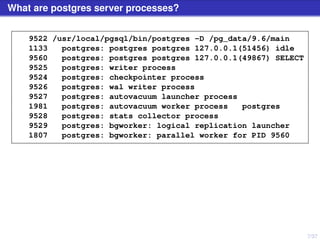
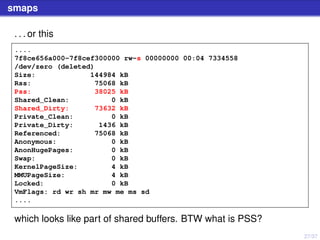
/proc/7194/smaps comprises a few sections like this
....
0135f000-0a0bf000 rw-p 00000000 00:00 0
[heap]
Size: 144768 kB
Rss: 136180 kB
Pss: 136180 kB
Shared_Clean: 0 kB
Shared_Dirty: 0 kB
Private_Clean: 0 kB
Private_Dirty: 136180 kB
Referenced: 114936 kB
Anonymous: 136180 kB
AnonHugePages: 2048 kB
Swap: 0 kB
KernelPageSize: 4 kB
MMUPageSize: 4 kB
Locked: 0 kB
VmFlags: rd wr mr mw me ac sd
....
which is a private memory segment . . .
52. 27/37
smaps
. . . or this
....
7f8ce656a000-7f8cef300000 rw-s 00000000 00:04 7334558
/dev/zero (deleted)
Size: 144984 kB
Rss: 75068 kB
Pss: 38025 kB
Shared_Clean: 0 kB
Shared_Dirty: 73632 kB
Private_Clean: 0 kB
Private_Dirty: 1436 kB
Referenced: 75068 kB
Anonymous: 0 kB
AnonHugePages: 0 kB
Swap: 0 kB
KernelPageSize: 4 kB
MMUPageSize: 4 kB
Locked: 0 kB
VmFlags: rd wr sh mr mw me ms sd
....
which looks like part of shared buffers. BTW what is PSS?
53. 28/37
smaps: PSS
PSS stands for proportional set size
For each private allocated memory chunk we count its size as is
We divide the size of a shared memory chunk by the number of
processes that use it
54. 28/37
smaps: PSS
PSS stands for proportional set size
For each private allocated memory chunk we count its size as is
We divide the size of a shared memory chunk by the number of
processes that use it
pid
PSS(pid) = total memory used!
55. 28/37
smaps: PSS
PSS stands for proportional set size
For each private allocated memory chunk we count its size as is
We divide the size of a shared memory chunk by the number of
processes that use it
pid
PSS(pid) = total memory used!
PSS support was added to Linux kernel in 2007, but I’m not aware of
a task manager able to display it or sort processes by it.
56. 29/37
smaps: Private
Anyway, we need to count only private memory used by a backend
or a worker, as all the shared is allocated by postmaster on startup.
We can get the size of private memory of a process this way:
$ grep '^Private' /proc/7194/smaps|awk '{a+=$2}END{print a*1024}'
7852032
57. 30/37
smaps: Private from psql
You even can get amount of private memory used by a backend from
itself using SQL:
do $do$
declare
l_command text :=
$p$ cat /proc/$p$ || pg_backend_pid() || $p$/smaps $p$ ||
$p$ | grep '^Private' $p$ ||
$p$ | awk '{a+=$2}END{print a * 1024}' $p$;
begin
create temp table if not exists z (a int);
execute 'copy z from program ' || quote_literal(l_command);
raise notice '%', (select pg_size_pretty(sum(a)) from z);
truncate z;
end;
$do$;
Unfortunately it requires superuser privileges.
Workaround: rewrite as a PL/Python function and mark it
SECURITY DEFINER.
59. 32/37
How is allocated RAM reclaimed?
And sometimes this show-me-my-RAM-usage SQL returns much
more than zero:
postgres=# i ~/smaps.sql
psql:/home/l/smaps.sql:13: NOTICE: 892 MB
DO
60. 32/37
How is allocated RAM reclaimed?
And sometimes this show-me-my-RAM-usage SQL returns much
more than zero:
postgres=# i ~/smaps.sql
psql:/home/l/smaps.sql:13: NOTICE: 892 MB
DO
But there is no heavy query running? Does Postgres LEAK?!
61. 32/37
How is allocated RAM reclaimed?
And sometimes this show-me-my-RAM-usage SQL returns much
more than zero:
postgres=# i ~/smaps.sql
psql:/home/l/smaps.sql:13: NOTICE: 892 MB
DO
But there is no heavy query running? Does Postgres LEAK?!
Well, yes and no.
62. 33/37
How is allocated RAM reclaimed?
Postgres operates so-called memory contexts — groups of
memory allocations. They can be
Per-row
Per-aggregate
Per-node
Per-query
Per-backend
and some other ones I believe
And they are designed to "free" the memory when the correspondent
object is destroyed. And they do "free", I’ve checked it.
63. 34/37
How is allocated RAM reclaimed?
Why "free", not free?
Because postgres uses so-called memory allocator that optimises
malloc/free calls. Sometimes some memory is freed, and it does not
free it for to use next time. But not 892MB. They free(3) it, I’ve
checked it.
64. 35/37
How is allocated RAM reclaimed?
Why free(3), not free?
Because linux implementation of free(3) uses either heap expansion
by brk() or mmap() syscall, depending on the size requested. And
memory got by brk() does not get reclaimed.
The threshold for the decision what to use is not fixed as well. It is
initially 128Kb but Linux increases it up to 32MB adaptively
depending on the process previous allocations history.
Those values can be changed, as well as adaptive behaviour could
be turned off using mallopt(3) or even certain environment
variables.
And it turned out that Postgres stopped "leaking" after it.