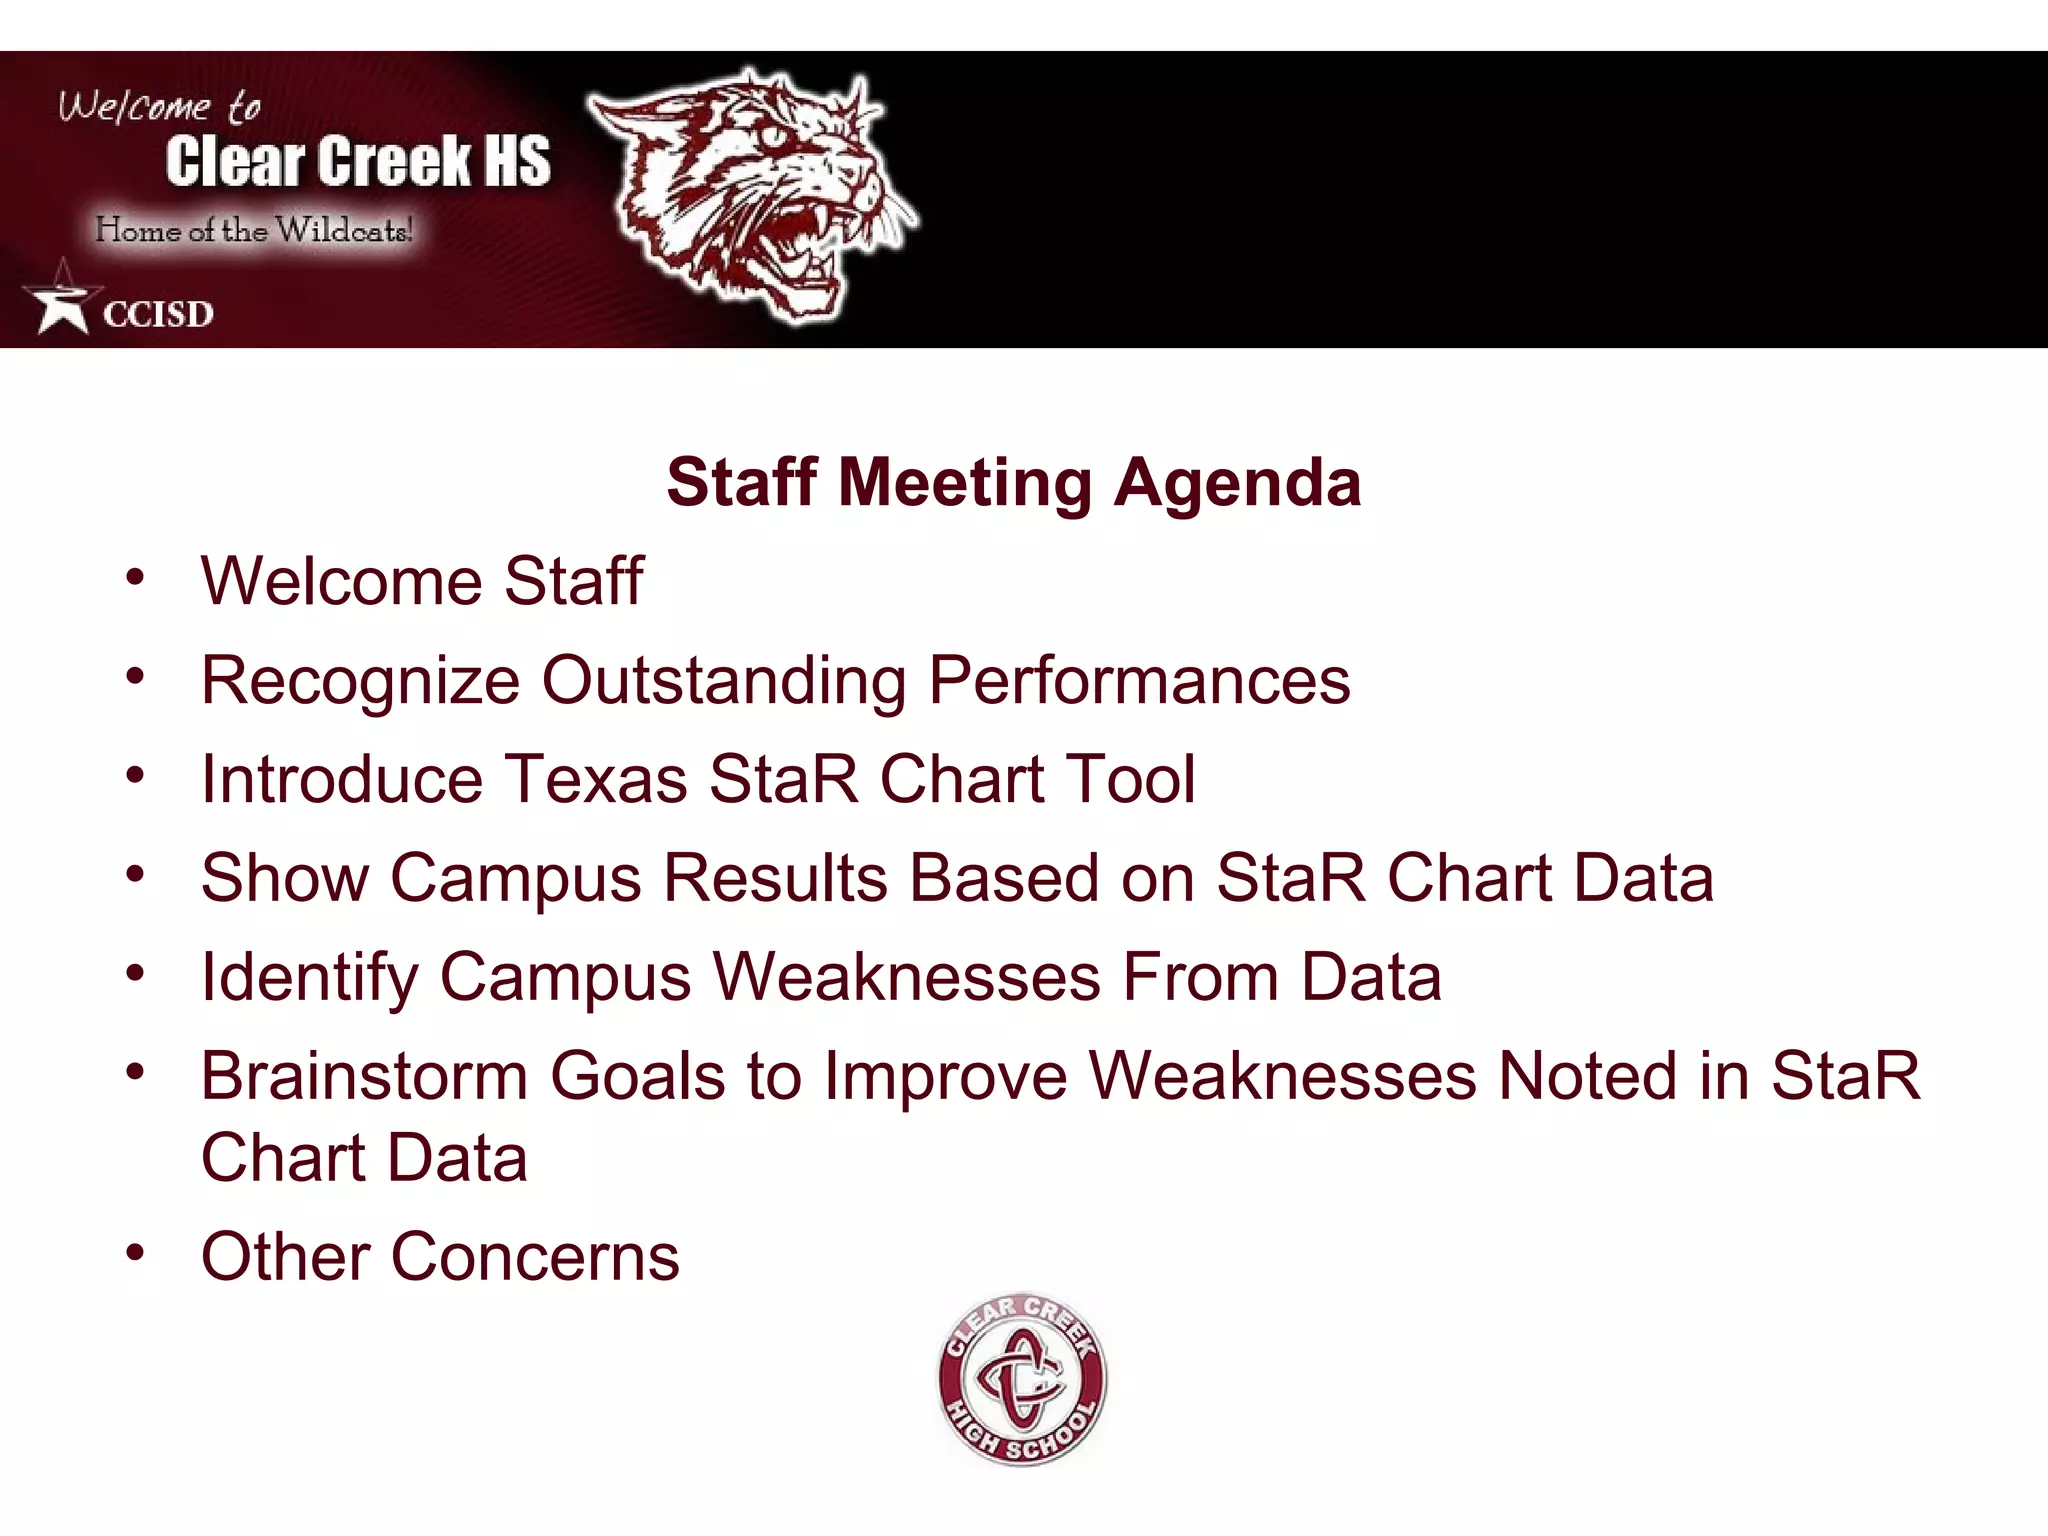
The staff meeting agenda includes:
1) Welcoming staff and recognizing outstanding performances.
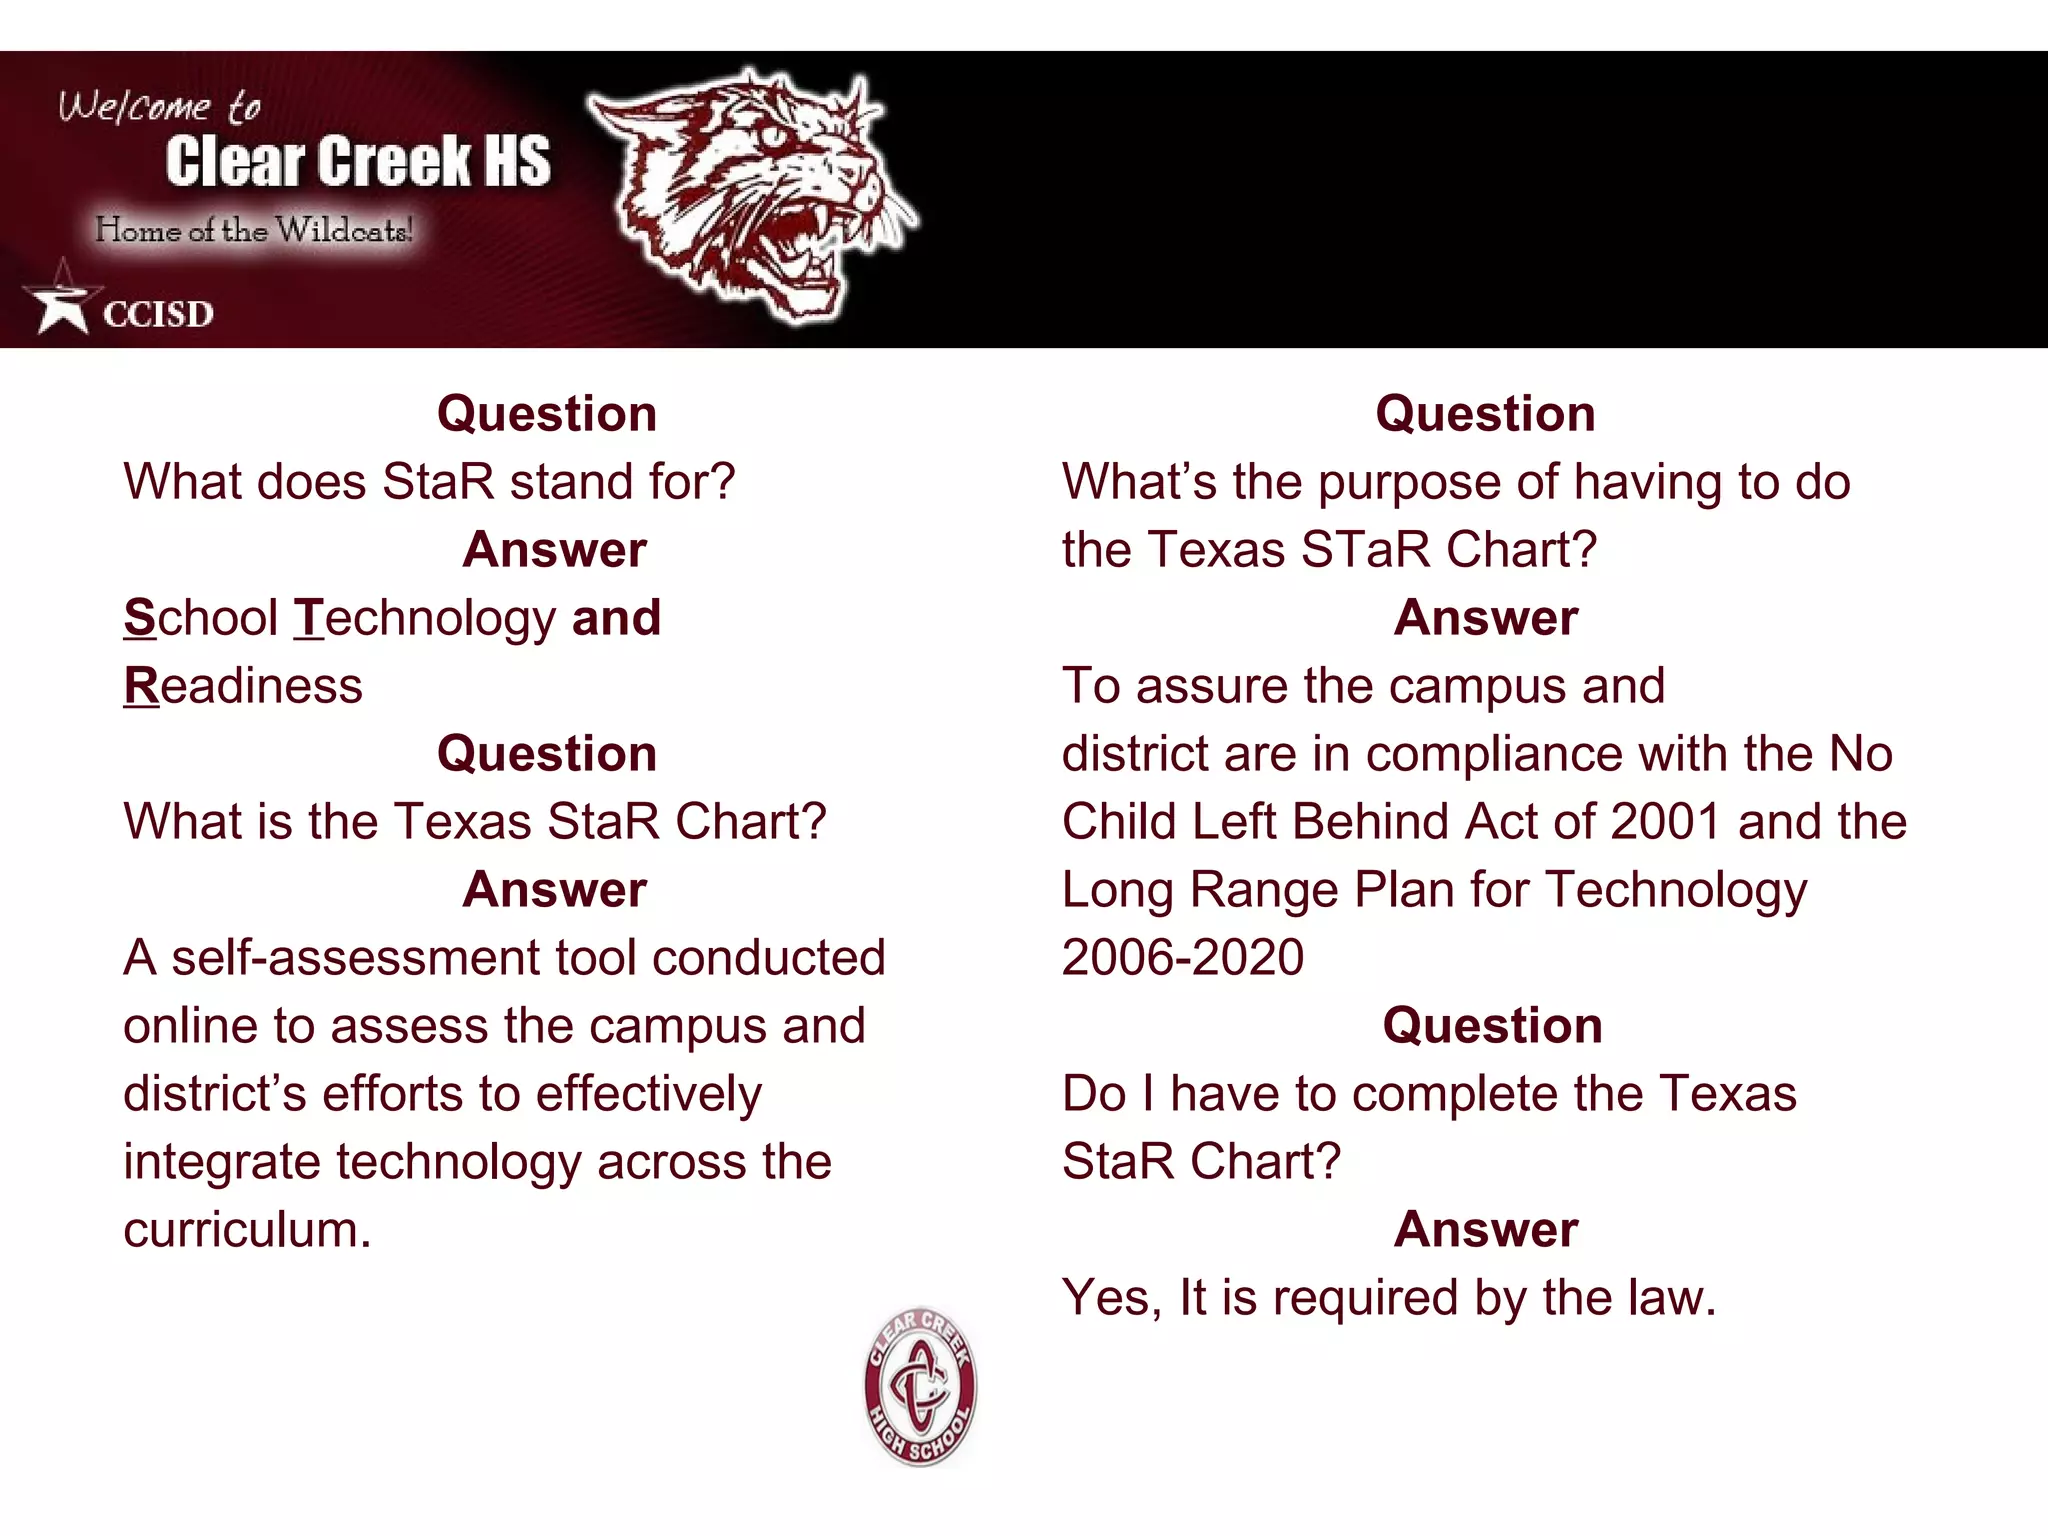
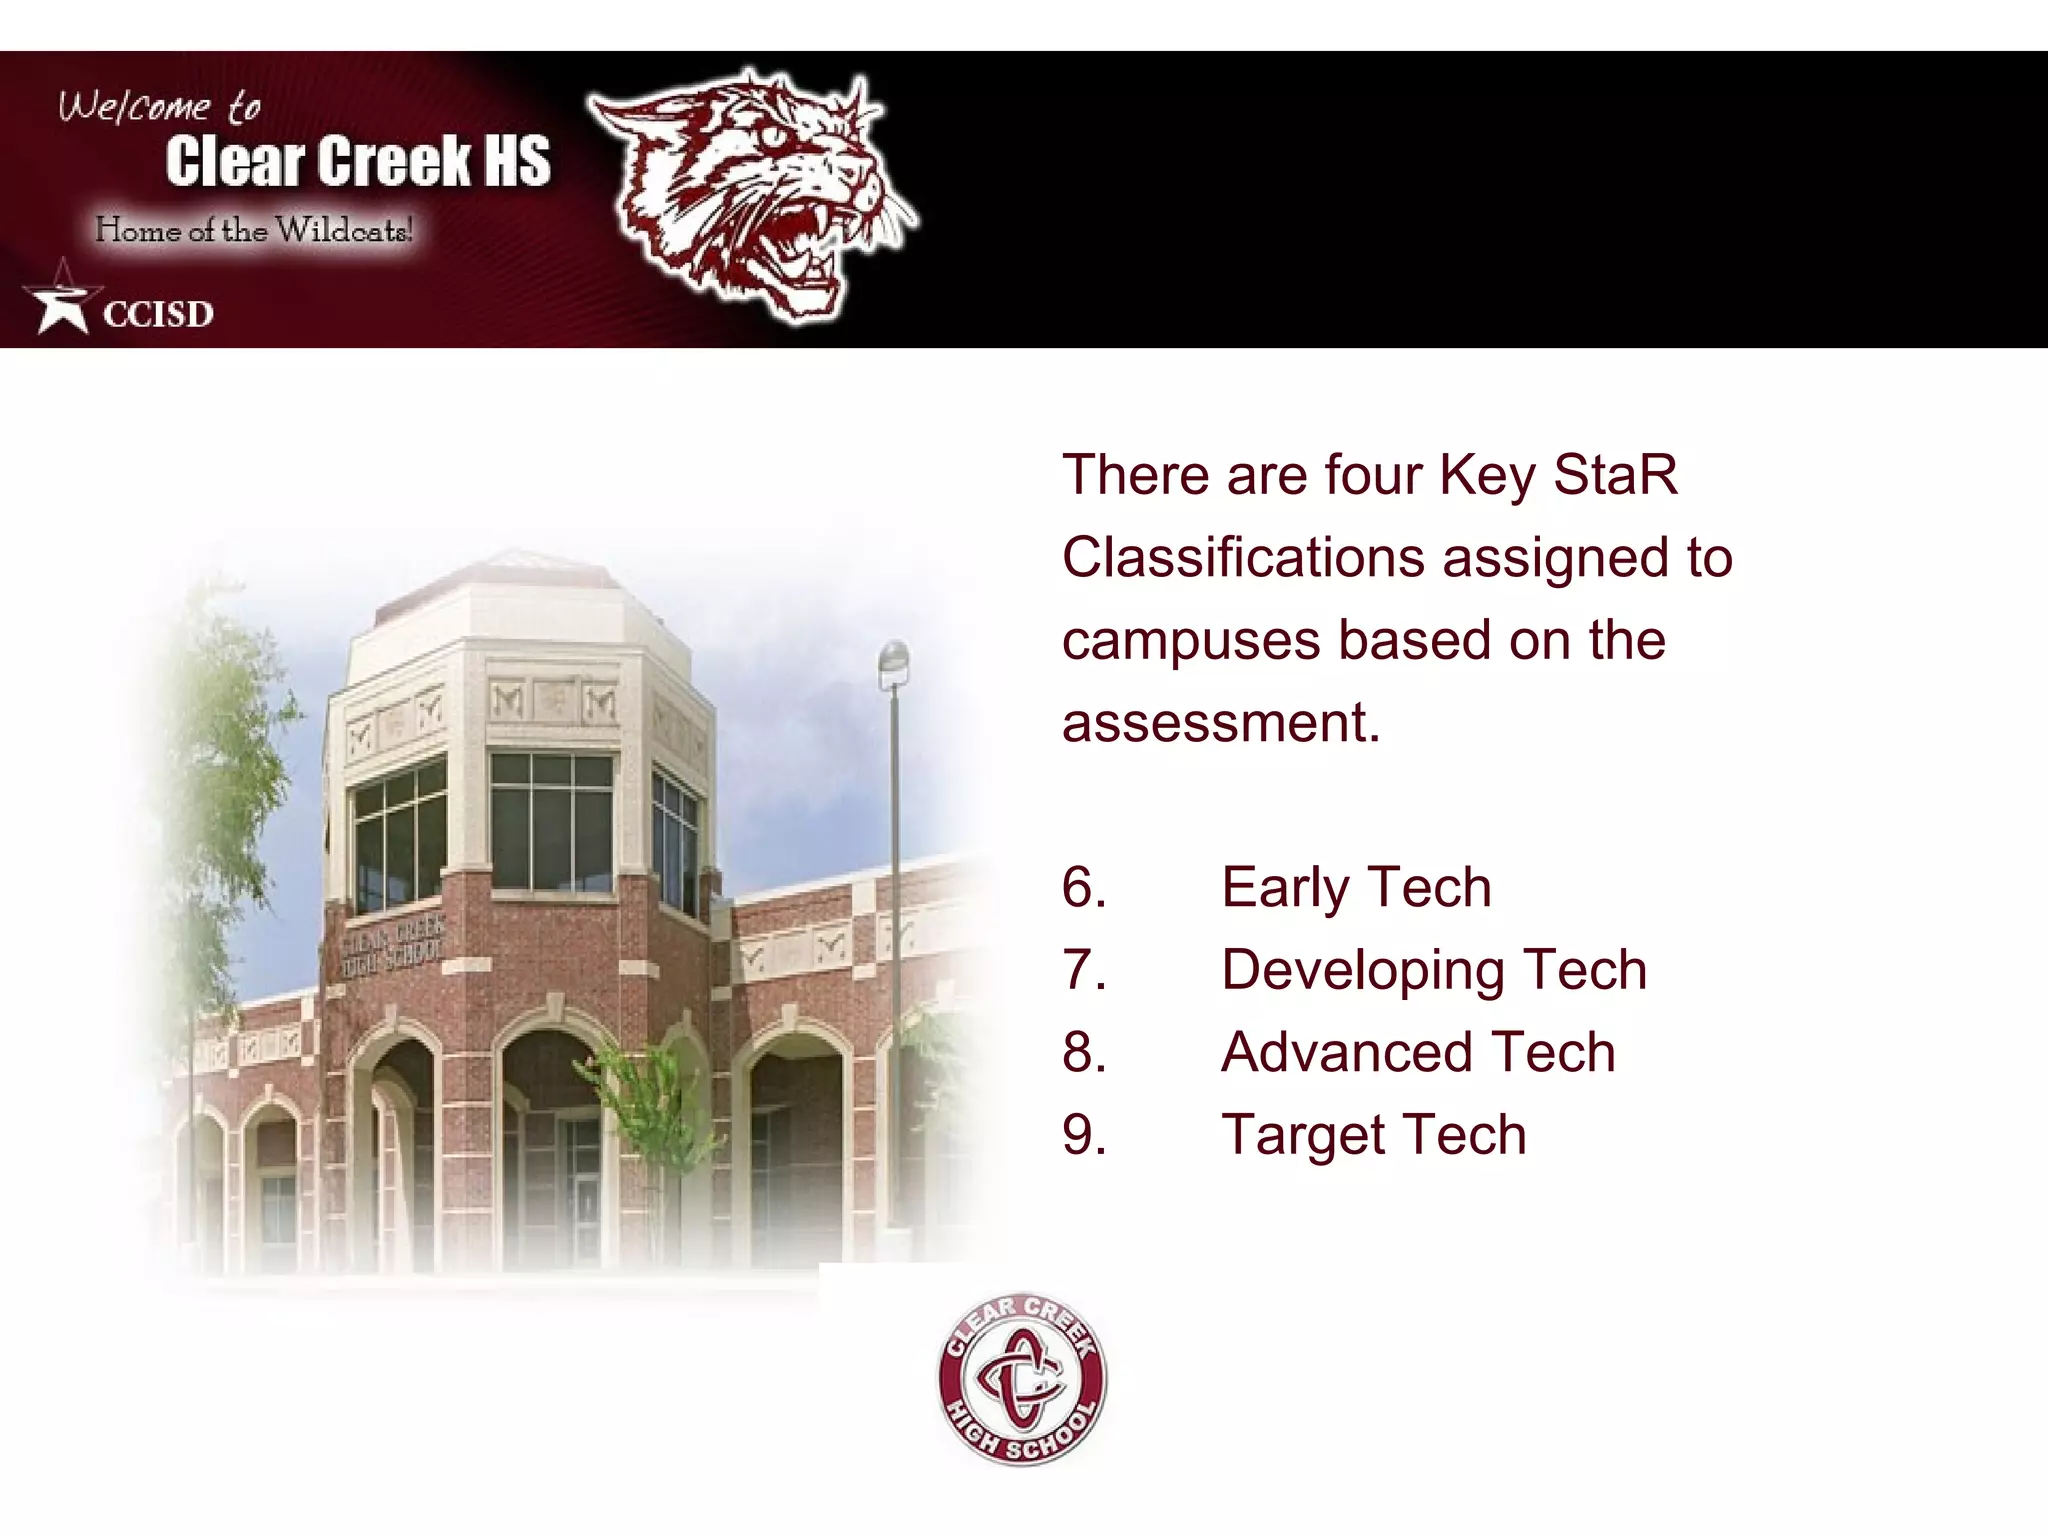
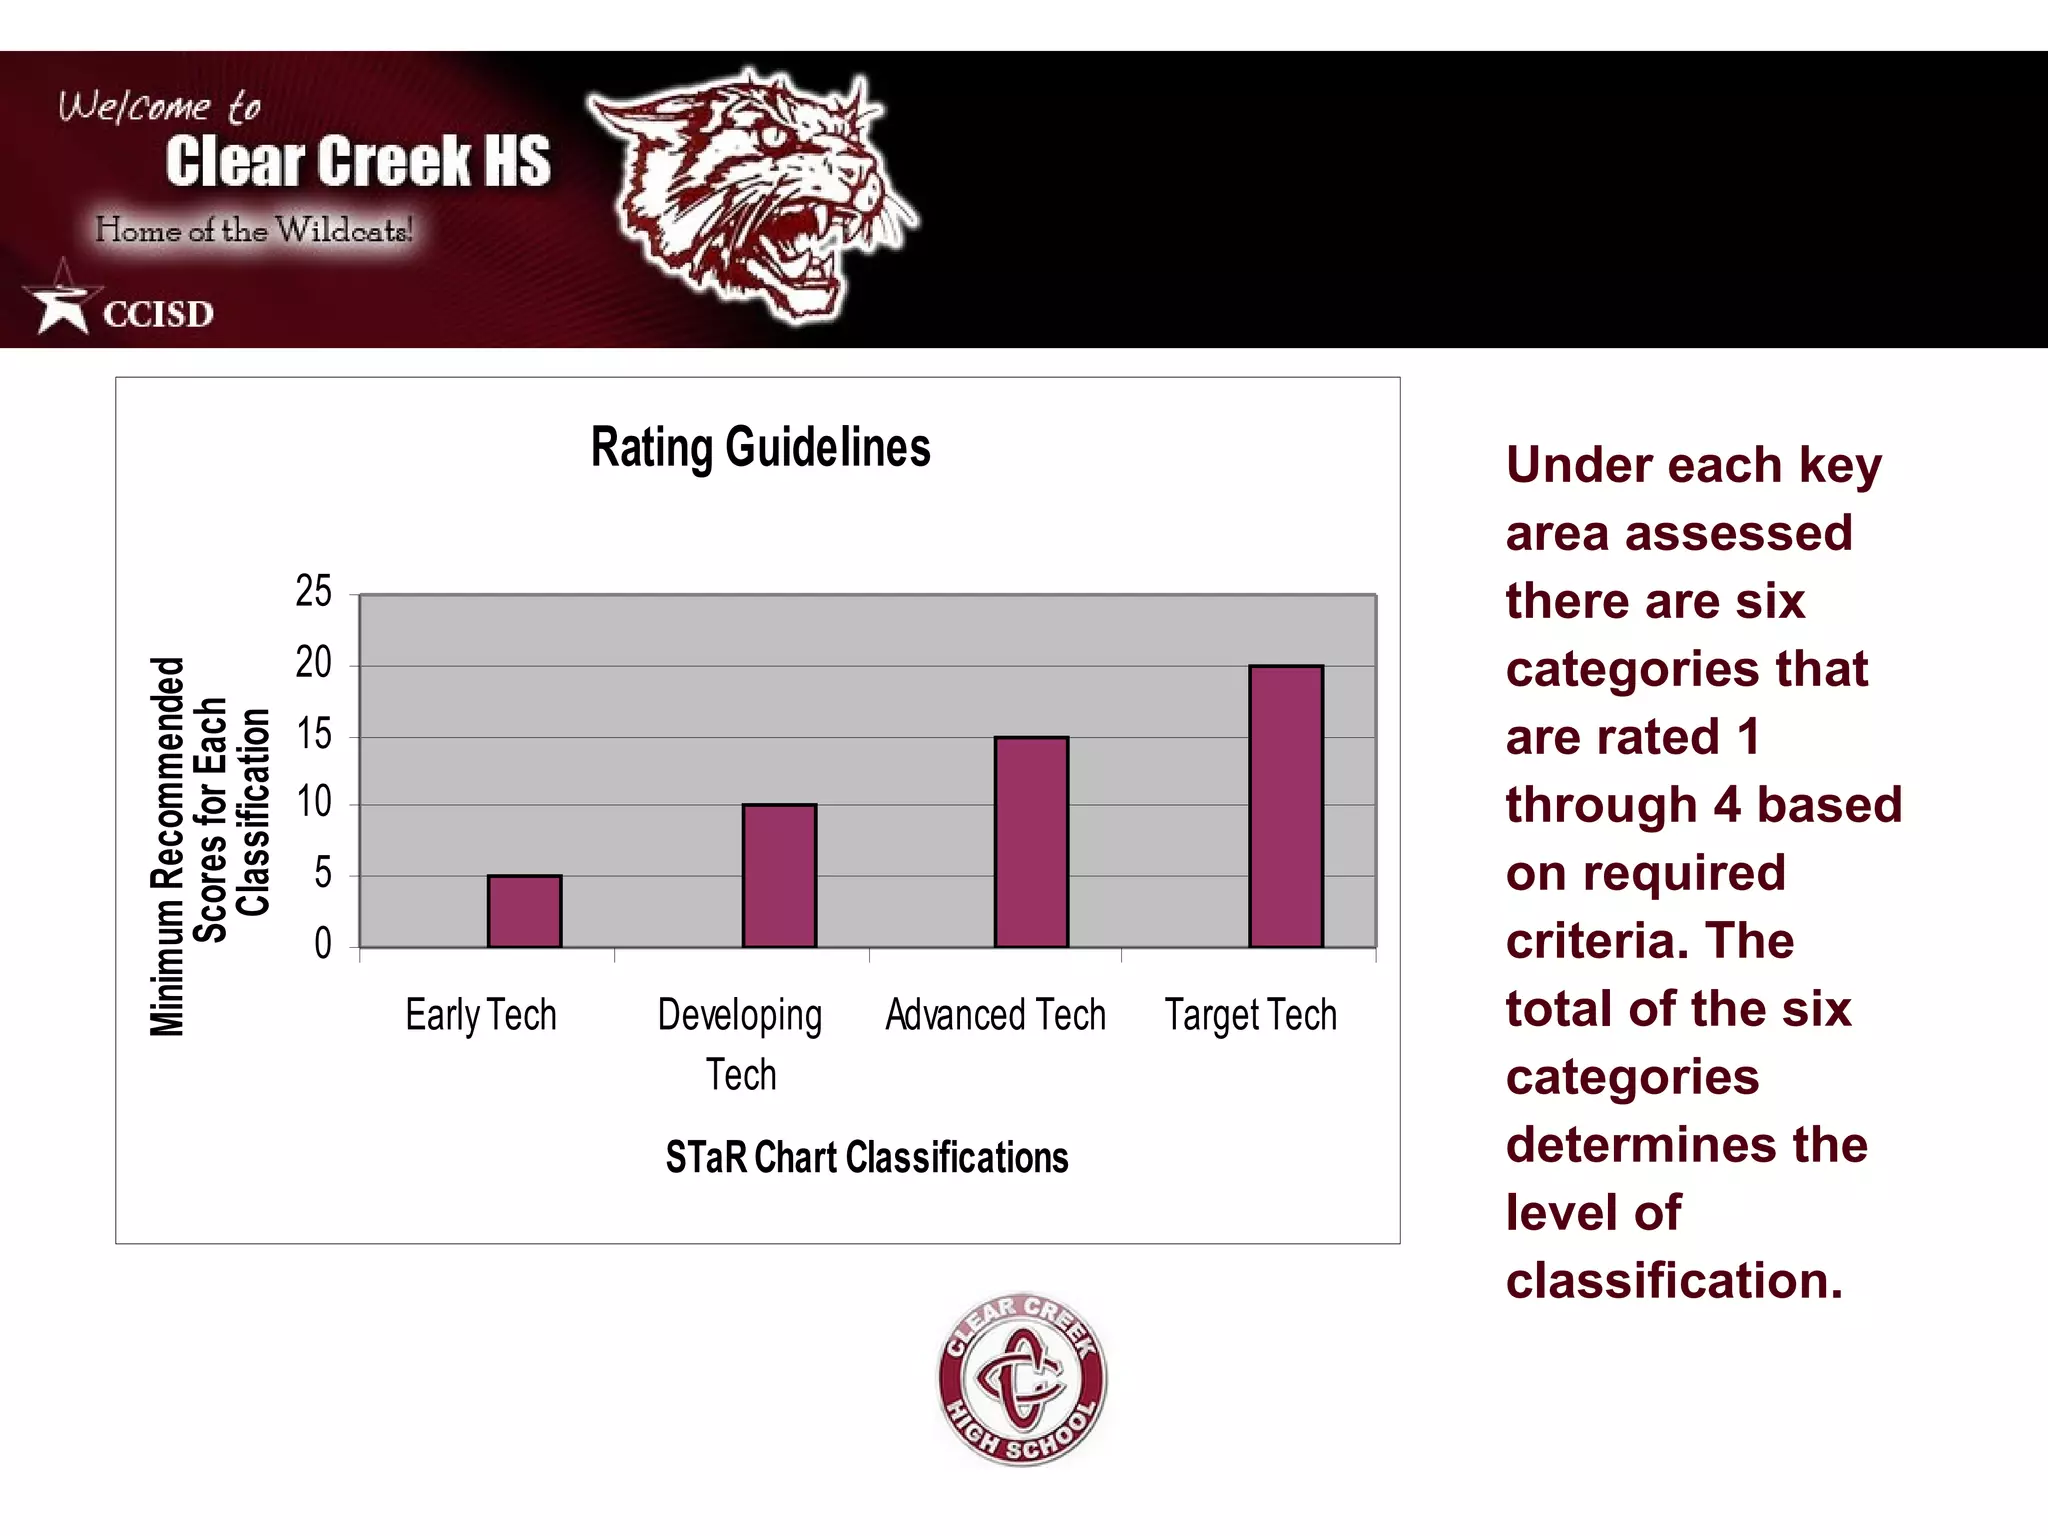
2) Introducing the Texas StaR Chart tool, which is used to assess technology integration across curriculum.
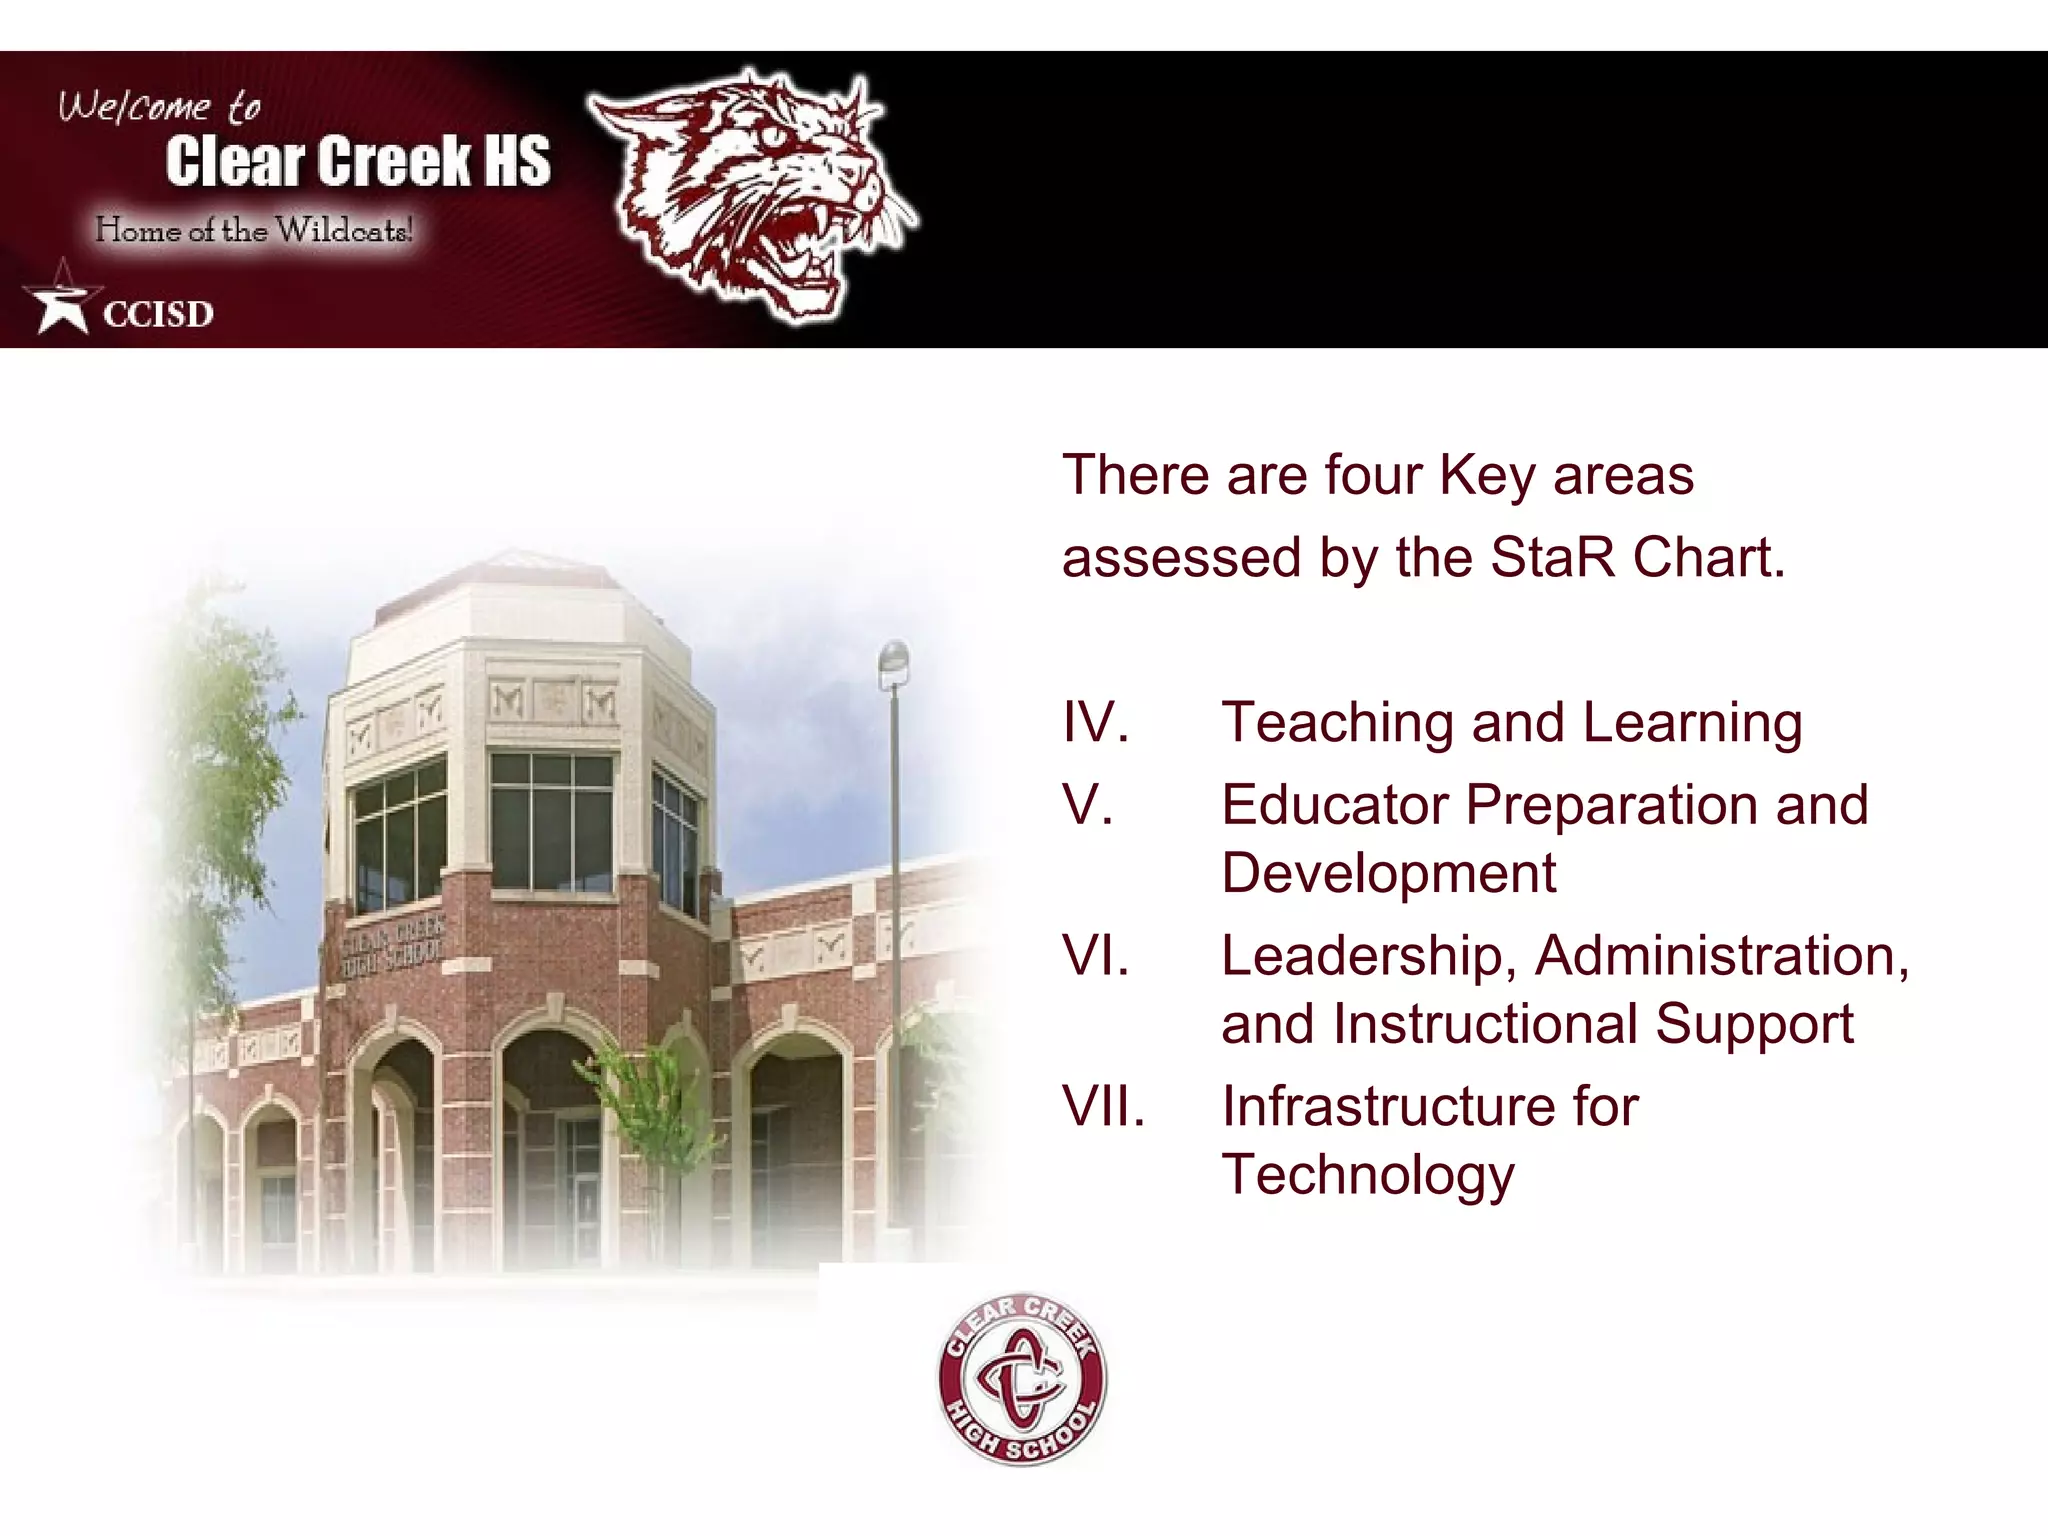
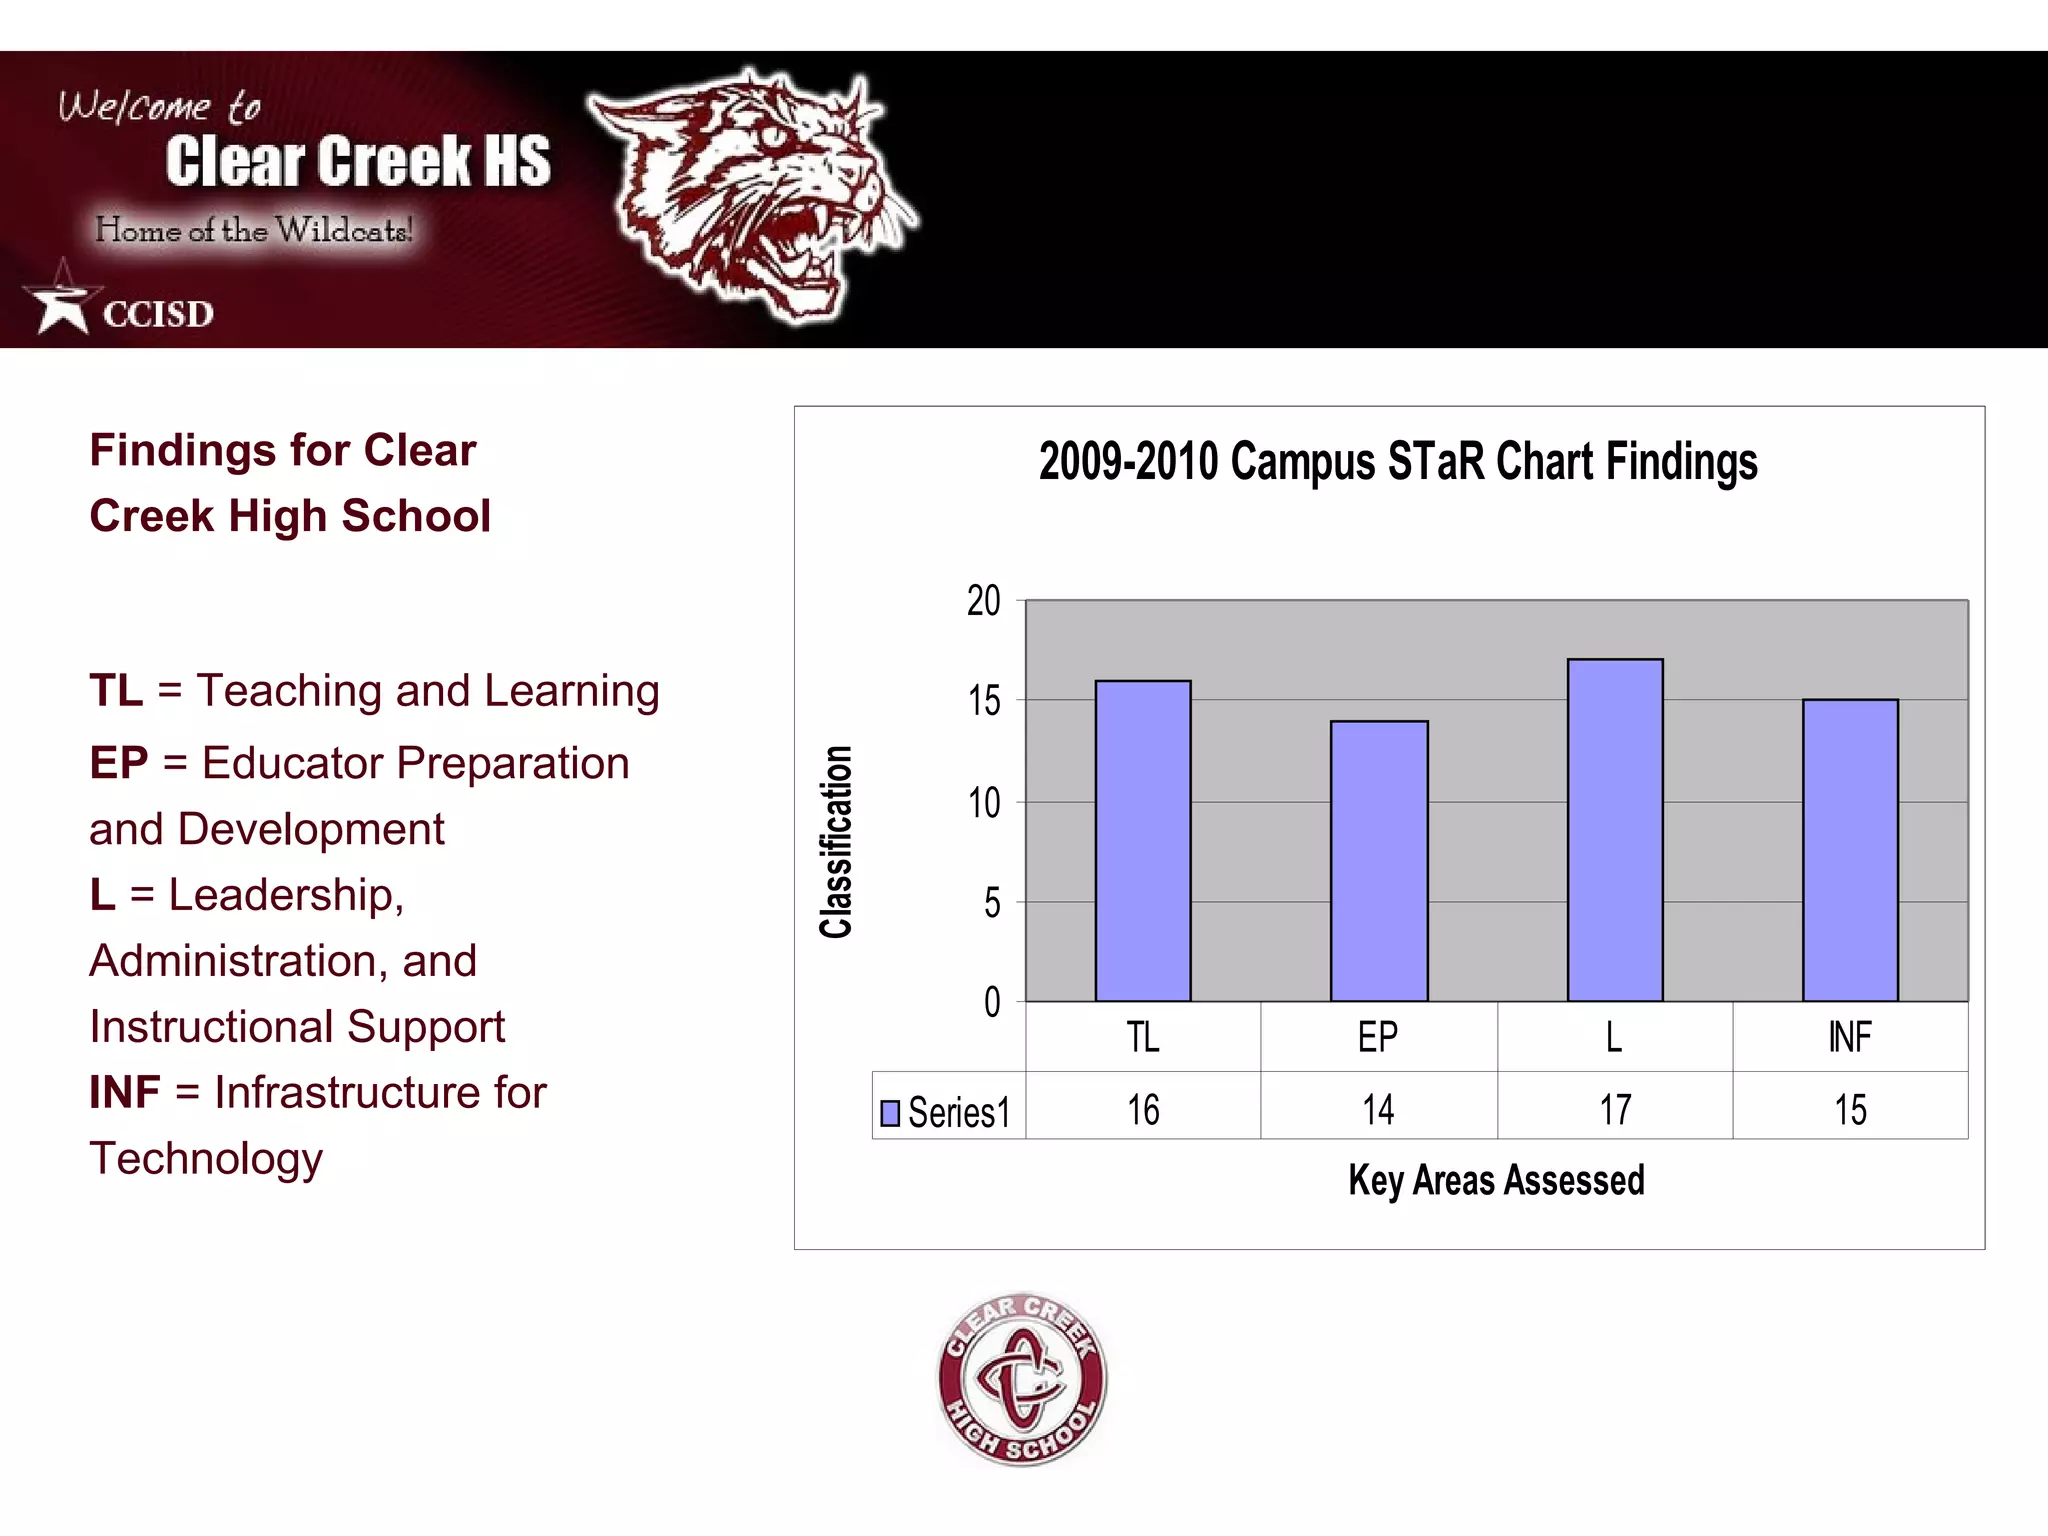
3) Showing campus results from the StaR Chart and identifying weaknesses.
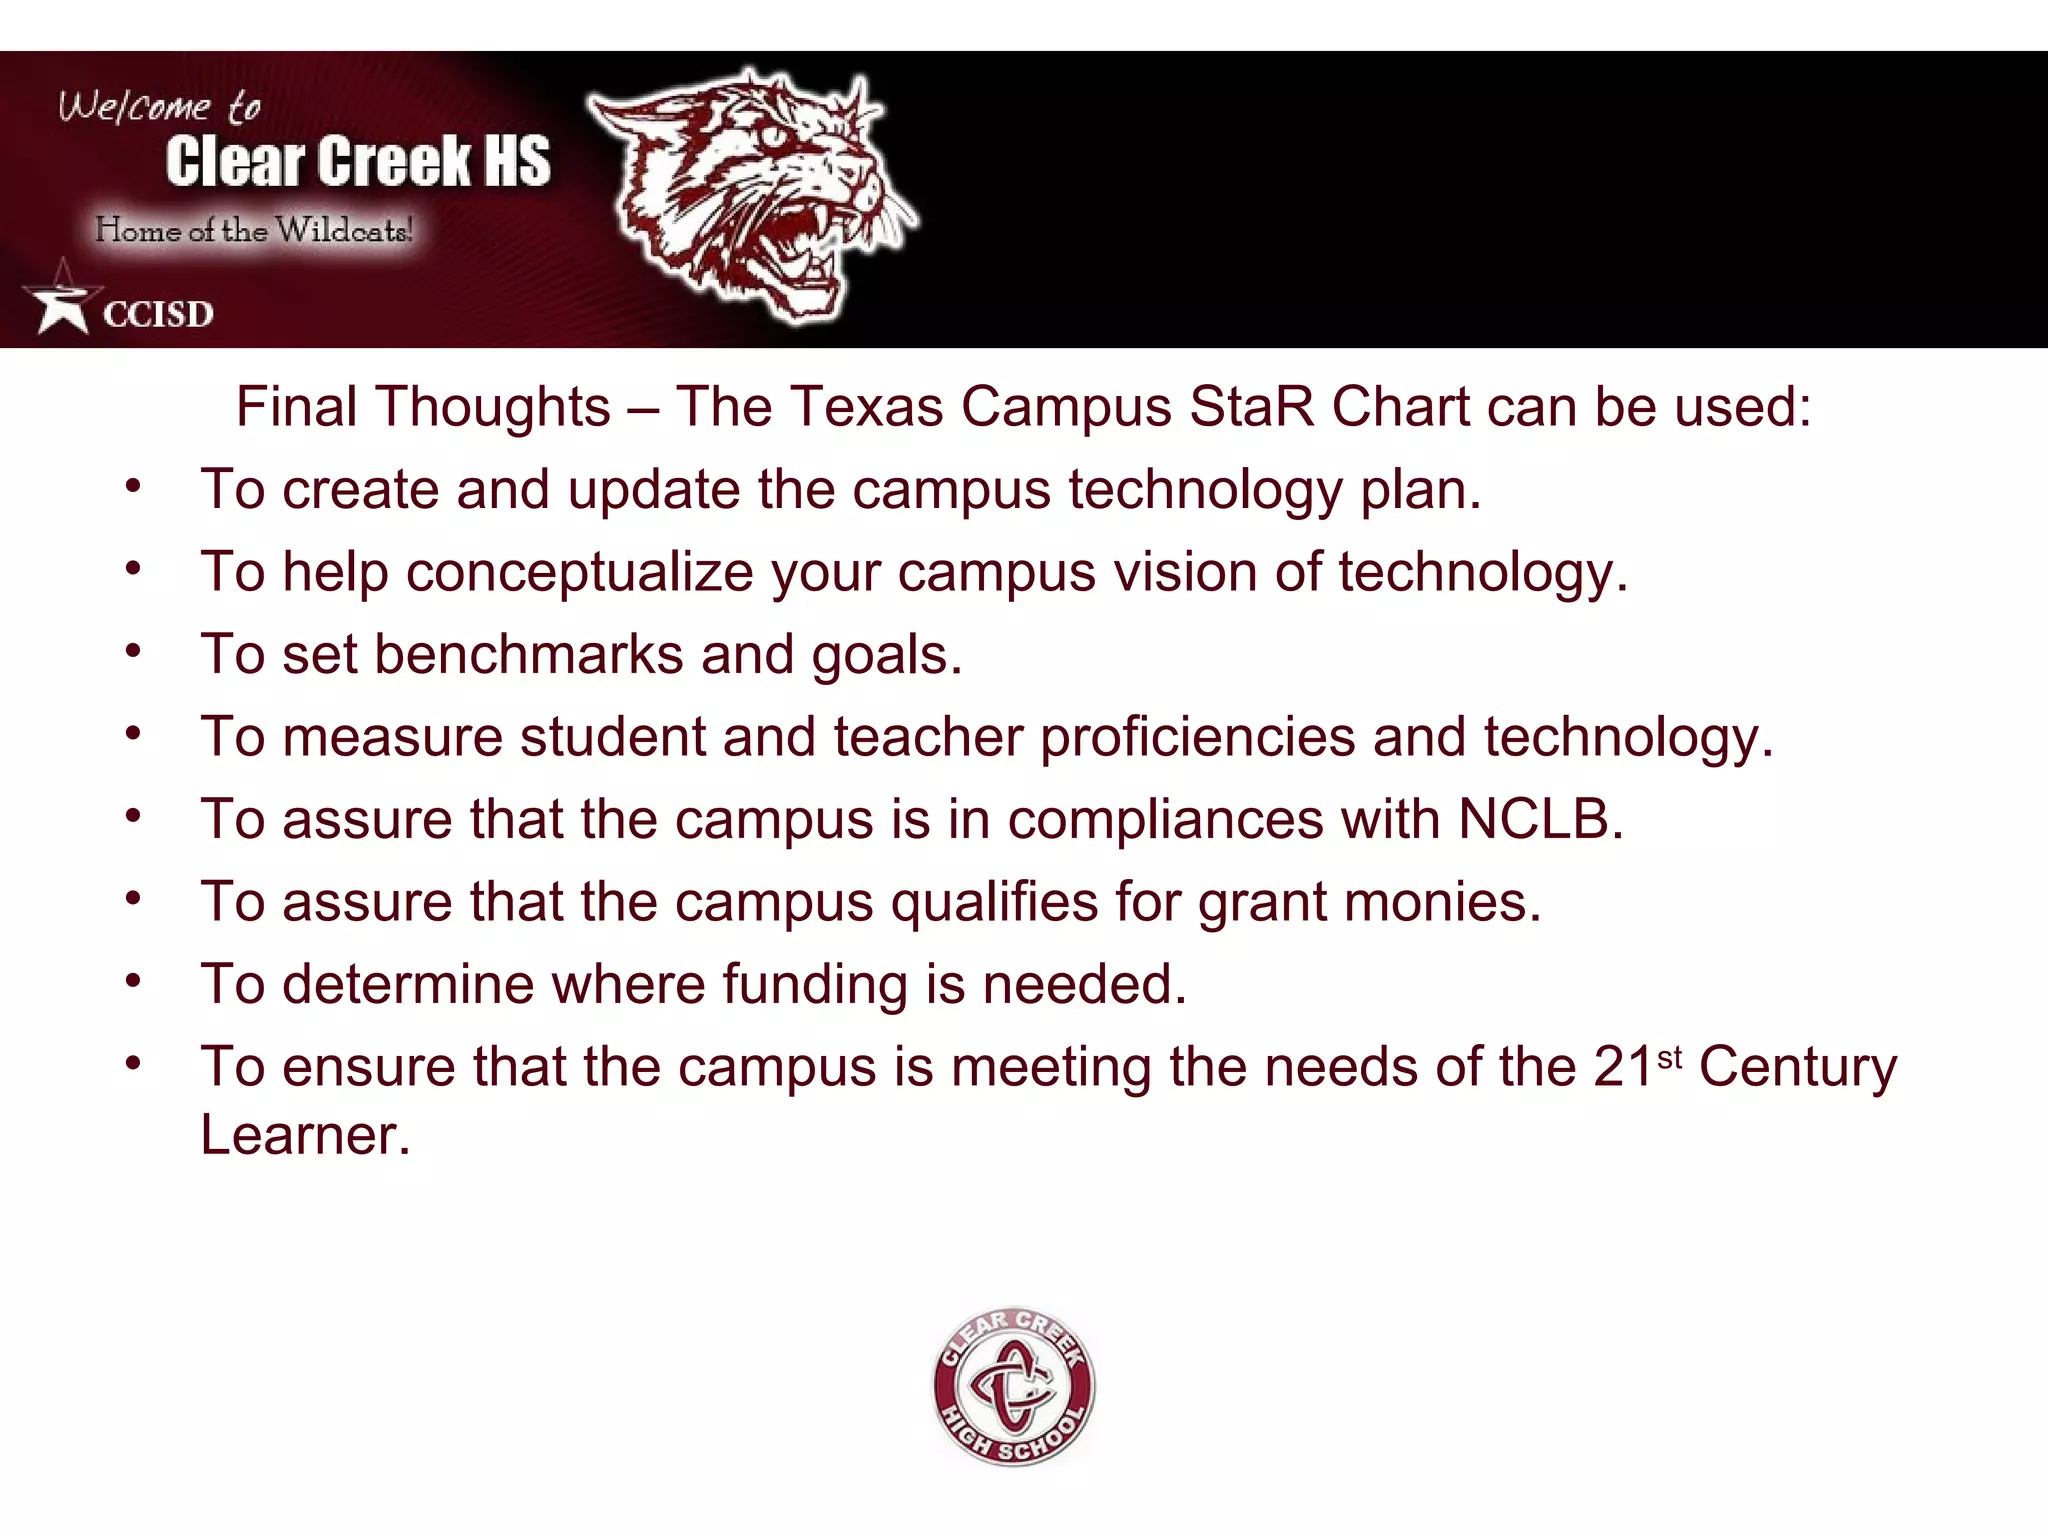
4) Brainstorming goals to improve weaknesses identified in the StaR Chart data.


![Texas s ta_r_chart[1]](https://cdn.slidesharecdn.com/ss_thumbnails/texasstarchart1-110306141741-phpapp01-thumbnail.jpg?width=640&height=640&fit=bounds)


![Texas S Ta R Chart[1]](https://cdn.slidesharecdn.com/ss_thumbnails/texasstarchart1-091201180433-phpapp01-thumbnail.jpg?width=640&height=640&fit=bounds)


![Eim 2.7.20 시연용final[10.25]](https://cdn.slidesharecdn.com/ss_thumbnails/eim2-7-20final10-25-101103060918-phpapp02-thumbnail.jpg?width=640&height=640&fit=bounds)


