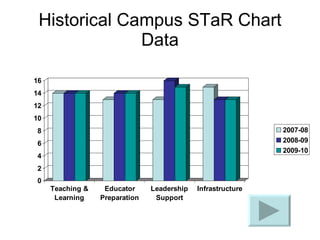
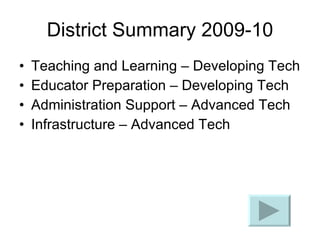
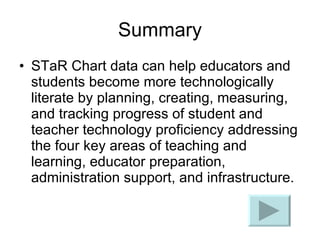
TEXAS STaR CHART S chool  T echnology  a nd  R eadiness Presented by Geri Williams
Purpose of Learning Gain an understanding of the STaR Chart Understand  the purpose of collected data Evaluate  data for planning and setting goals Implement  strategies for improvement
HISTORICAL ROOTS No Child Left Behind Act of 2001 requires that students be technology literate by the end of eighth grade.
Understanding the STaR Chart Profiles campus status in meeting technology goals Ranks campuses on levels of progress Allows stakeholders to view campus technology readiness
Purpose of the STaR Chart Create or update campus technology plans Set benchmarks and goals Measure teacher and student technological proficiencies
Continued….. Determine funding priorities Track progress on use of No Child Left Behind Title II funds
Evaluate Data Allows campuses to determine which key areas are strengths and weaknesses for future improvement towards student success
Implementing Strategies for Improvement Strategies for improvement are based on the key areas of the STaR Chart: Teaching & Learning Educator Preparation Administration & Support Infrastructure
 
Campus Summary 2009-10 Teaching and learning – Developing Tech Educator Preparation & Development – Developing Tech Leadership Support – Advanced Tech Infrastructure – Developing Tech
Historical Campus STaR Chart Data
District Summary 2009-10 Teaching and Learning – Developing Tech Educator Preparation – Developing Tech Administration Support – Advanced Tech Infrastructure – Advanced Tech
Summary STaR Chart data can help educators and students become more technologically literate by planning, creating, measuring, and tracking progress of student and teacher technology proficiency addressing the four key areas of teaching and learning, educator preparation, administration support, and infrastructure.
Resource http://starchart.esc12.net/

Texas s ta r chart powerpoint

  • 1.
    TEXAS STaR CHARTS chool T echnology a nd R eadiness Presented by Geri Williams
  • 2.
    Purpose of LearningGain an understanding of the STaR Chart Understand the purpose of collected data Evaluate data for planning and setting goals Implement strategies for improvement
  • 3.
    HISTORICAL ROOTS NoChild Left Behind Act of 2001 requires that students be technology literate by the end of eighth grade.
  • 4.
    Understanding the STaRChart Profiles campus status in meeting technology goals Ranks campuses on levels of progress Allows stakeholders to view campus technology readiness
  • 5.
    Purpose of theSTaR Chart Create or update campus technology plans Set benchmarks and goals Measure teacher and student technological proficiencies
  • 6.
    Continued….. Determine fundingpriorities Track progress on use of No Child Left Behind Title II funds
  • 7.
    Evaluate Data Allowscampuses to determine which key areas are strengths and weaknesses for future improvement towards student success
  • 8.
    Implementing Strategies forImprovement Strategies for improvement are based on the key areas of the STaR Chart: Teaching & Learning Educator Preparation Administration & Support Infrastructure
  • 9.
  • 10.
    Campus Summary 2009-10Teaching and learning – Developing Tech Educator Preparation & Development – Developing Tech Leadership Support – Advanced Tech Infrastructure – Developing Tech
  • 11.
  • 12.
    District Summary 2009-10Teaching and Learning – Developing Tech Educator Preparation – Developing Tech Administration Support – Advanced Tech Infrastructure – Advanced Tech
  • 13.
    Summary STaR Chartdata can help educators and students become more technologically literate by planning, creating, measuring, and tracking progress of student and teacher technology proficiency addressing the four key areas of teaching and learning, educator preparation, administration support, and infrastructure.
  • 14.