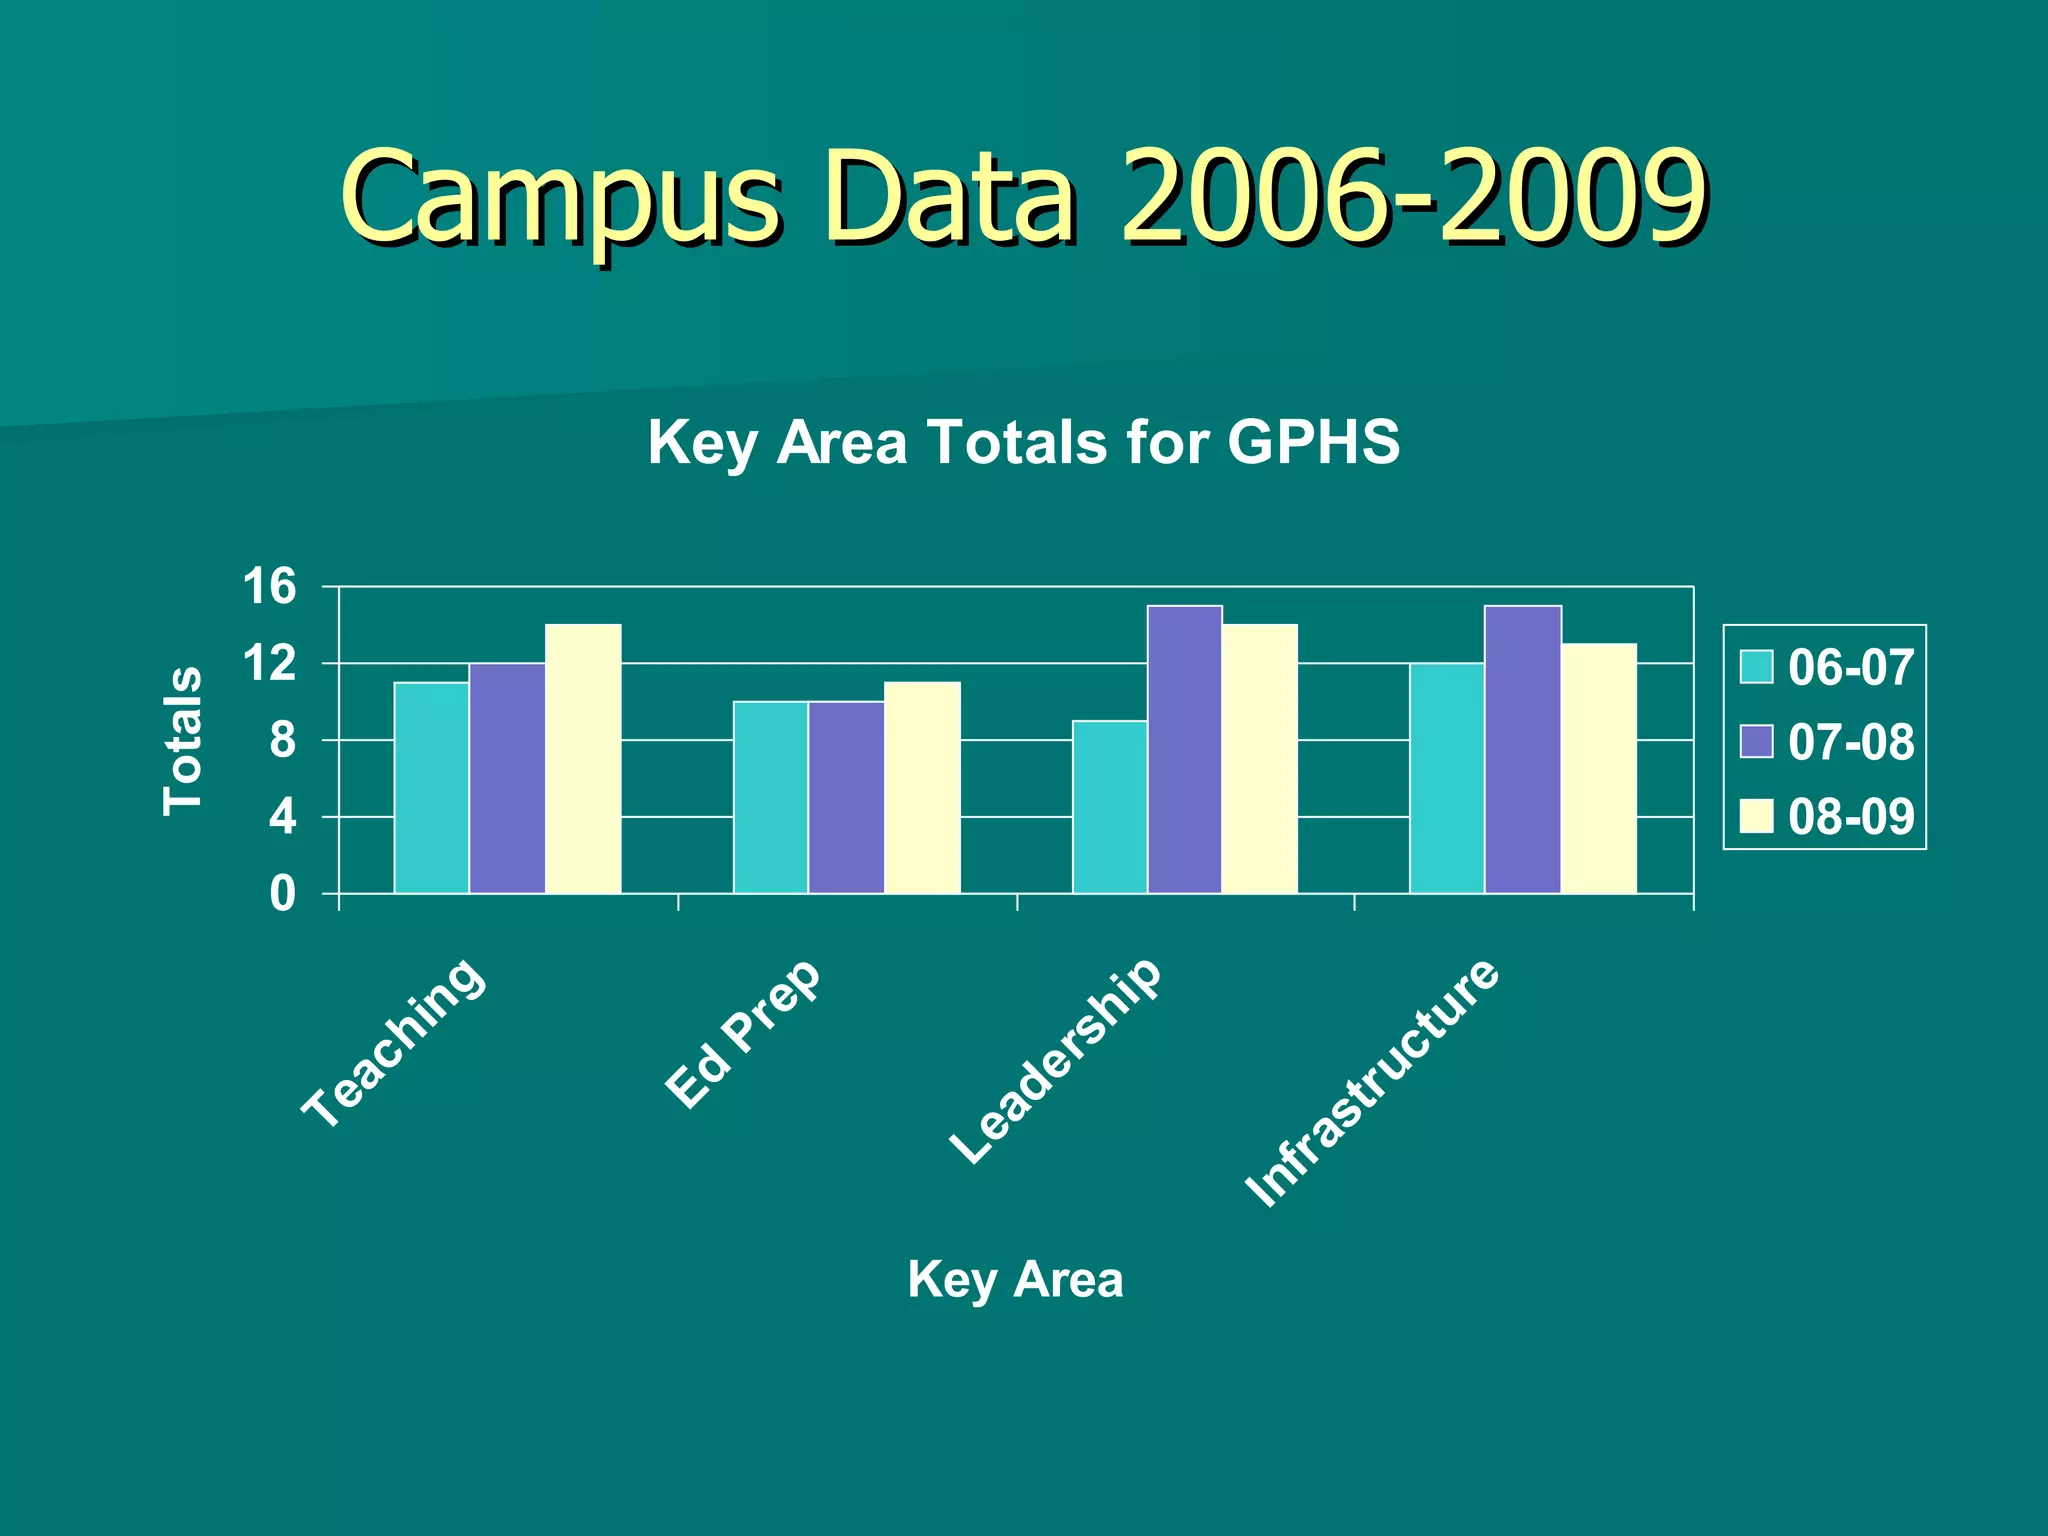
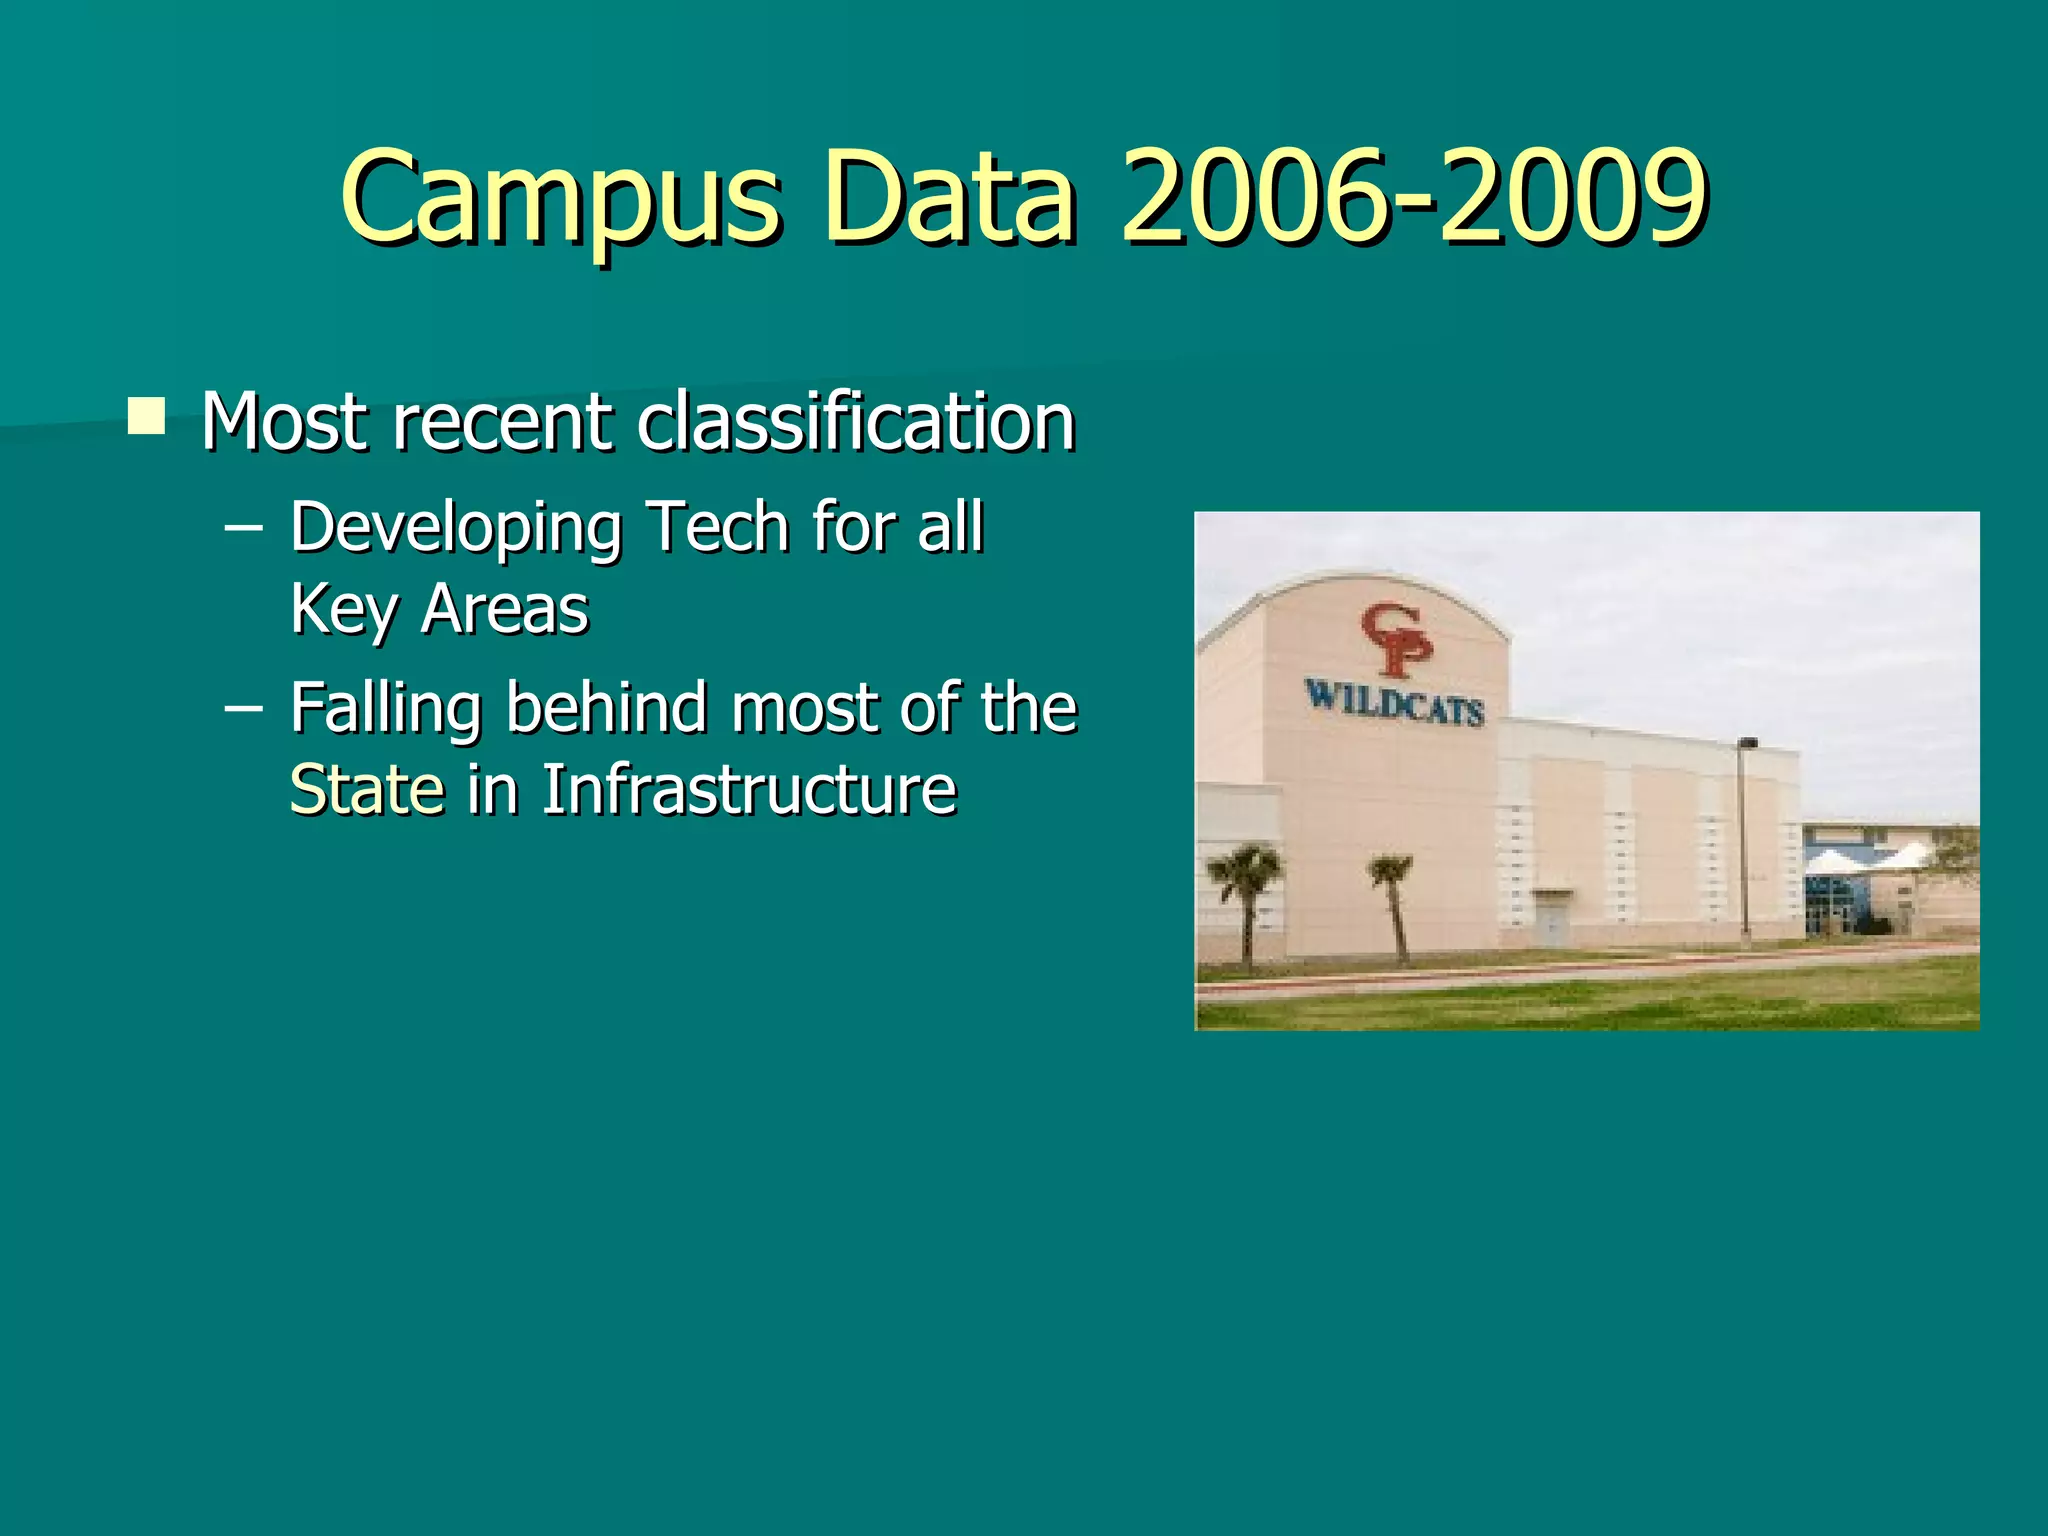
Texas STaR Chart 2006-2009 Analysis Gregory-Portland High School
Agenda Explain Campus STaR Chart Analyze Recent Data Recommend Action
What is the Campus STaR Chart? STaR= S chool  T echnology  a nd  R eadiness Online, self-assessment tool Aligned with  Texas Long-Range Plan for Technology  and No Child Left Behind standards Measures campus technology preparedness and integration Used for planning, budgeting, and progress evaluation
What is the Campus STaR Chart? Key Areas Teaching & Learning Educator Prep & Development Leadership, Admin, & Instructional Support Infrastructure for Technology
What is the Campus STaR Chart? Key Area Classifications 1=Early Tech 2=Developing Tech 3=Advanced Tech 4=Target Tech
Campus Data 2006-2009
Campus Data 2006-2009 Significant gains Online Learning Content Area Connections Communication and Collaboration
Campus Data 2006-2009 Declining or stagnant areas Professional Development for Online Learning Leadership and Vision Budget Students Per Computers LAN/WAN
Campus Data 2006-2009 Most recent classification Developing Tech for all Key Areas Falling behind most of the  State  in Infrastructure
What Now? Modify Campus Improvement Plan Reprioritize technology budget Increase opportunities for online professional development Collaborate with other campuses that have had more progress
Conclusion STaR Chart Useful tool to gauge progress Campus Data Developing Tech in all Key Areas Necessary Actions Change improvement plan to fill gaps
Teaching and Learning Patterns of Classroom Use Frequency/Design of Instructional Setting Content Area Connections TEKS Implementation Student Mastery of Tech Applications Online Learning Back to Diagram
Educator Prep and Development Professional Development Experiences Models of Professional Development Capabilities of Educators Access to Professional Development Levels of Understanding and Patterns of Use Professional Development for Online Learning Back to Diagram
Leadership and Instructional Support Leadership and Vision Planning Instructional Support Communication and Collaboration Budget Leadership and Support for Online Learning Back to Diagram
Infrastructure for Technology Students Per Computers Internet Access Connectivity Speed Other Classroom Technology Technical Support LAN/WAN Distance Learning Capacity Back to Diagram

Texas S Ta R Chart

  • 1.
    Texas STaR Chart2006-2009 Analysis Gregory-Portland High School
  • 2.
    Agenda Explain CampusSTaR Chart Analyze Recent Data Recommend Action
  • 3.
    What is theCampus STaR Chart? STaR= S chool T echnology a nd R eadiness Online, self-assessment tool Aligned with Texas Long-Range Plan for Technology and No Child Left Behind standards Measures campus technology preparedness and integration Used for planning, budgeting, and progress evaluation
  • 4.
    What is theCampus STaR Chart? Key Areas Teaching & Learning Educator Prep & Development Leadership, Admin, & Instructional Support Infrastructure for Technology
  • 5.
    What is theCampus STaR Chart? Key Area Classifications 1=Early Tech 2=Developing Tech 3=Advanced Tech 4=Target Tech
  • 6.
  • 7.
    Campus Data 2006-2009Significant gains Online Learning Content Area Connections Communication and Collaboration
  • 8.
    Campus Data 2006-2009Declining or stagnant areas Professional Development for Online Learning Leadership and Vision Budget Students Per Computers LAN/WAN
  • 9.
    Campus Data 2006-2009Most recent classification Developing Tech for all Key Areas Falling behind most of the State in Infrastructure
  • 10.
    What Now? ModifyCampus Improvement Plan Reprioritize technology budget Increase opportunities for online professional development Collaborate with other campuses that have had more progress
  • 11.
    Conclusion STaR ChartUseful tool to gauge progress Campus Data Developing Tech in all Key Areas Necessary Actions Change improvement plan to fill gaps
  • 12.
    Teaching and LearningPatterns of Classroom Use Frequency/Design of Instructional Setting Content Area Connections TEKS Implementation Student Mastery of Tech Applications Online Learning Back to Diagram
  • 13.
    Educator Prep andDevelopment Professional Development Experiences Models of Professional Development Capabilities of Educators Access to Professional Development Levels of Understanding and Patterns of Use Professional Development for Online Learning Back to Diagram
  • 14.
    Leadership and InstructionalSupport Leadership and Vision Planning Instructional Support Communication and Collaboration Budget Leadership and Support for Online Learning Back to Diagram
  • 15.
    Infrastructure for TechnologyStudents Per Computers Internet Access Connectivity Speed Other Classroom Technology Technical Support LAN/WAN Distance Learning Capacity Back to Diagram