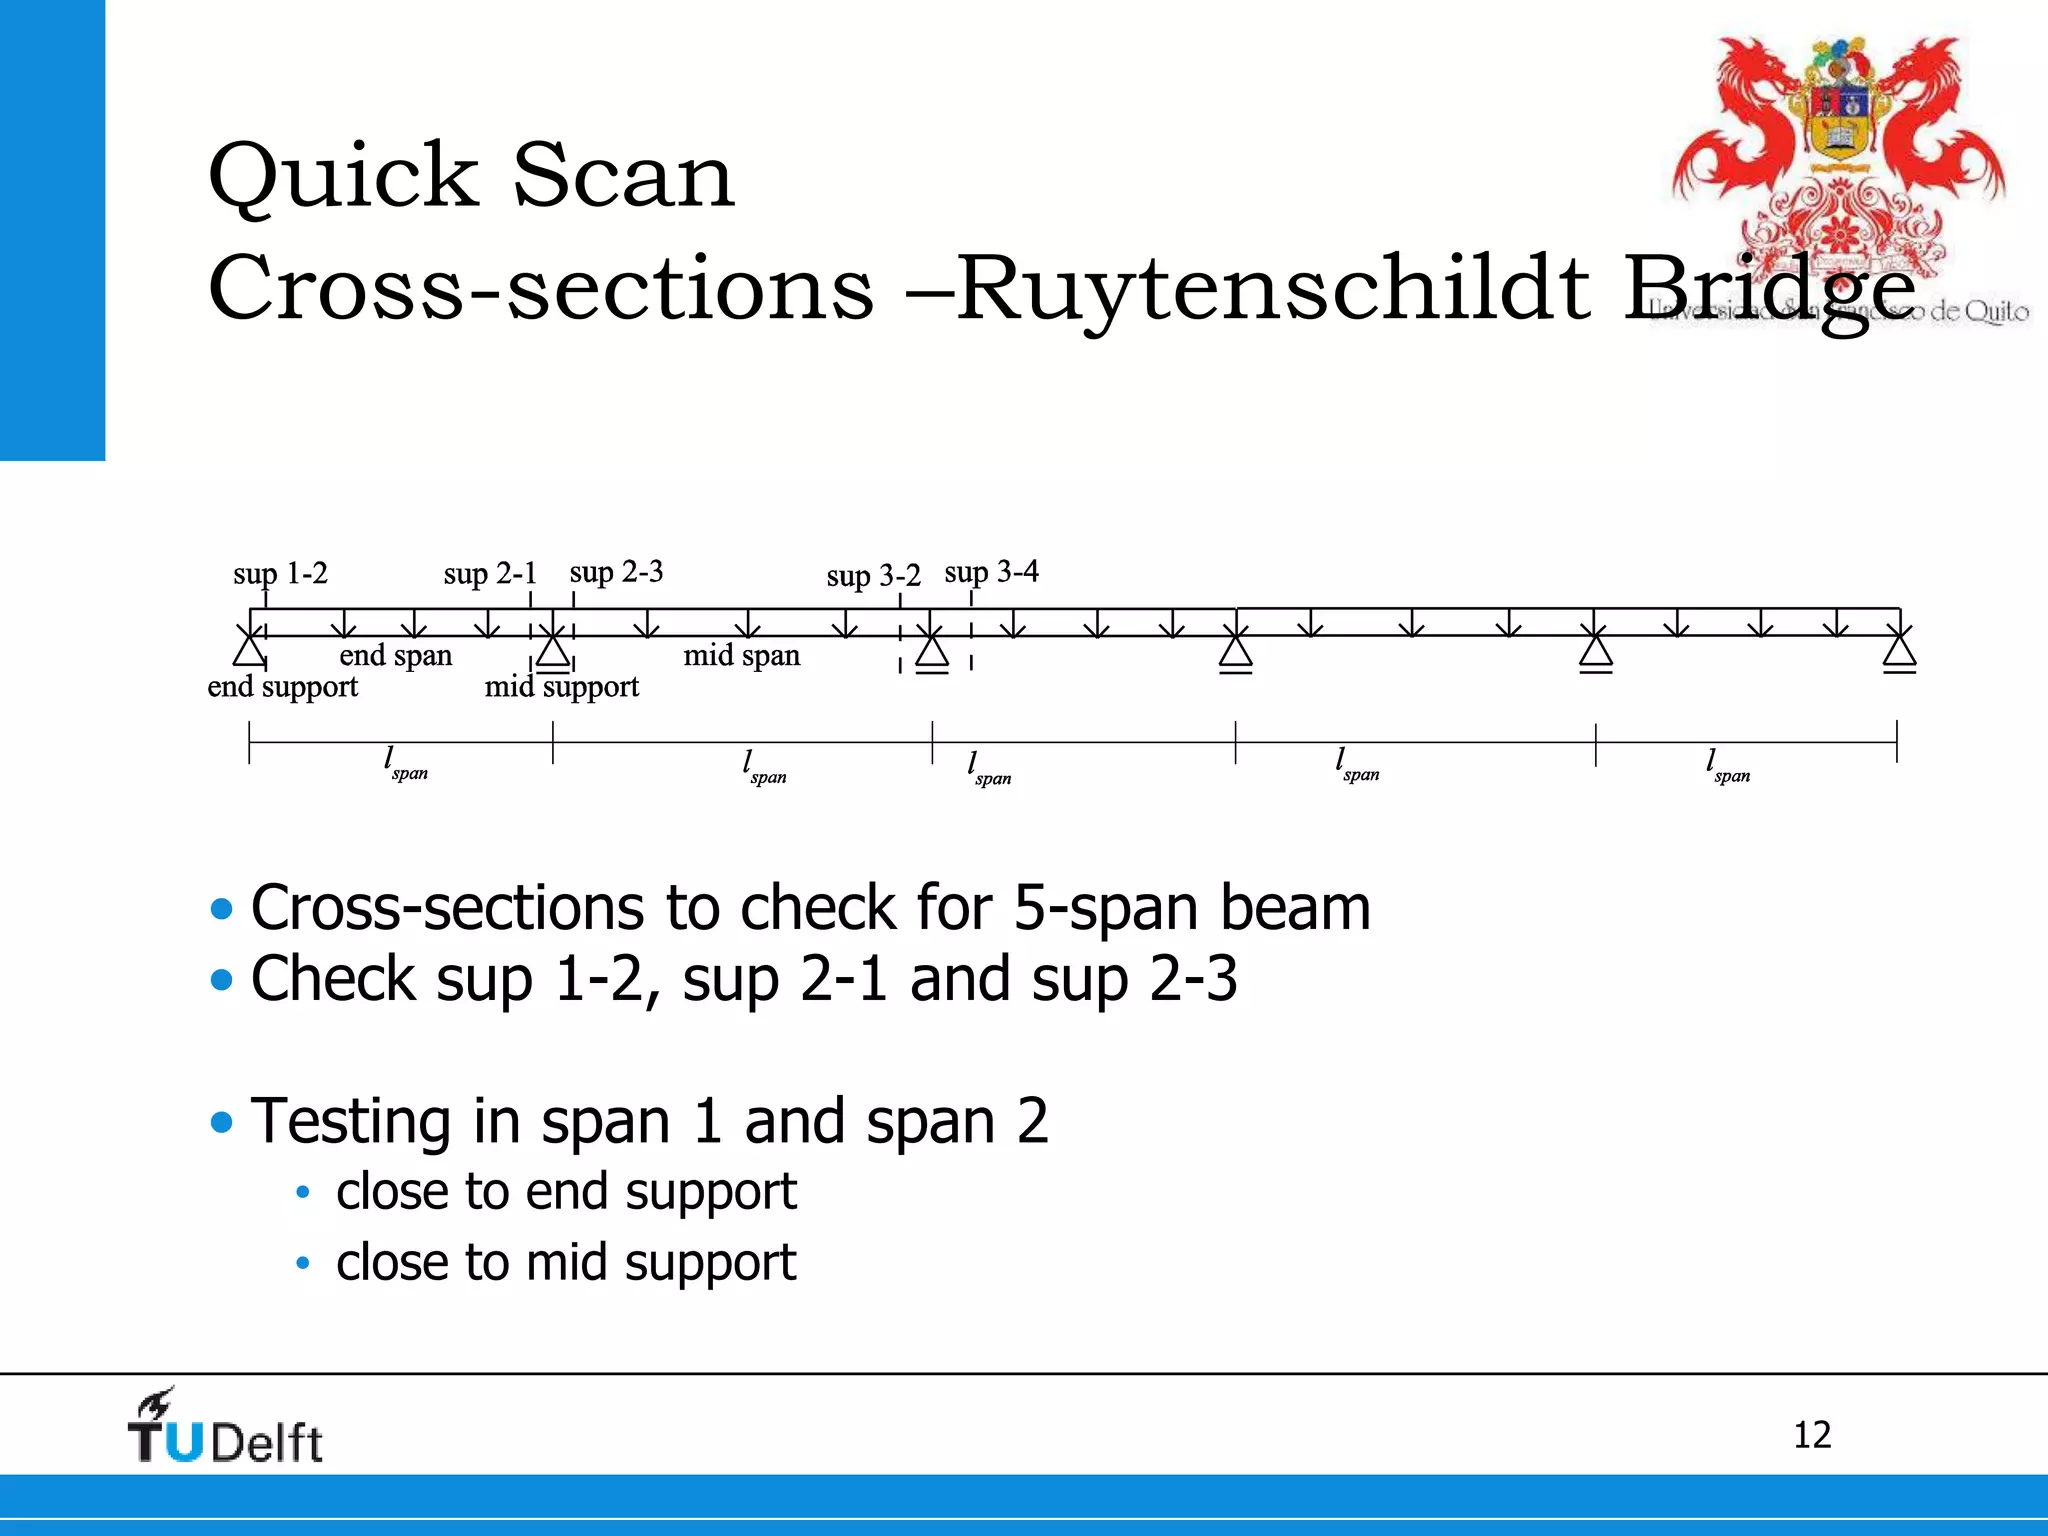
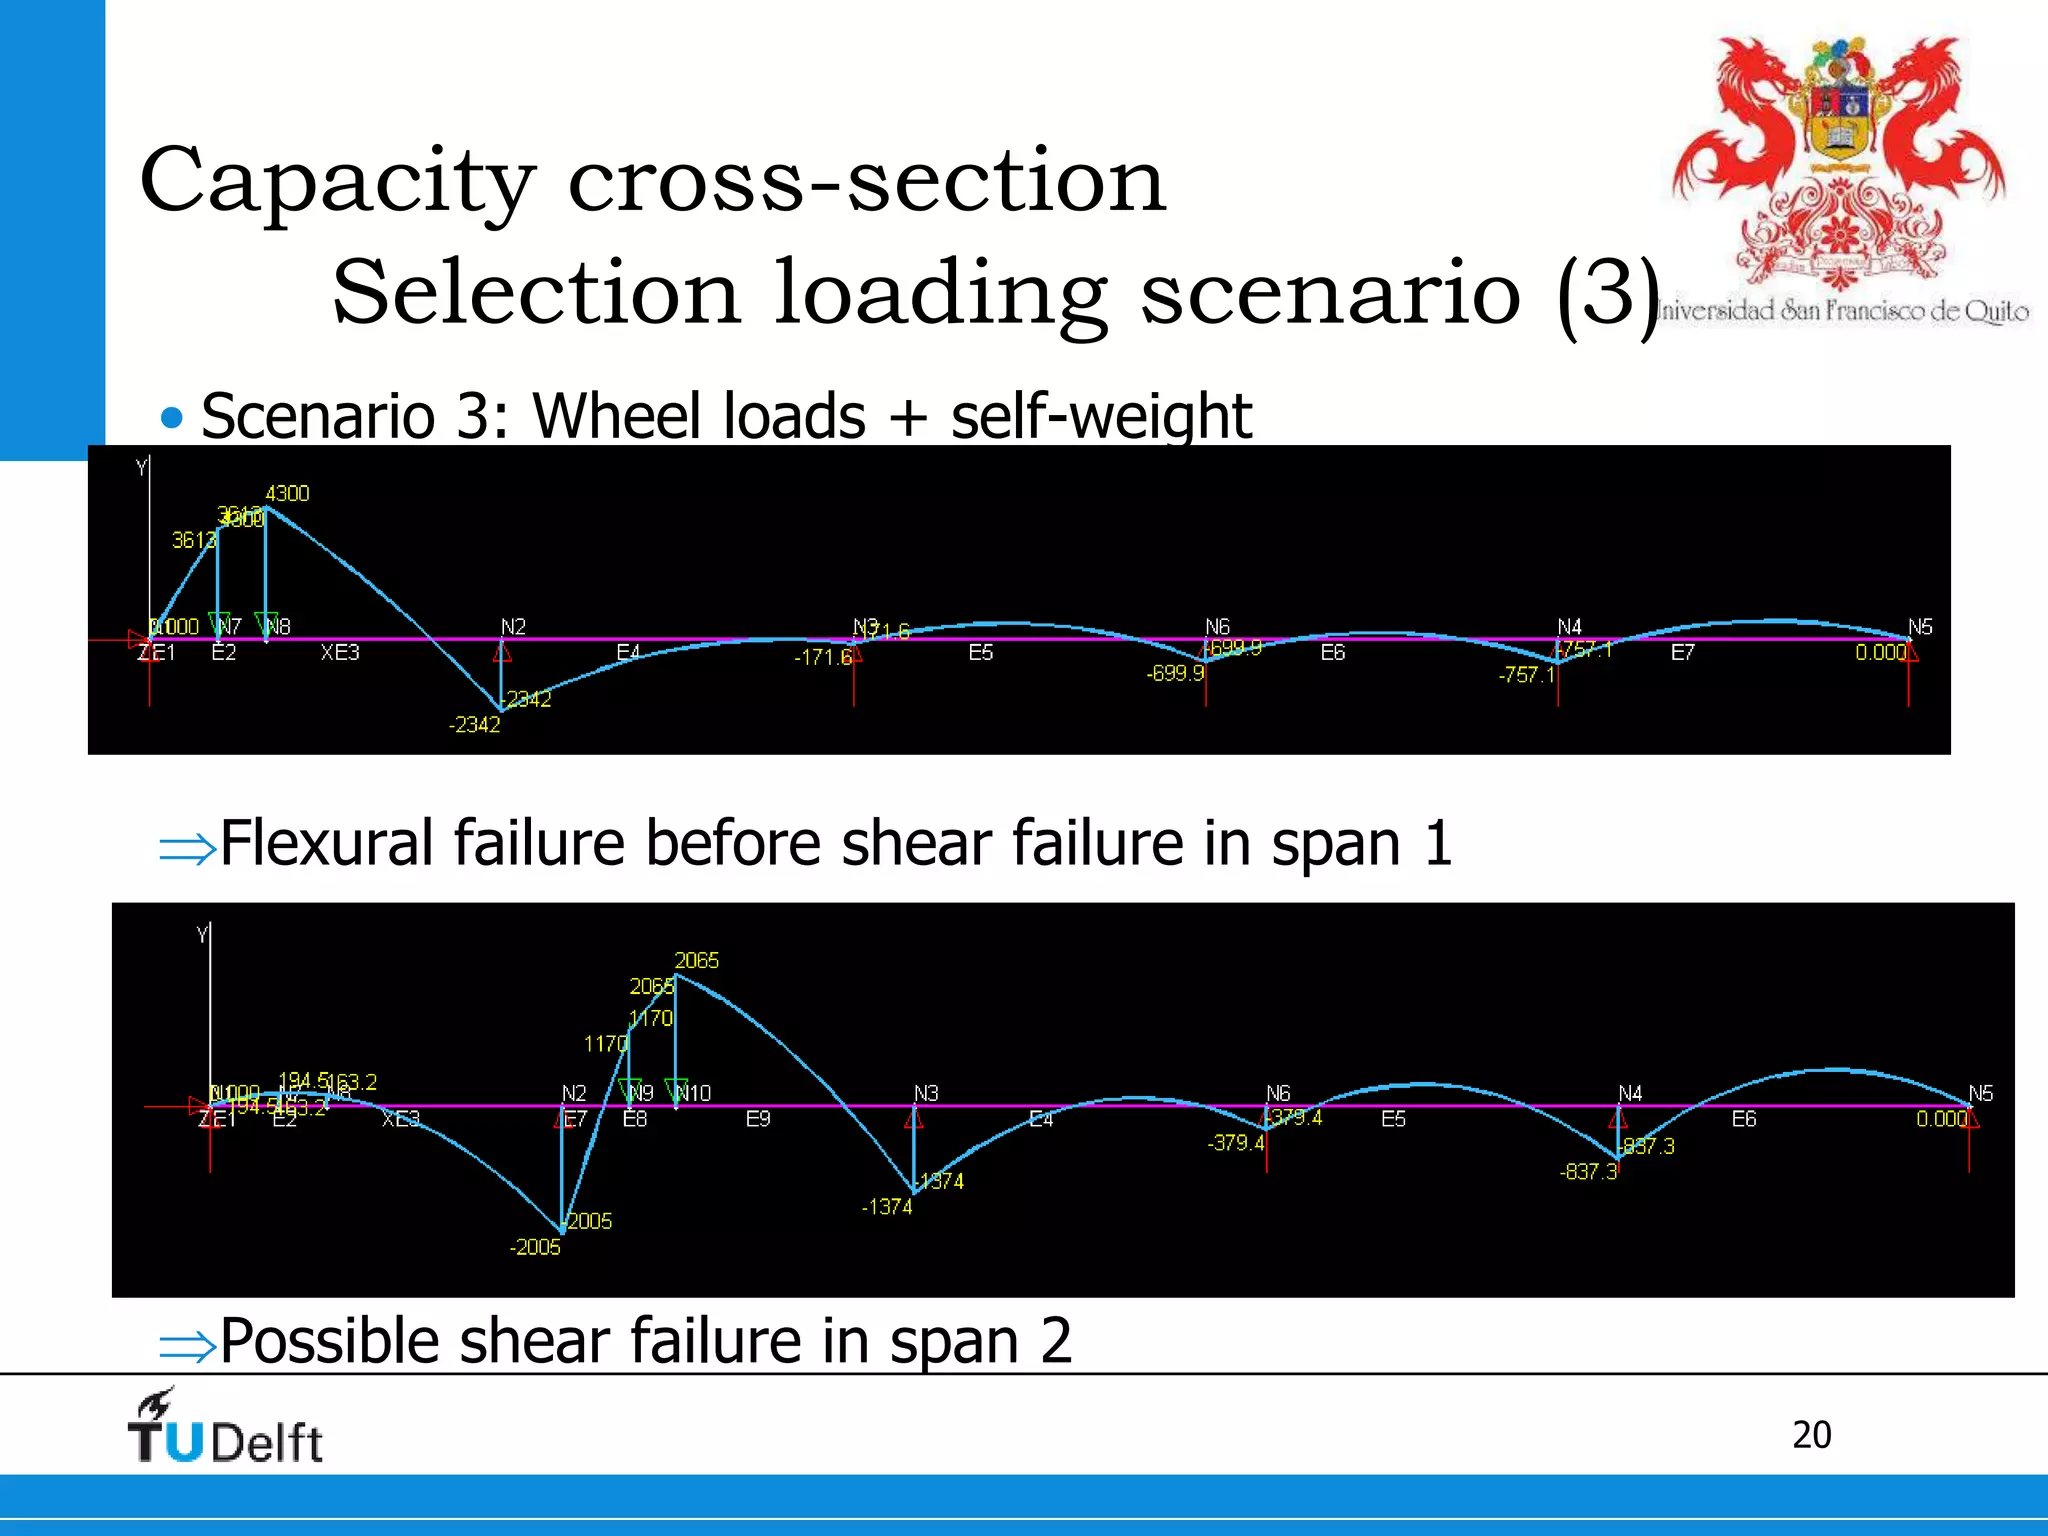
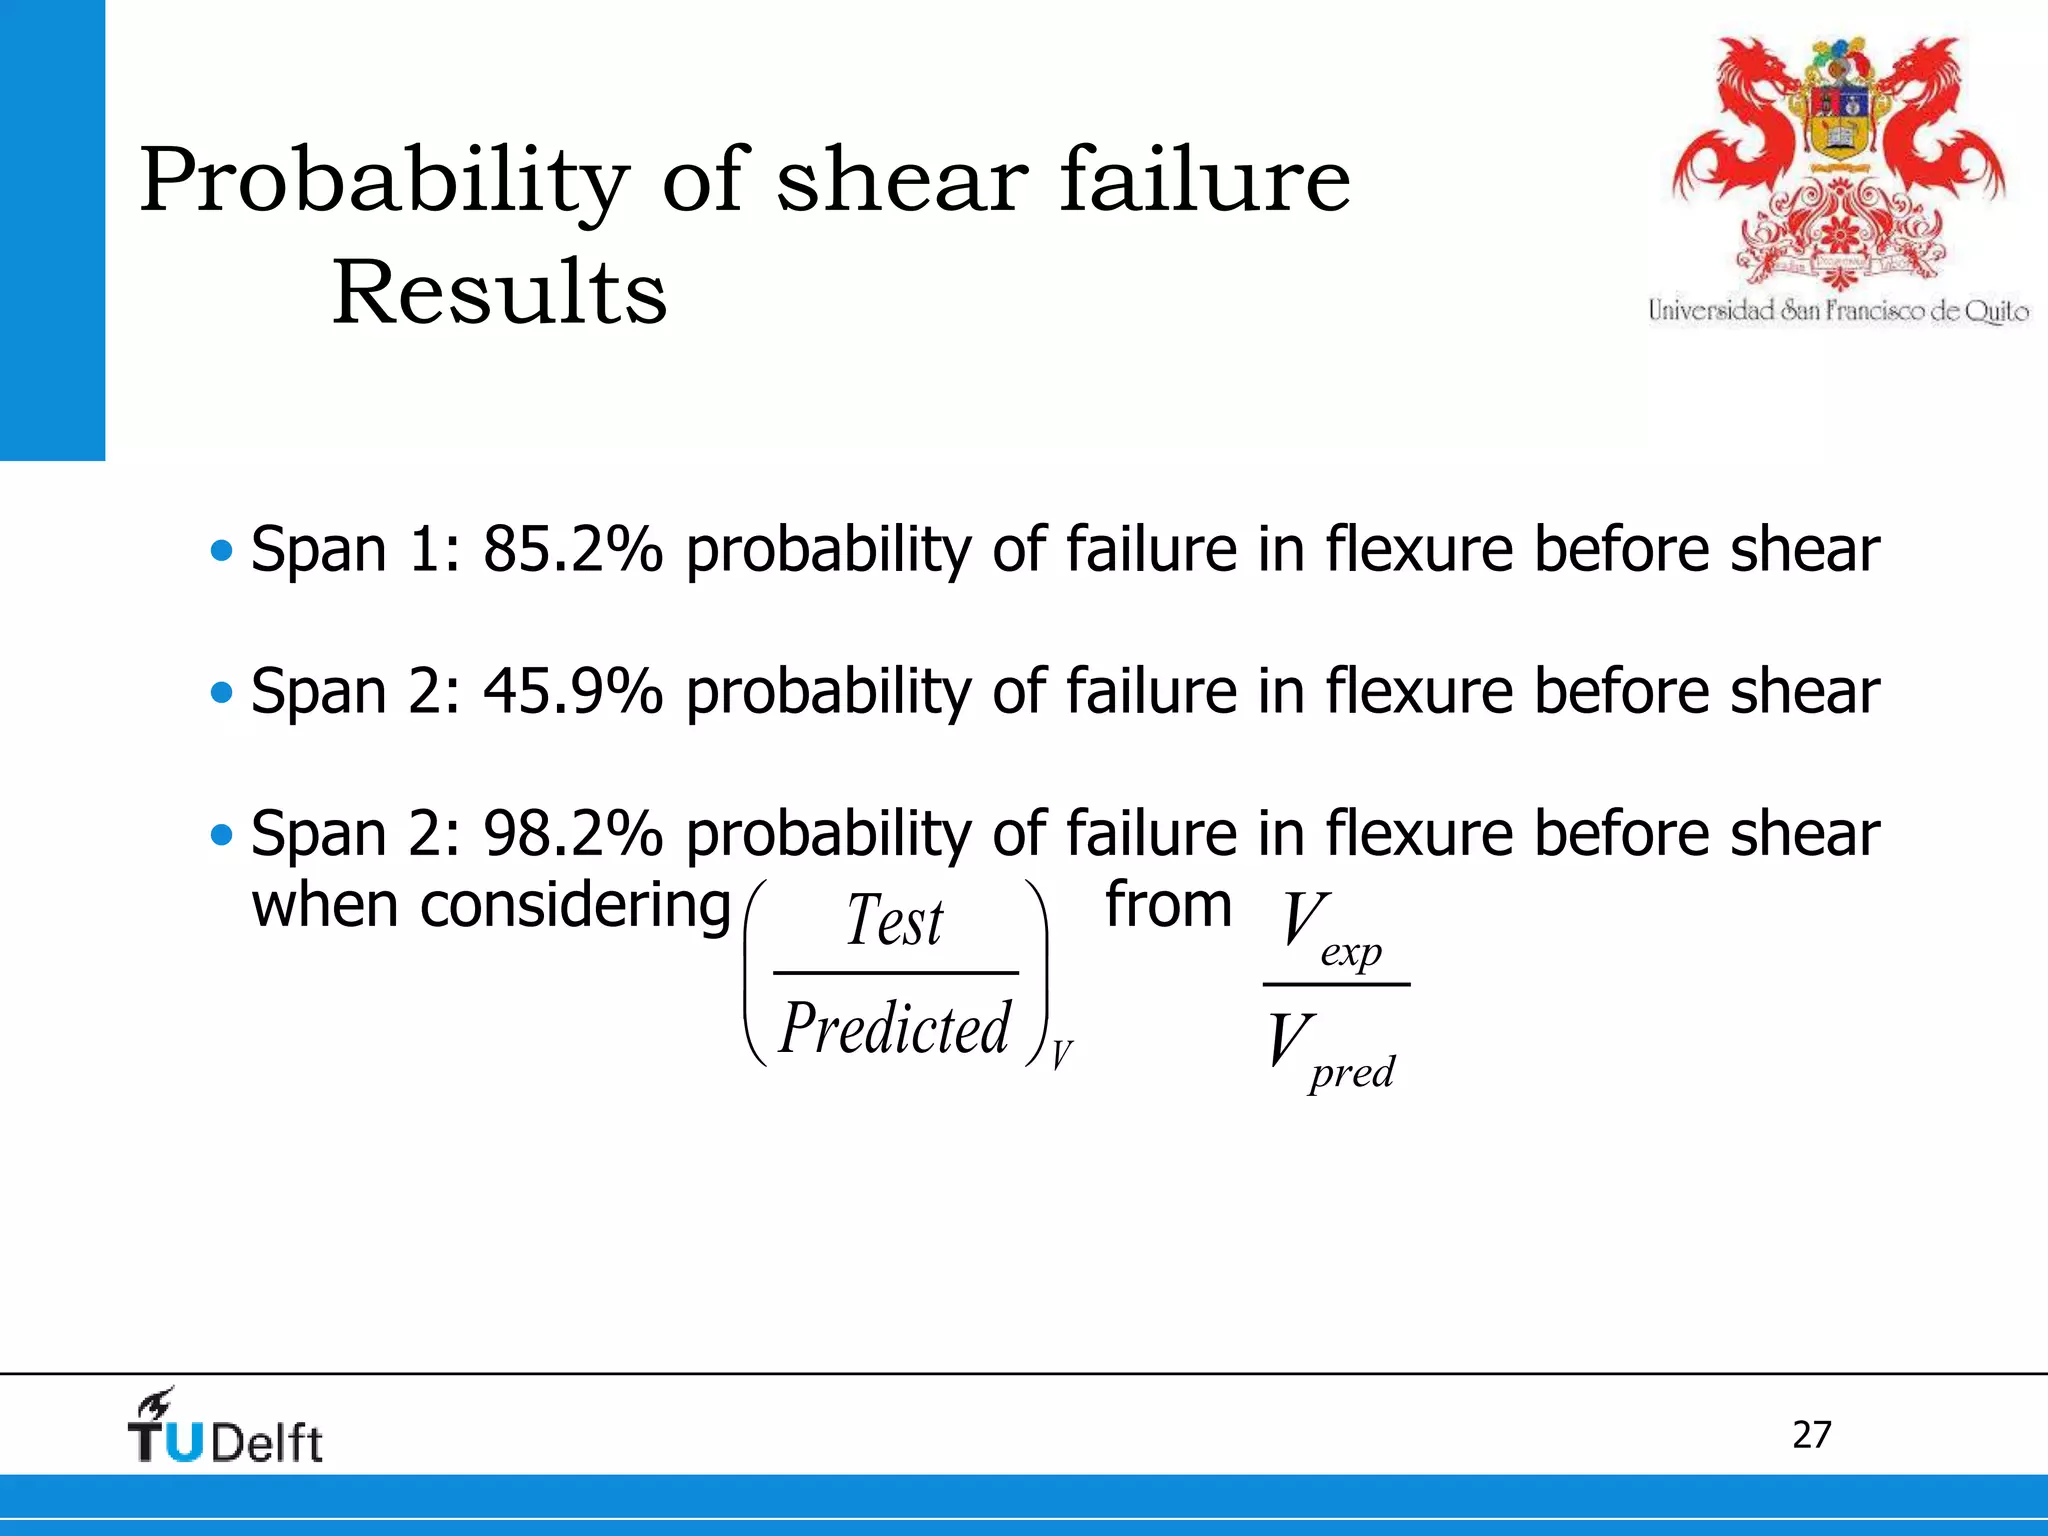
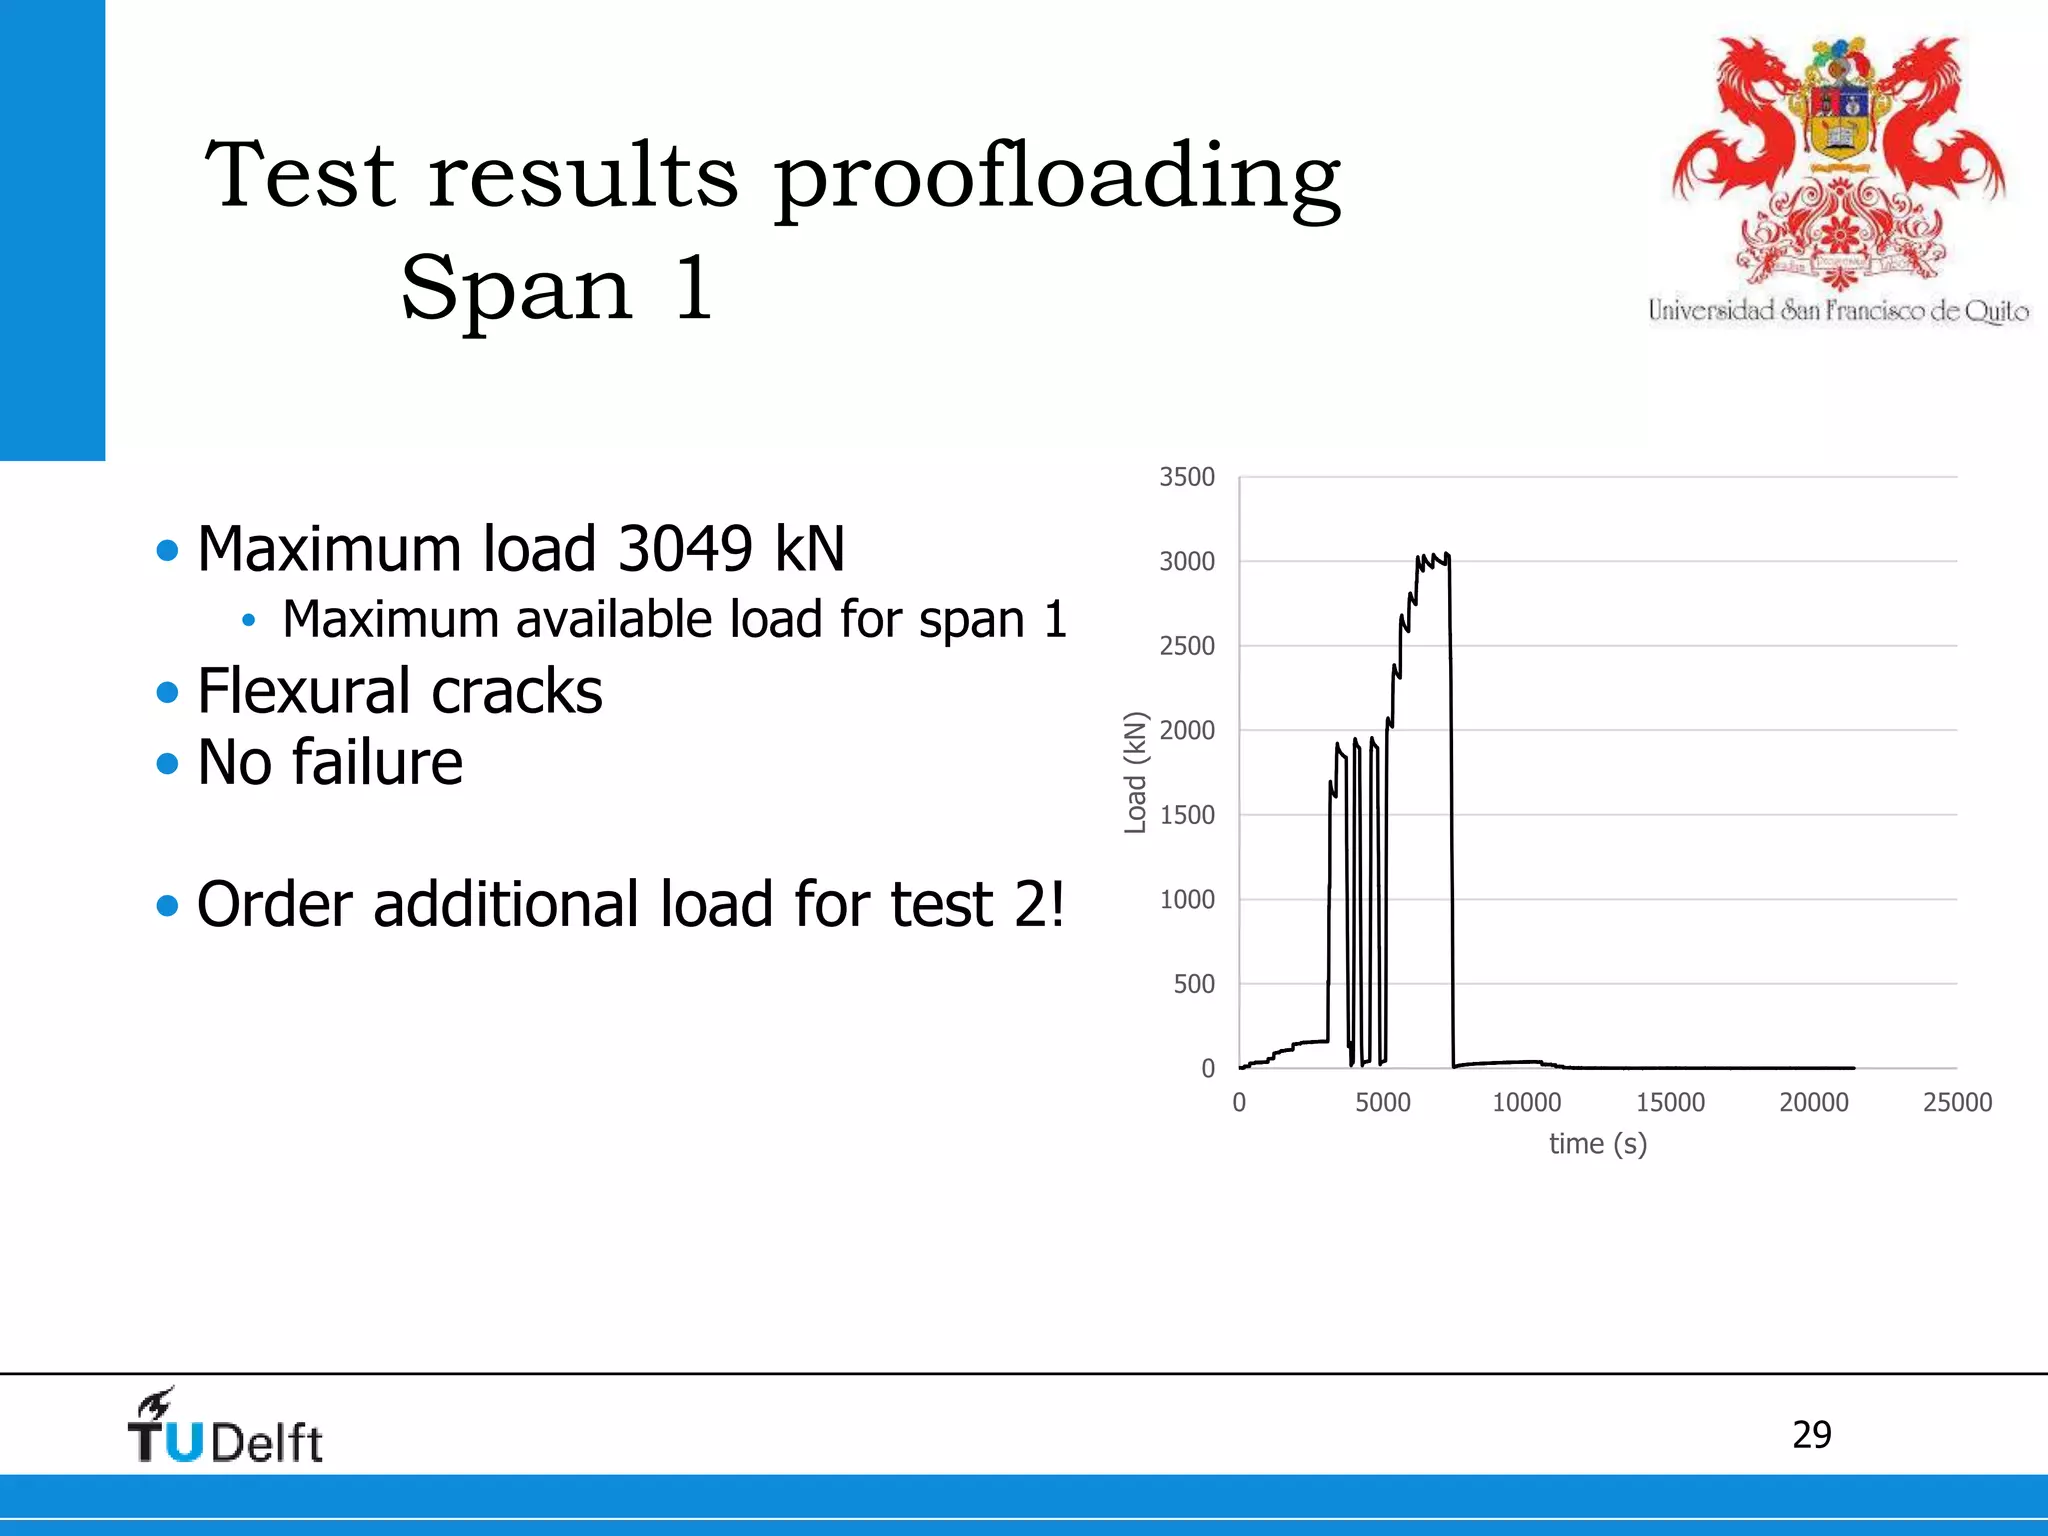
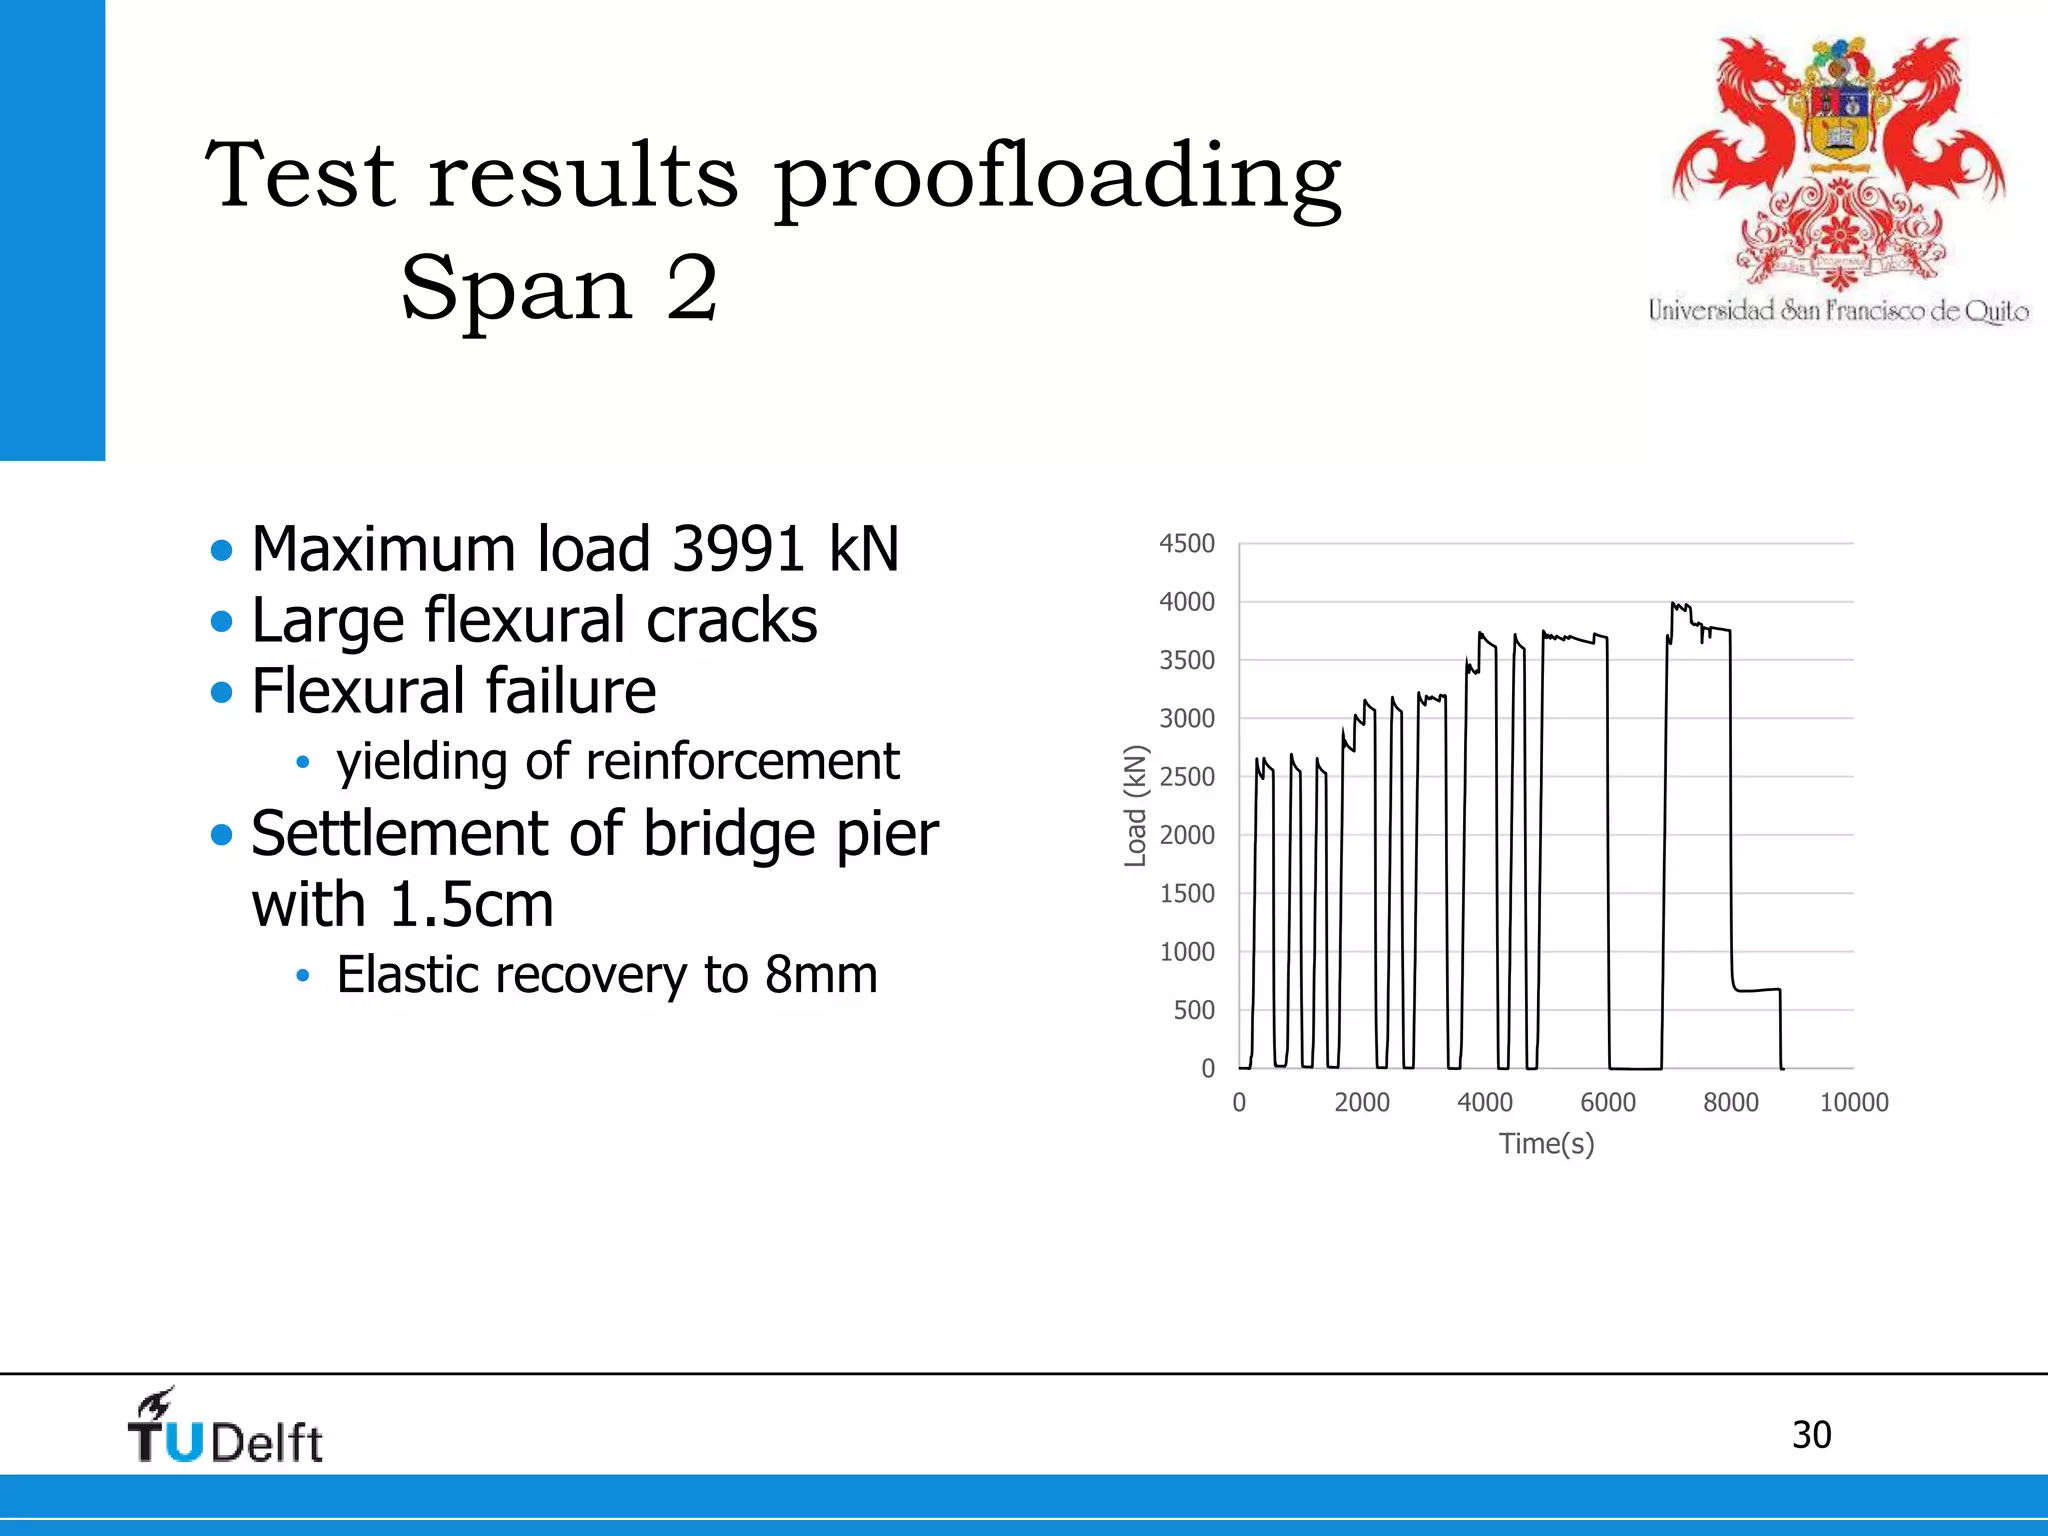
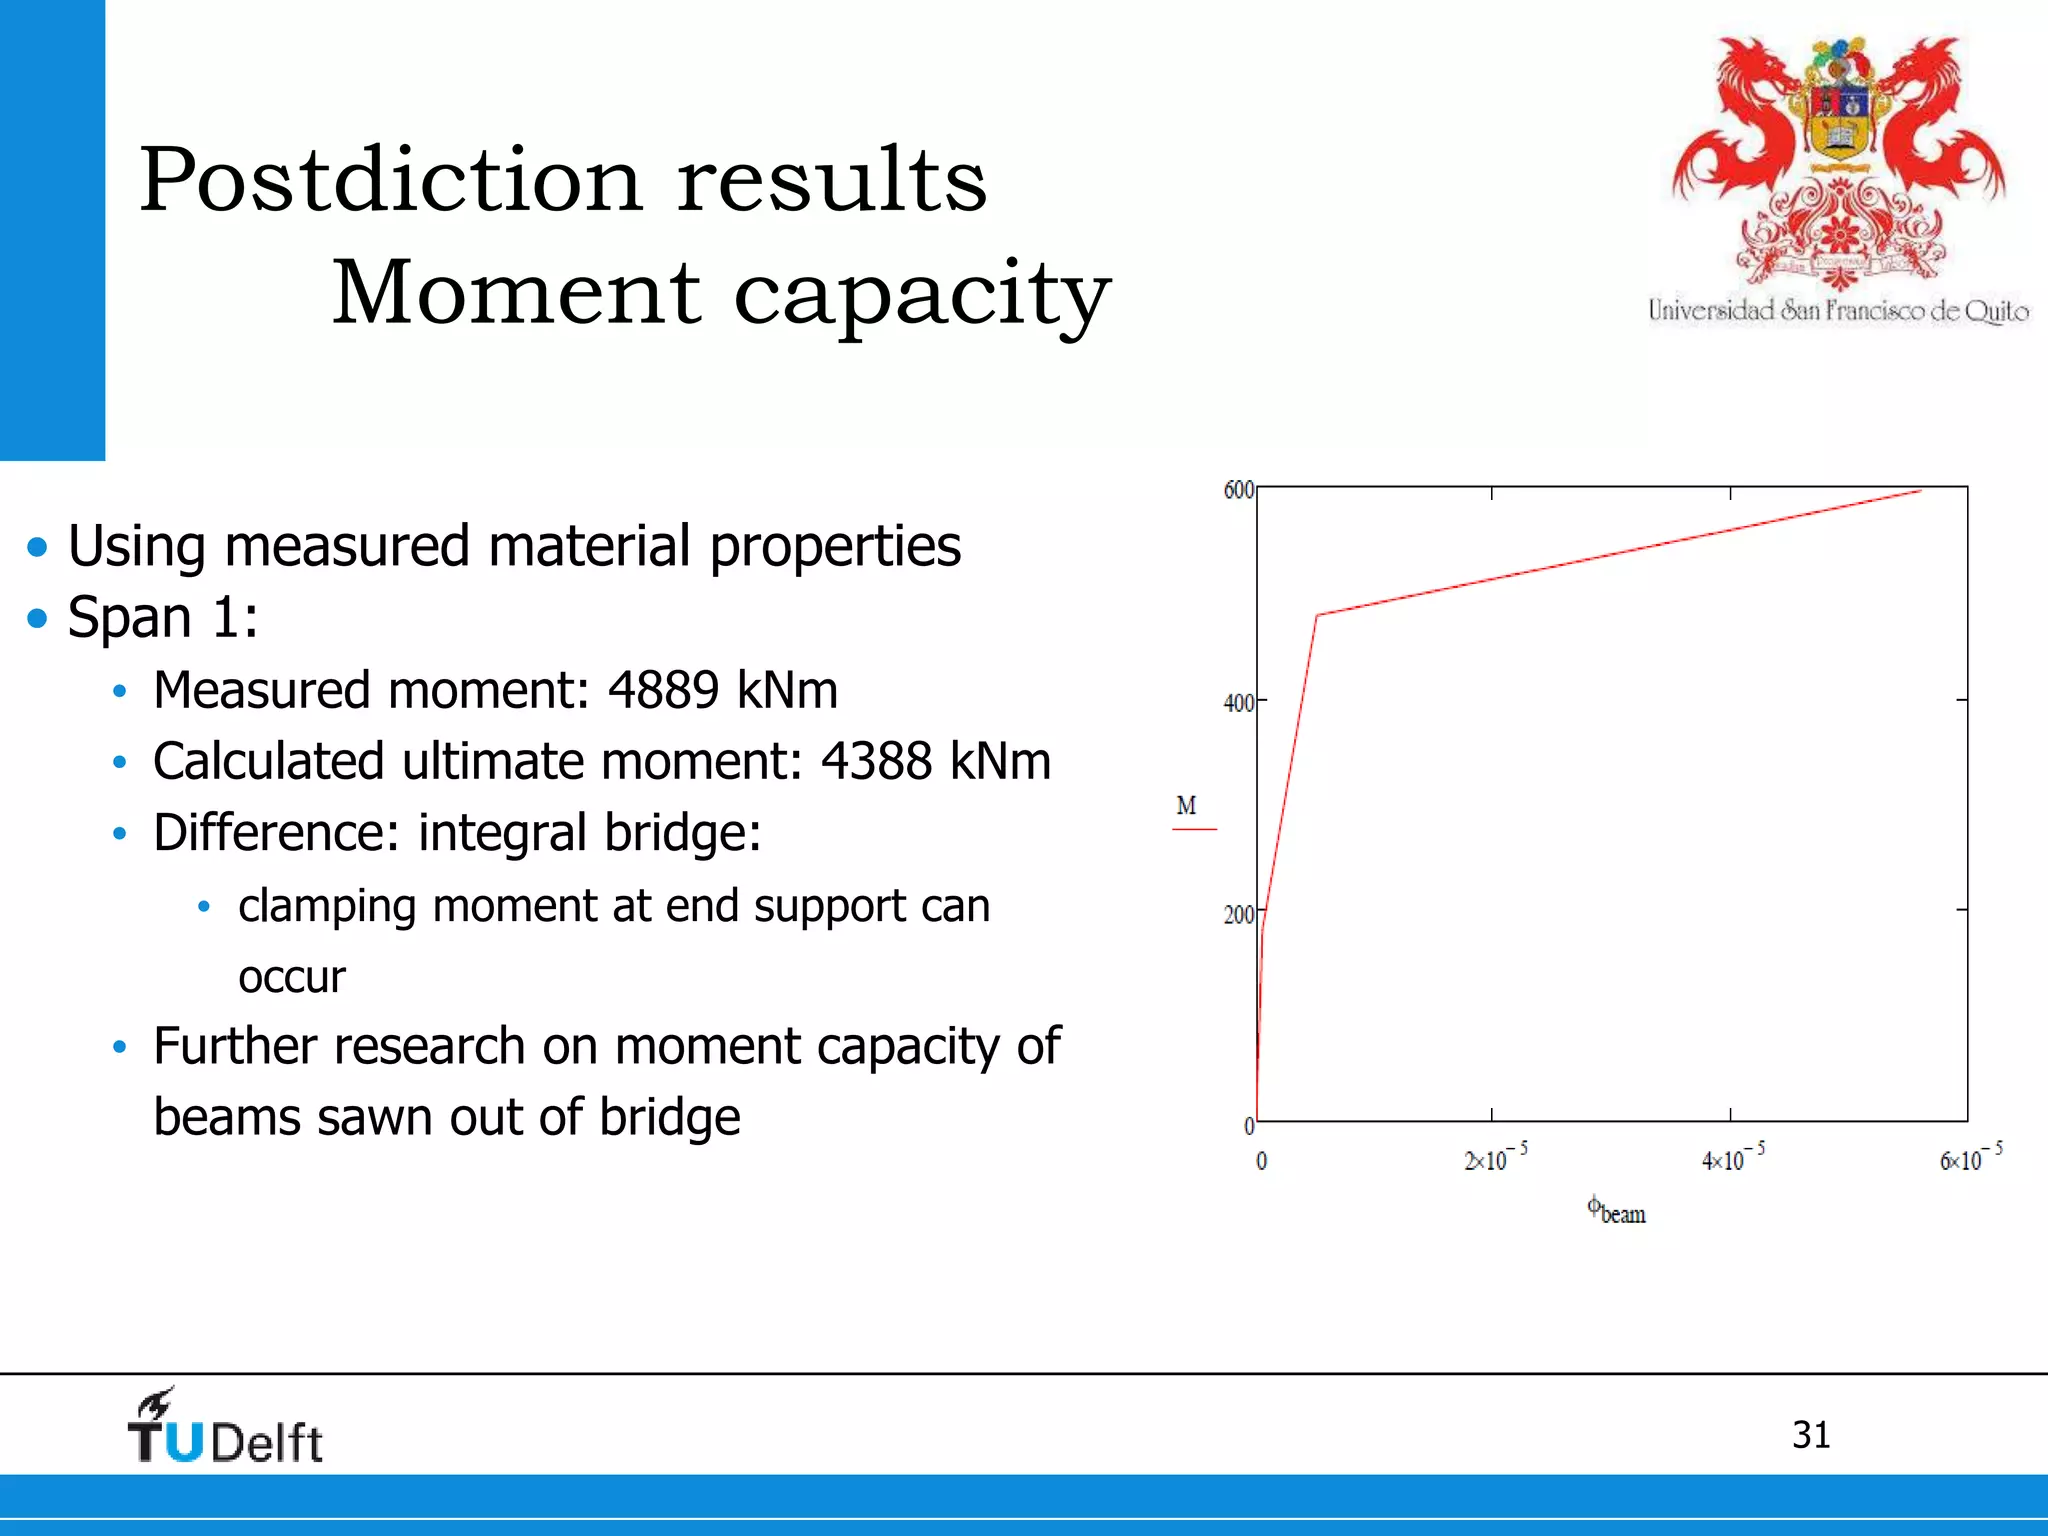
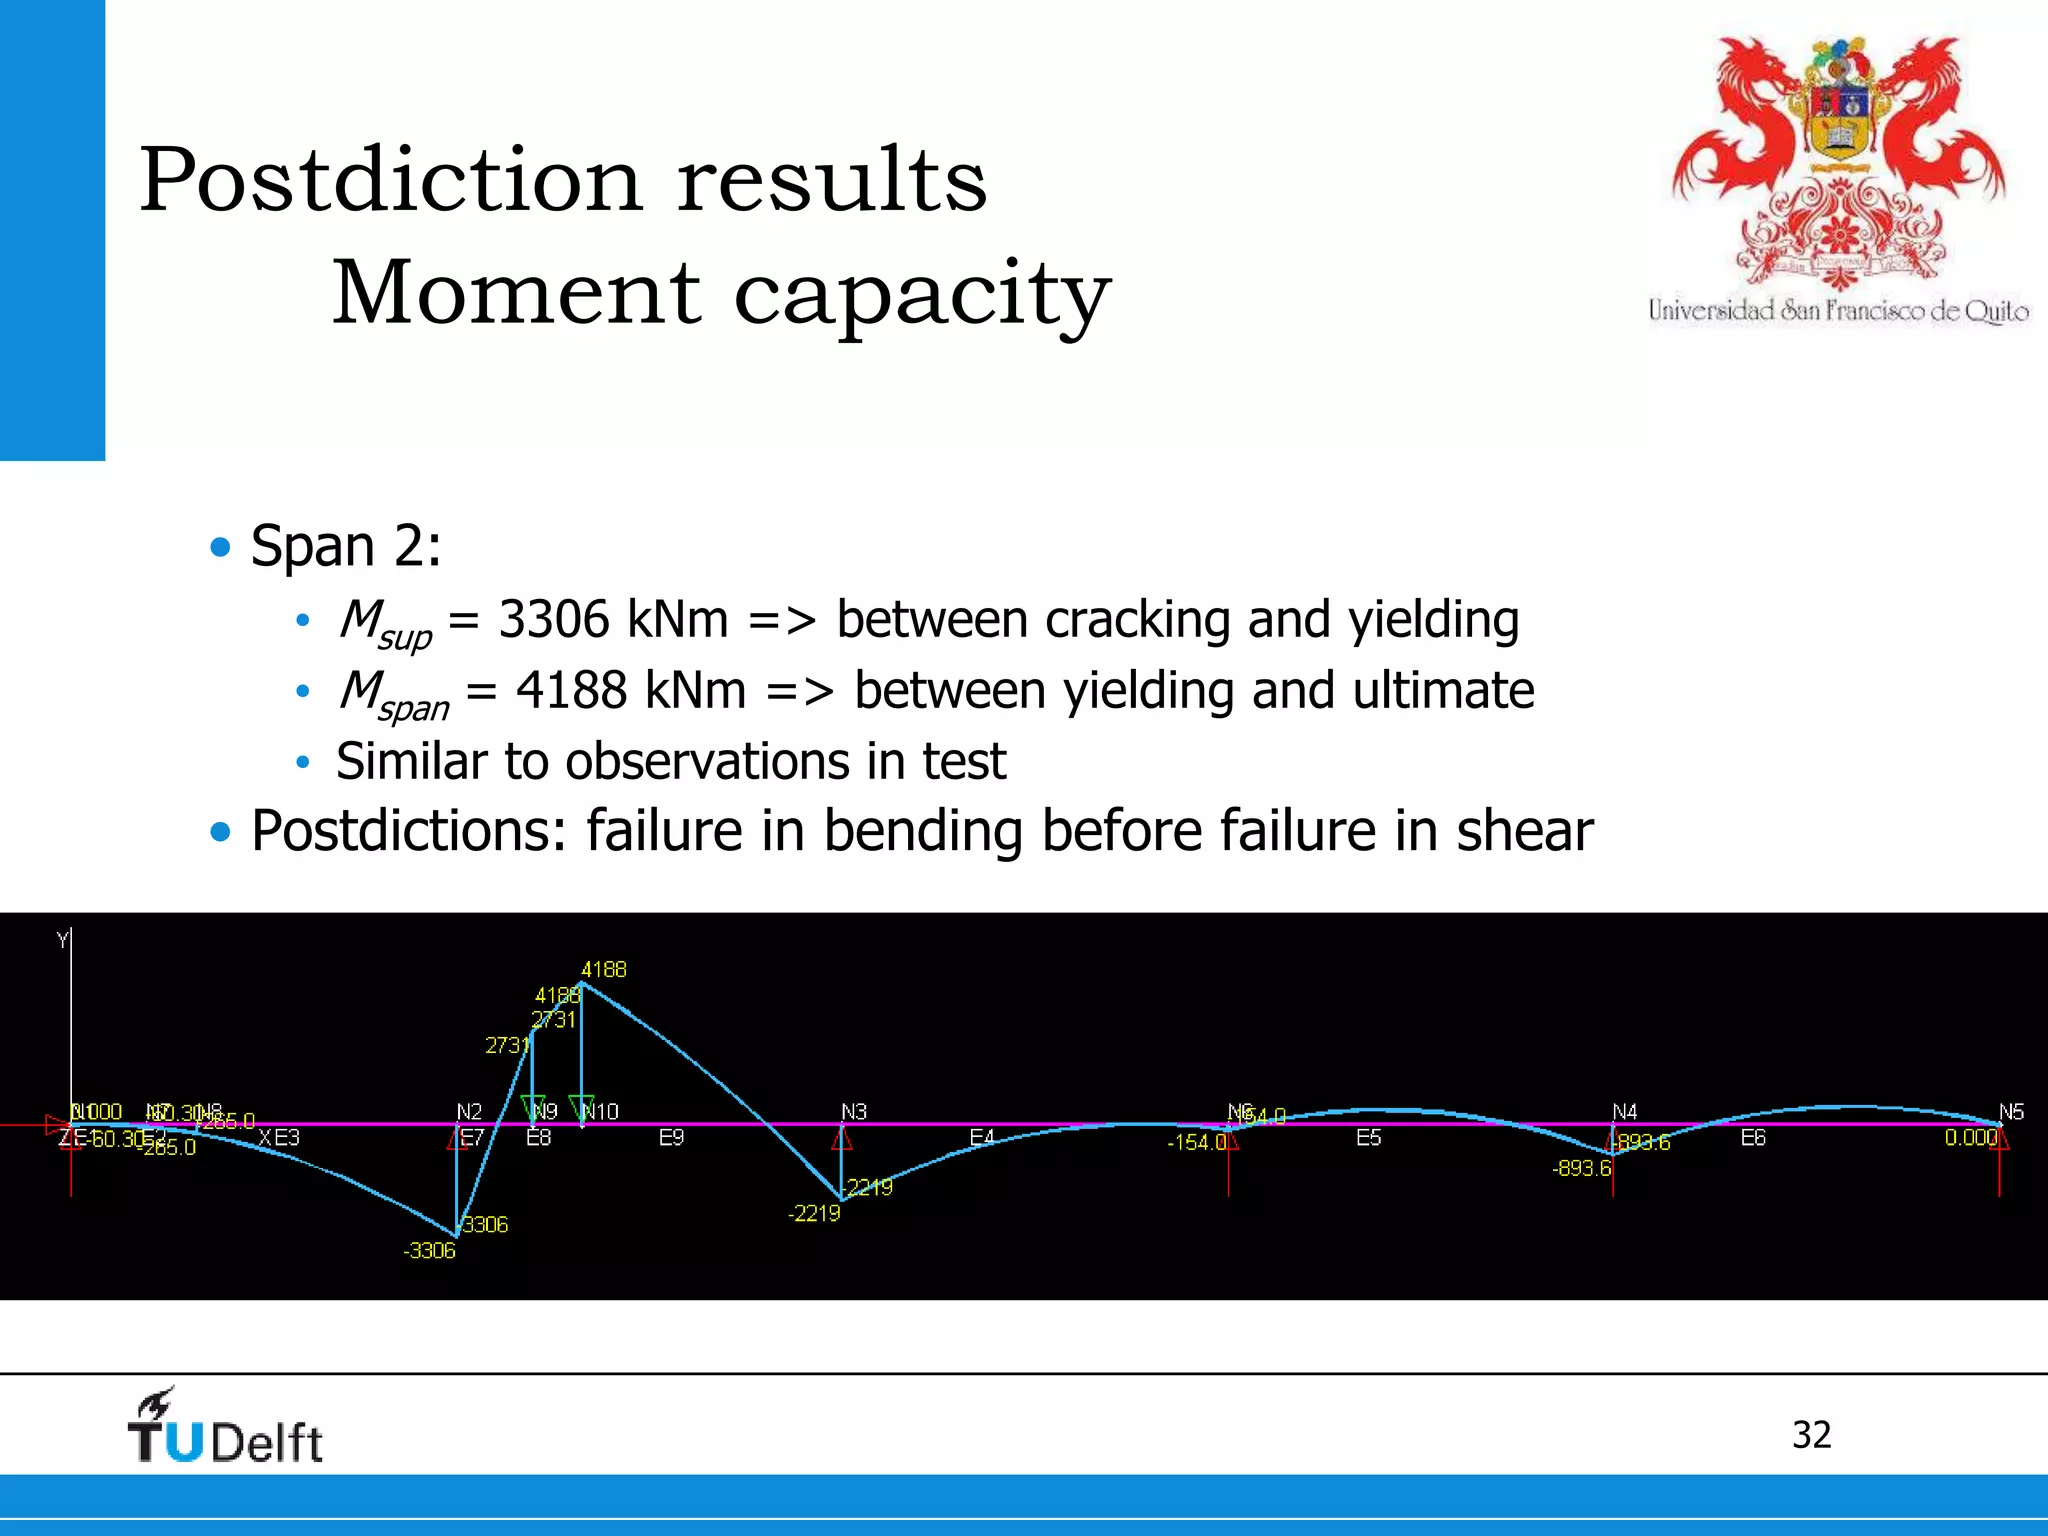
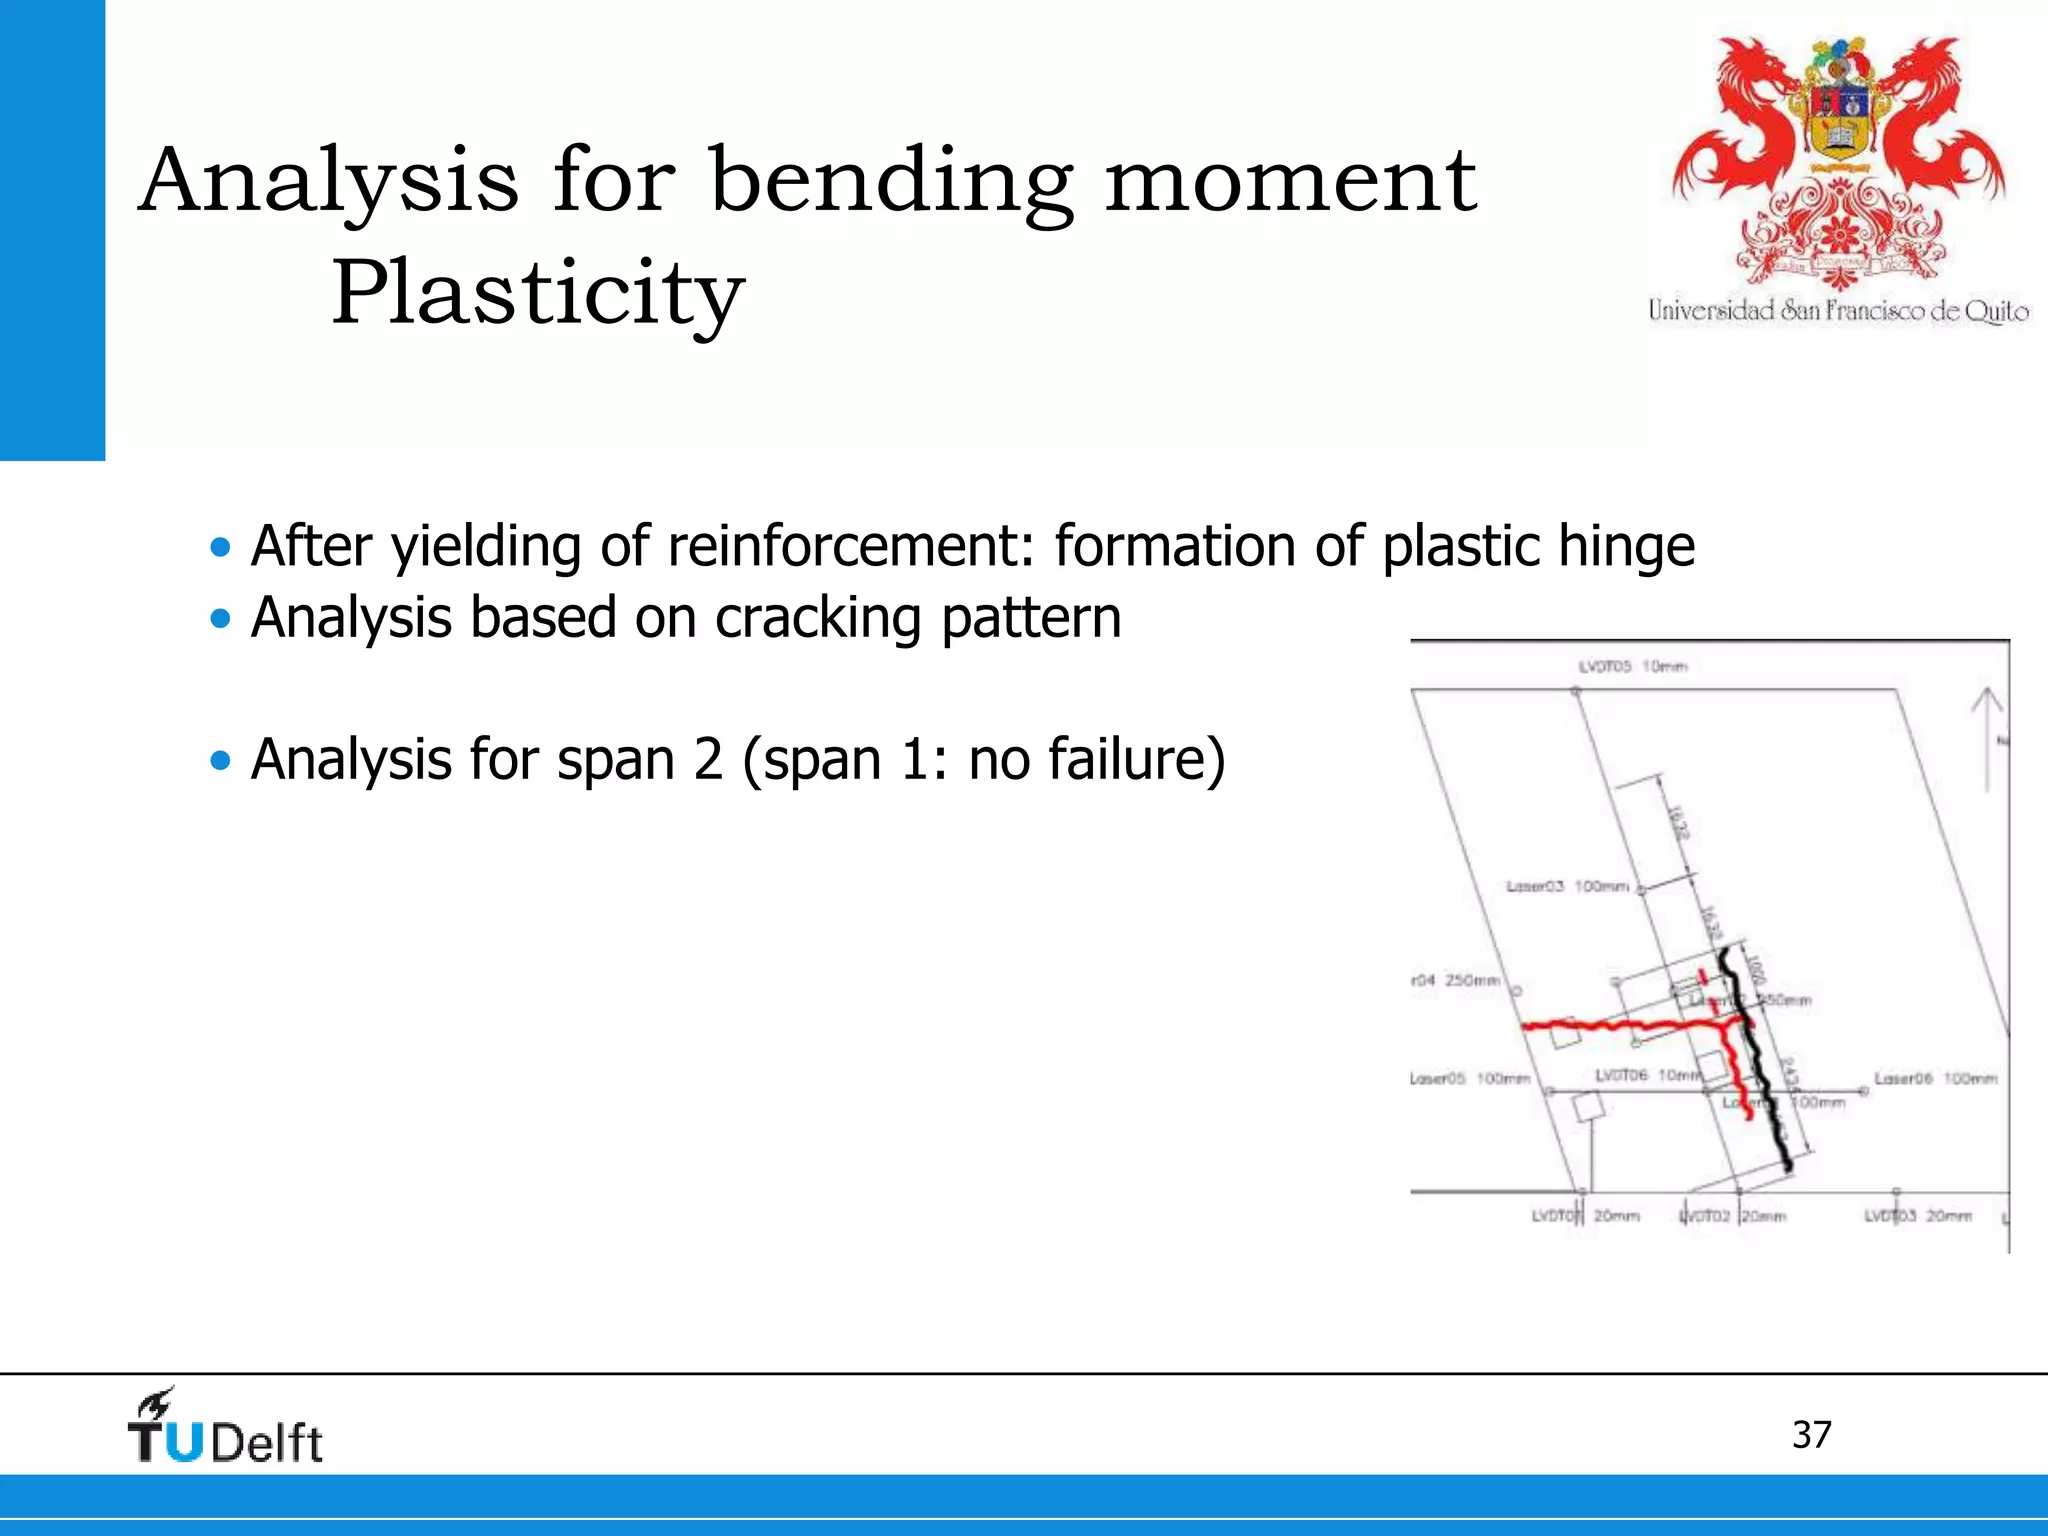
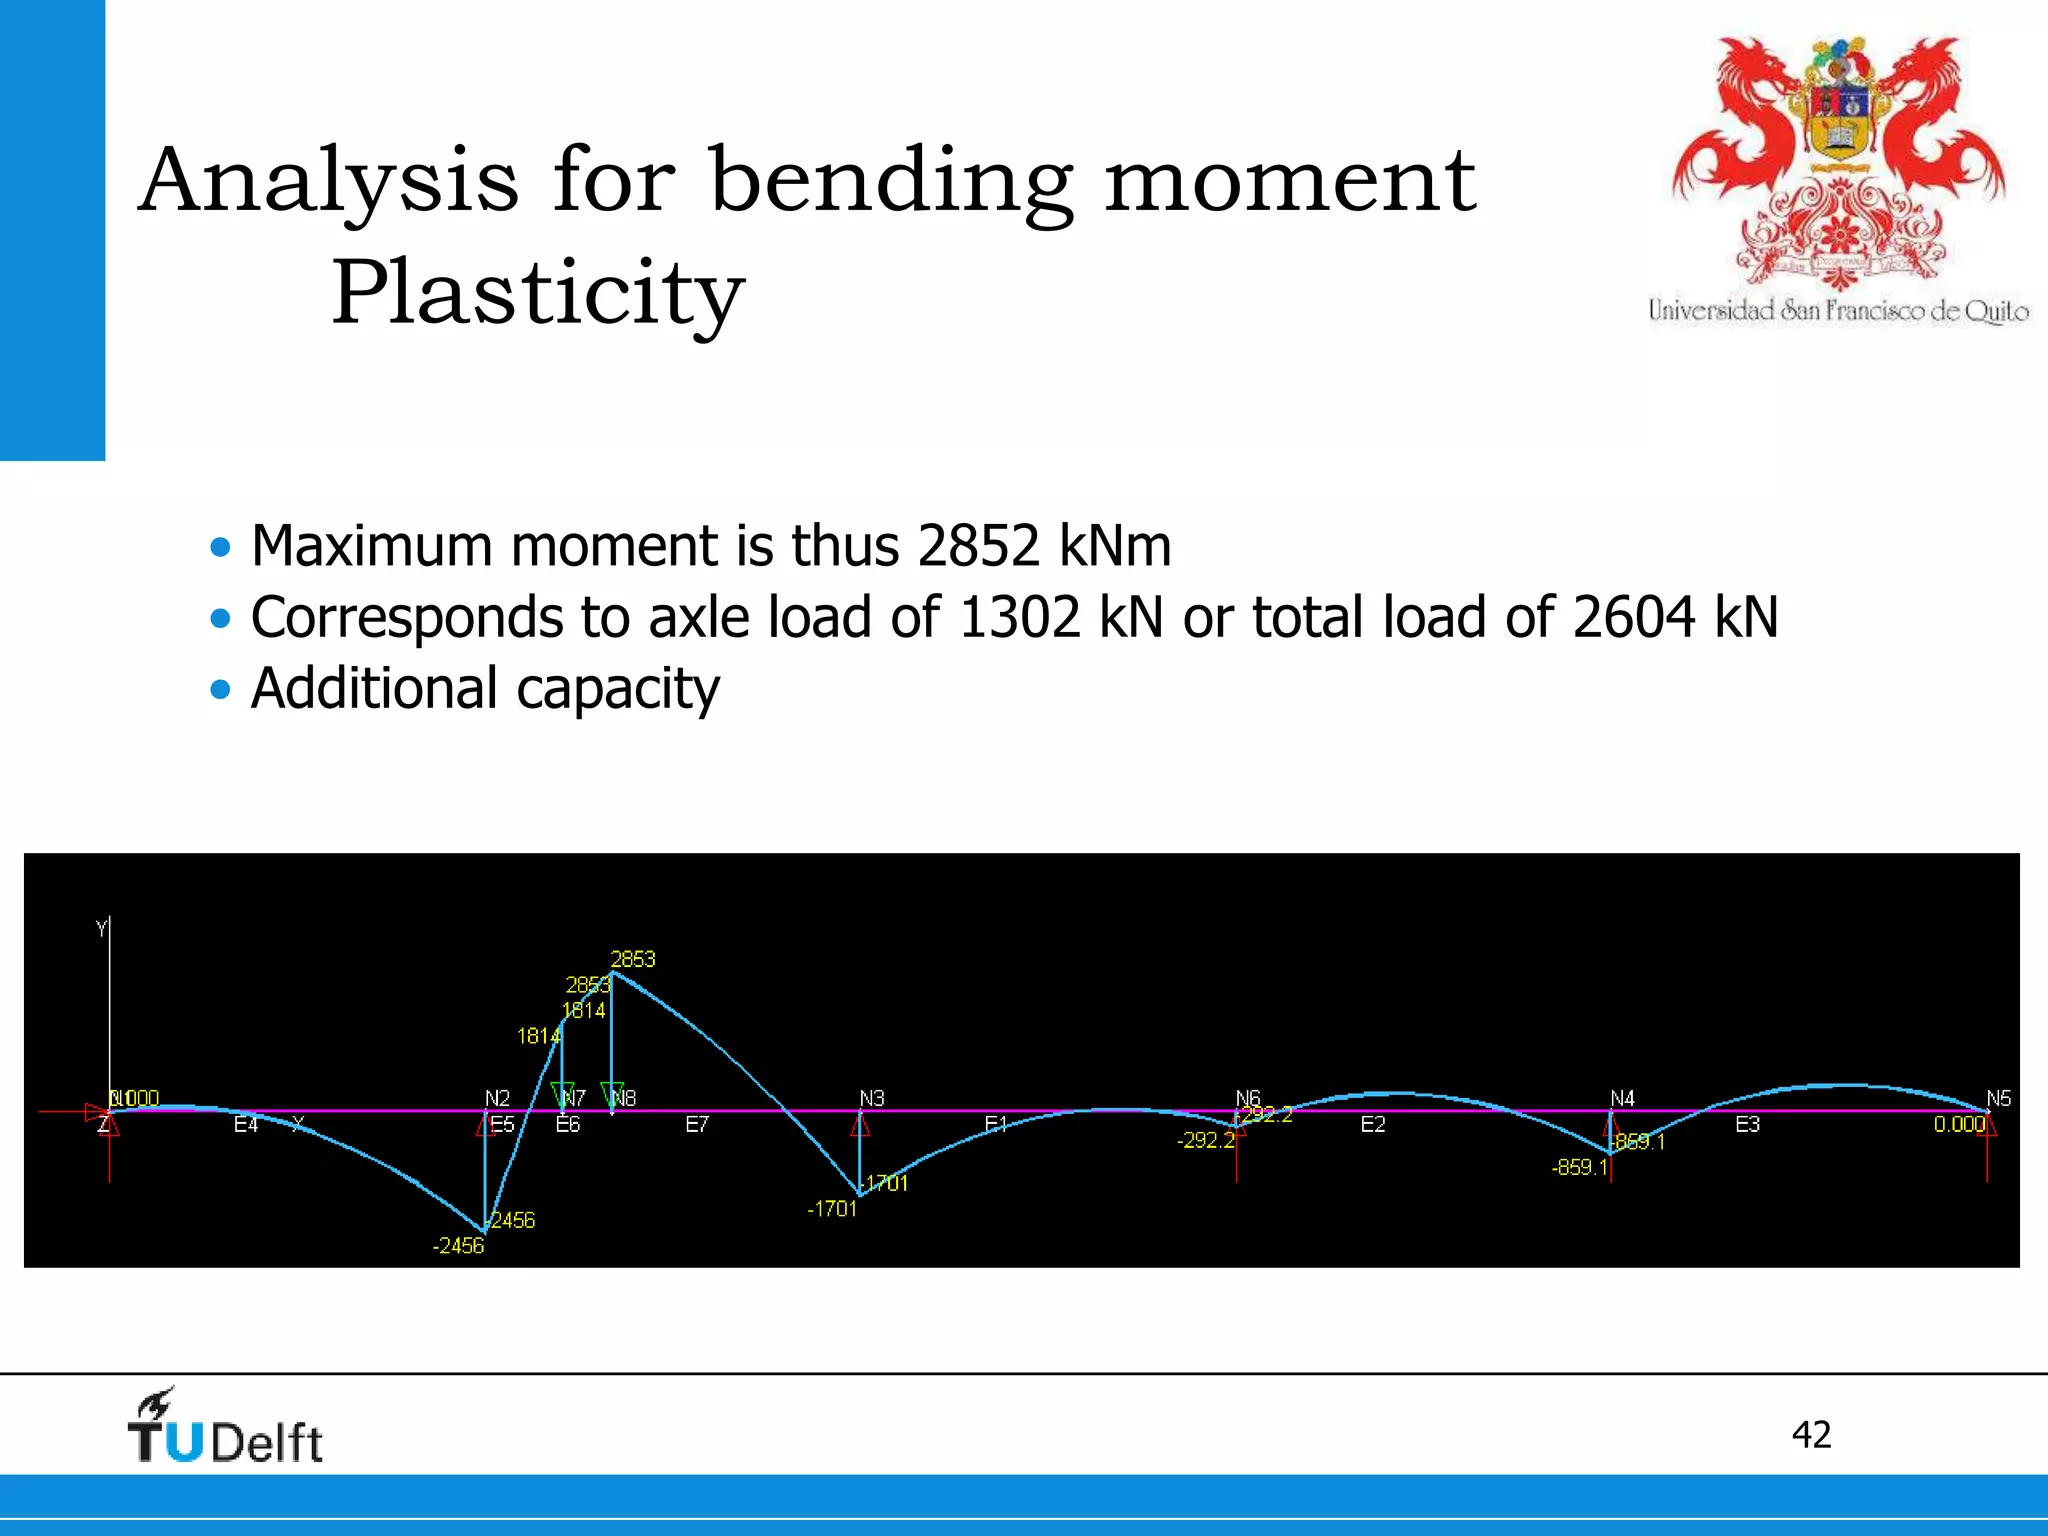
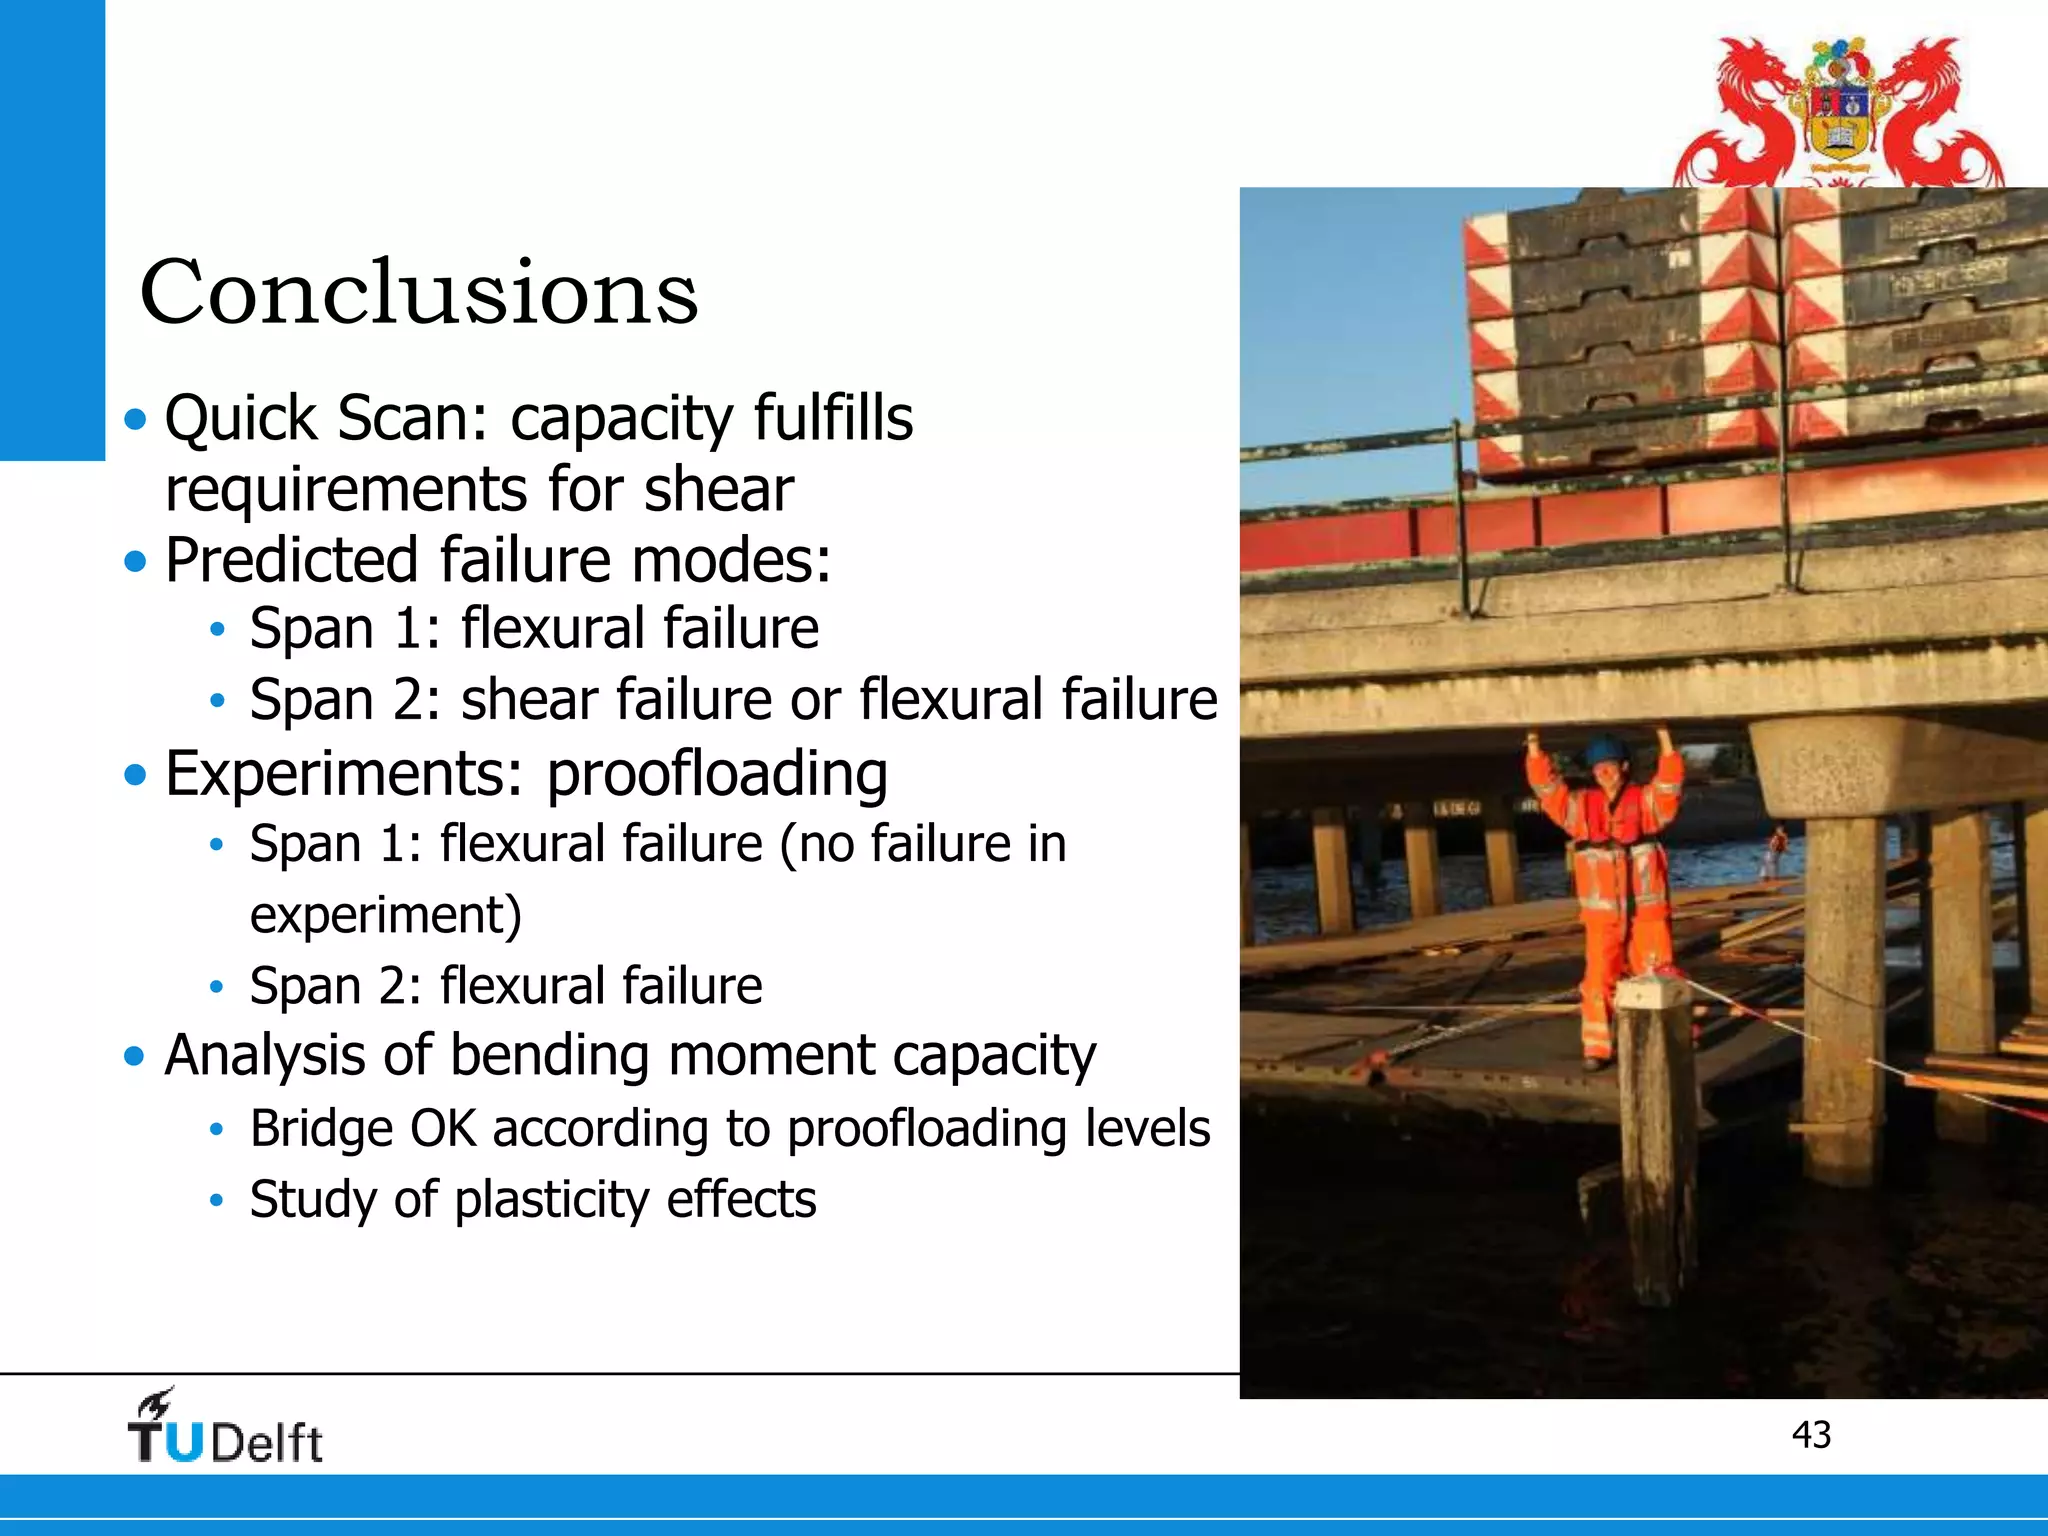
Challenge the future
Delft
University of
Technology
Testing to Failure of the
Ruytenschildt Bridge
Analysis of the Ultimate Limit State Results
Eva Lantsoght, Cor van der Veen, Ane de Boer
2
Overview
• Introduction to case
• Quick Scan predictions
• Predictions based on code equations
• Failure probability in shear vs flexure
• Test results
• Postdictions
• Conclusions
Slab shear experiments, TU Delft
3
Proofloading
Case Ruytenschildtbrug
• Proofloading to assess capacity of
existing bridge
• ASR affected bridges
• Unaffected bridges
• Study cracks and deformations for
applied loads
• Crack formation: acoustic emissions
measurements
• Control load process
• Ruytenschildtbrug: testing to failure
4
Proofloading Ruytenschildt Bridge
Existing bridge Partial demolition and building new bridge
5
Proofloading
Case Ruytenschildtbrug
6
Quick Scan approach
• Quick Scan shear behavior in slabs
• Similar to hand calculation
• In spreadsheet
• Developed since +- 2005
• Conservative approach
• First Level of Approximation
• Only relevant cross-sections of each span
• Includes results from slab shear tests TU
Delft
• Result = unity check = vEd/vRd,c
7
Recommendations
Effective width
• Experiments on slabs with variable widths
• Statistical analysis ofVexp/VEC with beff1 and beff2
• NLFEA: stress distribution at support
• Lower bound: 4dl
8
Recommendations
Slab factor 1.25
• Comparison test results and EN 1992-1-
1:2005
• Normal distribution
• Characteristic increase at least 1.25
• Combination of β = av /2dl and slab
factor 1.25
βnew = av /2.5dl
for 0.5dl ≤ av ≤ 2.5dl
9
Recommendations
Superposition of loads
• Experiments on slabs with line load and concentrated load
• Superposition is a conservative assumption
• Concentrated load over effective width
• Line load over entire width
10
Recommendations
Lower bound vmin
• Built before 1962: QR24 steel reinforcement
• fyk = 240 MPa
• Eurocode 2 vmin based on fyk = 500 MPa
3/2 1/2 1/2
min 0.772 ck ykv k f f 

11
Quick Scan
Position tandems Load Model 1
Load spreading at line support
Distribution UDL first lane
12
Quick Scan
Cross-sections –Ruytenschildt Bridge
• Cross-sections to check for 5-span beam
• Check sup 1-2, sup 2-1 and sup 2-3
• Testing in span 1 and span 2
• close to end support
• close to mid support
13
Quick Scan development
QS-Excel-RWS
• more cross-sections
• Reinforcement more detailed
QS-MathCad-TUDelft
14
Quick Scan Ruytenschildt Bridge
• Predictions: not all material parameters known beforehand
• Assume QR24 steel
• Some test results of concrete cores: compression and splitting
• Based on characteristic values
• Follows rating procedures
• Skew 72º angle
• Skew factors as used in QS
• Concrete compressive strength not known beforehand
• Calculations over range of compressive strengths
TS Edge distance Skew Factor For 0.7m
TS1 0.5m 1.08
1.084
0.95m 1.09
TS2 0.5m 1.23
1.239
0.95m 1.25
15
Quick Scan Ruytenschildt Bridge
Support 1-2
0
0.1
0.2
0.3
0.4
0.5
0.6
0.7
0.8
0.9
1
0 10 20 30 40 50 60 70 80 90 100
unitycheck
fck,cube
16
Quick Scan Ruytenschildtbrug
Support 2-3
0
0.2
0.4
0.6
0.8
1
1.2
0 10 20 30 40 50 60 70 80 90 100
unitycheck
fck,cube
17
Capacity cross-section
Introduction
• Average material
• Two loading possibilities:
• Battens + big bags
• 4 wheel loads: simulating 1 load tandem
• Skew factors as in Quick Scan
• Saw cut at 7.365m over full length of bridge
• Average vRd,c
• Averagevmin : transform formula to average instead of
characteristic
3/2 1/2
1/2
1.08 0.163
0.12
ck
min
yk
k f
v
f

18
Capacity cross-section
Selection loading scenario (1)
• Scenario 1: big bags sand + battens load
=> Flexural failure before shear failure
Effective width battens
19
Capacity cross-section
Selection loading scenario (2)
• Scenario 2: only battens load + self-weight as distributed
load
=> Failure in flexure before shear
20
Capacity cross-section
Selection loading scenario (3)
• Scenario 3: Wheel loads + self-weight
Flexural failure before shear failure in span 1
Possible shear failure in span 2
21
Capacity cross-section
Effective width for skewed slab
22
Capacity cross-section
Calculations (1)
• Moment capacity
• Myield : fy = 282 MPa
• Mu : fult= 383 MPa
Cross-section Mcr
(kNm)
Myield
(kNm)
Mu
(kNm)
Sup 1-2 1334 3519 4388
Sup 2-3, span 1358 3372 4192
Sup 2-3, support 1421 5118 6333
23
Capacity cross-section
Calculations (2)
• Shear capacity
• Pshear : calculated shear capacity
• Pshear,skew: including skew factors
• Pshear,test : increased average Test/Prediction slab experiments
• Pshear,skew,test : Skew factors + slab increase
• Most likely: Pshear,test+ some skew effect
• Punching is not governing
Support Pshear
(kN)
Pshear,skew
(kN)
Pshear,test
(kN)
Pshear,skew,test
(kN)
Sup 1-2 1340 2140 2711 4390
Sup 2-3 975 1626 1972 3289
24
Probability of shear failure
• Monte Carlo simulation
 shear < flexurefp P
( )f shear flexurep P UC UC 
 
 
1/3,
1/3
,
, , ,
100
100
Rd c
l ck
Ed c
shear
Rd c
Rd c test l c mean
C
k f
v
UC
Testv C k f
Predicted



 
2
2
s y
Ed
flexure
Rd
s u
M
a
A f d
M
UC
Test aM
A f d
Predicted
 
 
  
   
   
   
25
Probability of shear failure
Test/Predicted shear
Based on slab shear experiments TU Delft
26
Probability of shear failure
Limit state function
27
Probability of shear failure
Results
• Span 1: 85.2% probability of failure in flexure before shear
• Span 2: 45.9% probability of failure in flexure before shear
• Span 2: 98.2% probability of failure in flexure before shear
when considering from
V
Test
Predicted
 
 
 
exp
pred
V
V
28
Uncertainties in predictions
• Effect skew angle on effective
width
• Effect skew on shear capacity of
slabs
• Concrete compressive strength
(assumed B45)
• Yield strength of steel (fy = 282
MPa assumed)
29
Test results proofloading
Span 1
• Maximum load 3049 kN
• Maximum available load for span 1
• Flexural cracks
• No failure
• Order additional load for test 2!
0
500
1000
1500
2000
2500
3000
3500
0 5000 10000 15000 20000 25000
Load(kN) time (s)
30
Test results proofloading
Span 2
• Maximum load 3991 kN
• Large flexural cracks
• Flexural failure
• yielding of reinforcement
• Settlement of bridge pier
with 1.5cm
• Elastic recovery to 8mm
0
500
1000
1500
2000
2500
3000
3500
4000
4500
0 2000 4000 6000 8000 10000
Load(kN) Time(s)
31
Postdiction results
Moment capacity
• Using measured material properties
• Span 1:
• Measured moment: 4889 kNm
• Calculated ultimate moment: 4388 kNm
• Difference: integral bridge:
• clamping moment at end support can
occur
• Further research on moment capacity of
beams sawn out of bridge
32
Postdiction results
Moment capacity
• Span 2:
• Msup = 3306 kNm => between cracking and yielding
• Mspan = 4188 kNm => between yielding and ultimate
• Similar to observations in test
• Postdictions: failure in bending before failure in shear
33
Analysis for bending moment
Finite element model
• Linear finite element model in Scia Engineer
• Concrete class C20/25 as based on tested cores
• Modeled as continuous slab, 5 spans
• Used for comparison between proofloading and Eurocode loads
34
Analysis for bending moment
Largest moment with LM1
• Load Model 1 from Eurocode
• Self-weight + layer of asphalt
• Distributed lane load + concentrated
wheel loads
• Position of wheel loads resulting in
largest moment
• manual live load analysis
• Span 1: x = 4,633m => mux
+ = 438,5
kNm/m
• Span 2: x = 14,5m => mux
+ = 330,4
kNm/m
35
Analysis for bending moment
Proofloading – Load levels
• Traditional proofloading:
• finish test before failure or damage to bridge
• load must pass “unfit for use” and “repair” levels
• identify these levels
• Requirement: same moment for EC load as for test tandem
• at “unfit for use” and “repair” load levels
• “Repair” level
• Span 1: axle load 620 kN, total load 1240 kN
• Span 2: axle load 544 kN, total load 1088 kN
• “Unfit for use” level
• Span 1: axle load 589 kN, total load 1178 kN
• Span 2: axle load 520 kN, total load 1040 kN
36
Analysis for bending moment
Ultimate capacity
• From a plate analysis (FEM)
• Maximum measured loads in experiment
• Tandem loads at critical distance for shear 2,5d
• Results:
• Span 1: x = 3,391m => mux
+ = 819,6 kNm/m
• Span 2: x = 12,455m => mux
+ = 814,3 kNm/m
37
Analysis for bending moment
Plasticity
• After yielding of reinforcement: formation of plastic hinge
• Analysis based on cracking pattern
• Analysis for span 2 (span 1: no failure)
38
Analysis for bending moment
Plasticity
• Consider the distribution of mx in slab subjected to loading as
applied in test
39
Analysis for bending moment
Plasticity
• Make a cut, find distribution of moments over width at position of
crack
40
Analysis for bending moment
Plasticity
• Percentage of moment distributed over 3,63m (length of crack)?
• 77,4% of total moment in crack = plastic moment
• 22,6% remains linear elastic
• In linear elastic part: capacity can increase until reaching onset of
yielding and cracking
• Total moment due to maximum load: 2271 kNm
41
Analysis for bending moment
Plasticity
• Linear elastic part carries moment after yielding and cracking:
• Can increase up to yield moment
3,735
77,39% 2271 1809
3,63
m
LEdeel kNm kNm
m
   
3,735
77,39% 2271
3,63
2852
m
LEdeel x kNm
m
x kNm
   
 
42
Analysis for bending moment
Plasticity
• Maximum moment is thus 2852 kNm
• Corresponds to axle load of 1302 kN or total load of 2604 kN
• Additional capacity
43
Conclusions
• Quick Scan: capacity fulfills
requirements for shear
• Predicted failure modes:
• Span 1: flexural failure
• Span 2: shear failure or flexural failure
• Experiments: proofloading
• Span 1: flexural failure (no failure in
experiment)
• Span 2: flexural failure
• Analysis of bending moment capacity
• Bridge OK according to proofloading levels
• Study of plasticity effects
44
Contact:
Eva Lantsoght
E.O.L.Lantsoght@tudelft.nl // elantsoght@usfq.edu.ec
+31(0)152787449

Testing to failure of the Ruytenschildt Bridge

  • 1.
    Challenge the future Delft Universityof Technology Testing to Failure of the Ruytenschildt Bridge Analysis of the Ultimate Limit State Results Eva Lantsoght, Cor van der Veen, Ane de Boer
  • 2.
    2 Overview • Introduction tocase • Quick Scan predictions • Predictions based on code equations • Failure probability in shear vs flexure • Test results • Postdictions • Conclusions Slab shear experiments, TU Delft
  • 3.
    3 Proofloading Case Ruytenschildtbrug • Proofloadingto assess capacity of existing bridge • ASR affected bridges • Unaffected bridges • Study cracks and deformations for applied loads • Crack formation: acoustic emissions measurements • Control load process • Ruytenschildtbrug: testing to failure
  • 4.
    4 Proofloading Ruytenschildt Bridge Existingbridge Partial demolition and building new bridge
  • 5.
  • 6.
    6 Quick Scan approach •Quick Scan shear behavior in slabs • Similar to hand calculation • In spreadsheet • Developed since +- 2005 • Conservative approach • First Level of Approximation • Only relevant cross-sections of each span • Includes results from slab shear tests TU Delft • Result = unity check = vEd/vRd,c
  • 7.
    7 Recommendations Effective width • Experimentson slabs with variable widths • Statistical analysis ofVexp/VEC with beff1 and beff2 • NLFEA: stress distribution at support • Lower bound: 4dl
  • 8.
    8 Recommendations Slab factor 1.25 •Comparison test results and EN 1992-1- 1:2005 • Normal distribution • Characteristic increase at least 1.25 • Combination of β = av /2dl and slab factor 1.25 βnew = av /2.5dl for 0.5dl ≤ av ≤ 2.5dl
  • 9.
    9 Recommendations Superposition of loads •Experiments on slabs with line load and concentrated load • Superposition is a conservative assumption • Concentrated load over effective width • Line load over entire width
  • 10.
    10 Recommendations Lower bound vmin •Built before 1962: QR24 steel reinforcement • fyk = 240 MPa • Eurocode 2 vmin based on fyk = 500 MPa 3/2 1/2 1/2 min 0.772 ck ykv k f f  
  • 11.
    11 Quick Scan Position tandemsLoad Model 1 Load spreading at line support Distribution UDL first lane
  • 12.
    12 Quick Scan Cross-sections –RuytenschildtBridge • Cross-sections to check for 5-span beam • Check sup 1-2, sup 2-1 and sup 2-3 • Testing in span 1 and span 2 • close to end support • close to mid support
  • 13.
    13 Quick Scan development QS-Excel-RWS •more cross-sections • Reinforcement more detailed QS-MathCad-TUDelft
  • 14.
    14 Quick Scan RuytenschildtBridge • Predictions: not all material parameters known beforehand • Assume QR24 steel • Some test results of concrete cores: compression and splitting • Based on characteristic values • Follows rating procedures • Skew 72º angle • Skew factors as used in QS • Concrete compressive strength not known beforehand • Calculations over range of compressive strengths TS Edge distance Skew Factor For 0.7m TS1 0.5m 1.08 1.084 0.95m 1.09 TS2 0.5m 1.23 1.239 0.95m 1.25
  • 15.
    15 Quick Scan RuytenschildtBridge Support 1-2 0 0.1 0.2 0.3 0.4 0.5 0.6 0.7 0.8 0.9 1 0 10 20 30 40 50 60 70 80 90 100 unitycheck fck,cube
  • 16.
    16 Quick Scan Ruytenschildtbrug Support2-3 0 0.2 0.4 0.6 0.8 1 1.2 0 10 20 30 40 50 60 70 80 90 100 unitycheck fck,cube
  • 17.
    17 Capacity cross-section Introduction • Averagematerial • Two loading possibilities: • Battens + big bags • 4 wheel loads: simulating 1 load tandem • Skew factors as in Quick Scan • Saw cut at 7.365m over full length of bridge • Average vRd,c • Averagevmin : transform formula to average instead of characteristic 3/2 1/2 1/2 1.08 0.163 0.12 ck min yk k f v f 
  • 18.
    18 Capacity cross-section Selection loadingscenario (1) • Scenario 1: big bags sand + battens load => Flexural failure before shear failure Effective width battens
  • 19.
    19 Capacity cross-section Selection loadingscenario (2) • Scenario 2: only battens load + self-weight as distributed load => Failure in flexure before shear
  • 20.
    20 Capacity cross-section Selection loadingscenario (3) • Scenario 3: Wheel loads + self-weight Flexural failure before shear failure in span 1 Possible shear failure in span 2
  • 21.
  • 22.
    22 Capacity cross-section Calculations (1) •Moment capacity • Myield : fy = 282 MPa • Mu : fult= 383 MPa Cross-section Mcr (kNm) Myield (kNm) Mu (kNm) Sup 1-2 1334 3519 4388 Sup 2-3, span 1358 3372 4192 Sup 2-3, support 1421 5118 6333
  • 23.
    23 Capacity cross-section Calculations (2) •Shear capacity • Pshear : calculated shear capacity • Pshear,skew: including skew factors • Pshear,test : increased average Test/Prediction slab experiments • Pshear,skew,test : Skew factors + slab increase • Most likely: Pshear,test+ some skew effect • Punching is not governing Support Pshear (kN) Pshear,skew (kN) Pshear,test (kN) Pshear,skew,test (kN) Sup 1-2 1340 2140 2711 4390 Sup 2-3 975 1626 1972 3289
  • 24.
    24 Probability of shearfailure • Monte Carlo simulation  shear < flexurefp P ( )f shear flexurep P UC UC      1/3, 1/3 , , , , 100 100 Rd c l ck Ed c shear Rd c Rd c test l c mean C k f v UC Testv C k f Predicted      2 2 s y Ed flexure Rd s u M a A f d M UC Test aM A f d Predicted                   
  • 25.
    25 Probability of shearfailure Test/Predicted shear Based on slab shear experiments TU Delft
  • 26.
    26 Probability of shearfailure Limit state function
  • 27.
    27 Probability of shearfailure Results • Span 1: 85.2% probability of failure in flexure before shear • Span 2: 45.9% probability of failure in flexure before shear • Span 2: 98.2% probability of failure in flexure before shear when considering from V Test Predicted       exp pred V V
  • 28.
    28 Uncertainties in predictions •Effect skew angle on effective width • Effect skew on shear capacity of slabs • Concrete compressive strength (assumed B45) • Yield strength of steel (fy = 282 MPa assumed)
  • 29.
    29 Test results proofloading Span1 • Maximum load 3049 kN • Maximum available load for span 1 • Flexural cracks • No failure • Order additional load for test 2! 0 500 1000 1500 2000 2500 3000 3500 0 5000 10000 15000 20000 25000 Load(kN) time (s)
  • 30.
    30 Test results proofloading Span2 • Maximum load 3991 kN • Large flexural cracks • Flexural failure • yielding of reinforcement • Settlement of bridge pier with 1.5cm • Elastic recovery to 8mm 0 500 1000 1500 2000 2500 3000 3500 4000 4500 0 2000 4000 6000 8000 10000 Load(kN) Time(s)
  • 31.
    31 Postdiction results Moment capacity •Using measured material properties • Span 1: • Measured moment: 4889 kNm • Calculated ultimate moment: 4388 kNm • Difference: integral bridge: • clamping moment at end support can occur • Further research on moment capacity of beams sawn out of bridge
  • 32.
    32 Postdiction results Moment capacity •Span 2: • Msup = 3306 kNm => between cracking and yielding • Mspan = 4188 kNm => between yielding and ultimate • Similar to observations in test • Postdictions: failure in bending before failure in shear
  • 33.
    33 Analysis for bendingmoment Finite element model • Linear finite element model in Scia Engineer • Concrete class C20/25 as based on tested cores • Modeled as continuous slab, 5 spans • Used for comparison between proofloading and Eurocode loads
  • 34.
    34 Analysis for bendingmoment Largest moment with LM1 • Load Model 1 from Eurocode • Self-weight + layer of asphalt • Distributed lane load + concentrated wheel loads • Position of wheel loads resulting in largest moment • manual live load analysis • Span 1: x = 4,633m => mux + = 438,5 kNm/m • Span 2: x = 14,5m => mux + = 330,4 kNm/m
  • 35.
    35 Analysis for bendingmoment Proofloading – Load levels • Traditional proofloading: • finish test before failure or damage to bridge • load must pass “unfit for use” and “repair” levels • identify these levels • Requirement: same moment for EC load as for test tandem • at “unfit for use” and “repair” load levels • “Repair” level • Span 1: axle load 620 kN, total load 1240 kN • Span 2: axle load 544 kN, total load 1088 kN • “Unfit for use” level • Span 1: axle load 589 kN, total load 1178 kN • Span 2: axle load 520 kN, total load 1040 kN
  • 36.
    36 Analysis for bendingmoment Ultimate capacity • From a plate analysis (FEM) • Maximum measured loads in experiment • Tandem loads at critical distance for shear 2,5d • Results: • Span 1: x = 3,391m => mux + = 819,6 kNm/m • Span 2: x = 12,455m => mux + = 814,3 kNm/m
  • 37.
    37 Analysis for bendingmoment Plasticity • After yielding of reinforcement: formation of plastic hinge • Analysis based on cracking pattern • Analysis for span 2 (span 1: no failure)
  • 38.
    38 Analysis for bendingmoment Plasticity • Consider the distribution of mx in slab subjected to loading as applied in test
  • 39.
    39 Analysis for bendingmoment Plasticity • Make a cut, find distribution of moments over width at position of crack
  • 40.
    40 Analysis for bendingmoment Plasticity • Percentage of moment distributed over 3,63m (length of crack)? • 77,4% of total moment in crack = plastic moment • 22,6% remains linear elastic • In linear elastic part: capacity can increase until reaching onset of yielding and cracking • Total moment due to maximum load: 2271 kNm
  • 41.
    41 Analysis for bendingmoment Plasticity • Linear elastic part carries moment after yielding and cracking: • Can increase up to yield moment 3,735 77,39% 2271 1809 3,63 m LEdeel kNm kNm m     3,735 77,39% 2271 3,63 2852 m LEdeel x kNm m x kNm      
  • 42.
    42 Analysis for bendingmoment Plasticity • Maximum moment is thus 2852 kNm • Corresponds to axle load of 1302 kN or total load of 2604 kN • Additional capacity
  • 43.
    43 Conclusions • Quick Scan:capacity fulfills requirements for shear • Predicted failure modes: • Span 1: flexural failure • Span 2: shear failure or flexural failure • Experiments: proofloading • Span 1: flexural failure (no failure in experiment) • Span 2: flexural failure • Analysis of bending moment capacity • Bridge OK according to proofloading levels • Study of plasticity effects
  • 44.
    44 Contact: Eva Lantsoght E.O.L.Lantsoght@tudelft.nl //elantsoght@usfq.edu.ec +31(0)152787449