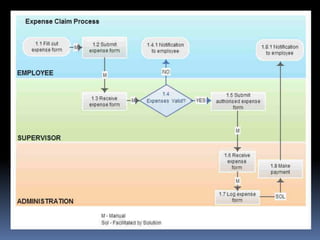
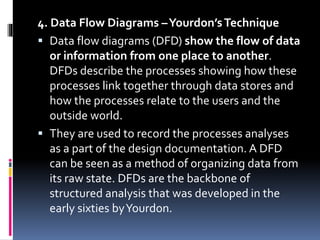
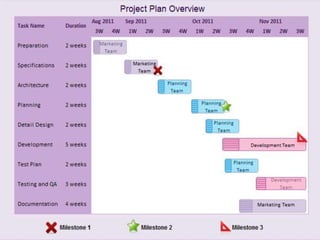
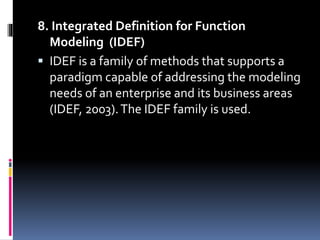
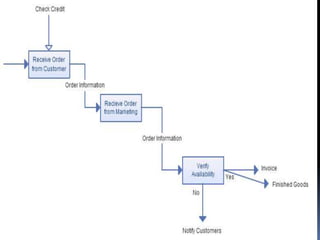
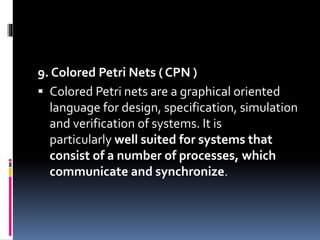
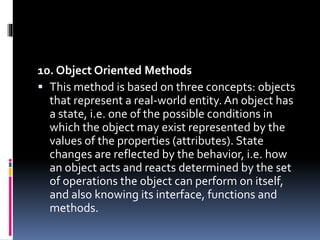
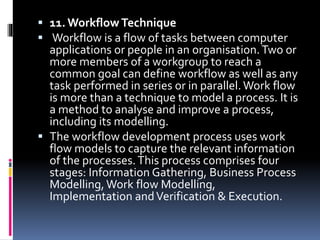
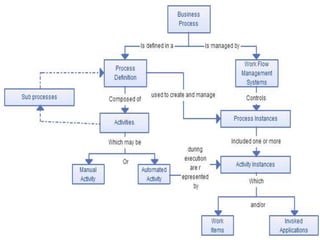
TECHNIQUES IN BUSINESS:
TESTING MODELS AND EXAMPLES
 Business process modeling is mainly used
to map a workflow so you can understand,
analyse and make positive changes to that
workflow or process. Usage of diagram helps
you to visualize this process and make better
decisions.
 DIFFERENT TECHNIQUES
Business process modeling notation (BPMN)
 UML diagrams
 Flowchart technique
 Data flow diagrams
 Role activity diagrams
 Role interaction diagrams
 Gantt charts
 Integrated definition for function modeling
 Colored petri-nets
 Object oriented methods
 Workflow technique
 Simulation model
 1. Business Process Modeling Notation (BPMN)
 Simply put BPMN is a graphical representation of your
business process using standard objects. If you want to
get more technical It can also be defined as a set of
graphical objects and rules defining available
connections between the objects.
 BPMN consists of the following basic building blocks;
 Flow objects: events (circles), activities (rectangles with
rounded corners), and gateways (diamonds)
 Connecting objects: mainly comprising arrows, these
indicate sequence flow (filled arrows), message flow
(dashed arrows), and associations
 Swim lanes: pools (graphic container) and lanes (sub-
partition of the pool)
 Artifacts: data objects, groups, and annotations
 The biggest advantage of BPMN is that it’s a
standard with well defined syntax. So many
business analysts are familiar with it which
makes collaboration much easier. Also most
modeling tools support BPMN which makes it
much easier to share and edit if even using
different software. All the together makes
BPMN the most popular business process
modeling technique at the moment.
2. UML Diagrams
 UML is a modelling language mainly used for
specification, visualization, development and
documenting of software systems. But business
professionals have adapted it as a powerful business
process modeling technique.
 With 14 different UML diagram types it offers a flexible
and powerful way to visualize almost any business
process.They are typically used for modelling the
detailed logic of a business process. In many ways UML
diagrams are the object-oriented equivalent of flow
charts.
 As mentioned above one of its main advantages is its
flexibility. But with 14 different diagram types some
might find it difficult to understand the diagrams. Add to
that the same process can be modeled using different
UML diagrams. So probably not the most popular choice
among analysts.
3. FlowchartTechnique
 Flowcharts are probably the most popular
diagram type in the world. Because it has few
standard symbols it can be easily understood by
many. Simplicity makes it powerful and an
effective tool. In fact BPMN can be considered as
an advanced version of the basic flowchart
technique. Also most drawing software
support creation of flowcharts it is used by a
much wider audience as well.
 Flowchart uses a sequential flow of actions and
does not support a breakdown of the activities.
The Flow Chart model is possibly the first
process notation. It has frequently been used
over many years although there is no exact date
for its origin.
4. Data Flow Diagrams –Yourdon’sTechnique
 Data flow diagrams (DFD) show the flow of data
or information from one place to another.
DFDs describe the processes showing how these
processes link together through data stores and
how the processes relate to the users and the
outside world.
 They are used to record the processes analyses
as a part of the design documentation. A DFD
can be seen as a method of organizing data from
its raw state. DFDs are the backbone of
structured analysis that was developed in the
early sixties byYourdon.
 5. Role Activity Diagrams – RAD
 Roles are abstract notations of behavior
describing a desired behavior within the
organization.They are often organizational
functions.They also include software
systems, customers and suppliers. RADs
provide a different perspective of the process
and are particularly useful in supporting
communication.They are intuitive to read,
easy to understand and presents a detailed
view of the process and permitting
activities in parallel.
6. Role Interaction Diagrams – RID
 Activities are connected to roles in a type of matrix.
Activities are shown vertically on the left axis and
the roles are shown horizontally at the top.Text and
symbols are used together in order to represent the
process.
 Although slightly more complex than flow diagrams,
RIDs are fairly intuitive to understand, easy to
read but they tend to be messy, with many arrows
pointing left and right and are therefore quite hard
to build.
 Inputs to, and outputs from the activities are not
modeled.Therefore, important information is lost.
RIDs are not as flexible as flowcharts, for example.
They have quite rigid notation. But compared with
other modelling techniques, RIDs are nevertheless
flexible.
7. Gantt Charts
 Gantt charts relate a list of activities to a time
scale. Although it can be used to represent a
process graphically it’s strength lies in the
ability to monitor the current situation,
project timeline and resource allocation.
 A Gantt chart is a matrix that lists on the vertical
axis all the tasks or activities to be performed in a
process. Each row contains a single activity
identification, which usually consists of a number
and a name.The horizontal axis is headed by
columns indicating estimated activity duration,
skill level needed to perform the activity, and the
name of the person assigned to the activity,
followed by one column for each period in the
project’s duration. Each period may be expressed
in hours, days, weeks, months, and other time
units. In some cases it may be necessary to label
the period columns as period 1, period 2, and so
on.
8. Integrated Definition for Function
Modeling (IDEF)
 IDEF is a family of methods that supports a
paradigm capable of addressing the modeling
needs of an enterprise and its business areas
(IDEF, 2003).The IDEF family is used.
9. Colored Petri Nets ( CPN )
 Colored Petri nets are a graphical oriented
language for design, specification, simulation
and verification of systems. It is
particularly well suited for systems that
consist of a number of processes, which
communicate and synchronize.
10. Object Oriented Methods
 This method is based on three concepts: objects
that represent a real-world entity. An object has
a state, i.e. one of the possible conditions in
which the object may exist represented by the
values of the properties (attributes). State
changes are reflected by the behavior, i.e. how
an object acts and reacts determined by the set
of operations the object can perform on itself,
and also knowing its interface, functions and
methods.
 11. Workflow Technique
 Workflow is a flow of tasks between computer
applications or people in an organisation.Two or
more members of a workgroup to reach a
common goal can define workflow as well as any
task performed in series or in parallel. Work flow
is more than a technique to model a process. It is
a method to analyse and improve a process,
including its modelling.
 The workflow development process uses work
flow models to capture the relevant information
of the processes.This process comprises four
stages: Information Gathering, Business Process
Modelling,Work flow Modelling,
Implementation andVerification & Execution.
 12. Simulation
 Simulation model comes in handy when you
want to study a complex real-world system.
You want to learn more about the system to
make an informed decision but the complexity
of the system prevents you from doing that
directly.
 Therefore you proceed indirectly by creating
and studying another entity (the simulation
model), which is sufficiently similar to the real-
world system.

REPORT IN PRODMAN Testing models and Examples

  • 1.
  • 2.
     Business processmodeling is mainly used to map a workflow so you can understand, analyse and make positive changes to that workflow or process. Usage of diagram helps you to visualize this process and make better decisions.
  • 3.
     DIFFERENT TECHNIQUES Businessprocess modeling notation (BPMN)  UML diagrams  Flowchart technique  Data flow diagrams  Role activity diagrams  Role interaction diagrams  Gantt charts  Integrated definition for function modeling  Colored petri-nets  Object oriented methods  Workflow technique  Simulation model
  • 4.
     1. BusinessProcess Modeling Notation (BPMN)  Simply put BPMN is a graphical representation of your business process using standard objects. If you want to get more technical It can also be defined as a set of graphical objects and rules defining available connections between the objects.  BPMN consists of the following basic building blocks;  Flow objects: events (circles), activities (rectangles with rounded corners), and gateways (diamonds)  Connecting objects: mainly comprising arrows, these indicate sequence flow (filled arrows), message flow (dashed arrows), and associations  Swim lanes: pools (graphic container) and lanes (sub- partition of the pool)  Artifacts: data objects, groups, and annotations
  • 7.
     The biggestadvantage of BPMN is that it’s a standard with well defined syntax. So many business analysts are familiar with it which makes collaboration much easier. Also most modeling tools support BPMN which makes it much easier to share and edit if even using different software. All the together makes BPMN the most popular business process modeling technique at the moment.
  • 8.
    2. UML Diagrams UML is a modelling language mainly used for specification, visualization, development and documenting of software systems. But business professionals have adapted it as a powerful business process modeling technique.  With 14 different UML diagram types it offers a flexible and powerful way to visualize almost any business process.They are typically used for modelling the detailed logic of a business process. In many ways UML diagrams are the object-oriented equivalent of flow charts.  As mentioned above one of its main advantages is its flexibility. But with 14 different diagram types some might find it difficult to understand the diagrams. Add to that the same process can be modeled using different UML diagrams. So probably not the most popular choice among analysts.
  • 10.
    3. FlowchartTechnique  Flowchartsare probably the most popular diagram type in the world. Because it has few standard symbols it can be easily understood by many. Simplicity makes it powerful and an effective tool. In fact BPMN can be considered as an advanced version of the basic flowchart technique. Also most drawing software support creation of flowcharts it is used by a much wider audience as well.  Flowchart uses a sequential flow of actions and does not support a breakdown of the activities. The Flow Chart model is possibly the first process notation. It has frequently been used over many years although there is no exact date for its origin.
  • 12.
    4. Data FlowDiagrams –Yourdon’sTechnique  Data flow diagrams (DFD) show the flow of data or information from one place to another. DFDs describe the processes showing how these processes link together through data stores and how the processes relate to the users and the outside world.  They are used to record the processes analyses as a part of the design documentation. A DFD can be seen as a method of organizing data from its raw state. DFDs are the backbone of structured analysis that was developed in the early sixties byYourdon.
  • 14.
     5. RoleActivity Diagrams – RAD  Roles are abstract notations of behavior describing a desired behavior within the organization.They are often organizational functions.They also include software systems, customers and suppliers. RADs provide a different perspective of the process and are particularly useful in supporting communication.They are intuitive to read, easy to understand and presents a detailed view of the process and permitting activities in parallel.
  • 16.
    6. Role InteractionDiagrams – RID  Activities are connected to roles in a type of matrix. Activities are shown vertically on the left axis and the roles are shown horizontally at the top.Text and symbols are used together in order to represent the process.  Although slightly more complex than flow diagrams, RIDs are fairly intuitive to understand, easy to read but they tend to be messy, with many arrows pointing left and right and are therefore quite hard to build.  Inputs to, and outputs from the activities are not modeled.Therefore, important information is lost. RIDs are not as flexible as flowcharts, for example. They have quite rigid notation. But compared with other modelling techniques, RIDs are nevertheless flexible.
  • 18.
    7. Gantt Charts Gantt charts relate a list of activities to a time scale. Although it can be used to represent a process graphically it’s strength lies in the ability to monitor the current situation, project timeline and resource allocation.
  • 19.
     A Ganttchart is a matrix that lists on the vertical axis all the tasks or activities to be performed in a process. Each row contains a single activity identification, which usually consists of a number and a name.The horizontal axis is headed by columns indicating estimated activity duration, skill level needed to perform the activity, and the name of the person assigned to the activity, followed by one column for each period in the project’s duration. Each period may be expressed in hours, days, weeks, months, and other time units. In some cases it may be necessary to label the period columns as period 1, period 2, and so on.
  • 21.
    8. Integrated Definitionfor Function Modeling (IDEF)  IDEF is a family of methods that supports a paradigm capable of addressing the modeling needs of an enterprise and its business areas (IDEF, 2003).The IDEF family is used.
  • 23.
    9. Colored PetriNets ( CPN )  Colored Petri nets are a graphical oriented language for design, specification, simulation and verification of systems. It is particularly well suited for systems that consist of a number of processes, which communicate and synchronize.
  • 25.
    10. Object OrientedMethods  This method is based on three concepts: objects that represent a real-world entity. An object has a state, i.e. one of the possible conditions in which the object may exist represented by the values of the properties (attributes). State changes are reflected by the behavior, i.e. how an object acts and reacts determined by the set of operations the object can perform on itself, and also knowing its interface, functions and methods.
  • 26.
     11. WorkflowTechnique  Workflow is a flow of tasks between computer applications or people in an organisation.Two or more members of a workgroup to reach a common goal can define workflow as well as any task performed in series or in parallel. Work flow is more than a technique to model a process. It is a method to analyse and improve a process, including its modelling.  The workflow development process uses work flow models to capture the relevant information of the processes.This process comprises four stages: Information Gathering, Business Process Modelling,Work flow Modelling, Implementation andVerification & Execution.
  • 28.
     12. Simulation Simulation model comes in handy when you want to study a complex real-world system. You want to learn more about the system to make an informed decision but the complexity of the system prevents you from doing that directly.  Therefore you proceed indirectly by creating and studying another entity (the simulation model), which is sufficiently similar to the real- world system.