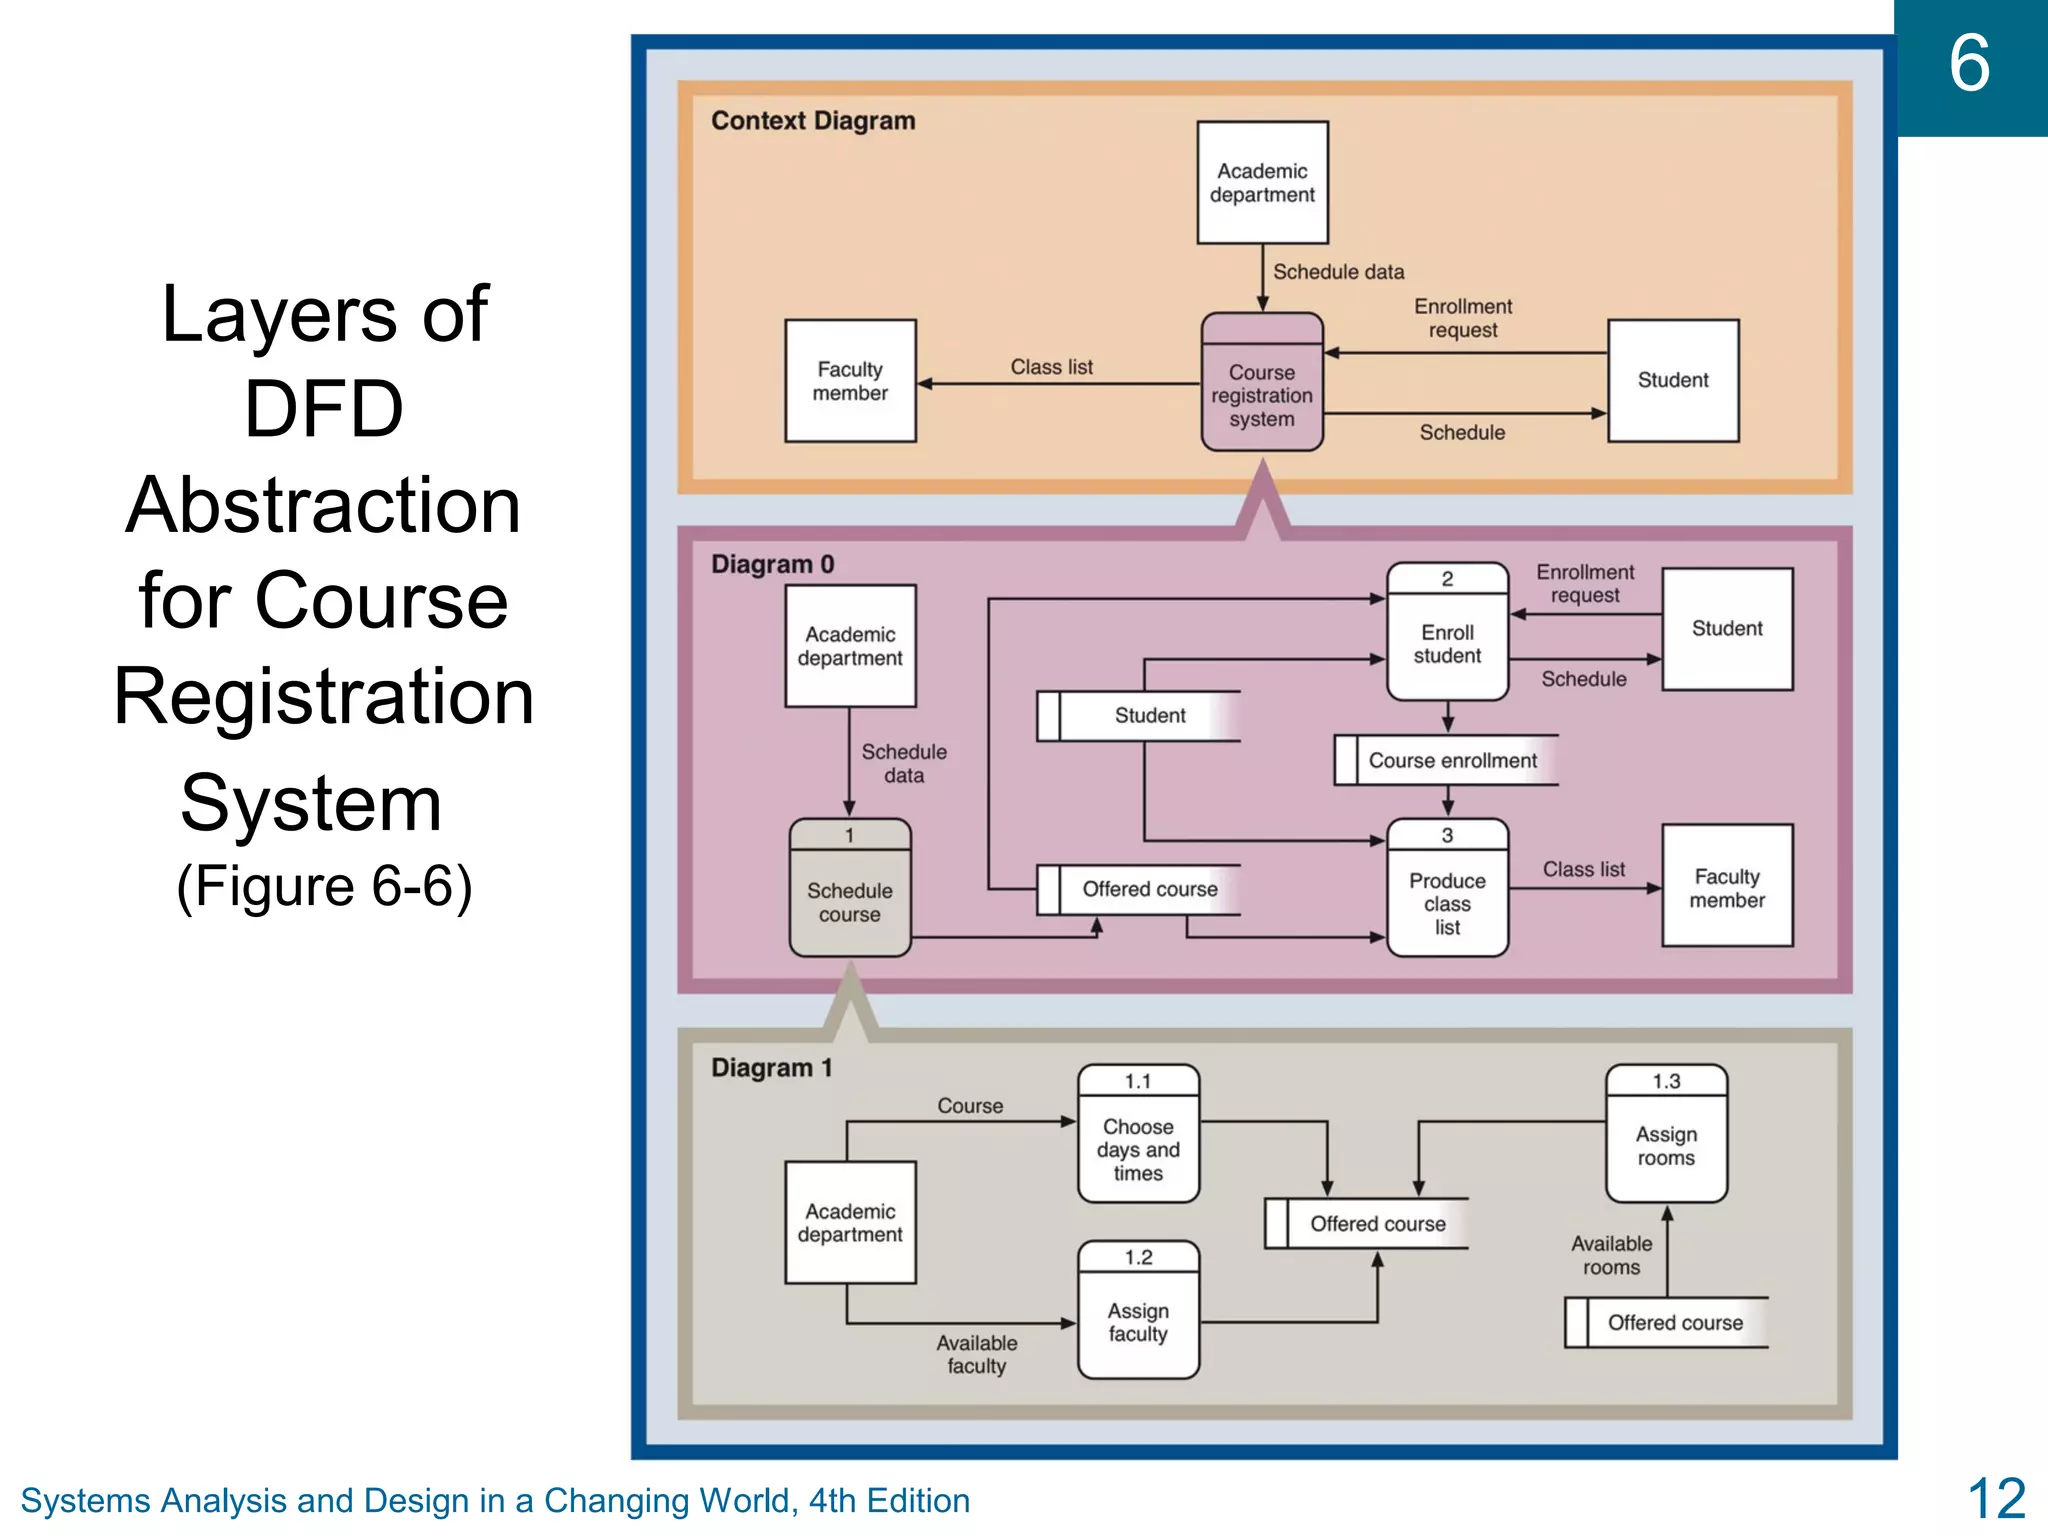
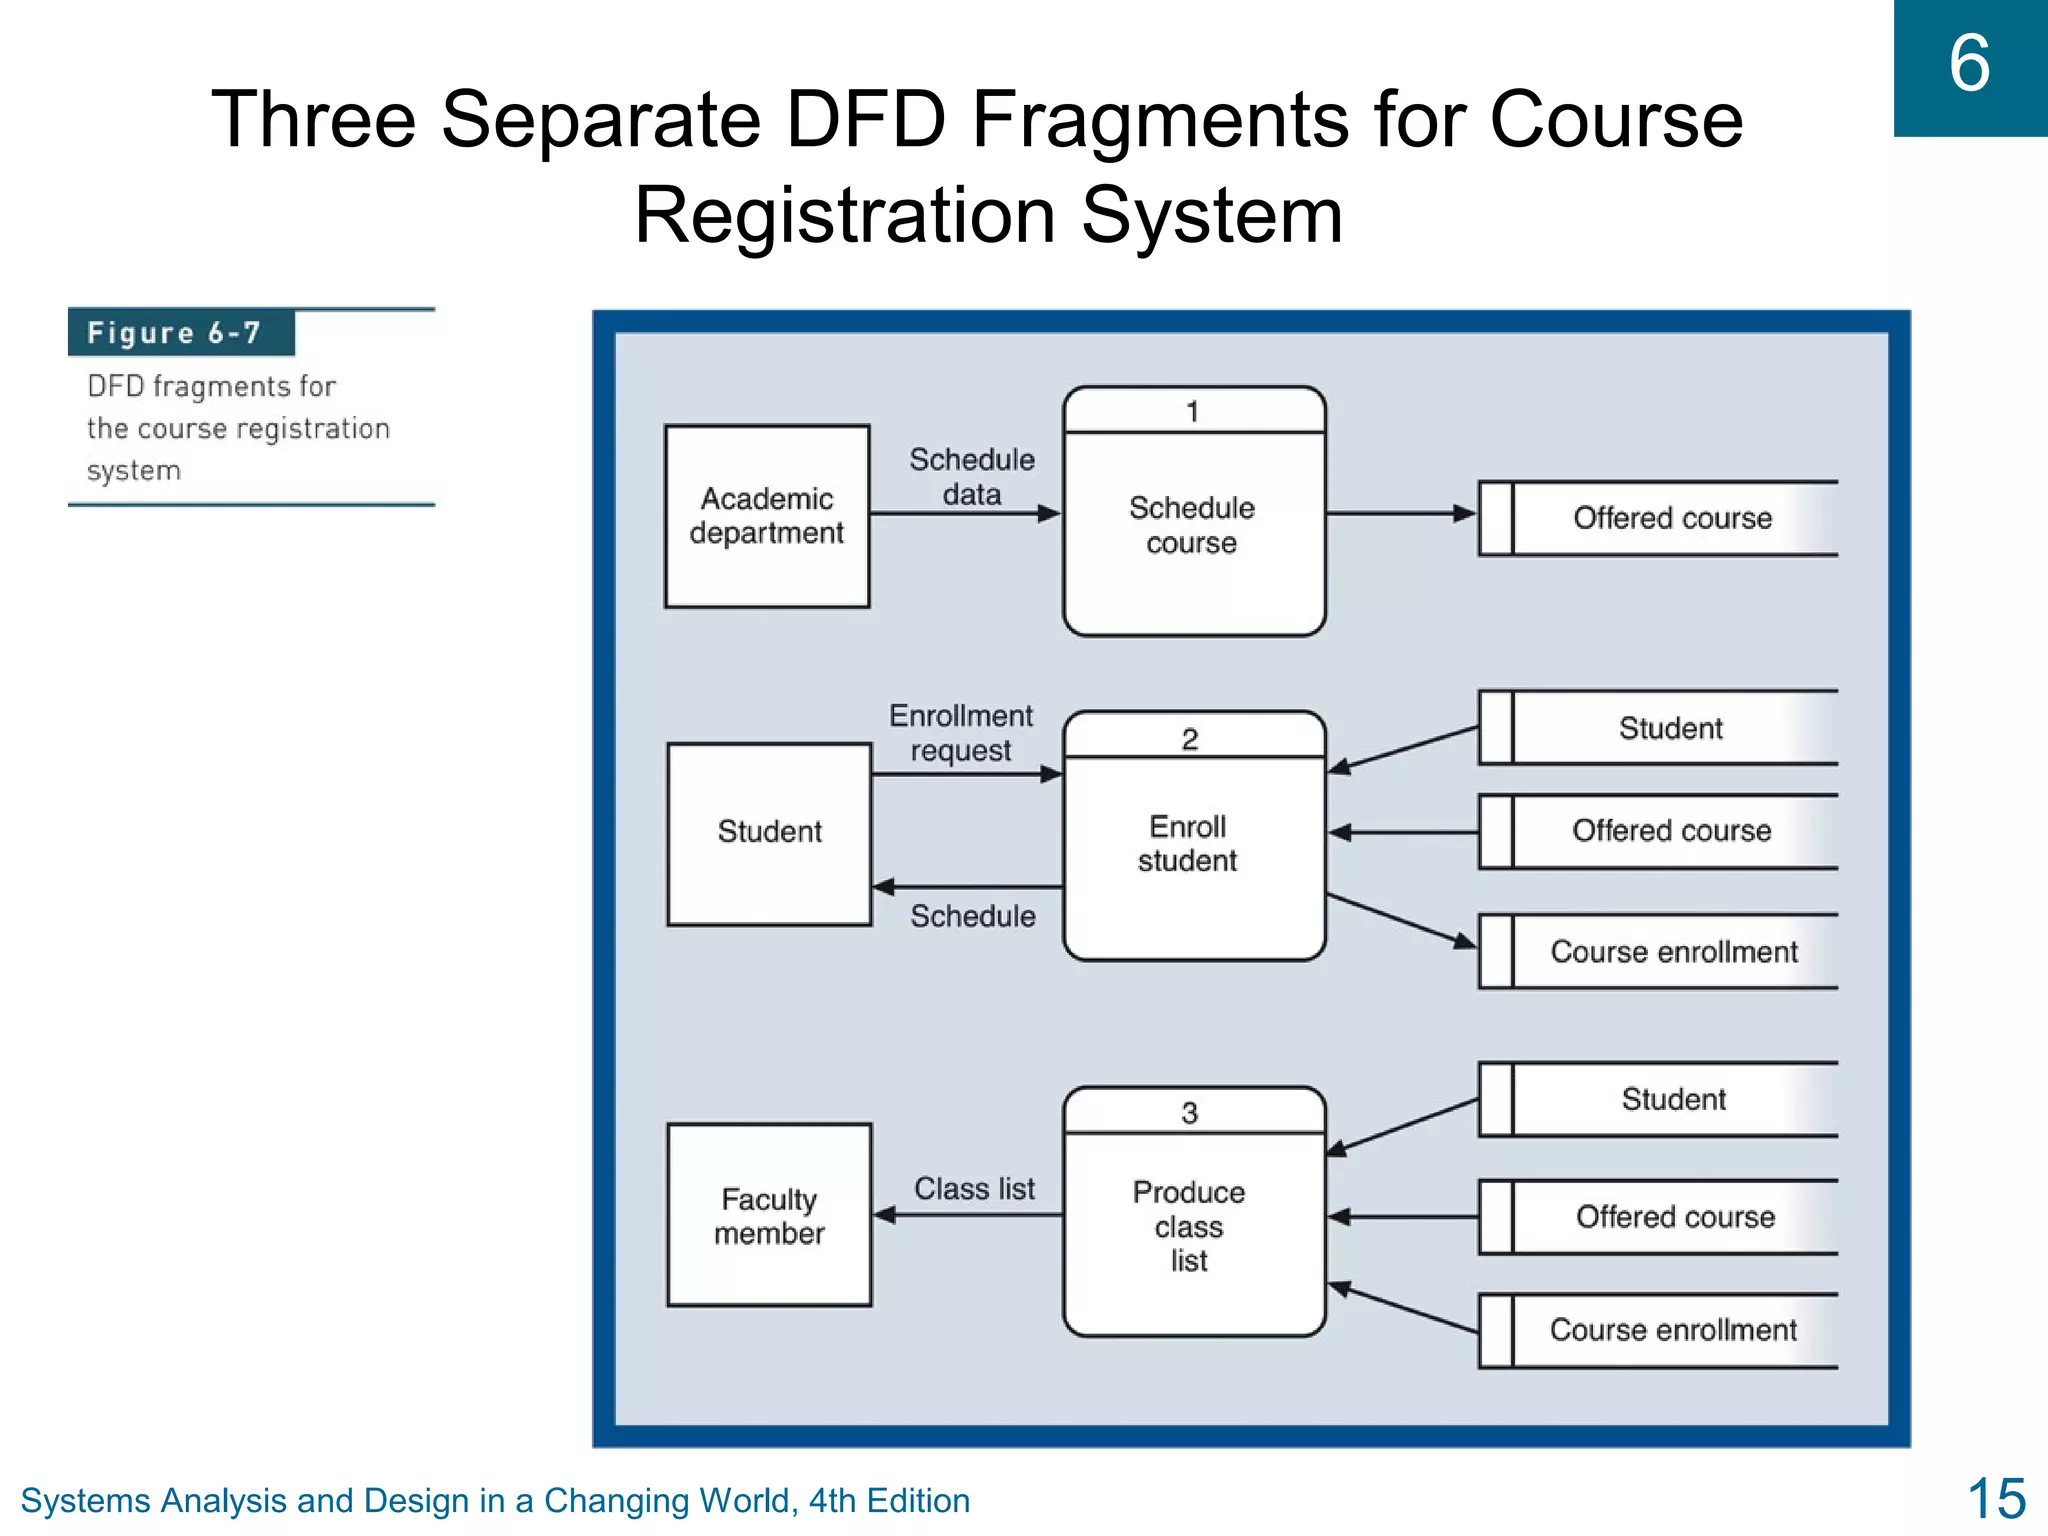
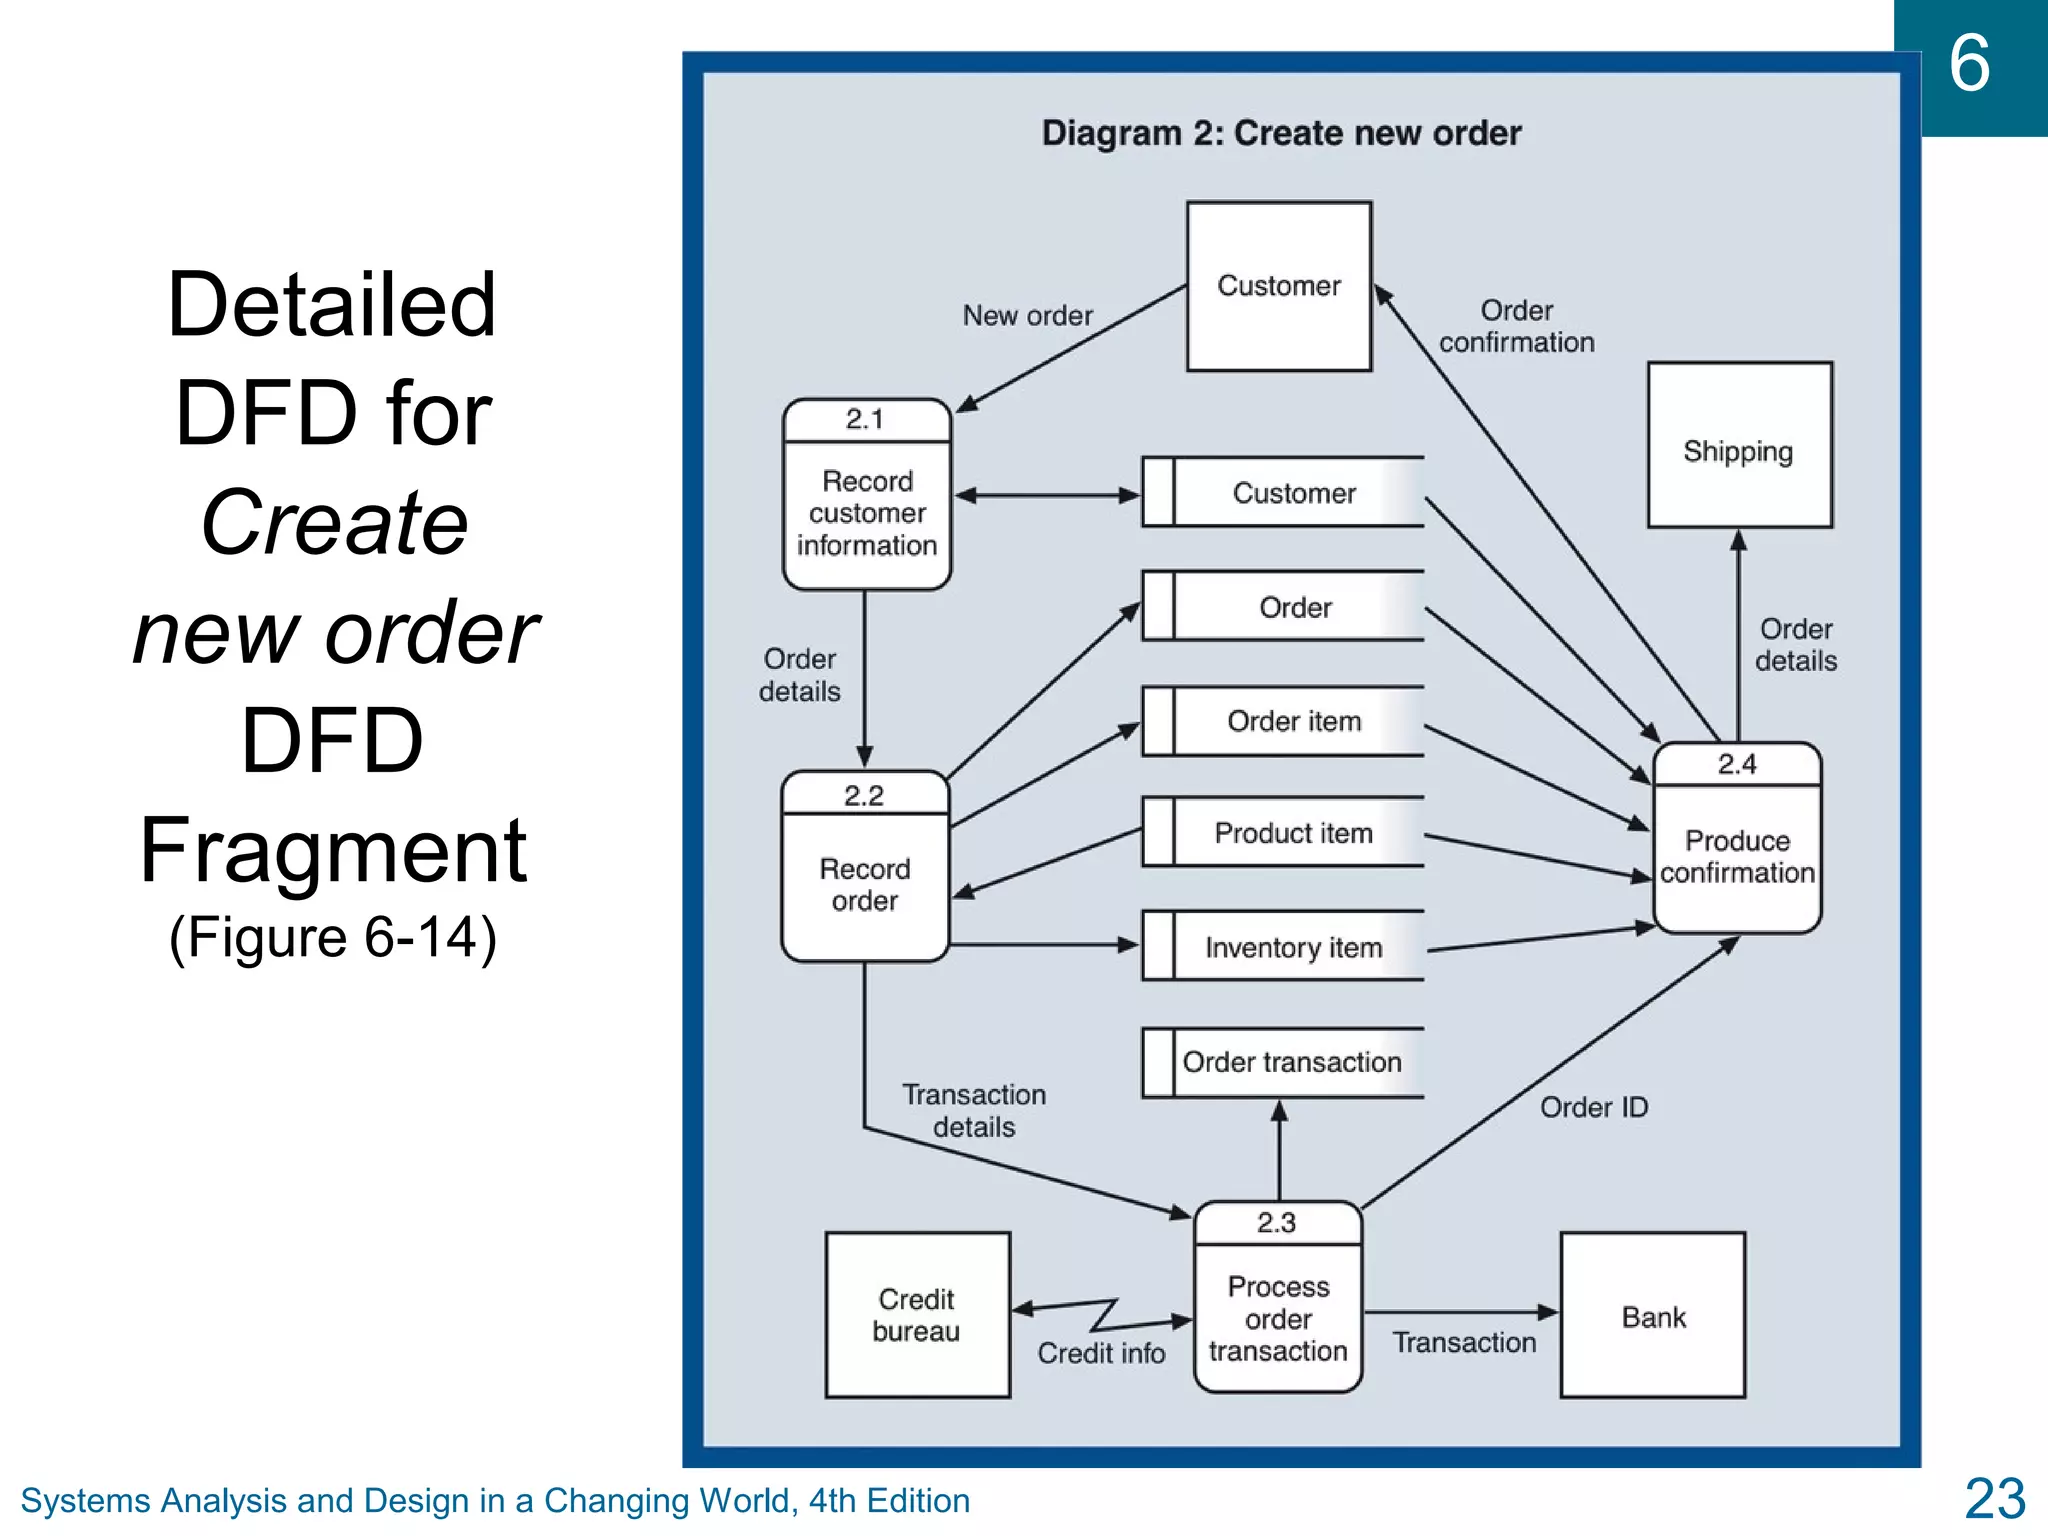
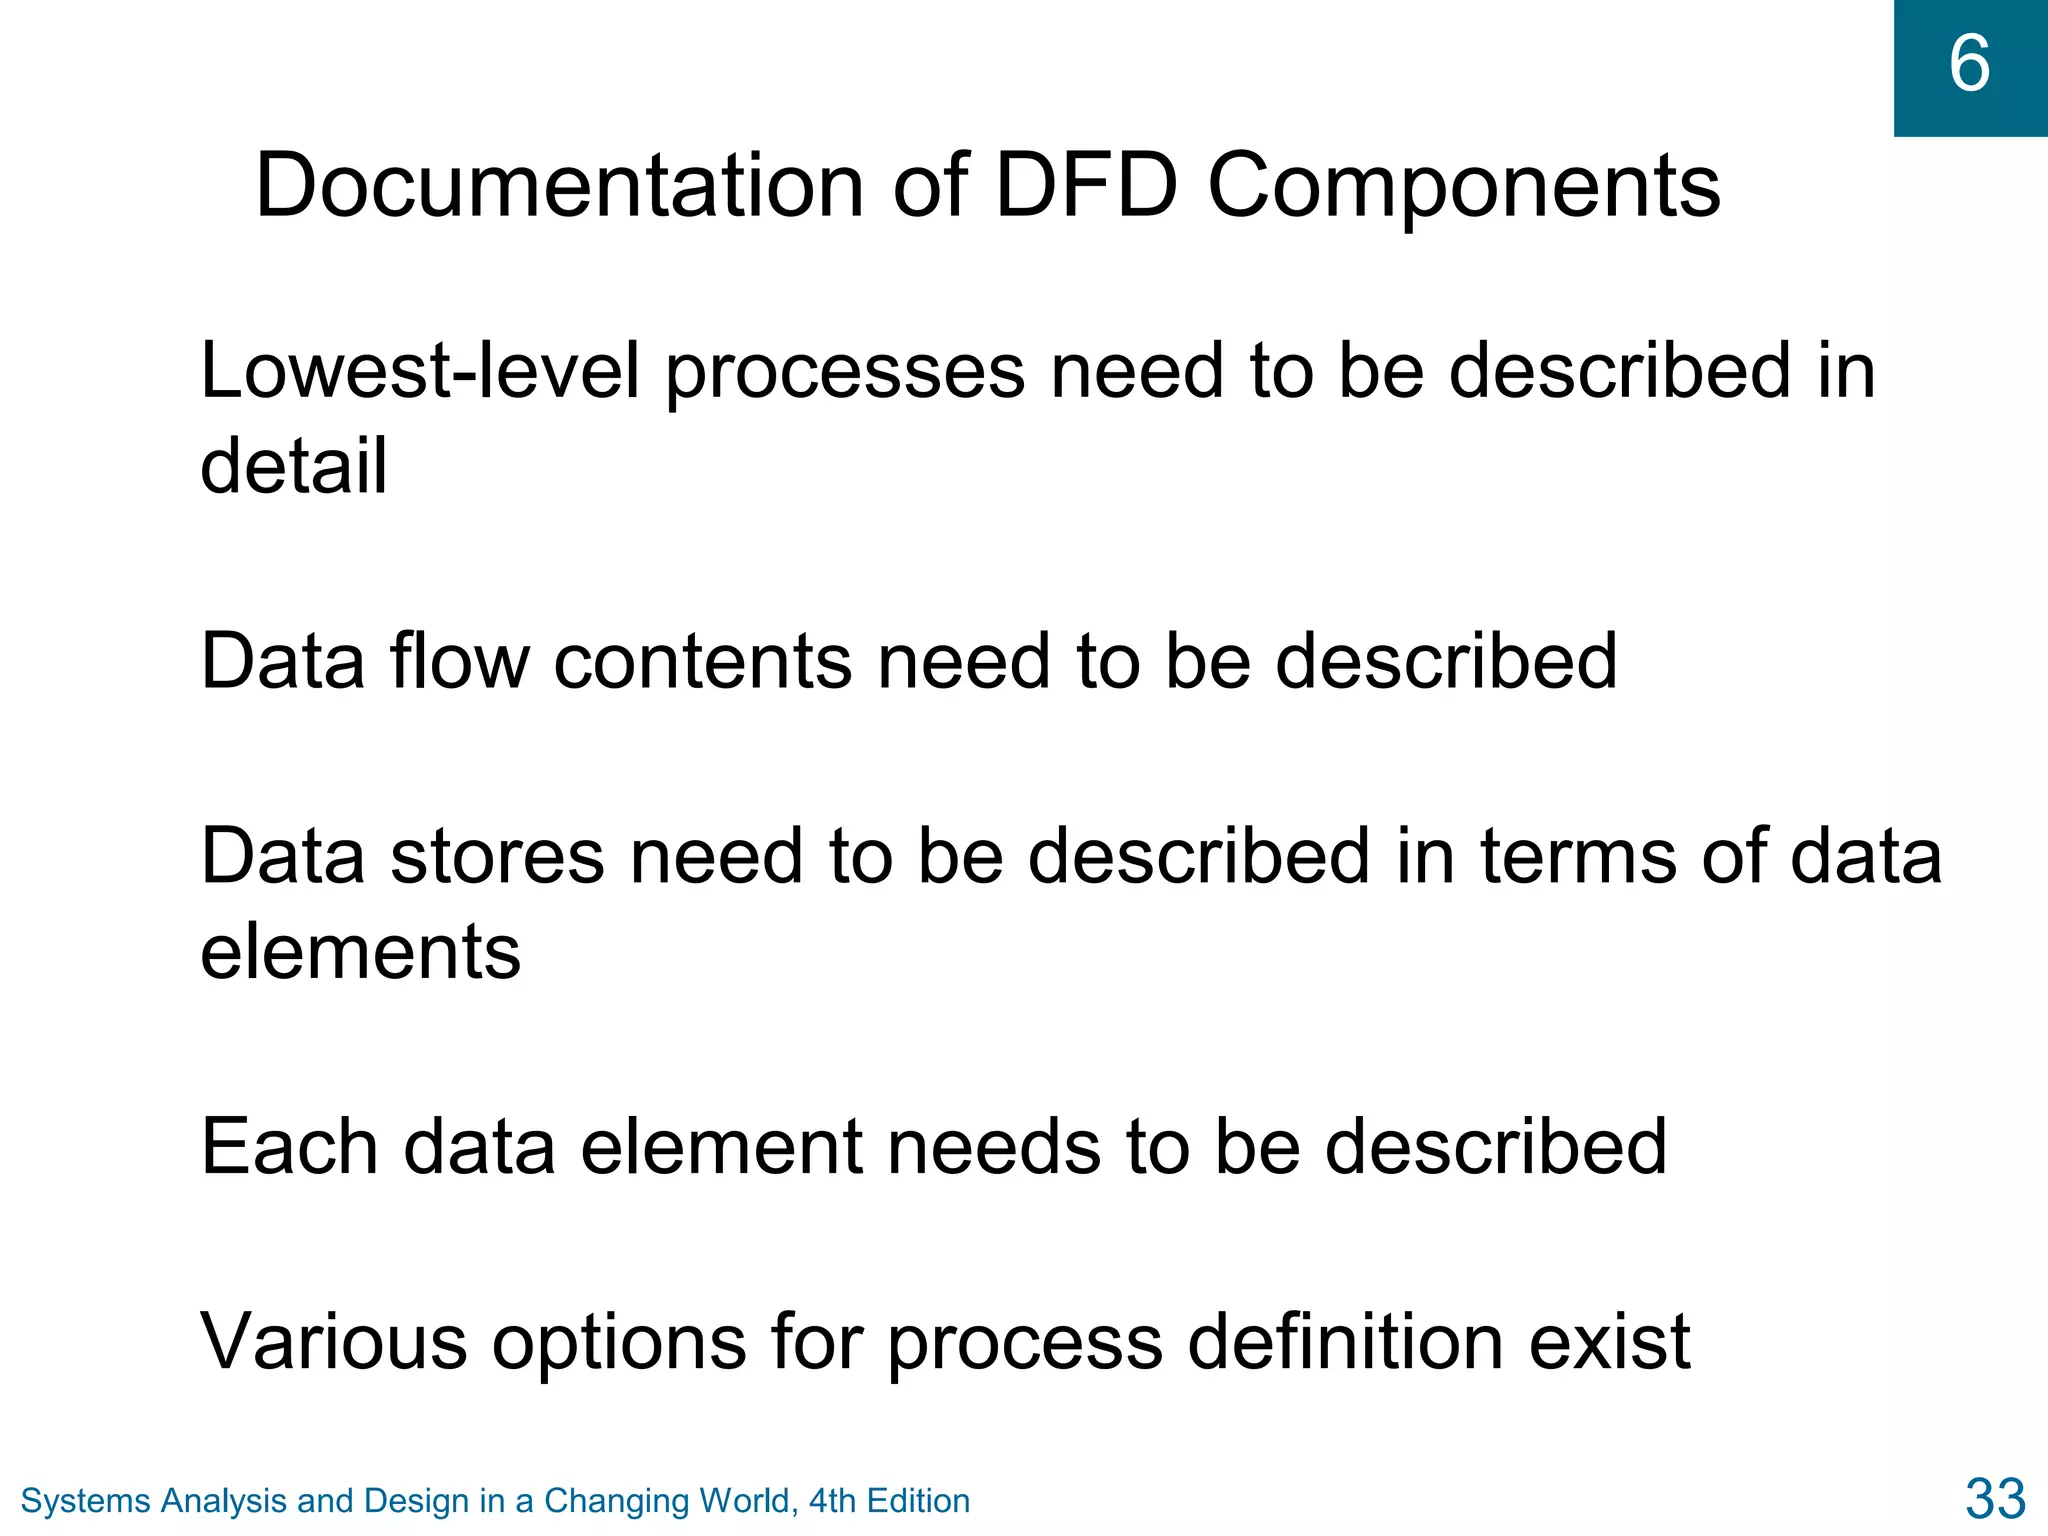
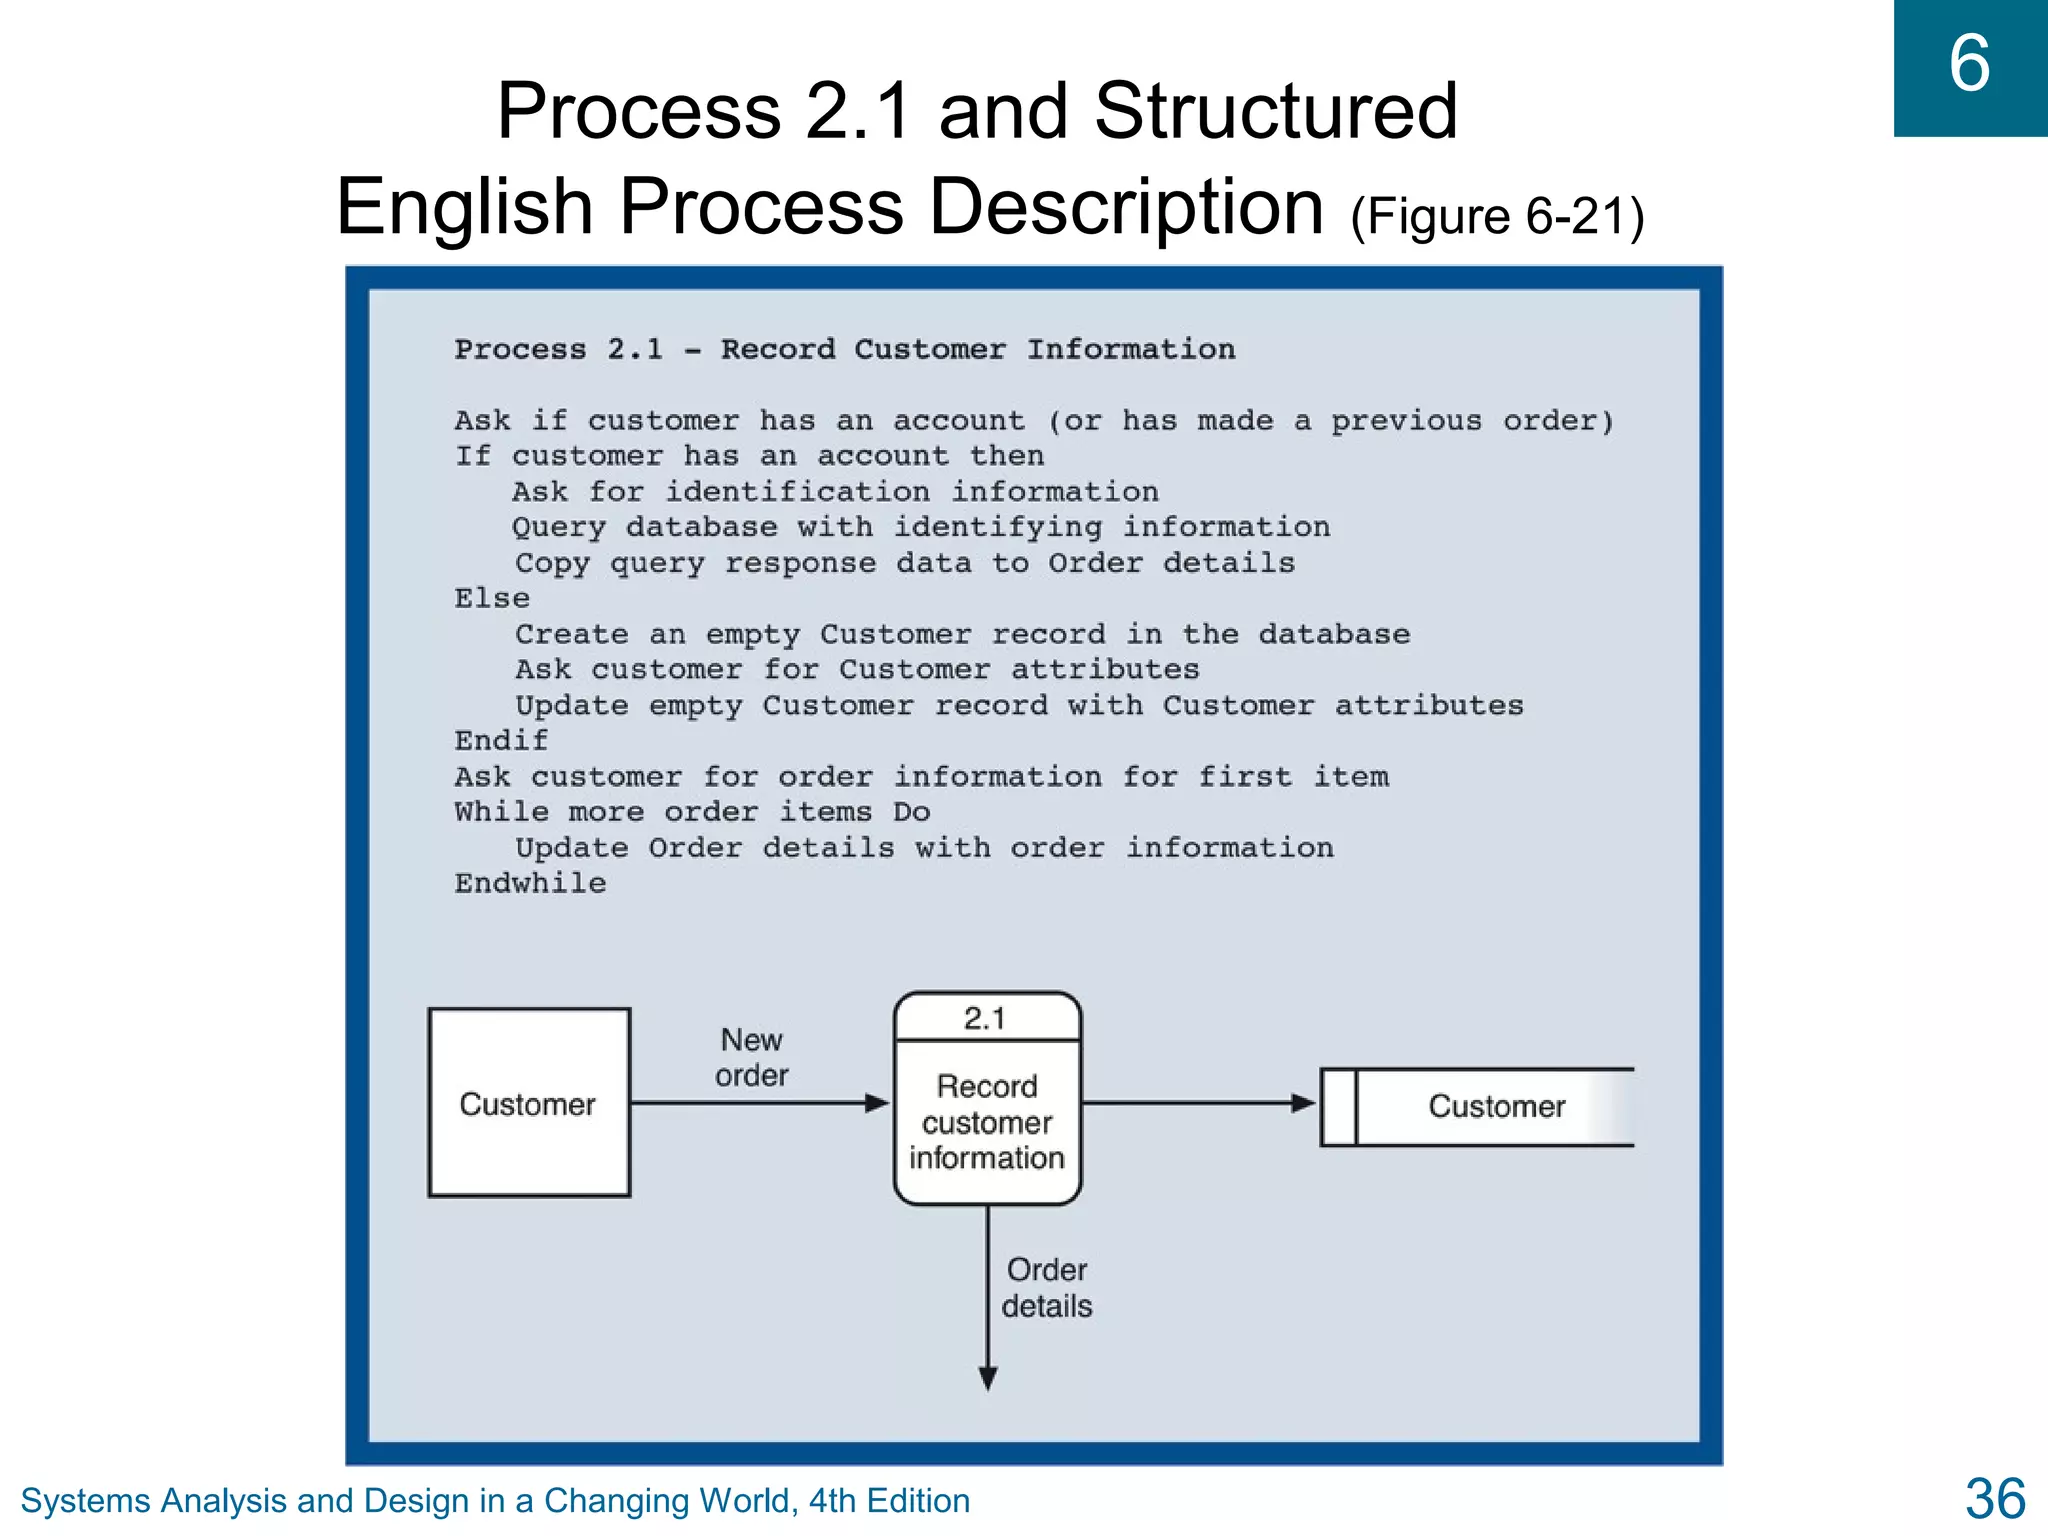
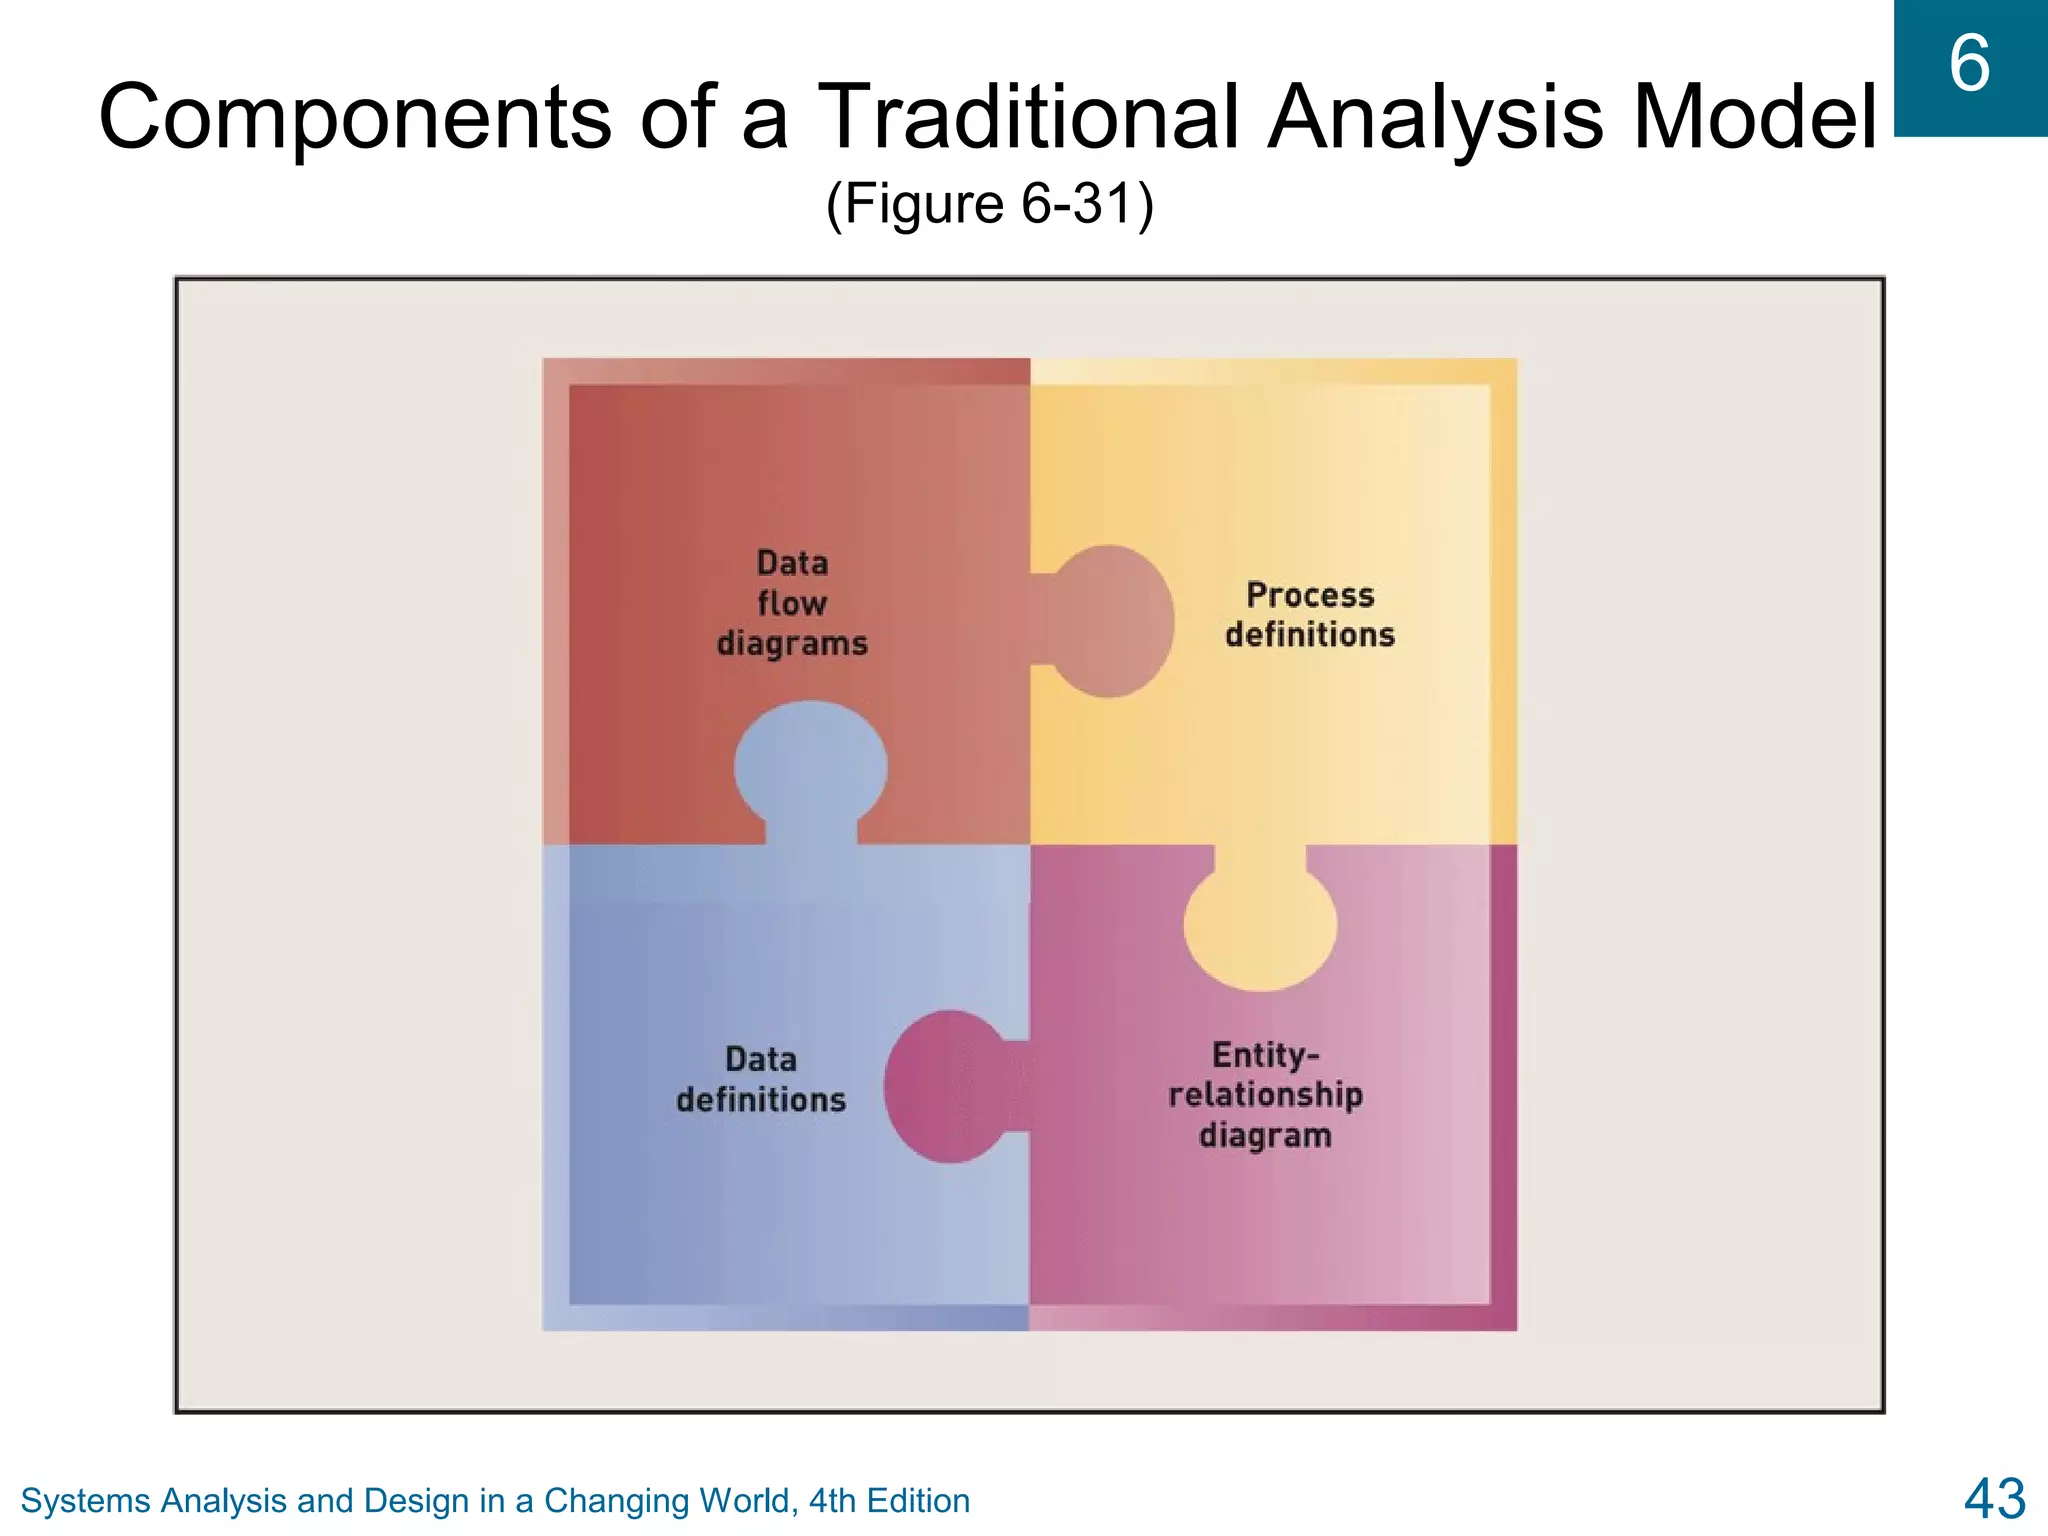
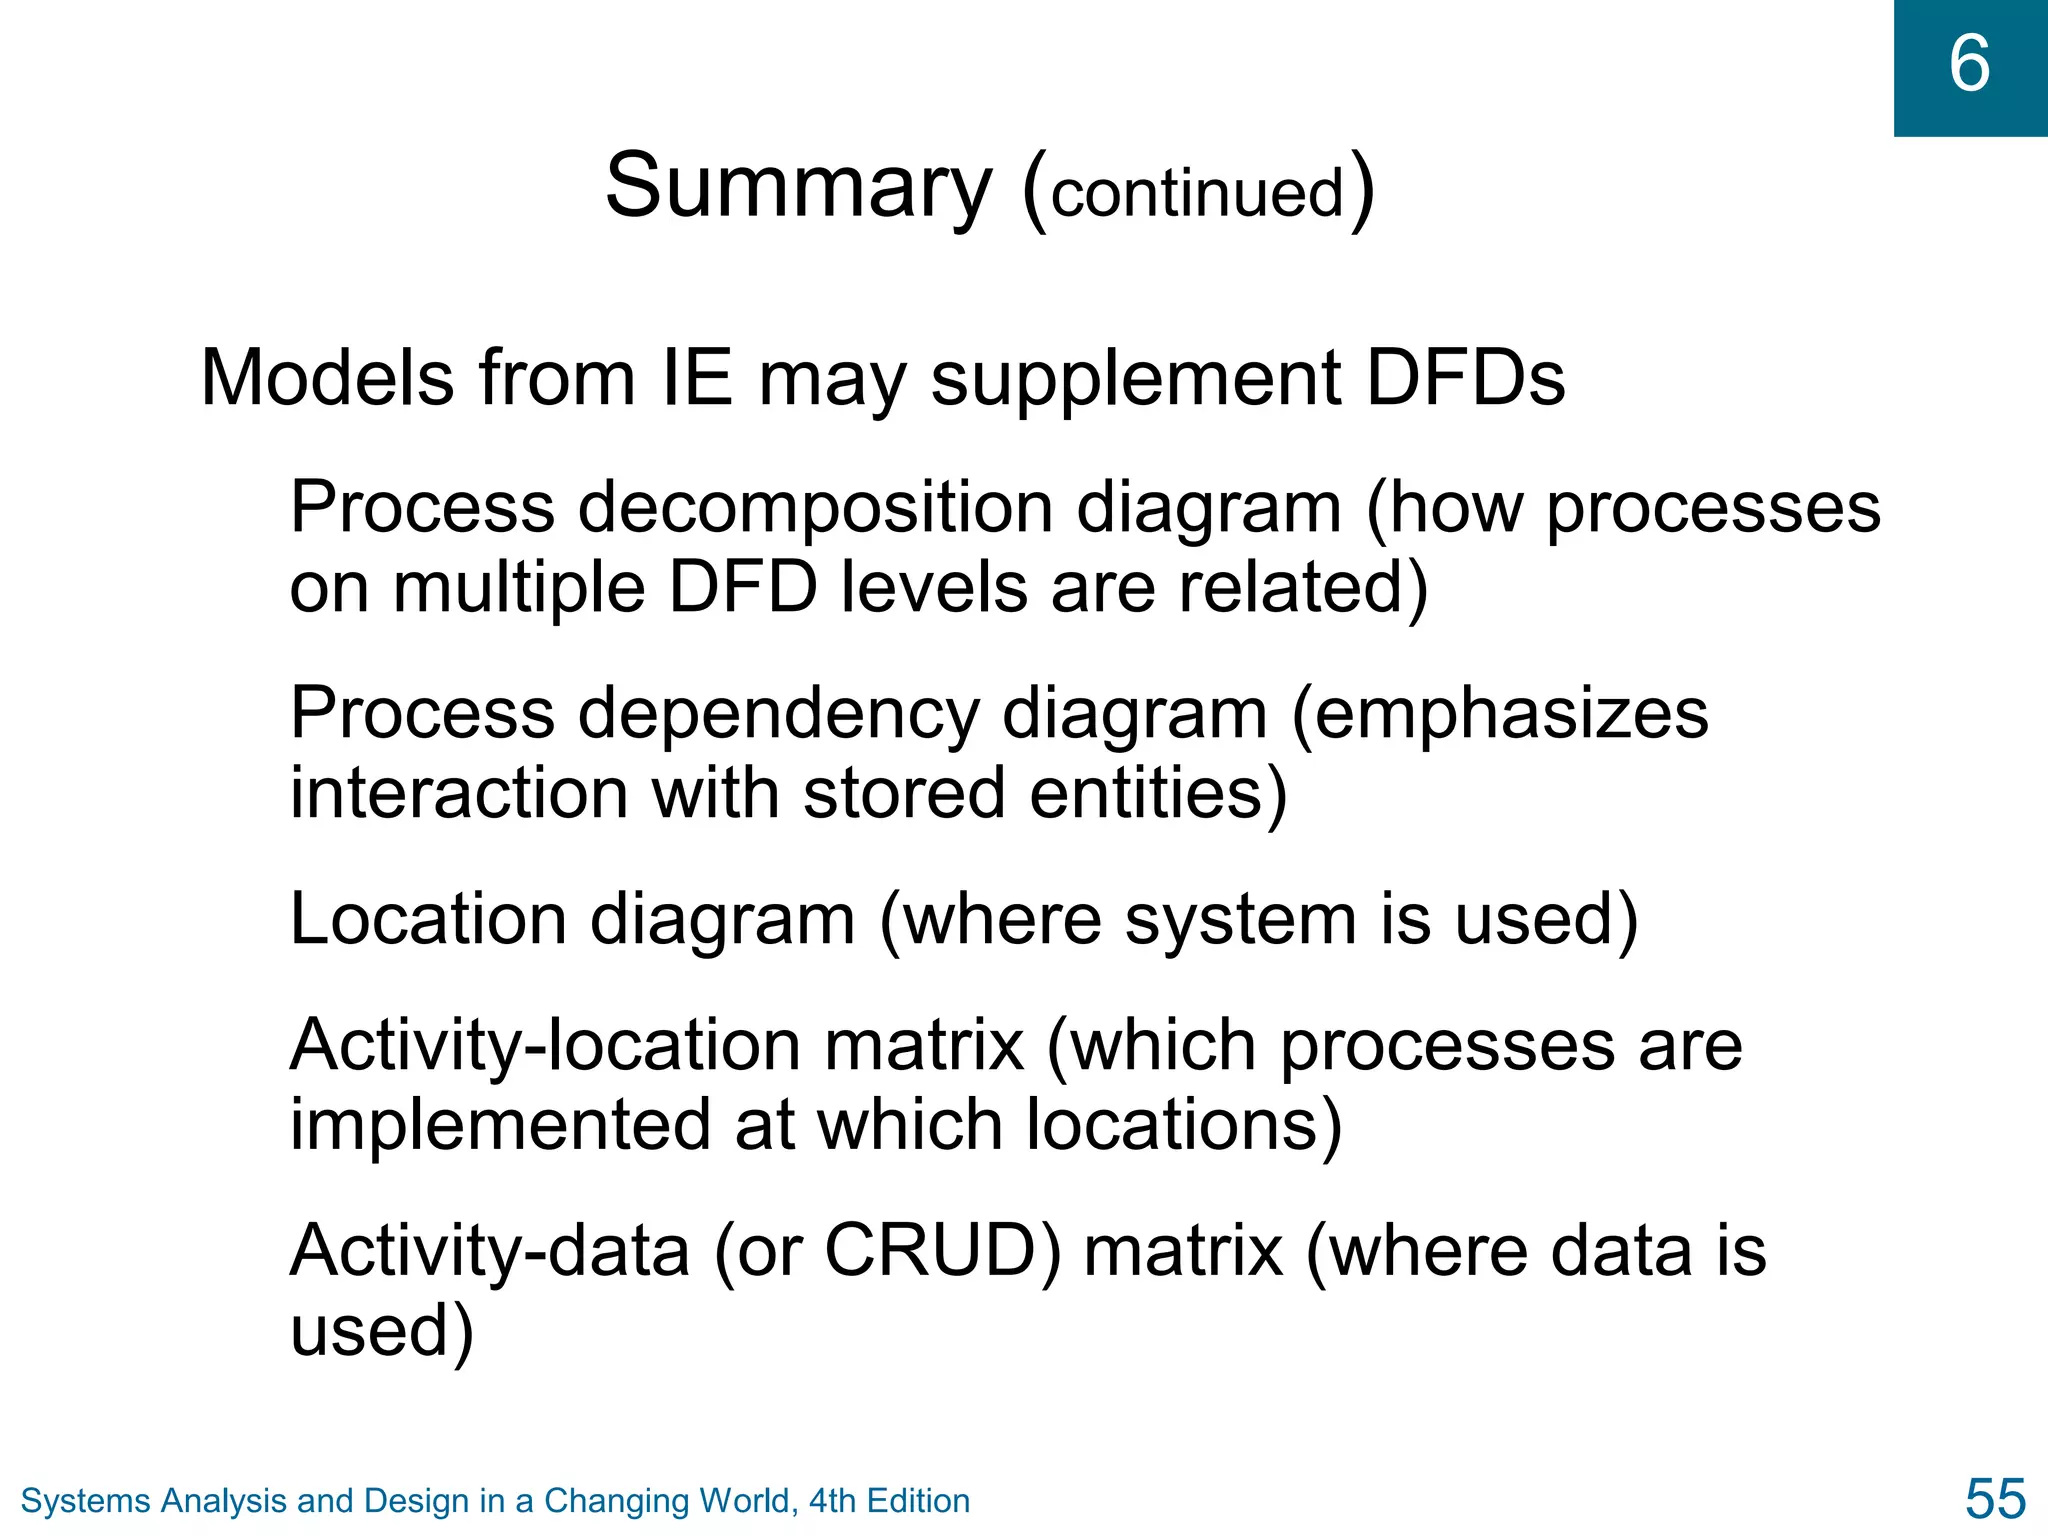
6
Systems Analysis and Design in a
Changing World, Fourth Edition
6
Systems Analysis and Design in a Changing World, 4th Edition 2
Learning Objectives
Explain how the traditional approach and the
object-oriented approach differ when modeling
the details of a use case
List the components of a traditional system and
the symbols representing them on a data flow
diagram
Describe how data flow diagrams can show the
system at various levels of abstraction
6
Systems Analysis and Design in a Changing World, 4th Edition 3
Learning Objectives (continued)
Develop data flow diagrams, data element
definitions, data store definitions, and process
descriptions
Read and interpret Information Engineering
models that can be incorporated within traditional
structured analysis
Develop tables to show the distribution of
processing and data access across system
locations
6
Systems Analysis and Design in a Changing World, 4th Edition 4
Overview
What the system does and what event occurs –
activities and interactions (use case)
Traditional structured approach to representing
activities and interactions
Diagrams and other models of the traditional
approach
RMO customer support system example shows
how each model is related
How traditional and IE approaches and models
can be used together to describe system
6
Systems Analysis and Design in a Changing World, 4th Edition 5
Traditional versus Object-Oriented
Approaches
6
Systems Analysis and Design in a Changing World, 4th Edition 6
Traditional Approach in this Chapter
6
Systems Analysis and Design in a Changing World, 4th Edition 7
Data Flow Diagrams (DFDs)
Graphical system model that shows all main
requirements for an IS in one diagram
Inputs/outputs
Processes
Data storage
Easy to read and understand with minimal
training
6
Systems Analysis and Design in a Changing World, 4th Edition 8
Data Flow
Diagram
Symbols
(Figure 6-3)
6
Systems Analysis and Design in a Changing World, 4th Edition 9
DFD Fragment Showing Use Case Look
up item availability from the RMO (Figure 6-4)
6
Systems Analysis and Design in a Changing World, 4th Edition 10
DFD Integrates Event Table and ERD (Figure 6-5)
6
Systems Analysis and Design in a Changing World, 4th Edition 11
DFD and Levels of Abstraction
Data flow diagrams (DFDs) are decomposed into
additional diagrams to provide multiple levels of
detail
Higher-level diagrams provide general views of
system
Lower-level diagrams provide detailed views of
system
Differing views are called levels of abstraction
6
Systems Analysis and Design in a Changing World, 4th Edition 12
Layers of
DFD
Abstraction
for Course
Registration
System
(Figure 6-6)
6
Systems Analysis and Design in a Changing World, 4th Edition 13
Context Diagrams
DFD that summarizes all processing activity for
the system or subsystem
Highest level (most abstract) view of system
Shows system boundaries
System scope is represented by a single process,
external agents, and all data flows into and out of
the system
6
Systems Analysis and Design in a Changing World, 4th Edition 14
DFD Fragments
Created for each use case in the event table
Represent system response to one event within a
single process symbol
Self-contained models
Focus attention on single part of system
Show only data stores required in the use case
6
Systems Analysis and Design in a Changing World, 4th Edition 15
Three Separate DFD Fragments for Course
Registration System
6
Systems Analysis and Design in a Changing World, 4th Edition 16
Event-Partitioned System Model
DFD to model system requirements using single process
for each use case/activity in system or subsystem
Combines all DFD fragments together to show
decomposition of the context-level diagram
Sometimes called “diagram 0”
Used primarily as a presentation tool
Decomposed into more detailed DFD fragments
6
Systems Analysis and Design in a Changing World, 4th Edition 17
Combining
DFD
Fragments to
Create
Event-
Partitioned
System
Model
(Figure 6-8)
6
Systems Analysis and Design in a Changing World, 4th Edition 18
Context
Diagram for
RMO
Customer
Support
System
(Figure 6-9)
6
Systems Analysis and Design in a Changing World, 4th Edition 19
RMO Subsystems and Use Cases/Activities from
Event Table (Figure 6-10)
6
Systems Analysis and Design in a Changing World, 4th Edition 20
Context Diagram for RMO
Order-Entry Subsystem (Figure 6-11)
6
Systems Analysis and Design in a Changing World, 4th Edition 21
Five Separate DFD Fragments for RMO
Order-Entry Subsystem (Figure 6-12)
6
Systems Analysis and Design in a Changing World, 4th Edition 22
Decomposing DFD Fragments
Most DFD fragments can be further described using
structured English
Sometimes DFD fragments need to be diagrammed in
more detail
Decomposed into subprocesses in a detailed DFD
DFD numbering scheme
Hierarchical decomposition
DFD Fragment 2 is decomposed into Diagram 2
Diagram 2 has processes 2.1, 2.2, 2.3, 2.4
6
Systems Analysis and Design in a Changing World, 4th Edition 23
Detailed
DFD for
Create
new order
DFD
Fragment
(Figure 6-14)
6
Systems Analysis and Design in a Changing World, 4th Edition 24
Physical and Logical DFDs
Logical model
Assumes implementation in perfect technology
Does not tell how system is implemented
Physical model
Describes assumptions about implementation
technology
Developed in last stages of analysis or in early
design
6
Systems Analysis and Design in a Changing World, 4th Edition 25
Physical
DFD for
Scheduling
Courses
(Figure 6-15)
6
Systems Analysis and Design in a Changing World, 4th Edition 26
Evaluating DFD Quality
Readable
Internally consistent and balanced
Accurately represents system requirements
Reduces information overload – rule of 7 +/- 2
Single DFD should not have more than 7 +/-2
processes
No more than 7 +/- 2 data flows should enter or
leave a process or data store in a single DFD
Minimizes required number of interfaces
6
Systems Analysis and Design in a Changing World, 4th Edition 27
Data Flow Consistency Problems
Differences in data flow content between a
process and its process decomposition
Data outflows without corresponding inflows
Data inflows without corresponding outflows
Results in unbalanced DFDs
6
Systems Analysis and Design in a Changing World, 4th Edition 28
Consistency Rules
All data that flows into a process must
Flow out of the process, or
Be used to generate data that flows out of the
process
All data that flows out of a process must
Have flowed into the process, or
Have been generated from data that flowed into
the process
6
Systems Analysis and Design in a Changing World, 4th Edition 29
Unnecessary Data Input: Black Hole
6
Systems Analysis and Design in a Changing World, 4th Edition 30
Process with Impossible Data Output:
A Miracle (Figure 6-17)
6
Systems Analysis and Design in a Changing World, 4th Edition 31
Process with Unnecessary Data Input
(Figure 6-18)
6
Systems Analysis and Design in a Changing World, 4th Edition 32
Process with Impossible Data Output
(Figure 6-19)
6
Systems Analysis and Design in a Changing World, 4th Edition 33
Documentation of DFD Components
Lowest-level processes need to be described in
detail
Data flow contents need to be described
Data stores need to be described in terms of data
elements
Each data element needs to be described
Various options for process definition exist
6
Systems Analysis and Design in a Changing World, 4th Edition 34
Structured English
Method of writing process specifications
Combines structured programming techniques
with narrative English
Well-suited for lengthy sequential processes or
simple control logic (single loop or if-then-else)
Ill-suited for complex decision logic or few (or no)
sequential processing steps
6
Systems Analysis and Design in a Changing World, 4th Edition 35
Structured English Example (Figure 6-20)
6
Systems Analysis and Design in a Changing World, 4th Edition 36
Process 2.1 and Structured
English Process Description (Figure 6-21)
6
Systems Analysis and Design in a Changing World, 4th Edition 37
Decision Tables and Decision Trees
Can summarize complex decision logic better than structured
English
Incorporate logic into the table or tree structure to make
descriptions more readable
6
Systems Analysis and Design in a Changing World, 4th Edition 38
Decision Tree for Calculating
Shipping Charges (Figure 6-24)
6
Systems Analysis and Design in a Changing World, 4th Edition 39
Data Flow Definitions
Textual description of data flow’s content and internal
structure
Often coincide with attributes of data entities included in
ERD plus computed values
Algebraic notion describes data elements on data flow
plus data structure
6
Systems Analysis and Design in a Changing World, 4th Edition 40
Data Flow Definition for RMO Products
and Items Control Break Report (Figure 6-29)
6
Systems Analysis and Design in a Changing World, 4th Edition 41
Data Element Definitions
Data type description
String, integer, floating point, Boolean
Sometimes very specific written description
Length of element
Maximum and minimum values
Data dictionary – repository for definitions of data
flows, data stores, and data elements
6
Systems Analysis and Design in a Changing World, 4th Edition 42
Data Element Definition Examples
(Figure 6-30)
6
Systems Analysis and Design in a Changing World, 4th Edition 43
Components of a Traditional Analysis Model
(Figure 6-31)
6
Systems Analysis and Design in a Changing World, 4th Edition 44
Information Engineering Models
Focus on strategic planning, enterprise
applications, and data requirements of new
system
Share features with structured system
development methodology
Developed by James Martin in early 1980’s
Thought to be more rigorous and complete than
the structured approach
6
Systems Analysis and Design in a Changing World, 4th Edition 45
Information Engineering System
Development Life Cycle Phases (Figure 6-32)
6
Systems Analysis and Design in a Changing World, 4th Edition 46
Process Decomposition and Dependency
Models
IE process models show three information types
Decomposition of processes into other processes
Dependency relationships among processes
Internal processing logic
Process decomposition diagram – represents
hierarchical relationship among processes at
different levels of abstraction
Process dependency model – describes ordering
of processes and interaction with stored entities
6
Systems Analysis and Design in a Changing World, 4th Edition 47
Process
Decomposition
Diagram for RMO
(Figure 6-34)
6
Systems Analysis and Design in a Changing World, 4th Edition 48
Process Dependency Diagram (Figure 6-35)
6
Systems Analysis and Design in a Changing World, 4th Edition 49
Locations and Communication
Through Networks
Logical information needed during analysis
Number of user locations
Processing and data access requirements at
various locations
Volume and timing of processing and data access
requests
Needed to make initial design decisions such as
Distribution of computer systems, application
software, database components, network capacity
6
Systems Analysis and Design in a Changing World, 4th Edition 50
Gathering Location Information
Identify locations where work is to be performed
Draw location diagram
List functions performed by users at each location
Build activity-location matrix
Rows are system activities from event table
Columns are physical locations
Build activity-data (CRUD) matrix
CRUD – create, read, update, and delete
6
Systems Analysis and Design in a Changing World, 4th Edition 51
RMO Activity-Location Matrix (Figure 6-38)
6
Systems Analysis and Design in a Changing World, 4th Edition 52
RMO Activity-Data Matrix (CRUD)
(Figure 6-39)
6
Systems Analysis and Design in a Changing World, 4th Edition 53
Summary
Data flow diagrams (DFDs) are used in combination with
event table and entity-relationship diagram (ERD) to
model system requirements
DFDs model system as set of processes, data flows,
external agents, and data stores
DFDs easy to read – graphically represent key features of
system using small set of symbols
Many types of DFDs – context diagrams, DFD fragments,
subsystem DFDs, event-partitioned DFDs, and detailed
process DFDs
6
Systems Analysis and Design in a Changing World, 4th Edition 54
Summary (continued)
Each process, data flow, and data store requires
detailed definition
Analyst may define processes as structured
English process specifications, decision tables,
decision trees, or detail process DFDs
Detailed process decomposition DFDs used
when internal process complexity is great
Data flows are defined by component data
elements and their internal structure (algebraic
notation)
6
Systems Analysis and Design in a Changing World, 4th Edition 55
Summary (continued)
Models from IE may supplement DFDs
Process decomposition diagram (how processes
on multiple DFD levels are related)
Process dependency diagram (emphasizes
interaction with stored entities)
Location diagram (where system is used)
Activity-location matrix (which processes are
implemented at which locations)
Activity-data (or CRUD) matrix (where data is
used)

The Traditional Approach to Requirement

  • 1.
    6 Systems Analysis andDesign in a Changing World, Fourth Edition
  • 2.
    6 Systems Analysis andDesign in a Changing World, 4th Edition 2 Learning Objectives Explain how the traditional approach and the object-oriented approach differ when modeling the details of a use case List the components of a traditional system and the symbols representing them on a data flow diagram Describe how data flow diagrams can show the system at various levels of abstraction
  • 3.
    6 Systems Analysis andDesign in a Changing World, 4th Edition 3 Learning Objectives (continued) Develop data flow diagrams, data element definitions, data store definitions, and process descriptions Read and interpret Information Engineering models that can be incorporated within traditional structured analysis Develop tables to show the distribution of processing and data access across system locations
  • 4.
    6 Systems Analysis andDesign in a Changing World, 4th Edition 4 Overview What the system does and what event occurs – activities and interactions (use case) Traditional structured approach to representing activities and interactions Diagrams and other models of the traditional approach RMO customer support system example shows how each model is related How traditional and IE approaches and models can be used together to describe system
  • 5.
    6 Systems Analysis andDesign in a Changing World, 4th Edition 5 Traditional versus Object-Oriented Approaches
  • 6.
    6 Systems Analysis andDesign in a Changing World, 4th Edition 6 Traditional Approach in this Chapter
  • 7.
    6 Systems Analysis andDesign in a Changing World, 4th Edition 7 Data Flow Diagrams (DFDs) Graphical system model that shows all main requirements for an IS in one diagram Inputs/outputs Processes Data storage Easy to read and understand with minimal training
  • 8.
    6 Systems Analysis andDesign in a Changing World, 4th Edition 8 Data Flow Diagram Symbols (Figure 6-3)
  • 9.
    6 Systems Analysis andDesign in a Changing World, 4th Edition 9 DFD Fragment Showing Use Case Look up item availability from the RMO (Figure 6-4)
  • 10.
    6 Systems Analysis andDesign in a Changing World, 4th Edition 10 DFD Integrates Event Table and ERD (Figure 6-5)
  • 11.
    6 Systems Analysis andDesign in a Changing World, 4th Edition 11 DFD and Levels of Abstraction Data flow diagrams (DFDs) are decomposed into additional diagrams to provide multiple levels of detail Higher-level diagrams provide general views of system Lower-level diagrams provide detailed views of system Differing views are called levels of abstraction
  • 12.
    6 Systems Analysis andDesign in a Changing World, 4th Edition 12 Layers of DFD Abstraction for Course Registration System (Figure 6-6)
  • 13.
    6 Systems Analysis andDesign in a Changing World, 4th Edition 13 Context Diagrams DFD that summarizes all processing activity for the system or subsystem Highest level (most abstract) view of system Shows system boundaries System scope is represented by a single process, external agents, and all data flows into and out of the system
  • 14.
    6 Systems Analysis andDesign in a Changing World, 4th Edition 14 DFD Fragments Created for each use case in the event table Represent system response to one event within a single process symbol Self-contained models Focus attention on single part of system Show only data stores required in the use case
  • 15.
    6 Systems Analysis andDesign in a Changing World, 4th Edition 15 Three Separate DFD Fragments for Course Registration System
  • 16.
    6 Systems Analysis andDesign in a Changing World, 4th Edition 16 Event-Partitioned System Model DFD to model system requirements using single process for each use case/activity in system or subsystem Combines all DFD fragments together to show decomposition of the context-level diagram Sometimes called “diagram 0” Used primarily as a presentation tool Decomposed into more detailed DFD fragments
  • 17.
    6 Systems Analysis andDesign in a Changing World, 4th Edition 17 Combining DFD Fragments to Create Event- Partitioned System Model (Figure 6-8)
  • 18.
    6 Systems Analysis andDesign in a Changing World, 4th Edition 18 Context Diagram for RMO Customer Support System (Figure 6-9)
  • 19.
    6 Systems Analysis andDesign in a Changing World, 4th Edition 19 RMO Subsystems and Use Cases/Activities from Event Table (Figure 6-10)
  • 20.
    6 Systems Analysis andDesign in a Changing World, 4th Edition 20 Context Diagram for RMO Order-Entry Subsystem (Figure 6-11)
  • 21.
    6 Systems Analysis andDesign in a Changing World, 4th Edition 21 Five Separate DFD Fragments for RMO Order-Entry Subsystem (Figure 6-12)
  • 22.
    6 Systems Analysis andDesign in a Changing World, 4th Edition 22 Decomposing DFD Fragments Most DFD fragments can be further described using structured English Sometimes DFD fragments need to be diagrammed in more detail Decomposed into subprocesses in a detailed DFD DFD numbering scheme Hierarchical decomposition DFD Fragment 2 is decomposed into Diagram 2 Diagram 2 has processes 2.1, 2.2, 2.3, 2.4
  • 23.
    6 Systems Analysis andDesign in a Changing World, 4th Edition 23 Detailed DFD for Create new order DFD Fragment (Figure 6-14)
  • 24.
    6 Systems Analysis andDesign in a Changing World, 4th Edition 24 Physical and Logical DFDs Logical model Assumes implementation in perfect technology Does not tell how system is implemented Physical model Describes assumptions about implementation technology Developed in last stages of analysis or in early design
  • 25.
    6 Systems Analysis andDesign in a Changing World, 4th Edition 25 Physical DFD for Scheduling Courses (Figure 6-15)
  • 26.
    6 Systems Analysis andDesign in a Changing World, 4th Edition 26 Evaluating DFD Quality Readable Internally consistent and balanced Accurately represents system requirements Reduces information overload – rule of 7 +/- 2 Single DFD should not have more than 7 +/-2 processes No more than 7 +/- 2 data flows should enter or leave a process or data store in a single DFD Minimizes required number of interfaces
  • 27.
    6 Systems Analysis andDesign in a Changing World, 4th Edition 27 Data Flow Consistency Problems Differences in data flow content between a process and its process decomposition Data outflows without corresponding inflows Data inflows without corresponding outflows Results in unbalanced DFDs
  • 28.
    6 Systems Analysis andDesign in a Changing World, 4th Edition 28 Consistency Rules All data that flows into a process must Flow out of the process, or Be used to generate data that flows out of the process All data that flows out of a process must Have flowed into the process, or Have been generated from data that flowed into the process
  • 29.
    6 Systems Analysis andDesign in a Changing World, 4th Edition 29 Unnecessary Data Input: Black Hole
  • 30.
    6 Systems Analysis andDesign in a Changing World, 4th Edition 30 Process with Impossible Data Output: A Miracle (Figure 6-17)
  • 31.
    6 Systems Analysis andDesign in a Changing World, 4th Edition 31 Process with Unnecessary Data Input (Figure 6-18)
  • 32.
    6 Systems Analysis andDesign in a Changing World, 4th Edition 32 Process with Impossible Data Output (Figure 6-19)
  • 33.
    6 Systems Analysis andDesign in a Changing World, 4th Edition 33 Documentation of DFD Components Lowest-level processes need to be described in detail Data flow contents need to be described Data stores need to be described in terms of data elements Each data element needs to be described Various options for process definition exist
  • 34.
    6 Systems Analysis andDesign in a Changing World, 4th Edition 34 Structured English Method of writing process specifications Combines structured programming techniques with narrative English Well-suited for lengthy sequential processes or simple control logic (single loop or if-then-else) Ill-suited for complex decision logic or few (or no) sequential processing steps
  • 35.
    6 Systems Analysis andDesign in a Changing World, 4th Edition 35 Structured English Example (Figure 6-20)
  • 36.
    6 Systems Analysis andDesign in a Changing World, 4th Edition 36 Process 2.1 and Structured English Process Description (Figure 6-21)
  • 37.
    6 Systems Analysis andDesign in a Changing World, 4th Edition 37 Decision Tables and Decision Trees Can summarize complex decision logic better than structured English Incorporate logic into the table or tree structure to make descriptions more readable
  • 38.
    6 Systems Analysis andDesign in a Changing World, 4th Edition 38 Decision Tree for Calculating Shipping Charges (Figure 6-24)
  • 39.
    6 Systems Analysis andDesign in a Changing World, 4th Edition 39 Data Flow Definitions Textual description of data flow’s content and internal structure Often coincide with attributes of data entities included in ERD plus computed values Algebraic notion describes data elements on data flow plus data structure
  • 40.
    6 Systems Analysis andDesign in a Changing World, 4th Edition 40 Data Flow Definition for RMO Products and Items Control Break Report (Figure 6-29)
  • 41.
    6 Systems Analysis andDesign in a Changing World, 4th Edition 41 Data Element Definitions Data type description String, integer, floating point, Boolean Sometimes very specific written description Length of element Maximum and minimum values Data dictionary – repository for definitions of data flows, data stores, and data elements
  • 42.
    6 Systems Analysis andDesign in a Changing World, 4th Edition 42 Data Element Definition Examples (Figure 6-30)
  • 43.
    6 Systems Analysis andDesign in a Changing World, 4th Edition 43 Components of a Traditional Analysis Model (Figure 6-31)
  • 44.
    6 Systems Analysis andDesign in a Changing World, 4th Edition 44 Information Engineering Models Focus on strategic planning, enterprise applications, and data requirements of new system Share features with structured system development methodology Developed by James Martin in early 1980’s Thought to be more rigorous and complete than the structured approach
  • 45.
    6 Systems Analysis andDesign in a Changing World, 4th Edition 45 Information Engineering System Development Life Cycle Phases (Figure 6-32)
  • 46.
    6 Systems Analysis andDesign in a Changing World, 4th Edition 46 Process Decomposition and Dependency Models IE process models show three information types Decomposition of processes into other processes Dependency relationships among processes Internal processing logic Process decomposition diagram – represents hierarchical relationship among processes at different levels of abstraction Process dependency model – describes ordering of processes and interaction with stored entities
  • 47.
    6 Systems Analysis andDesign in a Changing World, 4th Edition 47 Process Decomposition Diagram for RMO (Figure 6-34)
  • 48.
    6 Systems Analysis andDesign in a Changing World, 4th Edition 48 Process Dependency Diagram (Figure 6-35)
  • 49.
    6 Systems Analysis andDesign in a Changing World, 4th Edition 49 Locations and Communication Through Networks Logical information needed during analysis Number of user locations Processing and data access requirements at various locations Volume and timing of processing and data access requests Needed to make initial design decisions such as Distribution of computer systems, application software, database components, network capacity
  • 50.
    6 Systems Analysis andDesign in a Changing World, 4th Edition 50 Gathering Location Information Identify locations where work is to be performed Draw location diagram List functions performed by users at each location Build activity-location matrix Rows are system activities from event table Columns are physical locations Build activity-data (CRUD) matrix CRUD – create, read, update, and delete
  • 51.
    6 Systems Analysis andDesign in a Changing World, 4th Edition 51 RMO Activity-Location Matrix (Figure 6-38)
  • 52.
    6 Systems Analysis andDesign in a Changing World, 4th Edition 52 RMO Activity-Data Matrix (CRUD) (Figure 6-39)
  • 53.
    6 Systems Analysis andDesign in a Changing World, 4th Edition 53 Summary Data flow diagrams (DFDs) are used in combination with event table and entity-relationship diagram (ERD) to model system requirements DFDs model system as set of processes, data flows, external agents, and data stores DFDs easy to read – graphically represent key features of system using small set of symbols Many types of DFDs – context diagrams, DFD fragments, subsystem DFDs, event-partitioned DFDs, and detailed process DFDs
  • 54.
    6 Systems Analysis andDesign in a Changing World, 4th Edition 54 Summary (continued) Each process, data flow, and data store requires detailed definition Analyst may define processes as structured English process specifications, decision tables, decision trees, or detail process DFDs Detailed process decomposition DFDs used when internal process complexity is great Data flows are defined by component data elements and their internal structure (algebraic notation)
  • 55.
    6 Systems Analysis andDesign in a Changing World, 4th Edition 55 Summary (continued) Models from IE may supplement DFDs Process decomposition diagram (how processes on multiple DFD levels are related) Process dependency diagram (emphasizes interaction with stored entities) Location diagram (where system is used) Activity-location matrix (which processes are implemented at which locations) Activity-data (or CRUD) matrix (where data is used)