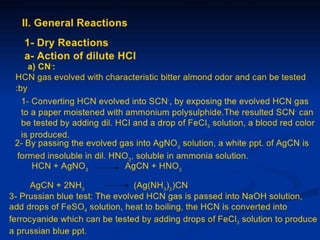
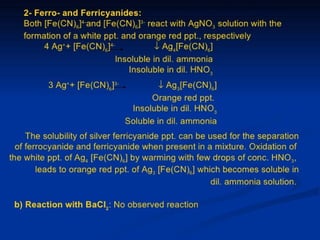
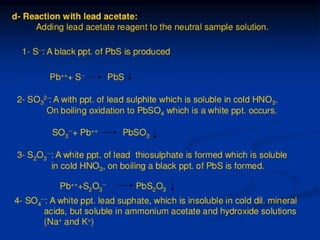
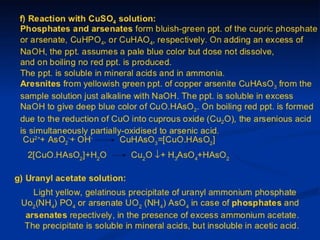
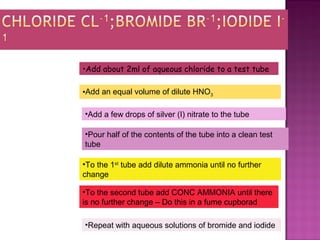
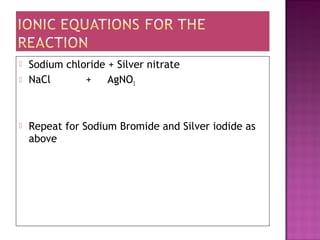
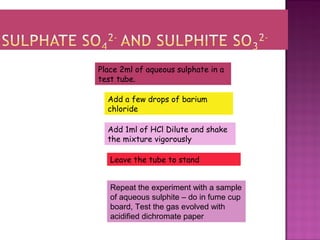
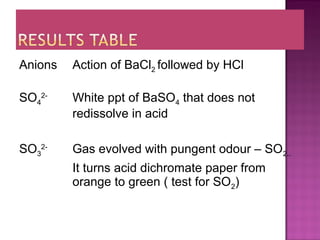
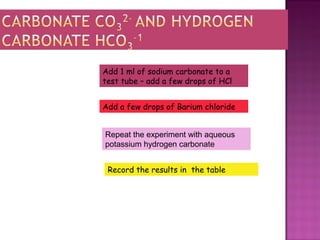
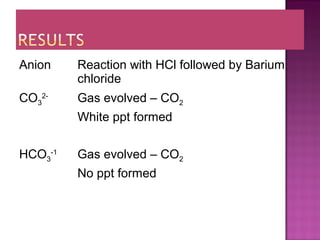
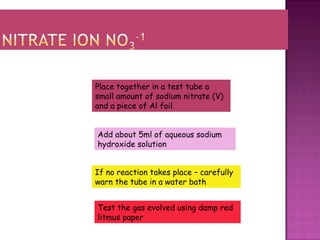
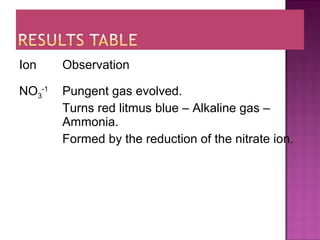
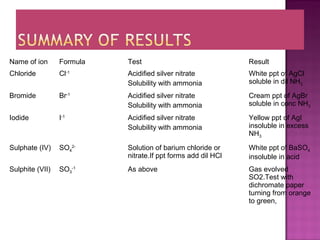
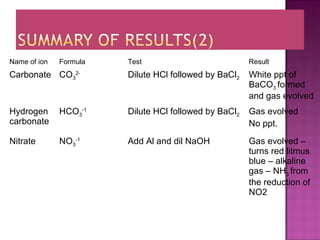
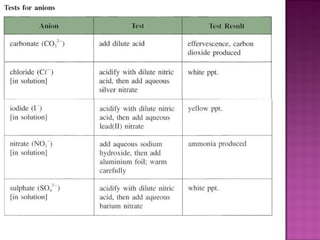
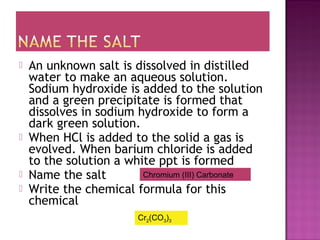
This document provides information about qualitative analysis of common anions and cations. It describes a series of chemical tests to identify various ions by observing reactions such as formation of precipitates or gases. For example, chloride ions are identified by the formation of a white precipitate with silver nitrate that dissolves in dilute ammonia. The document also lists the expected observations for ions such as sulfate, sulfite, carbonate, hydrogen carbonate and nitrate. Finally, it presents the analysis of an unknown salt and identifies it as chromium (III) carbonate based on the observed green precipitate and reactions.
Precipitation formation
Precipitation condition and precipitation purity
Methods in Precipitation titration
Mohr method
Volhard method
Fajans method
Titrations with precipitating agents are useful for determining certain analytes e.g. Cl- can be determined when titrated with AgNO3.
Detection of end point:
Chemical
-Precipitation Type - Mohr’s method
-Adsorption – Fajan’s method
-For silver analyses –Volhard method
Sensors –Potentiometric or amperometric
The chemical types are also classified into:
1.Indicators reacting with titrant forming specific color.
2.Adsorption indicators.
Anatacid || B pharmacy First Year || Presentation || kkwagh ||
This presentation is helpful for your study
This Presentation Contain
• Introduction
• characteristics of ideal antacid
• classification of antacid
• Some common use antacid
INTRODUCTION TO PHARMACEUTICAL CHEMISTRY AND LIMIT TESTSUJATA WANKHEDE
INTRODUCTION TO PHARMACEUTICAL CHEMISTRY, INTRODUCTION TO LIMIT TESTS, LIMIT TEST OF IRON, CHLORIDE, SULPHATE, ARSENIC AND THERE DIAGRAMS WITHTHE PRINCIPAL AND PROCEDURE OF ALL THE LIMIT TEST WITH THEIR RESULTS
Introduction:
RNA interference (RNAi) or Post-Transcriptional Gene Silencing (PTGS) is an important biological process for modulating eukaryotic gene expression.
It is highly conserved process of posttranscriptional gene silencing by which double stranded RNA (dsRNA) causes sequence-specific degradation of mRNA sequences.
dsRNA-induced gene silencing (RNAi) is reported in a wide range of eukaryotes ranging from worms, insects, mammals and plants.
This process mediates resistance to both endogenous parasitic and exogenous pathogenic nucleic acids, and regulates the expression of protein-coding genes.
What are small ncRNAs?
micro RNA (miRNA)
short interfering RNA (siRNA)
Properties of small non-coding RNA:
Involved in silencing mRNA transcripts.
Called “small” because they are usually only about 21-24 nucleotides long.
Synthesized by first cutting up longer precursor sequences (like the 61nt one that Lee discovered).
Silence an mRNA by base pairing with some sequence on the mRNA.
Discovery of siRNA?
The first small RNA:
In 1993 Rosalind Lee (Victor Ambros lab) was studying a non- coding gene in C. elegans, lin-4, that was involved in silencing of another gene, lin-14, at the appropriate time in the
development of the worm C. elegans.
Two small transcripts of lin-4 (22nt and 61nt) were found to be complementary to a sequence in the 3' UTR of lin-14.
Because lin-4 encoded no protein, she deduced that it must be these transcripts that are causing the silencing by RNA-RNA interactions.
Types of RNAi ( non coding RNA)
MiRNA
Length (23-25 nt)
Trans acting
Binds with target MRNA in mismatch
Translation inhibition
Si RNA
Length 21 nt.
Cis acting
Bind with target Mrna in perfect complementary sequence
Piwi-RNA
Length ; 25 to 36 nt.
Expressed in Germ Cells
Regulates trnasposomes activity
MECHANISM OF RNAI:
First the double-stranded RNA teams up with a protein complex named Dicer, which cuts the long RNA into short pieces.
Then another protein complex called RISC (RNA-induced silencing complex) discards one of the two RNA strands.
The RISC-docked, single-stranded RNA then pairs with the homologous mRNA and destroys it.
THE RISC COMPLEX:
RISC is large(>500kD) RNA multi- protein Binding complex which triggers MRNA degradation in response to MRNA
Unwinding of double stranded Si RNA by ATP independent Helicase
Active component of RISC is Ago proteins( ENDONUCLEASE) which cleave target MRNA.
DICER: endonuclease (RNase Family III)
Argonaute: Central Component of the RNA-Induced Silencing Complex (RISC)
One strand of the dsRNA produced by Dicer is retained in the RISC complex in association with Argonaute
ARGONAUTE PROTEIN :
1.PAZ(PIWI/Argonaute/ Zwille)- Recognition of target MRNA
2.PIWI (p-element induced wimpy Testis)- breaks Phosphodiester bond of mRNA.)RNAse H activity.
MiRNA:
The Double-stranded RNAs are naturally produced in eukaryotic cells during development, and they have a key role in regulating gene expression .
Earliest Galaxies in the JADES Origins Field: Luminosity Function and Cosmic ...Sérgio Sacani
We characterize the earliest galaxy population in the JADES Origins Field (JOF), the deepest
imaging field observed with JWST. We make use of the ancillary Hubble optical images (5 filters
spanning 0.4−0.9µm) and novel JWST images with 14 filters spanning 0.8−5µm, including 7 mediumband filters, and reaching total exposure times of up to 46 hours per filter. We combine all our data
at > 2.3µm to construct an ultradeep image, reaching as deep as ≈ 31.4 AB mag in the stack and
30.3-31.0 AB mag (5σ, r = 0.1” circular aperture) in individual filters. We measure photometric
redshifts and use robust selection criteria to identify a sample of eight galaxy candidates at redshifts
z = 11.5 − 15. These objects show compact half-light radii of R1/2 ∼ 50 − 200pc, stellar masses of
M⋆ ∼ 107−108M⊙, and star-formation rates of SFR ∼ 0.1−1 M⊙ yr−1
. Our search finds no candidates
at 15 < z < 20, placing upper limits at these redshifts. We develop a forward modeling approach to
infer the properties of the evolving luminosity function without binning in redshift or luminosity that
marginalizes over the photometric redshift uncertainty of our candidate galaxies and incorporates the
impact of non-detections. We find a z = 12 luminosity function in good agreement with prior results,
and that the luminosity function normalization and UV luminosity density decline by a factor of ∼ 2.5
from z = 12 to z = 14. We discuss the possible implications of our results in the context of theoretical
models for evolution of the dark matter halo mass function.
This pdf is about the Schizophrenia.
For more details visit on YouTube; @SELF-EXPLANATORY;
https://www.youtube.com/channel/UCAiarMZDNhe1A3Rnpr_WkzA/videos
Thanks...!
Deep Behavioral Phenotyping in Systems Neuroscience for Functional Atlasing a...Ana Luísa Pinho
Functional Magnetic Resonance Imaging (fMRI) provides means to characterize brain activations in response to behavior. However, cognitive neuroscience has been limited to group-level effects referring to the performance of specific tasks. To obtain the functional profile of elementary cognitive mechanisms, the combination of brain responses to many tasks is required. Yet, to date, both structural atlases and parcellation-based activations do not fully account for cognitive function and still present several limitations. Further, they do not adapt overall to individual characteristics. In this talk, I will give an account of deep-behavioral phenotyping strategies, namely data-driven methods in large task-fMRI datasets, to optimize functional brain-data collection and improve inference of effects-of-interest related to mental processes. Key to this approach is the employment of fast multi-functional paradigms rich on features that can be well parametrized and, consequently, facilitate the creation of psycho-physiological constructs to be modelled with imaging data. Particular emphasis will be given to music stimuli when studying high-order cognitive mechanisms, due to their ecological nature and quality to enable complex behavior compounded by discrete entities. I will also discuss how deep-behavioral phenotyping and individualized models applied to neuroimaging data can better account for the subject-specific organization of domain-general cognitive systems in the human brain. Finally, the accumulation of functional brain signatures brings the possibility to clarify relationships among tasks and create a univocal link between brain systems and mental functions through: (1) the development of ontologies proposing an organization of cognitive processes; and (2) brain-network taxonomies describing functional specialization. To this end, tools to improve commensurability in cognitive science are necessary, such as public repositories, ontology-based platforms and automated meta-analysis tools. I will thus discuss some brain-atlasing resources currently under development, and their applicability in cognitive as well as clinical neuroscience.
A brief information about the SCOP protein database used in bioinformatics.
The Structural Classification of Proteins (SCOP) database is a comprehensive and authoritative resource for the structural and evolutionary relationships of proteins. It provides a detailed and curated classification of protein structures, grouping them into families, superfamilies, and folds based on their structural and sequence similarities.
Multi-source connectivity as the driver of solar wind variability in the heli...Sérgio Sacani
The ambient solar wind that flls the heliosphere originates from multiple
sources in the solar corona and is highly structured. It is often described
as high-speed, relatively homogeneous, plasma streams from coronal
holes and slow-speed, highly variable, streams whose source regions are
under debate. A key goal of ESA/NASA’s Solar Orbiter mission is to identify
solar wind sources and understand what drives the complexity seen in the
heliosphere. By combining magnetic feld modelling and spectroscopic
techniques with high-resolution observations and measurements, we show
that the solar wind variability detected in situ by Solar Orbiter in March
2022 is driven by spatio-temporal changes in the magnetic connectivity to
multiple sources in the solar atmosphere. The magnetic feld footpoints
connected to the spacecraft moved from the boundaries of a coronal hole
to one active region (12961) and then across to another region (12957). This
is refected in the in situ measurements, which show the transition from fast
to highly Alfvénic then to slow solar wind that is disrupted by the arrival of
a coronal mass ejection. Our results describe solar wind variability at 0.5 au
but are applicable to near-Earth observatories.
Seminar of U.V. Spectroscopy by SAMIR PANDASAMIR PANDA
Spectroscopy is a branch of science dealing the study of interaction of electromagnetic radiation with matter.
Ultraviolet-visible spectroscopy refers to absorption spectroscopy or reflect spectroscopy in the UV-VIS spectral region.
Ultraviolet-visible spectroscopy is an analytical method that can measure the amount of light received by the analyte.
Cancer cell metabolism: special Reference to Lactate PathwayAADYARAJPANDEY1
Normal Cell Metabolism:
Cellular respiration describes the series of steps that cells use to break down sugar and other chemicals to get the energy we need to function.
Energy is stored in the bonds of glucose and when glucose is broken down, much of that energy is released.
Cell utilize energy in the form of ATP.
The first step of respiration is called glycolysis. In a series of steps, glycolysis breaks glucose into two smaller molecules - a chemical called pyruvate. A small amount of ATP is formed during this process.
Most healthy cells continue the breakdown in a second process, called the Kreb's cycle. The Kreb's cycle allows cells to “burn” the pyruvates made in glycolysis to get more ATP.
The last step in the breakdown of glucose is called oxidative phosphorylation (Ox-Phos).
It takes place in specialized cell structures called mitochondria. This process produces a large amount of ATP. Importantly, cells need oxygen to complete oxidative phosphorylation.
If a cell completes only glycolysis, only 2 molecules of ATP are made per glucose. However, if the cell completes the entire respiration process (glycolysis - Kreb's - oxidative phosphorylation), about 36 molecules of ATP are created, giving it much more energy to use.
IN CANCER CELL:
Unlike healthy cells that "burn" the entire molecule of sugar to capture a large amount of energy as ATP, cancer cells are wasteful.
Cancer cells only partially break down sugar molecules. They overuse the first step of respiration, glycolysis. They frequently do not complete the second step, oxidative phosphorylation.
This results in only 2 molecules of ATP per each glucose molecule instead of the 36 or so ATPs healthy cells gain. As a result, cancer cells need to use a lot more sugar molecules to get enough energy to survive.
introduction to WARBERG PHENOMENA:
WARBURG EFFECT Usually, cancer cells are highly glycolytic (glucose addiction) and take up more glucose than do normal cells from outside.
Otto Heinrich Warburg (; 8 October 1883 – 1 August 1970) In 1931 was awarded the Nobel Prize in Physiology for his "discovery of the nature and mode of action of the respiratory enzyme.
WARNBURG EFFECT : cancer cells under aerobic (well-oxygenated) conditions to metabolize glucose to lactate (aerobic glycolysis) is known as the Warburg effect. Warburg made the observation that tumor slices consume glucose and secrete lactate at a higher rate than normal tissues.
8. •Add about 2ml of aqueous chloride to a test tube
•Add an equal volume of dilute HNO3
•Add a few drops of silver (I) nitrate to the tube
•Pour half of the contents of the tube into a clean test
tube
•To the 1st
tube add dilute ammonia until no further
change
•To the second tube add CONC AMMONIA until there
is no further change – Do this in a fume cupborad
•Repeat with aqueous solutions of bromide and iodide
9. Halide Ion
HNO3 then
AgNO3
Action of dilute NH3 on
product
Action of conc NH3 on
product
Cl-1
White ppt White ppt dissolves White ppt
dissolves
Br-1
Cream ppt Insoluble Cream ppt
dissolves
I-1
Yellow ppt Insoluble insoluble
10. Sodium chloride + Silver nitrate
NaCl + AgNO3
Repeat for Sodium Bromide and Silver iodide as
above
11. Place 2ml of aqueous sulphate in a
test tube.
Add a few drops of barium
chloride
Add 1ml of HCl Dilute and shake
the mixture vigorously
Leave the tube to stand
Repeat the experiment with a sample
of aqueous sulphite – do in fume cup
board, Test the gas evolved with
acidified dichromate paper
12. Anions Action of BaCl2 followed by HCl
SO4
2-
White ppt of BaSO4 that does not
redissolve in acid
SO3
2-
Gas evolved with pungent odour – SO2..
It turns acid dichromate paper from
orange to green ( test for SO2)
13. Add 1 ml of sodium carbonate to a
test tube – add a few drops of HCl
Repeat the experiment with aqueous
potassium hydrogen carbonate
Record the results in the table
Add a few drops of Barium chloride
14. Anion Reaction with HCl followed by Barium
chloride
CO3
2-
Gas evolved – CO2
White ppt formed
HCO3
-1
Gas evolved – CO2
No ppt formed
15. Place together in a test tube a
small amount of sodium nitrate (V)
and a piece of Al foil.
Add about 5ml of aqueous sodium
hydroxide solution
If no reaction takes place – carefully
warn the tube in a water bath
Test the gas evolved using damp red
litmus paper
17. Name of ion Formula Test Result
Chloride Cl-1
Acidified silver nitrate
Solubility with ammonia
White ppt of AgCl
soluble in dil NH3
Bromide Br-1
Acidified silver nitrate
Solubility with ammonia
Cream ppt of AgBr
soluble in conc NH3
Iodide I-1
Acidified silver nitrate
Solubility with ammonia
Yellow ppt of AgI
insoluble in excess
NH3
Sulphate (IV) SO4
2-
Solution of barium chloride or
nitrate.If ppt forms add dil HCl
White ppt of BaSO4
insoluble in acid
Sulphite (VII) SO3
-1
As above Gas evolved
SO2.Test with
dichromate paper
turning from orange
to green,
18. Name of ion Formula Test Result
Carbonate CO3
2-
Dilute HCl followed by BaCl2 White ppt of
BaCO3 formed
and gas evolved
Hydrogen
carbonate
HCO3
-1
Dilute HCl followed by BaCl2 Gas evolved
No ppt.
Nitrate NO3
-1
Add Al and dil NaOH Gas evolved –
turns red litmus
blue – alkaline
gas – NH3 from
the reduction of
NO2
19.
20. An unknown salt is dissolved in distilled
water to make an aqueous solution.
Sodium hydroxide is added to the solution
and a green precipitate is formed that
dissolves in sodium hydroxide to form a
dark green solution.
When HCl is added to the solid a gas is
evolved. When barium chloride is added
to the solution a white ppt is formed
Name the salt
Write the chemical formula for this
chemical
Chromium (III) Carbonate
Cr2(CO3)3