Download to read offline


![Page 13 of 43
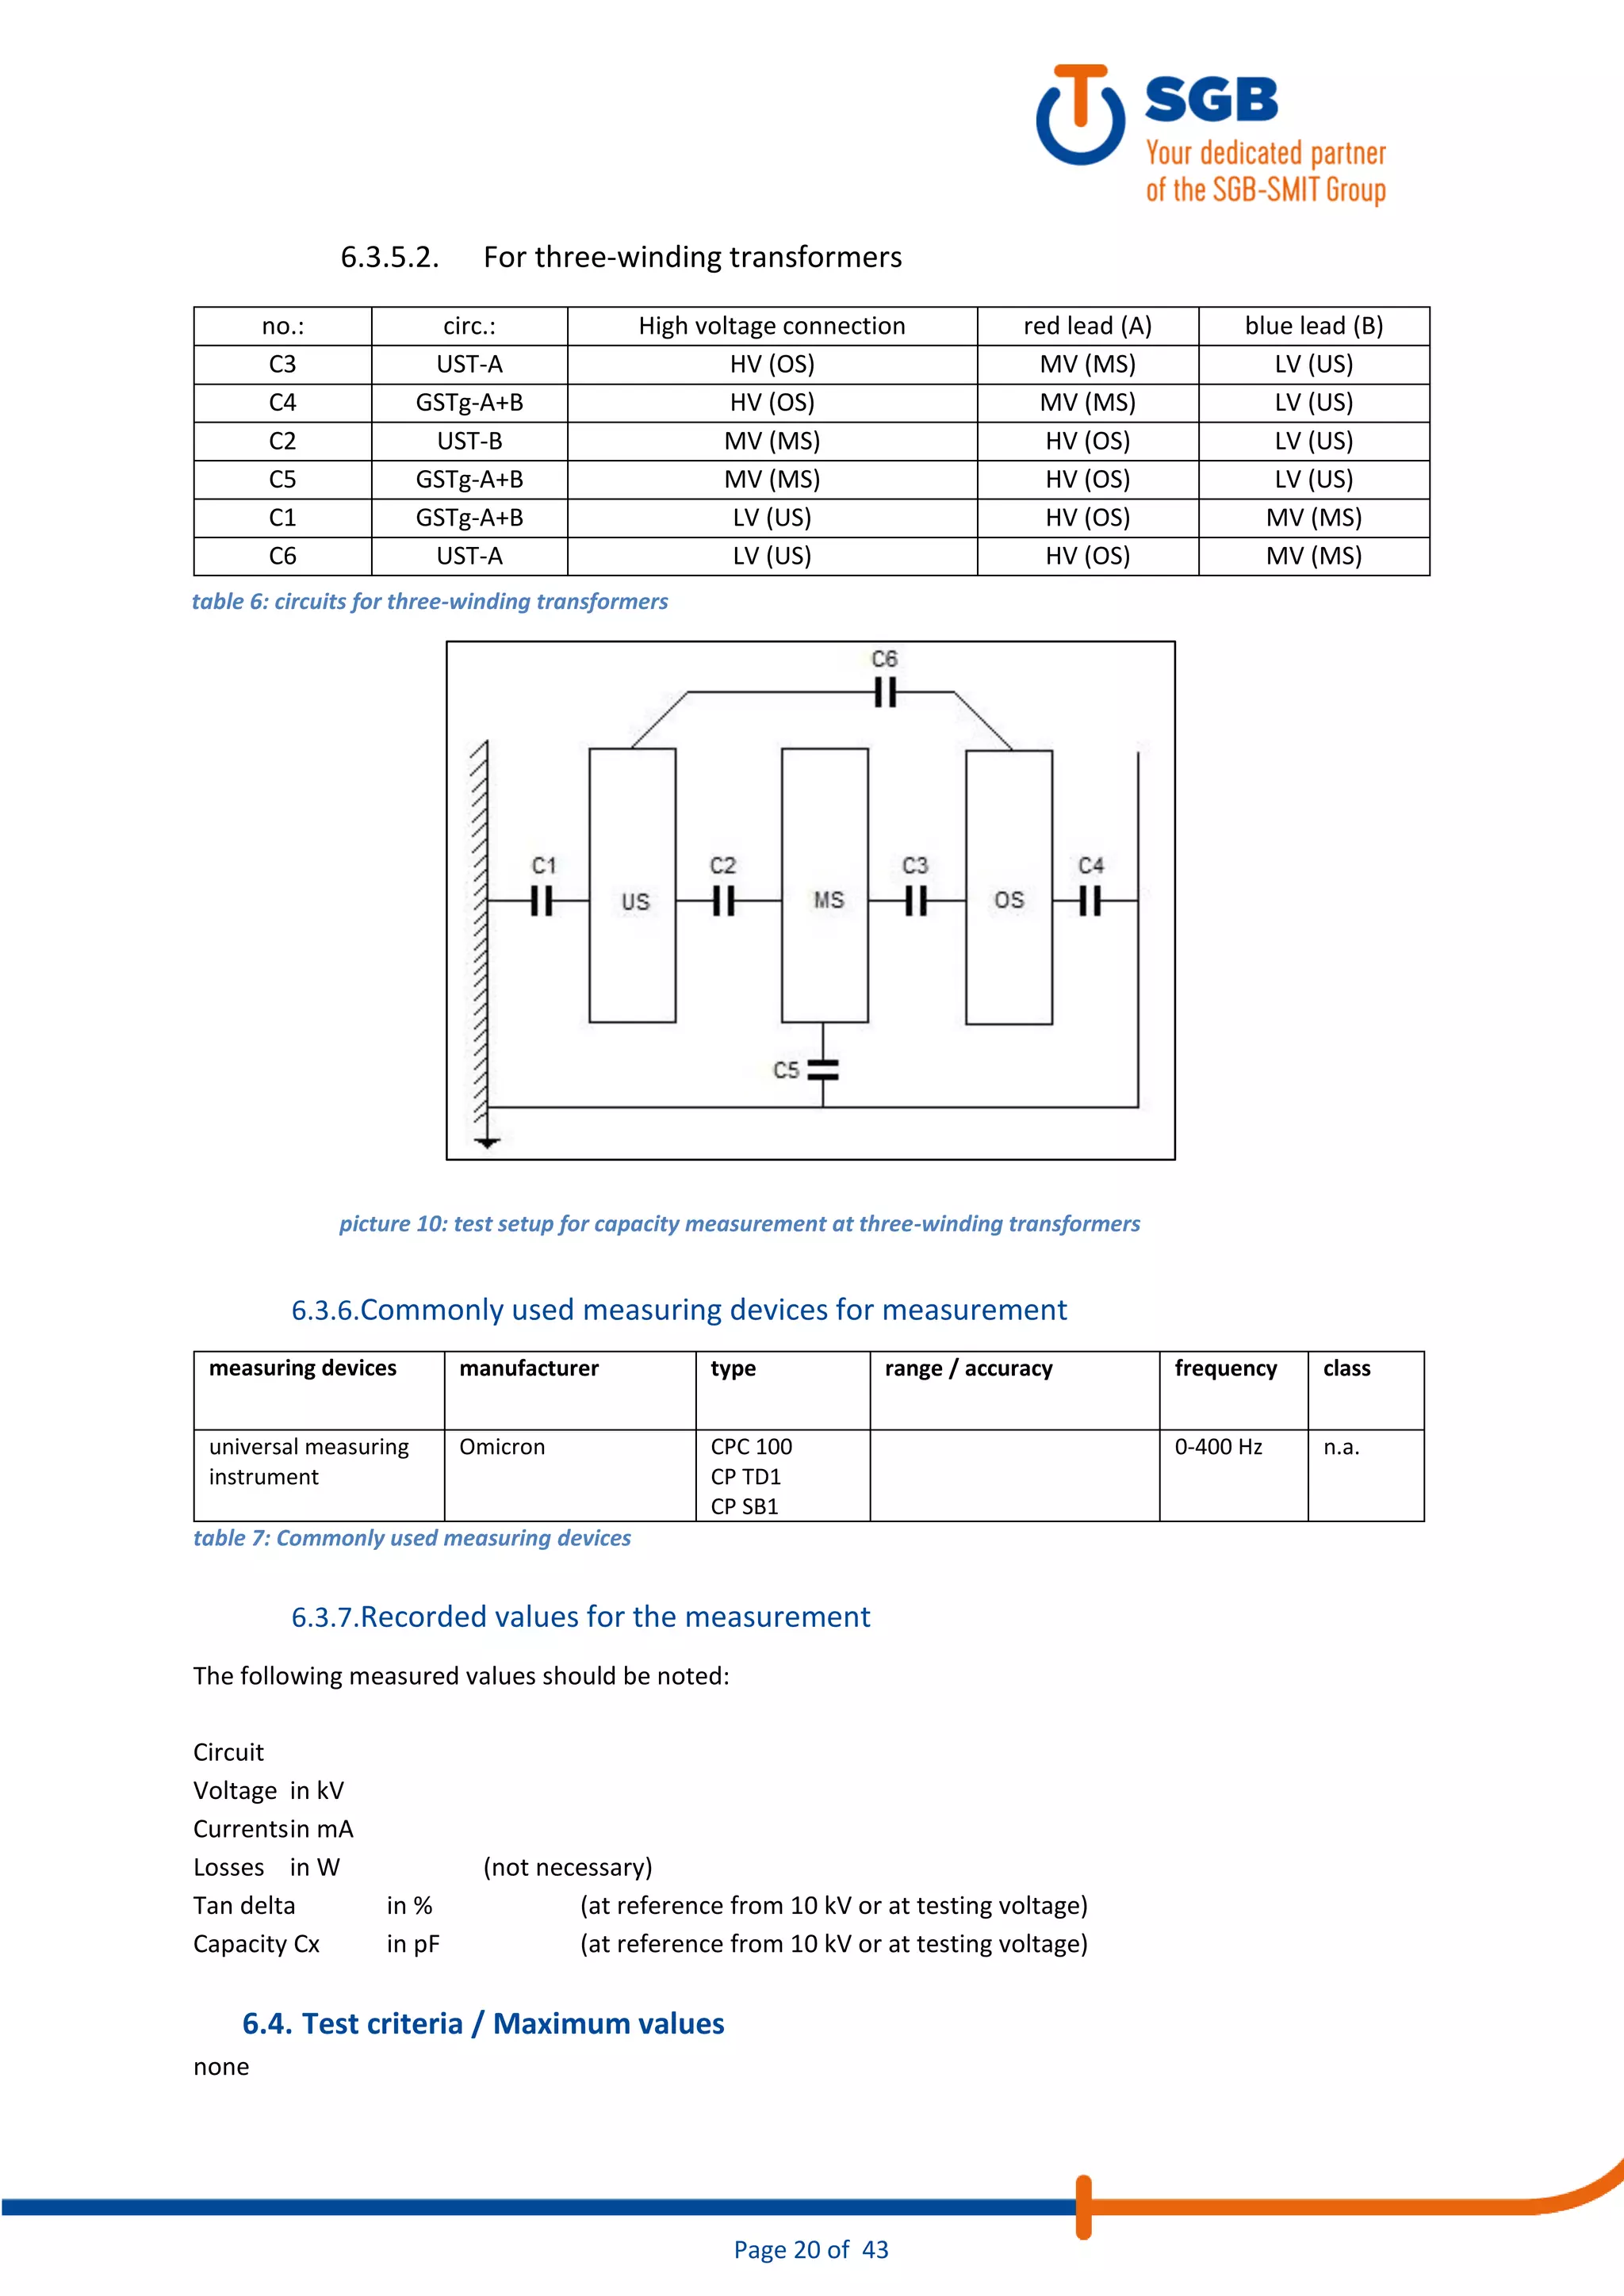
4.5. Calculations to determine sound level values
The first step is that the average A-weighted sound pressure level LP(A) will be calculated.
𝐿𝑃(𝐴)[𝑎𝑣𝑒𝑟𝑎𝑔𝑒 𝑢𝑛𝑐𝑜𝑟𝑟𝑒𝑐𝑡𝑒𝑑] = 10 log [
1
𝑁
∑ 100,1𝐿𝑃(𝐴) 𝑖
𝑁
𝑖=1
]
formula 3: calculation of the average A-weighted sound pressure level LP(A)
N = number of microphones
𝐿𝑃(𝐴) 𝑖 = A-weighted sound pressure level LP(A) of microphone no. i
If the measured distance or the guaranteed distance is not 1m, then the A-weighted sound pressure level shall
be LP(A) corrected according the formula from IEC 60076-10:2016.
𝐿𝑃(𝐴)𝑎𝑡 𝑟𝑎𝑡𝑒𝑑 𝑑𝑖𝑠𝑡𝑎𝑛𝑐𝑒 = 𝐿𝑃(𝐴)𝑎𝑡 𝑚𝑒𝑎𝑠𝑢𝑟𝑒𝑑 𝑑𝑖𝑠𝑡𝑎𝑛𝑐𝑒 − 10 log
𝑆𝑎𝑡 𝑟𝑎𝑡𝑒𝑑 𝑑𝑖𝑠𝑡𝑎𝑛𝑐𝑒
𝑆𝑎𝑡 𝑚𝑒𝑎𝑠𝑢𝑟𝑒𝑑 𝑑𝑖𝑠𝑡𝑎𝑛𝑐𝑒
formula 4: correction for distance
S = measurement surface
Finally, the calculation of the sound power level LW(A)
𝐿𝑊(𝐴) = 𝐿𝑃(𝐴) + 10 log
𝑆
𝑆0
formula 5: calculation of the sound power level LW(A)
S = measurement surface
S0 = is equal to the reference area (1 m²)
4.6. Test criteria / Maximum values
The guarantee sound level values must be held.](https://image.slidesharecdn.com/testdescriptionfordry-type-transformersforspecialtestsreve-221031170705-3e4c5e97/75/Test_description_for_dry-type-transformers_for_special_tests-13-2048.jpg)

![Page 16 of 43
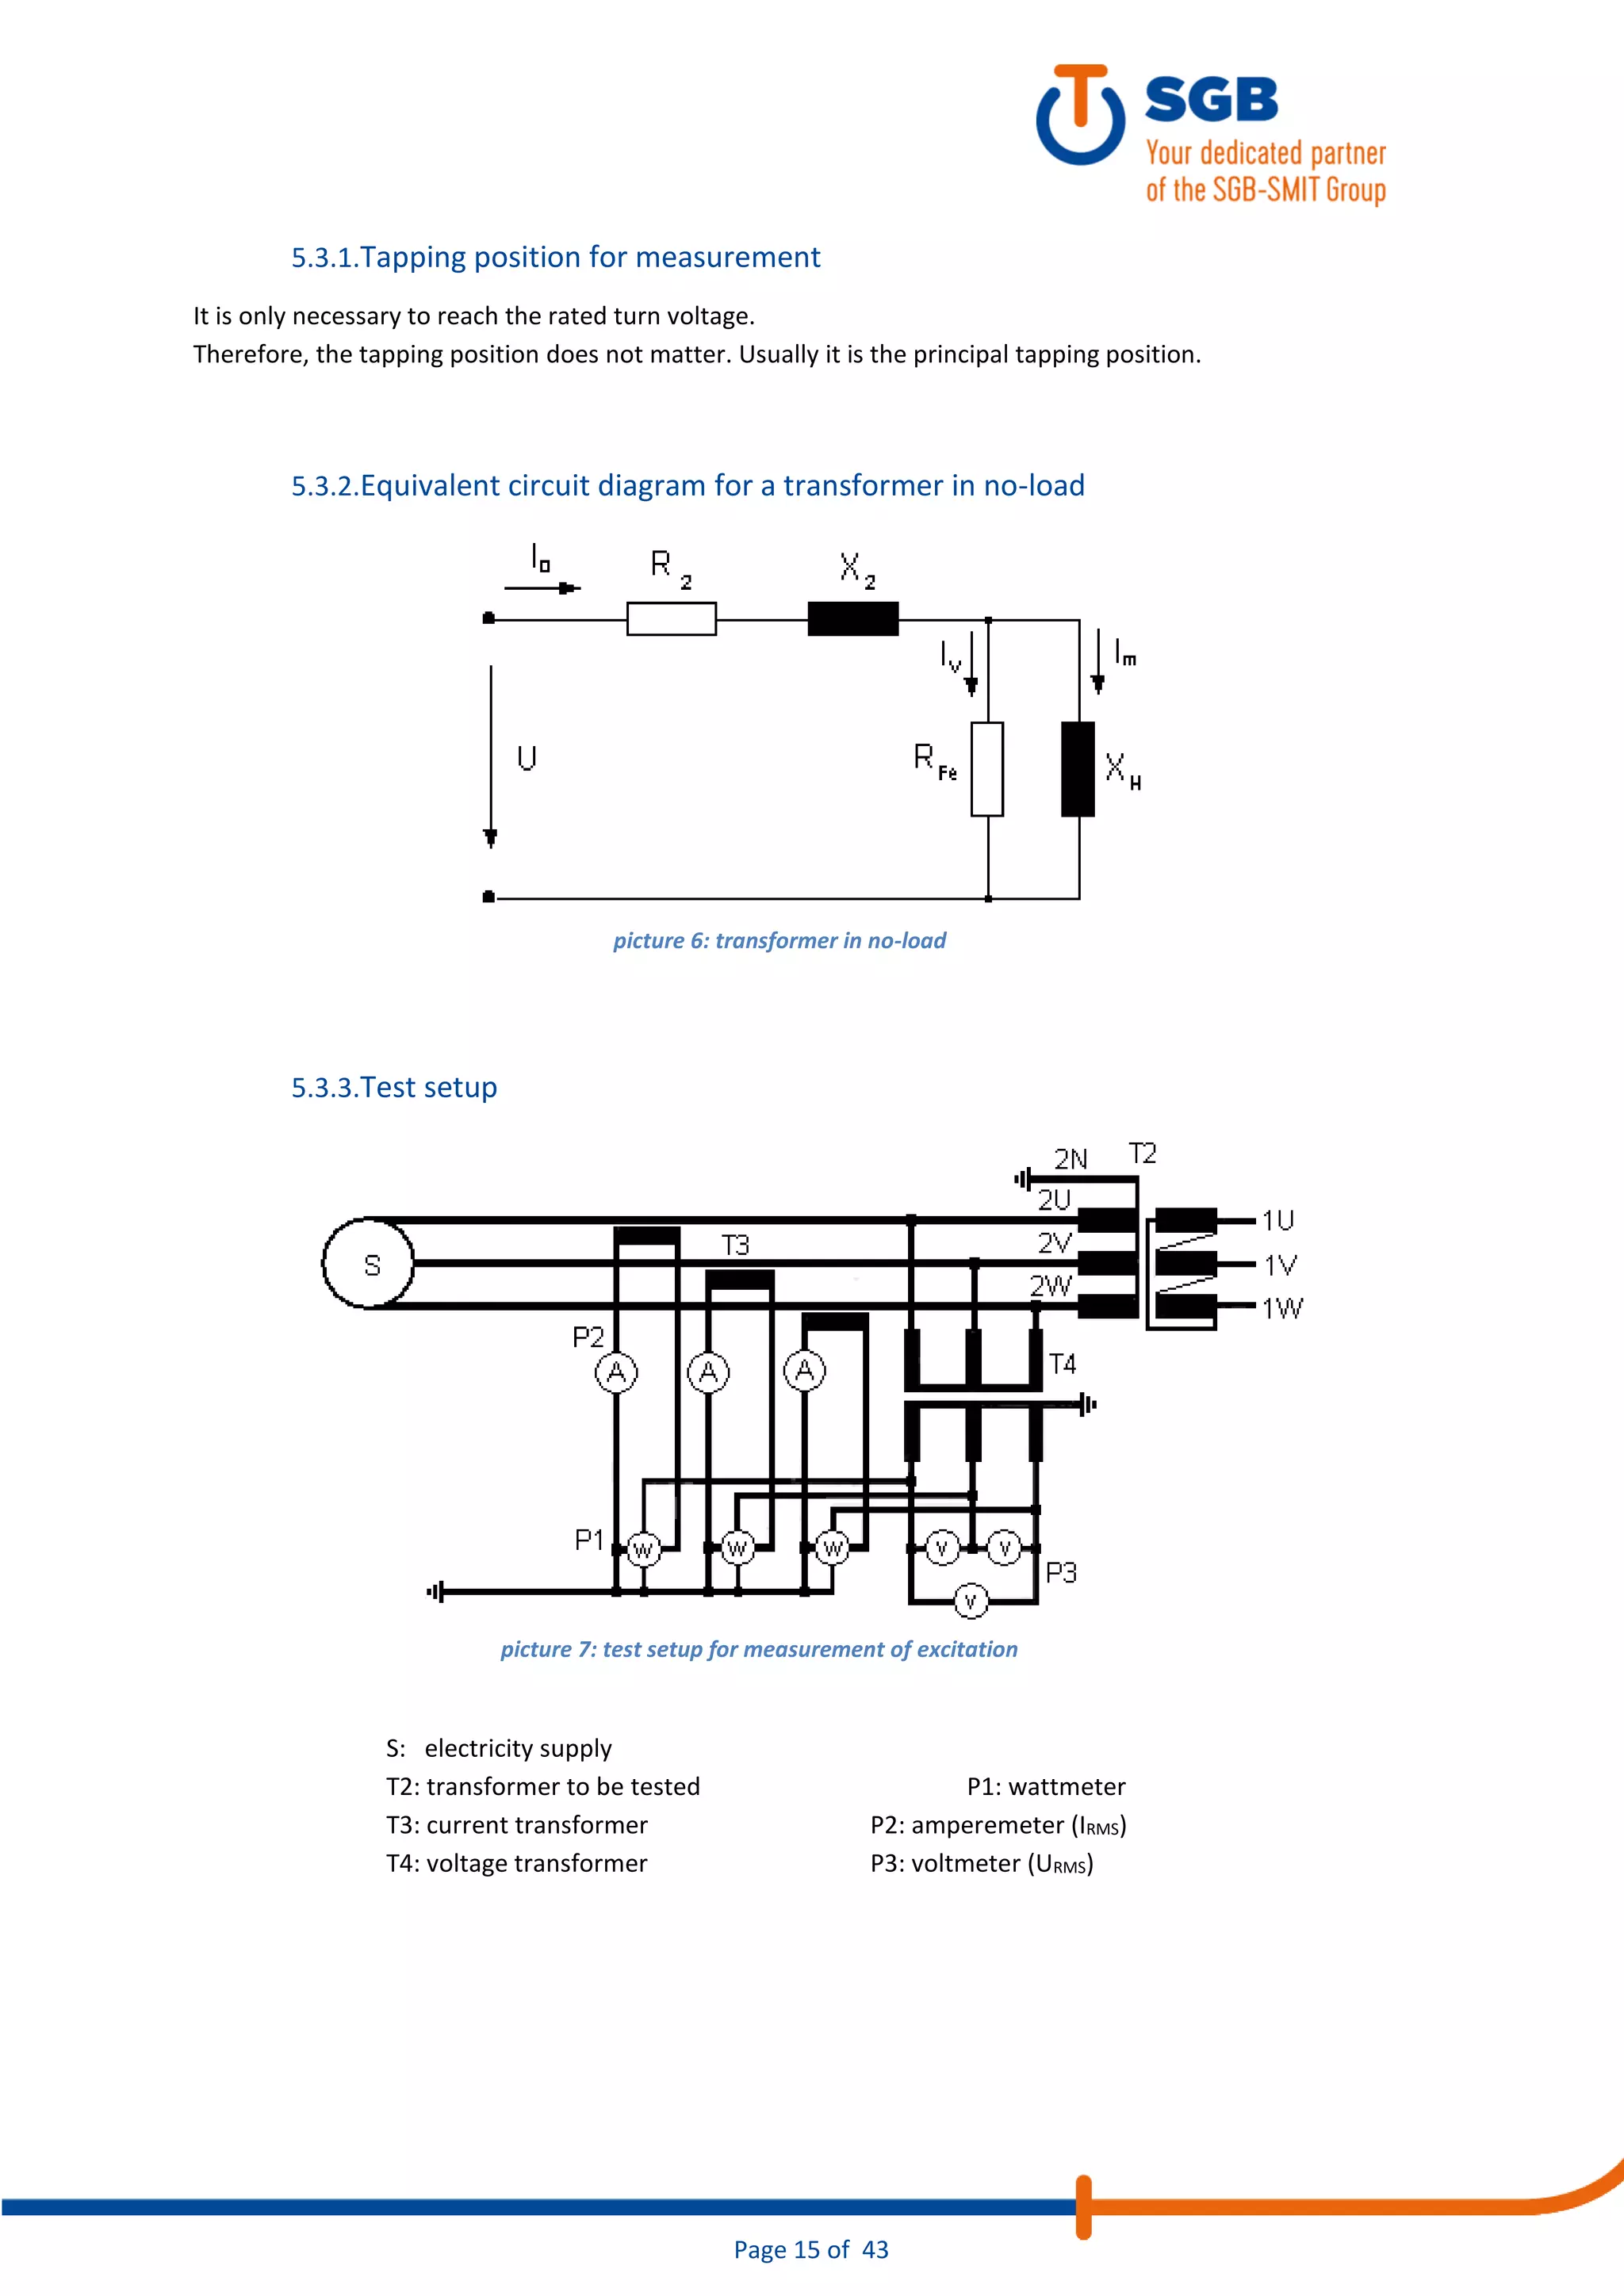
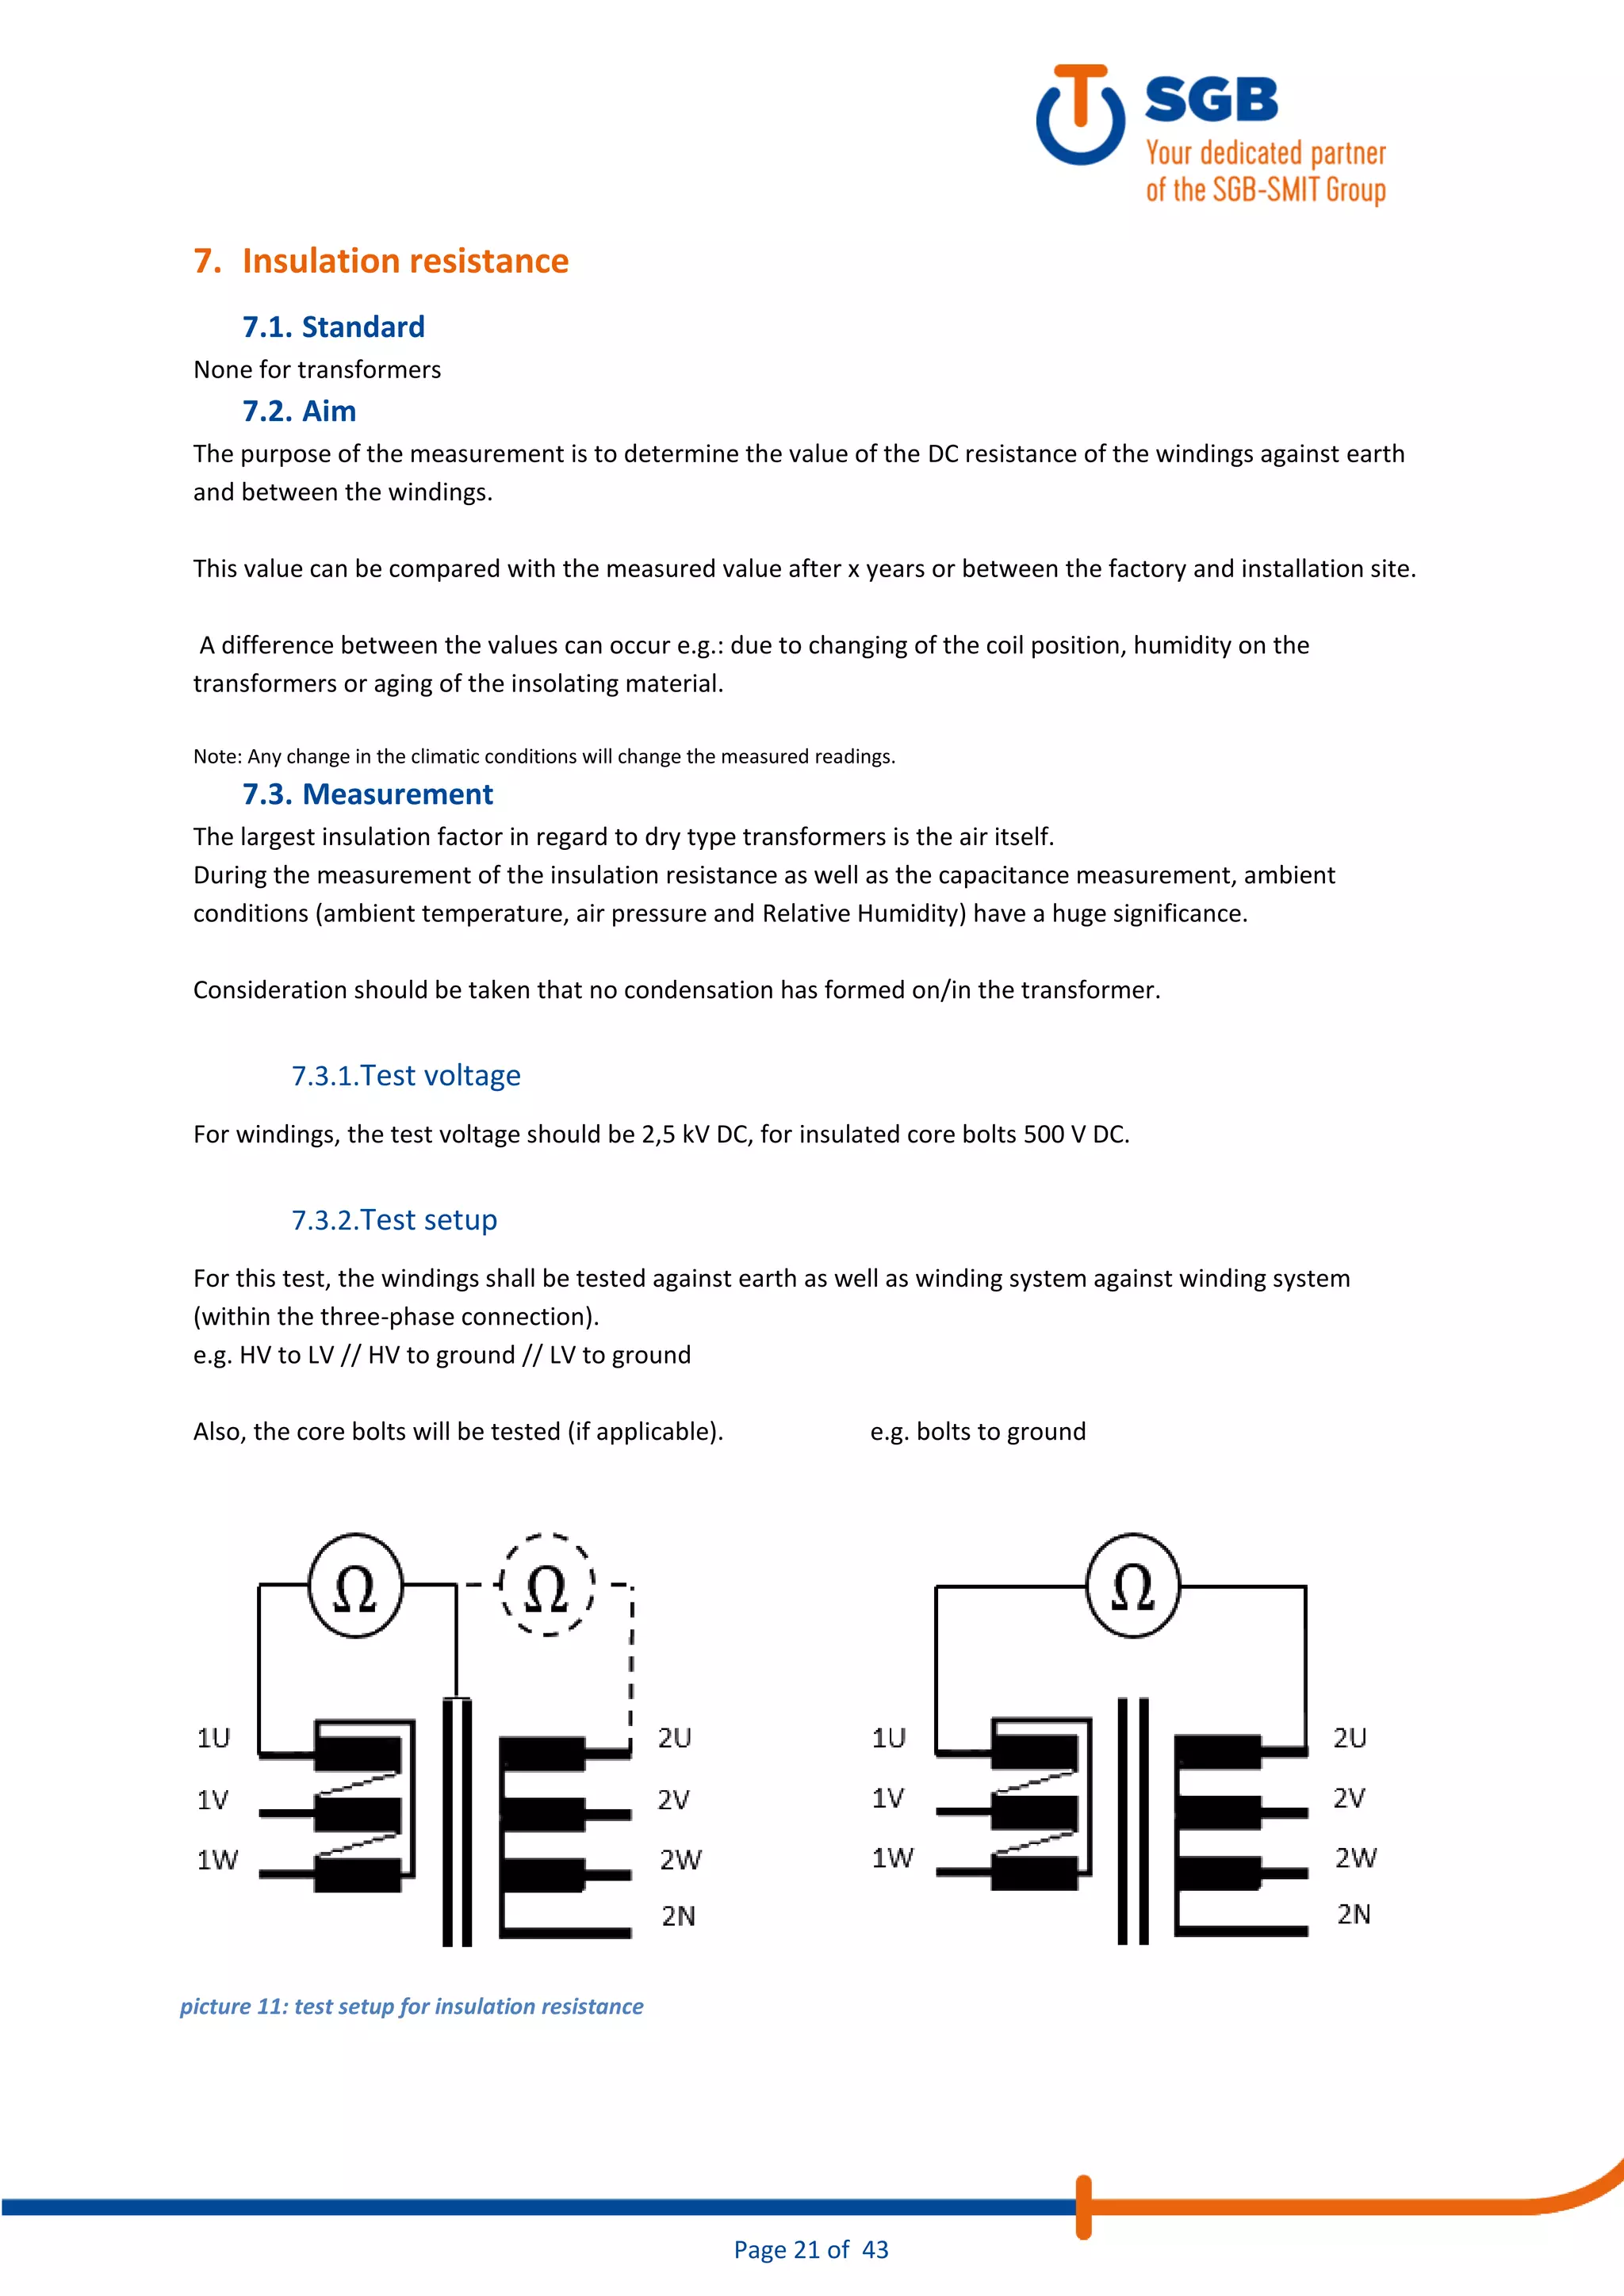
5.3.4.Commonly used measuring devices for measurement
measuring devices manufacturer type range / accuracy frequency class
Precision Power
Analyzer
ZIMMER LMG 500 U rms 1000 V / I rms 32 A
U pk 3200 V / I pk 120 A
DC - 10 MHz 0,01-0,03
LV-current-transf. H&B Ti 48 2,5-500 A/5 A 50/60 Hz 0,1
HV-voltage-transf. epro NVRD 40 2-40 kV/100 V 50/60 Hz 0,02
HV-current-transf. epro NCO 60 1-600 A/5 A 50/60 Hz 0,01
table 3: Commonly used measuring devices
5.3.5.Recorded values for the measurement
Voltage [V], amperage [A] and losses [W] for all phases (in R.M.S.) are recorded.
The Magnetic flux density [T] is indicated based on the individual test voltages.
5.4. Test criteria / Maximum values
none](https://image.slidesharecdn.com/testdescriptionfordry-type-transformersforspecialtestsreve-221031170705-3e4c5e97/75/Test_description_for_dry-type-transformers_for_special_tests-16-2048.jpg)

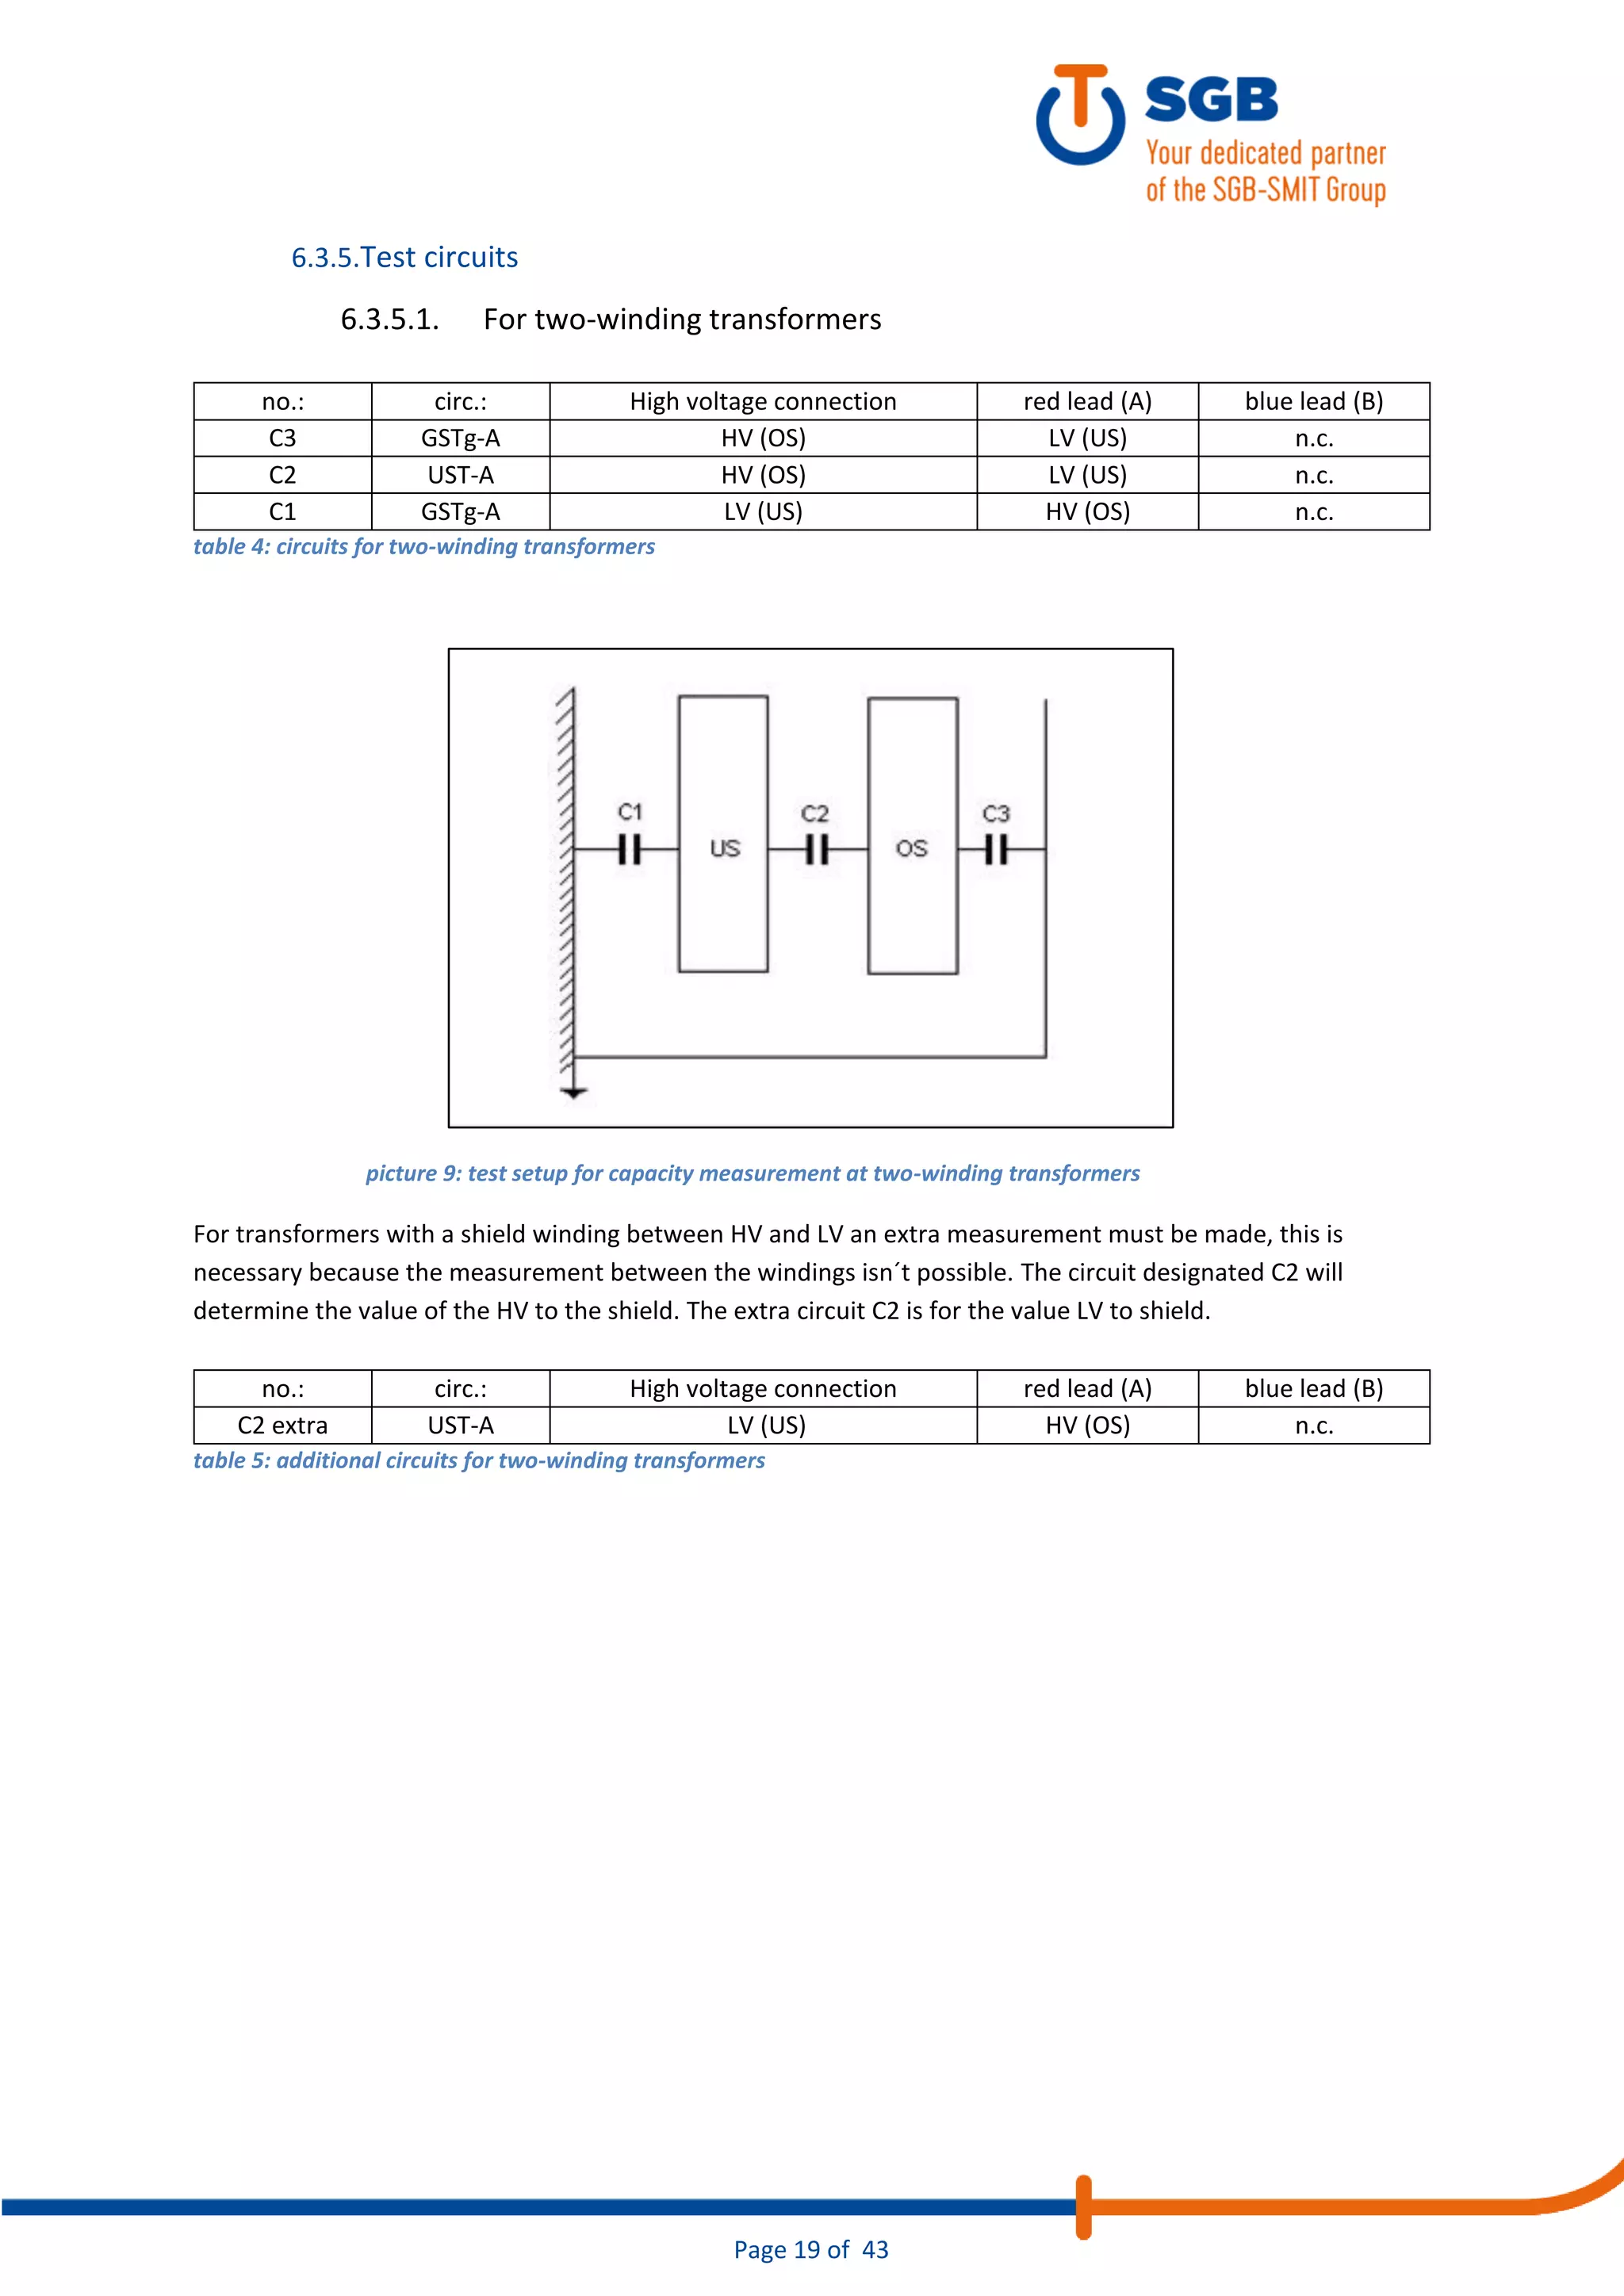
![Page 22 of 43
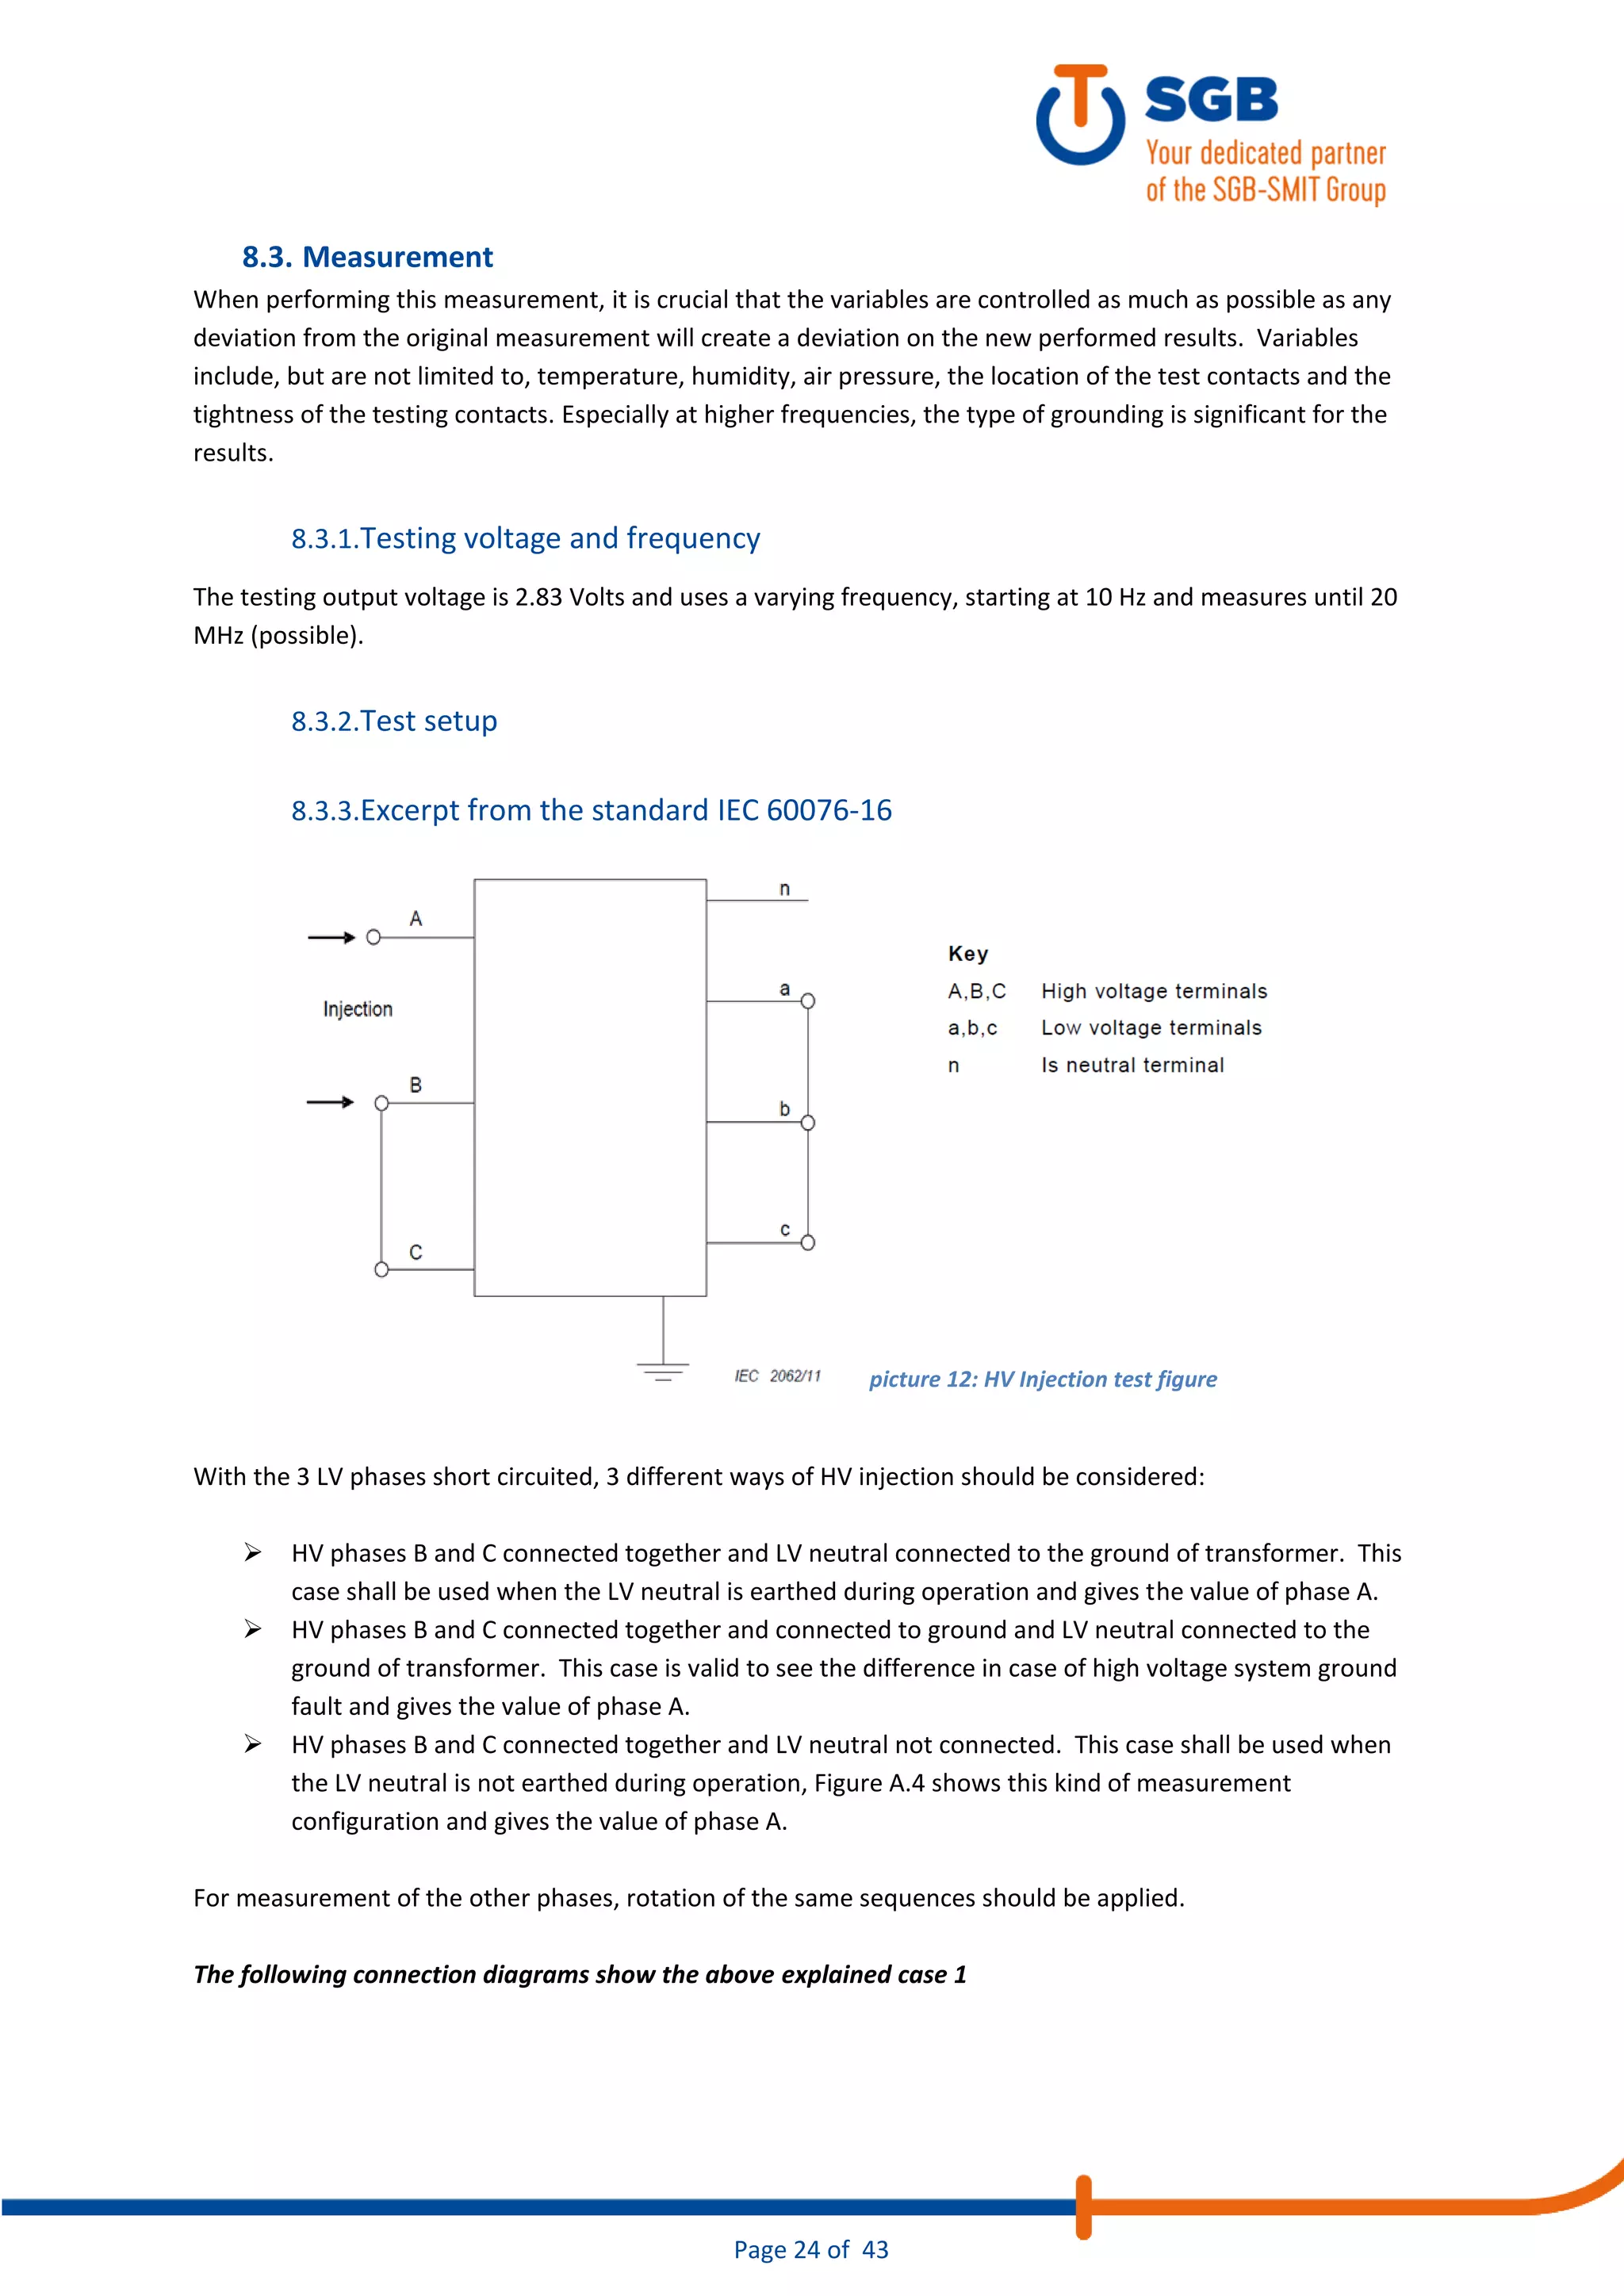
7.3.1.Commonly used measuring devices for measurement
measuring devices manufacturer type range / accuracy frequency class
Ins. resist. - meter GOSSEN Metriso 5000 0-4GΩ DC 1,5
table 8: Commonly used measuring devices
7.3.2.Recorded values for the measurement
The following measured values should be noted:
Connection
Voltage in kV DC
Resistance in MΩ or GΩ
7.4. Test criteria / Maximum values
In the standard for dry transformers this test is not required, listed or provided with minimum values.
The minimum insulation resistance can be determined by a rule of thumb. This was valid until 1985 (per volt a
1kOhm).
When tested at the factory, we expect as a minimum value (Un [V] / 1000 + 1) MΩ.
e.g. HV with 15 kV and LV with 690 V
HV = 15 kV corresponds 16 MΩ
LV = 690 V corresponds 1,69 MΩ
Bolts = 0 V corresponds 1 MΩ](https://image.slidesharecdn.com/testdescriptionfordry-type-transformersforspecialtestsreve-221031170705-3e4c5e97/75/Test_description_for_dry-type-transformers_for_special_tests-22-2048.jpg)


![Page 31 of 43
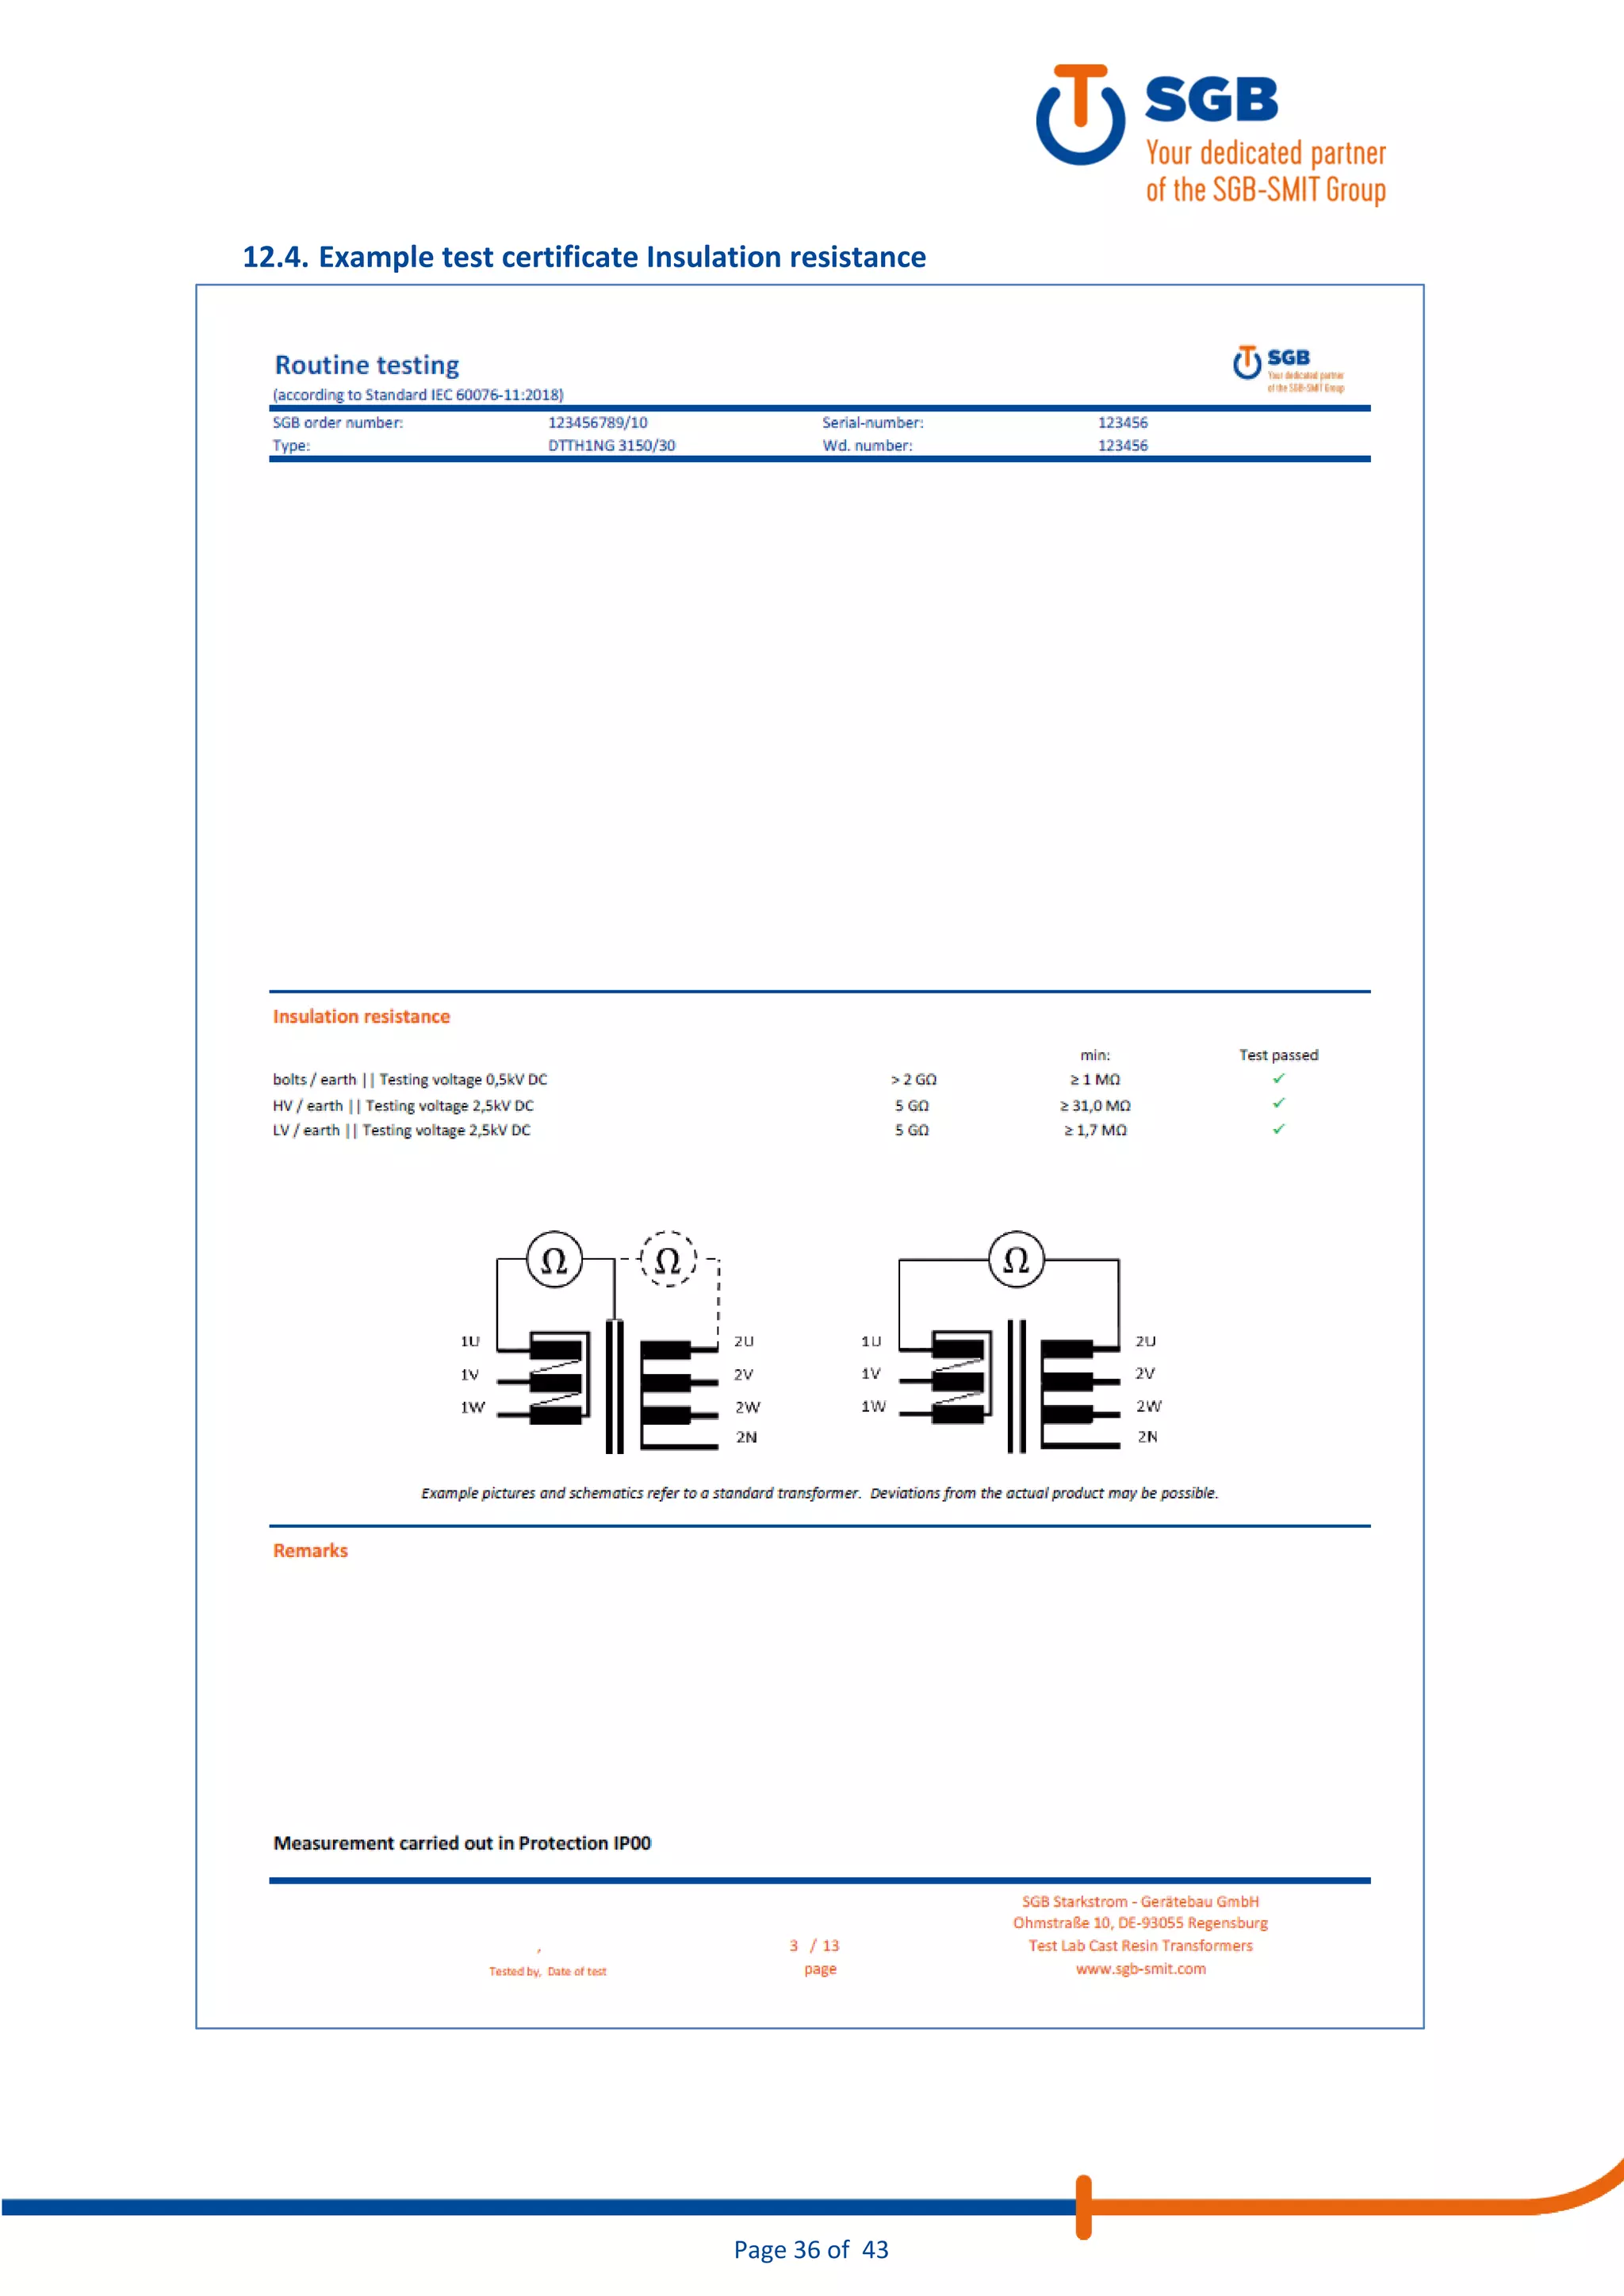
11.Measurement of partial discharge with earth
11.1. Standard
IEC 60076-11:2018 clause 14.4.1
11.2. Aim
Partial discharge measurement of single-phase line-to-earth fault condition.
This special test is for transformers connected to systems which are isolated or earthed
through a high value impedance and which can continue to be operated under a single phase
line-to-earth fault condition.
11.3. Measurement
For detailed information on the partical discarge measurement and the measurement environment, please see
(chapter for routine tests, clause 10).
11.3.1. Differences to the routine partical discarge measurement
A phase-to-phase voltage of 1,3 Ur shall be induced for 30 s, with one line terminal earthed, followed without
interruption by a phase-to-phase voltage of Ur for 3 min during which the partial discharge shall be measured.
This test shall be repeated with another line terminal earthed.
picture 19: measurement of partial discharge with earth
All other criteria refer to routine partical discarge measurement.
11.3.2. Commonly used measuring devices for measurement
measuring devices manufacturer type range / accuracy frequency class
PD-measurement
system
Omicron MCU502
4xMPD600
3xMPP600
500 fC - 3nC 0 - 32 MHz 0,01-0,03
Table 12: Commonly used measuring devices
11.3.3. Recorded values for the measurement
The background level and the maximum PD values within the 180 sec. for all phases in [pC], are then recorded
in the test protocol.
11.4. Test criteria / Maximum values
The partial discharge level is allowed a maximum of 10pC with correction factor.](https://image.slidesharecdn.com/testdescriptionfordry-type-transformersforspecialtestsreve-221031170705-3e4c5e97/75/Test_description_for_dry-type-transformers_for_special_tests-31-2048.jpg)


The document is a detailed test description for cast-resin and dry-type transformers, outlining various special tests not required by standards but performed upon customer request. It includes standards, measurement protocols, test setups, and criteria for tests such as sound level measurement, insulation resistance, and excitation determination. Appendices provide test certificates and examples for various measurements, illustrating the comprehensive testing framework for transformers.