SlideShare a Scribd company logo
1 of 14
Chapter 7 
Properties of Pure Substances 
If any two independent intensive properties of a simple compressible system are defined, 
other properties automatically assume definite values. These properties can be expressed in terms 
of charts, tables or equations. This chapter covers the charts and tables of properties of steam. 
7.1 Pure Substances 
Substances of fixed chemical composition are known as pure substances 
Example : Water, Helium, Nitrogen, Oxygen etc. 
Substances exist in any one of the three phases namely solid, liquid and gas. For example, 
H2O may exist in the form ice (solid), Water (Liquid) or Steam (Gaseous). In all these phases it 
will have the same chemical composition. 
A Mixture of two or more phases of a pure substance should also be regarded as pure 
substance. If Water and Steam Co-exits in a container, the chemical composition of both the 
Vapour and liquid phases will be identical. Hence this heterogeneous system is also a pure 
substance. 
7.2 Phase Transformation 
Consider a unit mass of ice heated steadily at a constant pressure of 1 atm. Let the initial 
temperature be -30oC. Due to heating, temperature increases upto 0oC (Figure 7.1). At 0oC ice 
starts melting. Until entire mass of ice becomes water, temperature is remaining constant. Heat 
added during this 
phase change is 
known as latent 
heat of fusion.
Further heating increases the temperature of water. This continues until 100oC. At 100oC 
Evaporation of water into steam is taking place. Temperature once again remains constant at 
100oC until complete conversion of water into steam occurs. Heat added during this phase change 
is known as latent heat of evaporation. Temperature of steam continues to increase afterwards. 
7.3 p -T Diagram of a Pure Substance 
Instead of 1atm. pressure, if water is heated at 5 bar, evaporation will be taking place at 15 
1.86oC. In the similar manner, each pressure has its own saturation temperature for a given 
substance. 
In a p-T diagram the locus of saturation temperatures against the corresponding pressures 
forms a curve known as vaporisation curve. It separates liquid and vapour phases is p-T diagram. 
Similarly solid & liquid phases are separated by fusion curve in p-T diagram. 
Below a limiting value of pressure known as Triple point, direct conversion of solid into 
vapour is taking place. This is known as sublimation. Sublimation curve separate solid and 
vapour phases in p-T diagram. Sublimation curve, vapourisation curve and fusion curve are 
represented on a p-T Coordinates in Figure7.2. Sublimation and vapourisation curves are having 
positives slopes for all substances. Fusion curve for most of the substances is having positive 
slope but for water it is negative. From p-T diagram it can be inferred that the given substance 
exists in liquid phase when the temperature is below the saturation temperature corresponding to 
the given pressure and in vapour phase if the given temperature is greater than the saturation 
temperature. When the given temperature is equal to the saturation temperature it may be liquid, 
vapor (or) a mixture of both.
7.4 T-v Diagram of a Pure Substance 
For simplicity let us consider only the liquid and vapour phases, which are commonly 
encountered in most of the engineering applications. Let a system of unit mass of water be heated 
at constant pressure. 1-2-3-4 in Figure 7.3 Shows the T-v Variations at constant pressure. 
From 1 to 2, heat addition increases the temperature with a very small increase in volume. 
State of water between 1 to 2 is known as subcooled liquid or compressed liquid because for a 
given pressure it is at a temperature lower than the saturation temperature (or) for a given 
temperature it is at a pressure higher than saturation pressure. The state of water at 2 is known 
saturated liquid. Temperature at this state is equal to the saturation temperature. Any further 
addition of heat causes evaporation of water. 
From 2-3 evaporation is taking place. During this phase change, temperature remains 
constant and increase in volume is high. At state 3, entire mass is in the form of vapour known 
dry saturated vapour. 
From 3 to 4, heating causes increase in both temperature and volume. State of steam in this 
region is called super heated state. 
As mentioned earlier, at higher pressure evaporation occurs at higher temperature and at 
lower pressure evaporation occurs at lower temperature. Latent heat of evaporation decreases 
with increase in pressure. For a particular pressure it becomes zero so that the change from liquid 
to vapour phase occurs suddenly without a distinct intermediate state. This pressure is known as 
critical pressure. This state on a property diagram is known as critical point. By connecting the 
saturated liquid state at different pressures a line called saturated liquid line is obtained. In the 
same way, by connecting the saturated vapour states, saturated vapour line is obtained. It can be 
observed that the saturated liquid and vapour line meet at critical point. Figure 7.4. Shows all 
these lines and various regions on a T-v diagram.
The region between saturated liquid line and saturated vapour line is known as wet region, 
consisting of both liquid and vapour. The percentage of composition or quality of this wet steam 
is expressed in terms of dryness fraction which is defined as the ratio of mass of vapour to the 
mass of the mixture. Specific volume of wet steam is expressed as 
v = xvg + (1 - x)vf 
= vf + x(vg - vf) 
= vf + xvfg ...(7.1) 
Where vf - specific volume of the saturate liquid @ the given Pressure or Temperature 
vg - specific volume of sat. vapour @ the given Pressure or Temperature 
x - dryness fraction. 
Since vf<<vg 
v = vf + xvg ...(7.2) 
In the compressed liquid region, specific volume may be regarded as a function of temperature 
alone since the liquid is incompressible. 
v @ vf @ the given temperature. 
In the superheated region, v is function of both temperature and pressure. 
7.5 T-s Diagram for a Pure Substance 
Similar to T-v diagram, T-s diagram can also be drawn for a pure substance. Figure 7.5 
shows various regions on a T-s diagram. The salient features of this diagram are : 
 Temperature is taken on Y-axis and entropy is taken on X-axis
 There are three distinct regions : to the left of the saturated liquid line is the liquid 
region, between saturated liquid and saturated vapour line is wet region, and to the right 
of saturated vapour line is superheated region 
 Constant pressure lines coincide with the constant temperature lines in the wet region. 
These lines becomes curved in the superheated region 
 Slope of the saturated liquid line is less compared to that in T-v diagram. 
Entropy of a fluid at saturated liquid state s = sf @ the given p or T 
For saturated vapour state 
s = sg @ the given p, T 
For Wet state 
s = sf + x sfg ...(7.3) 
where sf and sfg are functions of p or T. 
For superheated state 
s = s(p, t) 
For subcooled liquid 
s = sf - cpl ln ...(7.4) 
Where sf  ®  sat. liquid entropy @ the given pressure
cpl ® Liquid specific heat at the given temperature 
Ts ® Sat. temp. corresponding to the given pressure 
T ® Given Temperature. 
7.6 h-s Diagram for a Pure Substance 
Within the wet region both isobars and isotherms are the same, but beyond saturated 
vapour line they deviate. Also it can be noted that the constant pressure lines diverge from each 
other towards the super heated vapour region. In the super heated vapour region, slope of 
isotherms become almost zero. The slope of constant pressure curves at any point is a measure of 
temperature, by noting that . 
7.7 p-v. Diagram Of A Pure Substance
Figure 7.7 shows the pv diagram of a pure substance. The saturated liquid and saturated-vapour 
curves meet at the critical point. The region to the left of the saturated-liquid line is 
compressed liquid, and the region to the right of the saturated-vapour line is superheated vapour. 
In between the two lines is the two-phase liquid-vapour region. Several isotherms are shown in 
the figure. The critical isotherm has an inflection point and a zero slope at the critical point. 
Isotherms below the critical point experience two discontinuities in slope as they cross the 
saturated-liquid and saturated-vapour lines. In between these two lines, the slope of the isotherms 
is zero, and a state in this region can be entirely saturated liquid, entirely saturated vapour, or a 
combination of the two. 
7.8 Extending p-v Diagram for a Pure Substance to Solid Phase
Figure 7.8a. shows various regions of a pure substances on a p-v coordinates. Volume 
continuously increases from solid to super heated vapour region. But for water volume decreases 
on melting and afterwards increases as shown Figure 7.8b. 
7.9 p-V-T Surface 
p-V-T behaviour of a pure substance can be expressed in a single three dimensional p-v-t 
surface as shown in the Figure 7.9(a). For water as its volume decreases on melting unlike other 
substances its p-v-t surface will be different from that of others as given in Figure 7.9(b).
7.10 Measurements of 
Dryness Fraction of Wet Steam 
Dryness fraction of wet steam, representing the fraction of steam in the mixture of water 
and steam can be measured by using (i) Throttling calorimeter and (ii) Separating and Throttling 
calorimeter. Principle and working of these two devices are presented in this section. 
(i) Throttling calorimeter 
Let us consider a wet steam as represented by state 1 in the h-s diagram as given in Figure 
7.10. When it undergoes a throttling process to state 2, it enters into the superheated region. By 
measuring the temperature and pressure after throttling the specific enthalpy can be obtained. As 
mentioned earlier during throttling enthalpy remains constant. Therefore the initial state can be 
completely fixed since the pressure before throttling and the corresponding specific enthalpy are 
known. That is, 
h1 = hf1 + x1 hfg1 = h2 
...(7.5) 
where h2 = f (t2, p2) 
hf1 = hf@p1 
hfg1 = hfg@p1 .
Schematic arrangement of a throttling calorimeter is given in Figure 7.11. Steam from the 
main is extracted through a perforated tube projecting into it as shown in the Figure. Pressure of 
the steam is measured. It is then throttled into a chamber where the necessary pressure and 
temperature measurements are made. From the chamber the expanded steam is then condensed by 
circulating cooling water and discharged.
(ii) Separating and Throttling calorimeter 
When the dryness fraction of the steam is very low, it becomes superheated vapour only at 
very low end pressure on throttling. In general, the pressure after throttling for dryness fraction 
measurement is preferred to be above atmospheric. In such applications, separating and throttling 
calorimeters are used for dryness fraction measurement. 
Wet steam, when subjected to sudden change in the direction of flow, a portion of the 
liquid falls due to gravity and gets separated from the main stream. Thus the remaining steam 
becomes rich in vapour, which upon throttling will become superheated vapour even at a pressure 
higher than atmospheric pressure. This principle is employed in the separating and throttling 
calorimeter. 
The schematic arrangement of a separating and throttling calorimeter is shown in Figure 
7.13. The wet steam from the steam main is extracted through a perforated tube and sent to the 
separator where a portion of the liquid is separated due to sudden change in the direction as 
explained above. The remaining steam is throttled into a chamber where the required pressure and 
temperature measurements are made. Mass flow rate of liquid separated in the separator is 
collected and measured. Mass of the remaining steam is also measured by condensing the 
throttled steam and collecting it. Let be the mass of liquid separated in the separator and be the 
mass of steam throttled. The state of steam before entering the separator is denoted as state1 and 
states before and after throttling are respectively represented as state 2 and state 3.
As throttling is a constant enthalpy process 
h2 = h3 
...(7.6) 
where h3 = f(T3, p3) ; Since pressure and temperature after throttling are known, 
from the superheated steam table, h3 can be obtained. 
These two values can be obtained from the saturated table 
Therefore x2 can be computed from equation (7.6 ).
It has already been mentioned that only liquid is being separated from the wet steam when 
it is passed through the separator. Then the mass of dry vapour leaving the separator must be 
equal to the mass of dry vapour entering the separator. 
That is 
(m1 + m2) x1 = m2 x2 
Upon rearranging the equation 
...(7.7) 
7.11 Steam Tables 
As defined earlier to define the thermodynamic state of a given substance, any two 
independent intensive properties are sufficient. Once the state is fixed, all other properties can be 
computed. Tables giving the property values of saturated liquid and saturated vapour with respect 
temperature and pressure are available along with the properties of superheated steam. These 
tables can be made use of in the calculation of properties at any state. [See Appendix A1 & A2] 
For refrigeration application, fluids like Ammonia and R134a are used. Properties of these 
fluids are also available in the form of tables.

More Related Content

What's hot

What's hot (20)

Thermodynamic systems and properties
Thermodynamic systems and propertiesThermodynamic systems and properties
Thermodynamic systems and properties
 
Phase Diagram
Phase DiagramPhase Diagram
Phase Diagram
 
STEAM NOZZLES
STEAM NOZZLESSTEAM NOZZLES
STEAM NOZZLES
 
STEAM JET COOLING SYSTEM
STEAM JET COOLING SYSTEMSTEAM JET COOLING SYSTEM
STEAM JET COOLING SYSTEM
 
Vapour Absorption Refrigeration System
Vapour Absorption Refrigeration SystemVapour Absorption Refrigeration System
Vapour Absorption Refrigeration System
 
vapour compression refrigeration system
vapour compression refrigeration systemvapour compression refrigeration system
vapour compression refrigeration system
 
Steam Formation
Steam FormationSteam Formation
Steam Formation
 
Availability and irreversibility
Availability and irreversibilityAvailability and irreversibility
Availability and irreversibility
 
Heat exchangers
Heat exchangersHeat exchangers
Heat exchangers
 
PROPERTIES OF PURE SUBSTANCES
PROPERTIES OF PURE SUBSTANCESPROPERTIES OF PURE SUBSTANCES
PROPERTIES OF PURE SUBSTANCES
 
Compressor and Types
Compressor and TypesCompressor and Types
Compressor and Types
 
Critical thickness of insulation
Critical thickness of insulationCritical thickness of insulation
Critical thickness of insulation
 
Transient heat-conduction-Part-I
Transient heat-conduction-Part-ITransient heat-conduction-Part-I
Transient heat-conduction-Part-I
 
Heat exchanger and its type,ntu method
Heat exchanger and its type,ntu methodHeat exchanger and its type,ntu method
Heat exchanger and its type,ntu method
 
Vapor Absorption Refrigeration System
Vapor Absorption Refrigeration System Vapor Absorption Refrigeration System
Vapor Absorption Refrigeration System
 
Reciprocating Compressor
Reciprocating CompressorReciprocating Compressor
Reciprocating Compressor
 
Air refrigeration system by Bell Coleman cycle and Vortex tube
Air refrigeration system by Bell Coleman cycle and Vortex tubeAir refrigeration system by Bell Coleman cycle and Vortex tube
Air refrigeration system by Bell Coleman cycle and Vortex tube
 
Extended surface fins
Extended surface finsExtended surface fins
Extended surface fins
 
Gas mixtures
Gas mixturesGas mixtures
Gas mixtures
 
Friction factor
Friction factorFriction factor
Friction factor
 

Similar to Chapter 7 pure substance

UNIT-2_Part1_NOTES-PKNAG-SPATI.pdf
UNIT-2_Part1_NOTES-PKNAG-SPATI.pdfUNIT-2_Part1_NOTES-PKNAG-SPATI.pdf
UNIT-2_Part1_NOTES-PKNAG-SPATI.pdfYOGESH AHIRE
 
chapter two ppt.pptx
chapter two ppt.pptxchapter two ppt.pptx
chapter two ppt.pptxmihretu7
 
Properties of Pure Substances and Property Diagram.pdf
Properties of Pure Substances and Property Diagram.pdfProperties of Pure Substances and Property Diagram.pdf
Properties of Pure Substances and Property Diagram.pdfAishikChowdhury
 
chapter03_7sdsdsdfsaerssssssssa.pptfgggggggggse
chapter03_7sdsdsdfsaerssssssssa.pptfgggggggggsechapter03_7sdsdsdfsaerssssssssa.pptfgggggggggse
chapter03_7sdsdsdfsaerssssssssa.pptfgggggggggsektmbych2016
 
Properties of pure substances
Properties of pure substancesProperties of pure substances
Properties of pure substancesHarishDAV
 
Chapter03.pure substance
Chapter03.pure substanceChapter03.pure substance
Chapter03.pure substancePASRINIVASAN_79
 
Properties of pure substances
Properties of pure substancesProperties of pure substances
Properties of pure substancesfaslmulat
 
Propiedades termodinámicas de las sustancias puras
Propiedades termodinámicas de las sustancias purasPropiedades termodinámicas de las sustancias puras
Propiedades termodinámicas de las sustancias purasNorman Rivera
 
Rayegan thermo i-cengel-chapter 3-p1
Rayegan thermo i-cengel-chapter 3-p1Rayegan thermo i-cengel-chapter 3-p1
Rayegan thermo i-cengel-chapter 3-p1Larry Howard
 
1649011617114008.hhgggggggggfffffffffffffff
1649011617114008.hhgggggggggfffffffffffffff1649011617114008.hhgggggggggfffffffffffffff
1649011617114008.hhgggggggggfffffffffffffffAbdlaDoski
 
THERMODYNAMICS-I PROPERTIES OF PURE SUBSTACES
THERMODYNAMICS-I PROPERTIES OF PURE SUBSTACES THERMODYNAMICS-I PROPERTIES OF PURE SUBSTACES
THERMODYNAMICS-I PROPERTIES OF PURE SUBSTACES MUHAMMADOKASHA3
 
J2006 termodinamik 1 unit8
J2006 termodinamik 1 unit8J2006 termodinamik 1 unit8
J2006 termodinamik 1 unit8Malaysia
 
Vapour Liquid Equilibirium using digramatic representation
Vapour Liquid Equilibirium using digramatic representationVapour Liquid Equilibirium using digramatic representation
Vapour Liquid Equilibirium using digramatic representationShubham Budhawant
 
Bab 3 Thermodynamic of Engineering Approach
Bab 3 Thermodynamic of Engineering ApproachBab 3 Thermodynamic of Engineering Approach
Bab 3 Thermodynamic of Engineering ApproachIbnu Hasan
 
JJ207 Thermodynamics I Chapter 2
JJ207 Thermodynamics I Chapter 2JJ207 Thermodynamics I Chapter 2
JJ207 Thermodynamics I Chapter 2nhaikalhassan
 
Gibbs phase rule and lever rule
Gibbs phase rule and lever ruleGibbs phase rule and lever rule
Gibbs phase rule and lever rulevaibhav tailor
 

Similar to Chapter 7 pure substance (20)

UNIT-2_Part1_NOTES-PKNAG-SPATI.pdf
UNIT-2_Part1_NOTES-PKNAG-SPATI.pdfUNIT-2_Part1_NOTES-PKNAG-SPATI.pdf
UNIT-2_Part1_NOTES-PKNAG-SPATI.pdf
 
chapter two ppt.pptx
chapter two ppt.pptxchapter two ppt.pptx
chapter two ppt.pptx
 
Chapter 03 thermo
Chapter 03 thermoChapter 03 thermo
Chapter 03 thermo
 
Properties of Pure Substances and Property Diagram.pdf
Properties of Pure Substances and Property Diagram.pdfProperties of Pure Substances and Property Diagram.pdf
Properties of Pure Substances and Property Diagram.pdf
 
chapter03_7sdsdsdfsaerssssssssa.pptfgggggggggse
chapter03_7sdsdsdfsaerssssssssa.pptfgggggggggsechapter03_7sdsdsdfsaerssssssssa.pptfgggggggggse
chapter03_7sdsdsdfsaerssssssssa.pptfgggggggggse
 
Properties of pure substances
Properties of pure substancesProperties of pure substances
Properties of pure substances
 
Chapter03.pure substance
Chapter03.pure substanceChapter03.pure substance
Chapter03.pure substance
 
Chap3a jan13
Chap3a jan13Chap3a jan13
Chap3a jan13
 
Properties of pure substances
Properties of pure substancesProperties of pure substances
Properties of pure substances
 
Propiedades termodinámicas de las sustancias puras
Propiedades termodinámicas de las sustancias purasPropiedades termodinámicas de las sustancias puras
Propiedades termodinámicas de las sustancias puras
 
Rayegan thermo i-cengel-chapter 3-p1
Rayegan thermo i-cengel-chapter 3-p1Rayegan thermo i-cengel-chapter 3-p1
Rayegan thermo i-cengel-chapter 3-p1
 
1649011617114008.hhgggggggggfffffffffffffff
1649011617114008.hhgggggggggfffffffffffffff1649011617114008.hhgggggggggfffffffffffffff
1649011617114008.hhgggggggggfffffffffffffff
 
THERMODYNAMICS-I PROPERTIES OF PURE SUBSTACES
THERMODYNAMICS-I PROPERTIES OF PURE SUBSTACES THERMODYNAMICS-I PROPERTIES OF PURE SUBSTACES
THERMODYNAMICS-I PROPERTIES OF PURE SUBSTACES
 
J2006 termodinamik 1 unit8
J2006 termodinamik 1 unit8J2006 termodinamik 1 unit8
J2006 termodinamik 1 unit8
 
Vapour Liquid Equilibirium using digramatic representation
Vapour Liquid Equilibirium using digramatic representationVapour Liquid Equilibirium using digramatic representation
Vapour Liquid Equilibirium using digramatic representation
 
Bab 3 Thermodynamic of Engineering Approach
Bab 3 Thermodynamic of Engineering ApproachBab 3 Thermodynamic of Engineering Approach
Bab 3 Thermodynamic of Engineering Approach
 
JJ207 Thermodynamics I Chapter 2
JJ207 Thermodynamics I Chapter 2JJ207 Thermodynamics I Chapter 2
JJ207 Thermodynamics I Chapter 2
 
Gibbs phase rule and lever rule
Gibbs phase rule and lever ruleGibbs phase rule and lever rule
Gibbs phase rule and lever rule
 
Pure substances
Pure substancesPure substances
Pure substances
 
Phase Equilibrium
Phase EquilibriumPhase Equilibrium
Phase Equilibrium
 

More from Aaba Tambe

Chapter 6 availability
Chapter 6 availabilityChapter 6 availability
Chapter 6 availabilityAaba Tambe
 
Chapter 5 thermodynamics 1
Chapter 5 thermodynamics 1Chapter 5 thermodynamics 1
Chapter 5 thermodynamics 1Aaba Tambe
 
Chapter 4 second law
Chapter 4  second lawChapter 4  second law
Chapter 4 second lawAaba Tambe
 
Chapter 3 thermodynamics final
Chapter 3 thermodynamics finalChapter 3 thermodynamics final
Chapter 3 thermodynamics finalAaba Tambe
 
Chapter 2 thermodynamics 1
Chapter 2 thermodynamics 1Chapter 2 thermodynamics 1
Chapter 2 thermodynamics 1Aaba Tambe
 
Chapter 1thermodynamics
Chapter 1thermodynamicsChapter 1thermodynamics
Chapter 1thermodynamicsAaba Tambe
 

More from Aaba Tambe (6)

Chapter 6 availability
Chapter 6 availabilityChapter 6 availability
Chapter 6 availability
 
Chapter 5 thermodynamics 1
Chapter 5 thermodynamics 1Chapter 5 thermodynamics 1
Chapter 5 thermodynamics 1
 
Chapter 4 second law
Chapter 4  second lawChapter 4  second law
Chapter 4 second law
 
Chapter 3 thermodynamics final
Chapter 3 thermodynamics finalChapter 3 thermodynamics final
Chapter 3 thermodynamics final
 
Chapter 2 thermodynamics 1
Chapter 2 thermodynamics 1Chapter 2 thermodynamics 1
Chapter 2 thermodynamics 1
 
Chapter 1thermodynamics
Chapter 1thermodynamicsChapter 1thermodynamics
Chapter 1thermodynamics
 

Recently uploaded

OSVC_Meta-Data based Simulation Automation to overcome Verification Challenge...
OSVC_Meta-Data based Simulation Automation to overcome Verification Challenge...OSVC_Meta-Data based Simulation Automation to overcome Verification Challenge...
OSVC_Meta-Data based Simulation Automation to overcome Verification Challenge...Soham Mondal
 
microprocessor 8085 and its interfacing
microprocessor 8085  and its interfacingmicroprocessor 8085  and its interfacing
microprocessor 8085 and its interfacingjaychoudhary37
 
Software and Systems Engineering Standards: Verification and Validation of Sy...
Software and Systems Engineering Standards: Verification and Validation of Sy...Software and Systems Engineering Standards: Verification and Validation of Sy...
Software and Systems Engineering Standards: Verification and Validation of Sy...VICTOR MAESTRE RAMIREZ
 
Current Transformer Drawing and GTP for MSETCL
Current Transformer Drawing and GTP for MSETCLCurrent Transformer Drawing and GTP for MSETCL
Current Transformer Drawing and GTP for MSETCLDeelipZope
 
Biology for Computer Engineers Course Handout.pptx
Biology for Computer Engineers Course Handout.pptxBiology for Computer Engineers Course Handout.pptx
Biology for Computer Engineers Course Handout.pptxDeepakSakkari2
 
Oxy acetylene welding presentation note.
Oxy acetylene welding presentation note.Oxy acetylene welding presentation note.
Oxy acetylene welding presentation note.eptoze12
 
Gfe Mayur Vihar Call Girls Service WhatsApp -> 9999965857 Available 24x7 ^ De...
Gfe Mayur Vihar Call Girls Service WhatsApp -> 9999965857 Available 24x7 ^ De...Gfe Mayur Vihar Call Girls Service WhatsApp -> 9999965857 Available 24x7 ^ De...
Gfe Mayur Vihar Call Girls Service WhatsApp -> 9999965857 Available 24x7 ^ De...srsj9000
 
What are the advantages and disadvantages of membrane structures.pptx
What are the advantages and disadvantages of membrane structures.pptxWhat are the advantages and disadvantages of membrane structures.pptx
What are the advantages and disadvantages of membrane structures.pptxwendy cai
 
Past, Present and Future of Generative AI
Past, Present and Future of Generative AIPast, Present and Future of Generative AI
Past, Present and Future of Generative AIabhishek36461
 
Sachpazis Costas: Geotechnical Engineering: A student's Perspective Introduction
Sachpazis Costas: Geotechnical Engineering: A student's Perspective IntroductionSachpazis Costas: Geotechnical Engineering: A student's Perspective Introduction
Sachpazis Costas: Geotechnical Engineering: A student's Perspective IntroductionDr.Costas Sachpazis
 
HARMONY IN THE NATURE AND EXISTENCE - Unit-IV
HARMONY IN THE NATURE AND EXISTENCE - Unit-IVHARMONY IN THE NATURE AND EXISTENCE - Unit-IV
HARMONY IN THE NATURE AND EXISTENCE - Unit-IVRajaP95
 
SPICE PARK APR2024 ( 6,793 SPICE Models )
SPICE PARK APR2024 ( 6,793 SPICE Models )SPICE PARK APR2024 ( 6,793 SPICE Models )
SPICE PARK APR2024 ( 6,793 SPICE Models )Tsuyoshi Horigome
 
VIP Call Girls Service Hitech City Hyderabad Call +91-8250192130
VIP Call Girls Service Hitech City Hyderabad Call +91-8250192130VIP Call Girls Service Hitech City Hyderabad Call +91-8250192130
VIP Call Girls Service Hitech City Hyderabad Call +91-8250192130Suhani Kapoor
 
Gurgaon ✡️9711147426✨Call In girls Gurgaon Sector 51 escort service
Gurgaon ✡️9711147426✨Call In girls Gurgaon Sector 51 escort serviceGurgaon ✡️9711147426✨Call In girls Gurgaon Sector 51 escort service
Gurgaon ✡️9711147426✨Call In girls Gurgaon Sector 51 escort servicejennyeacort
 
Study on Air-Water & Water-Water Heat Exchange in a Finned Tube Exchanger
Study on Air-Water & Water-Water Heat Exchange in a Finned Tube ExchangerStudy on Air-Water & Water-Water Heat Exchange in a Finned Tube Exchanger
Study on Air-Water & Water-Water Heat Exchange in a Finned Tube ExchangerAnamika Sarkar
 
Internship report on mechanical engineering
Internship report on mechanical engineeringInternship report on mechanical engineering
Internship report on mechanical engineeringmalavadedarshan25
 
(ANVI) Koregaon Park Call Girls Just Call 7001035870 [ Cash on Delivery ] Pun...
(ANVI) Koregaon Park Call Girls Just Call 7001035870 [ Cash on Delivery ] Pun...(ANVI) Koregaon Park Call Girls Just Call 7001035870 [ Cash on Delivery ] Pun...
(ANVI) Koregaon Park Call Girls Just Call 7001035870 [ Cash on Delivery ] Pun...ranjana rawat
 
High Profile Call Girls Nagpur Isha Call 7001035870 Meet With Nagpur Escorts
High Profile Call Girls Nagpur Isha Call 7001035870 Meet With Nagpur EscortsHigh Profile Call Girls Nagpur Isha Call 7001035870 Meet With Nagpur Escorts
High Profile Call Girls Nagpur Isha Call 7001035870 Meet With Nagpur Escortsranjana rawat
 
ZXCTN 5804 / ZTE PTN / ZTE POTN / ZTE 5804 PTN / ZTE POTN 5804 ( 100/200 GE Z...
ZXCTN 5804 / ZTE PTN / ZTE POTN / ZTE 5804 PTN / ZTE POTN 5804 ( 100/200 GE Z...ZXCTN 5804 / ZTE PTN / ZTE POTN / ZTE 5804 PTN / ZTE POTN 5804 ( 100/200 GE Z...
ZXCTN 5804 / ZTE PTN / ZTE POTN / ZTE 5804 PTN / ZTE POTN 5804 ( 100/200 GE Z...ZTE
 

Recently uploaded (20)

OSVC_Meta-Data based Simulation Automation to overcome Verification Challenge...
OSVC_Meta-Data based Simulation Automation to overcome Verification Challenge...OSVC_Meta-Data based Simulation Automation to overcome Verification Challenge...
OSVC_Meta-Data based Simulation Automation to overcome Verification Challenge...
 
microprocessor 8085 and its interfacing
microprocessor 8085  and its interfacingmicroprocessor 8085  and its interfacing
microprocessor 8085 and its interfacing
 
Software and Systems Engineering Standards: Verification and Validation of Sy...
Software and Systems Engineering Standards: Verification and Validation of Sy...Software and Systems Engineering Standards: Verification and Validation of Sy...
Software and Systems Engineering Standards: Verification and Validation of Sy...
 
Current Transformer Drawing and GTP for MSETCL
Current Transformer Drawing and GTP for MSETCLCurrent Transformer Drawing and GTP for MSETCL
Current Transformer Drawing and GTP for MSETCL
 
Biology for Computer Engineers Course Handout.pptx
Biology for Computer Engineers Course Handout.pptxBiology for Computer Engineers Course Handout.pptx
Biology for Computer Engineers Course Handout.pptx
 
Oxy acetylene welding presentation note.
Oxy acetylene welding presentation note.Oxy acetylene welding presentation note.
Oxy acetylene welding presentation note.
 
Gfe Mayur Vihar Call Girls Service WhatsApp -> 9999965857 Available 24x7 ^ De...
Gfe Mayur Vihar Call Girls Service WhatsApp -> 9999965857 Available 24x7 ^ De...Gfe Mayur Vihar Call Girls Service WhatsApp -> 9999965857 Available 24x7 ^ De...
Gfe Mayur Vihar Call Girls Service WhatsApp -> 9999965857 Available 24x7 ^ De...
 
What are the advantages and disadvantages of membrane structures.pptx
What are the advantages and disadvantages of membrane structures.pptxWhat are the advantages and disadvantages of membrane structures.pptx
What are the advantages and disadvantages of membrane structures.pptx
 
Past, Present and Future of Generative AI
Past, Present and Future of Generative AIPast, Present and Future of Generative AI
Past, Present and Future of Generative AI
 
Sachpazis Costas: Geotechnical Engineering: A student's Perspective Introduction
Sachpazis Costas: Geotechnical Engineering: A student's Perspective IntroductionSachpazis Costas: Geotechnical Engineering: A student's Perspective Introduction
Sachpazis Costas: Geotechnical Engineering: A student's Perspective Introduction
 
HARMONY IN THE NATURE AND EXISTENCE - Unit-IV
HARMONY IN THE NATURE AND EXISTENCE - Unit-IVHARMONY IN THE NATURE AND EXISTENCE - Unit-IV
HARMONY IN THE NATURE AND EXISTENCE - Unit-IV
 
SPICE PARK APR2024 ( 6,793 SPICE Models )
SPICE PARK APR2024 ( 6,793 SPICE Models )SPICE PARK APR2024 ( 6,793 SPICE Models )
SPICE PARK APR2024 ( 6,793 SPICE Models )
 
VIP Call Girls Service Hitech City Hyderabad Call +91-8250192130
VIP Call Girls Service Hitech City Hyderabad Call +91-8250192130VIP Call Girls Service Hitech City Hyderabad Call +91-8250192130
VIP Call Girls Service Hitech City Hyderabad Call +91-8250192130
 
Gurgaon ✡️9711147426✨Call In girls Gurgaon Sector 51 escort service
Gurgaon ✡️9711147426✨Call In girls Gurgaon Sector 51 escort serviceGurgaon ✡️9711147426✨Call In girls Gurgaon Sector 51 escort service
Gurgaon ✡️9711147426✨Call In girls Gurgaon Sector 51 escort service
 
Study on Air-Water & Water-Water Heat Exchange in a Finned Tube Exchanger
Study on Air-Water & Water-Water Heat Exchange in a Finned Tube ExchangerStudy on Air-Water & Water-Water Heat Exchange in a Finned Tube Exchanger
Study on Air-Water & Water-Water Heat Exchange in a Finned Tube Exchanger
 
🔝9953056974🔝!!-YOUNG call girls in Rajendra Nagar Escort rvice Shot 2000 nigh...
🔝9953056974🔝!!-YOUNG call girls in Rajendra Nagar Escort rvice Shot 2000 nigh...🔝9953056974🔝!!-YOUNG call girls in Rajendra Nagar Escort rvice Shot 2000 nigh...
🔝9953056974🔝!!-YOUNG call girls in Rajendra Nagar Escort rvice Shot 2000 nigh...
 
Internship report on mechanical engineering
Internship report on mechanical engineeringInternship report on mechanical engineering
Internship report on mechanical engineering
 
(ANVI) Koregaon Park Call Girls Just Call 7001035870 [ Cash on Delivery ] Pun...
(ANVI) Koregaon Park Call Girls Just Call 7001035870 [ Cash on Delivery ] Pun...(ANVI) Koregaon Park Call Girls Just Call 7001035870 [ Cash on Delivery ] Pun...
(ANVI) Koregaon Park Call Girls Just Call 7001035870 [ Cash on Delivery ] Pun...
 
High Profile Call Girls Nagpur Isha Call 7001035870 Meet With Nagpur Escorts
High Profile Call Girls Nagpur Isha Call 7001035870 Meet With Nagpur EscortsHigh Profile Call Girls Nagpur Isha Call 7001035870 Meet With Nagpur Escorts
High Profile Call Girls Nagpur Isha Call 7001035870 Meet With Nagpur Escorts
 
ZXCTN 5804 / ZTE PTN / ZTE POTN / ZTE 5804 PTN / ZTE POTN 5804 ( 100/200 GE Z...
ZXCTN 5804 / ZTE PTN / ZTE POTN / ZTE 5804 PTN / ZTE POTN 5804 ( 100/200 GE Z...ZXCTN 5804 / ZTE PTN / ZTE POTN / ZTE 5804 PTN / ZTE POTN 5804 ( 100/200 GE Z...
ZXCTN 5804 / ZTE PTN / ZTE POTN / ZTE 5804 PTN / ZTE POTN 5804 ( 100/200 GE Z...
 

Chapter 7 pure substance

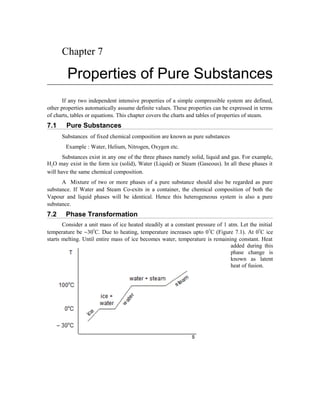
  • 1. Chapter 7 Properties of Pure Substances If any two independent intensive properties of a simple compressible system are defined, other properties automatically assume definite values. These properties can be expressed in terms of charts, tables or equations. This chapter covers the charts and tables of properties of steam. 7.1 Pure Substances Substances of fixed chemical composition are known as pure substances Example : Water, Helium, Nitrogen, Oxygen etc. Substances exist in any one of the three phases namely solid, liquid and gas. For example, H2O may exist in the form ice (solid), Water (Liquid) or Steam (Gaseous). In all these phases it will have the same chemical composition. A Mixture of two or more phases of a pure substance should also be regarded as pure substance. If Water and Steam Co-exits in a container, the chemical composition of both the Vapour and liquid phases will be identical. Hence this heterogeneous system is also a pure substance. 7.2 Phase Transformation Consider a unit mass of ice heated steadily at a constant pressure of 1 atm. Let the initial temperature be -30oC. Due to heating, temperature increases upto 0oC (Figure 7.1). At 0oC ice starts melting. Until entire mass of ice becomes water, temperature is remaining constant. Heat added during this phase change is known as latent heat of fusion.
  • 2. Further heating increases the temperature of water. This continues until 100oC. At 100oC Evaporation of water into steam is taking place. Temperature once again remains constant at 100oC until complete conversion of water into steam occurs. Heat added during this phase change is known as latent heat of evaporation. Temperature of steam continues to increase afterwards. 7.3 p -T Diagram of a Pure Substance Instead of 1atm. pressure, if water is heated at 5 bar, evaporation will be taking place at 15 1.86oC. In the similar manner, each pressure has its own saturation temperature for a given substance. In a p-T diagram the locus of saturation temperatures against the corresponding pressures forms a curve known as vaporisation curve. It separates liquid and vapour phases is p-T diagram. Similarly solid & liquid phases are separated by fusion curve in p-T diagram. Below a limiting value of pressure known as Triple point, direct conversion of solid into vapour is taking place. This is known as sublimation. Sublimation curve separate solid and vapour phases in p-T diagram. Sublimation curve, vapourisation curve and fusion curve are represented on a p-T Coordinates in Figure7.2. Sublimation and vapourisation curves are having positives slopes for all substances. Fusion curve for most of the substances is having positive slope but for water it is negative. From p-T diagram it can be inferred that the given substance exists in liquid phase when the temperature is below the saturation temperature corresponding to the given pressure and in vapour phase if the given temperature is greater than the saturation temperature. When the given temperature is equal to the saturation temperature it may be liquid, vapor (or) a mixture of both.
  • 3. 7.4 T-v Diagram of a Pure Substance For simplicity let us consider only the liquid and vapour phases, which are commonly encountered in most of the engineering applications. Let a system of unit mass of water be heated at constant pressure. 1-2-3-4 in Figure 7.3 Shows the T-v Variations at constant pressure. From 1 to 2, heat addition increases the temperature with a very small increase in volume. State of water between 1 to 2 is known as subcooled liquid or compressed liquid because for a given pressure it is at a temperature lower than the saturation temperature (or) for a given temperature it is at a pressure higher than saturation pressure. The state of water at 2 is known saturated liquid. Temperature at this state is equal to the saturation temperature. Any further addition of heat causes evaporation of water. From 2-3 evaporation is taking place. During this phase change, temperature remains constant and increase in volume is high. At state 3, entire mass is in the form of vapour known dry saturated vapour. From 3 to 4, heating causes increase in both temperature and volume. State of steam in this region is called super heated state. As mentioned earlier, at higher pressure evaporation occurs at higher temperature and at lower pressure evaporation occurs at lower temperature. Latent heat of evaporation decreases with increase in pressure. For a particular pressure it becomes zero so that the change from liquid to vapour phase occurs suddenly without a distinct intermediate state. This pressure is known as critical pressure. This state on a property diagram is known as critical point. By connecting the saturated liquid state at different pressures a line called saturated liquid line is obtained. In the same way, by connecting the saturated vapour states, saturated vapour line is obtained. It can be observed that the saturated liquid and vapour line meet at critical point. Figure 7.4. Shows all these lines and various regions on a T-v diagram.
  • 4. The region between saturated liquid line and saturated vapour line is known as wet region, consisting of both liquid and vapour. The percentage of composition or quality of this wet steam is expressed in terms of dryness fraction which is defined as the ratio of mass of vapour to the mass of the mixture. Specific volume of wet steam is expressed as v = xvg + (1 - x)vf = vf + x(vg - vf) = vf + xvfg ...(7.1) Where vf - specific volume of the saturate liquid @ the given Pressure or Temperature vg - specific volume of sat. vapour @ the given Pressure or Temperature x - dryness fraction. Since vf<<vg v = vf + xvg ...(7.2) In the compressed liquid region, specific volume may be regarded as a function of temperature alone since the liquid is incompressible. v @ vf @ the given temperature. In the superheated region, v is function of both temperature and pressure. 7.5 T-s Diagram for a Pure Substance Similar to T-v diagram, T-s diagram can also be drawn for a pure substance. Figure 7.5 shows various regions on a T-s diagram. The salient features of this diagram are :  Temperature is taken on Y-axis and entropy is taken on X-axis
  • 5.  There are three distinct regions : to the left of the saturated liquid line is the liquid region, between saturated liquid and saturated vapour line is wet region, and to the right of saturated vapour line is superheated region  Constant pressure lines coincide with the constant temperature lines in the wet region. These lines becomes curved in the superheated region  Slope of the saturated liquid line is less compared to that in T-v diagram. Entropy of a fluid at saturated liquid state s = sf @ the given p or T For saturated vapour state s = sg @ the given p, T For Wet state s = sf + x sfg ...(7.3) where sf and sfg are functions of p or T. For superheated state s = s(p, t) For subcooled liquid s = sf - cpl ln ...(7.4) Where sf ® sat. liquid entropy @ the given pressure
  • 6. cpl ® Liquid specific heat at the given temperature Ts ® Sat. temp. corresponding to the given pressure T ® Given Temperature. 7.6 h-s Diagram for a Pure Substance Within the wet region both isobars and isotherms are the same, but beyond saturated vapour line they deviate. Also it can be noted that the constant pressure lines diverge from each other towards the super heated vapour region. In the super heated vapour region, slope of isotherms become almost zero. The slope of constant pressure curves at any point is a measure of temperature, by noting that . 7.7 p-v. Diagram Of A Pure Substance
  • 7. Figure 7.7 shows the pv diagram of a pure substance. The saturated liquid and saturated-vapour curves meet at the critical point. The region to the left of the saturated-liquid line is compressed liquid, and the region to the right of the saturated-vapour line is superheated vapour. In between the two lines is the two-phase liquid-vapour region. Several isotherms are shown in the figure. The critical isotherm has an inflection point and a zero slope at the critical point. Isotherms below the critical point experience two discontinuities in slope as they cross the saturated-liquid and saturated-vapour lines. In between these two lines, the slope of the isotherms is zero, and a state in this region can be entirely saturated liquid, entirely saturated vapour, or a combination of the two. 7.8 Extending p-v Diagram for a Pure Substance to Solid Phase
  • 8.
  • 9. Figure 7.8a. shows various regions of a pure substances on a p-v coordinates. Volume continuously increases from solid to super heated vapour region. But for water volume decreases on melting and afterwards increases as shown Figure 7.8b. 7.9 p-V-T Surface p-V-T behaviour of a pure substance can be expressed in a single three dimensional p-v-t surface as shown in the Figure 7.9(a). For water as its volume decreases on melting unlike other substances its p-v-t surface will be different from that of others as given in Figure 7.9(b).
  • 10. 7.10 Measurements of Dryness Fraction of Wet Steam Dryness fraction of wet steam, representing the fraction of steam in the mixture of water and steam can be measured by using (i) Throttling calorimeter and (ii) Separating and Throttling calorimeter. Principle and working of these two devices are presented in this section. (i) Throttling calorimeter Let us consider a wet steam as represented by state 1 in the h-s diagram as given in Figure 7.10. When it undergoes a throttling process to state 2, it enters into the superheated region. By measuring the temperature and pressure after throttling the specific enthalpy can be obtained. As mentioned earlier during throttling enthalpy remains constant. Therefore the initial state can be completely fixed since the pressure before throttling and the corresponding specific enthalpy are known. That is, h1 = hf1 + x1 hfg1 = h2 ...(7.5) where h2 = f (t2, p2) hf1 = hf@p1 hfg1 = hfg@p1 .
  • 11. Schematic arrangement of a throttling calorimeter is given in Figure 7.11. Steam from the main is extracted through a perforated tube projecting into it as shown in the Figure. Pressure of the steam is measured. It is then throttled into a chamber where the necessary pressure and temperature measurements are made. From the chamber the expanded steam is then condensed by circulating cooling water and discharged.
  • 12. (ii) Separating and Throttling calorimeter When the dryness fraction of the steam is very low, it becomes superheated vapour only at very low end pressure on throttling. In general, the pressure after throttling for dryness fraction measurement is preferred to be above atmospheric. In such applications, separating and throttling calorimeters are used for dryness fraction measurement. Wet steam, when subjected to sudden change in the direction of flow, a portion of the liquid falls due to gravity and gets separated from the main stream. Thus the remaining steam becomes rich in vapour, which upon throttling will become superheated vapour even at a pressure higher than atmospheric pressure. This principle is employed in the separating and throttling calorimeter. The schematic arrangement of a separating and throttling calorimeter is shown in Figure 7.13. The wet steam from the steam main is extracted through a perforated tube and sent to the separator where a portion of the liquid is separated due to sudden change in the direction as explained above. The remaining steam is throttled into a chamber where the required pressure and temperature measurements are made. Mass flow rate of liquid separated in the separator is collected and measured. Mass of the remaining steam is also measured by condensing the throttled steam and collecting it. Let be the mass of liquid separated in the separator and be the mass of steam throttled. The state of steam before entering the separator is denoted as state1 and states before and after throttling are respectively represented as state 2 and state 3.
  • 13. As throttling is a constant enthalpy process h2 = h3 ...(7.6) where h3 = f(T3, p3) ; Since pressure and temperature after throttling are known, from the superheated steam table, h3 can be obtained. These two values can be obtained from the saturated table Therefore x2 can be computed from equation (7.6 ).
  • 14. It has already been mentioned that only liquid is being separated from the wet steam when it is passed through the separator. Then the mass of dry vapour leaving the separator must be equal to the mass of dry vapour entering the separator. That is (m1 + m2) x1 = m2 x2 Upon rearranging the equation ...(7.7) 7.11 Steam Tables As defined earlier to define the thermodynamic state of a given substance, any two independent intensive properties are sufficient. Once the state is fixed, all other properties can be computed. Tables giving the property values of saturated liquid and saturated vapour with respect temperature and pressure are available along with the properties of superheated steam. These tables can be made use of in the calculation of properties at any state. [See Appendix A1 & A2] For refrigeration application, fluids like Ammonia and R134a are used. Properties of these fluids are also available in the form of tables.