SlideShare a Scribd company logo
1 of 8
Download to read offline
Development of surface enhanced Raman scattering (SERS)
spectroscopy monitoring of fuel markers to prevent fraud
Timothy G. Wilkinson*a
, John Clarksona
, Peter C. Whitea
, Nicholas Meakina
, Ken McDonaldb
a
DeCipher Pte Ltd, Unit 5, Begbroke Science Park, Begbroke, OX5 1PF, UK. b
Ocean Optics, St.
Clements Business Centre, 1-5 London Place, Oxford, OX4 1BD, UK.
ABSTRACT
Governments often tax fuel products to generate revenues to support and stimulate their economies. They also subsidize
the cost of essential fuel products. Fuel taxation and subsidization practices are both subject to fraud. Oil marketing
companies also suffer from fuel fraud with loss of legitimate sales and additional quality and liability issues. The use of
an advanced marking system to identify and control fraud has been shown to be effective in controlling illegal activity.
DeCipher has developed surface enhanced Raman scattering (SERS) spectroscopy as its lead technology for measuring
markers in fuel to identify and control malpractice. SERS has many advantages that make it highly suitable for this
purpose. The SERS instruments are portable and can be used to monitor fuel at any point in the supply chain. SERS
shows high specificity for the marker, with no false positives. Multiple markers can also be detected in a single SERS
analysis allowing, for example, specific regional monitoring of fuel. The SERS analysis from fuel is also quick, clear and
decisive, with a measurement time of less than 5 minutes. We will present results highlighting our development of the
use of a highly stable silver colloid as a SERS substrate to measure the markers at ppb levels. Preliminary results from
the use of a solid state SERS substrate to measure fuel markers will also be presented.
Keywords: SERS, fuel fraud, silver colloid, solid-state SERS.
1. INTRODUCTION
It is estimated that about $800 billion dollars is lost worldwide annually across most industry sectors, including fuels,
through illegal malpractices such as counterfeiting, theft, smuggling and product diversion. These trading malpractices
can have an adverse effect on industrial and economic growth. In many countries fuel products are taxed to provide
revenues to boost their economy and in some countries to subsidize the cost of essential products. Unfortunately, these
incentives are usurped by individuals or organized groups who try to profit from evading payment of taxes on fuels
consumed or through the illegal use of subsidized fuels.
Countries consider implementation of a fuel control program if they levy a high rate of taxation on fuel products and if
the income generated contributes a significant proportion to their overall revenue. Implementation of a program may also
be considered, particularly by developing countries, if they want to protect internal investment and especially when some
of the major investors are the oil-multinational companies. In countries offering fuel subsidies, where the revenue
generated is to be used to aid poor communities or particular sectors e.g., farmers, these may also consider the
introduction a fuel control program.
Other driving forces may also depend upon whether the country is a crude oil importer or exporter and the amount of
revenue lost through fuel fraud. With a fuel exporting country lost revenue is much less of a problem compared with a
fuel importing country, since the latter will suffer from greater financial difficulties. Protection of a country’s image and
international status are also considered to be good reasons for providing a fuel control program and welcomed by oil
marketing companies to ensure they can generate revenue, brand and liability protection.
Several countries have introduced fuel control programs with fraudulent use confirmed by detection of a marker
introduced into fuel products. By introducing a marker at a known concentration this can show if a fuel is non-
adulterated or adulterated with another fuel which could be either non-subsidized or subsidized. Furthermore, if a low
level of marker is detected this could be indicative of fuel laundering, an illegal practice whereby a chemical or
adsorbent material has been added to the fuel in an attempt to remove the marker. Methods of detection that have or are
still being used include immunoassay, UV-IR spectroscopy, GC-MS, X-Ray analysis and covert chemicals.
*tim@timwilkinson@energenics.co.uk
Chemical, Biological, Radiological, Nuclear, and Explosives (CBRNE) Sensing XIV,
edited by Augustus Way Fountain, Proc. of SPIE Vol. 8710, 87100G · © 2013
SPIE · CCC code: 0277-786X/13/$18 · doi: 10.1117/12.2018389
Proc. of SPIE Vol. 8710 87100G-1
DeCipher Pte Ltd, a company which offers consultancy services to determine how to tackle problems caused by
fraudulent fuel marking with expertise in design, implementation and operation of fuel marking systems were aware that
these methods of detection were not entirely suitable since, as discussed later, they are unable to meet all the
performance criteria required. About three years ago the company became interested in a novel SERS method proposed
by Peter White after he had been able to devise a method for producing a very stable and reproducible silver colloid1,2
,
critical for any successful commercial SERS application. This SERS method when used in conjunction with a portable
Raman instrument, developed in partnership with Ocean Optics, has since proved to be very successful in all aspects of
fuel fraud detection. Having demonstrated the advantages of this SERS method over other detection methods, it has now
been chosen and implemented by several countries for the detection of fraud in their fuel control programs. Interestingly,
although the SERS detection and its potential were recognized over forty years ago, this is believed to be the first major
commercial and forensic application of this detection technique.
This presentation covers the development of the SERS system, including the portable Raman instrument and suitable
markers. Results from field trials are presented, together with examples of multiple marker detection and identification of
the illegal practices of fuel adulteration and laundering. Due to proprietary and contractual reasons some details about the
SERS reagents, the identity of the markers and information related to the marking protocols used in the field will not be
divulged. However, the advantages of this SERS method over the more traditional detection methods will be presented.
Finally, some preliminary studies using solid state SERS substrates as an alternative to colloidal silver for producing the
surface enhancement effects are also disclosed.
2. THE SERS METHOD
2.1 Development of the SERS system
The surface enhancing effect of silver and the resulting increase in sensitivity of Raman signals by up to six orders of
magnitude was identified by Fleischmann et.al, in 19743
. When possible to use a laser excitation wavelength close to the
max of the analyte (resonance Raman spectroscopy) and combined with this surface enhancement effect (surface
enhanced resonance Raman scattering (SERRS) spectroscopy) an overall increase in sensitivity of between ten and
fourteen orders of magnitude can be achieved, thus making it one of the most sensitive detection techniques. With the
additional advantages of providing molecular information, a high degree of selectivity and ability to measure analytes in
either aqueous or organic solutions, SERS was considered an ideal detection technique with many potential applications.
Many of these applications used a silver colloid as the SERS substrate and one of the first forensic applications of SERS
for the detection of trace levels of colorants was reported by White et.al4
at a SPIE conference in 1998. However, as with
many other applications, commercialization was hindered due to the lack of a method to produce a silver colloid that
could meet the requirements for SERS spectroscopy. A summary of a SERS spectroscopists meeting reported by Natan5
in 2006 specified the requirements for a suitable substrate and these included acceptable shelf-life, good batch to batch
reproducibility, low cost and a high enhancement factor.
These problems with production of a suitable silver colloid were overcome when in 2009 White and Hjortkjaer
developed and patented1
a method which produced a stable aqueous silver colloid solution that could meet and in most
instances exceeded all the required specifications. Having achieved this goal Peter White then proposed and showed,
amongst other ideas, the use of this colloid in a novel rapid single tube SERS procedure for the detection and
identification of marker(s) at low ppb levels in less than 1 ml of fuel. This was the start of the journey and with
DeCipher’s interest, expertise and development work their efforts finally resulted in introducing SERS spectroscopy as a
viable method for the detection and monitoring of the fraudulent use of fuels.
The single tube analytical method proposed was found to be a robust, reliable and quick procedure that can be used in the
field, even by operatives who had no previous scientific experience. The concept behind the use of single tube procedure
was based on the knowledge that the negatively charged silver colloidal particles in aqueous solution should aid the
extraction of any marker(s) from a fuel sample. Furthermore, when this procedure is performed in a glass vial, a SERS
spectrum of the marker(s) present in the aqueous phase can be achieved without any further manipulation of the sample.
Typically, a SERS spectrum of a marker present in a fuel sample is prepared for analysis as follows. Silver colloid
solution diluted with water (500 µl; colloid/water 30:70) is added to a 1.0 ml screw-capped glass vial which contains an
aliquot (500 µl) of the marked fuel. After capping the vial and vortex mixing the contents for 3 x 3 seconds, the sodium
chloride aggregating reagent solution (40 µl; 0.175M) is added, the vial capped and inverted twice to mix the
Proc. of SPIE Vol. 8710 87100G-2
J
Co
stntvs
574
. m 1111,. t .a s
components. The vial is then inserted into the SERS instrument to record the spectrum of any marker(s) extracted. Using
this method the whole procedure can be completed with a result being obtained in five minutes.
2.2 SERS detection of the marker(s)
In order for this SERS method to be acceptable for operation in the field and in the laboratory the detection system had to
meet the following requirements;
 Be portable and robust.
 Operate off a mains or battery supply.
 Able to identify and quantify more than one marker.
 Capable of producing unique marker(s) spectra.
 Provide secure data storage to prevent tampering.
 Contain a facility to verify sample.
 Capable of being linked to a printer.
 Capable of being able to transmit results.
Additionally for the field instrument, a major requirement was that it should be able to provide a simple qualitative
“Yes/No” output to show which marker(s) are present. Due to the complexity of these requirements and an immediate
need for an instrument, a partnership was established between DeCipher and Ocean Optics for the latter to develop a
suitable detection system together with the appropriate software to carry out these required tasks. An instrument which is
capable of meeting all of these requirements has subsequently been produced and used very successfully in the field. The
current instrument together with a screen shot of a marker being detected and identified in a marked fuel sample is
shown in Figure 1.
Figure 1. The portable SERS instrument developed for use in the field and laboratory for the detection of fuel fraud and
a screen shot of the SERS spectrum of a marker being detected and identified in a marked diesel. (© John Wiley &
Sons & IM Publications LLP).
The excitation source in this instrument is a 30mW, 532nm diode laser and spectra are recorded over 200-2000 cm-1
using a cooled CCD detector. A glass vial containing the prepared sample is inserted into the sample holder and a
spectrum is recorded over a scan time of typically 1 x 30 seconds. Control of the instrument, sample identification,
collection of data and presentation of results are all processed through software installed on the inboard computer.
2.3 Fuel markers
Any analytical method used for the detection of fuel fraud must be capable of detecting a marker or markers in a fuel at <
5% of the marking level. Furthermore if the detection method is to compete for tenders being offered by countries who
want to introduce a fuel monitoring program, then it is essential that the markers used must meet other additional and
stringent requirements including;
Proc. of SPIE Vol. 8710 87100G-3
 Being stable in the fuel and carrier solvent.
 Having specific detection characteristics with no false positives.
 Having no effect on the fuel.
 Being detected by a simple and fast test procedure with simple instrumentation.
 Being detectable after attempts to laundering with acid, alkali or common absorbents.
 Being detectable in a small volume of fuel to reduce volume of waste material.
 Exhibiting a low level of degradation in sunlight.
Since many thousands of litres of fuels may require marking in a fuel control program, cost and the logistics of marking
are major issues. It is not only the cost of the marker that has to be considered but also the cost and volume of carrier
solvents used. Hence, an important consideration is the solubility of the marker in the carrier solvent. If for example a
marker concentration of typically 100ppb is required, then 10mls of a 1% marker concentrate in the carrier solvent would
be needed to disperse the solution into 1000 litres of fuel. In a fuel program the marker can be introduced into and
monitored at any point in the fuel supply chain with the marking of fuels being done either manually or by automatic
injectors.
As identified previously, the silver colloid particles are negatively charged and to achieve the strongest surface
enhancement effect the analyte i.e., marker in this case, must be in very close proximity to the silver surface. It is for this
reason why the markers used are predominantly cationic as these are attracted to the silver surface. This does to some
extent limit the choice of markers, however this has not been a problem as from extensive testing of over two hundred
potential markers a significant number have been identified that can meet the above specifications. Ideally, it is
preferable that many of these markers also display a max which is close to the laser excitation wavelength in order to
benefit from the additional sensitivity gained through the resonance effect.
In a fuel marking program more than one marker may be needed. One example is the requirement to be able to
differentiate between the sources of a fuel. This is essential if for example a road fuel is subsidized at a different rate to
an industrial fuel. More than one marker is also required by a country if they want to mark different fuels such as
gasoline, diesel, kerosene or biofuels, or to identify different grades of a fuel or regional malpractice. With this need to
detect, identify and quantify multiple markers in the field, this limits severely the number of analytical methods that can
be used. A major advantage of DeCipher’s SERS system is that multiple marker detection can be achieved in a single
analysis since in a spectrum obtained from a marked fuel it is possible to identify the spectrum of each marker and also
quantify the amount of each marker present.
3. SERS DETECTION OF FUEL FRAUD
3.1 Pilot studies
Within six months of proof of concept, the SERS system was developed and demonstrated very successfully in several
pilot studies carried out in a number of Asian countries. One of these was in a country where an existing diesel marking
system was already in operation. Results from samples analyzed using the existing system could therefore be compared
directly with those obtained from the SERS system. Of the five hundred samples analyzed it was possible to identify the
marker in every sample and no false positives were obtained. Furthermore, the operatives who used both detection
systems found the SERS method to be cleaner, faster, provided a permanent record of the data and only wasted 0.5 ml of
the fuel.
3.2 Application in the field
The success of these pilot studies and confirmation that the system was both robust and reliable, resulted in DeCipher
quickly gaining a number of major contracts for the marking of fuels. Subsequently, operation of the SERS system in the
field has provided customers with evidence of fuel fraud taking place in their countries. With DeCipher’s own unique
multi-marking scheme being used for marking diesel, gasoline, kerosene and biofuels and also different grades of these
fuels, cases of fuel fraud have been confirmed, successfully prosecuted and saving governments considerable losses in
revenue. It has also been observed that by introducing a successful fuel control program this deters fuel fraud and hence
loss of revenue.
Proc. of SPIE Vol. 8710 87100G-4
2000 -
1500 -
>,...
c 1000
0
c
INDUSTRIAL DIESEL - Marker X
e
I
V
500 W_ L__
0
200 600 1000 1400 1800
Wavenumbers (cm"')
3000
2500
>, 2000
c 1500
ç 1000
500
0
200
AUTOMOTIVE DIESEL - Marker Y
600 1000 1400 1800
Wavenumbers (cm')
MIXED DIESELS - Markers X and Y
2500 -
2000 -
200 600 1000 1400 1800
Wavenumbers (cm'')
As explained earlier, more than one marker is required if wanting to differentiate between different fuels or grades of
fuels. An example of the latter is required when one grade of a fuel is taxed or subsidized at a different rate to another
grade. Hence when fuel stations are suspected of selling a lower grade of gasoline from pumps which should be
delivering premium grade gasoline, marking each grade of fuel with a different marker will confirm if any malpractice is
taking place. Another scenario where multiple markers are used in some countries is when industrial diesel is taxed or
subsidized at a different rate for automotive diesel. As illustrated in Figure 2, by marking the industrial diesel with one
marker (Marker X) and the automobile diesel with another (Marker Y), then by monitoring samples of diesel in
automobile fuel tanks, the presence of Marker X or both markers confirms the fraudulent use of the industrial diesel.
Figure 2. An example showing the advantage of being able to identify more than one marker in a single SERS analysis.
The spectra obtained shows that sample taken from an automobile tank contains two markers and is a mixture of
industrial diesel which contains Marker X and an automotive diesel which contains Marker Y
This ability to detect and quantify the individual markers in a mixture of markers in single analysis and in the field, has
been recognized as a major advantage of the SERS detection method over other analytical methods used previously and
why it is being selected for fuel monitoring programs.
Detection of fuel adulteration is often a requirement of some fuel control programs, especially if a subsidized fuel is
being used to dilute a non subsidized fuel. An example encountered is where kerosene, a subsidized fuel, is used to dilute
highly taxed and unsubsidized diesel. To detect this malpractice then either fuel could be marked or alternatively both
are marked with a different marker. In the example shown in Figure 3 the kerosene had been marked at a level 200pb and
detected in a sample of unmarked diesel thus showing the diesel had been diluted with kerosene.
Proc. of SPIE Vol. 8710 87100G-5
200 600 1000 1400
YyIYeSMmbeSt (G4S4i)
1800
Figure 3. An example of adulteration where a diesel sample (unmarked) is found to contain a marker used in kerosene. The
lower spectrum is from a diesel/kerosene mixture (90:10) but contains no marker in the kerosene. (© John Wiley & Sons &
IM Publications LLP).
Quantifying the amounts of a marker or markers present with the SERS system is achieved by using algorithms based on
the ratio of the intensities of the SERS signals. When following the standard operating procedure for sample preparation
and analysis reproducible quantification is achieved over a marking range of c.a., 1.0 to100%. In the above example it
was determined that the diesel contained about 10% of kerosene. This example illustrates the sensitivity of the SERS
method as the marker concentration has been reduced to about 20 ppb in the adulterated diesel sample. With the majority
of markers used in the field these provide identifiable spectra at levels of ca., 1ppb. This ability to identify markers at this
level is essential because when analyzing fuel samples that have been laundered by the addition of chemicals or
adsorbents, the markers may only be present at these trace levels.
The results presented in Figure 3 also highlight another advantage of using the SERS method for the detection of fuel
fraud. As with diesel many fuels either fluoresce and/or contain additives that fluoresce and this phenomenon can
produce problems with some of the other fuel monitoring analytical techniques. In traditional Raman spectroscopy
fluorescence it is also a major problem as it swamps any surface enhanced signals. However, with SERS spectroscopy
the silver colloid quenches fluorescence, as identified by the low background in spectra and furthermore, with little or no
contribution from any of the additives of fuel components this shows the excellent selectivity of this technique.
COMPARISON OF SERS WITH OTHER ANALYTICAL METHODS
A variety of analytical methods have been developed for monitoring the fraudulent use of fuels with some still currently
in use and a comparison between these and this novel SERS based method is shown in Table 1.
Table 1. A comparison of the analytical methods used to detect markers in fuels.
Analytical Detection
Method
Comments
SERS Technology  Instrument based.
 Sensitive. Gives specific fingerprint.
 Detection and quantification of multiple markers in a single analysis.
 No false positives. Quick analysis time.
Immunoassay  Visual test for each marker.
 Sensitive and specific.
Covert Chemicals  Simple test – visual or instrument.
 Non-specific.
UV-IR Spectroscopy  Non-specific instrument based test.
 Quantification is fuel dependent.
GC-MS  Large instrument. Cost.
X- Ray  Large instrument. Cost.
Proc. of SPIE Vol. 8710 87100G-6
With demands for more complex fuel monitoring programs there is a greater need for systems that can detect and
quantify multiple markers with portable instrument based methods that can be used in the field. Instrument, operating,
marker and consumable costs, low detection limits, and good selectivity are also very important criteria when a country
is selecting a method. From the results presented above and the comments in Table 1, it is possible to see the advantages
gained in using this new SERS detection method and why this method is being selected and used.
4. SOLID-STATE SERS SUBSTRATES
Solid-state SERS substrates used as dipsticks have been explored as a method of monitoring marker in fuels. Table 1 lists
advantages and disadvantages of colloidal substrates compared to solid-state substrates for measuring fuel markers.
Currently, commercially available solid state SERS substrates are prohibitively expensive and some have relatively low
enhancement factors. A recent review of low cost SERS substrates show these can be produced using much cheaper and
simpler methods6
. The advantages of solid state substrates include, simplicity of use compared to colloid substrates and a
direct measurement of markers in fuel. DeCipher has obtained promising results from a low cost, solid state SERS
substrate and together with Ocean Optics are in early stage development of this substrate, instrumentation and marker
chemistry towards a solid-state SERS fuel marker product. This development will increase the choice of fuel markers.
Table 2. Comparison of the advantages and disadvantages of colloidal and solid-state SERS substrates for measuring fuel
markers.
SERS
SUBSTRATE
ADVANTAGES DISADVANTAGES
COLLOID
• There is a proven Working System for
fuels.
• Quick results, < 3 mins.
• Quantitative.
• Inexpensive.
• Reproducible.
• Long shelf-life time.
• SERS observed for a limited time due to
aggregation.
• Not a direct measurement and reagents need to
be added to develop SERS.
SOLID
STATE
• Simple measurement using a “dip-stick”.
• Markers measured directly in fuel.
• SERS can be measured days after initial
measurement.
• New substrates reported to have high
enhancement factors, comparable to colloid,
enabling low detection limits
• Method can be automated for bulk laboratory
analysis.
• No Working System in the market suitable
for detection of markers in fuels.
• Not known whether the sensitivity of solid-
state substrates match colloidal systems.
• SERS signal may take a relatively long time to
develop e.g., > 10 mins.
• Reproducibility and shelf-life time unknown.
5. CONCLUSIONS
A SERS detection method using a portable instrument has been successfully developed, implemented in the field and
shown to have considerable advantages over other methods currently used for the detection of fuel fraud. A novel single
tube sample preparation scheme which uses the properties of a stable silver colloid provides an overall analysis time of
typically five minutes.
Both qualitative and quantitative analyses of markers in all types of fuel can be obtained when present at levels down to
1-10 ppb thus highlighting the sensitivity of the detection system and hence making it possible to detect the malpractices
of fuel adulteration and laundering. One of the other major advantages of this technique is the high degree of selectivity
that can be achieved and this enables identification and the quantification of multiple markers in fuels in a single
analysis.
Proc. of SPIE Vol. 8710 87100G-7
Since adopting this SERS monitoring system as the lead technology for fuel control programs in several countries, the
results obtained have provided evidence which has resulted in successful prosecutions. Interestingly, this is believed to
be the first major commercial and forensic application of SERS and only made possible due to a method developed
recently for production of a stable and reproducible silver colloid, an essential component for any commercial
application of SERS spectroscopy. More recently the company has started to evaluate the potential of using solid-state
SERS substrates as these should be able to extend the range of markers that can be used.
Finally, this success cannot be attributed solely to development and use of this novel detection method. DeCipher’s
expertise in determining how to tackle problems in monitoring fuel fraud, the marking of fuels and the design,
implementation and operation of fuel marking systems are just as important. Furthermore, since the company’s senior
personnel are responsible for the infrastructure and sub-contracting of operational manpower, DeCipher is also able to
provide an integrated operations system of controlled marking, linking terminal deliveries to retail site receipts and
managing an active surveillance/testing program.
The silver colloid patent referred to in this paper is owned by the University of Lincoln, UK.
REFERENCES
1. White, P.C. and Hjortkjaer, J,H., “Preparation of metal colloids”, International Patent Application, PCT WO
2009/081138 A1, (2009).
2. White, P.C. and Hjortkjaer, J,H., “Preparation and characterisation of a stable silver colloid for SERS spectroscopy”,
Phys.Chem. Chem.Phys. Submitted for publication.
3. Fleischmann, M., Hendra, P.A. and McQuillan, A.J., "Raman spectra of pyridine adsorbed at a silver electrode",
J.Chem.Phys.Lett., 26, 163-166, (1974).
4. White, P.C., Rodger, C., Rutherford, V., Finnon, Y., Smith, W,E. and Fitzgerald, M., “Surface enhanced resonance
Raman scattering (SERRS) spectroscopy. A powerful technique for the forensic analysis of colourants?”, Proc. SPIE
3576, 77-86, (1998).
5. M.J. Natan, M.J., “Concluding remarks – Surface enhanced Raman scattering”, Faraday Discuss., 132, 321-328,
(2006).
6. L. Polavarpu and L.M. Liz-Maran., “Towards low-cost flexible substrates for nanoplasmonic sensing”, Phys. Chem.
Chem. Phys, 15, 5288-5300, (2013).
Proc. of SPIE Vol. 8710 87100G-8

More Related Content

Viewers also liked

UV Raman Evidence of a Tyrosine in Apo-Human Serum Transferrin with a Low pKa...
UV Raman Evidence of a Tyrosine in Apo-Human Serum Transferrin with a Low pKa...UV Raman Evidence of a Tyrosine in Apo-Human Serum Transferrin with a Low pKa...
UV Raman Evidence of a Tyrosine in Apo-Human Serum Transferrin with a Low pKa...
John Clarkson
 
A new single grating spectrograph for ultra violet raman scattering studies
A new single grating spectrograph for ultra violet raman scattering studiesA new single grating spectrograph for ultra violet raman scattering studies
A new single grating spectrograph for ultra violet raman scattering studies
John Clarkson
 
A theoretical study of the structure and vibrations of 2,4,6 trinitrotoluene
A theoretical study of the structure and vibrations of 2,4,6 trinitrotolueneA theoretical study of the structure and vibrations of 2,4,6 trinitrotoluene
A theoretical study of the structure and vibrations of 2,4,6 trinitrotoluene
John Clarkson
 

Viewers also liked (17)

Volunteers in urban Forestry: Treasure or Trouble
Volunteers in urban Forestry: Treasure or TroubleVolunteers in urban Forestry: Treasure or Trouble
Volunteers in urban Forestry: Treasure or Trouble
 
UV Raman Evidence of a Tyrosine in Apo-Human Serum Transferrin with a Low pKa...
UV Raman Evidence of a Tyrosine in Apo-Human Serum Transferrin with a Low pKa...UV Raman Evidence of a Tyrosine in Apo-Human Serum Transferrin with a Low pKa...
UV Raman Evidence of a Tyrosine in Apo-Human Serum Transferrin with a Low pKa...
 
Apparels in delhi ppt
Apparels  in delhi pptApparels  in delhi ppt
Apparels in delhi ppt
 
SELECTION OF IMAGES TAKEN FOR FIRM MAGAZINE
SELECTION OF IMAGES TAKEN FOR FIRM MAGAZINESELECTION OF IMAGES TAKEN FOR FIRM MAGAZINE
SELECTION OF IMAGES TAKEN FOR FIRM MAGAZINE
 
A new single grating spectrograph for ultra violet raman scattering studies
A new single grating spectrograph for ultra violet raman scattering studiesA new single grating spectrograph for ultra violet raman scattering studies
A new single grating spectrograph for ultra violet raman scattering studies
 
UV raman evidence of a tyrosine in apo human serum transferrin with a low p k...
UV raman evidence of a tyrosine in apo human serum transferrin with a low p k...UV raman evidence of a tyrosine in apo human serum transferrin with a low p k...
UV raman evidence of a tyrosine in apo human serum transferrin with a low p k...
 
Raman study of the polarizing forces promoting catalysis in 4 chlorbenzoyl-co...
Raman study of the polarizing forces promoting catalysis in 4 chlorbenzoyl-co...Raman study of the polarizing forces promoting catalysis in 4 chlorbenzoyl-co...
Raman study of the polarizing forces promoting catalysis in 4 chlorbenzoyl-co...
 
New Kids in Town 10-2013 EDITED
New Kids in Town 10-2013 EDITEDNew Kids in Town 10-2013 EDITED
New Kids in Town 10-2013 EDITED
 
Thermodynamic and biophysical characterization of cytochrome p450 bio i from ...
Thermodynamic and biophysical characterization of cytochrome p450 bio i from ...Thermodynamic and biophysical characterization of cytochrome p450 bio i from ...
Thermodynamic and biophysical characterization of cytochrome p450 bio i from ...
 
Vibrational analysis of trans azobenzene
Vibrational analysis of trans azobenzeneVibrational analysis of trans azobenzene
Vibrational analysis of trans azobenzene
 
Temperature fields during the development of combustion in a rapid compressio...
Temperature fields during the development of combustion in a rapid compressio...Temperature fields during the development of combustion in a rapid compressio...
Temperature fields during the development of combustion in a rapid compressio...
 
Ultraviolet resonance raman study of the avidin biotin complex
Ultraviolet resonance raman study of the avidin biotin complexUltraviolet resonance raman study of the avidin biotin complex
Ultraviolet resonance raman study of the avidin biotin complex
 
Ed.tech2D
Ed.tech2DEd.tech2D
Ed.tech2D
 
Yousef Taha c.v
Yousef Taha c.vYousef Taha c.v
Yousef Taha c.v
 
The effect of core destabilisation on the mechanical resistance of i27
The effect of core destabilisation on the mechanical resistance of i27The effect of core destabilisation on the mechanical resistance of i27
The effect of core destabilisation on the mechanical resistance of i27
 
UV resonance raman study of streptavidin binding of biotin and 2 iminobiotin ...
UV resonance raman study of streptavidin binding of biotin and 2 iminobiotin ...UV resonance raman study of streptavidin binding of biotin and 2 iminobiotin ...
UV resonance raman study of streptavidin binding of biotin and 2 iminobiotin ...
 
A theoretical study of the structure and vibrations of 2,4,6 trinitrotoluene
A theoretical study of the structure and vibrations of 2,4,6 trinitrotolueneA theoretical study of the structure and vibrations of 2,4,6 trinitrotoluene
A theoretical study of the structure and vibrations of 2,4,6 trinitrotoluene
 

Similar to Development of surface enhanced raman scattering (sers) spectroscopy monitoring of fuel markers to prevent fraud

Eor screenings by arficial intelligence spe 78332
Eor screenings by arficial intelligence spe 78332Eor screenings by arficial intelligence spe 78332
Eor screenings by arficial intelligence spe 78332
Ricardo Tapia
 
Leak Detection And Repair
Leak Detection And RepairLeak Detection And Repair
Leak Detection And Repair
Ashutosh Soni
 
On the comparison of metals, heavy and toxics elements in waste petroleum of ...
On the comparison of metals, heavy and toxics elements in waste petroleum of ...On the comparison of metals, heavy and toxics elements in waste petroleum of ...
On the comparison of metals, heavy and toxics elements in waste petroleum of ...
Dr. Mohamed Saad Seoud
 
PG-Rise-3-Report_Directional-Air-Flow-Sampler-Final (2)
PG-Rise-3-Report_Directional-Air-Flow-Sampler-Final (2)PG-Rise-3-Report_Directional-Air-Flow-Sampler-Final (2)
PG-Rise-3-Report_Directional-Air-Flow-Sampler-Final (2)
Chiemela Victor Amaechi
 
75315682 hse leak-detection
75315682 hse leak-detection75315682 hse leak-detection
75315682 hse leak-detection
Jasmin Jasmin
 
Neeri - Toxic Air Pollutants
Neeri - Toxic Air PollutantsNeeri - Toxic Air Pollutants
Neeri - Toxic Air Pollutants
ECRD IN
 

Similar to Development of surface enhanced raman scattering (sers) spectroscopy monitoring of fuel markers to prevent fraud (20)

“A Systematic Review of HCR, PDR, and ARR-Based Approaches for Enhancing Bloo...
“A Systematic Review of HCR, PDR, and ARR-Based Approaches for Enhancing Bloo...“A Systematic Review of HCR, PDR, and ARR-Based Approaches for Enhancing Bloo...
“A Systematic Review of HCR, PDR, and ARR-Based Approaches for Enhancing Bloo...
 
Subsea leak detection systems
Subsea leak detection systemsSubsea leak detection systems
Subsea leak detection systems
 
PIOGA/MSC Observations/Questions on PA DEP Radiation in Shale Drilling Study
PIOGA/MSC Observations/Questions on PA DEP Radiation in Shale Drilling StudyPIOGA/MSC Observations/Questions on PA DEP Radiation in Shale Drilling Study
PIOGA/MSC Observations/Questions on PA DEP Radiation in Shale Drilling Study
 
Eor screenings by arficial intelligence spe 78332
Eor screenings by arficial intelligence spe 78332Eor screenings by arficial intelligence spe 78332
Eor screenings by arficial intelligence spe 78332
 
Seeing CH4 Clearly: Science-Based Approaches to Methane Monitoring in the Oil...
Seeing CH4 Clearly: Science-Based Approaches to Methane Monitoring in the Oil...Seeing CH4 Clearly: Science-Based Approaches to Methane Monitoring in the Oil...
Seeing CH4 Clearly: Science-Based Approaches to Methane Monitoring in the Oil...
 
Risk Assessment in Spain
Risk Assessment in SpainRisk Assessment in Spain
Risk Assessment in Spain
 
Challenges and Accomplishments of TD-NMR in Industry 4.0: Crimson Publishers
Challenges and Accomplishments of TD-NMR in Industry 4.0: Crimson PublishersChallenges and Accomplishments of TD-NMR in Industry 4.0: Crimson Publishers
Challenges and Accomplishments of TD-NMR in Industry 4.0: Crimson Publishers
 
IQ4I Research published a new report on “Chromatography Global Market – Fore...
IQ4I Research published a new report on “Chromatography Global Market  – Fore...IQ4I Research published a new report on “Chromatography Global Market  – Fore...
IQ4I Research published a new report on “Chromatography Global Market – Fore...
 
Leak Detection And Repair
Leak Detection And RepairLeak Detection And Repair
Leak Detection And Repair
 
cdoif-leak-detection-guide.pdf
cdoif-leak-detection-guide.pdfcdoif-leak-detection-guide.pdf
cdoif-leak-detection-guide.pdf
 
HALDEN LAB PRESENTATION (Updated).pptx
HALDEN LAB PRESENTATION (Updated).pptxHALDEN LAB PRESENTATION (Updated).pptx
HALDEN LAB PRESENTATION (Updated).pptx
 
Api
ApiApi
Api
 
On the comparison of metals, heavy and toxics elements in waste petroleum of ...
On the comparison of metals, heavy and toxics elements in waste petroleum of ...On the comparison of metals, heavy and toxics elements in waste petroleum of ...
On the comparison of metals, heavy and toxics elements in waste petroleum of ...
 
APPLICATIONS OF GAS CHROMATOGRAPHY [APPLICATIONS OF GC] BY Prof. Dr. P.RAVISA...
APPLICATIONS OF GAS CHROMATOGRAPHY [APPLICATIONS OF GC] BY Prof. Dr. P.RAVISA...APPLICATIONS OF GAS CHROMATOGRAPHY [APPLICATIONS OF GC] BY Prof. Dr. P.RAVISA...
APPLICATIONS OF GAS CHROMATOGRAPHY [APPLICATIONS OF GC] BY Prof. Dr. P.RAVISA...
 
Refocus: Analysis of malodor
Refocus: Analysis of malodorRefocus: Analysis of malodor
Refocus: Analysis of malodor
 
News Release: Commerce Resources Corp. Reports 80% Reduction in Consumption ...
News Release:  Commerce Resources Corp. Reports 80% Reduction in Consumption ...News Release:  Commerce Resources Corp. Reports 80% Reduction in Consumption ...
News Release: Commerce Resources Corp. Reports 80% Reduction in Consumption ...
 
PG-Rise-3-Report_Directional-Air-Flow-Sampler-Final (2)
PG-Rise-3-Report_Directional-Air-Flow-Sampler-Final (2)PG-Rise-3-Report_Directional-Air-Flow-Sampler-Final (2)
PG-Rise-3-Report_Directional-Air-Flow-Sampler-Final (2)
 
News March 2015
News March 2015News March 2015
News March 2015
 
75315682 hse leak-detection
75315682 hse leak-detection75315682 hse leak-detection
75315682 hse leak-detection
 
Neeri - Toxic Air Pollutants
Neeri - Toxic Air PollutantsNeeri - Toxic Air Pollutants
Neeri - Toxic Air Pollutants
 

More from John Clarkson

Bulk radical homo polymerisation studies on commercial arcylate monomers usin...
Bulk radical homo polymerisation studies on commercial arcylate monomers usin...Bulk radical homo polymerisation studies on commercial arcylate monomers usin...
Bulk radical homo polymerisation studies on commercial arcylate monomers usin...
John Clarkson
 
A dft analysis of the vibrational spectra of nitrobenzene
A dft analysis of the vibrational spectra of nitrobenzeneA dft analysis of the vibrational spectra of nitrobenzene
A dft analysis of the vibrational spectra of nitrobenzene
John Clarkson
 
A theoretical study of the structure and vibrations of 2,4,6-trinitrotoluene
A theoretical study of the structure and vibrations of 2,4,6-trinitrotolueneA theoretical study of the structure and vibrations of 2,4,6-trinitrotoluene
A theoretical study of the structure and vibrations of 2,4,6-trinitrotoluene
John Clarkson
 
Development of surface enhanced Raman scattering (SERS) spectroscopy monitori...
Development of surface enhanced Raman scattering (SERS) spectroscopy monitori...Development of surface enhanced Raman scattering (SERS) spectroscopy monitori...
Development of surface enhanced Raman scattering (SERS) spectroscopy monitori...
John Clarkson
 

More from John Clarkson (11)

Vibrational analysis of the phenylazonaphthol pigment ca4b
Vibrational analysis of the phenylazonaphthol pigment ca4bVibrational analysis of the phenylazonaphthol pigment ca4b
Vibrational analysis of the phenylazonaphthol pigment ca4b
 
Raman microscopy and x ray diffraction a combined study of fibrillin-rich mic...
Raman microscopy and x ray diffraction a combined study of fibrillin-rich mic...Raman microscopy and x ray diffraction a combined study of fibrillin-rich mic...
Raman microscopy and x ray diffraction a combined study of fibrillin-rich mic...
 
Opportunities for probing the structure and mechanism of porphobilinogen synt...
Opportunities for probing the structure and mechanism of porphobilinogen synt...Opportunities for probing the structure and mechanism of porphobilinogen synt...
Opportunities for probing the structure and mechanism of porphobilinogen synt...
 
Morphological study of aluminum tris(8 hydroxyquinoline) thin films using inf...
Morphological study of aluminum tris(8 hydroxyquinoline) thin films using inf...Morphological study of aluminum tris(8 hydroxyquinoline) thin films using inf...
Morphological study of aluminum tris(8 hydroxyquinoline) thin films using inf...
 
Evidence for electrophilic catalysis in the 4 chlorobenzoyl-co a dehalogenase...
Evidence for electrophilic catalysis in the 4 chlorobenzoyl-co a dehalogenase...Evidence for electrophilic catalysis in the 4 chlorobenzoyl-co a dehalogenase...
Evidence for electrophilic catalysis in the 4 chlorobenzoyl-co a dehalogenase...
 
Comparison of the structures and vibrational modes of carboxybiotin and n car...
Comparison of the structures and vibrational modes of carboxybiotin and n car...Comparison of the structures and vibrational modes of carboxybiotin and n car...
Comparison of the structures and vibrational modes of carboxybiotin and n car...
 
Characterization of the surface of a citrate reduced colloid optimized for us...
Characterization of the surface of a citrate reduced colloid optimized for us...Characterization of the surface of a citrate reduced colloid optimized for us...
Characterization of the surface of a citrate reduced colloid optimized for us...
 
Bulk radical homo polymerisation studies on commercial arcylate monomers usin...
Bulk radical homo polymerisation studies on commercial arcylate monomers usin...Bulk radical homo polymerisation studies on commercial arcylate monomers usin...
Bulk radical homo polymerisation studies on commercial arcylate monomers usin...
 
A dft analysis of the vibrational spectra of nitrobenzene
A dft analysis of the vibrational spectra of nitrobenzeneA dft analysis of the vibrational spectra of nitrobenzene
A dft analysis of the vibrational spectra of nitrobenzene
 
A theoretical study of the structure and vibrations of 2,4,6-trinitrotoluene
A theoretical study of the structure and vibrations of 2,4,6-trinitrotolueneA theoretical study of the structure and vibrations of 2,4,6-trinitrotoluene
A theoretical study of the structure and vibrations of 2,4,6-trinitrotoluene
 
Development of surface enhanced Raman scattering (SERS) spectroscopy monitori...
Development of surface enhanced Raman scattering (SERS) spectroscopy monitori...Development of surface enhanced Raman scattering (SERS) spectroscopy monitori...
Development of surface enhanced Raman scattering (SERS) spectroscopy monitori...
 

Recently uploaded

Asymmetry in the atmosphere of the ultra-hot Jupiter WASP-76 b
Asymmetry in the atmosphere of the ultra-hot Jupiter WASP-76 bAsymmetry in the atmosphere of the ultra-hot Jupiter WASP-76 b
Asymmetry in the atmosphere of the ultra-hot Jupiter WASP-76 b
Sérgio Sacani
 
Biogenic Sulfur Gases as Biosignatures on Temperate Sub-Neptune Waterworlds
Biogenic Sulfur Gases as Biosignatures on Temperate Sub-Neptune WaterworldsBiogenic Sulfur Gases as Biosignatures on Temperate Sub-Neptune Waterworlds
Biogenic Sulfur Gases as Biosignatures on Temperate Sub-Neptune Waterworlds
Sérgio Sacani
 
POGONATUM : morphology, anatomy, reproduction etc.
POGONATUM : morphology, anatomy, reproduction etc.POGONATUM : morphology, anatomy, reproduction etc.
POGONATUM : morphology, anatomy, reproduction etc.
Silpa
 
development of diagnostic enzyme assay to detect leuser virus
development of diagnostic enzyme assay to detect leuser virusdevelopment of diagnostic enzyme assay to detect leuser virus
development of diagnostic enzyme assay to detect leuser virus
NazaninKarimi6
 
Bacterial Identification and Classifications
Bacterial Identification and ClassificationsBacterial Identification and Classifications
Bacterial Identification and Classifications
Areesha Ahmad
 
Digital Dentistry.Digital Dentistryvv.pptx
Digital Dentistry.Digital Dentistryvv.pptxDigital Dentistry.Digital Dentistryvv.pptx
Digital Dentistry.Digital Dentistryvv.pptx
MohamedFarag457087
 

Recently uploaded (20)

Bhiwandi Bhiwandi ❤CALL GIRL 7870993772 ❤CALL GIRLS ESCORT SERVICE In Bhiwan...
Bhiwandi Bhiwandi ❤CALL GIRL 7870993772 ❤CALL GIRLS  ESCORT SERVICE In Bhiwan...Bhiwandi Bhiwandi ❤CALL GIRL 7870993772 ❤CALL GIRLS  ESCORT SERVICE In Bhiwan...
Bhiwandi Bhiwandi ❤CALL GIRL 7870993772 ❤CALL GIRLS ESCORT SERVICE In Bhiwan...
 
module for grade 9 for distance learning
module for grade 9 for distance learningmodule for grade 9 for distance learning
module for grade 9 for distance learning
 
Asymmetry in the atmosphere of the ultra-hot Jupiter WASP-76 b
Asymmetry in the atmosphere of the ultra-hot Jupiter WASP-76 bAsymmetry in the atmosphere of the ultra-hot Jupiter WASP-76 b
Asymmetry in the atmosphere of the ultra-hot Jupiter WASP-76 b
 
Biogenic Sulfur Gases as Biosignatures on Temperate Sub-Neptune Waterworlds
Biogenic Sulfur Gases as Biosignatures on Temperate Sub-Neptune WaterworldsBiogenic Sulfur Gases as Biosignatures on Temperate Sub-Neptune Waterworlds
Biogenic Sulfur Gases as Biosignatures on Temperate Sub-Neptune Waterworlds
 
POGONATUM : morphology, anatomy, reproduction etc.
POGONATUM : morphology, anatomy, reproduction etc.POGONATUM : morphology, anatomy, reproduction etc.
POGONATUM : morphology, anatomy, reproduction etc.
 
Molecular markers- RFLP, RAPD, AFLP, SNP etc.
Molecular markers- RFLP, RAPD, AFLP, SNP etc.Molecular markers- RFLP, RAPD, AFLP, SNP etc.
Molecular markers- RFLP, RAPD, AFLP, SNP etc.
 
Exploring Criminology and Criminal Behaviour.pdf
Exploring Criminology and Criminal Behaviour.pdfExploring Criminology and Criminal Behaviour.pdf
Exploring Criminology and Criminal Behaviour.pdf
 
FAIRSpectra - Enabling the FAIRification of Spectroscopy and Spectrometry
FAIRSpectra - Enabling the FAIRification of Spectroscopy and SpectrometryFAIRSpectra - Enabling the FAIRification of Spectroscopy and Spectrometry
FAIRSpectra - Enabling the FAIRification of Spectroscopy and Spectrometry
 
Clean In Place(CIP).pptx .
Clean In Place(CIP).pptx                 .Clean In Place(CIP).pptx                 .
Clean In Place(CIP).pptx .
 
FAIRSpectra - Enabling the FAIRification of Analytical Science
FAIRSpectra - Enabling the FAIRification of Analytical ScienceFAIRSpectra - Enabling the FAIRification of Analytical Science
FAIRSpectra - Enabling the FAIRification of Analytical Science
 
An introduction on sequence tagged site mapping
An introduction on sequence tagged site mappingAn introduction on sequence tagged site mapping
An introduction on sequence tagged site mapping
 
GBSN - Microbiology (Unit 1)
GBSN - Microbiology (Unit 1)GBSN - Microbiology (Unit 1)
GBSN - Microbiology (Unit 1)
 
Stages in the normal growth curve
Stages in the normal growth curveStages in the normal growth curve
Stages in the normal growth curve
 
Dr. E. Muralinath_ Blood indices_clinical aspects
Dr. E. Muralinath_ Blood indices_clinical  aspectsDr. E. Muralinath_ Blood indices_clinical  aspects
Dr. E. Muralinath_ Blood indices_clinical aspects
 
Thyroid Physiology_Dr.E. Muralinath_ Associate Professor
Thyroid Physiology_Dr.E. Muralinath_ Associate ProfessorThyroid Physiology_Dr.E. Muralinath_ Associate Professor
Thyroid Physiology_Dr.E. Muralinath_ Associate Professor
 
development of diagnostic enzyme assay to detect leuser virus
development of diagnostic enzyme assay to detect leuser virusdevelopment of diagnostic enzyme assay to detect leuser virus
development of diagnostic enzyme assay to detect leuser virus
 
Bacterial Identification and Classifications
Bacterial Identification and ClassificationsBacterial Identification and Classifications
Bacterial Identification and Classifications
 
Digital Dentistry.Digital Dentistryvv.pptx
Digital Dentistry.Digital Dentistryvv.pptxDigital Dentistry.Digital Dentistryvv.pptx
Digital Dentistry.Digital Dentistryvv.pptx
 
300003-World Science Day For Peace And Development.pptx
300003-World Science Day For Peace And Development.pptx300003-World Science Day For Peace And Development.pptx
300003-World Science Day For Peace And Development.pptx
 
pumpkin fruit fly, water melon fruit fly, cucumber fruit fly
pumpkin fruit fly, water melon fruit fly, cucumber fruit flypumpkin fruit fly, water melon fruit fly, cucumber fruit fly
pumpkin fruit fly, water melon fruit fly, cucumber fruit fly
 

Development of surface enhanced raman scattering (sers) spectroscopy monitoring of fuel markers to prevent fraud

  • 1. Development of surface enhanced Raman scattering (SERS) spectroscopy monitoring of fuel markers to prevent fraud Timothy G. Wilkinson*a , John Clarksona , Peter C. Whitea , Nicholas Meakina , Ken McDonaldb a DeCipher Pte Ltd, Unit 5, Begbroke Science Park, Begbroke, OX5 1PF, UK. b Ocean Optics, St. Clements Business Centre, 1-5 London Place, Oxford, OX4 1BD, UK. ABSTRACT Governments often tax fuel products to generate revenues to support and stimulate their economies. They also subsidize the cost of essential fuel products. Fuel taxation and subsidization practices are both subject to fraud. Oil marketing companies also suffer from fuel fraud with loss of legitimate sales and additional quality and liability issues. The use of an advanced marking system to identify and control fraud has been shown to be effective in controlling illegal activity. DeCipher has developed surface enhanced Raman scattering (SERS) spectroscopy as its lead technology for measuring markers in fuel to identify and control malpractice. SERS has many advantages that make it highly suitable for this purpose. The SERS instruments are portable and can be used to monitor fuel at any point in the supply chain. SERS shows high specificity for the marker, with no false positives. Multiple markers can also be detected in a single SERS analysis allowing, for example, specific regional monitoring of fuel. The SERS analysis from fuel is also quick, clear and decisive, with a measurement time of less than 5 minutes. We will present results highlighting our development of the use of a highly stable silver colloid as a SERS substrate to measure the markers at ppb levels. Preliminary results from the use of a solid state SERS substrate to measure fuel markers will also be presented. Keywords: SERS, fuel fraud, silver colloid, solid-state SERS. 1. INTRODUCTION It is estimated that about $800 billion dollars is lost worldwide annually across most industry sectors, including fuels, through illegal malpractices such as counterfeiting, theft, smuggling and product diversion. These trading malpractices can have an adverse effect on industrial and economic growth. In many countries fuel products are taxed to provide revenues to boost their economy and in some countries to subsidize the cost of essential products. Unfortunately, these incentives are usurped by individuals or organized groups who try to profit from evading payment of taxes on fuels consumed or through the illegal use of subsidized fuels. Countries consider implementation of a fuel control program if they levy a high rate of taxation on fuel products and if the income generated contributes a significant proportion to their overall revenue. Implementation of a program may also be considered, particularly by developing countries, if they want to protect internal investment and especially when some of the major investors are the oil-multinational companies. In countries offering fuel subsidies, where the revenue generated is to be used to aid poor communities or particular sectors e.g., farmers, these may also consider the introduction a fuel control program. Other driving forces may also depend upon whether the country is a crude oil importer or exporter and the amount of revenue lost through fuel fraud. With a fuel exporting country lost revenue is much less of a problem compared with a fuel importing country, since the latter will suffer from greater financial difficulties. Protection of a country’s image and international status are also considered to be good reasons for providing a fuel control program and welcomed by oil marketing companies to ensure they can generate revenue, brand and liability protection. Several countries have introduced fuel control programs with fraudulent use confirmed by detection of a marker introduced into fuel products. By introducing a marker at a known concentration this can show if a fuel is non- adulterated or adulterated with another fuel which could be either non-subsidized or subsidized. Furthermore, if a low level of marker is detected this could be indicative of fuel laundering, an illegal practice whereby a chemical or adsorbent material has been added to the fuel in an attempt to remove the marker. Methods of detection that have or are still being used include immunoassay, UV-IR spectroscopy, GC-MS, X-Ray analysis and covert chemicals. *tim@timwilkinson@energenics.co.uk Chemical, Biological, Radiological, Nuclear, and Explosives (CBRNE) Sensing XIV, edited by Augustus Way Fountain, Proc. of SPIE Vol. 8710, 87100G · © 2013 SPIE · CCC code: 0277-786X/13/$18 · doi: 10.1117/12.2018389 Proc. of SPIE Vol. 8710 87100G-1
  • 2. DeCipher Pte Ltd, a company which offers consultancy services to determine how to tackle problems caused by fraudulent fuel marking with expertise in design, implementation and operation of fuel marking systems were aware that these methods of detection were not entirely suitable since, as discussed later, they are unable to meet all the performance criteria required. About three years ago the company became interested in a novel SERS method proposed by Peter White after he had been able to devise a method for producing a very stable and reproducible silver colloid1,2 , critical for any successful commercial SERS application. This SERS method when used in conjunction with a portable Raman instrument, developed in partnership with Ocean Optics, has since proved to be very successful in all aspects of fuel fraud detection. Having demonstrated the advantages of this SERS method over other detection methods, it has now been chosen and implemented by several countries for the detection of fraud in their fuel control programs. Interestingly, although the SERS detection and its potential were recognized over forty years ago, this is believed to be the first major commercial and forensic application of this detection technique. This presentation covers the development of the SERS system, including the portable Raman instrument and suitable markers. Results from field trials are presented, together with examples of multiple marker detection and identification of the illegal practices of fuel adulteration and laundering. Due to proprietary and contractual reasons some details about the SERS reagents, the identity of the markers and information related to the marking protocols used in the field will not be divulged. However, the advantages of this SERS method over the more traditional detection methods will be presented. Finally, some preliminary studies using solid state SERS substrates as an alternative to colloidal silver for producing the surface enhancement effects are also disclosed. 2. THE SERS METHOD 2.1 Development of the SERS system The surface enhancing effect of silver and the resulting increase in sensitivity of Raman signals by up to six orders of magnitude was identified by Fleischmann et.al, in 19743 . When possible to use a laser excitation wavelength close to the max of the analyte (resonance Raman spectroscopy) and combined with this surface enhancement effect (surface enhanced resonance Raman scattering (SERRS) spectroscopy) an overall increase in sensitivity of between ten and fourteen orders of magnitude can be achieved, thus making it one of the most sensitive detection techniques. With the additional advantages of providing molecular information, a high degree of selectivity and ability to measure analytes in either aqueous or organic solutions, SERS was considered an ideal detection technique with many potential applications. Many of these applications used a silver colloid as the SERS substrate and one of the first forensic applications of SERS for the detection of trace levels of colorants was reported by White et.al4 at a SPIE conference in 1998. However, as with many other applications, commercialization was hindered due to the lack of a method to produce a silver colloid that could meet the requirements for SERS spectroscopy. A summary of a SERS spectroscopists meeting reported by Natan5 in 2006 specified the requirements for a suitable substrate and these included acceptable shelf-life, good batch to batch reproducibility, low cost and a high enhancement factor. These problems with production of a suitable silver colloid were overcome when in 2009 White and Hjortkjaer developed and patented1 a method which produced a stable aqueous silver colloid solution that could meet and in most instances exceeded all the required specifications. Having achieved this goal Peter White then proposed and showed, amongst other ideas, the use of this colloid in a novel rapid single tube SERS procedure for the detection and identification of marker(s) at low ppb levels in less than 1 ml of fuel. This was the start of the journey and with DeCipher’s interest, expertise and development work their efforts finally resulted in introducing SERS spectroscopy as a viable method for the detection and monitoring of the fraudulent use of fuels. The single tube analytical method proposed was found to be a robust, reliable and quick procedure that can be used in the field, even by operatives who had no previous scientific experience. The concept behind the use of single tube procedure was based on the knowledge that the negatively charged silver colloidal particles in aqueous solution should aid the extraction of any marker(s) from a fuel sample. Furthermore, when this procedure is performed in a glass vial, a SERS spectrum of the marker(s) present in the aqueous phase can be achieved without any further manipulation of the sample. Typically, a SERS spectrum of a marker present in a fuel sample is prepared for analysis as follows. Silver colloid solution diluted with water (500 µl; colloid/water 30:70) is added to a 1.0 ml screw-capped glass vial which contains an aliquot (500 µl) of the marked fuel. After capping the vial and vortex mixing the contents for 3 x 3 seconds, the sodium chloride aggregating reagent solution (40 µl; 0.175M) is added, the vial capped and inverted twice to mix the Proc. of SPIE Vol. 8710 87100G-2
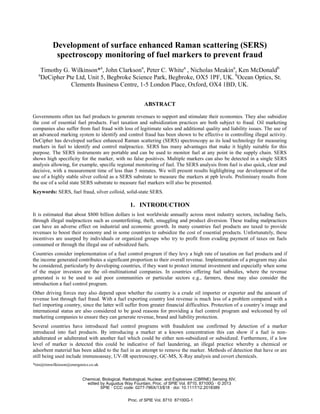
  • 3. J Co stntvs 574 . m 1111,. t .a s components. The vial is then inserted into the SERS instrument to record the spectrum of any marker(s) extracted. Using this method the whole procedure can be completed with a result being obtained in five minutes. 2.2 SERS detection of the marker(s) In order for this SERS method to be acceptable for operation in the field and in the laboratory the detection system had to meet the following requirements;  Be portable and robust.  Operate off a mains or battery supply.  Able to identify and quantify more than one marker.  Capable of producing unique marker(s) spectra.  Provide secure data storage to prevent tampering.  Contain a facility to verify sample.  Capable of being linked to a printer.  Capable of being able to transmit results. Additionally for the field instrument, a major requirement was that it should be able to provide a simple qualitative “Yes/No” output to show which marker(s) are present. Due to the complexity of these requirements and an immediate need for an instrument, a partnership was established between DeCipher and Ocean Optics for the latter to develop a suitable detection system together with the appropriate software to carry out these required tasks. An instrument which is capable of meeting all of these requirements has subsequently been produced and used very successfully in the field. The current instrument together with a screen shot of a marker being detected and identified in a marked fuel sample is shown in Figure 1. Figure 1. The portable SERS instrument developed for use in the field and laboratory for the detection of fuel fraud and a screen shot of the SERS spectrum of a marker being detected and identified in a marked diesel. (© John Wiley & Sons & IM Publications LLP). The excitation source in this instrument is a 30mW, 532nm diode laser and spectra are recorded over 200-2000 cm-1 using a cooled CCD detector. A glass vial containing the prepared sample is inserted into the sample holder and a spectrum is recorded over a scan time of typically 1 x 30 seconds. Control of the instrument, sample identification, collection of data and presentation of results are all processed through software installed on the inboard computer. 2.3 Fuel markers Any analytical method used for the detection of fuel fraud must be capable of detecting a marker or markers in a fuel at < 5% of the marking level. Furthermore if the detection method is to compete for tenders being offered by countries who want to introduce a fuel monitoring program, then it is essential that the markers used must meet other additional and stringent requirements including; Proc. of SPIE Vol. 8710 87100G-3
  • 4.  Being stable in the fuel and carrier solvent.  Having specific detection characteristics with no false positives.  Having no effect on the fuel.  Being detected by a simple and fast test procedure with simple instrumentation.  Being detectable after attempts to laundering with acid, alkali or common absorbents.  Being detectable in a small volume of fuel to reduce volume of waste material.  Exhibiting a low level of degradation in sunlight. Since many thousands of litres of fuels may require marking in a fuel control program, cost and the logistics of marking are major issues. It is not only the cost of the marker that has to be considered but also the cost and volume of carrier solvents used. Hence, an important consideration is the solubility of the marker in the carrier solvent. If for example a marker concentration of typically 100ppb is required, then 10mls of a 1% marker concentrate in the carrier solvent would be needed to disperse the solution into 1000 litres of fuel. In a fuel program the marker can be introduced into and monitored at any point in the fuel supply chain with the marking of fuels being done either manually or by automatic injectors. As identified previously, the silver colloid particles are negatively charged and to achieve the strongest surface enhancement effect the analyte i.e., marker in this case, must be in very close proximity to the silver surface. It is for this reason why the markers used are predominantly cationic as these are attracted to the silver surface. This does to some extent limit the choice of markers, however this has not been a problem as from extensive testing of over two hundred potential markers a significant number have been identified that can meet the above specifications. Ideally, it is preferable that many of these markers also display a max which is close to the laser excitation wavelength in order to benefit from the additional sensitivity gained through the resonance effect. In a fuel marking program more than one marker may be needed. One example is the requirement to be able to differentiate between the sources of a fuel. This is essential if for example a road fuel is subsidized at a different rate to an industrial fuel. More than one marker is also required by a country if they want to mark different fuels such as gasoline, diesel, kerosene or biofuels, or to identify different grades of a fuel or regional malpractice. With this need to detect, identify and quantify multiple markers in the field, this limits severely the number of analytical methods that can be used. A major advantage of DeCipher’s SERS system is that multiple marker detection can be achieved in a single analysis since in a spectrum obtained from a marked fuel it is possible to identify the spectrum of each marker and also quantify the amount of each marker present. 3. SERS DETECTION OF FUEL FRAUD 3.1 Pilot studies Within six months of proof of concept, the SERS system was developed and demonstrated very successfully in several pilot studies carried out in a number of Asian countries. One of these was in a country where an existing diesel marking system was already in operation. Results from samples analyzed using the existing system could therefore be compared directly with those obtained from the SERS system. Of the five hundred samples analyzed it was possible to identify the marker in every sample and no false positives were obtained. Furthermore, the operatives who used both detection systems found the SERS method to be cleaner, faster, provided a permanent record of the data and only wasted 0.5 ml of the fuel. 3.2 Application in the field The success of these pilot studies and confirmation that the system was both robust and reliable, resulted in DeCipher quickly gaining a number of major contracts for the marking of fuels. Subsequently, operation of the SERS system in the field has provided customers with evidence of fuel fraud taking place in their countries. With DeCipher’s own unique multi-marking scheme being used for marking diesel, gasoline, kerosene and biofuels and also different grades of these fuels, cases of fuel fraud have been confirmed, successfully prosecuted and saving governments considerable losses in revenue. It has also been observed that by introducing a successful fuel control program this deters fuel fraud and hence loss of revenue. Proc. of SPIE Vol. 8710 87100G-4
  • 5. 2000 - 1500 - >,... c 1000 0 c INDUSTRIAL DIESEL - Marker X e I V 500 W_ L__ 0 200 600 1000 1400 1800 Wavenumbers (cm"') 3000 2500 >, 2000 c 1500 ç 1000 500 0 200 AUTOMOTIVE DIESEL - Marker Y 600 1000 1400 1800 Wavenumbers (cm') MIXED DIESELS - Markers X and Y 2500 - 2000 - 200 600 1000 1400 1800 Wavenumbers (cm'') As explained earlier, more than one marker is required if wanting to differentiate between different fuels or grades of fuels. An example of the latter is required when one grade of a fuel is taxed or subsidized at a different rate to another grade. Hence when fuel stations are suspected of selling a lower grade of gasoline from pumps which should be delivering premium grade gasoline, marking each grade of fuel with a different marker will confirm if any malpractice is taking place. Another scenario where multiple markers are used in some countries is when industrial diesel is taxed or subsidized at a different rate for automotive diesel. As illustrated in Figure 2, by marking the industrial diesel with one marker (Marker X) and the automobile diesel with another (Marker Y), then by monitoring samples of diesel in automobile fuel tanks, the presence of Marker X or both markers confirms the fraudulent use of the industrial diesel. Figure 2. An example showing the advantage of being able to identify more than one marker in a single SERS analysis. The spectra obtained shows that sample taken from an automobile tank contains two markers and is a mixture of industrial diesel which contains Marker X and an automotive diesel which contains Marker Y This ability to detect and quantify the individual markers in a mixture of markers in single analysis and in the field, has been recognized as a major advantage of the SERS detection method over other analytical methods used previously and why it is being selected for fuel monitoring programs. Detection of fuel adulteration is often a requirement of some fuel control programs, especially if a subsidized fuel is being used to dilute a non subsidized fuel. An example encountered is where kerosene, a subsidized fuel, is used to dilute highly taxed and unsubsidized diesel. To detect this malpractice then either fuel could be marked or alternatively both are marked with a different marker. In the example shown in Figure 3 the kerosene had been marked at a level 200pb and detected in a sample of unmarked diesel thus showing the diesel had been diluted with kerosene. Proc. of SPIE Vol. 8710 87100G-5
  • 6. 200 600 1000 1400 YyIYeSMmbeSt (G4S4i) 1800 Figure 3. An example of adulteration where a diesel sample (unmarked) is found to contain a marker used in kerosene. The lower spectrum is from a diesel/kerosene mixture (90:10) but contains no marker in the kerosene. (© John Wiley & Sons & IM Publications LLP). Quantifying the amounts of a marker or markers present with the SERS system is achieved by using algorithms based on the ratio of the intensities of the SERS signals. When following the standard operating procedure for sample preparation and analysis reproducible quantification is achieved over a marking range of c.a., 1.0 to100%. In the above example it was determined that the diesel contained about 10% of kerosene. This example illustrates the sensitivity of the SERS method as the marker concentration has been reduced to about 20 ppb in the adulterated diesel sample. With the majority of markers used in the field these provide identifiable spectra at levels of ca., 1ppb. This ability to identify markers at this level is essential because when analyzing fuel samples that have been laundered by the addition of chemicals or adsorbents, the markers may only be present at these trace levels. The results presented in Figure 3 also highlight another advantage of using the SERS method for the detection of fuel fraud. As with diesel many fuels either fluoresce and/or contain additives that fluoresce and this phenomenon can produce problems with some of the other fuel monitoring analytical techniques. In traditional Raman spectroscopy fluorescence it is also a major problem as it swamps any surface enhanced signals. However, with SERS spectroscopy the silver colloid quenches fluorescence, as identified by the low background in spectra and furthermore, with little or no contribution from any of the additives of fuel components this shows the excellent selectivity of this technique. COMPARISON OF SERS WITH OTHER ANALYTICAL METHODS A variety of analytical methods have been developed for monitoring the fraudulent use of fuels with some still currently in use and a comparison between these and this novel SERS based method is shown in Table 1. Table 1. A comparison of the analytical methods used to detect markers in fuels. Analytical Detection Method Comments SERS Technology  Instrument based.  Sensitive. Gives specific fingerprint.  Detection and quantification of multiple markers in a single analysis.  No false positives. Quick analysis time. Immunoassay  Visual test for each marker.  Sensitive and specific. Covert Chemicals  Simple test – visual or instrument.  Non-specific. UV-IR Spectroscopy  Non-specific instrument based test.  Quantification is fuel dependent. GC-MS  Large instrument. Cost. X- Ray  Large instrument. Cost. Proc. of SPIE Vol. 8710 87100G-6
  • 7. With demands for more complex fuel monitoring programs there is a greater need for systems that can detect and quantify multiple markers with portable instrument based methods that can be used in the field. Instrument, operating, marker and consumable costs, low detection limits, and good selectivity are also very important criteria when a country is selecting a method. From the results presented above and the comments in Table 1, it is possible to see the advantages gained in using this new SERS detection method and why this method is being selected and used. 4. SOLID-STATE SERS SUBSTRATES Solid-state SERS substrates used as dipsticks have been explored as a method of monitoring marker in fuels. Table 1 lists advantages and disadvantages of colloidal substrates compared to solid-state substrates for measuring fuel markers. Currently, commercially available solid state SERS substrates are prohibitively expensive and some have relatively low enhancement factors. A recent review of low cost SERS substrates show these can be produced using much cheaper and simpler methods6 . The advantages of solid state substrates include, simplicity of use compared to colloid substrates and a direct measurement of markers in fuel. DeCipher has obtained promising results from a low cost, solid state SERS substrate and together with Ocean Optics are in early stage development of this substrate, instrumentation and marker chemistry towards a solid-state SERS fuel marker product. This development will increase the choice of fuel markers. Table 2. Comparison of the advantages and disadvantages of colloidal and solid-state SERS substrates for measuring fuel markers. SERS SUBSTRATE ADVANTAGES DISADVANTAGES COLLOID • There is a proven Working System for fuels. • Quick results, < 3 mins. • Quantitative. • Inexpensive. • Reproducible. • Long shelf-life time. • SERS observed for a limited time due to aggregation. • Not a direct measurement and reagents need to be added to develop SERS. SOLID STATE • Simple measurement using a “dip-stick”. • Markers measured directly in fuel. • SERS can be measured days after initial measurement. • New substrates reported to have high enhancement factors, comparable to colloid, enabling low detection limits • Method can be automated for bulk laboratory analysis. • No Working System in the market suitable for detection of markers in fuels. • Not known whether the sensitivity of solid- state substrates match colloidal systems. • SERS signal may take a relatively long time to develop e.g., > 10 mins. • Reproducibility and shelf-life time unknown. 5. CONCLUSIONS A SERS detection method using a portable instrument has been successfully developed, implemented in the field and shown to have considerable advantages over other methods currently used for the detection of fuel fraud. A novel single tube sample preparation scheme which uses the properties of a stable silver colloid provides an overall analysis time of typically five minutes. Both qualitative and quantitative analyses of markers in all types of fuel can be obtained when present at levels down to 1-10 ppb thus highlighting the sensitivity of the detection system and hence making it possible to detect the malpractices of fuel adulteration and laundering. One of the other major advantages of this technique is the high degree of selectivity that can be achieved and this enables identification and the quantification of multiple markers in fuels in a single analysis. Proc. of SPIE Vol. 8710 87100G-7
  • 8. Since adopting this SERS monitoring system as the lead technology for fuel control programs in several countries, the results obtained have provided evidence which has resulted in successful prosecutions. Interestingly, this is believed to be the first major commercial and forensic application of SERS and only made possible due to a method developed recently for production of a stable and reproducible silver colloid, an essential component for any commercial application of SERS spectroscopy. More recently the company has started to evaluate the potential of using solid-state SERS substrates as these should be able to extend the range of markers that can be used. Finally, this success cannot be attributed solely to development and use of this novel detection method. DeCipher’s expertise in determining how to tackle problems in monitoring fuel fraud, the marking of fuels and the design, implementation and operation of fuel marking systems are just as important. Furthermore, since the company’s senior personnel are responsible for the infrastructure and sub-contracting of operational manpower, DeCipher is also able to provide an integrated operations system of controlled marking, linking terminal deliveries to retail site receipts and managing an active surveillance/testing program. The silver colloid patent referred to in this paper is owned by the University of Lincoln, UK. REFERENCES 1. White, P.C. and Hjortkjaer, J,H., “Preparation of metal colloids”, International Patent Application, PCT WO 2009/081138 A1, (2009). 2. White, P.C. and Hjortkjaer, J,H., “Preparation and characterisation of a stable silver colloid for SERS spectroscopy”, Phys.Chem. Chem.Phys. Submitted for publication. 3. Fleischmann, M., Hendra, P.A. and McQuillan, A.J., "Raman spectra of pyridine adsorbed at a silver electrode", J.Chem.Phys.Lett., 26, 163-166, (1974). 4. White, P.C., Rodger, C., Rutherford, V., Finnon, Y., Smith, W,E. and Fitzgerald, M., “Surface enhanced resonance Raman scattering (SERRS) spectroscopy. A powerful technique for the forensic analysis of colourants?”, Proc. SPIE 3576, 77-86, (1998). 5. M.J. Natan, M.J., “Concluding remarks – Surface enhanced Raman scattering”, Faraday Discuss., 132, 321-328, (2006). 6. L. Polavarpu and L.M. Liz-Maran., “Towards low-cost flexible substrates for nanoplasmonic sensing”, Phys. Chem. Chem. Phys, 15, 5288-5300, (2013). Proc. of SPIE Vol. 8710 87100G-8