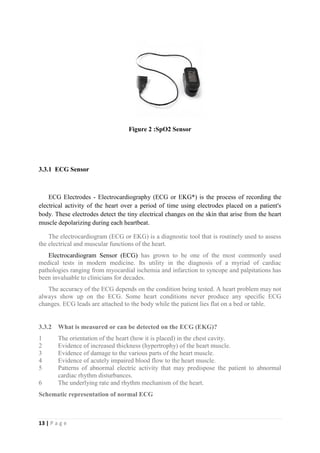
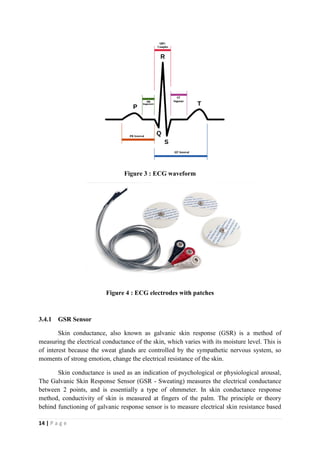
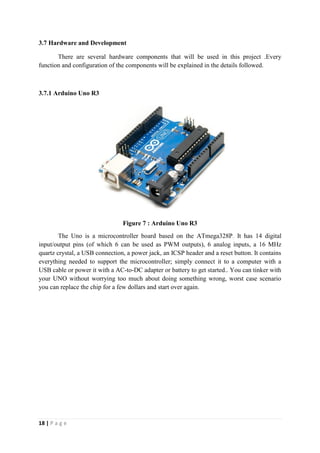
This document describes a proposed health monitoring companion device that would measure various health parameters for users through sensors. It would use an Arduino Uno microcontroller connected to an e-health sensor shield with four sensors: ECG to measure heart rate, temperature to measure body temperature, GSR to measure skin conductance, and SpO2 to measure blood oxygen levels. Readings would be displayed on a graphical LCD and sent to an Android application. The goal is to help users monitor their health at home without needing to visit medical facilities by making the device simple to use and understand.


![11 | P a g e
can be summarized in a) custom-made therapy) early diagnosis, c) schedule of next
appointment by letting the facts decide, d) monitoring in the home environment, e)
monitoring in everyday activities.
3.0 METHODOLOGY AND MATERIAL
3.1 Sensors Review
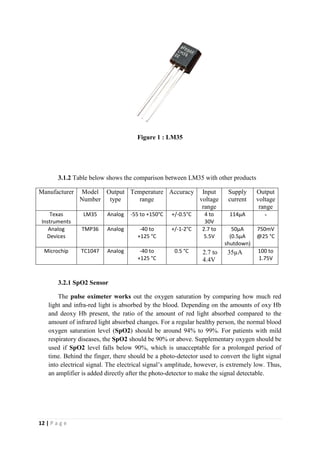
3.1.1 Body Temperature
Temperature Sensor that will be used in this project is LM35 . The sensor work by
reading the value of from Analog ADC input of Arduino Uno R3. The LM35 series are
precision integrated-circuit temperature devices with an output voltage linearly-proportional
to the Centigrade temperature. The LM35 device has an advantage over linear temperature
sensors calibrated in Kelvin, as the user is not required to subtract a large constant voltage
from the output to obtain convenient Centigrade scaling. The LM35 device does not require
any external calibration or trimming to provide typical accuracies of ±¼°C at room
temperature and ±¾°C over a full −55°C to 150°C temperature range. Lower cost is assured
by trimming and calibration at the wafer level. The low-output impedance, linear output, and
precise inherent calibration of the LM35 device makes interfacing to readout or control
circuitry especially easy. The device is used with single power supplies, or with plus and
minus supplies. As the LM35 device draws only 60 µA from the supply, it has very low self-
heating of less than 0.1°C in still air. The LM35 device is rated to operate over a −55°C to
150°C temperature range, while the LM35C device is rated for a −40°C to 110°C range (−10°
with improved accuracy). The LM35-series devices are available packaged in hermetic TO
transistor packages, while the LM35C, LM35CA, and LM35D devices are available in the
plastic TO-92 transistor package. The LM35D device is available in an 8-lead surface-mount
small-outline package and a plastic TO-220 package.
Arduino Uno R3 is working under 10-bit specification which is 2^10=1024.By
connecting the sensor to the 5V input , the formula used is : Voltage at pin in milliVolts =
(reading from ADC) * (5000/1024) .Then, to convert millivolts into temperature, use this
formula:Centigrade temperature = [(analog voltage in mV) - 500] / 10](https://image.slidesharecdn.com/technicalproposalfyp-160519190449/85/Technical-proposal-fyp-12-320.jpg)