This document provides a synopsis for a proposed dissertation on developing a real-time multi-channel wireless health monitoring system. The system will monitor electrocardiogram (ECG), blood pressure, body temperature, and blood pH from patients. The data will be transmitted wirelessly and viewed by doctors on a computer interface. Doctors will be able to select a patient and view their health parameters in real-time. They will also be able to send a patient's data to specialists for advice when needed. The proposed work will involve collecting sensor data, transmitting it wirelessly, developing processing and display software, and evaluating the system.
![Date: 21/08/2015 Student Sign Guide Sign
Page 4/15
11.3 PRESENT THEORIES AND PRACTICES
Now a day’s PHILIPS made one device named as “PHILIPS – Efficia ECG 100”. This
device is used to storing and transferring the ECG wave data. As these device is used for only
one parameter and it is cost effective, so I want to design such system which is used for more
than one parameter and which is having minimum cost as compared to PHILIPS – Efficia ECG
100. The figure no.1 is of PHILIPS – Efficia ECG 100.
Fig.1 PHILIPS – Efficia ECG 100
In Rubby Hall and Dinanath Hospital, Pune one system is present for transferring
patient’s data from patient’s room to the doctors’ cabin. In this system ZigBee is used for
transferring the data. ZigBee is having only 200 m range which is very less as compared to
whole area of Hospital. So for getting whole area to be under such system more number of
ZigBee required which is very costly.
In CISCO, Bangalore there is one hospital for their employee in campus. This hospital is
connected to other major hospitals in Bangalore. The report of employee is send using internet
to that major hospital to get proper decision. There is no live streaming of data. Data is first
stored and then it sent to other hospitals.
11.4 LITERATURE REVIEW
[1] KhalifaAlSharqi, AbdelrahimAbdelbari, and Mohammed Tarique, [1]: Author has
designed a ZigBee based wearable remote healthcare monitoring system for elderly
patients. This system is able to monitor the body temperature, heart pulse rate, ECG
signal, and muscle power.
[2] N. H. Lovell, F. Magrabi, B. G. Celler, K. Huynh, and H. Garsden [2]: Author has
designed web-based system for asynchronous multimedia messaging between shoulder
replacement surgery patients at home and their surgeons was developed and tested. A
web-based messaging system, called E-Medicine, was developed that allows patients to
easily send multimedia information such as video and audio, to their physicians.](https://image.slidesharecdn.com/a1657b33-446f-440d-a340-1d4b7f56c0b6-151003072713-lva1-app6891/75/Health-Monitoring-4-2048.jpg)
![Date: 21/08/2015 Student Sign Guide Sign
Page 5/15
[3] Toshiyo Tamura, Isao Mizukura, and Masaki Sekine [3]: Authors were investigated
changes in blood pressure with exercise, including walking and ergometer training, sleep,
and body weight. Blood pressure was monitored over a period of about 1 year in 61
subjects in Osaka, Japan. The morning systolic blood pressures were analyzed using
multivariate regression analysis, and the correlations between systolic blood pressure and
the above parameters were determined.
[4] Sakari Junnila, Harri Kailanto, Juho Merilahti, and Antti-Matti Vainio [4]: Authors
were proposed a general purpose home area sensor network and monitoring platform that
is intended for e-Health applications, ranging from elderly monitoring to early
homecoming after a hospitalization period. The system consists of a chosen set of
sensors, a wireless sensor network, a home client, and a distant server. They evaluated
concept in two initial trials: one with an elderly woman living in sheltered housing, and
the other with a hip surgery patient during his rehabilitation phase.
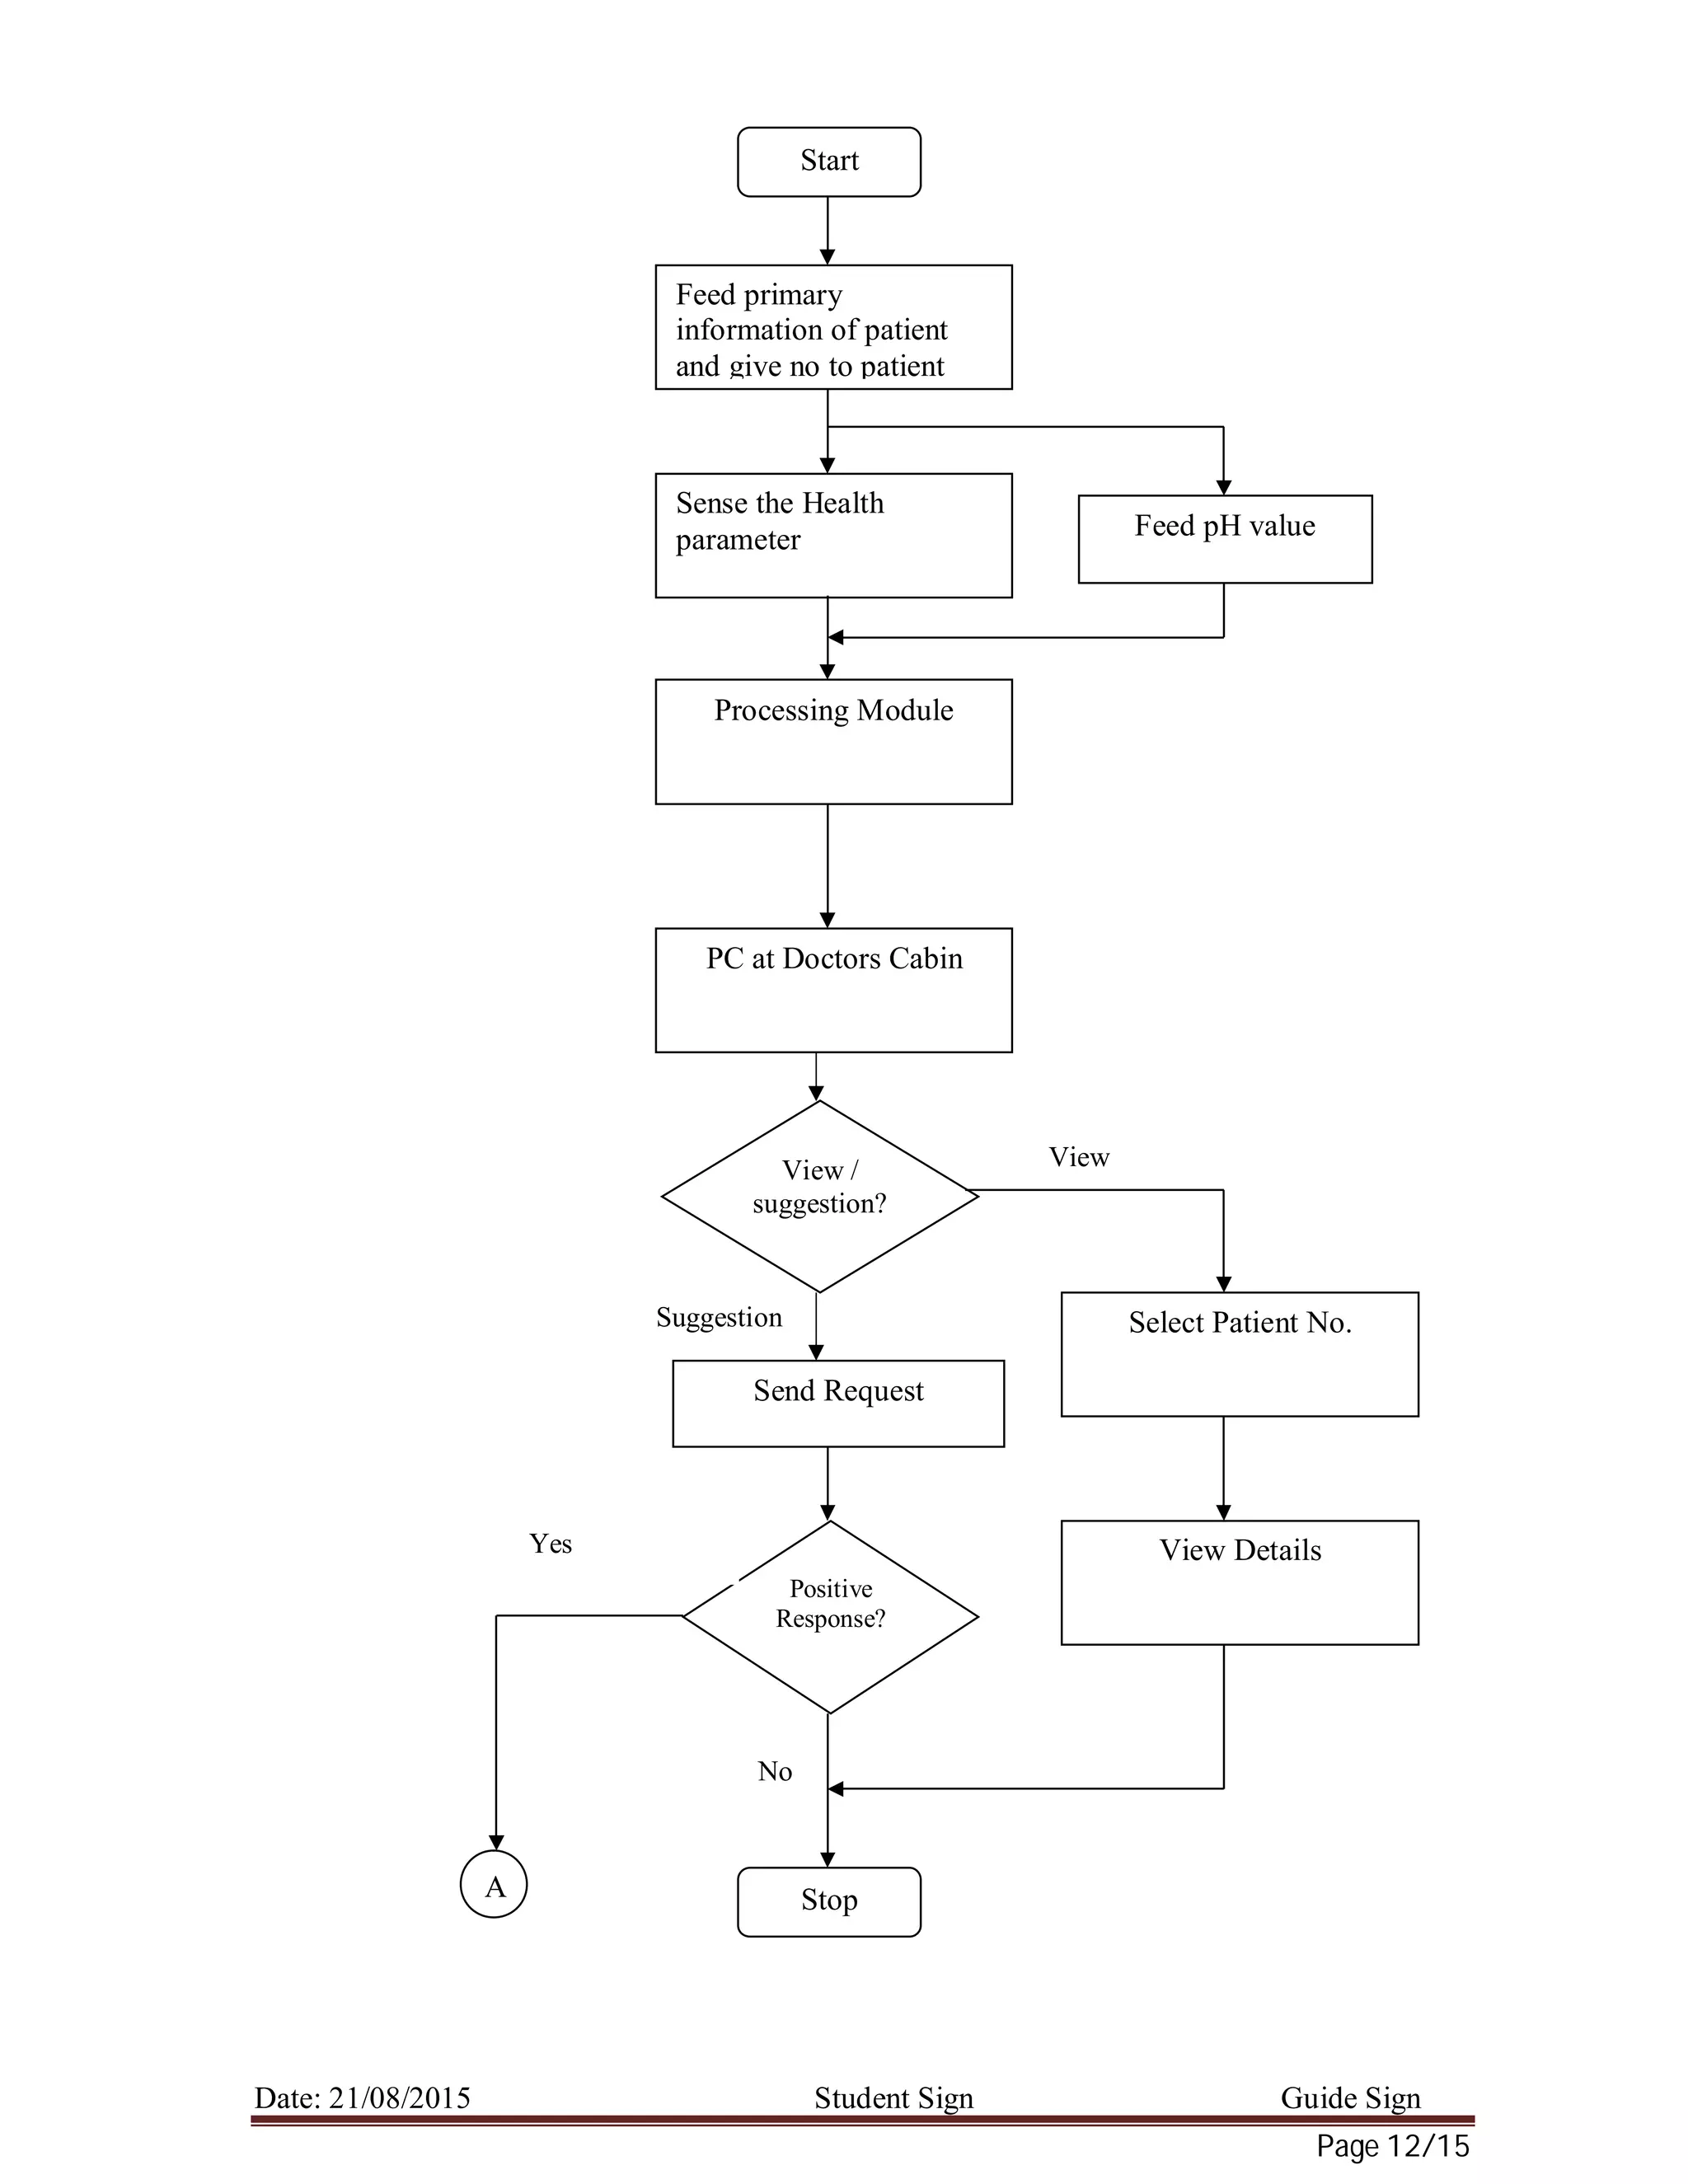
11.5 Problem statement
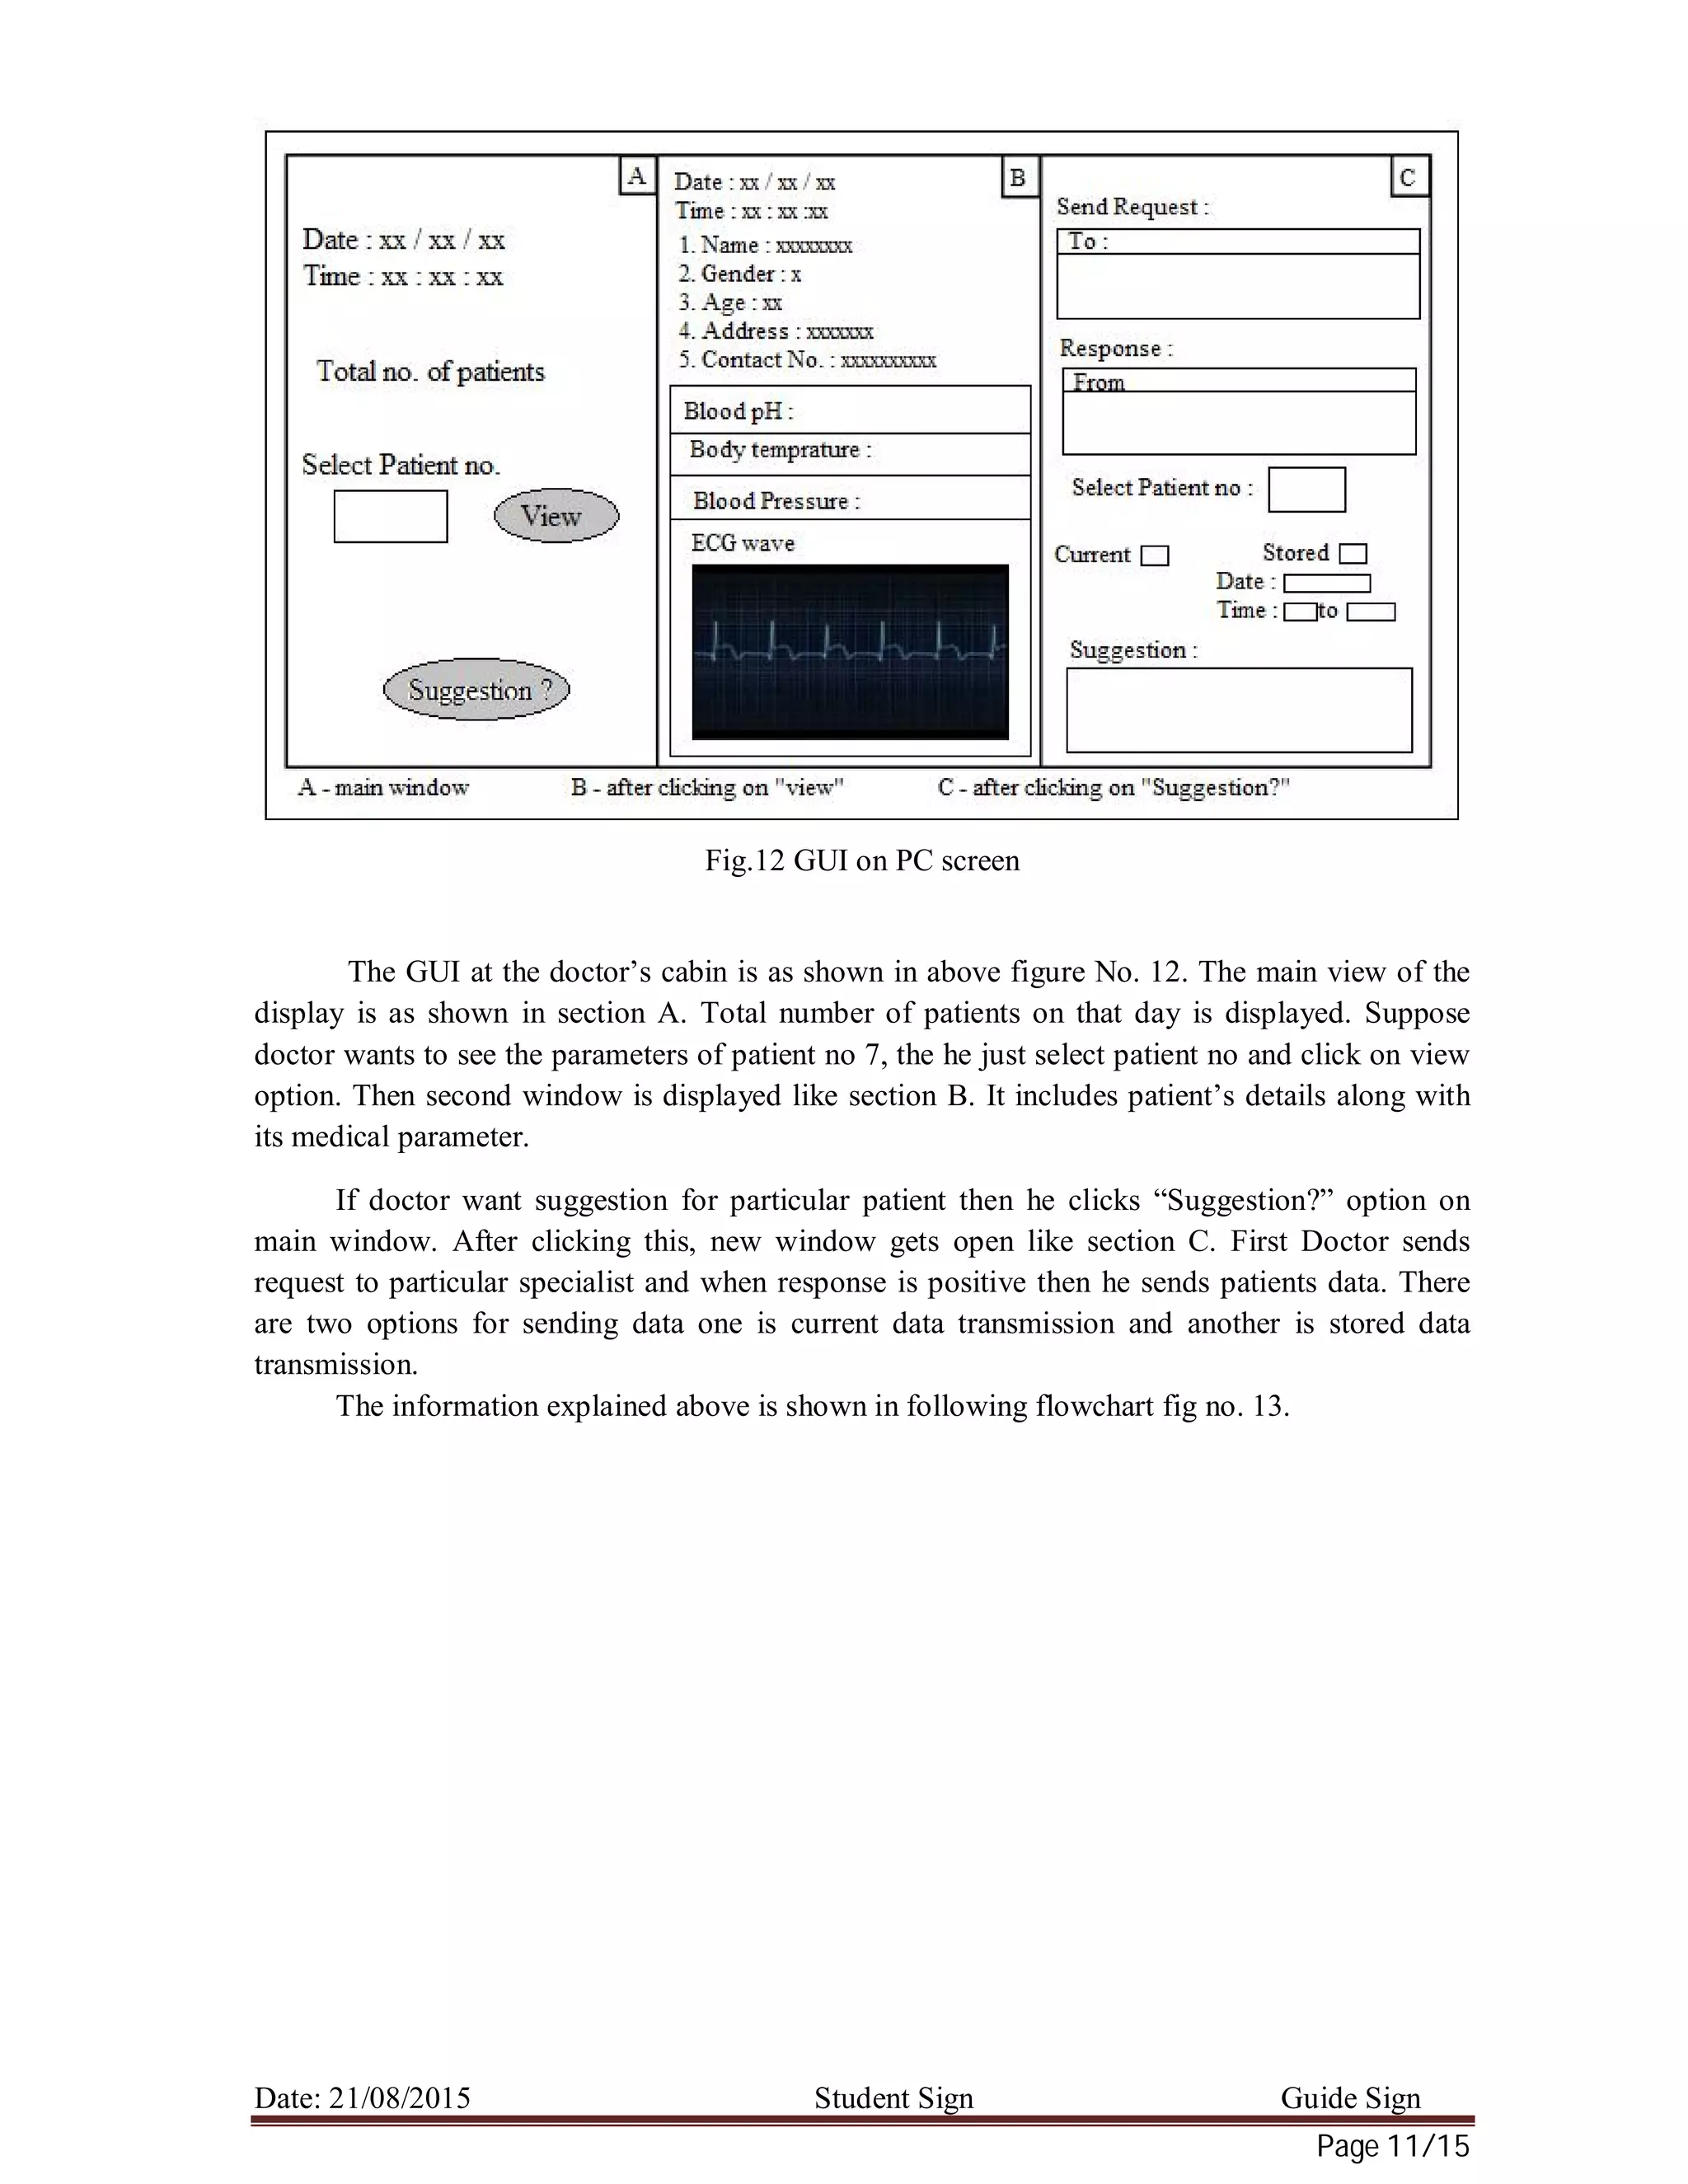
The proposed system is used to monitor health parameters like ECG signal, blood
pressure, body temperature, and blood pH. All these health parameters are sensed and using time
division multiplexing they are connected to the PC of Doctor through processor module using
wired connection. Doctor can view details of any patient and also he can send current data or
stored data of any patient to get suggestion from specialist in real time.
Objectives
1. Collection and storage of health parameter of all patients with a backup of 24 hours
2. Display all parameter information of selected patient on PC screen
3. Sending data for expert advice
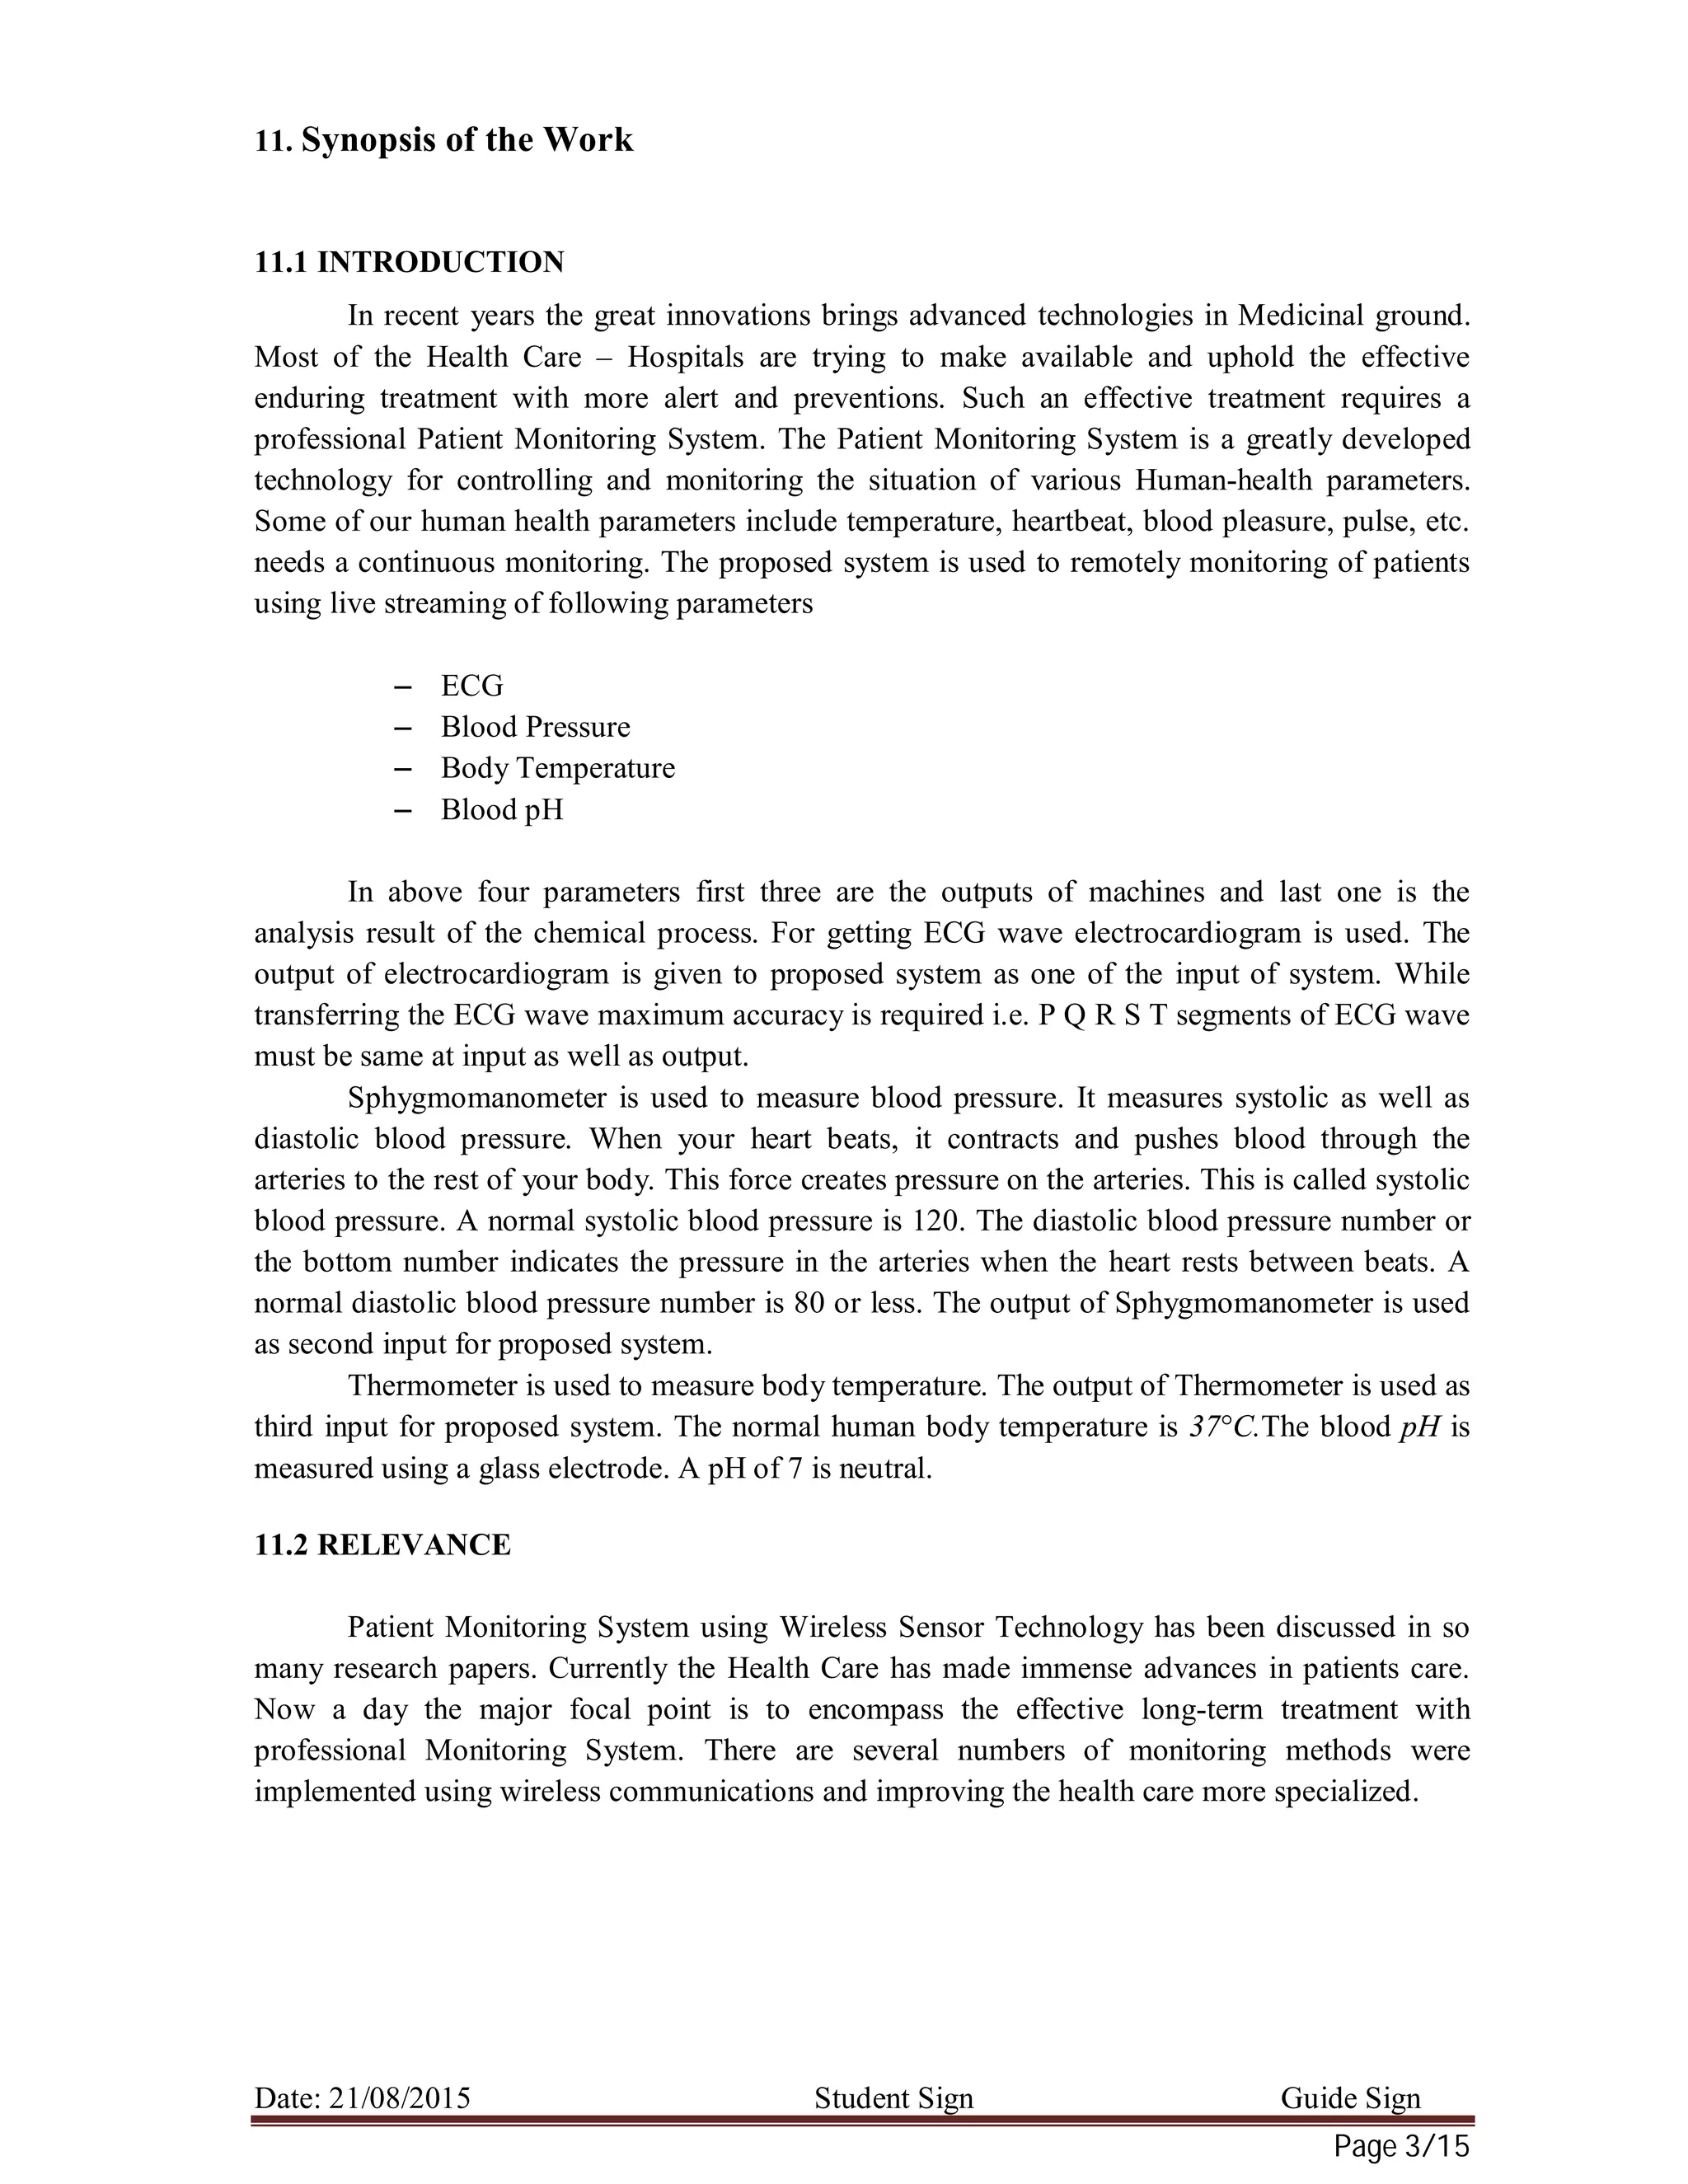
11.6 PROPOSED WORK:
a. Theoretical Analysis (Analytical Treatment)
The primary information of patient like name, age, address and contact details are feed at
the reception and particular number is given to patient. The PC which is at Doctors’ cabin gets
combined information from reception and ICU department. At the doctors PC there is option for
selecting the patient. If suppose patient no. 3 is selected then combination of all data from
reception and the ICU of that particular patient, displayed on that PC.
If suppose doctor was unable to understand the problem of particular patient then he first
send a message to particular specialist for asking are they free or not. If he is free then
information of particular patient is send to that specialist. After receiving the information,
specialist analyses this data and gives proper suggestion to doctor.
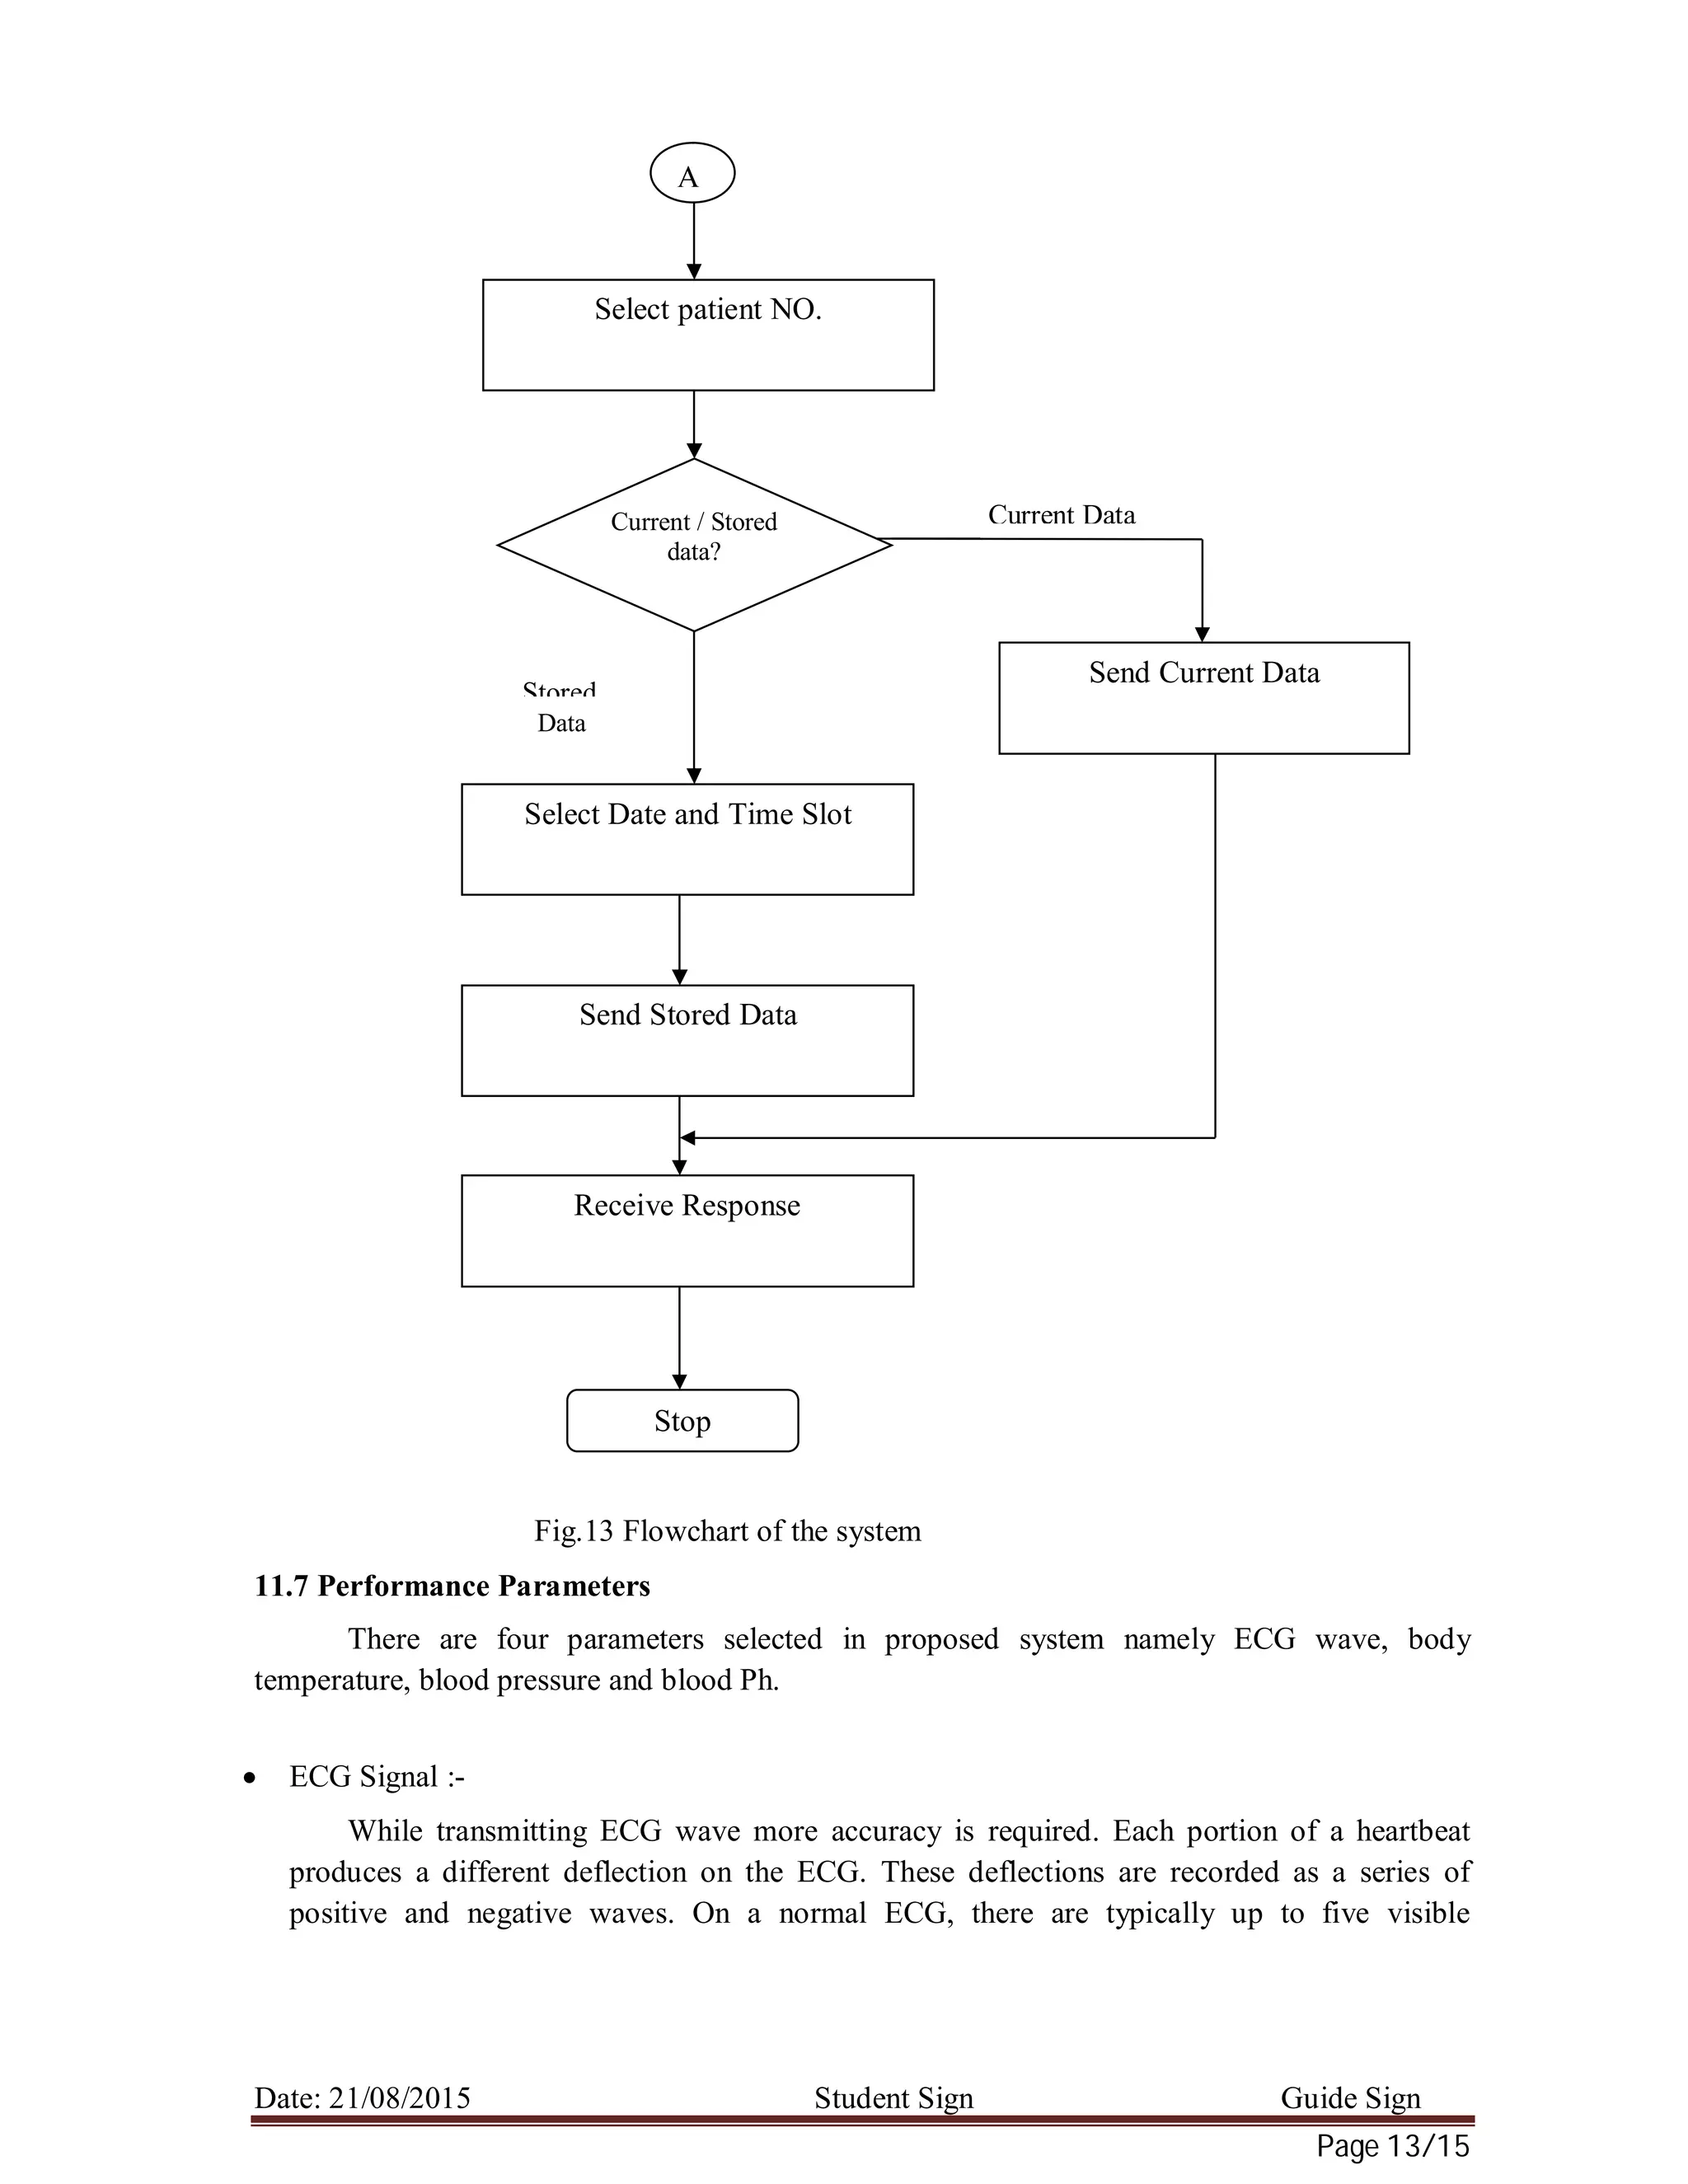
If doctor is unable to understand the problem of any patient in between sometime interval,
then he can also send the stored data.](https://image.slidesharecdn.com/a1657b33-446f-440d-a340-1d4b7f56c0b6-151003072713-lva1-app6891/75/Health-Monitoring-5-2048.jpg)
![Date: 21/08/2015 Student Sign Guide Sign
Page 8/15
Fig.5 ECG amplification and Filtering
1. Electrodes/ Sensors
For sensing the health parameter sensors are required. For sensing body temperature,
temperature sensor is required. There are many different types of temperature sensor available
and all have different characteristics depending upon their actual application. A Temperature
Sensor consists of two basic physical types: Contact and Non-contact Temperature Sensor.
There are so many body surface bio potential electrodes are available. Metal-plate
electrodes are used for application to limbs. Metal-disk electrodes are applied with surgical tape.
Disposable foam-pad electrodes are often used with electrocardiographic monitoring apparatus.
The Blood Pressure Sensor is a non-invasive sensor designed to measure human blood
pressure. It measures systolic and diastolic blood pressure.
2. Amplifier stage
ECG Amplifier:
Figure 6 shows the circuitry of ECG amplifier. The ECG amplifier has a gain of 25 in the
dc-coupled stages. The frequency response is 0.04 – 150 Hz for ± 3dB and is flat over 4 – 40 Hz.
The gain and frequency response are two important variables that relate the amplifier to the
particular signal. The offset potential is coupled direct to input, so it could saturate high gain
preamplifiers. To eliminate the saturation effect of DC potential, the preamplifier can be
capacitor coupled to the remaining amplifier stage [B1].
The gain of the amplifier is calculated using following equation no.1
= (1 + 2 ) …………………………..………………………… (1)
Fig.6 ECG amplifier](https://image.slidesharecdn.com/a1657b33-446f-440d-a340-1d4b7f56c0b6-151003072713-lva1-app6891/75/Health-Monitoring-8-2048.jpg)
![Date: 21/08/2015 Student Sign Guide Sign
Page 9/15
3. Driven-Right-Leg System
The circuit shown in figure 7 provides some electric safety. If an abnormally high voltage
should appear between patient and ground as a result of electric leakage or other cause, the
auxiliary op amp in figure 7 saturates. This effectively undergrounds the patient, because the
amplifier can no longer drive the right leg [B1].
Fig.7 Driven-Right-Leg System
4. Filter stage
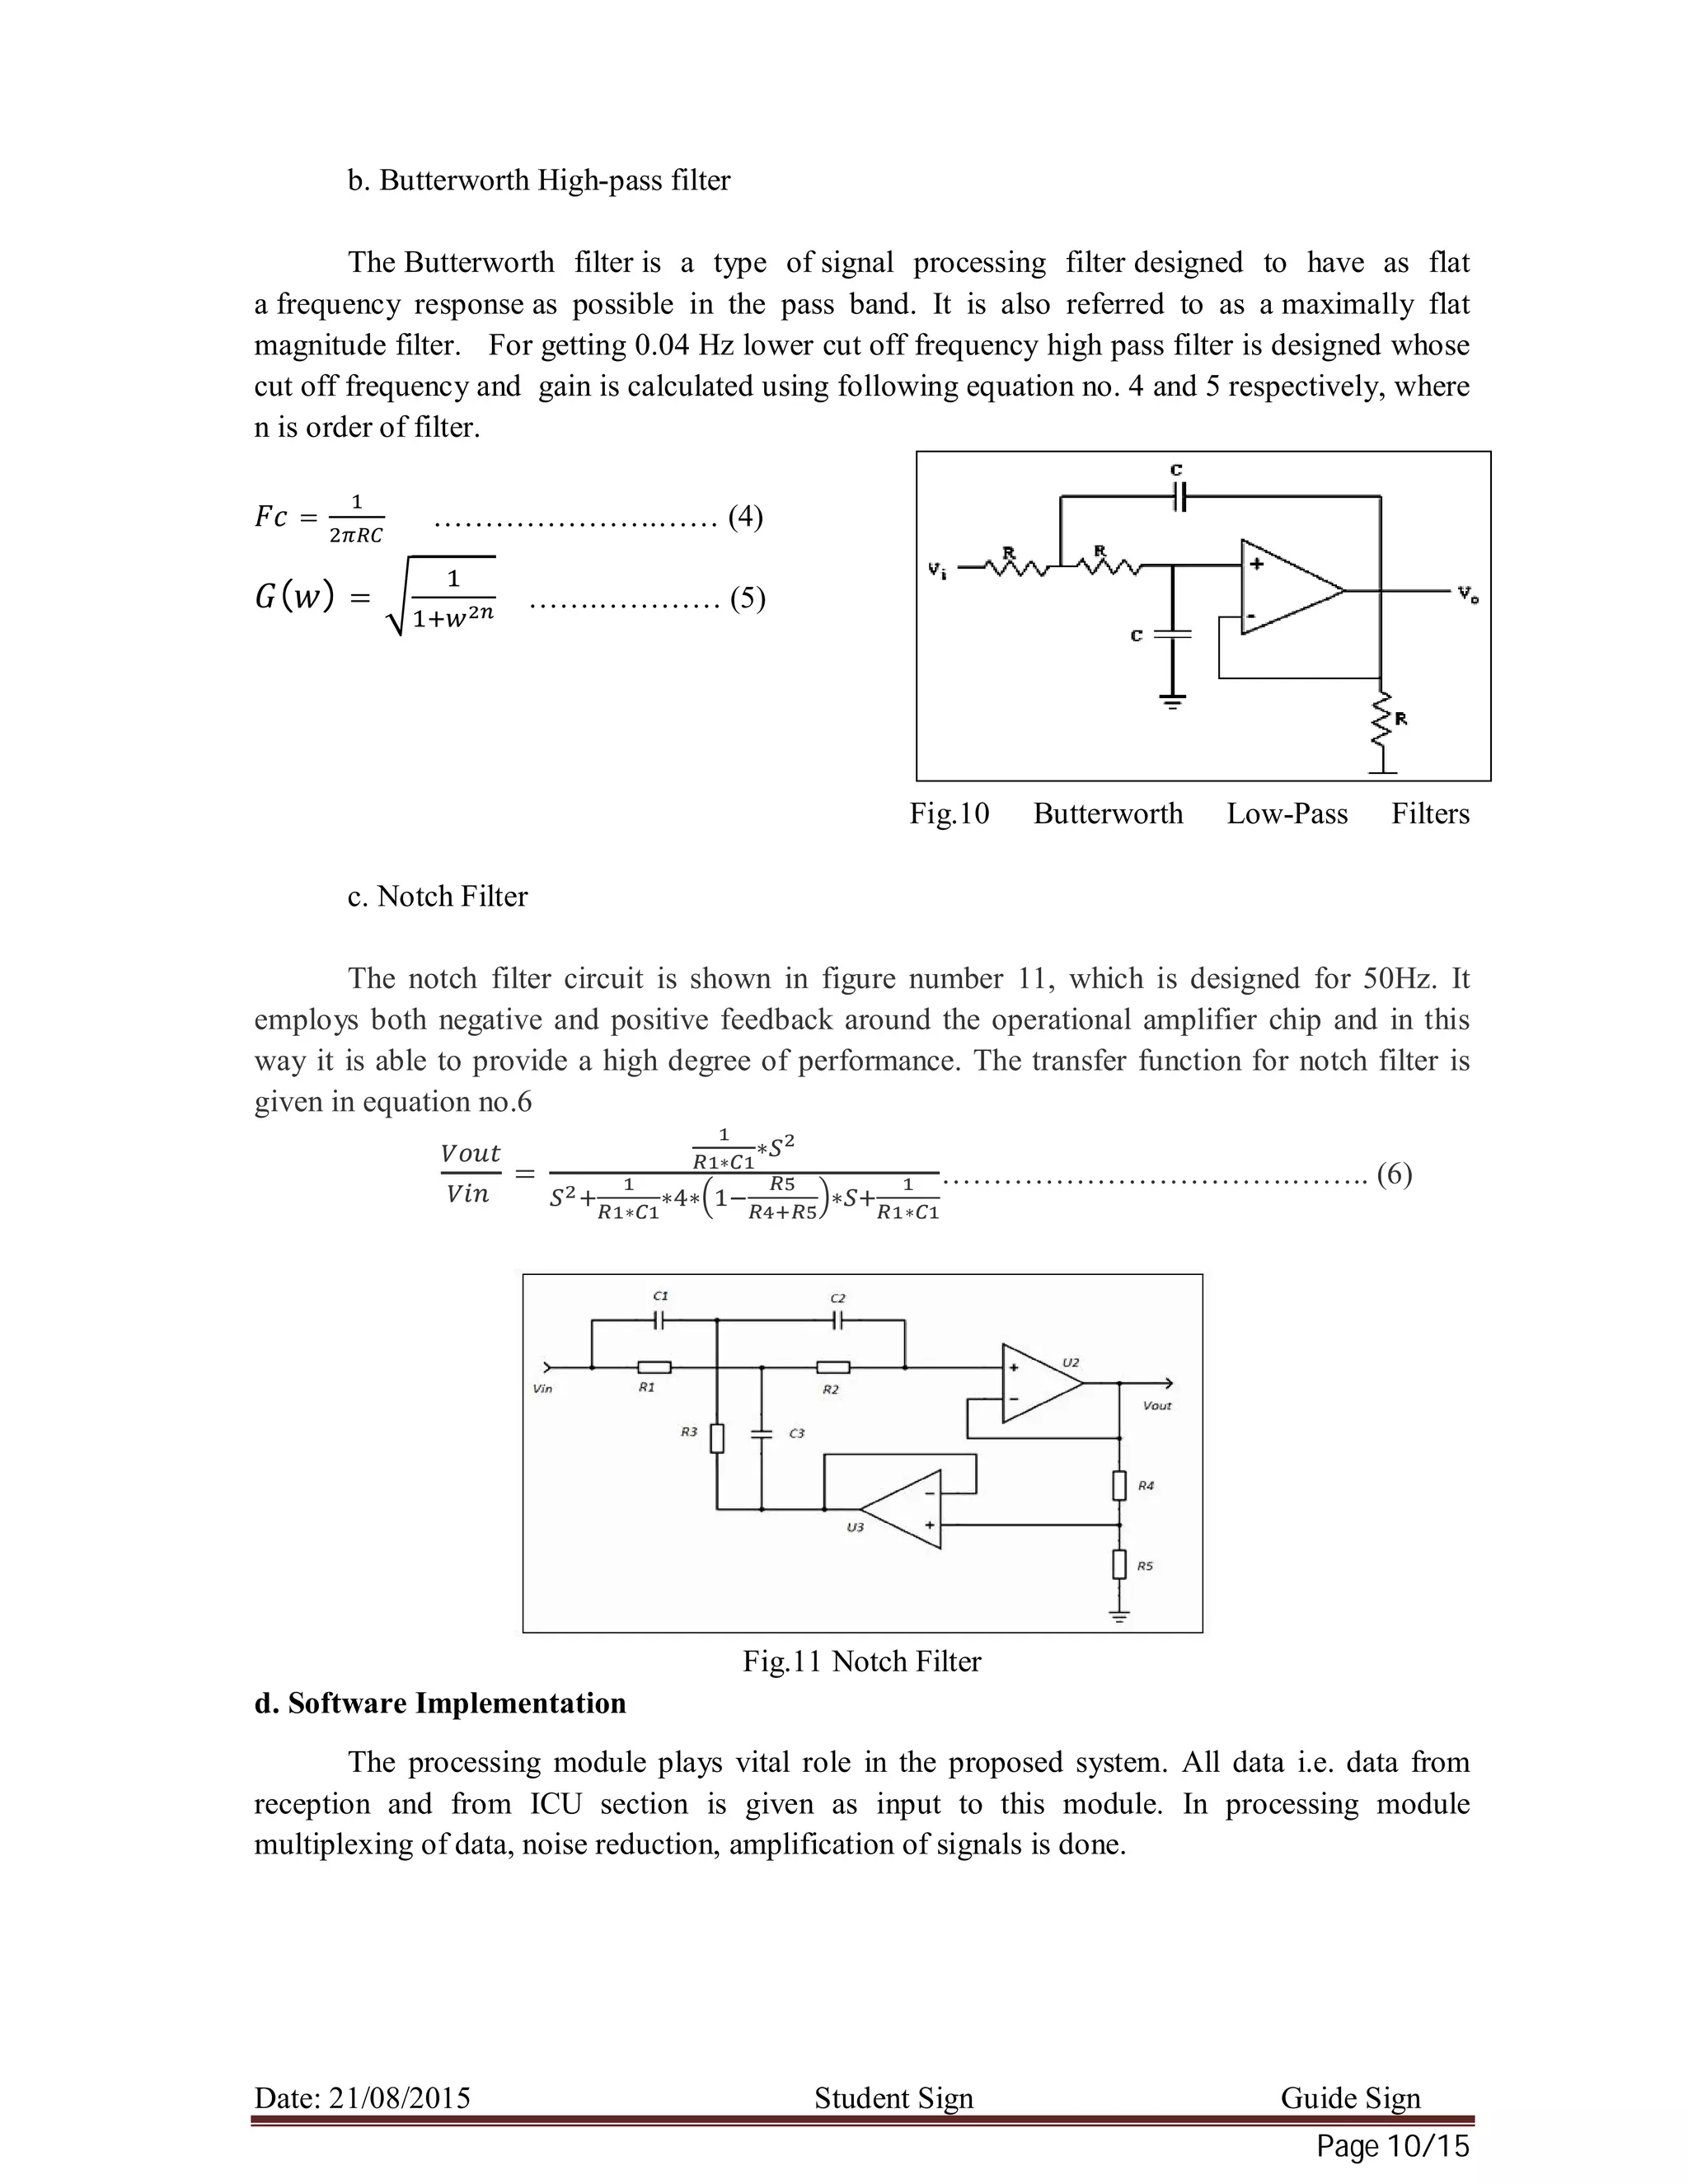
a. Butterworth low-pass filter
The Butterworth low-pass filter provides maximum pass band flatness. Therefore, a
Butterworth low-pass is often used as anti-aliasing filter in data converter applications where
precise signal levels are required across the entire pass band. Figure 9 plots the gain response of
different orders of Butterworth low-pass filters versus the normalized frequency axis, the higher
the filter order, the longer the pass band flatness. Butterworth low pass filter in figure no. 8 is
designed for getting upper cut off frequency of 150Hz. The cut off frequency and gain of
Butterworth low pass filter is calculated using following equation no.2 and 3 respectively, where
n is the order of filter.
= …………………….…………………………………………… (2)
( ) = ………………….……………………………………. .(3)
Fig.8 Butterworth Low-Pass Filters
Fig.9 Amplitude Responses of Butterworth
LPF](https://image.slidesharecdn.com/a1657b33-446f-440d-a340-1d4b7f56c0b6-151003072713-lva1-app6891/75/Health-Monitoring-9-2048.jpg)
![Date: 21/08/2015 Student Sign Guide Sign
Page 15/15
11.11 PROJECT TIME LINE ACTION PLAN:
Activity
Month
Year 2015 Year 2016
July Aug Sep Oct Nov Dec Jan Feb Mar Apr May
Literature Survey and
Review
Synopses Preparation
Data collection
Data display
graphically using GUI
Paper Publication
Add internet facility
Performance
Parameter
measurements
Result Analysis
Result analysis and
improvement if any
suggested
Paper Publication
Report writing
11.12 REFERENCES:
Journal / Conference Papers/Thesis:
[1] KhalifaAlSharqi, Abdel Rahim Abdelbari, Ali Abou-Elnour, and Mohammed Tarique,
“Zigbee based wearable remote healthcare monitoring system for elderly patients”,
International Journal of Wireless & Mobile Networks (IJWMN), vol. 6, no. 3, June 2014.
[2] N. H. Lovell, F. Magrabi, B. G. Celler, K. Huynh, and H. Garsden, “Web based
acquisition, storage, and retrieval of biomedical signals,” IEEE TRANSACTIONS ON
BIOMEDICAL ENGINEERING, vol. 20, no. 3,pp. 38–44, May/Jun. 2001.
[3] Toshiyo Tamura, Isao Mizukura, Masaki Sekine, “Monitoring and Evaluation of Blood
Pressure Changes With a Home Healthcare System”, IEEE TRANSACTIONS ON
INFORMATION TECHNOLOGY IN BIOMEDICINE, vol. 15, no. 4, July 2011.
[4] Sakari Junnila, Harri Kailanto, Antti Vehkaoja, Mari Zakrzewski, and Jari Hyttinen, “Wireless,
Multipurpose In-Home Health Monitoring Platform: Two Case Trials”, IEEE
TRANSACTIONS ON INFORMATION TECHNOLOGY IN BIOMEDICINE, vol. 14, no.2,
March 2010.
[5] Balkine Khaddoumi, Hervé Rix, Małgorzata Fereniec, and Roman Maniewski, “Body
Surface ECG Signal Shape Dispersion”, IEEE TRANSACTIONS ON BIOMEDICAL
ENGINEERING, vol. 53, no. 12, Dec 2006.
Books:
[B1] John Webster, “Medical Instrumentation: Application and Design, 3rd
ed.”, New Delhi,
John Wiley & Sons, 2009.
[B2]Thomas A. Powell, “Web Design: The Complete Reference, 2nd
ed.”, New Delhi,
Osborne/McGraw-Hill, 2000.](https://image.slidesharecdn.com/a1657b33-446f-440d-a340-1d4b7f56c0b6-151003072713-lva1-app6891/75/Health-Monitoring-15-2048.jpg)