SlideShare a Scribd company logo
Topological Data Analysis (TDA)
and Use Cases
Kim Hee (kimheekimi@gmail.com)
Outline
1. Visualization by TDA
2. Insights Discovery & Feature Selection
3. Evaluate the Insights
22.01.2016 Kim Hee, “Topological Data Analysis and Use Cases” 2
Visualization
22.01.2016 Kim Hee, “Topological Data Analysis and Use Cases” 3
Raw Data
Filter/Filter&Metric
NodesDivision with
Redundancy
Point Cloud
e f g h
A 3 7 10 12
B 4 8 11 13
C 5 9 8 10
D 13 11 8 4
Network
Node A
Edge
Node B
Node A
Node B
 L2(A,B)= 4 𝒃𝒚 𝐴𝑏𝑠 3 − 4 2 + 𝐴𝑏𝑠 7 − 8 2 + 𝐴𝑏𝑠 10 − 11 2 + 𝐴𝑏𝑠 12 − 13 2
 L2(A,C)= 16 𝒃𝒚 𝐴𝑏𝑠 3 − 5 2 + 𝐴𝑏𝑠 7 − 9 2 + 𝐴𝑏𝑠 10 − 8 2 + 𝐴𝑏𝑠 12 − 10 2
 L2(A,D)= 180 𝒃𝒚 𝐴𝑏𝑠 4 − 13 2 + 𝐴𝑏𝑠 8 − 11 2 + 𝐴𝑏𝑠 11 − 8 2 + 𝐴𝑏𝑠 13 − 4 2
 cos(∠AOB)=0.999 𝒃𝒚
(𝟑×𝟒)+(𝟕×𝟖)+(𝟏𝟎×𝟏𝟏)+(𝟏𝟐×𝟏𝟑)
𝟑2+𝟕2+𝟏𝟎2+𝟏𝟐2 × 𝟒2+𝟖2+𝟏𝟏2+𝟏𝟑2
=
334
334.275
 cos (∠AOC)=0.974 𝒃𝒚
(𝟑×𝟓)+(𝟕×𝟗)+(𝟏𝟎×𝟖)+(𝟏𝟐×𝟏𝟎)
𝟑2+𝟕2+𝟏𝟎2+𝟏𝟐2 × 𝟓2+𝟗2+𝟖2+𝟏𝟎2
=
278
285.552
 cos(∠AOD)= 0.757 𝒃𝒚
(𝟒×𝟏𝟑)+(𝟖×𝟏𝟏)+(𝟏𝟏×𝟖)+(𝟏𝟑×𝟒)
𝟒2+𝟖2+𝟏𝟏2+𝟏𝟑2× 𝟏𝟑2+𝟏𝟏+𝟖2+𝟒2
=
280
370
Euclidean Distance, 𝐿2 𝑋, 𝑌
𝑖=1
𝑁
𝑋𝑖 − 𝑌𝑖
2
CosineSimilarity, cos θ
𝑖=1
𝑁
𝑋𝑖 × 𝑌𝑖
𝑖=1
𝑁
𝑋𝑖
2
× 𝑖=1
𝑁
𝑌𝑖
2
X, Y: data sample, Xi, Yi: each attribute, N: number of attributes
1. Visualization
2. Insights Discovery
3. Evaluation
Insights Discovery
Case 1 – Titanic
22.01.2016 Kim Hee, “Topological Data Analysis and Use Cases” 4
1. Visualization
2. Insights Discovery
3. Evaluation
Insights Discovery
Case 2 – Energy Consumption
 Problem Domain
» Detect features that has correlation to the energy consumption
 Data Description
» Energy consumption history data in U.K. given by power plant
» 1,096 rows * 8 attributes
» Label attribute is volume, other are weather/calendar events
 Apply TDA →Discovered insights: Volume is correlated to day_type and school_holiday
1. Visualization
2. Insights Discovery
3. Evaluation
22.01.2016 Kim Hee, “Topological Data Analysis and Use Cases” 6
1. Visualization
2. Insights Discovery
3. Evaluation
Insights Discovery
Case 3 – High Dimensional Data
 Problem Domain
» Detect features that can predict customers who may terminate service
 Data Description
» Customer data given by Orange telecom
» 50,000 rows * 233 attributes
» Label attribute is churn (binary)
» Other attributes are anonymous
 Apply TDA
Column Name Value Hypergeometric p-value
churn 1 1.00E-12
Var202 PXLV 3.78E-04
Var199 Gai9lEF2Fr 4.19E-04
Var198 Z4hPoJV 4.82E-04
Var222 xiJRusu 4.82E-04
⋮ ⋮ ⋮
Var220 Af96s0w 0.047965
Var220 rDm3DH0 0.047965
Var197 yMvB 0.049324
49 underlying features are captured
(p-value that smaller than 0.05)
The result of group comparison
Time to evaluate the insights…
22.01.2016 Kim Hee, “Topological Data Analysis and Use Cases” 7
Evaluation Framework
label
sample 1 Y
sample 2 N
sample 3 Y
sample 4 Y
sample 5 N
sample 6 Y
sample 7 Y
sample 8 Y
sample 9 N
sample 10 Y
Method
Selected
Features
Reduction Accuracy
- all - 66%
PCA 7 features 22.22% 0%
RF 4 features 55.56% 33%
TDA 2 features 77.78% 100%
Sample Comparison Result
1. Visualization
2. Insights Discovery
3. Evaluation
prediction 1
label result
Y Y
N Y
Y Y
prediction 3prediction 2
ModelingEvaluation
Decision Tree
FeatureSelection
PCA TDAMRMR
Model 1 Model 2 Model 3 Model 4
label result
Y N
N Y
Y N
label result
Y N
N N
Y N
label result
Y Y
N N
Y Y
test data (30%)
Training data
(70%)
prediction 4
 Energy Consumption
22.01.2016 Kim Hee, “Topological Data Analysis and Use Cases” 9
Evaluation
1. Visualization
2. Insights Discovery
3. Evaluation
Modeling
Dimensional reduction All PCA MRMR TDA
Reduction rate
(no. of selected features)
0 %
(0)
92.70 %
(17)
57.08 %
(100/default)
83.26 %
(39)
Evaluation
(F1 Score)
Model by
Naïve Bayes
0.147 0.005 0.146 0.147
Evaluation
(F1 Score)
Model by
Decision tree
0.016 0.002 0.023 0.036
Modeling
Dimensional
reduction
All PCA MRMR TDA
Reduction rate 0 % 66.67 % 88.89 % 77.78 %
Selected features all
winter,
solar_rad,
temp
day_type
day_type,
sch_holiday
Evaluation (MAPE)
Model by
Neural Network
3.0546 % 11.1026 % 5.7003 % 3.6406 %
Model by SVM 10.9843 % 11.0649 % 10.6166 % 10.7778 %
 High Dimensional Data
References
 Used tool: Ayasdi, http://www.ayasdi.com/
 Open source: Mapper, http://danifold.net/mapper/
 PCA: https://en.wikipedia.org/wiki/Principal_component_analysis
 SVM: https://en.wikipedia.org/wiki/Support_vector_machine
 MRMR: http://penglab.janelia.org/proj/mRMR/
 MAPE: https://en.wikipedia.org/wiki/Mean_absolute_percentage_error
 F1 Score: https://en.wikipedia.org/wiki/F1_score
22.01.2016 Kim Hee, “Topological Data Analysis and Use Cases” 10
Question?
Kim Hee (kimheekimi@gmail.com)

More Related Content

What's hot

Kalman filter for Beginners
Kalman filter for BeginnersKalman filter for Beginners
Kalman filter for Beginners
winfred lu
 
A Comparison of Loss Function on Deep Embedding
A Comparison of Loss Function on Deep EmbeddingA Comparison of Loss Function on Deep Embedding
A Comparison of Loss Function on Deep Embedding
Cenk Bircanoğlu
 
Machine learning session4(linear regression)
Machine learning   session4(linear regression)Machine learning   session4(linear regression)
Machine learning session4(linear regression)
Abhimanyu Dwivedi
 
AlexNet(ImageNet Classification with Deep Convolutional Neural Networks)
AlexNet(ImageNet Classification with Deep Convolutional Neural Networks)AlexNet(ImageNet Classification with Deep Convolutional Neural Networks)
AlexNet(ImageNet Classification with Deep Convolutional Neural Networks)
Fellowship at Vodafone FutureLab
 
Deep learning - Conceptual understanding and applications
Deep learning - Conceptual understanding and applicationsDeep learning - Conceptual understanding and applications
Deep learning - Conceptual understanding and applications
Buhwan Jeong
 
Presentation on unsupervised learning
Presentation on unsupervised learning Presentation on unsupervised learning
Presentation on unsupervised learning
ANKUSH PAL
 
Multimodal Learning Analytics
Multimodal Learning AnalyticsMultimodal Learning Analytics
Multimodal Learning Analytics
Xavier Ochoa
 
VJAI Paper Reading#3-KDD2019-ClusterGCN
VJAI Paper Reading#3-KDD2019-ClusterGCNVJAI Paper Reading#3-KDD2019-ClusterGCN
VJAI Paper Reading#3-KDD2019-ClusterGCN
Dat Nguyen
 
Introduction to XGboost
Introduction to XGboostIntroduction to XGboost
Introduction to XGboost
Shuai Zhang
 
Local Outlier Factor
Local Outlier FactorLocal Outlier Factor
Local Outlier Factor
AMR koura
 
Gradient descent method
Gradient descent methodGradient descent method
Gradient descent method
Prof. Neeta Awasthy
 
Boundary Extraction
Boundary ExtractionBoundary Extraction
Boundary Extraction
Maria Akther
 
The world of loss function
The world of loss functionThe world of loss function
The world of loss function
홍배 김
 
Image segmentation with deep learning
Image segmentation with deep learningImage segmentation with deep learning
Image segmentation with deep learning
Antonio Rueda-Toicen
 
LSTM Basics
LSTM BasicsLSTM Basics
LSTM Basics
Akshay Sehgal
 
Maths-->>Eigenvalues and eigenvectors
Maths-->>Eigenvalues and eigenvectorsMaths-->>Eigenvalues and eigenvectors
Maths-->>Eigenvalues and eigenvectors
Jaydev Kishnani
 
7 steps to Predictive Analytics
7 steps to Predictive Analytics 7 steps to Predictive Analytics
7 steps to Predictive Analytics
Coforge (Erstwhile WHISHWORKS)
 
Xgboost
XgboostXgboost
Gradient descent optimizer
Gradient descent optimizerGradient descent optimizer
Gradient descent optimizer
Hojin Yang
 
Comparison of image segmentation
Comparison of image segmentationComparison of image segmentation
Comparison of image segmentation
Haitham Ahmed
 

What's hot (20)

Kalman filter for Beginners
Kalman filter for BeginnersKalman filter for Beginners
Kalman filter for Beginners
 
A Comparison of Loss Function on Deep Embedding
A Comparison of Loss Function on Deep EmbeddingA Comparison of Loss Function on Deep Embedding
A Comparison of Loss Function on Deep Embedding
 
Machine learning session4(linear regression)
Machine learning   session4(linear regression)Machine learning   session4(linear regression)
Machine learning session4(linear regression)
 
AlexNet(ImageNet Classification with Deep Convolutional Neural Networks)
AlexNet(ImageNet Classification with Deep Convolutional Neural Networks)AlexNet(ImageNet Classification with Deep Convolutional Neural Networks)
AlexNet(ImageNet Classification with Deep Convolutional Neural Networks)
 
Deep learning - Conceptual understanding and applications
Deep learning - Conceptual understanding and applicationsDeep learning - Conceptual understanding and applications
Deep learning - Conceptual understanding and applications
 
Presentation on unsupervised learning
Presentation on unsupervised learning Presentation on unsupervised learning
Presentation on unsupervised learning
 
Multimodal Learning Analytics
Multimodal Learning AnalyticsMultimodal Learning Analytics
Multimodal Learning Analytics
 
VJAI Paper Reading#3-KDD2019-ClusterGCN
VJAI Paper Reading#3-KDD2019-ClusterGCNVJAI Paper Reading#3-KDD2019-ClusterGCN
VJAI Paper Reading#3-KDD2019-ClusterGCN
 
Introduction to XGboost
Introduction to XGboostIntroduction to XGboost
Introduction to XGboost
 
Local Outlier Factor
Local Outlier FactorLocal Outlier Factor
Local Outlier Factor
 
Gradient descent method
Gradient descent methodGradient descent method
Gradient descent method
 
Boundary Extraction
Boundary ExtractionBoundary Extraction
Boundary Extraction
 
The world of loss function
The world of loss functionThe world of loss function
The world of loss function
 
Image segmentation with deep learning
Image segmentation with deep learningImage segmentation with deep learning
Image segmentation with deep learning
 
LSTM Basics
LSTM BasicsLSTM Basics
LSTM Basics
 
Maths-->>Eigenvalues and eigenvectors
Maths-->>Eigenvalues and eigenvectorsMaths-->>Eigenvalues and eigenvectors
Maths-->>Eigenvalues and eigenvectors
 
7 steps to Predictive Analytics
7 steps to Predictive Analytics 7 steps to Predictive Analytics
7 steps to Predictive Analytics
 
Xgboost
XgboostXgboost
Xgboost
 
Gradient descent optimizer
Gradient descent optimizerGradient descent optimizer
Gradient descent optimizer
 
Comparison of image segmentation
Comparison of image segmentationComparison of image segmentation
Comparison of image segmentation
 

Similar to TDA for feature selection

rbs - presentation about applications of machine learning.
rbs - presentation about applications of machine learning.rbs - presentation about applications of machine learning.
rbs - presentation about applications of machine learning.
ChellamuthuMech
 
Parameter estimation of distributed hydrological model using polynomial chaos...
Parameter estimation of distributed hydrological model using polynomial chaos...Parameter estimation of distributed hydrological model using polynomial chaos...
Parameter estimation of distributed hydrological model using polynomial chaos...
Putika Ashfar Khoiri
 
Analysis of quality metadata in the GEOSS Clearinghouse
Analysis of quality metadata in the GEOSS ClearinghouseAnalysis of quality metadata in the GEOSS Clearinghouse
Analysis of quality metadata in the GEOSS Clearinghouse
Paula Díaz
 
Srikanta Mishra
Srikanta MishraSrikanta Mishra
PAPER_CODE__IE12
PAPER_CODE__IE12PAPER_CODE__IE12
PAPER_CODE__IE12
Prashant Uttarkar
 
Synthesis of analytical methods data driven decision-making
Synthesis of analytical methods data driven decision-makingSynthesis of analytical methods data driven decision-making
Synthesis of analytical methods data driven decision-making
Adam Doyle
 
Universal approximators for Direct Policy Search in multi-purpose water reser...
Universal approximators for Direct Policy Search in multi-purpose water reser...Universal approximators for Direct Policy Search in multi-purpose water reser...
Universal approximators for Direct Policy Search in multi-purpose water reser...
Andrea Castelletti
 
SE2016 BigData Denis Reznik "Data driven future"
SE2016 BigData Denis Reznik "Data driven future"SE2016 BigData Denis Reznik "Data driven future"
SE2016 BigData Denis Reznik "Data driven future"
Inhacking
 
Denis Reznik Data driven future
Denis Reznik Data driven futureDenis Reznik Data driven future
Denis Reznik Data driven future
Аліна Шепшелей
 
ICIF19_Garg_job_talk_portfolio_modification.pdf
ICIF19_Garg_job_talk_portfolio_modification.pdfICIF19_Garg_job_talk_portfolio_modification.pdf
ICIF19_Garg_job_talk_portfolio_modification.pdf
Varun Garg
 
Handling Big Data in Ship Performance & Navigation Monitoring.
Handling Big Data in Ship Performance & Navigation Monitoring.Handling Big Data in Ship Performance & Navigation Monitoring.
Handling Big Data in Ship Performance & Navigation Monitoring.
Lokukaluge Prasad Perera
 
Six Sigma Mechanical Tolerance Analysis 1
Six Sigma Mechanical Tolerance Analysis 1Six Sigma Mechanical Tolerance Analysis 1
Six Sigma Mechanical Tolerance Analysis 1
David Panek
 
2018 National Tanks Conference & Exposition: HRSC Data Visualization
2018 National Tanks Conference & Exposition: HRSC Data Visualization2018 National Tanks Conference & Exposition: HRSC Data Visualization
2018 National Tanks Conference & Exposition: HRSC Data Visualization
Antea Group
 
six sigma DMAIC approach for reducing quality defects of camshaft binding pro...
six sigma DMAIC approach for reducing quality defects of camshaft binding pro...six sigma DMAIC approach for reducing quality defects of camshaft binding pro...
six sigma DMAIC approach for reducing quality defects of camshaft binding pro...
Niranjana B
 
Study on Application of Ensemble learning on Credit Scoring
Study on Application of Ensemble learning on Credit ScoringStudy on Application of Ensemble learning on Credit Scoring
Study on Application of Ensemble learning on Credit Scoring
harmonylab
 
OSMC 2009 | Anomalieerkennung und Trendvorhersagen an Hand von Daten aus Nagi...
OSMC 2009 | Anomalieerkennung und Trendvorhersagen an Hand von Daten aus Nagi...OSMC 2009 | Anomalieerkennung und Trendvorhersagen an Hand von Daten aus Nagi...
OSMC 2009 | Anomalieerkennung und Trendvorhersagen an Hand von Daten aus Nagi...
NETWAYS
 
Morgan uw maGIV v1.3 dist
Morgan uw maGIV v1.3 distMorgan uw maGIV v1.3 dist
Morgan uw maGIV v1.3 dist
ddm314
 
Feature Engineering
Feature Engineering Feature Engineering
Feature Engineering
odsc
 
Performance Comparison of Dimensionality Reduction Methods using MCDR
Performance Comparison of Dimensionality Reduction Methods using MCDRPerformance Comparison of Dimensionality Reduction Methods using MCDR
Performance Comparison of Dimensionality Reduction Methods using MCDR
AM Publications
 
Updating PageRank for Streaming Graphs
Updating PageRank for Streaming GraphsUpdating PageRank for Streaming Graphs
Updating PageRank for Streaming Graphs
Jason Riedy
 

Similar to TDA for feature selection (20)

rbs - presentation about applications of machine learning.
rbs - presentation about applications of machine learning.rbs - presentation about applications of machine learning.
rbs - presentation about applications of machine learning.
 
Parameter estimation of distributed hydrological model using polynomial chaos...
Parameter estimation of distributed hydrological model using polynomial chaos...Parameter estimation of distributed hydrological model using polynomial chaos...
Parameter estimation of distributed hydrological model using polynomial chaos...
 
Analysis of quality metadata in the GEOSS Clearinghouse
Analysis of quality metadata in the GEOSS ClearinghouseAnalysis of quality metadata in the GEOSS Clearinghouse
Analysis of quality metadata in the GEOSS Clearinghouse
 
Srikanta Mishra
Srikanta MishraSrikanta Mishra
Srikanta Mishra
 
PAPER_CODE__IE12
PAPER_CODE__IE12PAPER_CODE__IE12
PAPER_CODE__IE12
 
Synthesis of analytical methods data driven decision-making
Synthesis of analytical methods data driven decision-makingSynthesis of analytical methods data driven decision-making
Synthesis of analytical methods data driven decision-making
 
Universal approximators for Direct Policy Search in multi-purpose water reser...
Universal approximators for Direct Policy Search in multi-purpose water reser...Universal approximators for Direct Policy Search in multi-purpose water reser...
Universal approximators for Direct Policy Search in multi-purpose water reser...
 
SE2016 BigData Denis Reznik "Data driven future"
SE2016 BigData Denis Reznik "Data driven future"SE2016 BigData Denis Reznik "Data driven future"
SE2016 BigData Denis Reznik "Data driven future"
 
Denis Reznik Data driven future
Denis Reznik Data driven futureDenis Reznik Data driven future
Denis Reznik Data driven future
 
ICIF19_Garg_job_talk_portfolio_modification.pdf
ICIF19_Garg_job_talk_portfolio_modification.pdfICIF19_Garg_job_talk_portfolio_modification.pdf
ICIF19_Garg_job_talk_portfolio_modification.pdf
 
Handling Big Data in Ship Performance & Navigation Monitoring.
Handling Big Data in Ship Performance & Navigation Monitoring.Handling Big Data in Ship Performance & Navigation Monitoring.
Handling Big Data in Ship Performance & Navigation Monitoring.
 
Six Sigma Mechanical Tolerance Analysis 1
Six Sigma Mechanical Tolerance Analysis 1Six Sigma Mechanical Tolerance Analysis 1
Six Sigma Mechanical Tolerance Analysis 1
 
2018 National Tanks Conference & Exposition: HRSC Data Visualization
2018 National Tanks Conference & Exposition: HRSC Data Visualization2018 National Tanks Conference & Exposition: HRSC Data Visualization
2018 National Tanks Conference & Exposition: HRSC Data Visualization
 
six sigma DMAIC approach for reducing quality defects of camshaft binding pro...
six sigma DMAIC approach for reducing quality defects of camshaft binding pro...six sigma DMAIC approach for reducing quality defects of camshaft binding pro...
six sigma DMAIC approach for reducing quality defects of camshaft binding pro...
 
Study on Application of Ensemble learning on Credit Scoring
Study on Application of Ensemble learning on Credit ScoringStudy on Application of Ensemble learning on Credit Scoring
Study on Application of Ensemble learning on Credit Scoring
 
OSMC 2009 | Anomalieerkennung und Trendvorhersagen an Hand von Daten aus Nagi...
OSMC 2009 | Anomalieerkennung und Trendvorhersagen an Hand von Daten aus Nagi...OSMC 2009 | Anomalieerkennung und Trendvorhersagen an Hand von Daten aus Nagi...
OSMC 2009 | Anomalieerkennung und Trendvorhersagen an Hand von Daten aus Nagi...
 
Morgan uw maGIV v1.3 dist
Morgan uw maGIV v1.3 distMorgan uw maGIV v1.3 dist
Morgan uw maGIV v1.3 dist
 
Feature Engineering
Feature Engineering Feature Engineering
Feature Engineering
 
Performance Comparison of Dimensionality Reduction Methods using MCDR
Performance Comparison of Dimensionality Reduction Methods using MCDRPerformance Comparison of Dimensionality Reduction Methods using MCDR
Performance Comparison of Dimensionality Reduction Methods using MCDR
 
Updating PageRank for Streaming Graphs
Updating PageRank for Streaming GraphsUpdating PageRank for Streaming Graphs
Updating PageRank for Streaming Graphs
 

Recently uploaded

The Building Blocks of QuestDB, a Time Series Database
The Building Blocks of QuestDB, a Time Series DatabaseThe Building Blocks of QuestDB, a Time Series Database
The Building Blocks of QuestDB, a Time Series Database
javier ramirez
 
Challenges of Nation Building-1.pptx with more important
Challenges of Nation Building-1.pptx with more importantChallenges of Nation Building-1.pptx with more important
Challenges of Nation Building-1.pptx with more important
Sm321
 
4th Modern Marketing Reckoner by MMA Global India & Group M: 60+ experts on W...
4th Modern Marketing Reckoner by MMA Global India & Group M: 60+ experts on W...4th Modern Marketing Reckoner by MMA Global India & Group M: 60+ experts on W...
4th Modern Marketing Reckoner by MMA Global India & Group M: 60+ experts on W...
Social Samosa
 
Open Source Contributions to Postgres: The Basics POSETTE 2024
Open Source Contributions to Postgres: The Basics POSETTE 2024Open Source Contributions to Postgres: The Basics POSETTE 2024
Open Source Contributions to Postgres: The Basics POSETTE 2024
ElizabethGarrettChri
 
06-12-2024-BudapestDataForum-BuildingReal-timePipelineswithFLaNK AIM
06-12-2024-BudapestDataForum-BuildingReal-timePipelineswithFLaNK AIM06-12-2024-BudapestDataForum-BuildingReal-timePipelineswithFLaNK AIM
06-12-2024-BudapestDataForum-BuildingReal-timePipelineswithFLaNK AIM
Timothy Spann
 
一比一原版(UO毕业证)渥太华大学毕业证如何办理
一比一原版(UO毕业证)渥太华大学毕业证如何办理一比一原版(UO毕业证)渥太华大学毕业证如何办理
一比一原版(UO毕业证)渥太华大学毕业证如何办理
aqzctr7x
 
一比一原版(UMN文凭证书)明尼苏达大学毕业证如何办理
一比一原版(UMN文凭证书)明尼苏达大学毕业证如何办理一比一原版(UMN文凭证书)明尼苏达大学毕业证如何办理
一比一原版(UMN文凭证书)明尼苏达大学毕业证如何办理
nyfuhyz
 
Predictably Improve Your B2B Tech Company's Performance by Leveraging Data
Predictably Improve Your B2B Tech Company's Performance by Leveraging DataPredictably Improve Your B2B Tech Company's Performance by Leveraging Data
Predictably Improve Your B2B Tech Company's Performance by Leveraging Data
Kiwi Creative
 
Global Situational Awareness of A.I. and where its headed
Global Situational Awareness of A.I. and where its headedGlobal Situational Awareness of A.I. and where its headed
Global Situational Awareness of A.I. and where its headed
vikram sood
 
Intelligence supported media monitoring in veterinary medicine
Intelligence supported media monitoring in veterinary medicineIntelligence supported media monitoring in veterinary medicine
Intelligence supported media monitoring in veterinary medicine
AndrzejJarynowski
 
DSSML24_tspann_CodelessGenerativeAIPipelines
DSSML24_tspann_CodelessGenerativeAIPipelinesDSSML24_tspann_CodelessGenerativeAIPipelines
DSSML24_tspann_CodelessGenerativeAIPipelines
Timothy Spann
 
在线办理(英国UCA毕业证书)创意艺术大学毕业证在读证明一模一样
在线办理(英国UCA毕业证书)创意艺术大学毕业证在读证明一模一样在线办理(英国UCA毕业证书)创意艺术大学毕业证在读证明一模一样
在线办理(英国UCA毕业证书)创意艺术大学毕业证在读证明一模一样
v7oacc3l
 
End-to-end pipeline agility - Berlin Buzzwords 2024
End-to-end pipeline agility - Berlin Buzzwords 2024End-to-end pipeline agility - Berlin Buzzwords 2024
End-to-end pipeline agility - Berlin Buzzwords 2024
Lars Albertsson
 
一比一原版(GWU,GW文凭证书)乔治·华盛顿大学毕业证如何办理
一比一原版(GWU,GW文凭证书)乔治·华盛顿大学毕业证如何办理一比一原版(GWU,GW文凭证书)乔治·华盛顿大学毕业证如何办理
一比一原版(GWU,GW文凭证书)乔治·华盛顿大学毕业证如何办理
bopyb
 
一比一原版(UCSB文凭证书)圣芭芭拉分校毕业证如何办理
一比一原版(UCSB文凭证书)圣芭芭拉分校毕业证如何办理一比一原版(UCSB文凭证书)圣芭芭拉分校毕业证如何办理
一比一原版(UCSB文凭证书)圣芭芭拉分校毕业证如何办理
nuttdpt
 
Udemy_2024_Global_Learning_Skills_Trends_Report (1).pdf
Udemy_2024_Global_Learning_Skills_Trends_Report (1).pdfUdemy_2024_Global_Learning_Skills_Trends_Report (1).pdf
Udemy_2024_Global_Learning_Skills_Trends_Report (1).pdf
Fernanda Palhano
 
The Ipsos - AI - Monitor 2024 Report.pdf
The  Ipsos - AI - Monitor 2024 Report.pdfThe  Ipsos - AI - Monitor 2024 Report.pdf
The Ipsos - AI - Monitor 2024 Report.pdf
Social Samosa
 
办(uts毕业证书)悉尼科技大学毕业证学历证书原版一模一样
办(uts毕业证书)悉尼科技大学毕业证学历证书原版一模一样办(uts毕业证书)悉尼科技大学毕业证学历证书原版一模一样
办(uts毕业证书)悉尼科技大学毕业证学历证书原版一模一样
apvysm8
 
Palo Alto Cortex XDR presentation .......
Palo Alto Cortex XDR presentation .......Palo Alto Cortex XDR presentation .......
Palo Alto Cortex XDR presentation .......
Sachin Paul
 
Everything you wanted to know about LIHTC
Everything you wanted to know about LIHTCEverything you wanted to know about LIHTC
Everything you wanted to know about LIHTC
Roger Valdez
 

Recently uploaded (20)

The Building Blocks of QuestDB, a Time Series Database
The Building Blocks of QuestDB, a Time Series DatabaseThe Building Blocks of QuestDB, a Time Series Database
The Building Blocks of QuestDB, a Time Series Database
 
Challenges of Nation Building-1.pptx with more important
Challenges of Nation Building-1.pptx with more importantChallenges of Nation Building-1.pptx with more important
Challenges of Nation Building-1.pptx with more important
 
4th Modern Marketing Reckoner by MMA Global India & Group M: 60+ experts on W...
4th Modern Marketing Reckoner by MMA Global India & Group M: 60+ experts on W...4th Modern Marketing Reckoner by MMA Global India & Group M: 60+ experts on W...
4th Modern Marketing Reckoner by MMA Global India & Group M: 60+ experts on W...
 
Open Source Contributions to Postgres: The Basics POSETTE 2024
Open Source Contributions to Postgres: The Basics POSETTE 2024Open Source Contributions to Postgres: The Basics POSETTE 2024
Open Source Contributions to Postgres: The Basics POSETTE 2024
 
06-12-2024-BudapestDataForum-BuildingReal-timePipelineswithFLaNK AIM
06-12-2024-BudapestDataForum-BuildingReal-timePipelineswithFLaNK AIM06-12-2024-BudapestDataForum-BuildingReal-timePipelineswithFLaNK AIM
06-12-2024-BudapestDataForum-BuildingReal-timePipelineswithFLaNK AIM
 
一比一原版(UO毕业证)渥太华大学毕业证如何办理
一比一原版(UO毕业证)渥太华大学毕业证如何办理一比一原版(UO毕业证)渥太华大学毕业证如何办理
一比一原版(UO毕业证)渥太华大学毕业证如何办理
 
一比一原版(UMN文凭证书)明尼苏达大学毕业证如何办理
一比一原版(UMN文凭证书)明尼苏达大学毕业证如何办理一比一原版(UMN文凭证书)明尼苏达大学毕业证如何办理
一比一原版(UMN文凭证书)明尼苏达大学毕业证如何办理
 
Predictably Improve Your B2B Tech Company's Performance by Leveraging Data
Predictably Improve Your B2B Tech Company's Performance by Leveraging DataPredictably Improve Your B2B Tech Company's Performance by Leveraging Data
Predictably Improve Your B2B Tech Company's Performance by Leveraging Data
 
Global Situational Awareness of A.I. and where its headed
Global Situational Awareness of A.I. and where its headedGlobal Situational Awareness of A.I. and where its headed
Global Situational Awareness of A.I. and where its headed
 
Intelligence supported media monitoring in veterinary medicine
Intelligence supported media monitoring in veterinary medicineIntelligence supported media monitoring in veterinary medicine
Intelligence supported media monitoring in veterinary medicine
 
DSSML24_tspann_CodelessGenerativeAIPipelines
DSSML24_tspann_CodelessGenerativeAIPipelinesDSSML24_tspann_CodelessGenerativeAIPipelines
DSSML24_tspann_CodelessGenerativeAIPipelines
 
在线办理(英国UCA毕业证书)创意艺术大学毕业证在读证明一模一样
在线办理(英国UCA毕业证书)创意艺术大学毕业证在读证明一模一样在线办理(英国UCA毕业证书)创意艺术大学毕业证在读证明一模一样
在线办理(英国UCA毕业证书)创意艺术大学毕业证在读证明一模一样
 
End-to-end pipeline agility - Berlin Buzzwords 2024
End-to-end pipeline agility - Berlin Buzzwords 2024End-to-end pipeline agility - Berlin Buzzwords 2024
End-to-end pipeline agility - Berlin Buzzwords 2024
 
一比一原版(GWU,GW文凭证书)乔治·华盛顿大学毕业证如何办理
一比一原版(GWU,GW文凭证书)乔治·华盛顿大学毕业证如何办理一比一原版(GWU,GW文凭证书)乔治·华盛顿大学毕业证如何办理
一比一原版(GWU,GW文凭证书)乔治·华盛顿大学毕业证如何办理
 
一比一原版(UCSB文凭证书)圣芭芭拉分校毕业证如何办理
一比一原版(UCSB文凭证书)圣芭芭拉分校毕业证如何办理一比一原版(UCSB文凭证书)圣芭芭拉分校毕业证如何办理
一比一原版(UCSB文凭证书)圣芭芭拉分校毕业证如何办理
 
Udemy_2024_Global_Learning_Skills_Trends_Report (1).pdf
Udemy_2024_Global_Learning_Skills_Trends_Report (1).pdfUdemy_2024_Global_Learning_Skills_Trends_Report (1).pdf
Udemy_2024_Global_Learning_Skills_Trends_Report (1).pdf
 
The Ipsos - AI - Monitor 2024 Report.pdf
The  Ipsos - AI - Monitor 2024 Report.pdfThe  Ipsos - AI - Monitor 2024 Report.pdf
The Ipsos - AI - Monitor 2024 Report.pdf
 
办(uts毕业证书)悉尼科技大学毕业证学历证书原版一模一样
办(uts毕业证书)悉尼科技大学毕业证学历证书原版一模一样办(uts毕业证书)悉尼科技大学毕业证学历证书原版一模一样
办(uts毕业证书)悉尼科技大学毕业证学历证书原版一模一样
 
Palo Alto Cortex XDR presentation .......
Palo Alto Cortex XDR presentation .......Palo Alto Cortex XDR presentation .......
Palo Alto Cortex XDR presentation .......
 
Everything you wanted to know about LIHTC
Everything you wanted to know about LIHTCEverything you wanted to know about LIHTC
Everything you wanted to know about LIHTC
 

TDA for feature selection

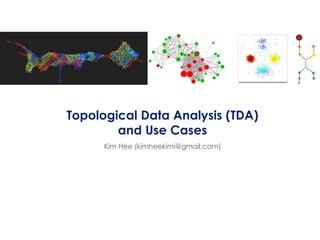
  • 1. Topological Data Analysis (TDA) and Use Cases Kim Hee (kimheekimi@gmail.com)
  • 2. Outline 1. Visualization by TDA 2. Insights Discovery & Feature Selection 3. Evaluate the Insights 22.01.2016 Kim Hee, “Topological Data Analysis and Use Cases” 2
  • 3. Visualization 22.01.2016 Kim Hee, “Topological Data Analysis and Use Cases” 3 Raw Data Filter/Filter&Metric NodesDivision with Redundancy Point Cloud e f g h A 3 7 10 12 B 4 8 11 13 C 5 9 8 10 D 13 11 8 4 Network Node A Edge Node B Node A Node B  L2(A,B)= 4 𝒃𝒚 𝐴𝑏𝑠 3 − 4 2 + 𝐴𝑏𝑠 7 − 8 2 + 𝐴𝑏𝑠 10 − 11 2 + 𝐴𝑏𝑠 12 − 13 2  L2(A,C)= 16 𝒃𝒚 𝐴𝑏𝑠 3 − 5 2 + 𝐴𝑏𝑠 7 − 9 2 + 𝐴𝑏𝑠 10 − 8 2 + 𝐴𝑏𝑠 12 − 10 2  L2(A,D)= 180 𝒃𝒚 𝐴𝑏𝑠 4 − 13 2 + 𝐴𝑏𝑠 8 − 11 2 + 𝐴𝑏𝑠 11 − 8 2 + 𝐴𝑏𝑠 13 − 4 2  cos(∠AOB)=0.999 𝒃𝒚 (𝟑×𝟒)+(𝟕×𝟖)+(𝟏𝟎×𝟏𝟏)+(𝟏𝟐×𝟏𝟑) 𝟑2+𝟕2+𝟏𝟎2+𝟏𝟐2 × 𝟒2+𝟖2+𝟏𝟏2+𝟏𝟑2 = 334 334.275  cos (∠AOC)=0.974 𝒃𝒚 (𝟑×𝟓)+(𝟕×𝟗)+(𝟏𝟎×𝟖)+(𝟏𝟐×𝟏𝟎) 𝟑2+𝟕2+𝟏𝟎2+𝟏𝟐2 × 𝟓2+𝟗2+𝟖2+𝟏𝟎2 = 278 285.552  cos(∠AOD)= 0.757 𝒃𝒚 (𝟒×𝟏𝟑)+(𝟖×𝟏𝟏)+(𝟏𝟏×𝟖)+(𝟏𝟑×𝟒) 𝟒2+𝟖2+𝟏𝟏2+𝟏𝟑2× 𝟏𝟑2+𝟏𝟏+𝟖2+𝟒2 = 280 370 Euclidean Distance, 𝐿2 𝑋, 𝑌 𝑖=1 𝑁 𝑋𝑖 − 𝑌𝑖 2 CosineSimilarity, cos θ 𝑖=1 𝑁 𝑋𝑖 × 𝑌𝑖 𝑖=1 𝑁 𝑋𝑖 2 × 𝑖=1 𝑁 𝑌𝑖 2 X, Y: data sample, Xi, Yi: each attribute, N: number of attributes 1. Visualization 2. Insights Discovery 3. Evaluation
  • 4. Insights Discovery Case 1 – Titanic 22.01.2016 Kim Hee, “Topological Data Analysis and Use Cases” 4 1. Visualization 2. Insights Discovery 3. Evaluation
  • 5. Insights Discovery Case 2 – Energy Consumption  Problem Domain » Detect features that has correlation to the energy consumption  Data Description » Energy consumption history data in U.K. given by power plant » 1,096 rows * 8 attributes » Label attribute is volume, other are weather/calendar events  Apply TDA →Discovered insights: Volume is correlated to day_type and school_holiday 1. Visualization 2. Insights Discovery 3. Evaluation
  • 6. 22.01.2016 Kim Hee, “Topological Data Analysis and Use Cases” 6 1. Visualization 2. Insights Discovery 3. Evaluation Insights Discovery Case 3 – High Dimensional Data  Problem Domain » Detect features that can predict customers who may terminate service  Data Description » Customer data given by Orange telecom » 50,000 rows * 233 attributes » Label attribute is churn (binary) » Other attributes are anonymous  Apply TDA Column Name Value Hypergeometric p-value churn 1 1.00E-12 Var202 PXLV 3.78E-04 Var199 Gai9lEF2Fr 4.19E-04 Var198 Z4hPoJV 4.82E-04 Var222 xiJRusu 4.82E-04 ⋮ ⋮ ⋮ Var220 Af96s0w 0.047965 Var220 rDm3DH0 0.047965 Var197 yMvB 0.049324 49 underlying features are captured (p-value that smaller than 0.05) The result of group comparison
  • 7. Time to evaluate the insights… 22.01.2016 Kim Hee, “Topological Data Analysis and Use Cases” 7
  • 8. Evaluation Framework label sample 1 Y sample 2 N sample 3 Y sample 4 Y sample 5 N sample 6 Y sample 7 Y sample 8 Y sample 9 N sample 10 Y Method Selected Features Reduction Accuracy - all - 66% PCA 7 features 22.22% 0% RF 4 features 55.56% 33% TDA 2 features 77.78% 100% Sample Comparison Result 1. Visualization 2. Insights Discovery 3. Evaluation prediction 1 label result Y Y N Y Y Y prediction 3prediction 2 ModelingEvaluation Decision Tree FeatureSelection PCA TDAMRMR Model 1 Model 2 Model 3 Model 4 label result Y N N Y Y N label result Y N N N Y N label result Y Y N N Y Y test data (30%) Training data (70%) prediction 4
  • 9.  Energy Consumption 22.01.2016 Kim Hee, “Topological Data Analysis and Use Cases” 9 Evaluation 1. Visualization 2. Insights Discovery 3. Evaluation Modeling Dimensional reduction All PCA MRMR TDA Reduction rate (no. of selected features) 0 % (0) 92.70 % (17) 57.08 % (100/default) 83.26 % (39) Evaluation (F1 Score) Model by Naïve Bayes 0.147 0.005 0.146 0.147 Evaluation (F1 Score) Model by Decision tree 0.016 0.002 0.023 0.036 Modeling Dimensional reduction All PCA MRMR TDA Reduction rate 0 % 66.67 % 88.89 % 77.78 % Selected features all winter, solar_rad, temp day_type day_type, sch_holiday Evaluation (MAPE) Model by Neural Network 3.0546 % 11.1026 % 5.7003 % 3.6406 % Model by SVM 10.9843 % 11.0649 % 10.6166 % 10.7778 %  High Dimensional Data
  • 10. References  Used tool: Ayasdi, http://www.ayasdi.com/  Open source: Mapper, http://danifold.net/mapper/  PCA: https://en.wikipedia.org/wiki/Principal_component_analysis  SVM: https://en.wikipedia.org/wiki/Support_vector_machine  MRMR: http://penglab.janelia.org/proj/mRMR/  MAPE: https://en.wikipedia.org/wiki/Mean_absolute_percentage_error  F1 Score: https://en.wikipedia.org/wiki/F1_score 22.01.2016 Kim Hee, “Topological Data Analysis and Use Cases” 10