Download as PDF, PPTX
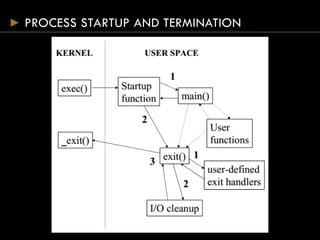
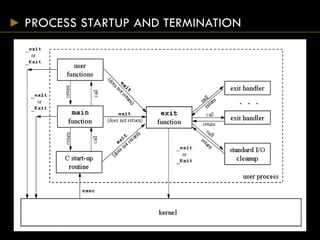
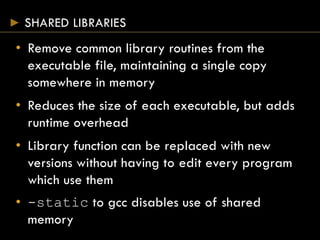
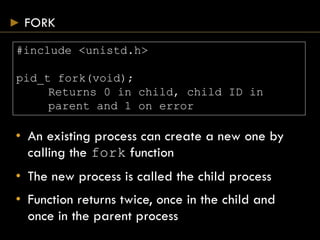
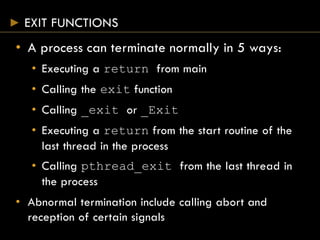
![PROCESS STARTUP AND TERMINATION
#include <stdlib.h>
#include <unistd.h>
int main(int argc, char *argv[]);
void exit(int status);
void _exit(int status);
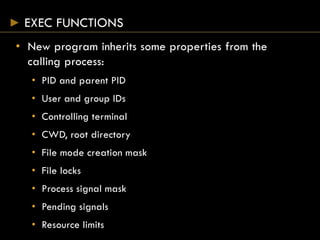
• main() is passed the command line arguments and
should return the termination status
• exit() takes the termination status and causes any
files to be properly closed and memory released
• _exit() terminates the process immediately
closing all file descriptors but not cleanly](https://image.slidesharecdn.com/processes-150824075951-lva1-app6892/85/Systems-Programming-Assignment-Help-Processes-4-320.jpg)
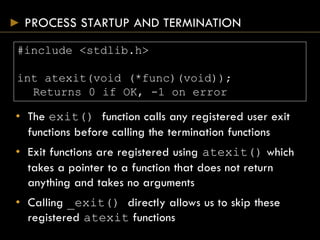
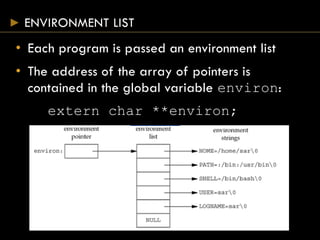
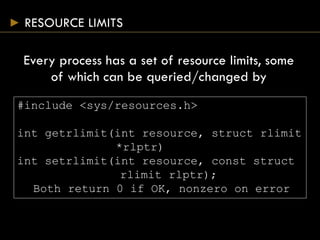
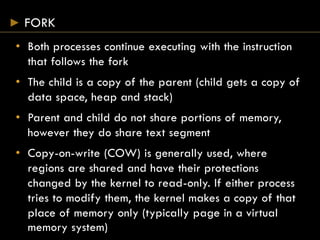
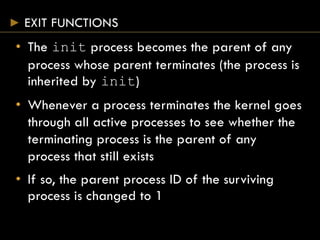

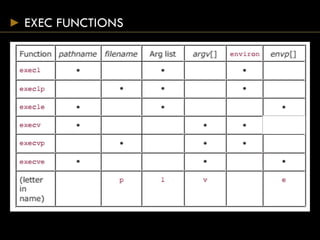
![EXEC FUNCTIONS
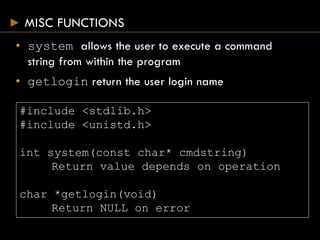
#include <unistd.h>
int execl(const char *pathname, const char* arg0
… /* (char *) 0 */);
int execv(const char *pathname, char *const
argv[]);
int execle(const char *pathname, const char
*arg0, … /*(char *) 0, char envp[] */);
int execve(const char *pathname, char *const
argv[], char *const envp[]);
int execlp(const char *filename, const char
*arg0, … /* (char *)0 */);
int execvp(const char *filename, char *const
argv[]);
Return 1 on error, no return on success](https://image.slidesharecdn.com/processes-150824075951-lva1-app6892/85/Systems-Programming-Assignment-Help-Processes-29-320.jpg)

The document discusses essential concepts of processes in Unix systems, covering process identification, startup, termination, resource limits, and memory layout. It explains the fork and exec functions for creating and managing processes, as well as the concepts of file sharing, process groups, and race conditions in concurrent processing. Additionally, it addresses how processes can communicate and manage resources effectively through various function calls.