Downloaded 876 times
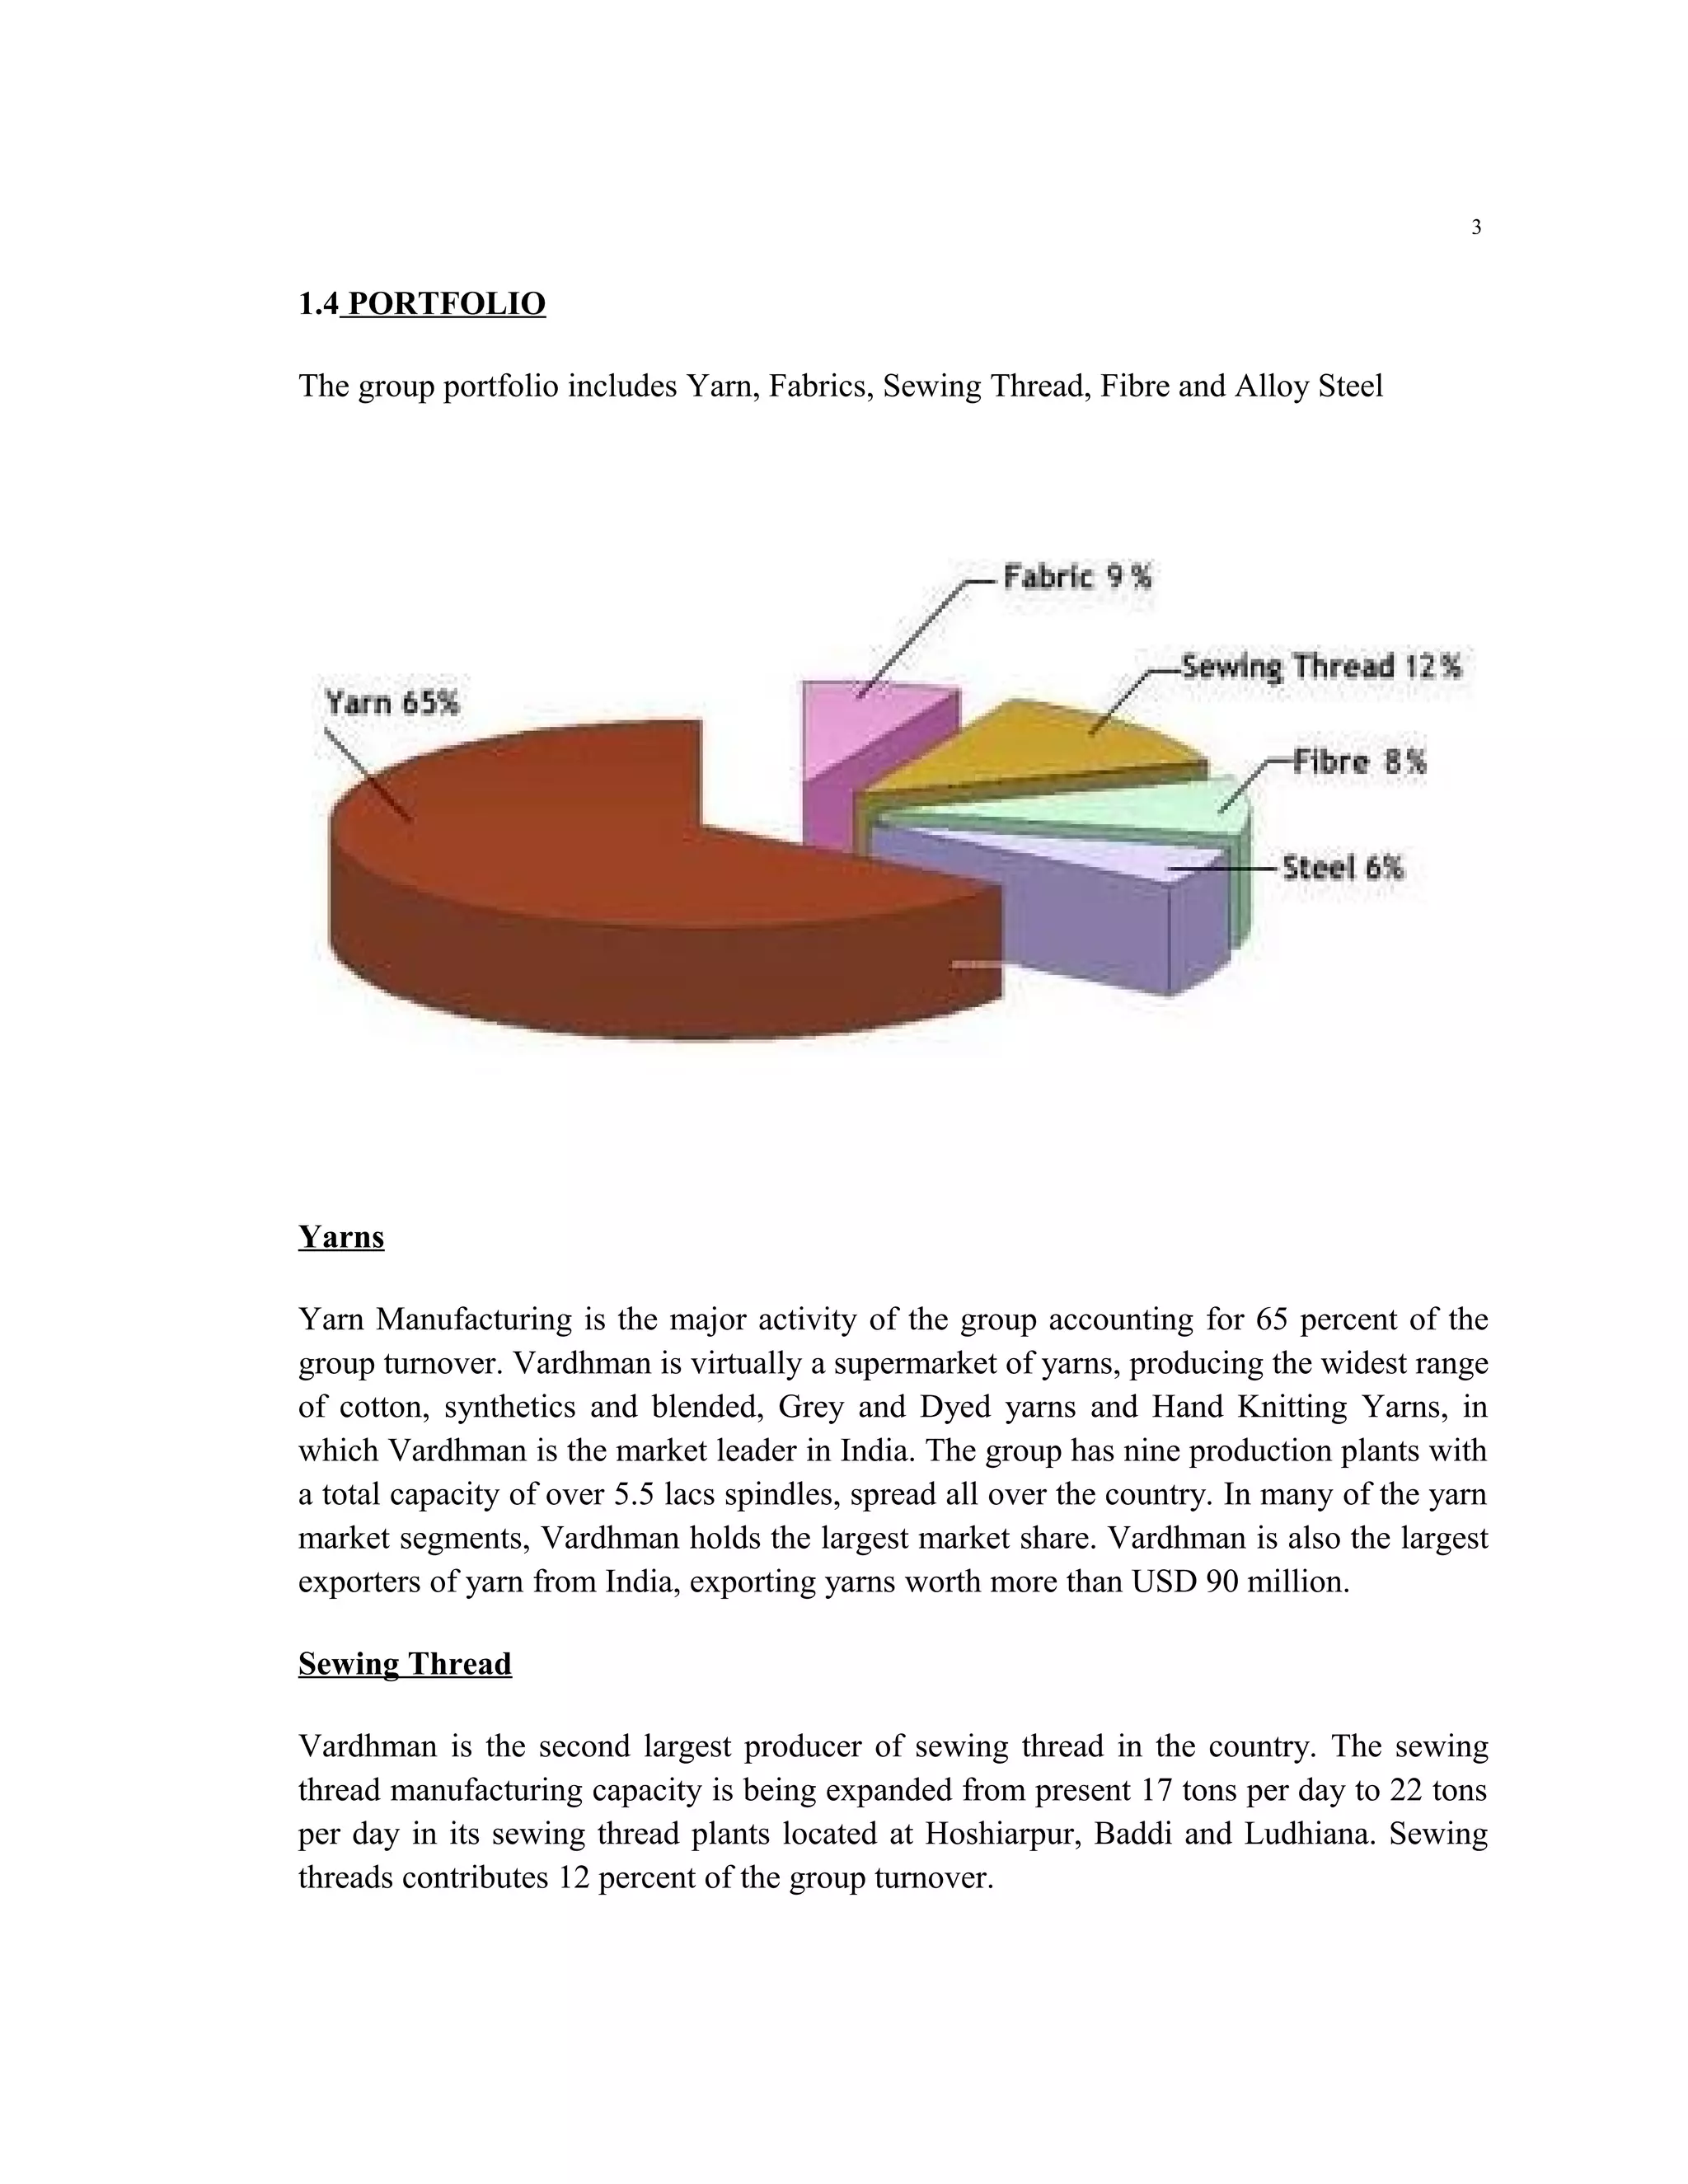


The document provides an overview of Vardhman Yarns and Threads Limited, Unit IV located in Baddi, India. [1] It discusses the company's history, vision, portfolio of products including yarns, fabrics, sewing threads, fiber and alloy steel. [2] It also outlines the company's achievements in receiving various awards for export and quality. [3] The summary provides the key details about the company's operations and products in a concise manner.


