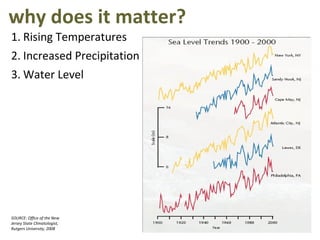
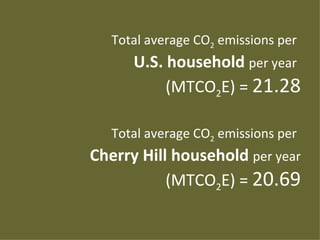
sustainability plan
   an element of the master plan
why does it matter?
• Rising Temperatures


SOURCE: Office of the New
Jersey State Climatologist,
Rutgers University, 2008
why does it matter?
1. Rising Temperatures
2. Increased Precipitation


SOURCE: Office of the New
Jersey State Climatologist,
Rutgers University, 2008
why does it matter?
1. Rising Temperatures
2. Increased Precipitation
3. Water Level


SOURCE: Office of the New
Jersey State Climatologist,
Rutgers University, 2008
Sustainable Community Benefits to Residents
   Establish and maintain a quality of life based on shared values
    adopted by the community
   Establish links between issues that often are viewed as separate
          (i.e., economic development, housing, public safety and transportation)
   Equitable distribution of critical resources and opportunities for
    the current generation as well as for future generations
   Enhanced quality of life/ improved livability
   Economic development that better supports community
    infrastructure with quality tax bases* and creates potential for
    increased community prosperity by providing diverse, high-quality
    local jobs for a greater portion of the population
•That is, reflecting true costs of community resource use and applying “user pays” principle.
SOURCE: How to Become an Environmentally Sustainable Community - A Primer, New Jersey Department of Environmental Protection, Office of Planning &
Sustainable Communities, January 2006, Table 1.
emissions analysis.
                             Source of GHGEMISSIONS
                           SOURCE of GHG    Emissions
                                        (for Cherry Hill)
          7%                    for Cherry Other
                                            Hill
                                      Homes     Mobile
                                      Business Commercial
                     30%                        Residential
                                      Transportation
    29%                               Other


               35%


                                               SOURCE: DVRPC, 2009
Total average CO2 emissions per
      U.S. household per year
           (MTCO2E) = 21.28

   Total average CO2 emissions per
Cherry Hill household per year
           (MTCO2E) = 20.69
emissions analysis.
                             2005 GHG Emissions (Gross)
 1,200,000

 1,000,000

  800,000                                                       Other
  600,000                                                       Mobile
  400,000                                                       Commercial
  200,000                                                       Residential
        -
                      p


                                                       p
                                           ow i p


                                                       p
                                                       p
                   hi


                                                      p


                                                      p
                                                    hi
                                                     p


                                                    hi
                                                    hi
                                                   ty
                                                   ty


                                       g T nsh
                                                   hi


                                                   hi
                ns


                                                  hi

                                                 ns


                                                ns
                                                ns
                                                Ci
                                                Ci
                                                ns


                                                ns
                                               ns
                w


                                              w
                                E w T ow


                                              w
                                              w
                        ow


                                              n


                                             w
                                              n
            To


                                           To


                                           To
                                           To
                                           to
                                           de


                                          To
                    ll T


                                        en
            n


                                        m


                                        m
                                        el


                                         n
                                        er
         o


                                        e

                                      to
                                     Ca
                 Hi


                                     ha
                                     ur
                                     Tr
     ilt


                                    nc
                                     st
                                    in


                                   ng
    m


                                  La


                                  ce
                                  es


                                  re
                ry


                                                           Source: DVRPC, 2009
   Ha


                                hi
                               ou


                                w
              er


                               Ev
                               nt


                                                           All emissions in MTCO2 E
                             as
                             La
            Ch


                            ou


                            Gl


                           W
                          M
indicators.
        Amount of Open Space (acres)                  1,364

 LAND   Amount of Developed Land (percentage)         87%

 USE.   Number of Green (LEED©-Certified) Buildings     0

        Mixed-Use zones                                 1
indicators.
               Traffic Congestion: Mean Travel Time to Work
               (minutes)                                           26.2
           Transportation Mode: Percent Driving Alone to
 TRANSPOR- Work                                                    80.2%
  TATION.      Vehicle Ownership: Average Number of Vehicles per
               Household                                            2
               Miles of bike paths                                  5.5
indicators.
             Municipal Gas Consumption (Annual Therms)         223,219.33
             Municipal Electricity Consumption (Annual kWh)    6,368,542.6
 ENERGY. Fuel Use for Municipal Vehicles (gallons)             211,755.80
             Total Municipal Water Consumption
             (gallons per year)                               2,968,094,000
indicators.
          Recycling Rate
          (Annual Tonnage/% of waste stream)         34,993 (60%)
          Paper & Containers Recycling
          (Annual Tonnage/% of waste stream)         9,032 (15%)
 WASTE.
          Solid Waste Rate
          (Annual Tonnage/% of waste stream)         23,365 (40%)

          Sanitary Sewer (average gallons per day)   12,000,000
action plan.


                                                   LAND USE.
       Encourage and facilitate responsible development
             with efficient land use that reduces sprawl.
  1. Implement and standardize efficient land use practices.
  2. Establish a municipal Green Building Program.
  3. Improve existing and continue to assemble meaningful open space.
action plan.


                                   TRANSPORTATION.
        Promote transportation and mobility options that
                            reduce pollution emissions.
  4. Encourage programs that reduce commuter trips.
  5. Incrementally improve municipal fleets for efficiency and less GHG
     emission.
  3. Invest in public infrastructure to promote non-vehicular and more
     efficient transportation systems.
action plan.


                                                          ENERGY.
   Utilize cleaner energy sources that minimize negative
                 effects and maximize energy efficiency.
  1. Serve as a model of building efficiency, by implementing the
     recommendation of the municipal energy audit.
  2. Establish energy-saving strategies, through government employee
     policy and training for all community services and facilities.
  3. Encourage energy efficiency of public utilities for emergency services,
     schools, businesses, and community residents.
action plan.


                                                        WASTE.
        Reduce waste by reducing, reusing, and recycling.
  1. Establish internal government paper reduction strategies, through
     employee policy and training, encouraging Township-wide adoption in
     public and private sectors.
  2. Establish new and improve existing recycling programs.
  3. Increase the use of composting in the Township.
reduction target.

                            NEW JERSEY EMISSIONS TARGET for Cherry Hill Hill
                                New Jersey Emissions Target for Cherry
                            1,200,000
  GHG Emissions in MTCO2E


                            1,000,000

                             800,000
                                                  2005 Emission
                             600,000              Level =
                                                  1,066,594
                             400,000

                             200,000

                                   0
                                   1990   2000   2010      2020   2030   2040   2050
current initiatives.
What does the adoption of this mean? How does it affect the Planning Board?
 State law (NJSA) is untested as to how a Sustainability Plan is applied.
 Planning goals of the Township; part of criteria as a basis for decisions.
 Specificity
 Basis for sustainable zoning ordinance (i.e. green building, solar, wind, etc.)


Nicole Hostettler, PP, AICP nhostettler@chtownship.com

Sustainability Plan Presentation

  • 1.
    sustainability plan an element of the master plan
  • 2.
    why does itmatter? • Rising Temperatures SOURCE: Office of the New Jersey State Climatologist, Rutgers University, 2008
  • 3.
    why does itmatter? 1. Rising Temperatures 2. Increased Precipitation SOURCE: Office of the New Jersey State Climatologist, Rutgers University, 2008
  • 4.
    why does itmatter? 1. Rising Temperatures 2. Increased Precipitation 3. Water Level SOURCE: Office of the New Jersey State Climatologist, Rutgers University, 2008
  • 5.
    Sustainable Community Benefitsto Residents  Establish and maintain a quality of life based on shared values adopted by the community  Establish links between issues that often are viewed as separate (i.e., economic development, housing, public safety and transportation)  Equitable distribution of critical resources and opportunities for the current generation as well as for future generations  Enhanced quality of life/ improved livability  Economic development that better supports community infrastructure with quality tax bases* and creates potential for increased community prosperity by providing diverse, high-quality local jobs for a greater portion of the population •That is, reflecting true costs of community resource use and applying “user pays” principle. SOURCE: How to Become an Environmentally Sustainable Community - A Primer, New Jersey Department of Environmental Protection, Office of Planning & Sustainable Communities, January 2006, Table 1.
  • 6.
    emissions analysis. Source of GHGEMISSIONS SOURCE of GHG Emissions (for Cherry Hill) 7% for Cherry Other Hill Homes Mobile Business Commercial 30% Residential Transportation 29% Other 35% SOURCE: DVRPC, 2009
  • 7.
    Total average CO2emissions per U.S. household per year (MTCO2E) = 21.28 Total average CO2 emissions per Cherry Hill household per year (MTCO2E) = 20.69
  • 8.
    emissions analysis. 2005 GHG Emissions (Gross) 1,200,000 1,000,000 800,000 Other 600,000 Mobile 400,000 Commercial 200,000 Residential - p p ow i p p p hi p p hi p hi hi ty ty g T nsh hi hi ns hi ns ns ns Ci Ci ns ns ns w w E w T ow w w ow n w n To To To To to de To ll T en n m m el n er o e to Ca Hi ha ur Tr ilt nc st in ng m La ce es re ry Source: DVRPC, 2009 Ha hi ou w er Ev nt All emissions in MTCO2 E as La Ch ou Gl W M
  • 9.
    indicators. Amount of Open Space (acres) 1,364 LAND Amount of Developed Land (percentage) 87% USE. Number of Green (LEED©-Certified) Buildings 0 Mixed-Use zones 1
  • 10.
    indicators. Traffic Congestion: Mean Travel Time to Work (minutes) 26.2 Transportation Mode: Percent Driving Alone to TRANSPOR- Work 80.2% TATION. Vehicle Ownership: Average Number of Vehicles per Household 2 Miles of bike paths 5.5
  • 11.
    indicators. Municipal Gas Consumption (Annual Therms) 223,219.33 Municipal Electricity Consumption (Annual kWh) 6,368,542.6 ENERGY. Fuel Use for Municipal Vehicles (gallons) 211,755.80 Total Municipal Water Consumption (gallons per year) 2,968,094,000
  • 12.
    indicators. Recycling Rate (Annual Tonnage/% of waste stream) 34,993 (60%) Paper & Containers Recycling (Annual Tonnage/% of waste stream) 9,032 (15%) WASTE. Solid Waste Rate (Annual Tonnage/% of waste stream) 23,365 (40%) Sanitary Sewer (average gallons per day) 12,000,000
  • 13.
    action plan. LAND USE. Encourage and facilitate responsible development with efficient land use that reduces sprawl. 1. Implement and standardize efficient land use practices. 2. Establish a municipal Green Building Program. 3. Improve existing and continue to assemble meaningful open space.
  • 14.
    action plan. TRANSPORTATION. Promote transportation and mobility options that reduce pollution emissions. 4. Encourage programs that reduce commuter trips. 5. Incrementally improve municipal fleets for efficiency and less GHG emission. 3. Invest in public infrastructure to promote non-vehicular and more efficient transportation systems.
  • 15.
    action plan. ENERGY. Utilize cleaner energy sources that minimize negative effects and maximize energy efficiency. 1. Serve as a model of building efficiency, by implementing the recommendation of the municipal energy audit. 2. Establish energy-saving strategies, through government employee policy and training for all community services and facilities. 3. Encourage energy efficiency of public utilities for emergency services, schools, businesses, and community residents.
  • 16.
    action plan. WASTE. Reduce waste by reducing, reusing, and recycling. 1. Establish internal government paper reduction strategies, through employee policy and training, encouraging Township-wide adoption in public and private sectors. 2. Establish new and improve existing recycling programs. 3. Increase the use of composting in the Township.
  • 17.
    reduction target. NEW JERSEY EMISSIONS TARGET for Cherry Hill Hill New Jersey Emissions Target for Cherry 1,200,000 GHG Emissions in MTCO2E 1,000,000 800,000 2005 Emission 600,000 Level = 1,066,594 400,000 200,000 0 1990 2000 2010 2020 2030 2040 2050
  • 18.
  • 19.
    What does theadoption of this mean? How does it affect the Planning Board?  State law (NJSA) is untested as to how a Sustainability Plan is applied.  Planning goals of the Township; part of criteria as a basis for decisions.  Specificity  Basis for sustainable zoning ordinance (i.e. green building, solar, wind, etc.) Nicole Hostettler, PP, AICP nhostettler@chtownship.com