Download as PDF, PPTX
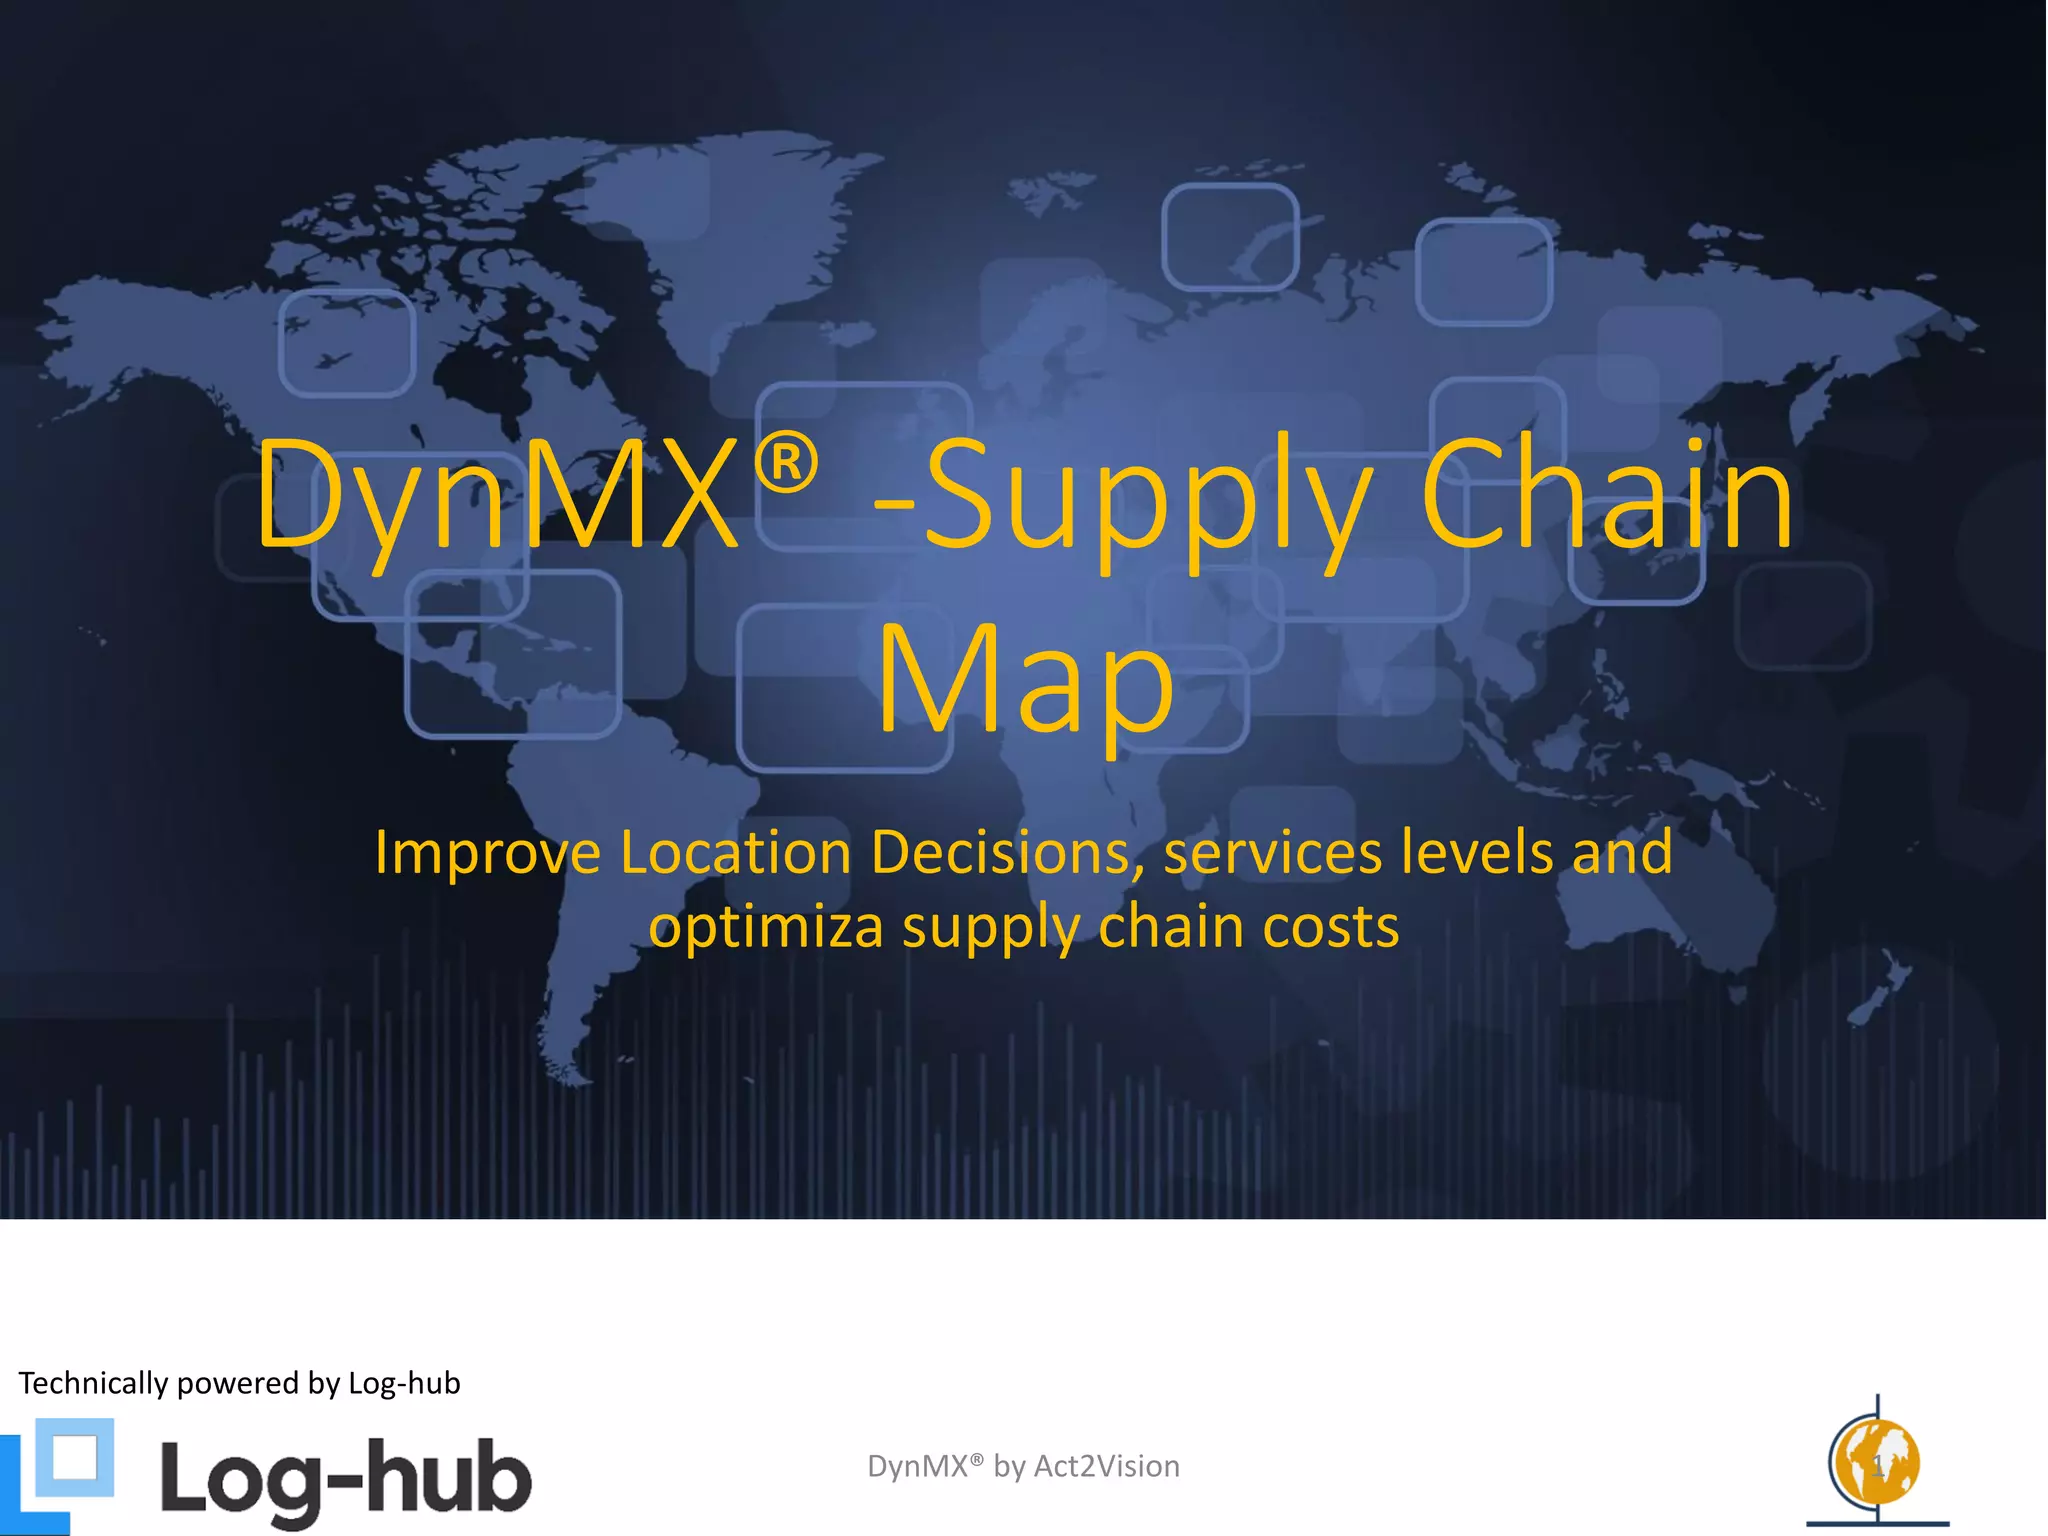
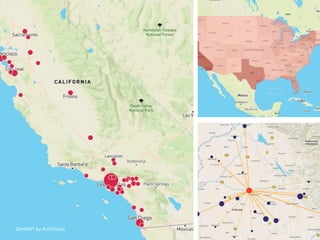
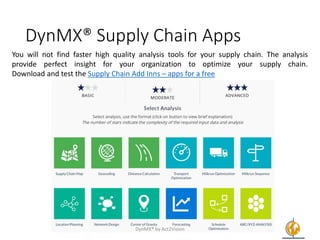
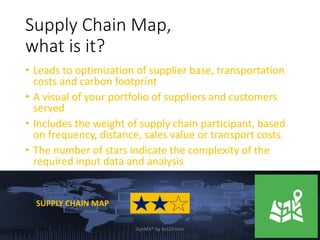
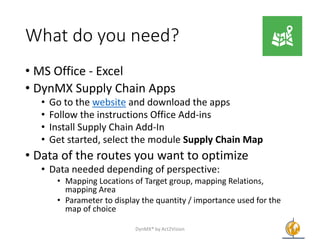
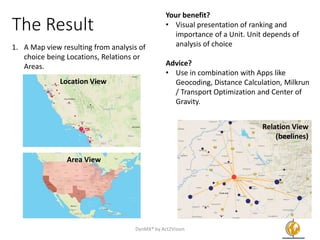
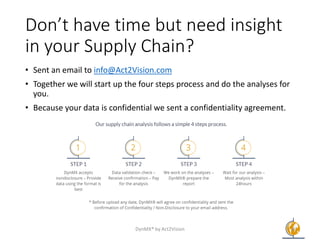

This document describes DynMX Supply Chain Map, a software tool that analyzes supply chain data to visualize relationships and optimize networks. The Supply Chain Map app generates visual maps showing the importance of suppliers, customers, and locations based on factors like frequency, distance, and costs. It helps users optimize their supplier base, transportation costs, and carbon footprint. The app requires Excel and supply chain data, then generates maps showing location, relation, or area views to provide insight into how to improve the supply chain network.