Download to read offline


![The Result 1. A table with overview of: Unit | Stockvalue |
Class
2. A table with overview of Totals per Class: Value |
Share | number of Units
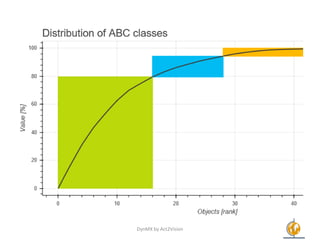
3. A Visualization of ABC classification
Your benefit?
Classification of Units based on their stock value.
Support decision to optimize Items on stock, Inventory value
Advice?
Use ABC together with XYZ to improve decision making.
Article_116 9398 A
Article_133 8965 A
Article_132 8960 A
Article_108 7126 B
Article_109 7075 B
Article_131 6001 B
Article_130 5742 B
Class Value [sum] Value [%] # Objects Objects [%]
A 308197 79,47 16 29,63
B 57624 14,86 12 22,22
C 21987 5,67 26 48,15
DynMX by Act2Vision 7](https://image.slidesharecdn.com/dynmx-abcpresentation-180212145650/85/Inventory-ABC-analysis-7-320.jpg)


This document describes an ABC analysis tool that classifies inventory items based on their stock value. The tool is part of a suite of supply chain apps called DynMX that are powered by Log-hub and provide fast, high-quality analysis. The ABC analysis classifies inventory into categories A, B, and C that can help with inventory management and product strategy decisions. It involves inputting inventory data like stock units and values and outputs tables and visualizations showing the classification and proportions of inventory value in each category.


![Connected factory semi_conductor narrative[1] [auto-saved]](https://cdn.slidesharecdn.com/ss_thumbnails/connectedfactorysemiconductornarrative1auto-saved-211116123427-thumbnail.jpg?width=640&height=640&fit=bounds)


