This document defines key economic concepts related to demand, including:
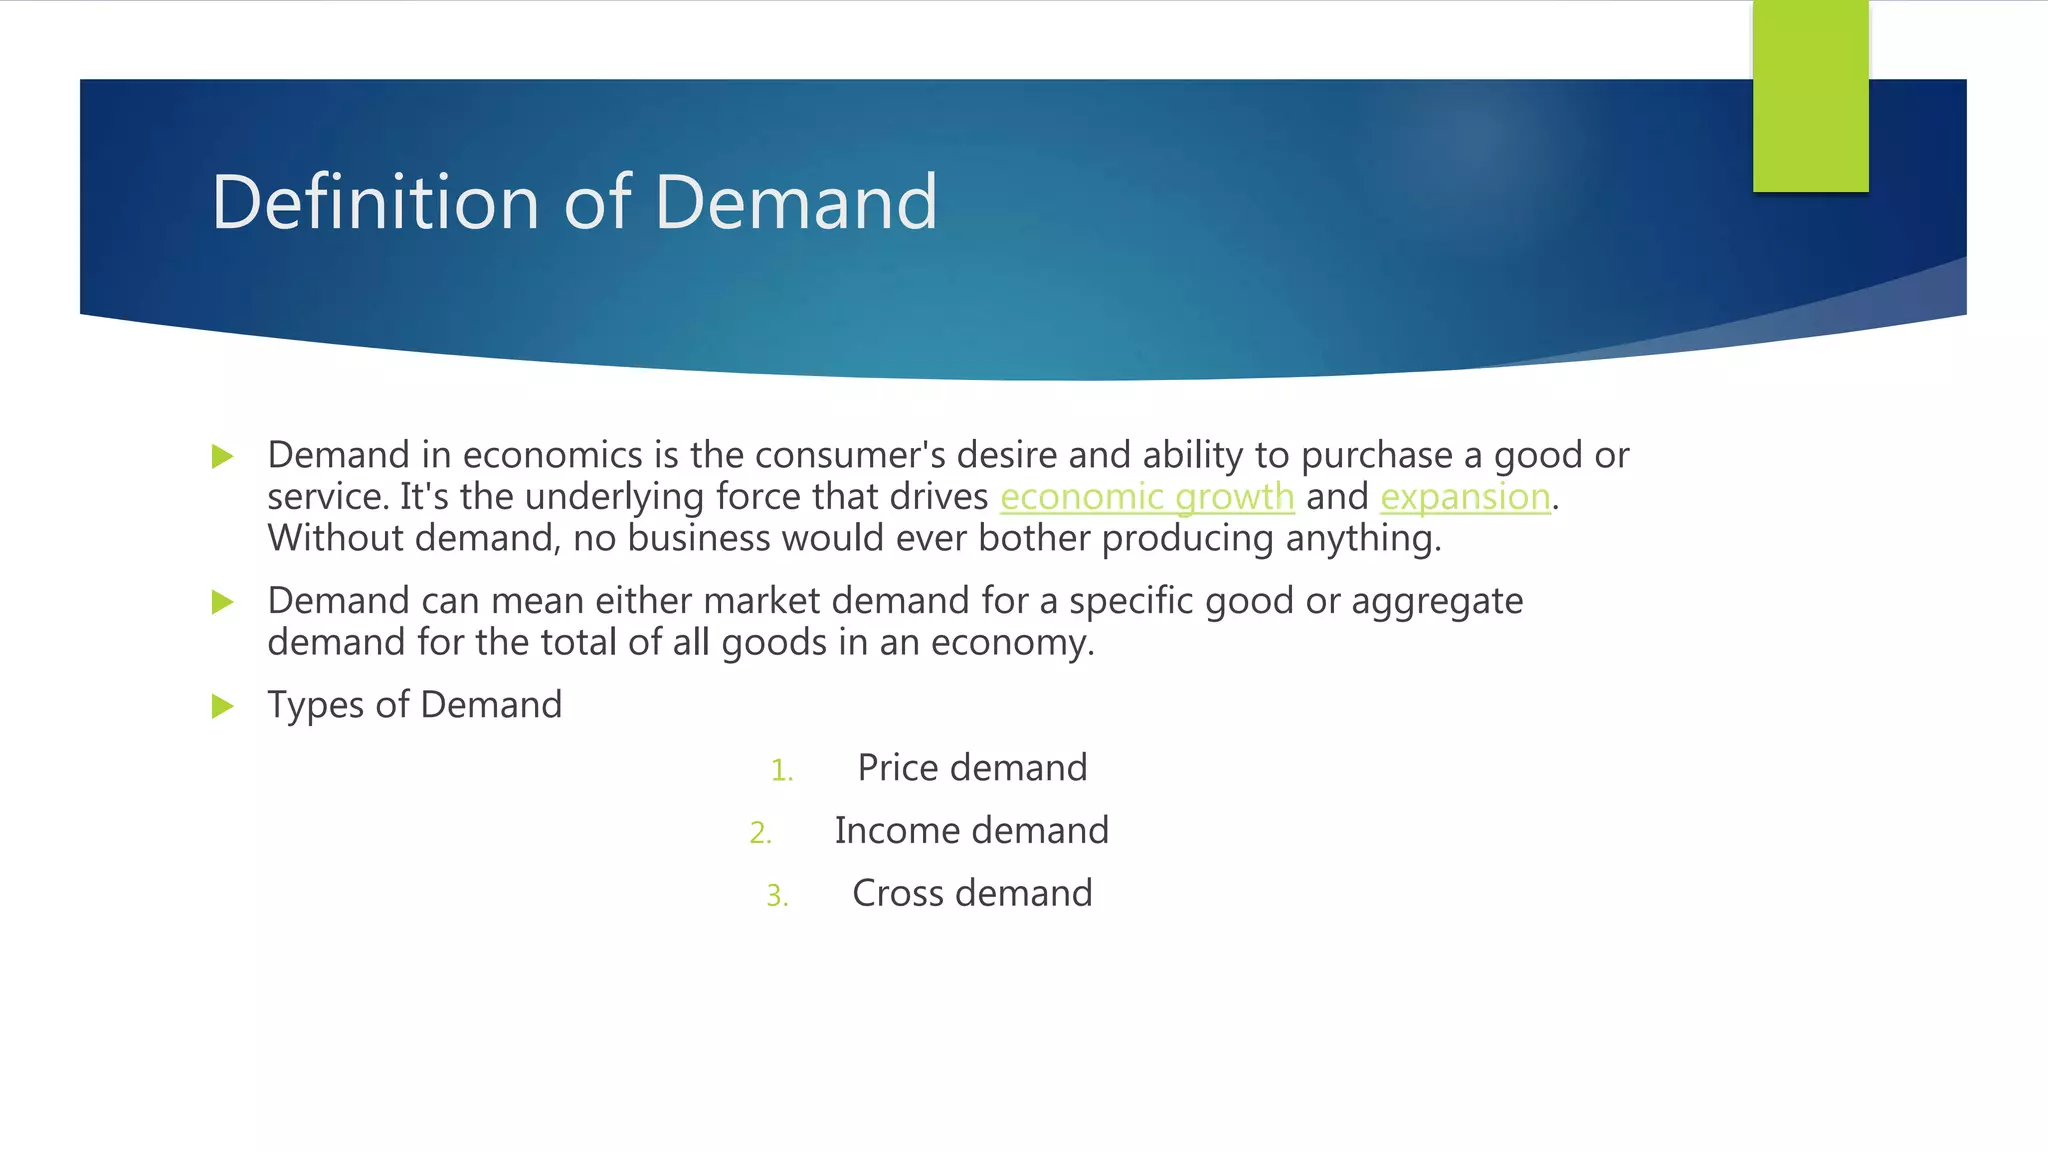
1. Demand is defined as consumer desire and ability to purchase goods and services, and is the driving force behind economic growth.
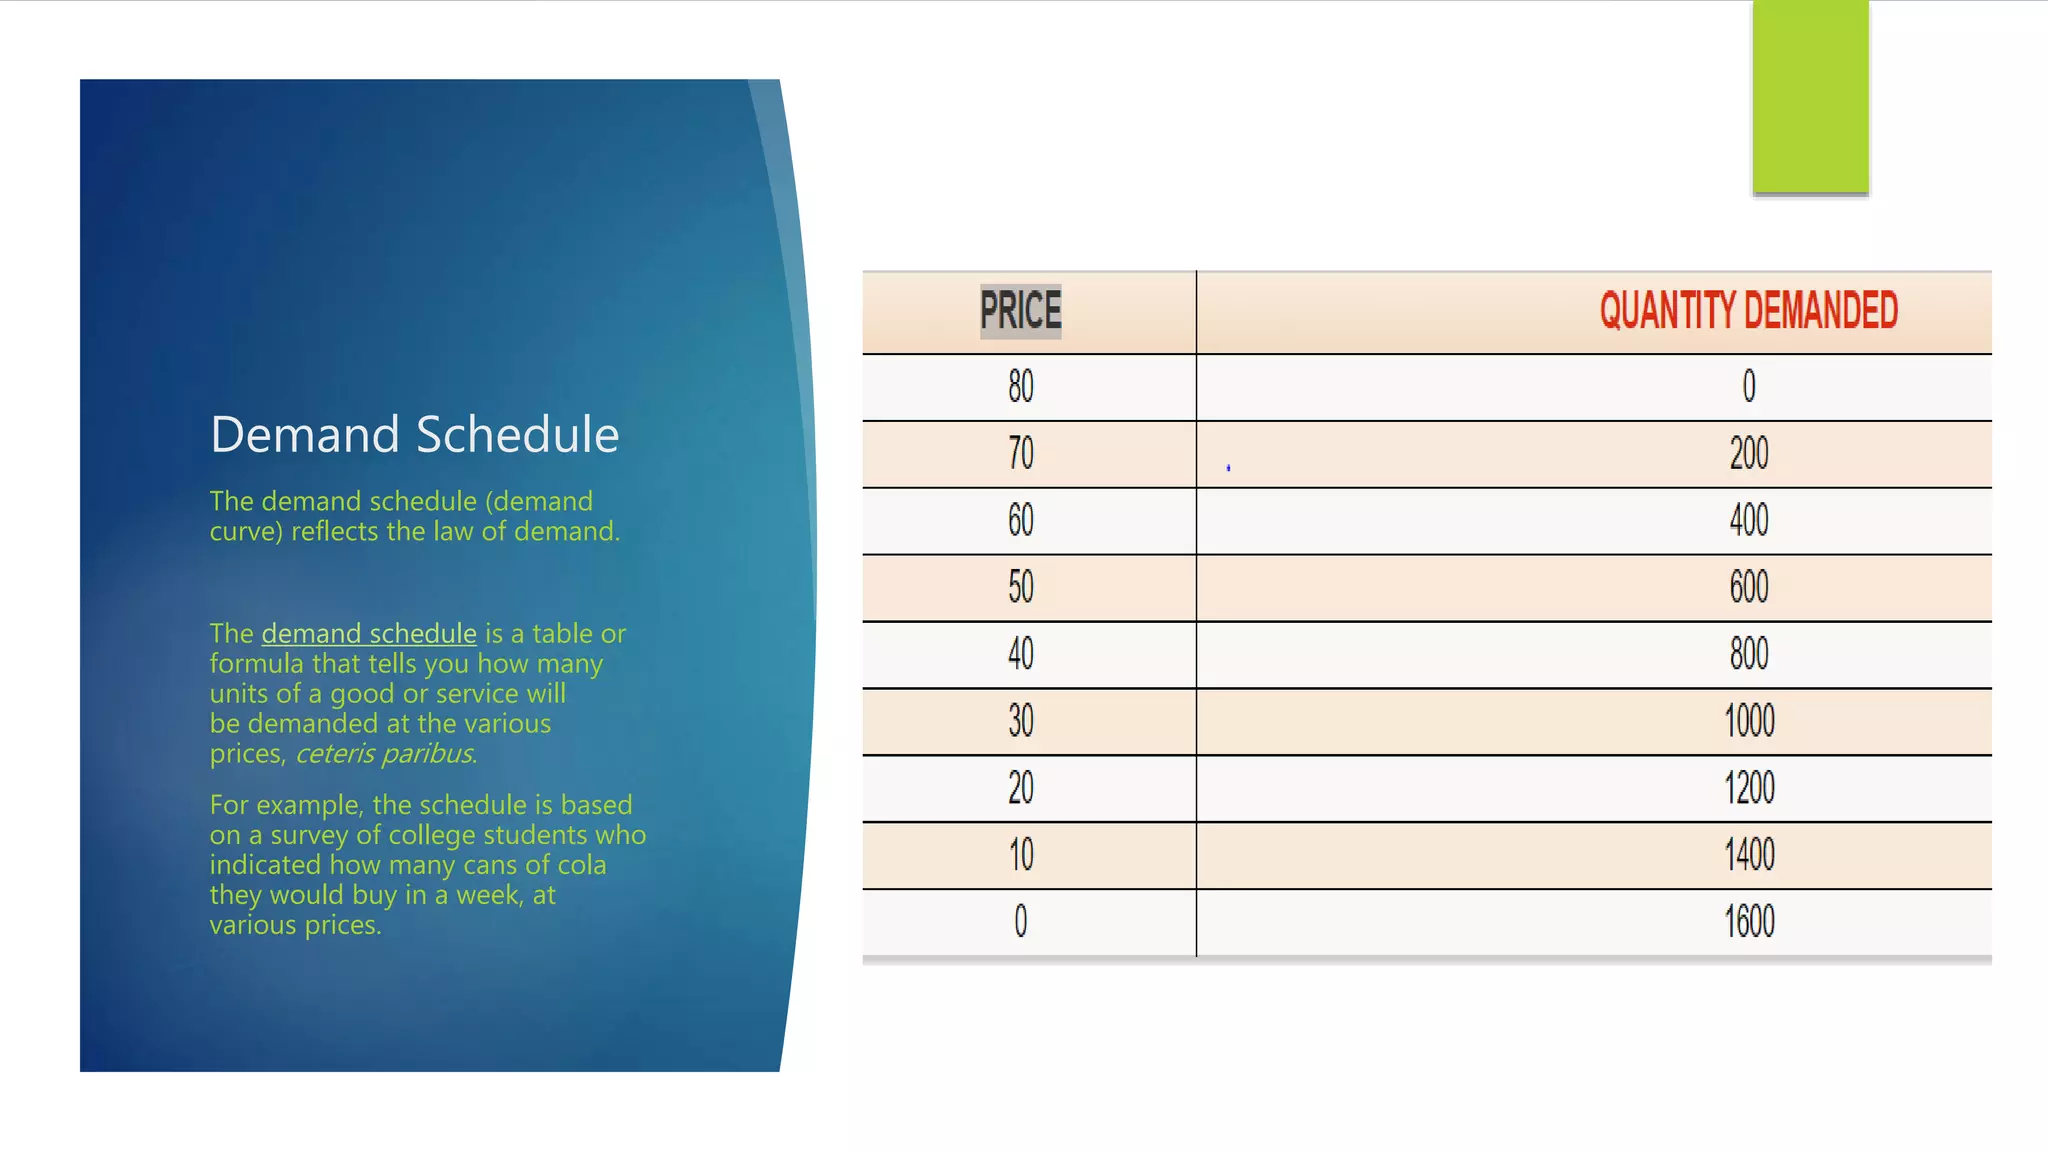
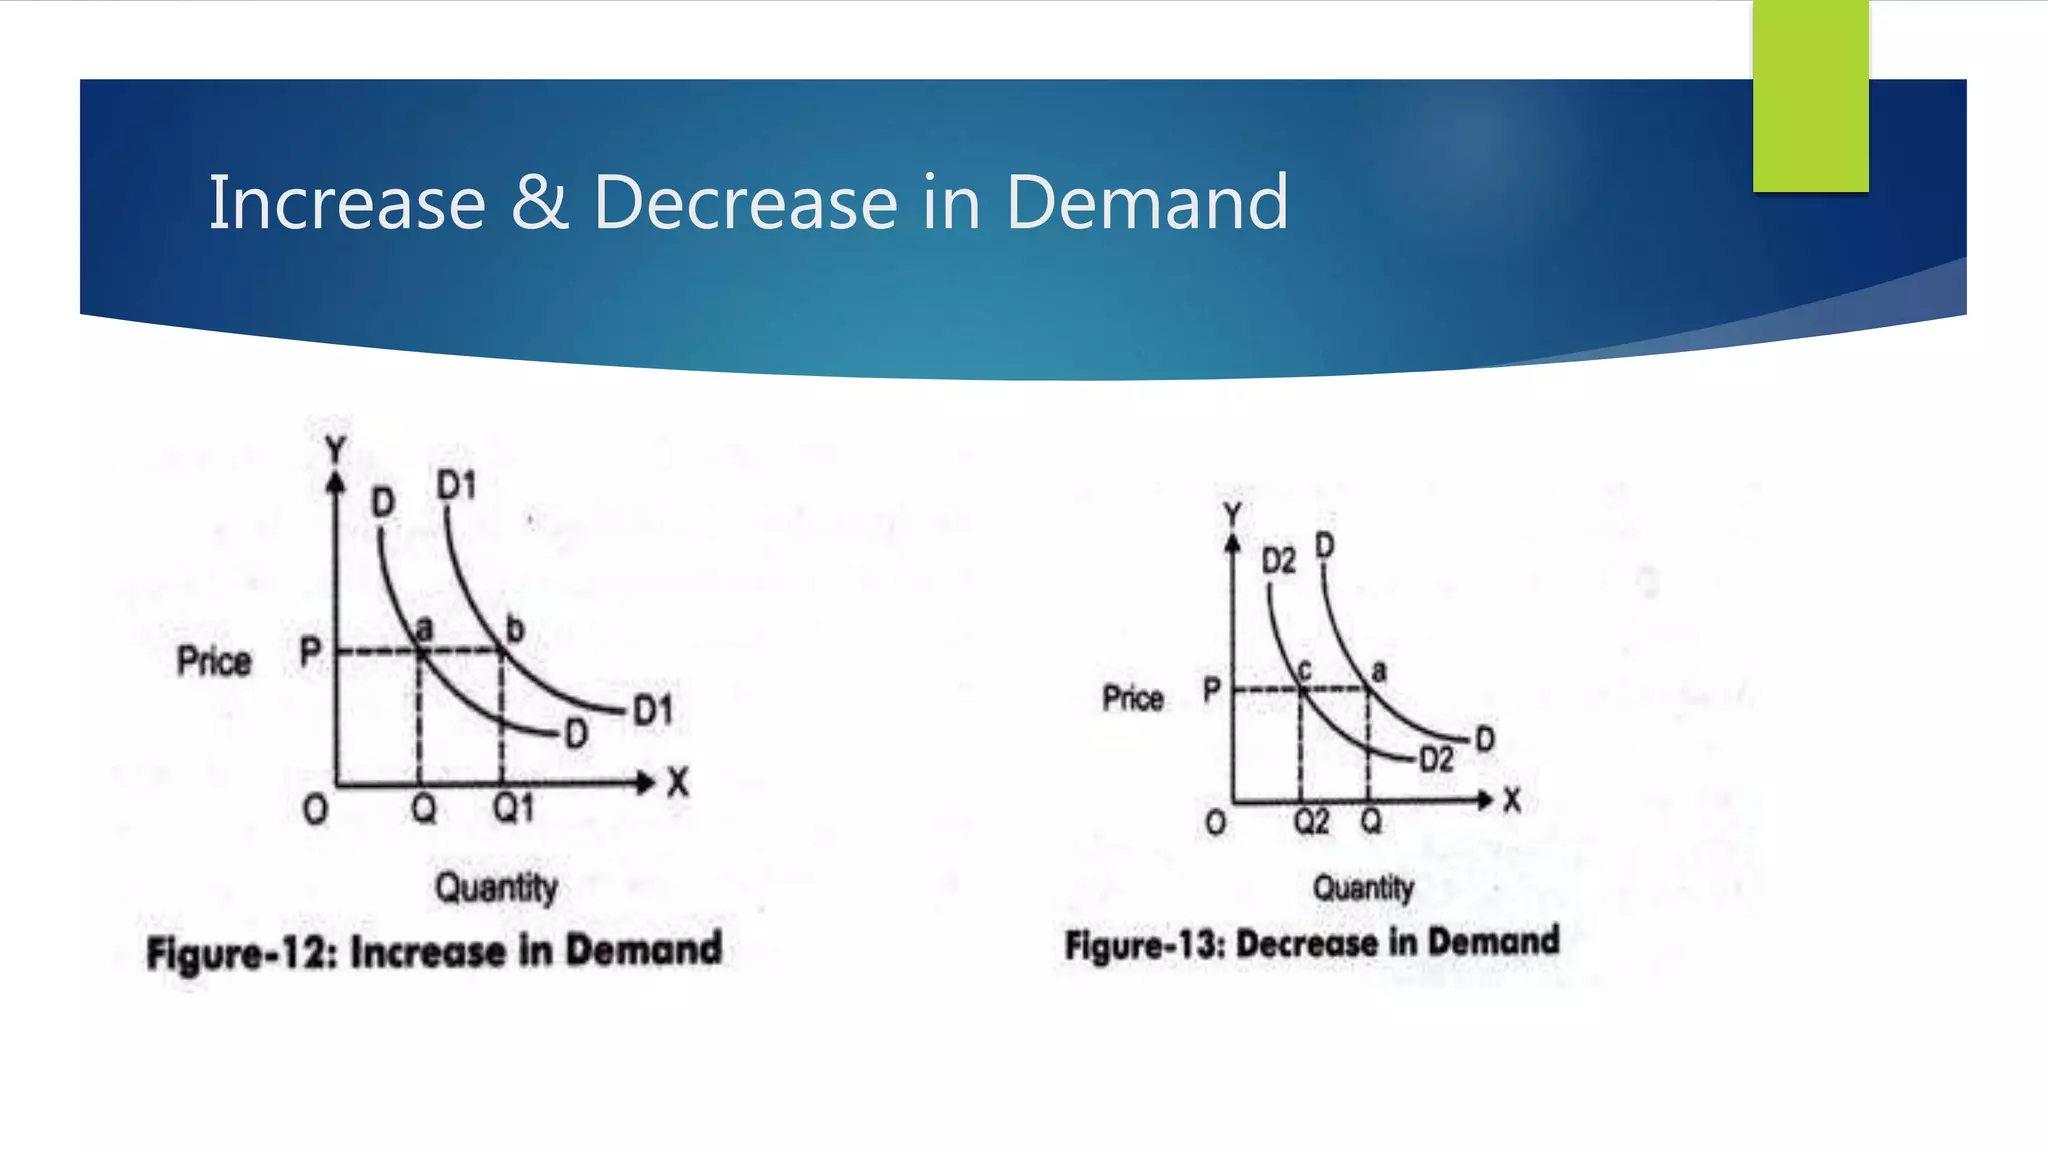
2. The law of demand states that as price increases, quantity demanded decreases, and vice versa.
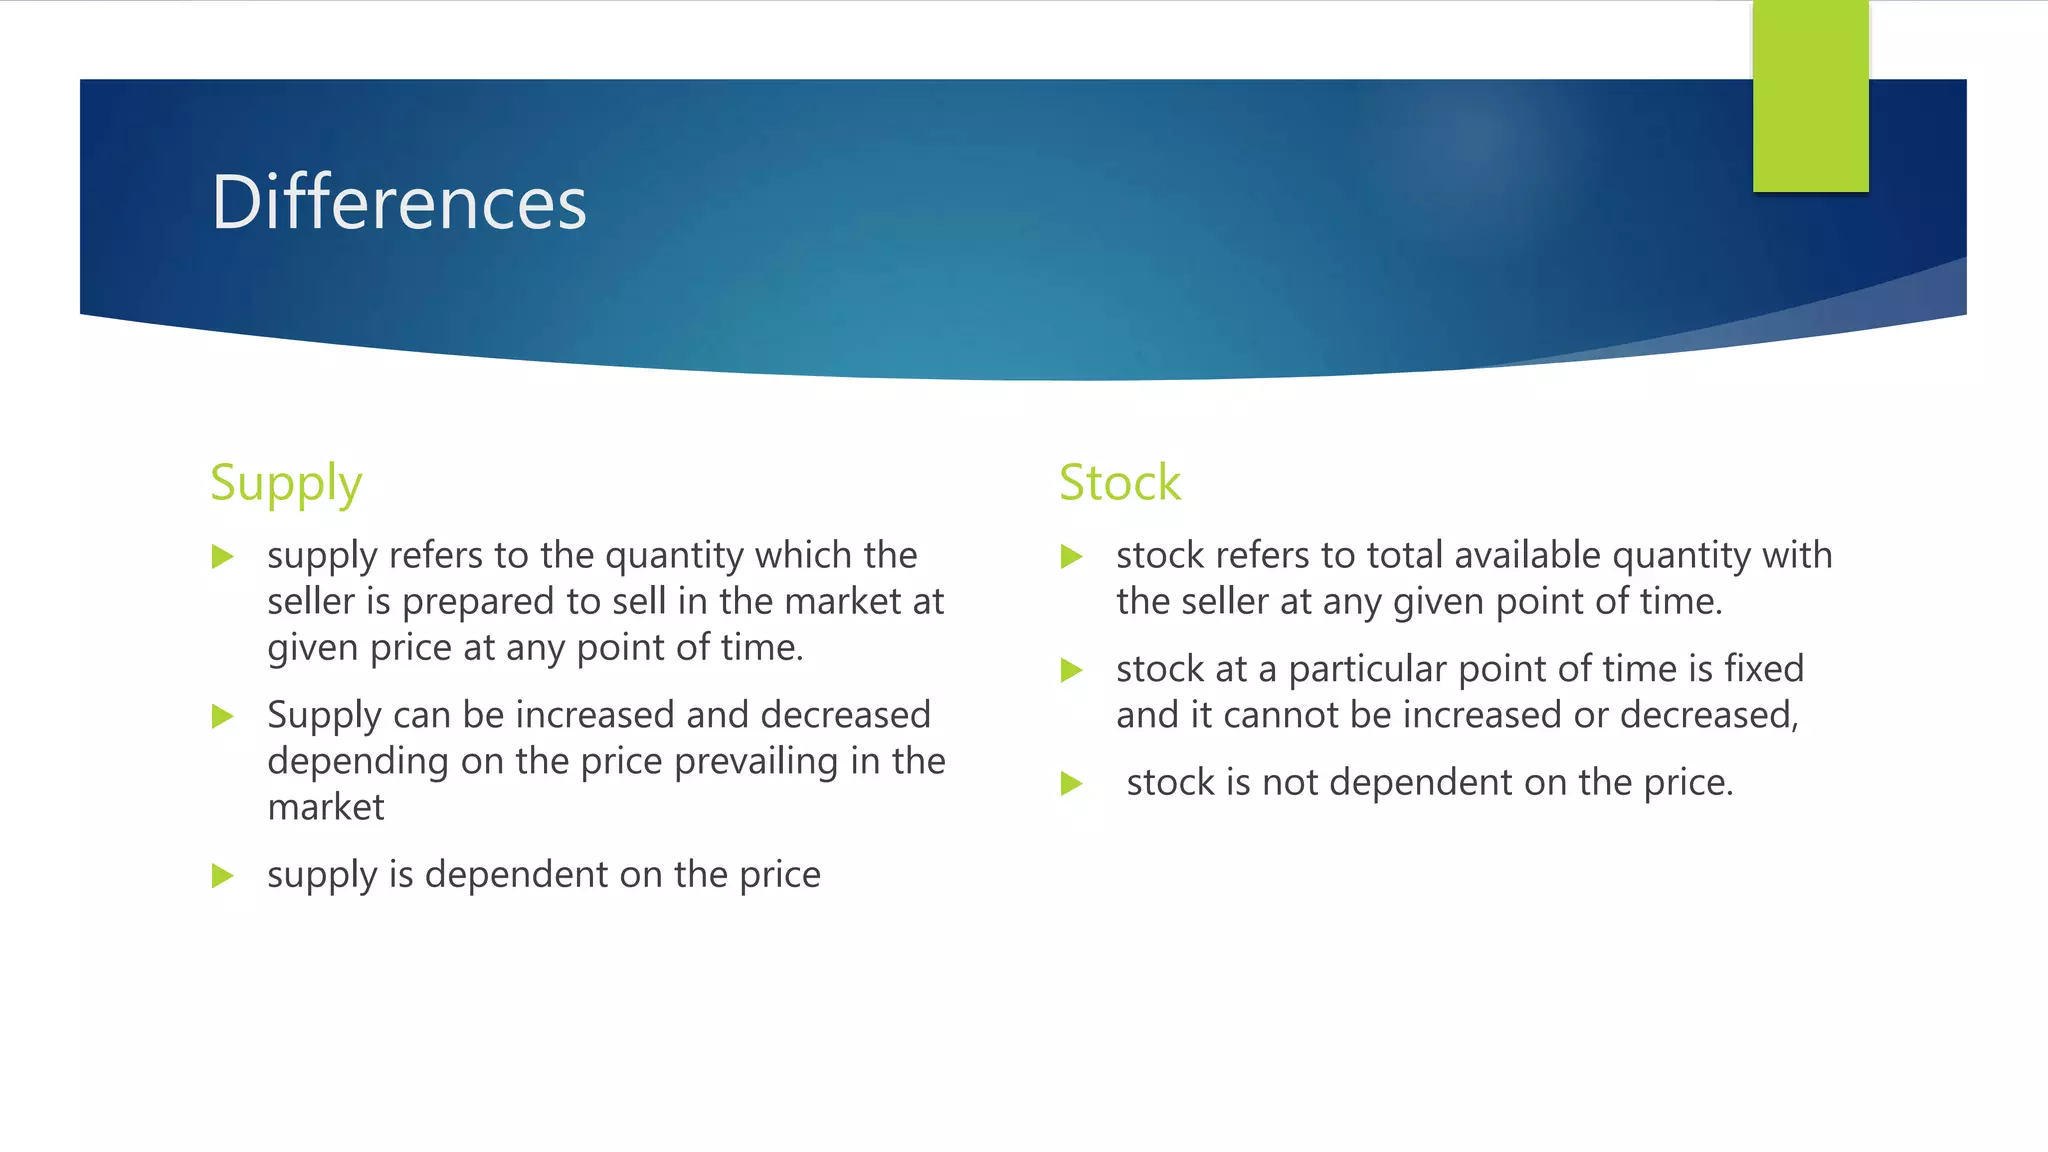
3. Supply is defined as the willingness and ability of producers to provide goods and services to the market. The law of supply states that as price increases, quantity supplied increases as well.
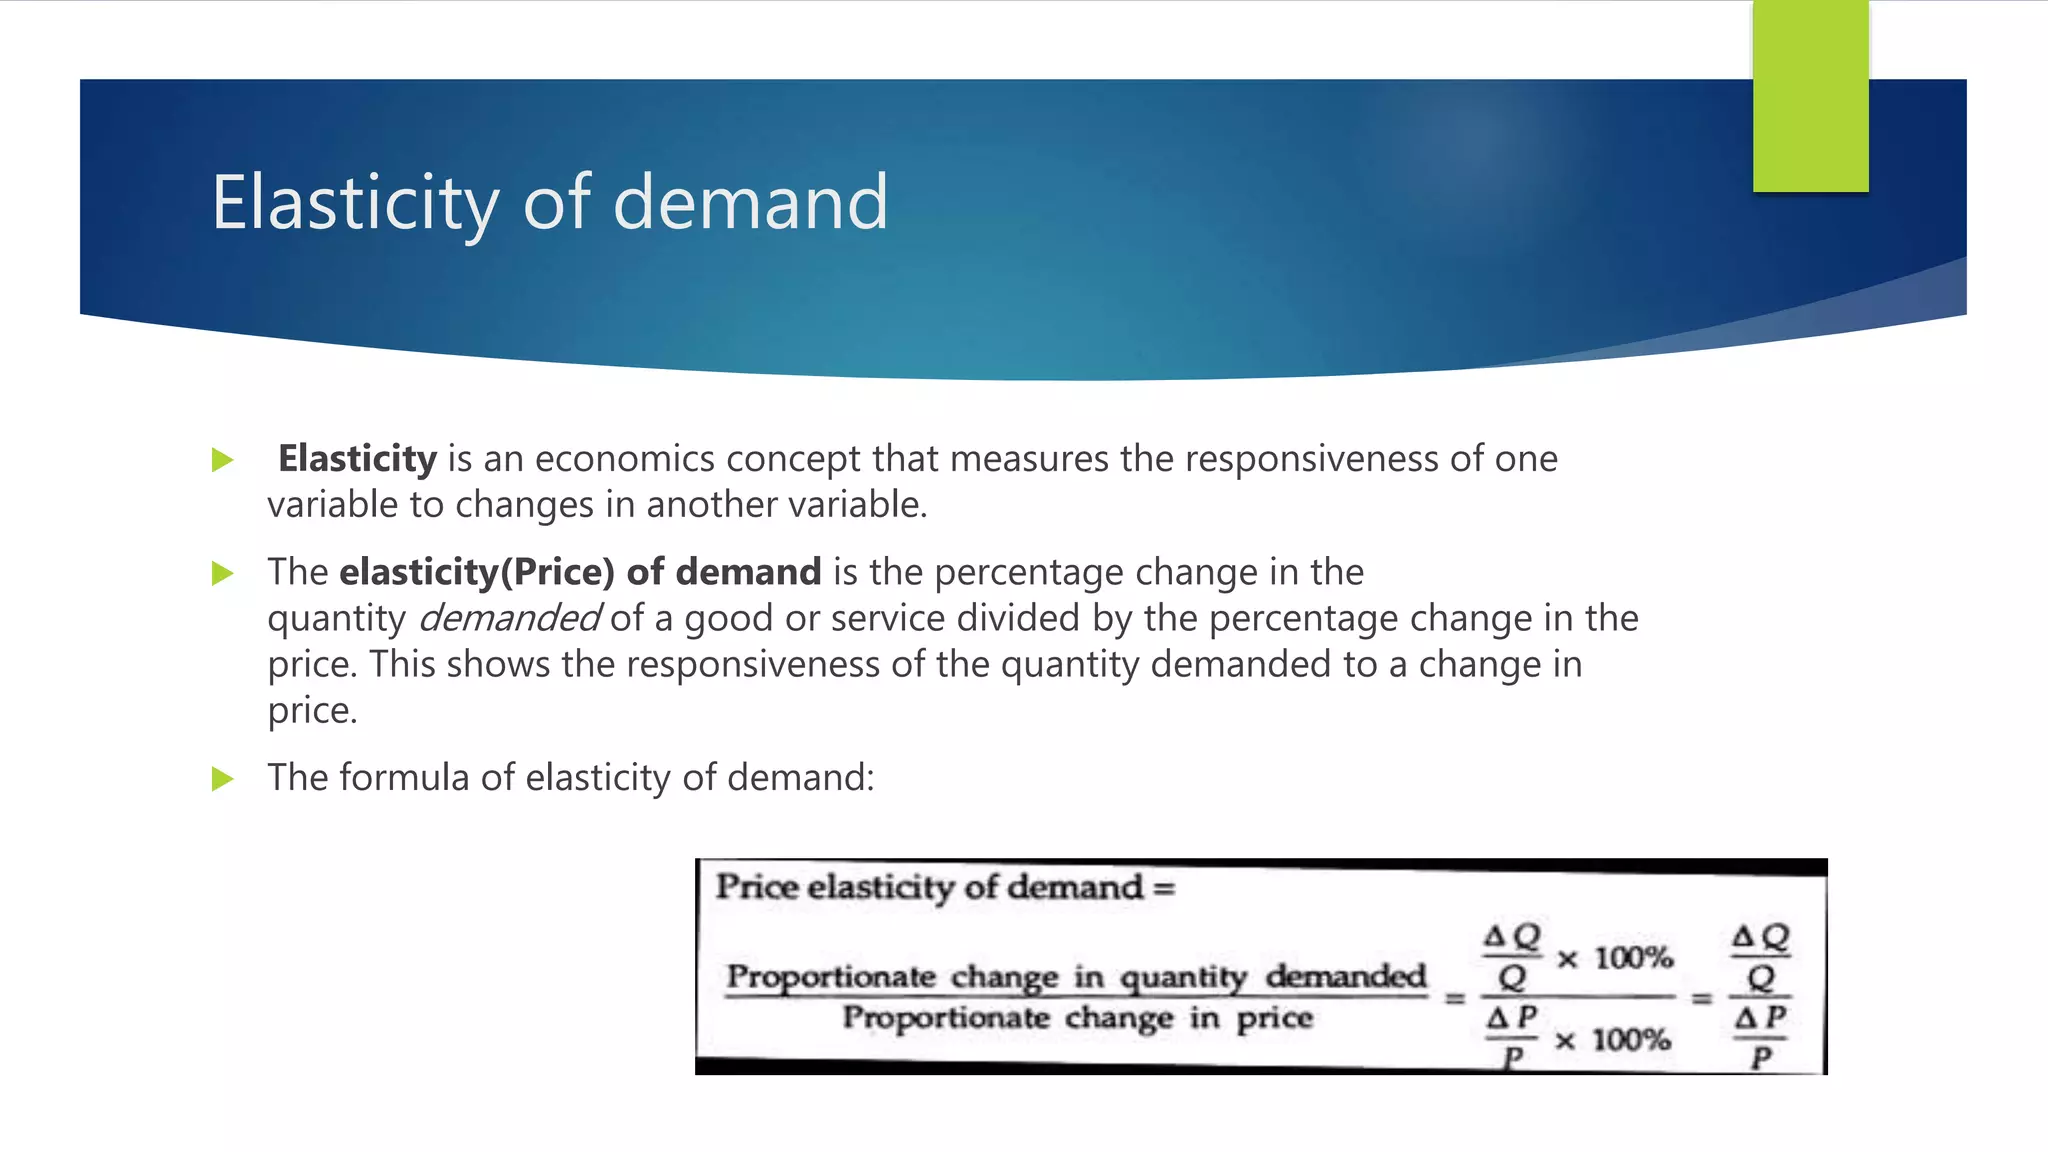
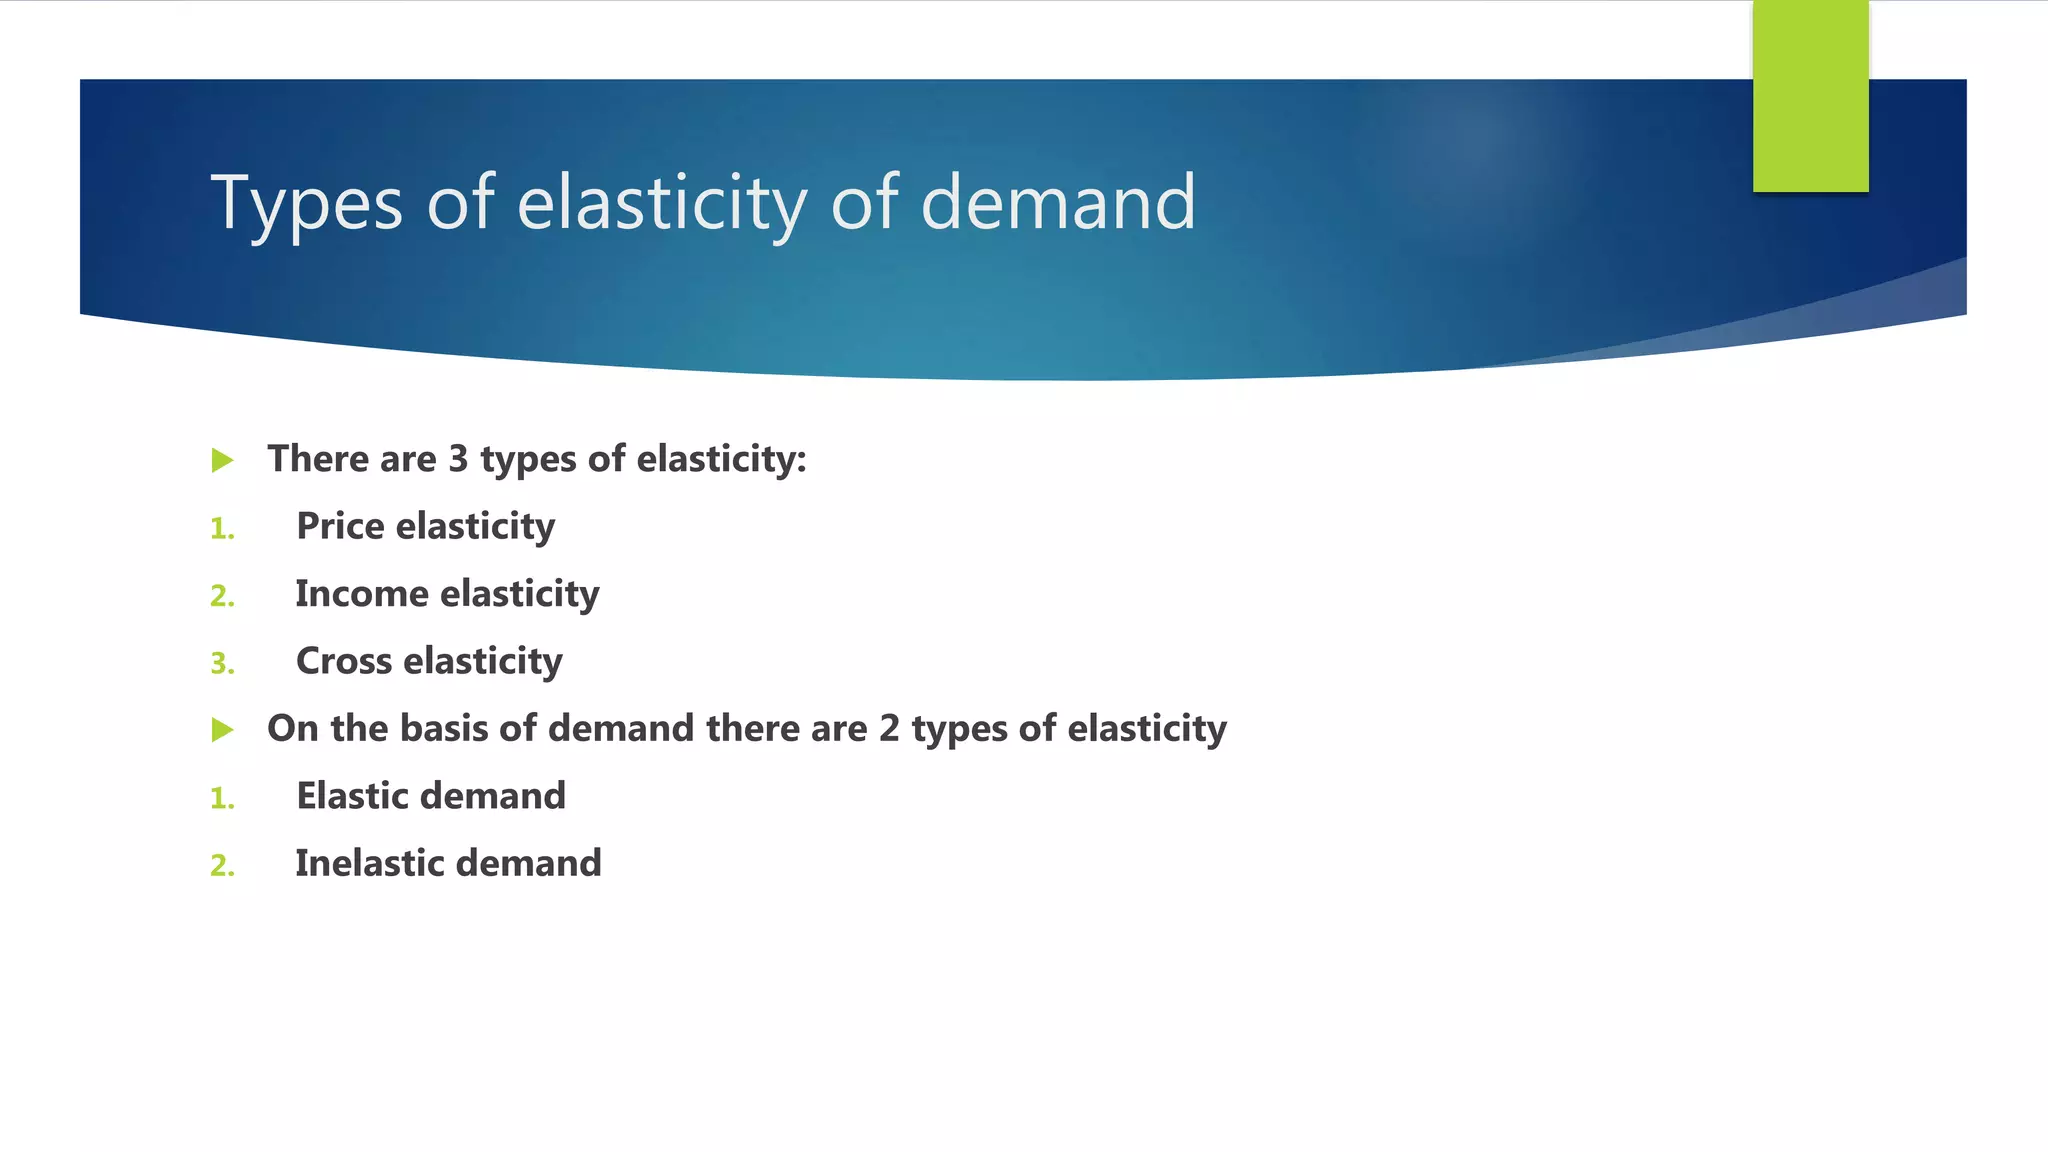
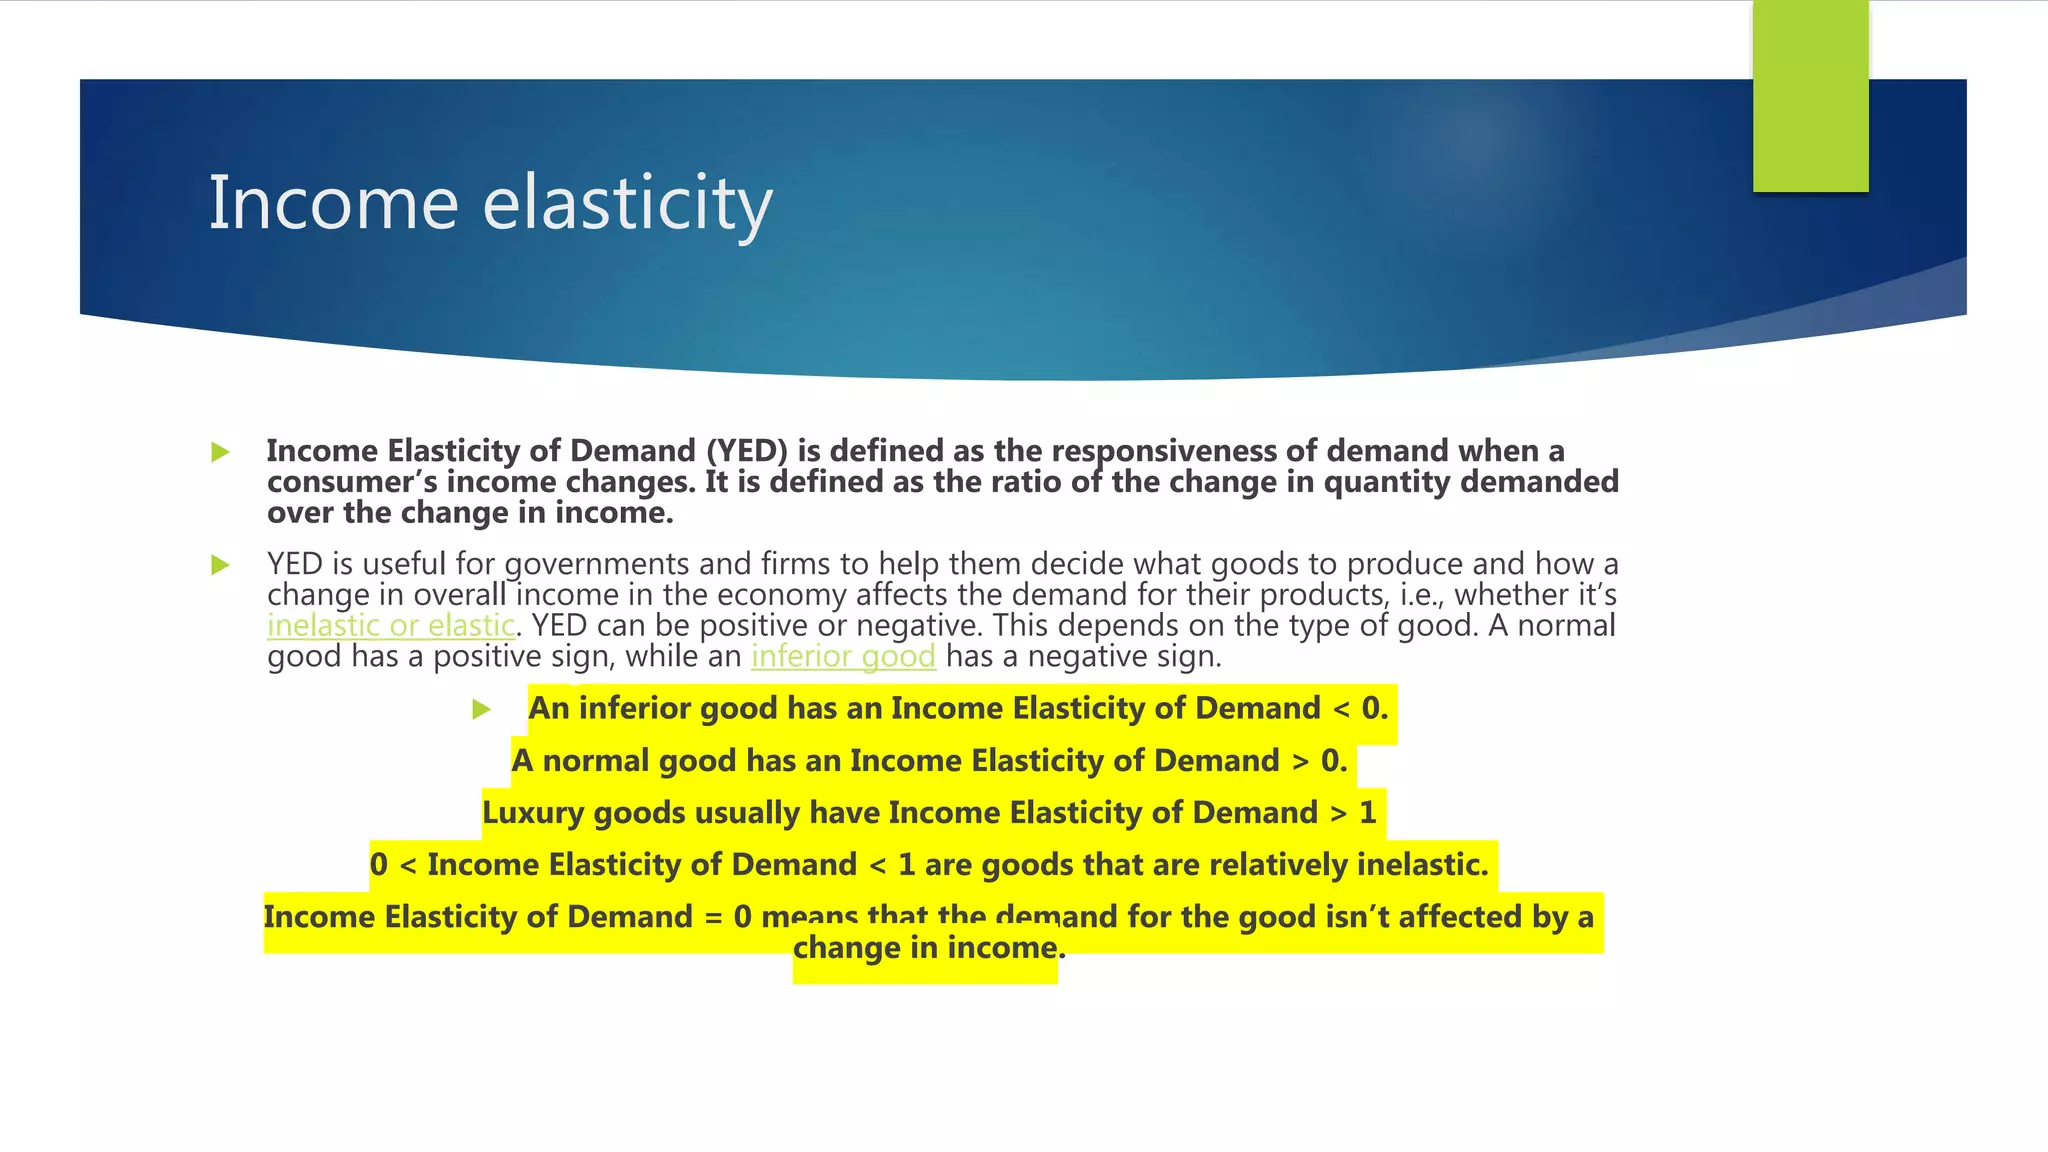
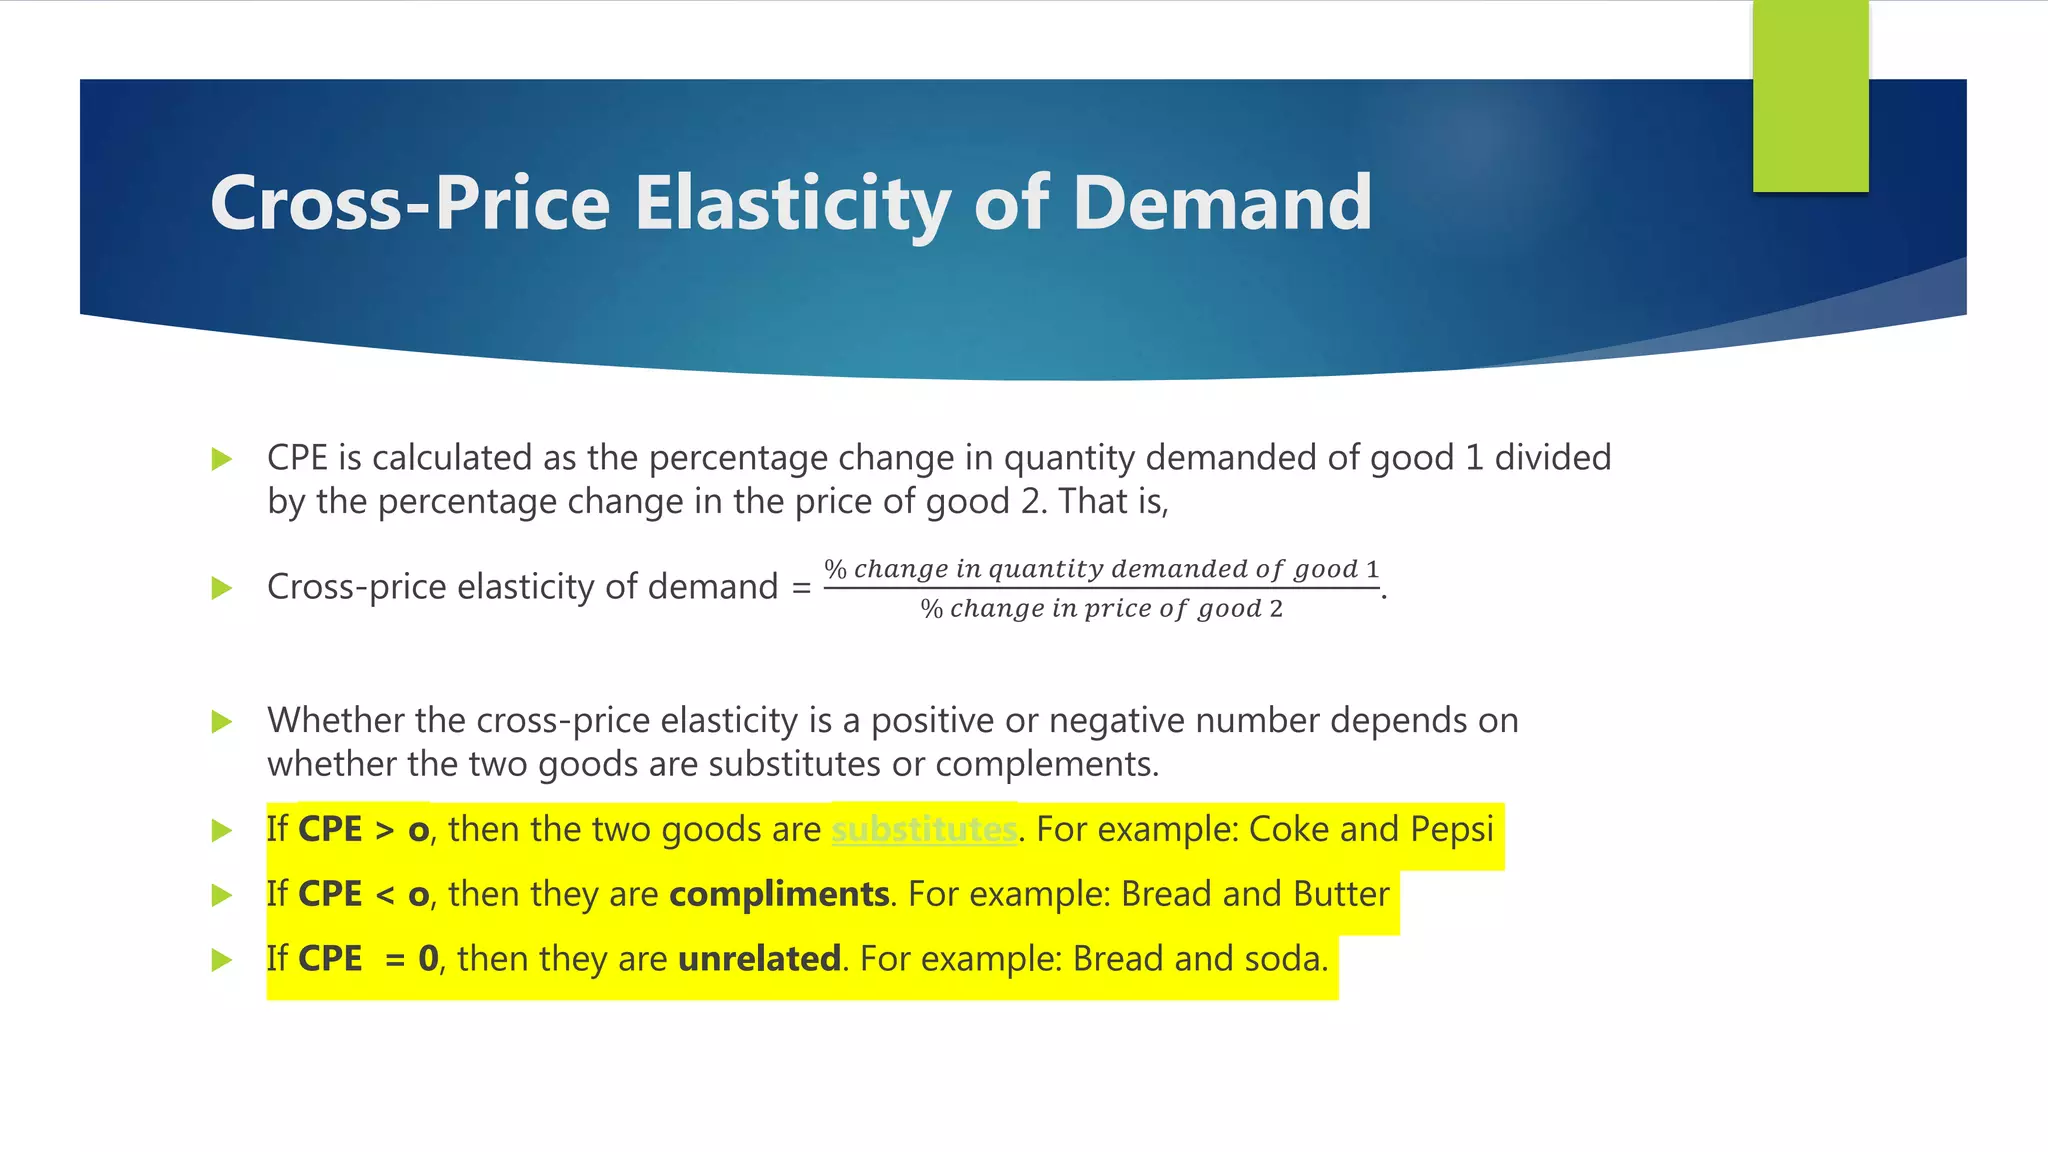
4. Elasticity measures the responsiveness of one variable to changes in another, and is calculated for price, income, and cross elasticity. Demand can be elastic or inelastic depending on the degree of responsiveness to price