Download to read offline
![Figure 7
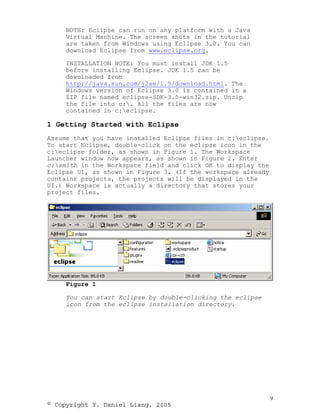
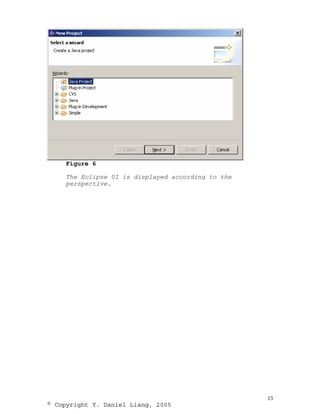
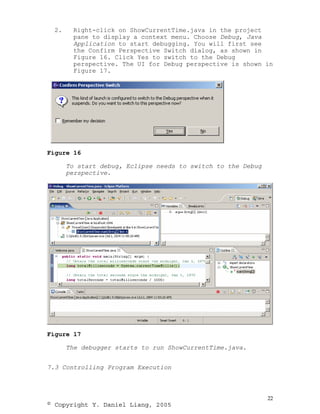
The Eclipse UI is displayed according to the
perspective.
4 Creating a Program
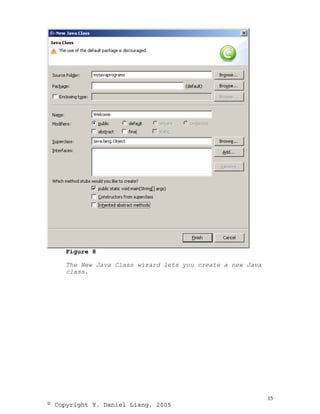
Now you can create a program in the project by choosing
File, New, Class to display the New Java Class wizard, as
shown in Figure 8. Type Welcome in the Name field. Check the
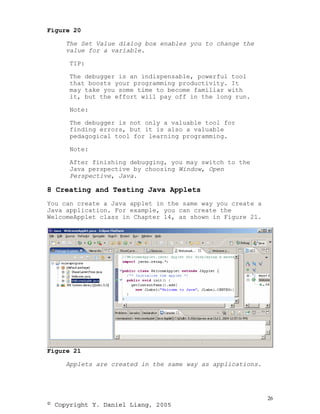
option public static void main(String[] args). Click Finish
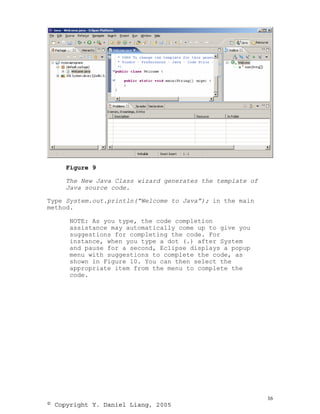
to generate the template for the source code Welcome.java,
as shown in Figure 9.
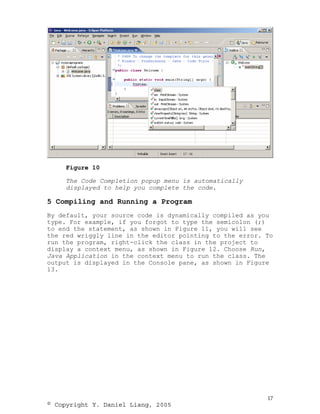
NOTE:
You may use a package by entering a package name
in the Package field in Figure 9. Since the
source code in the book does not use packages,
the Package field is left blank to match the
code in the book.
14
© Copyright Y. Daniel Liang, 2005](https://image.slidesharecdn.com/supplementjeclipse-100118020713-phpapp01/85/Supplement-J-Eclipse-7-320.jpg)

This document provides an overview and instructions for using the Eclipse integrated development environment (IDE) for creating and running Java programs. It covers getting started with Eclipse, choosing a perspective, creating a Java project and class, compiling and running programs within Eclipse, running programs from the command line, and debugging programs using Eclipse's debugger. The document contains screenshots to illustrate the various Eclipse windows and menus.