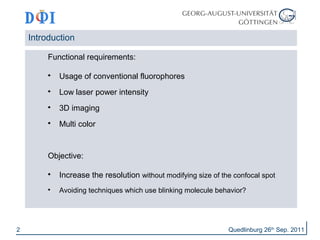
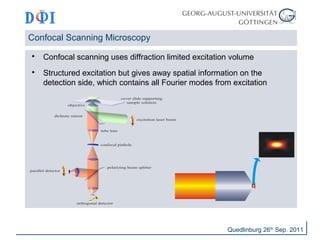
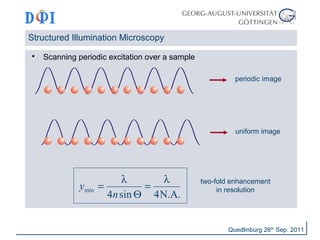
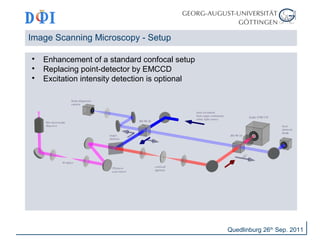
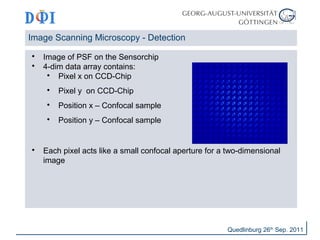
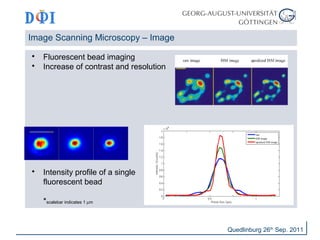
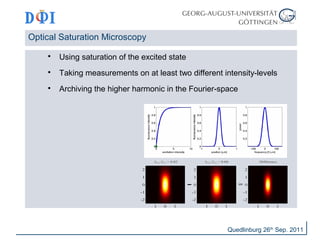
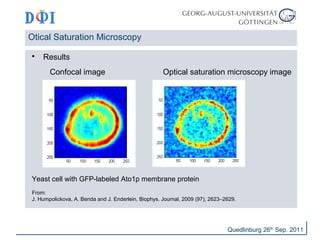
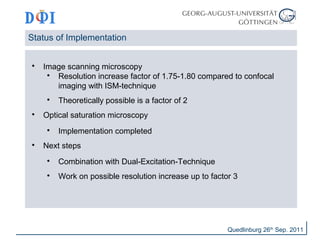
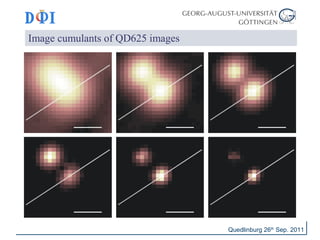
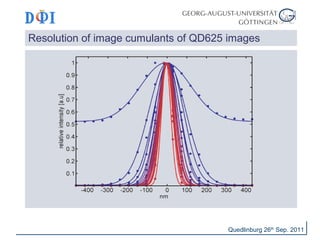
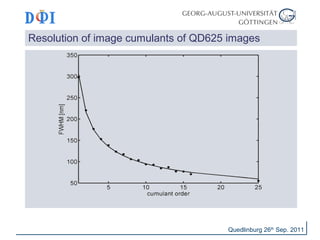
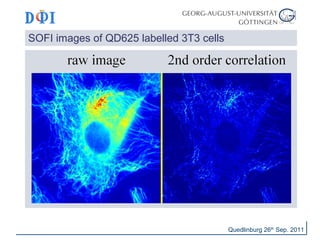
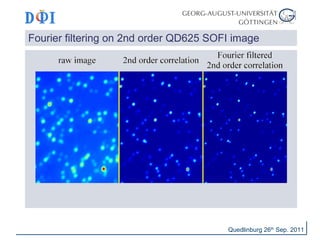
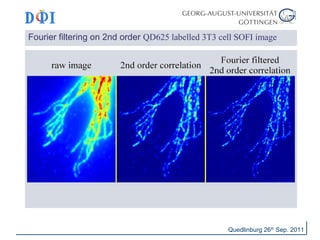
Summerschool Quedlinburg 2011 
Image Scanning Microscopy (ISM) 
Superresolution Optical Fluctuation Imaging (SOFI) 
Dirk Hähnel, Jörg Enderlein 
III. Institute of Physics – Biophysics 
Georg-August-University Göttingen 
Quedlinburg 26th Sep. 2011
Introduction 
Functional requirements: 
 Usage of conventional fluorophores 
 Low laser power intensity 
 3D imaging 
 Multi color 
Objective: 
 Increase the resolution without modifying size of the confocal spot 
 Avoiding techniques which use blinking molecule behavior? 
2 Quedlinburg 26th Sep. 2011
3 
Lateral Resolution Limit of Standard Light Microscopy 
 Emission is considered as a planar wave from point-like-source 
 Using pure diffraction optics 
 Resolution limit at a phase difference of π/2 
N.A. = n∙sinq 
Quedlinburg 26th Sep. 2011 
l 
2n∙sinq 
q 
objective
Confocal Scanning Microscopy 
 Confocal scanning uses diffraction limited excitation volume 
 Structured excitation but gives away spatial information on the 
detection side, which contains all Fourier modes from excitation 
Quedlinburg 26th Sep. 2011
Structured Illumination Microscopy 
 Scanning periodic excitation over a sample 
periodic image 
uniform image 
Quedlinburg 26th Sep. 2011 
= l = l 
min 4 sin 4N.A. 
y 
n 
Q 
two-fold enhancement 
in resolution
Image Scanning Microscopy - Setup 
 Enhancement of a standard confocal setup 
 Replacing point-detector by EMCCD 
 Excitation intensity detection is optional 
Quedlinburg 26th Sep. 2011
Image Scanning Microscopy - Detection 
 Image of PSF on the Sensorchip 
 4-dim data array contains: 
 Pixel x on CCD-Chip 
 Pixel y on CCD-Chip 
 Position x – Confocal sample 
 Position y – Confocal sample 
 Each pixel acts like a small confocal aperture for a two-dimensional 
image 
Quedlinburg 26th Sep. 2011
Image Scanning Microscopy – Image 
 Fluorescent bead imaging 
 Increase of contrast and resolution 
 Intensity profile of a single 
fluorescent bead 
*scalebar indicates 1 mm 
Quedlinburg 26th Sep. 2011
Optical Saturation Microscopy 
 Using saturation of the excited state 
 Taking measurements on at least two different intensity-levels 
 Archiving the higher harmonic in the Fourier-space 
Quedlinburg 26th Sep. 2011
Otical Saturation Microscopy 
Quedlinburg 26th Sep. 2011 
 Results 
Confocal image Optical saturation microscopy image 
Yeast cell with GFP-labeled Ato1p membrane protein 
From: 
J. Humpolickova, A. Benda and J. Enderlein, Biophys. Journal, 2009 (97), 2623–2629.
Drawbacks and Advantages 
 Drawbacks: 
 Optical quality of components 
 Chromatic aberration 
 Data handling 
 Scan speed 
 “Step and settle” on each pixel required 
 Limited camera speed 
 Automation requires nanosecond input/output timing 
 Advantages: 
 Any dye works 
 Excitation power can be lowered 
 3D-capability 
 Multicolor 
Quedlinburg 26th Sep. 2011
Status of Implementation 
 Image scanning microscopy 
 Resolution increase factor of 1.75-1.80 compared to confocal 
imaging with ISM-technique 
 Theoretically possible is a factor of 2 
 Optical saturation microscopy 
 Implementation completed 
 Next steps 
 Combination with Dual-Excitation-Technique 
 Work on possible resolution increase up to factor 3 
Quedlinburg 26th Sep. 2011
Superresolution Optical Fluctuation Imaging (SOFI) 
 The fluorescent label has to exhibit at least two different emission states. For 
example, these states can be a fluorescent and a non-fluorescent one, but in 
principle any two or more states which are optically distinguishable will do. 
 Different emitters have to switch between states repeatedly and independently 
from each other. 
Quedlinburg 26th Sep. 2011
Image cumulants of QD625 images 
Quedlinburg 26th Sep. 2011
Resolution of image cumulants of QD625 images 
Quedlinburg 26th Sep. 2011
Resolution of image cumulants of QD625 images 
Quedlinburg 26th Sep. 2011
SOFI images of QD625 labelled 3T3 cells 
Quedlinburg 26th Sep. 2011
Fourier filtering on 2nd order QD625 SOFI image 
Quedlinburg 26th Sep. 2011
Fourier filtering on 2nd order QD625 labelled 3T3 cell SOFI image 
Quedlinburg 26th Sep. 2011
Conclusion - ISM 
 Combination of two techniques: 
 Structured illumination and detection 
 Optical saturation 
 Multicolor 
 3D Imaging 
 Any probes 
Easy enhance resolution of standard confocal microscopes 
Get super-resolution with “conventional” fluorophores 
Working on enhancement of resolution up to factor 3 
Quedlinburg 26th Sep. 2011
Conclusion - SOFI 
 Implementation of SOFI is simple 
 It is inherently 3D 
 It is background eliminating 
 It works on all blinking probes (i.e. almost all probes) 
 It works on all types of microscope 
 Resolution is not limited to pixel size 
 It works not only on fluorescence 
Quedlinburg 26th Sep. 2011

Sumerschool DPI 2011 Quedlinburg

  • 1.
    Summerschool Quedlinburg 2011 Image Scanning Microscopy (ISM) Superresolution Optical Fluctuation Imaging (SOFI) Dirk Hähnel, Jörg Enderlein III. Institute of Physics – Biophysics Georg-August-University Göttingen Quedlinburg 26th Sep. 2011
  • 2.
    Introduction Functional requirements:  Usage of conventional fluorophores  Low laser power intensity  3D imaging  Multi color Objective:  Increase the resolution without modifying size of the confocal spot  Avoiding techniques which use blinking molecule behavior? 2 Quedlinburg 26th Sep. 2011
  • 3.
    3 Lateral ResolutionLimit of Standard Light Microscopy  Emission is considered as a planar wave from point-like-source  Using pure diffraction optics  Resolution limit at a phase difference of π/2 N.A. = n∙sinq Quedlinburg 26th Sep. 2011 l 2n∙sinq q objective
  • 4.
    Confocal Scanning Microscopy  Confocal scanning uses diffraction limited excitation volume  Structured excitation but gives away spatial information on the detection side, which contains all Fourier modes from excitation Quedlinburg 26th Sep. 2011
  • 5.
    Structured Illumination Microscopy  Scanning periodic excitation over a sample periodic image uniform image Quedlinburg 26th Sep. 2011 = l = l min 4 sin 4N.A. y n Q two-fold enhancement in resolution
  • 6.
    Image Scanning Microscopy- Setup  Enhancement of a standard confocal setup  Replacing point-detector by EMCCD  Excitation intensity detection is optional Quedlinburg 26th Sep. 2011
  • 7.
    Image Scanning Microscopy- Detection  Image of PSF on the Sensorchip  4-dim data array contains:  Pixel x on CCD-Chip  Pixel y on CCD-Chip  Position x – Confocal sample  Position y – Confocal sample  Each pixel acts like a small confocal aperture for a two-dimensional image Quedlinburg 26th Sep. 2011
  • 8.
    Image Scanning Microscopy– Image  Fluorescent bead imaging  Increase of contrast and resolution  Intensity profile of a single fluorescent bead *scalebar indicates 1 mm Quedlinburg 26th Sep. 2011
  • 9.
    Optical Saturation Microscopy  Using saturation of the excited state  Taking measurements on at least two different intensity-levels  Archiving the higher harmonic in the Fourier-space Quedlinburg 26th Sep. 2011
  • 10.
    Otical Saturation Microscopy Quedlinburg 26th Sep. 2011  Results Confocal image Optical saturation microscopy image Yeast cell with GFP-labeled Ato1p membrane protein From: J. Humpolickova, A. Benda and J. Enderlein, Biophys. Journal, 2009 (97), 2623–2629.
  • 11.
    Drawbacks and Advantages  Drawbacks:  Optical quality of components  Chromatic aberration  Data handling  Scan speed  “Step and settle” on each pixel required  Limited camera speed  Automation requires nanosecond input/output timing  Advantages:  Any dye works  Excitation power can be lowered  3D-capability  Multicolor Quedlinburg 26th Sep. 2011
  • 12.
    Status of Implementation  Image scanning microscopy  Resolution increase factor of 1.75-1.80 compared to confocal imaging with ISM-technique  Theoretically possible is a factor of 2  Optical saturation microscopy  Implementation completed  Next steps  Combination with Dual-Excitation-Technique  Work on possible resolution increase up to factor 3 Quedlinburg 26th Sep. 2011
  • 13.
    Superresolution Optical FluctuationImaging (SOFI)  The fluorescent label has to exhibit at least two different emission states. For example, these states can be a fluorescent and a non-fluorescent one, but in principle any two or more states which are optically distinguishable will do.  Different emitters have to switch between states repeatedly and independently from each other. Quedlinburg 26th Sep. 2011
  • 14.
    Image cumulants ofQD625 images Quedlinburg 26th Sep. 2011
  • 15.
    Resolution of imagecumulants of QD625 images Quedlinburg 26th Sep. 2011
  • 16.
    Resolution of imagecumulants of QD625 images Quedlinburg 26th Sep. 2011
  • 17.
    SOFI images ofQD625 labelled 3T3 cells Quedlinburg 26th Sep. 2011
  • 18.
    Fourier filtering on2nd order QD625 SOFI image Quedlinburg 26th Sep. 2011
  • 19.
    Fourier filtering on2nd order QD625 labelled 3T3 cell SOFI image Quedlinburg 26th Sep. 2011
  • 20.
    Conclusion - ISM  Combination of two techniques:  Structured illumination and detection  Optical saturation  Multicolor  3D Imaging  Any probes Easy enhance resolution of standard confocal microscopes Get super-resolution with “conventional” fluorophores Working on enhancement of resolution up to factor 3 Quedlinburg 26th Sep. 2011
  • 21.
    Conclusion - SOFI  Implementation of SOFI is simple  It is inherently 3D  It is background eliminating  It works on all blinking probes (i.e. almost all probes)  It works on all types of microscope  Resolution is not limited to pixel size  It works not only on fluorescence Quedlinburg 26th Sep. 2011