Download as PDF, PPTX
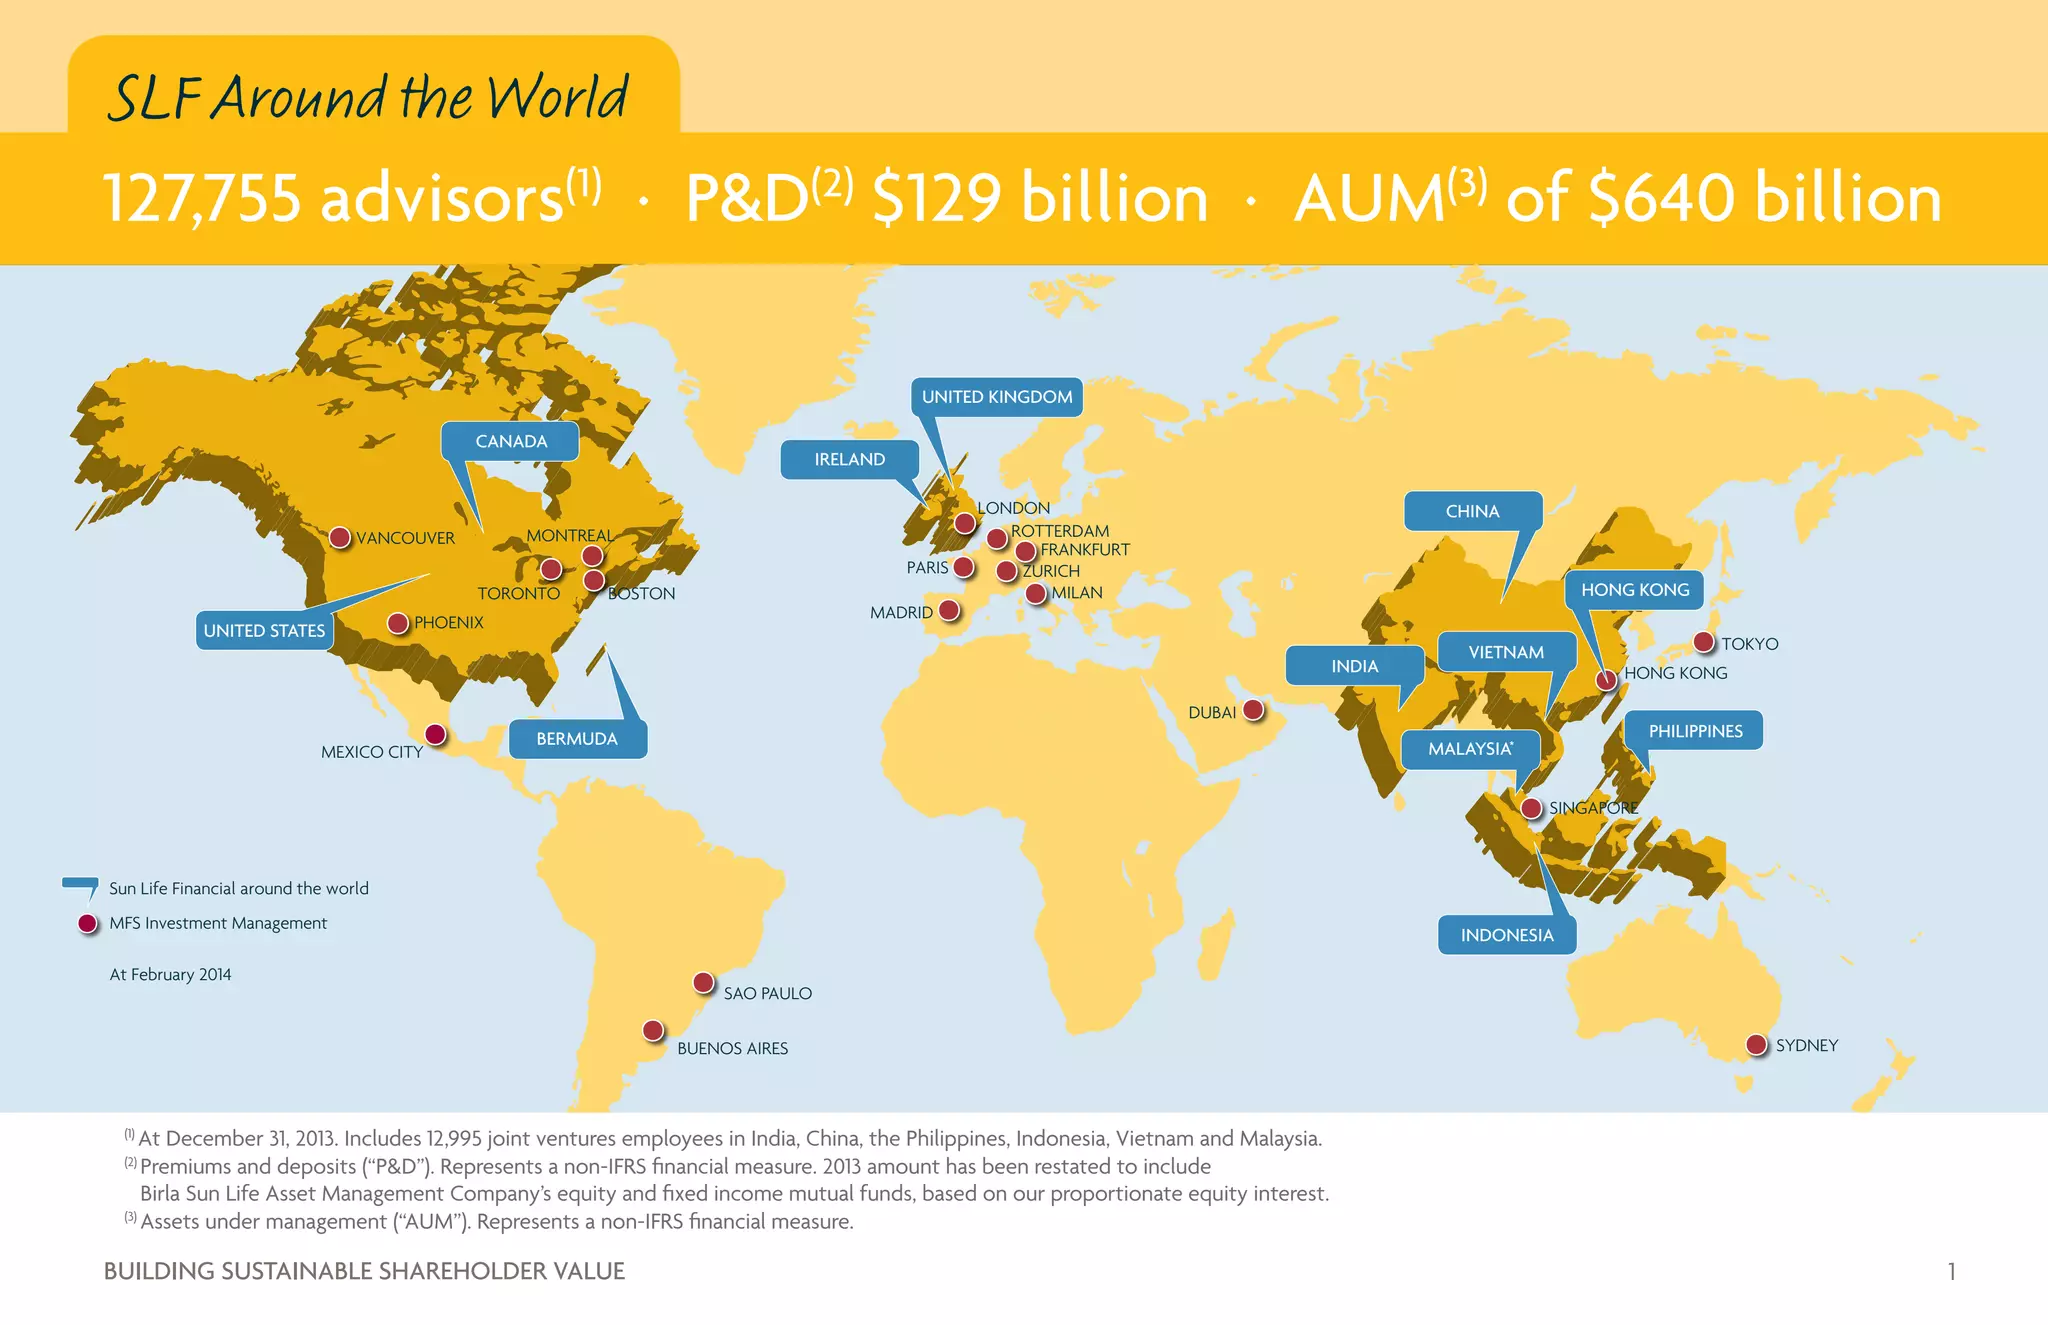
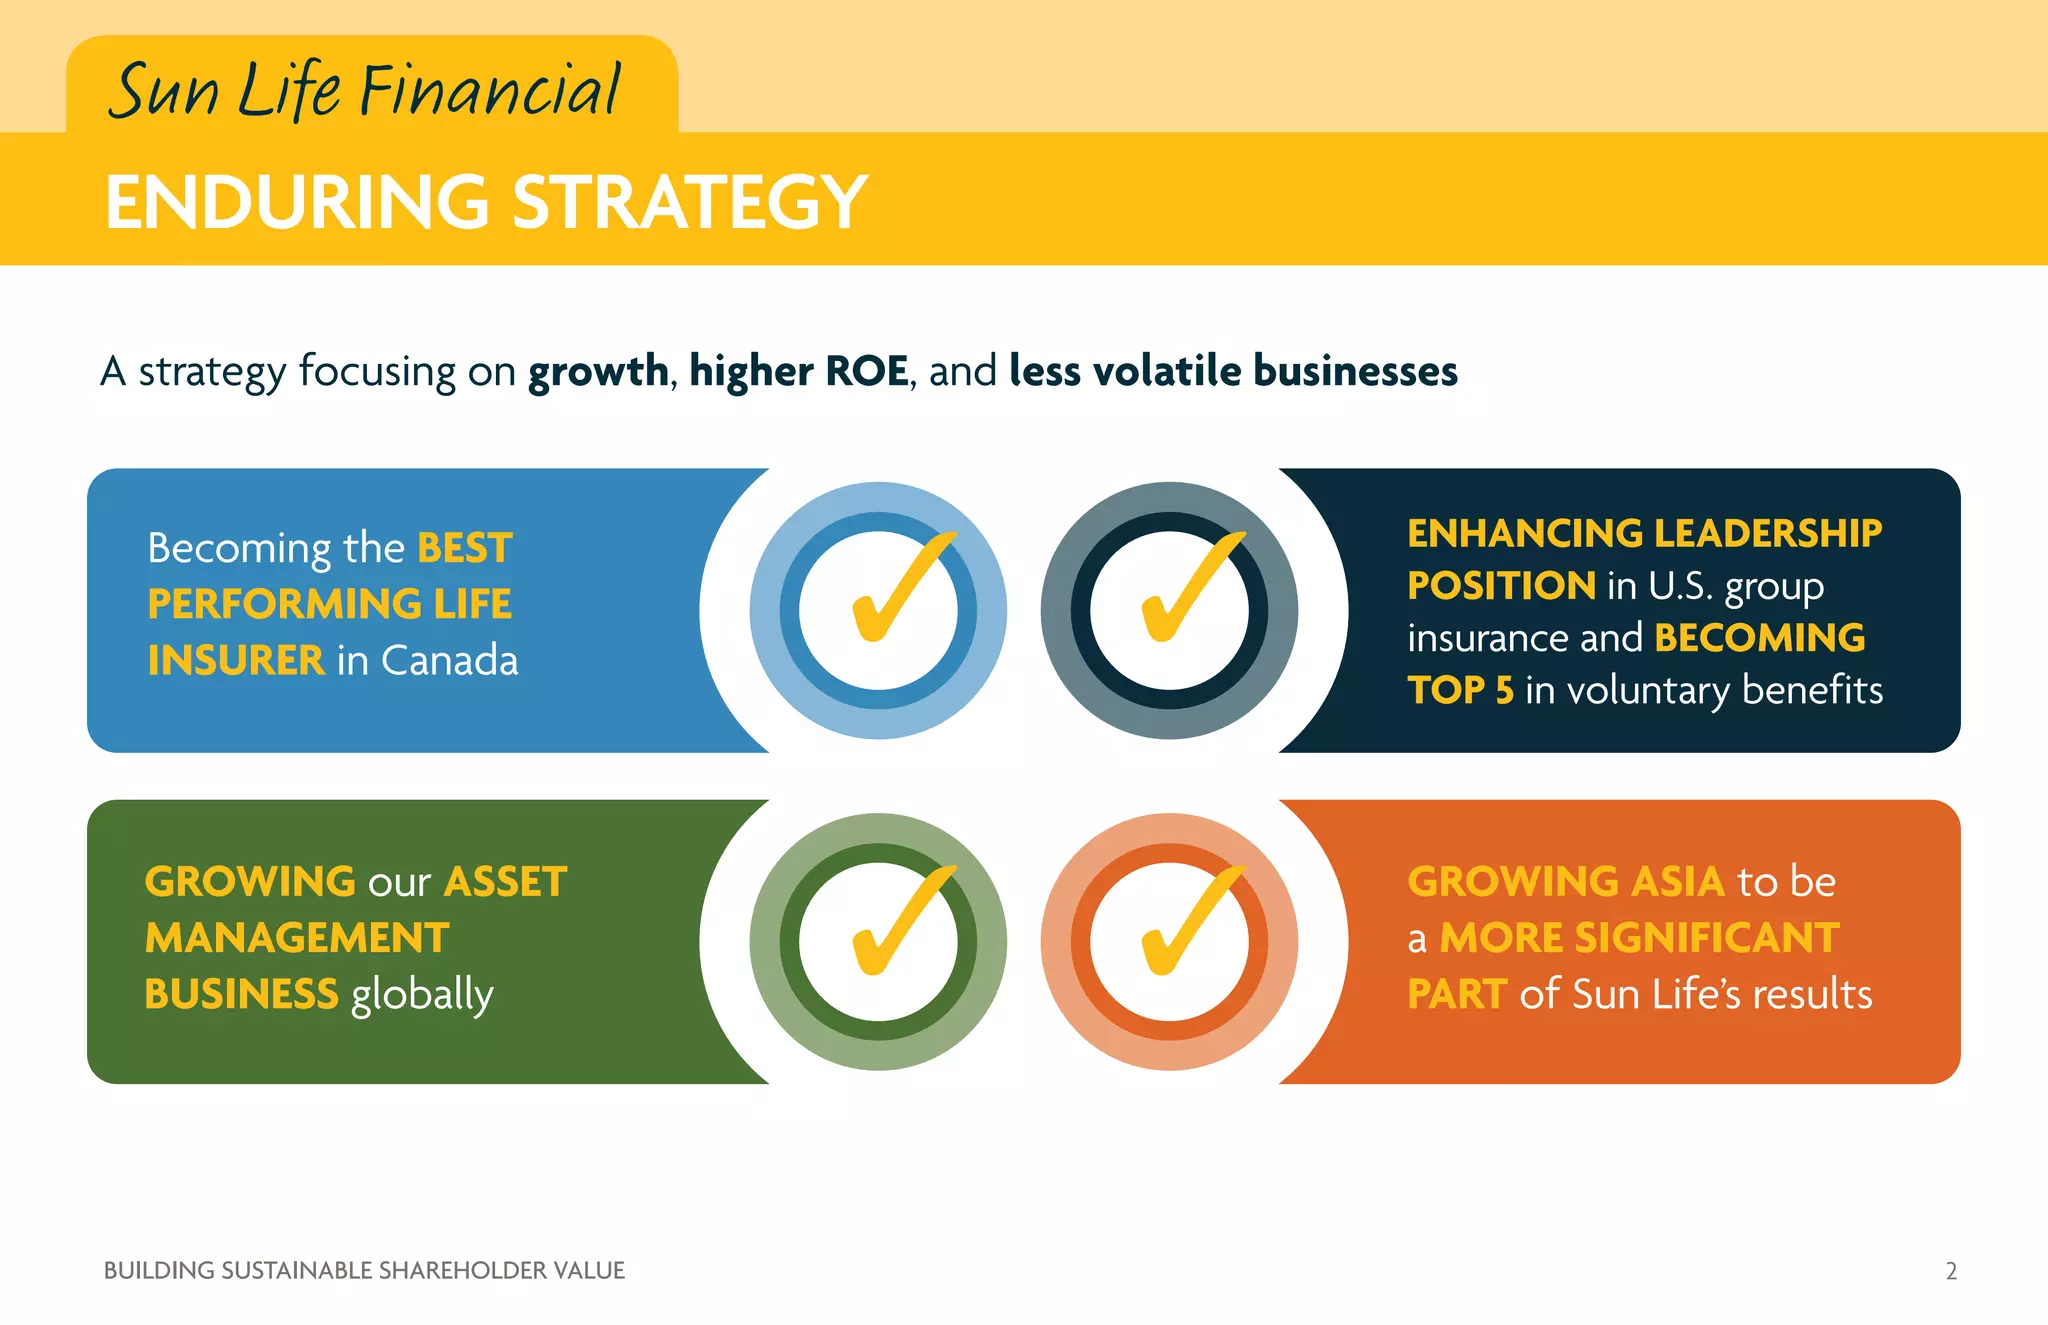
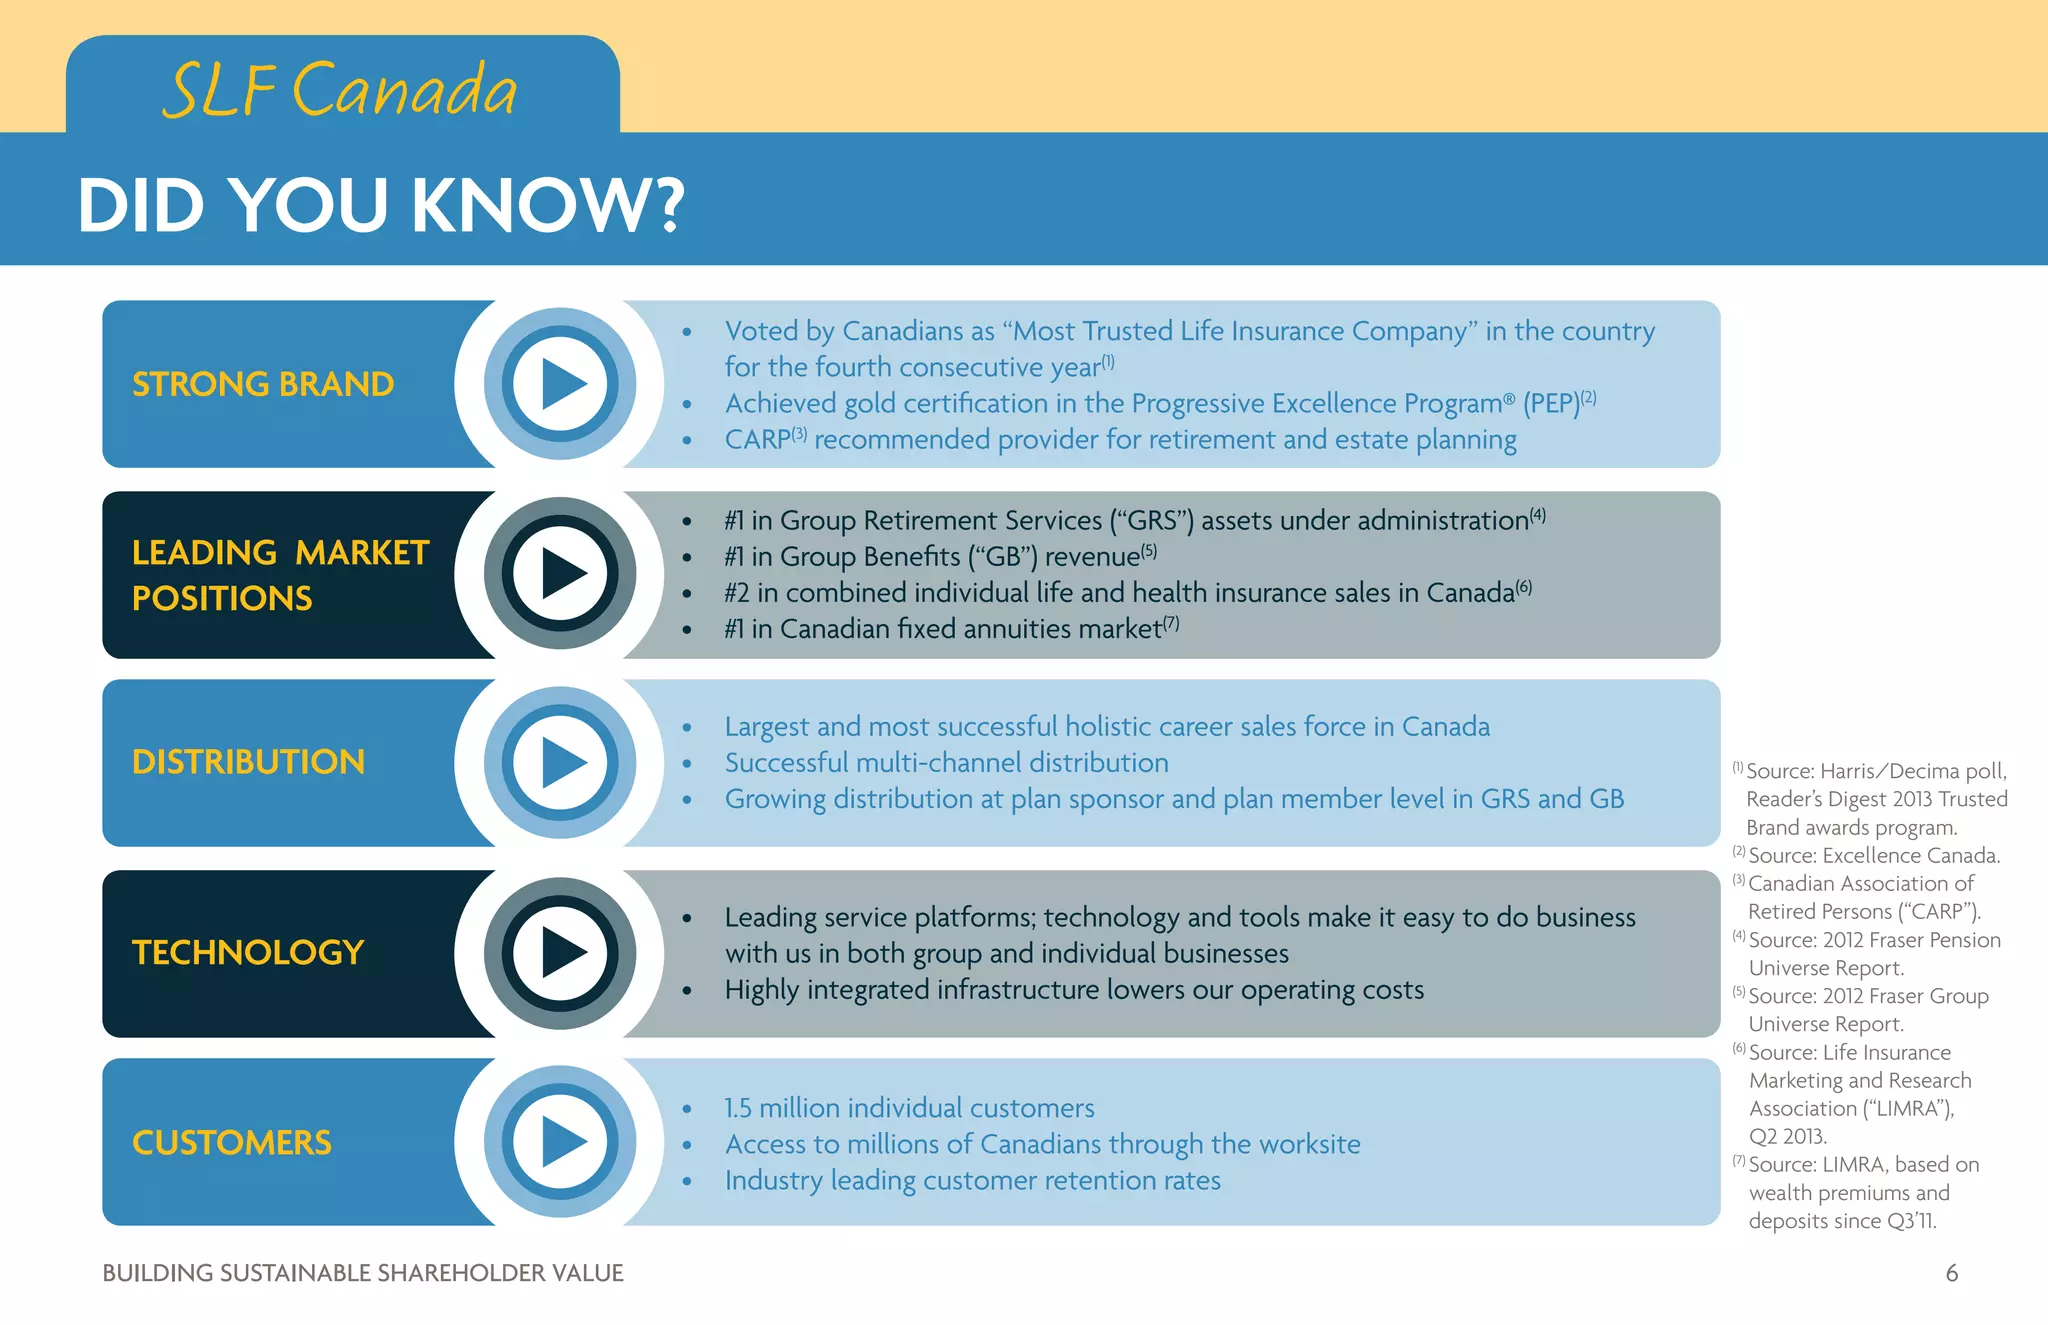
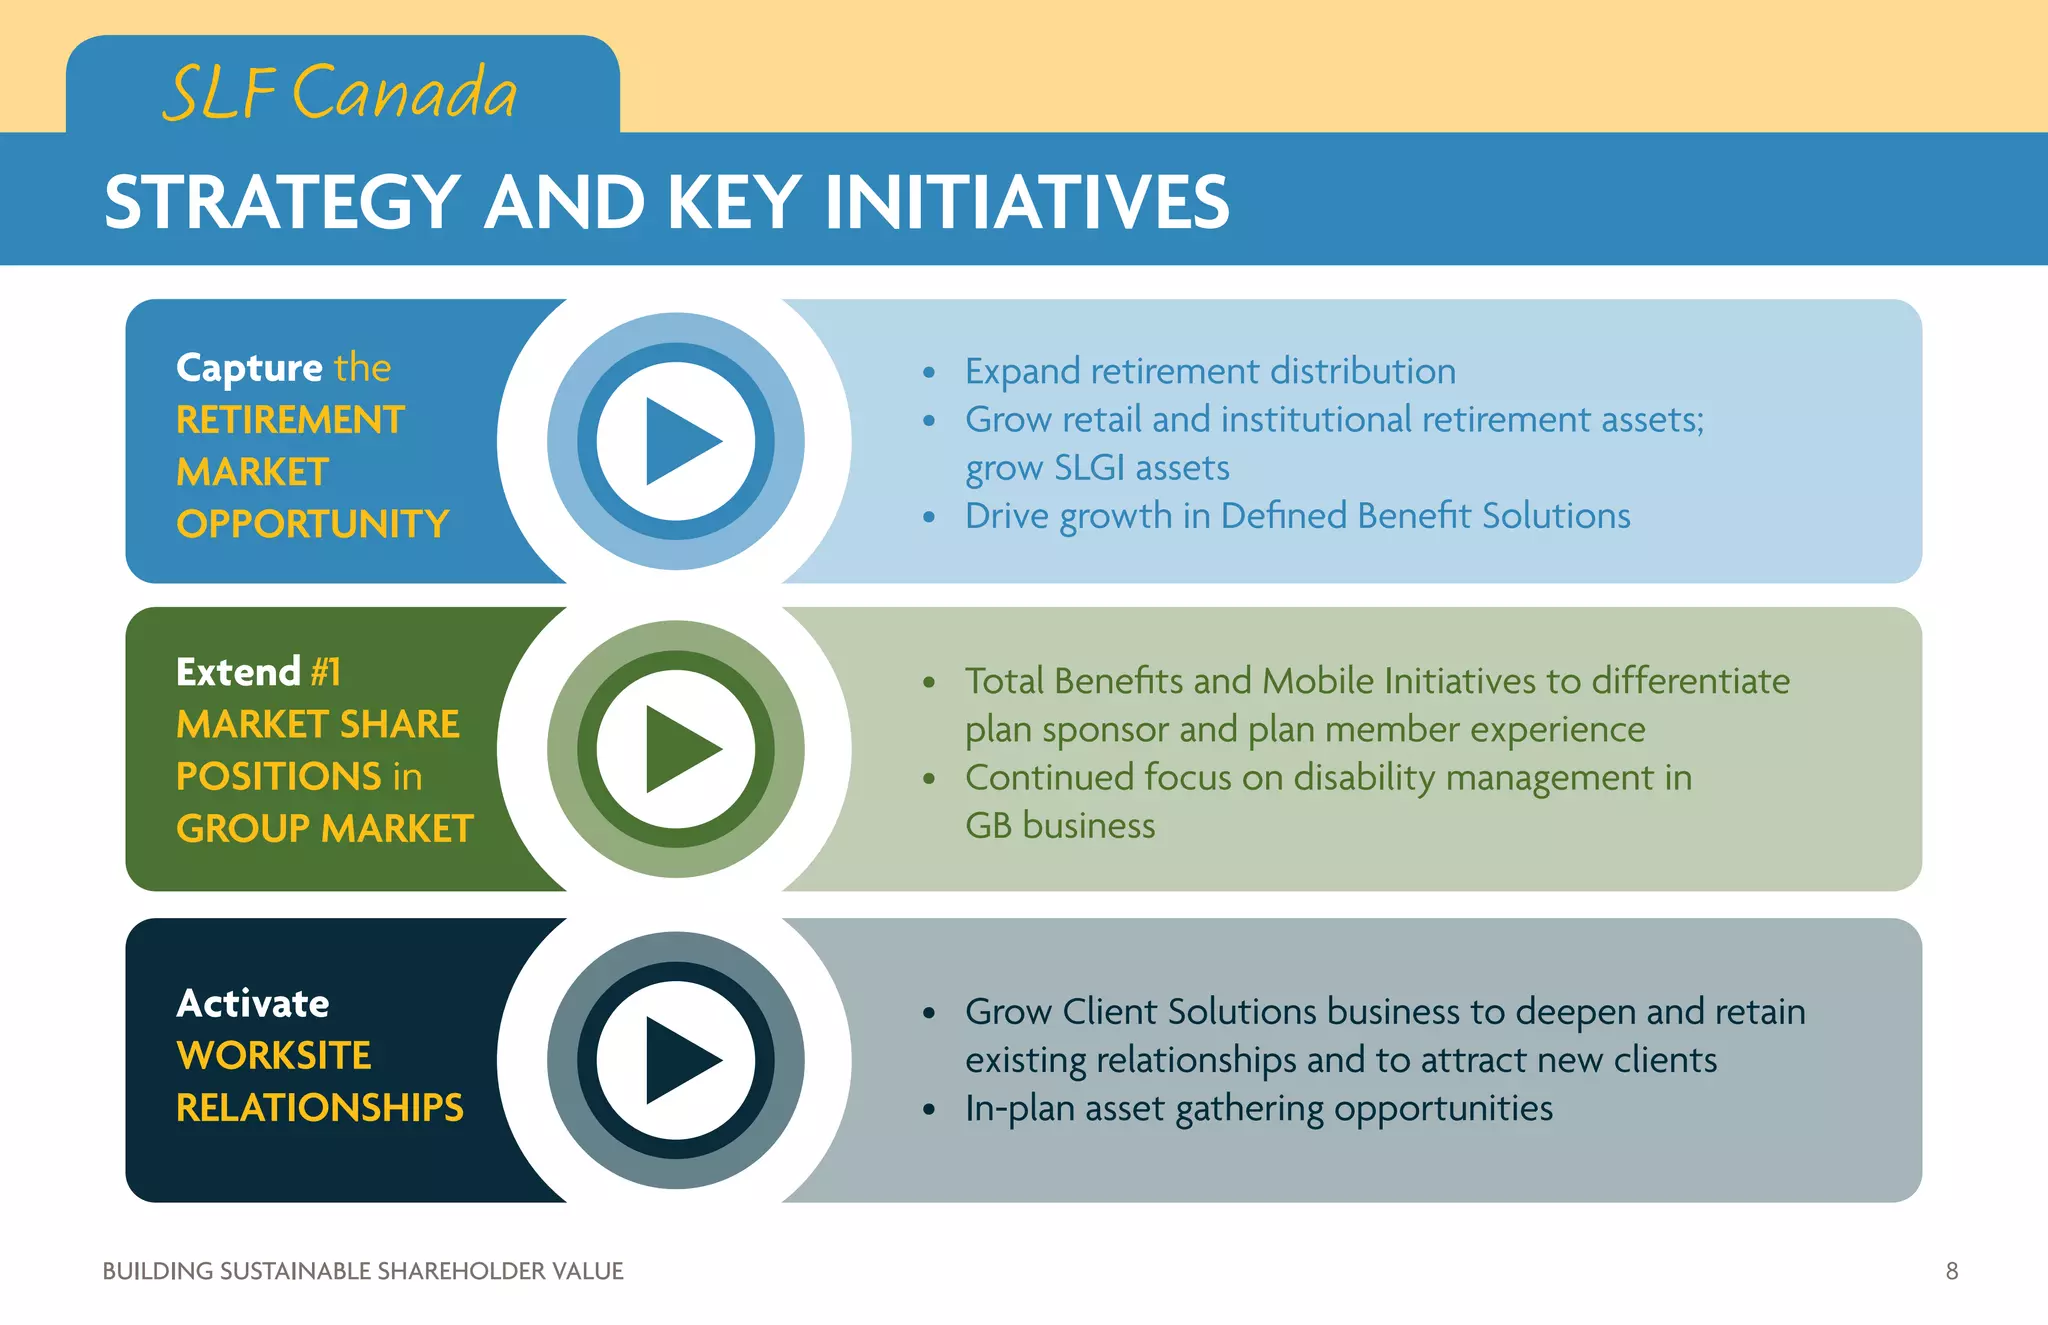
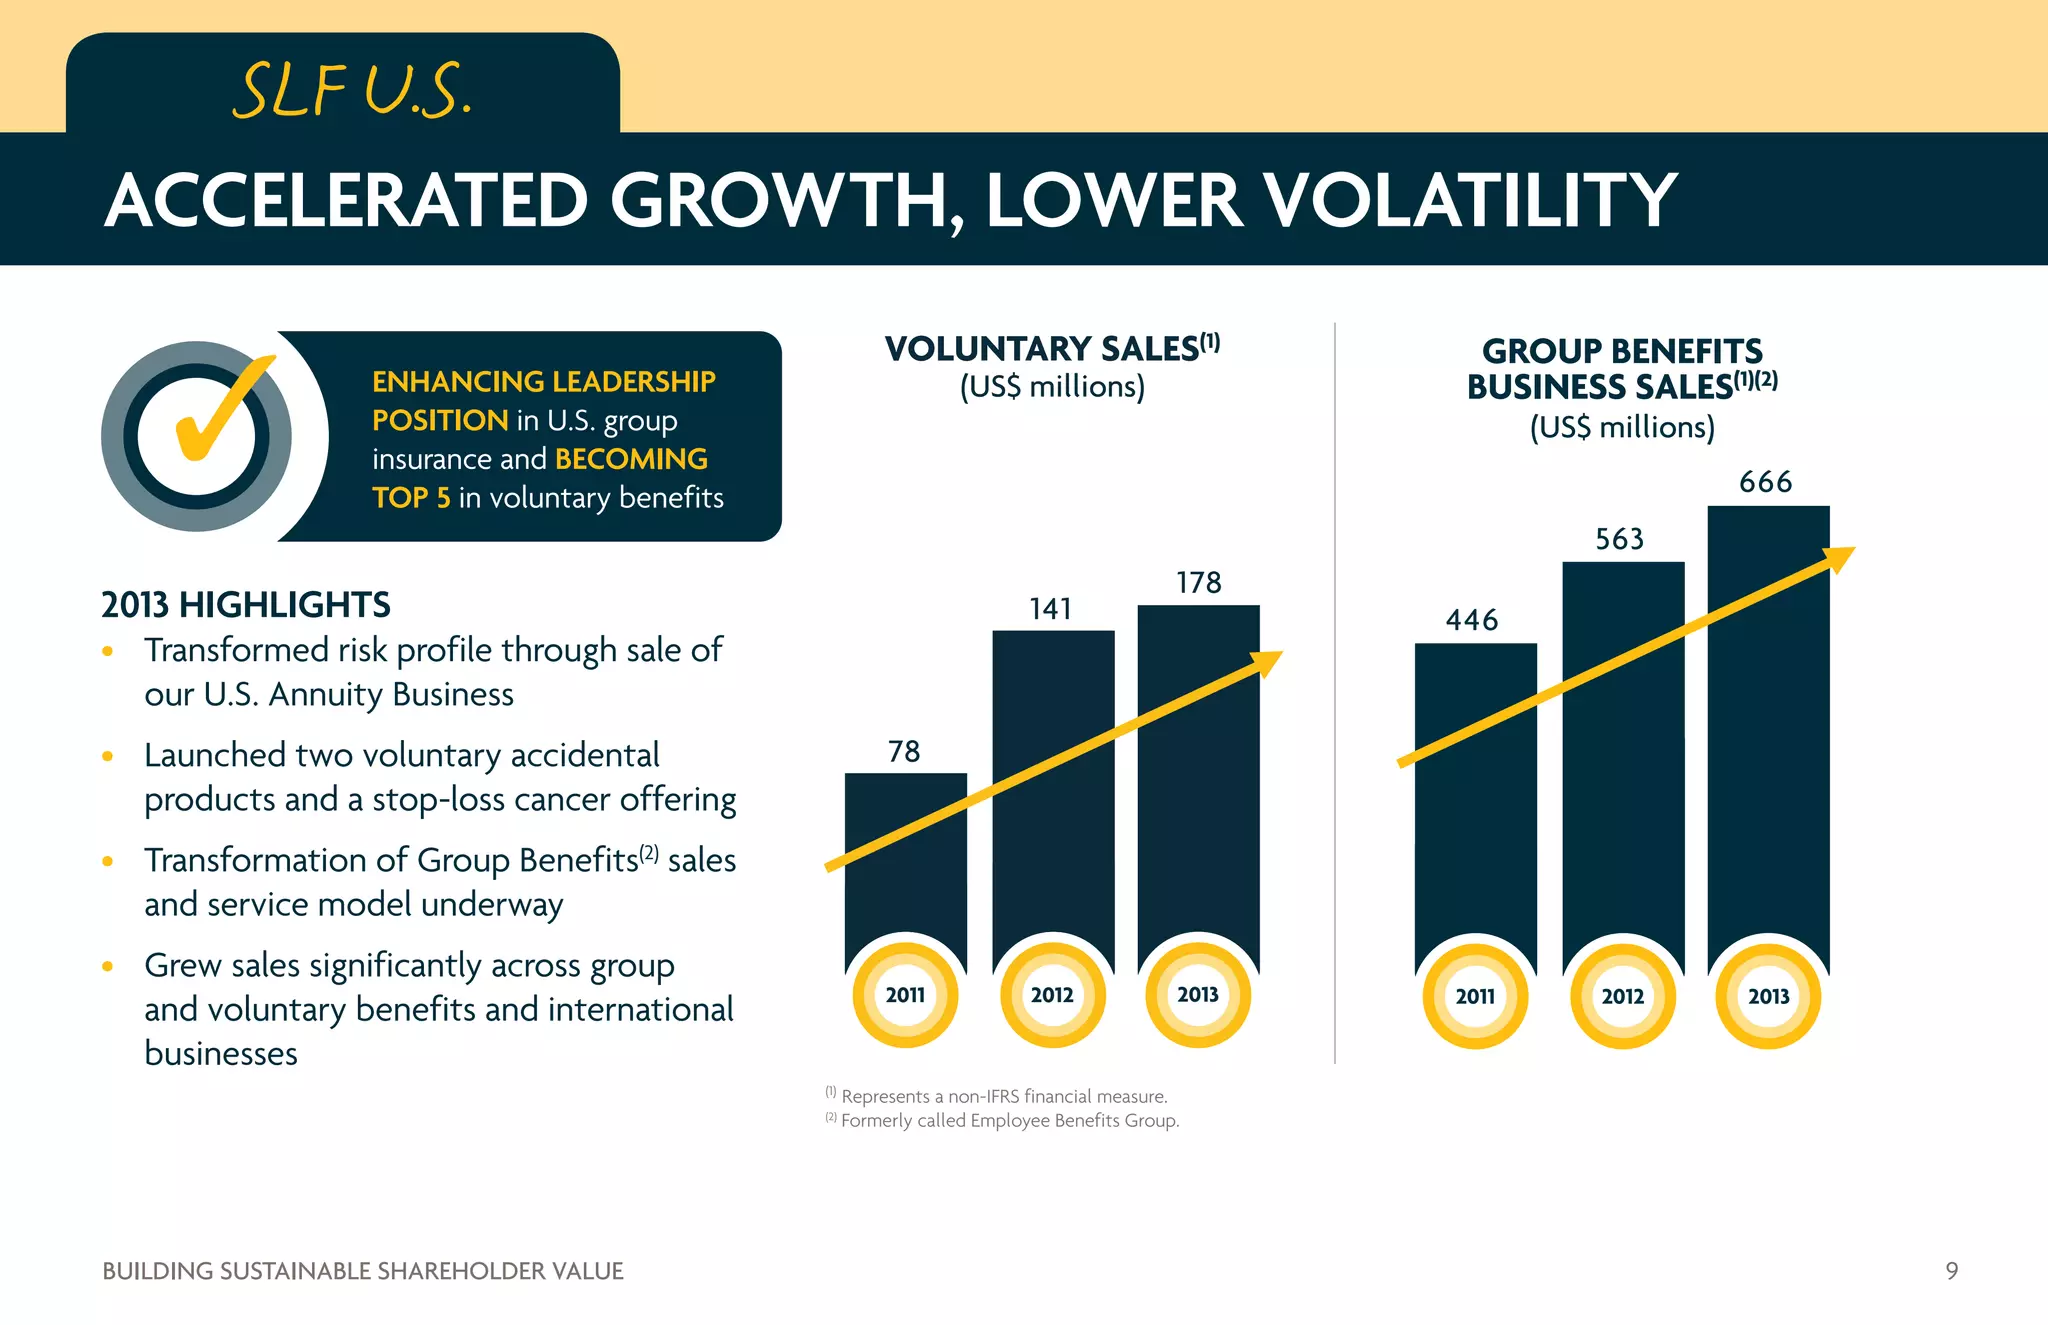
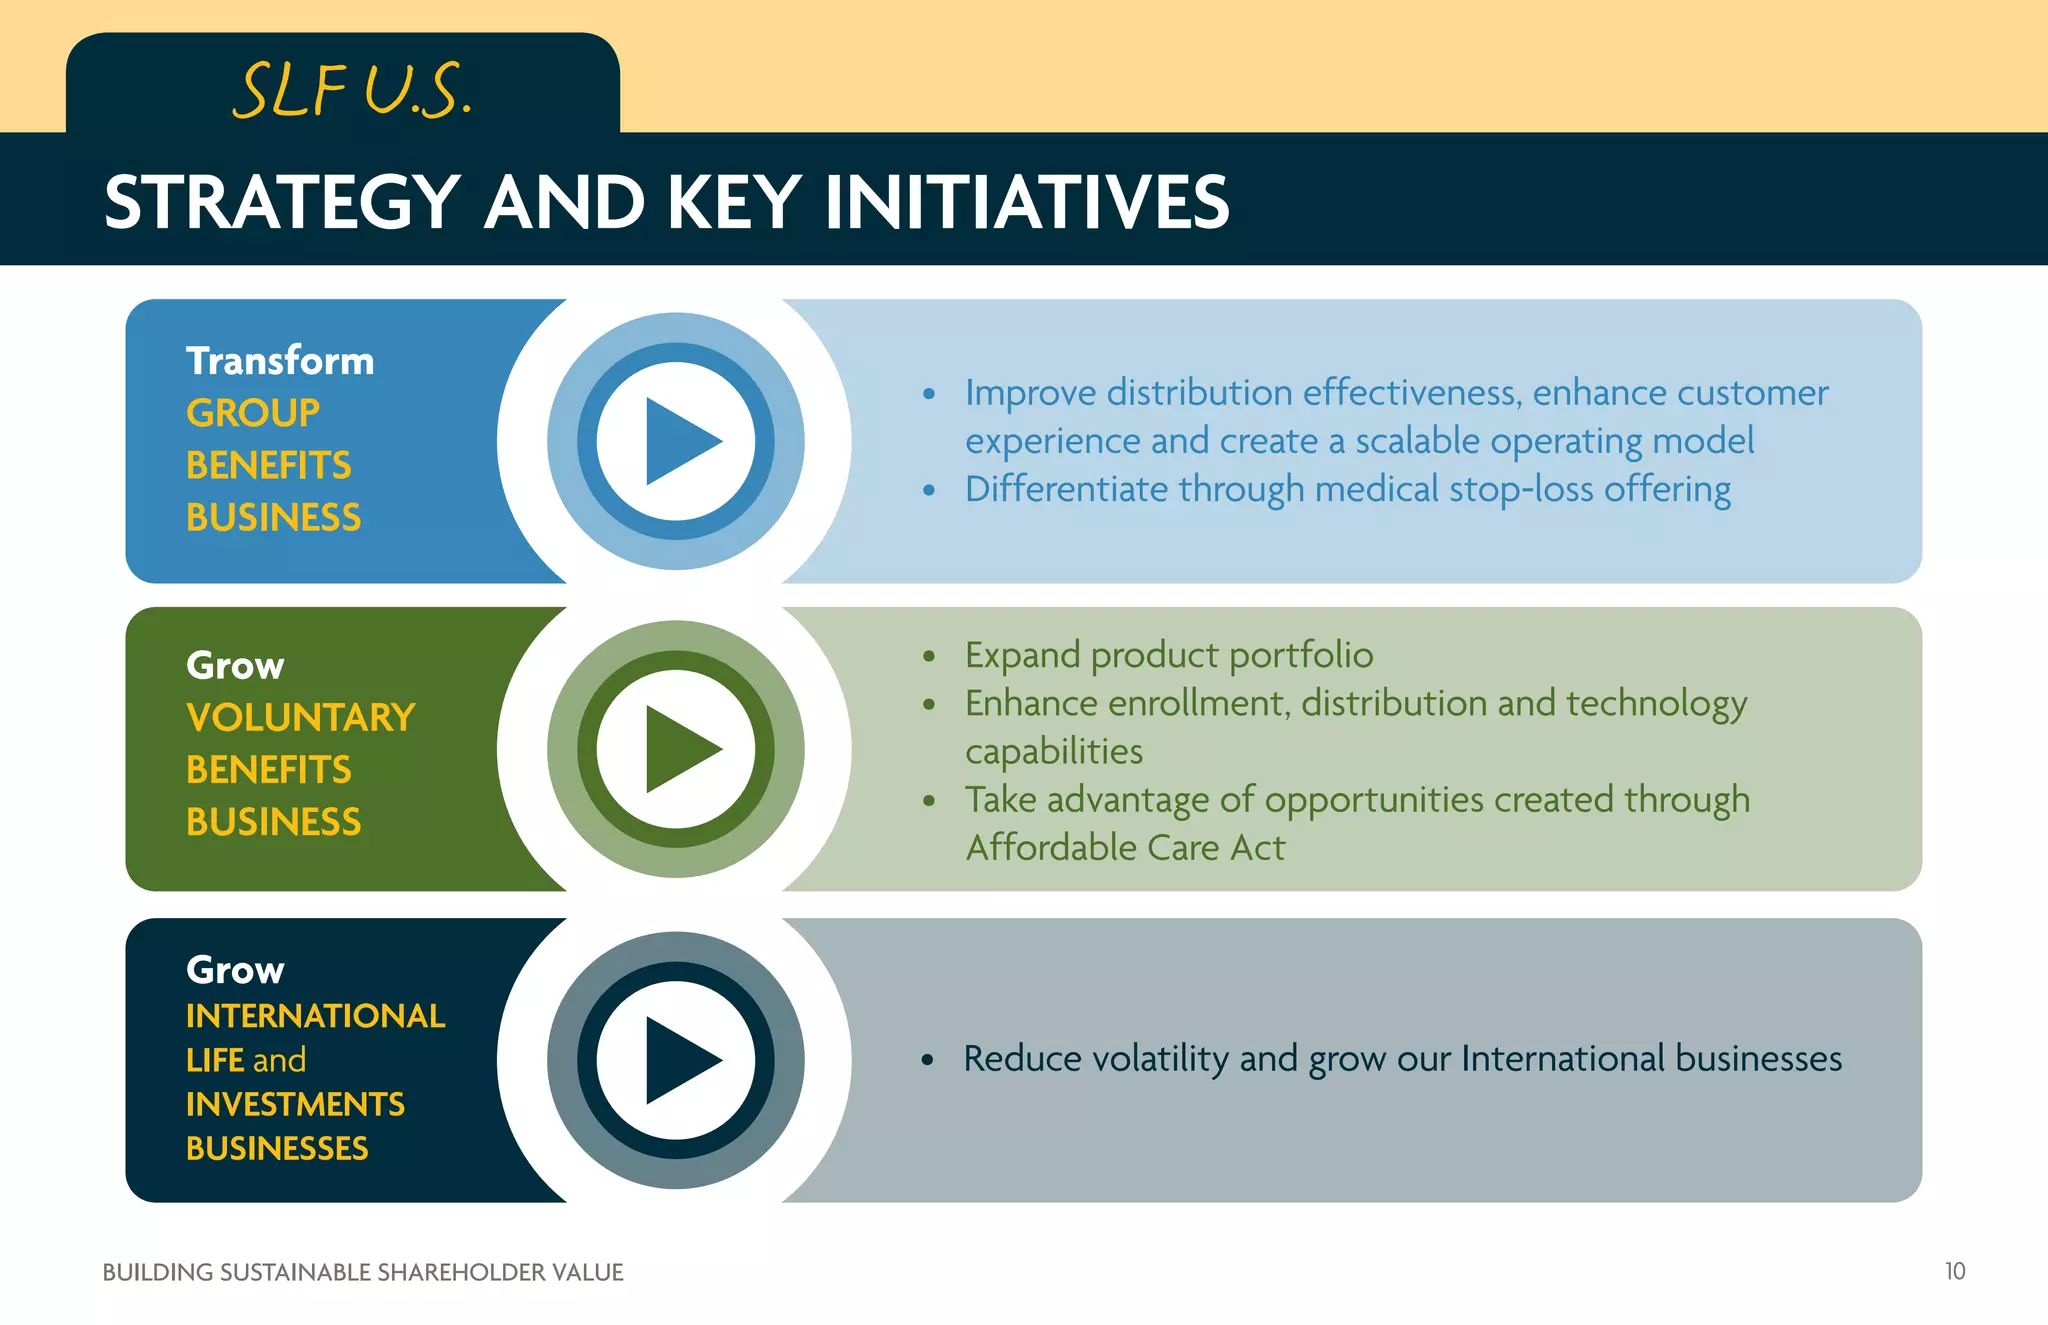
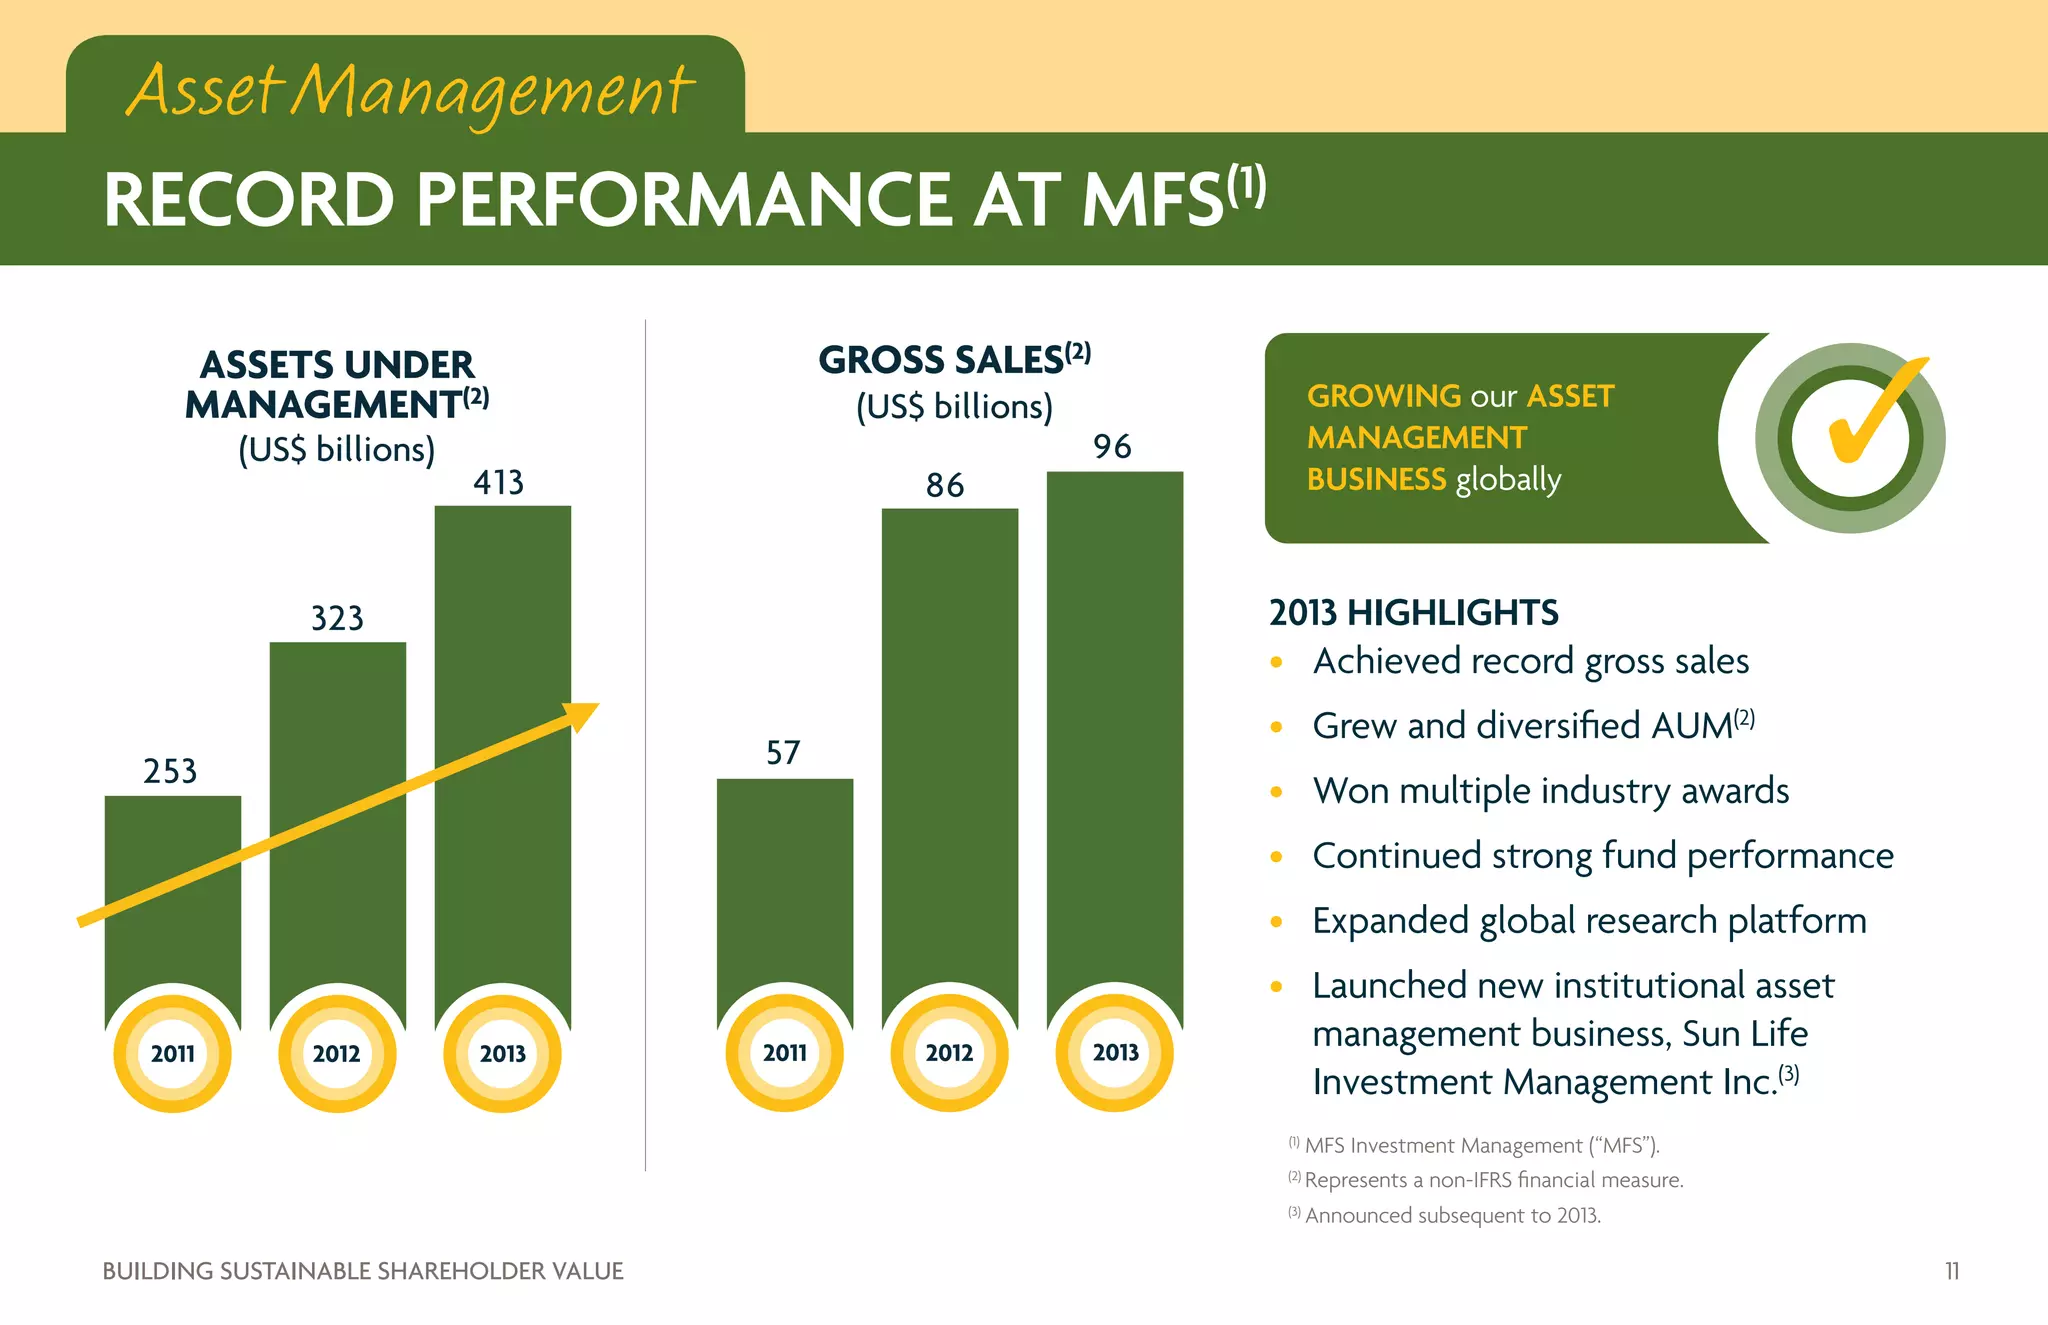
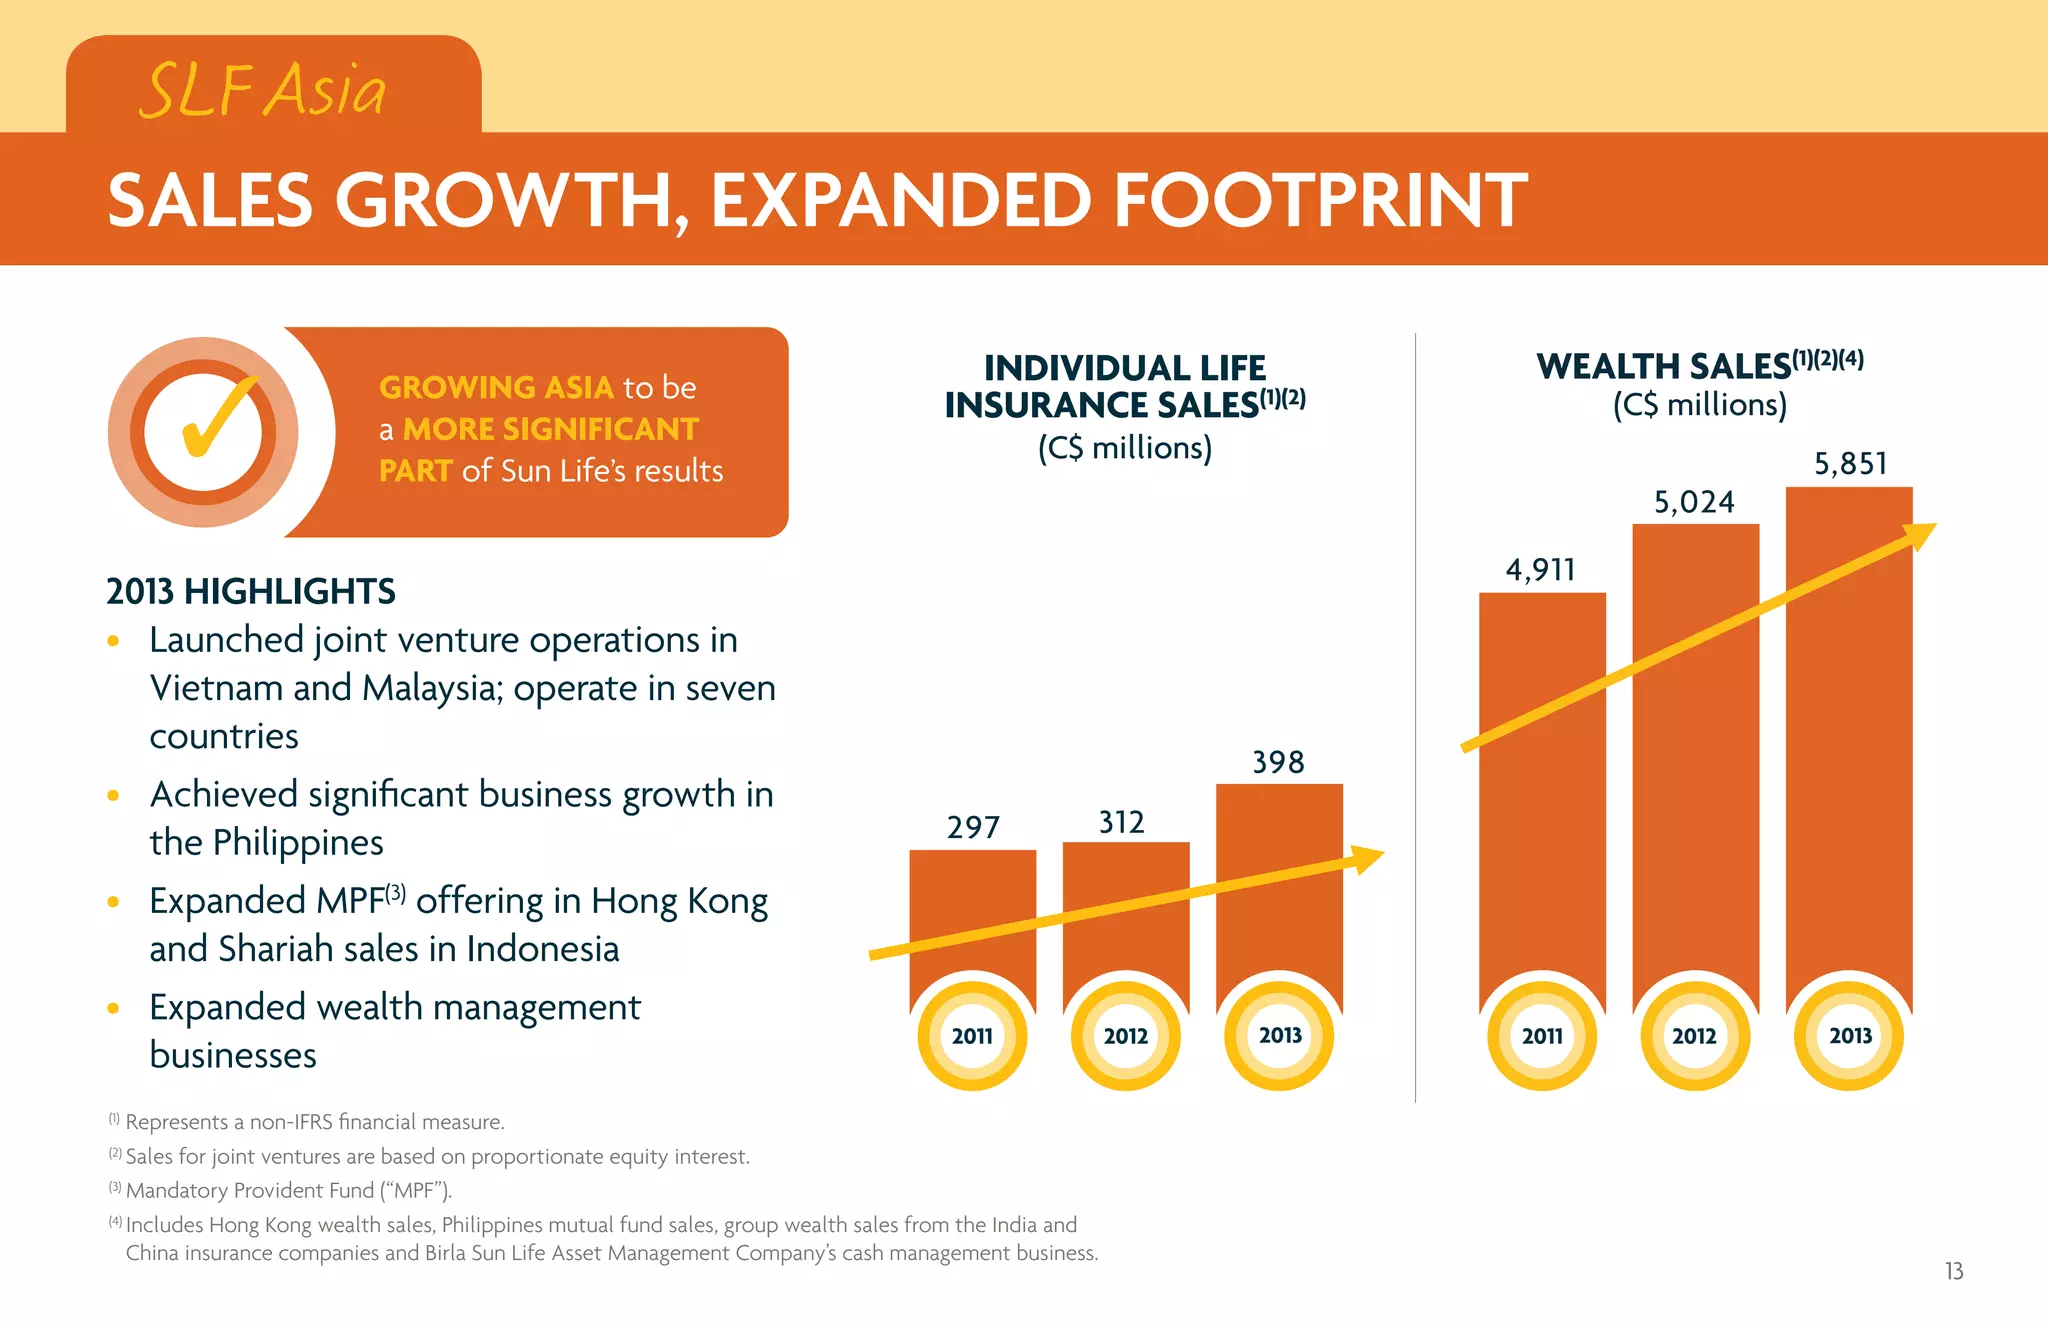
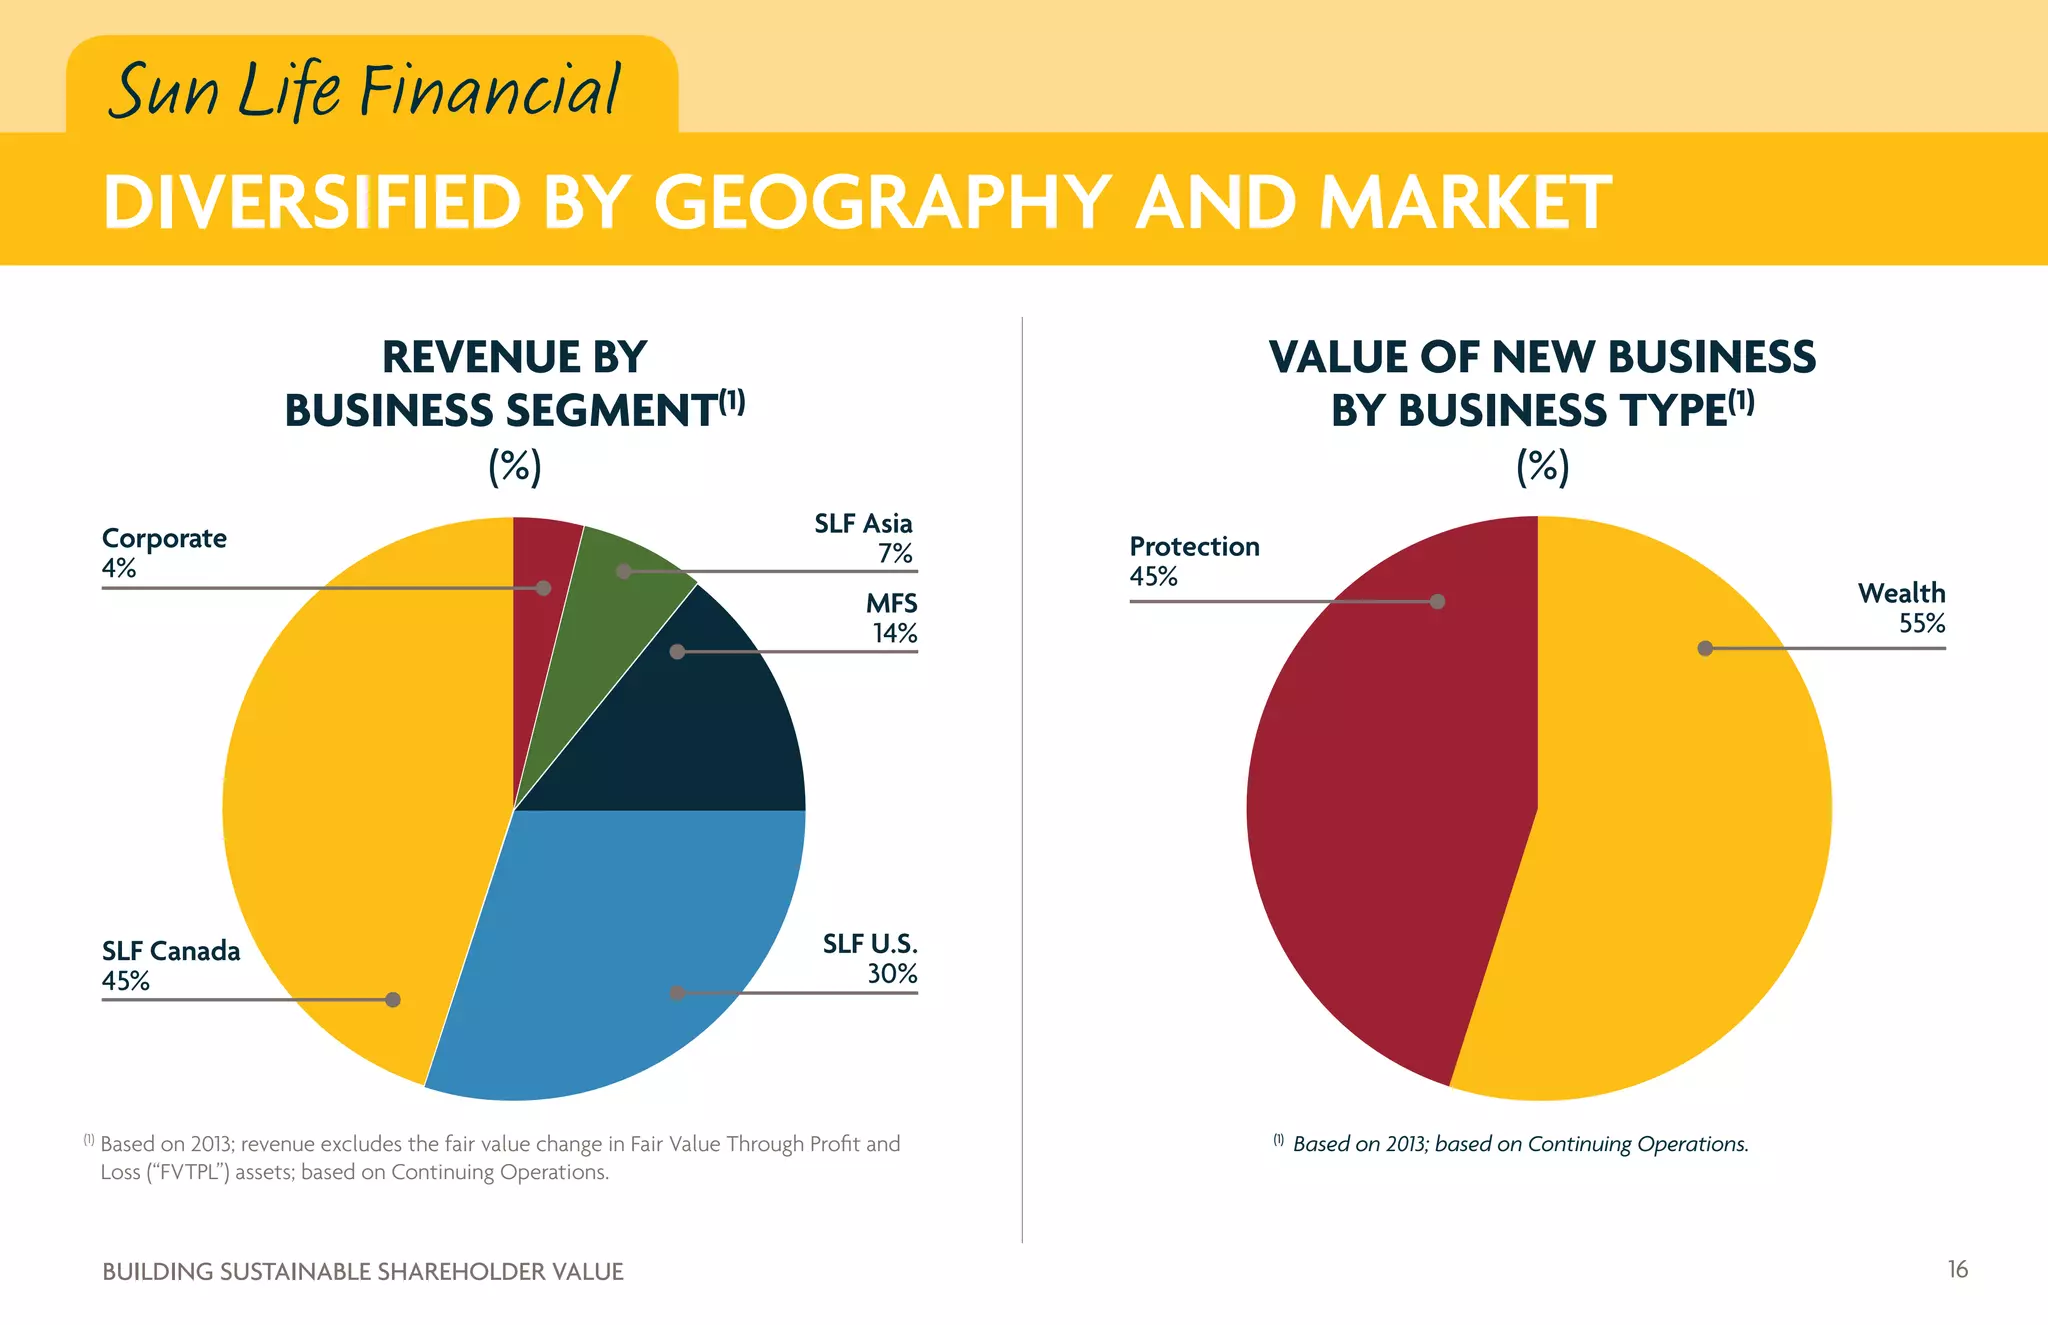
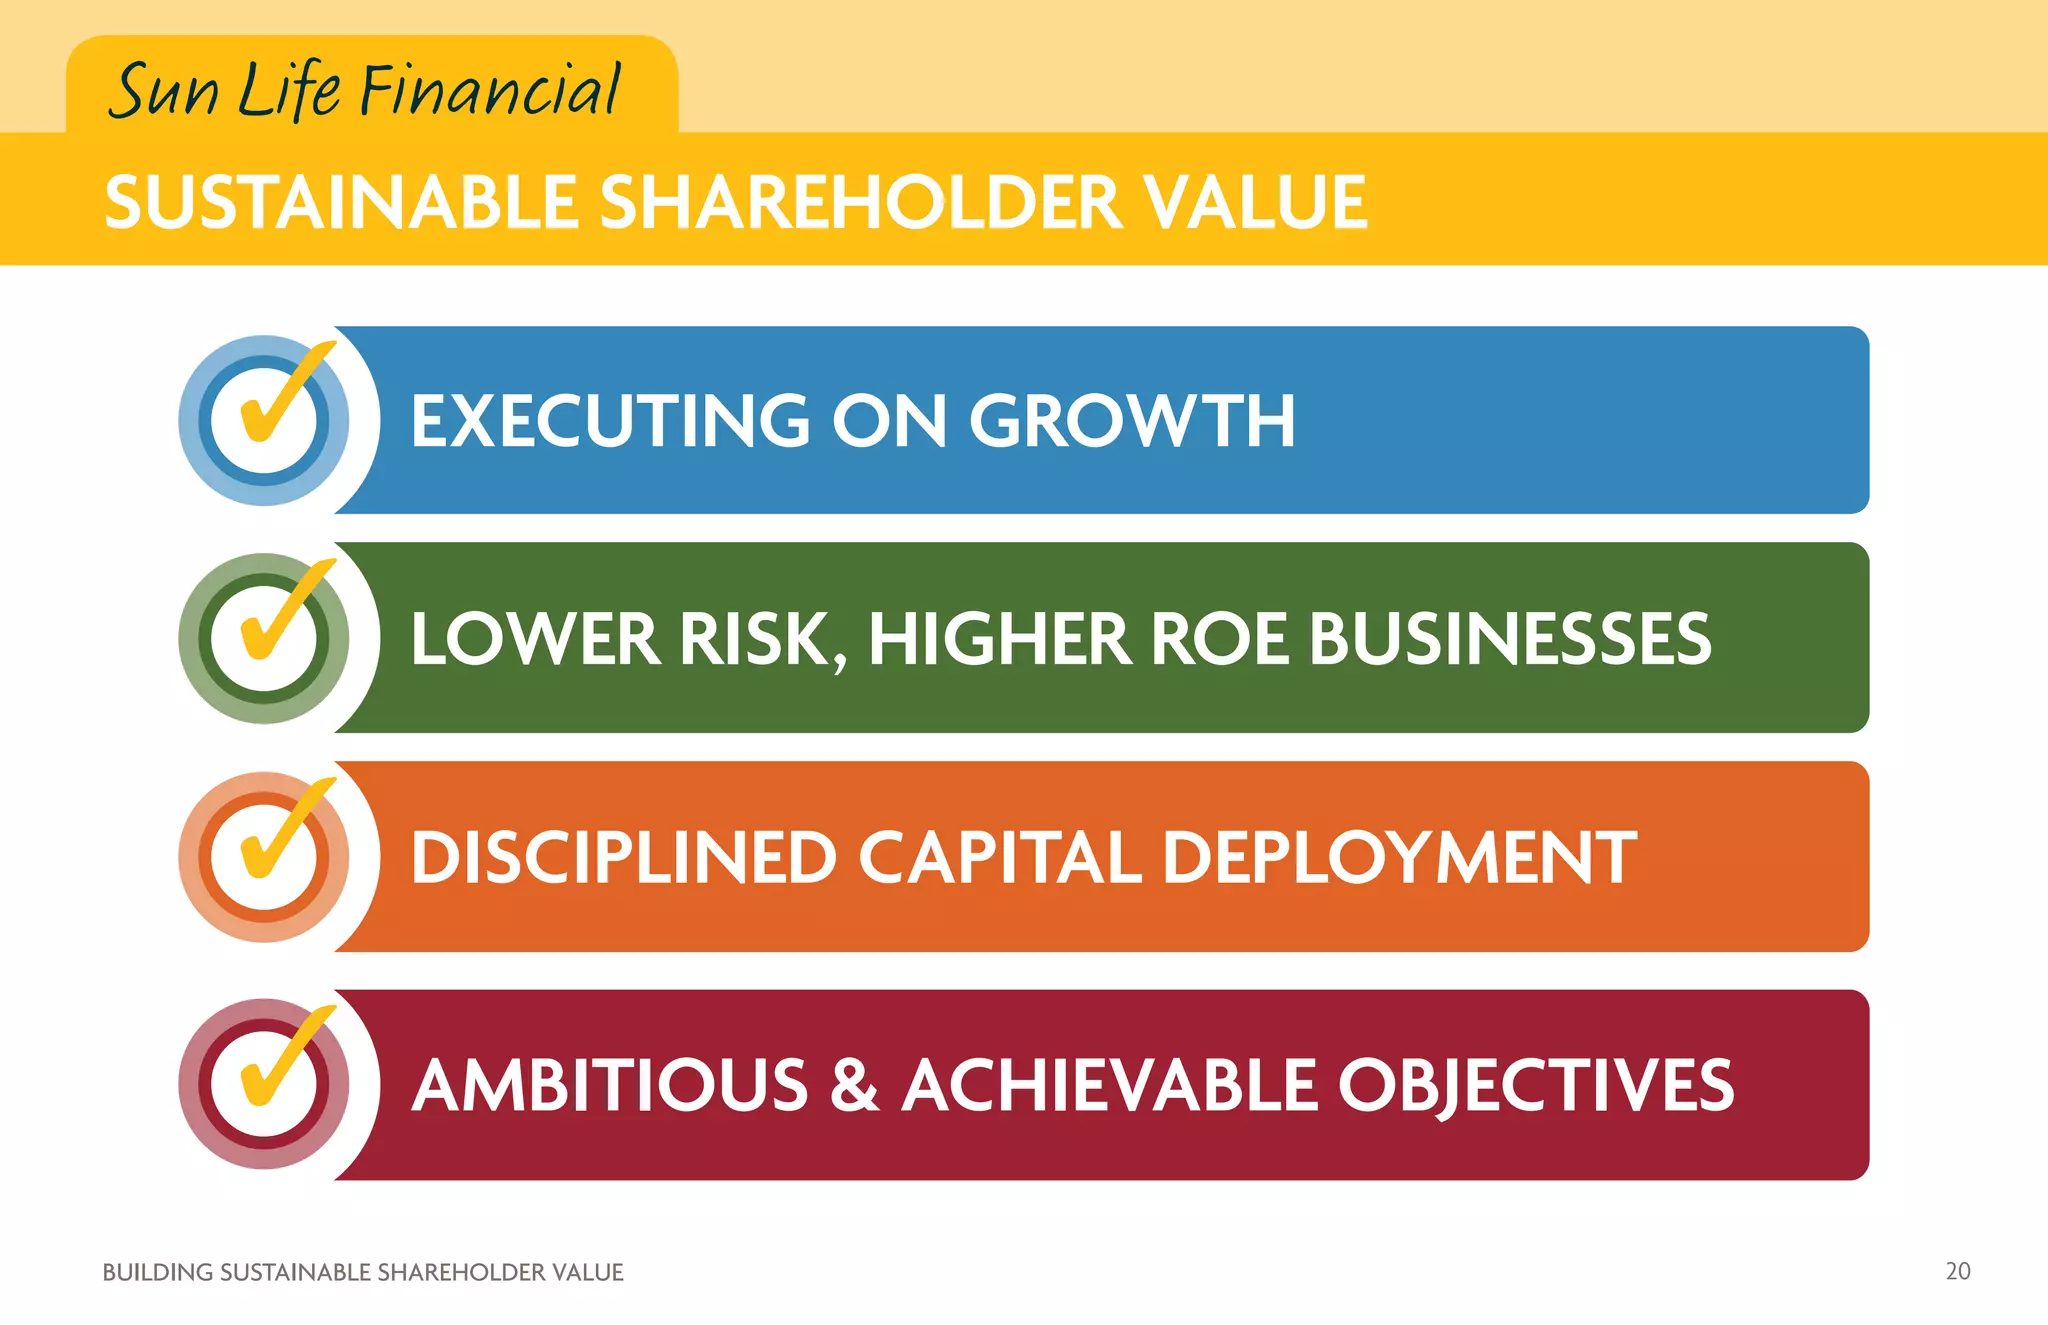

Sun Life Financial operates in key markets around the world including Canada, the United States, Asia, and through MFS Investment Management. The document outlines Sun Life's strategy of focusing on growth, higher returns on equity, and less volatile businesses. It discusses strategic objectives to become the top life insurer in Canada, enhance its leadership position in US group insurance, grow its asset management business globally including MFS, and grow its Asia business to be a more significant part of Sun Life's results.


