The document provides survey results from 1,000 respondents on transportation habits, learning styles, media consumption, and podcast listening behaviors. Key findings include:
- Most respondents spend 30-59 minutes driving per weekday, while fewer spend over 2 hours. Time spent as a passenger is lower.
- Visual and physical learning are most common. Watching online videos is more common than listening.
- Entertainment, news, and sports are the most listened to podcast topics. Friends/family and social media are main ways to discover new podcasts.
- Podcast subscriptions increase with age and income. Parents are more likely to listen to certain topics like arts/crafts and cooking.
So in summary,
Public Health England: Public awareness and opinion survey 2016Ipsos UK
Public Health England (PHE) commissioned Ipsos MORI to carry out quantitative research into the general public’s awareness of and concern about different health issues, and their awareness, knowledge, and opinions towards PHE. This report outlines the findings of the third wave of the research, following on from previous waves in 2015, 2014, and a baseline wave in 2013/2014.
The research found that half of the general public have heard of PHE, showing a steady increase between 2014 and 2016. Similarly, the public are more confident in PHE’s advice, and more likely to trust their advice on healthy living and health threats.
The Phone-Life Balance Study, commissioned by Motorola, and conducted in partnership with Dr. Nancy Etcoff, expert in Mind-Brain Behavior and the Science of Happiness at Harvard University and Psychologist at Massachusetts General Hospital Department of Psychiatry, was designed to generate insights around the impact of phone-life balance.
The Perils of Perception in 2015: Ipsos MORIIpsos UK
Ipsos MORI have compared perceptions of the likes of immigration levels, access to the Internet, the proportion of a country's wealth owned by the wealthiest 1%, obesity levels, religious affiliation, women in politics and in general employment, average wage levels and rural populations with the actual figures across thirty-three countries. How does your country fare?
How would you have fared with our questions? Take the quiz: https://www.ipsos-mori.com//perilsofperception
Ipsos Global @dvisor: Global Public Attitudes to Immigration 2011 - 2015Ipsos UK
The latest Ipsos Gloabal @dvisor reveals the British public is more positive in their attitudes towards immigration compared with many other countries. The survey, which asks a series of questions on immigration across 24 countries, also shows Britons have become more positive since 2011 but still have their concerns over immigration, primarily around its effect on public services.
Ben Page, Chief Executive of Ipsos MORI, presented at the Internet Advertising Bureau's Yahoo! Upfronts event in London on Tuesday, 14 October, 2014. http://www.iabuk.net/events/library/yahoo-upfronts-event
A new global survey in 25 countries looking at what issues worry the world. This is the first wave of this monthly survey, which finds that Britons are the most worried out of all 25 countries about immigration. Britons are increasingly pessimistic about the direction the country is headed in, with 37% saying they think things are going in the right direction, compared with 44% in September.
A majority of people in 25 countries around the world think things in their country are off on the wrong track, according to this new global poll from Ipsos.
The Perils of Perception in 2016: Ipsos MORIIpsos UK
Ipsos MORI have compared perceptions of the likes of portion of Muslim population, perceptions of happiness, homosexuality, sex before marriage, abortion, wealth, health spending, current and future population and whether Donald Trump would become US President with the actual figures across forty countries.
How do people in your country fare? How would you have fared with our questions? Take the quiz for your contry: https://perils.ipsos.com
A presentation on public perceptions of the charity sector given by Bobby Duffy, Managing Director, Ipsos MORI Social research Institute at NPC’s State of the Sector seminar on 5th March 2014. See the full poll at http://www.ipsos-mori.com/researchpublications/researcharchive/3352/State-of-the-Charities-Sector-poll-for-New-Philanthropy-Capital.aspx or visit the NPC website: http://www.thinknpc.org/publications/mind-the-gap/
Who cares what you think? Do people's voices matter for Sustainable Development?Ipsos UK
As the world embarks on the Sustainable Development Goals (SDG) era, efforts abound to improve development planning and measure impacts. The talk is of a "data revolution".
But does the sector that once talked endlessly of participation and ownership care any more about the voices of citizens and beneficiaries? Or has a focus on value-for-money and efficiency obscured this previously central mantra. Of the 230 SDG progress indicators, only four relate to people's perceptions.
In this context, we ask if, by accident or design, the international development community has de-prioritised listening. We also discuss the value of perceptions vs "objective" data. Is giving people a voice an expensive and methodologically complicated luxury or does it need to regain its place at the heart of the debate?
Welcome to our latest Global Trends report. While we live in a world of uncertainty, some trends ARE certain – we have covered these in our Megatrends section. Beyond known technology, demographic and environmental changes, we have found eight global master trends looking across our 18,000 interviews in 23 major countries.
In the West, we see the self-explanatory Crisis of the Elites and Generation Strains – the growing gulf between the young and older generations in terms of opportunity.
Everywhere we can see the Battle for Attention. With only so many hours in a day, consumers face being bombarded across more and more channels and are reacting by blocking and switching off. The Search for Simplicity and Control is in part a reaction to feeling overwhelmed, but is a global phenomenon – how business and public services provide this seems as big a challenge as ever. Another area in which we want to take control is in regard to our own health – a theme we explore in A Healthier World.
A decline in growth in living standards in the West, and pessimism about the future are now triggering two related trends: Uncertainty is the New Normal and the Rise and Rise of Tradition.
Much of this depends on where you are sitting as you read this. The Optimism Divide shows how living in Shanghai, Mumbai or Jakarta will give you a completely different perspective than if you are reading this in London, Chicago or Rome. This is an important corrective for international businesses – while the world is more connected than ever, it is not the same everywhere, and consumers remain dramatically different in their outlook.
The underlying sense is of increasing fragmentation across many spheres of life. Differences are growing, complexity increasing, positions embedding.
What this latest in-depth global study should remind us is that despite increasing longevity, rising incomes in emerging markets, more connectivity, computing power and storage than we could ever have imagined, the human condition is one of anxiety and striving for more – at least if you read the media. Understanding the manifestations of that seems ever more vital for politicians and business.
In this report, we outline an overall structure for organisations to use to frame their analysis about key trends in consumer and citizen opinion globally. You can find the full set of charts, data and more at https://www.ipsosglobaltrends.com
Per il secondo anno consecutivo, Ipsos ha condotto l'indagine sulla pericolo delle percezioni. Scopri quale è il paese più ignorante tra i 33 nei quali è stata effettuata la ricerca..
Ipsos European Pulse: Majority of Citizens in 12 EU Countries are Not Interes...Ipsos Public Affairs
A new poll of citizens in 12 European Union Countries feeling the pulse of voters ahead of the upcoming EU Elections indicates that 62% of them are not much interested in the event.
The poll was conducted from April 1, 2014 to April 25, 2014 and surveyed 8,833 adults in Belgium, Croatia, France, Germany, Great Britain, Hungary, Ireland, Italy, the Netherlands, Poland, Spain and Sweden.
For the full release, please follow this link: http://ipsos-na.com/news-polls/pressrelease.aspx?id=6491
Fake News, Filter Bubbles, Post-Truth and TrustIpsos UK
A major new Ipsos study of over 19,000 people in 27 countries highlights how we think fake news, filter bubbles and post-truth are things that affect other people, much more than ourselves.
PowerPoint slides, one for each of the former Government Office Regions in England, display the responses of the local authorities within the region to the questions in the Self-Assessment. They are intended primarily to support local discussions.
Social Media & Apps in the Nordics
AudienceProject Insights 2016
Facebook is for keeping contact with friends and family,
LinkedIn is for professional networking and YouTube is just for fun. In this Social Media & Apps study we take a look at how social media and apps are used across the Nordic countries.
We’re delighted to share with you the findings from our Global Trends survey - the largest study of its kind, looking at the attitudes and behaviours of consumers and citizens in 20 key countries around the world. We reveal the complex, and sometimes contradictory, findings covering everything from marriage to migration, from ambition to advertising and from society to social media. Visit http://www.ipsosglobaltrends.com for more.
Ipsos MORI's initial view on polls accuracy in the UK's 2015 electionIpsos UK
Ben Page, CEO of Ipsos MORI presents his initial view of the accuracy of polls in the UK's Election of 2015. Read our statement here: https://www.ipsos-mori.com/newsevents/latestnews/1680/In-response-to-the-2015-Election-results.aspx
Survey of Britain's Captains of Industry 2013Ipsos UK
Ipsos MORI’s Captains of Industry report finds 20 year high in optimism for economy from the men and women running Britain’s largest companies. Justin King of Sainsbury’s named Britain’s most impressive businessman.
Ipsos MORI / Halifax Housing Market Confidence Tracker Q4 2015Ipsos UK
Confidence in the UK housing market remains strong, according to the latest quarterly Halifax Market Confidence Tracker (HMCT), and comes against a backdrop of cooling confidence in the wider economy.
Despite declining steadily since last May, house price optimism (HPO) in the final quarter of 2015 continued to show that a majority of Britons believe that average UK property prices will be higher rather than lower 12 months from now (+61 compared to +63 in September 2015, and +68 in May 2015). Over three in ten Britons (13%) predict the average UK property price to rise by 15% or more.
It is always mentioned that the lifestyle between the south and north of Vietnam is different. This report illustrates the media consumption behavior and creative impression differences between south and north
It is always mentioned that the lifestyle between the South and North of Vietnam is different. This report illustrates the media consumption behavior and creative impression differences between South and North
Adobe Campaign released findings from its third annual consumer email survey, focused on consumers' habits and behavior related to personal and work email. The report surveyed more than 1,000 white-collar workers in Germany
In 2008 Freelanceswitch published a survey 'to find common threads, traits, and data about people' working as freelancers. Respondents were from around the globe.
The report presents a good base for how much clients all over the world are willing to pay for services offered by freelancers.
Australian Community Trends Report National Study summary by Mark McCrindle Mark McCrindle
The objectives of the Australian Community Trends report were to form the basis for a longitudinal study which can be conducted annually and provide a detailed analysis of the effectiveness, engagement and awareness of the not-for-profit sector. Another objective was to help organisations understand the Australian community- the emerging trends, the giving landscape and the current and emerging supporter segment.
Some of the other key objectives are:
Identification of National Giving Macro Segments
Not-for-profit Awareness and Benchmarking Analysis
Identification of Giving Blockers and
Giving Sentiment Index
Not-for-profit Staff and Leaders Snapshot.
In a recent national South African health survey measuring the health of the nation, it was found that 74% of South Africans think their fellow citizens are overweight, while only 34% of people considered themselves as overweight or obese. The national survey, which was released in Johannesburg this week, was commissioned by GlaxoSmithKline (GSK) and conducted by independent marketing insight consultancy, Added Value.
Social media becomes the information hub for Vietnamese and they spend hours on Facebook, Zalo and the other services daily.
This survey was made to understand the latest trend and usage of social media service in Vietnam.
The survey was made in Sept 2018, to 620 people in HCM and Hanoi.
We all need to eat and, for a majority of consumers, that involves the chore of grocery shopping, but how and when do most consumers go about it? A survey of 1,000 U.S. adults.
Six out of ten Americans are taking vacation this summer, with plans driven by economics and marital status. Seven out of ten (71%) married adults will vacation, compared to just half of divorced adults (49%). While only 46% of those making under $25,000 a year in household income will vacation this summer, 81% of those making $100,000 to $149,999 will, and 91% of those making $150,000 to $199,999 will.
TTRPG, Gamebook, and Interactive Fiction SurveyJeffrey Henning
Over one in five American adults (23%) with online access have played a tabletop role-playing game (TTRPG) such as Dungeons & Dragons (D&D), Pathfinder, or GURPs. While 45% of men under 45 years old have played, less than 10% of men over 55 have played; 39% of women under 25 have played, compared to 25% of women 25 to 34, and 10% of women 55-64.
Top 3 Ways to Align Sales and Marketing Teams for Rapid GrowthDemandbase
In this session, Demandbase’s Stephanie Quinn, Sr. Director of Integrated and Digital Marketing, Devin Rosenberg, Director of Sales, and Kevin Rooney, Senior Director of Sales Development will share how sales and marketing shapes their day-to-day and what key areas are needed for true alignment.
Most small businesses struggle to see marketing results. In this session, we will eliminate any confusion about what to do next, solving your marketing problems so your business can thrive. You’ll learn how to create a foundational marketing OS (operating system) based on neuroscience and backed by real-world results. You’ll be taught how to develop deep customer connections, and how to have your CRM dynamically segment and sell at any stage in the customer’s journey. By the end of the session, you’ll remove confusion and chaos and replace it with clarity and confidence for long-term marketing success.
Key Takeaways:
• Uncover the power of a foundational marketing system that dynamically communicates with prospects and customers on autopilot.
• Harness neuroscience and Tribal Alignment to transform your communication strategies, turning potential clients into fans and those fans into loyal customers.
• Discover the art of automated segmentation, pinpointing your most lucrative customers and identifying the optimal moments for successful conversions.
• Streamline your business with a content production plan that eliminates guesswork, wasted time, and money.
First Things First: Building and Effective Marketing Strategy
Too many companies (and marketers) jump straight into activation planning without formalizing a marketing strategy. It may seem tedious, but analyzing the mindset of your targeted audiences and identifying the messaging points most likely to resonate with them is time well spent. That process is also a great opportunity for marketers to collaborate with sales leaders and account managers on a galvanized go-to-market approach. I’ll walk you through the methods and tools we use with our clients to ensure campaign success.
Key Takeaways:
-Recognize the critical role of strategy in marketing
-Learn our approach for building an actionable, effective marketing strategy
-Receive templates and guides for developing a marketing strategy
AI-Powered Personalization: Principles, Use Cases, and Its Impact on CROVWO
In today’s era of AI, personalization is more than just a trend—it’s a fundamental strategy that unlocks numerous opportunities.
When done effectively, personalization builds trust, loyalty, and satisfaction among your users—key factors for business success. However, relying solely on AI capabilities isn’t enough. You need to anchor your approach in solid principles, understand your users’ context, and master the art of persuasion.
Join us as Sarjak Patel and Naitry Saggu from 3rd Eye Consulting unveil a transformative framework. This approach seamlessly integrates your unique context, consumer insights, and conversion goals, paving the way for unparalleled success in personalization.
The digital marketing industry is changing faster than ever and those who don’t adapt with the times are losing market share. Where should marketers be focusing their efforts? What strategies are the experts seeing get the best results? Get up-to-speed with the latest industry insights, trends and predictions for the future in this panel discussion with some leading digital marketing experts.
Mastering Local SEO for Service Businesses in the AI Era is tailored specifically for local service providers like plumbers, dentists, and others seeking to dominate their local search landscape. This session delves into leveraging AI advancements to enhance your online visibility and search rankings through the Content Factory model, designed for creating high-impact, SEO-driven content. Discover the Dollar-a-Day advertising strategy, a cost-effective approach to boost your local SEO efforts and attract more customers with minimal investment. Gain practical insights on optimizing your online presence to meet the specific needs of local service seekers, ensuring your business not only appears but stands out in local searches. This concise, action-oriented workshop is your roadmap to navigating the complexities of digital marketing in the AI age, driving more leads, conversions, and ultimately, success for your local service business.
Key Takeaways:
Embrace AI for Local SEO: Learn to harness the power of AI technologies to optimize your website and content for local search. Understand the pivotal role AI plays in analyzing search trends and consumer behavior, enabling you to tailor your SEO strategies to meet the specific demands of your target local audience. Leverage the Content Factory Model: Discover the step-by-step process of creating SEO-optimized content at scale. This approach ensures a steady stream of high-quality content that engages local customers and boosts your search rankings. Get an action guide on implementing this model, complete with templates and scheduling strategies to maintain a consistent online presence. Maximize ROI with Dollar-a-Day Advertising: Dive into the cost-effective Dollar-a-Day advertising strategy that amplifies your visibility in local searches without breaking the bank. Learn how to strategically allocate your budget across platforms to target potential local customers effectively. The session includes an action guide on setting up, monitoring, and optimizing your ad campaigns to ensure maximum impact with minimal investment.
Digital marketing is the art and science of promoting products or services using digital channels to reach and engage with potential customers. It encompasses a wide range of online tactics and strategies aimed at increasing brand visibility, driving website traffic, generating leads, and ultimately, converting those leads into customers.
https://nidmindia.com/
Is AI-Generated Content the Future of Content Creation?Cut-the-SaaS
Discover the transformative power of AI in content creation with our presentation, "Is AI-Generated Content the Future of Content Creation?" by Puran Parsani, CEO & Editor of Cut-The-SaaS. Learn how AI-generated content is revolutionizing marketing, publishing, education, healthcare, and finance by offering unprecedented efficiency, creativity, and scalability.
Understanding
AI-Generated Content:
AI-generated content includes text, images, videos, and audio produced by AI without direct human involvement. This technology leverages large datasets to create contextually relevant and coherent material, streamlining content production.
Key Benefits:
Content Creation: Rapidly generate high-quality content for blogs, articles, and social media.
Brainstorming: AI simulates conversations to inspire creative ideas.
Research Assistance: Efficiently summarize and research information.
Market Insights:
The content marketing industry is projected to grow to $17.6 billion by 2032, with AI-generated content expected to dominate over 55% of the market.
Case Study: CNET’s AI Content Controversy:
CNET’s use of AI for news articles led to public scrutiny due to factual inaccuracies, highlighting the need for transparency and human oversight.
Benefits Across Industries:
Marketing: Personalize content at scale and optimize engagement with predictive analytics.
Publishing: Automate content creation for faster publication cycles.
Education: Efficiently generate educational materials.
Healthcare: Create accurate content for patients and professionals.
Finance: Produce timely financial content for decision-making.
Challenges and Ethical Considerations:
Transparency: Disclose AI use to maintain trust.
Bias: Address potential AI biases with diverse datasets.
SEO: Ensure AI content meets SEO standards.
Quality: Maintain high standards to prevent misinformation.
Conclusion:
AI-generated content offers significant benefits in efficiency, personalization, and scalability. However, ethical considerations and quality assurance are crucial for responsible use. Explore the future of content creation with us and see how AI is transforming various industries.
Connect with Us:
Follow Cut-The-SaaS on LinkedIn, Instagram, YouTube, Twitter, and Medium. Visit cut-the-saas.com for more insights and resources.
A.I. (artificial intelligence) platforms are popping up all the time, and many of them can and should be used to help grow your brand, increase your sales and decrease your marketing costs.In this presentation:We will review some of the best AI platforms that are available for you to use.We will interact with some of the platforms in real-time, so attendees can see how they work.We will also look at some current brands that are using AI to help them create marketing messages, saving them time and money in the process. Lastly, we will discuss the pros and cons of using AI in marketing & branding and have a lively conversation that includes comments from the audience.
Key Takeaways:
Attendees will learn about LLM platforms, like ChatGPT, and how they work, with preset examples and real time interactions with the platform. Attendees will learn about other AI platforms that are creating graphic design elements at the push of a button...pre-set examples and real-time interactions.Attendees will discuss the pros & cons of AI in marketing + branding and share their perspectives with one another. Attendees will learn about the cost savings and the time savings associated with using AI, should they choose to.
Digital Commerce Lecture for Advanced Digital & Social Media Strategy at UCLA...Valters Lauzums
E-commerce in 2024 is characterized by a dynamic blend of opportunities and significant challenges. Supply chain disruptions and inventory shortages are critical issues, leading to increased shipping delays and rising costs, which impact timely delivery and squeeze profit margins. Efficient logistics management is essential, yet it is often hampered by these external factors. Payment processing, while needing to ensure security and user convenience, grapples with preventing fraud and integrating diverse payment methods, adding another layer of complexity. Furthermore, fulfillment operations require a streamlined approach to handle volume spikes and maintain accuracy in order picking, packing, and shipping, all while meeting customers' heightened expectations for faster delivery times.
Amid these operational challenges, customer data has emerged as an important strategy. By focusing on personalization and enhancing customer experience from historical behavior, businesses can deliver improved website and brand experienced, better product recommendations, optimal promotions, and content to meet individual preferences. Better data analytics can also help in effectively creating marketing campaigns, improving customer retention, and driving product development and inventory management.
Innovative formats such as social commerce and live shopping are beginning to impact the digital commerce landscape, offering new ways to engage with customers and drive sales, and may provide opportunity for brands that have been priced out or seen a downturn with post-pandemic shopping behavior. Social commerce integrates shopping experiences directly into social media platforms, tapping into the massive user bases of these networks to increase reach and engagement. Live shopping, on the other hand, combines entertainment and real-time interaction, providing a dynamic platform for showcasing products and encouraging immediate purchases. These innovations not only enhance customer engagement but also provide valuable data for businesses to refine their strategies and deliver superior shopping experiences.
The e-commerce sector is evolving rapidly, and businesses that effectively manage operational challenges and implement innovative strategies are best positioned for long-term success.
In this presentation, Danny Leibrandt explains the impact of AI on SEO and what Google has been doing about it. Learn how to take your SEO game to the next level and win over Google with his new strategy anyone can use. Get actionable steps to rank your name, your business, and your clients on Google - the right way.
Key Takeaways:
1. Real content is king
2. Find ways to show EEAT
3. Repurpose across all platforms
Come learn how YOU can Animate and Illuminate the World with Generative AI's Explosive Power. Come sit in the driver's seat and learn to harness this great technology.
When most people in the industry talk about online or digital reputation management, what they're really saying is Google search and PPC. And it's usually reactive, left dealing with the aftermath of negative information published somewhere online. That's outdated. It leaves executives, organizations and other high-profile individuals at a high risk of a digital reputation attack that spans channels and tactics. But the tools needed to safeguard against an attack are more cybersecurity-oriented than most marketing and communications professionals can manage. Business leaders Leaders grasp the importance; 83% of executives place reputation in their top five areas of risk, yet only 23% are confident in their ability to address it. To succeed in 2024 and beyond, you need to turn online reputation on its axis and think like an attacker.
Key Takeaways:
- New framework for examining and safeguarding an online reputation
- Tools and techniques to keep you a step ahead
- Practical examples that demonstrate when to act, how to act and how to recover
The digital marketing industry is changing faster than ever and those who don’t adapt with the times are losing market share. Where should marketers be focusing their efforts? What strategies are the experts seeing get the best results? Get up-to-speed with the latest industry insights, trends and predictions for the future in this panel discussion with some leading digital marketing experts.
Financial curveballs sent many American families reeling in 2023. Household budgets were squeezed by rising interest rates, surging prices on everyday goods, and a stagnating housing market. Consumers were feeling strapped. That sentiment, however, appears to be waning. The question is, to what extent?
To take the pulse of consumers’ feelings about their financial well-being ahead of a highly anticipated election, ThinkNow conducted a nationally representative quantitative survey. The survey highlights consumers’ hopes and anxieties as we move into 2024. Let's unpack the key findings to gain insights about where we stand.
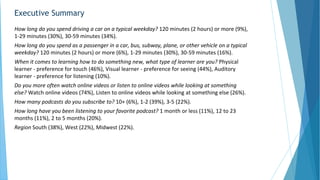
1. Executive Summary
How long do you spend driving a car on a typical weekday? 120 minutes (2 hours) or more (9%),
1-29 minutes (30%), 30-59 minutes (34%).
How long do you spend as a passenger in a car, bus, subway, plane, or other vehicle on a typical
weekday? 120 minutes (2 hours) or more (6%), 1-29 minutes (30%), 30-59 minutes (16%).
When it comes to learning how to do something new, what type of learner are you? Physical
learner - preference for touch (46%), Visual learner - preference for seeing (44%), Auditory
learner - preference for listening (10%).
Do you more often watch online videos or listen to online videos while looking at something
else? Watch online videos (74%), Listen to online videos while looking at something else (26%).
How many podcasts do you subscribe to? 10+ (6%), 1-2 (39%), 3-5 (22%).
How long have you been listening to your favorite podcast? 1 month or less (11%), 12 to 23
months (11%), 2 to 5 months (20%).
Region South (38%), West (22%), Midwest (22%).
2. A nation of drivers, not passengers
Sample Size: 1,000 (All Respondents)
3. How long do you spend driving a car on a typical weekday?
Which of the following best describes your current employment status?
Employe
d full-time
Employe
d part-
time
Self-
employed
Not
employed
Homema
ker
Retired Student Not
working/
currently
on
disability
(%) (%) (%) (%) (%) (%) (%) (%)
[No time + 1-29
minutes]
⇓ 29 47 41 ⇑ 68 51 ⇑ 59 44 ⇑ 64
No time ⇓ 4 12 20 ⇑ 43 17 10 ⇑ 27 ⇑ 29
1-29 minutes ⇓ 26 35 22 25 34 ⇑ 49 ⇓ 17 36
30-59 minutes ⇑ 39 32 32 ⇓ 20 28 32 33 31
60-119 minutes ⇑ 20 9 15 7 14 ⇓ 7 19 ⇓ 2
120 minutes (2 hours)
or more
⇑ 12 13 12 5 7 ⇓ 1 4 2
[60-119 minutes +
120 minutes (2 hours)
or more]
⇑ 32 21 27 12 20 ⇓ 8 23 ⇓ 5
Base n=443 n=103 n=41 n=56 n=88 n=157 n=52 n=42
Sample Size: 1,000 (All Respondents)
4. How long do you spend driving a car on a typical weekday?
How long do you spend as a passenger in a car, bus, subway, plane, or other vehicle
on a typical weekday?
No time 1-29 minutes 30-59 minutes 60-119
minutes
120 minutes (2
hours) or more
(%) (%) (%) (%) (%)
[No time + 1-29 minutes] 45 ⇑ 54 ⇓ 28 ⇓ 27 ⇓ 23
No time 11 11 10 ⇑ 21 17
1-29 minutes 33 ⇑ 42 ⇓ 18 ⇓ 6 ⇓ 6
30-59 minutes 37 ⇓ 29 ⇑ 49 24 ⇓ 8
60-119 minutes 13 12 16 ⇑ 32 12
120 minutes (2 hours) or more ⇓ 5 ⇓ 6 7 ⇑ 16 ⇑ 56
[60-119 minutes + 120 minutes
(2 hours) or more]
⇓ 19 ⇓ 18 23 ⇑ 48 ⇑ 69
Base n=420 n=304 n=166 n=62 n=48
Sample Size: 1,000 (All Respondents)
5. When it comes to learning how to do something new, what type of learner are you?
Sample Size: 1,000 (All Respondents)
6. Do you more often watch online videos or listen to online videos while looking at
something else?
Sample Size: 1,000 (All Respondents)
7. How often do you read each of the following?
Sample Size: 1,000 (All Respondents)
8. How often do you listen to each of the following?
Sample Size: 1,000 (All Respondents)
9. How many podcasts do you subscribe to?
Sample Size: 469 (47% of Respondents)
10. How long have you been listening to your favorite podcast?
Sample Size: 469 (47% of Respondents)
11. How long have you been listening to your favorite podcast?
How many podcasts do you subscribe to?
None 1-2 3-5 6-9 10+
(%) (%) (%) (%) (%)
[Do not have a favorite + 1
month or less]
⇑ 82 38 ⇓ 13 ⇓ 5 7
Do not have a favorite ⇑ 77 ⇓ 18 ⇓ 8 ⇓ 0 4
1 month or less ⇓ 4 ⇑ 20 6 5 4
2 to 5 months ⇓ 6 ⇑ 24 ⇑ 31 10 4
6 to 11 months ⇓ 5 12 17 ⇑ 31 15
12 to 23 months ⇓ 1 13 ⇑ 18 ⇑ 28 15
24 or more months ⇓ 6 ⇓ 12 21 26 59
[12 to 23 + 24 or more months] ⇓ 7 25 ⇑ 39 ⇑ 54 74
Base n=115 n=168 n=120 n=39 n=27
Sample Size: 469 (47% of Respondents)
12. What topics do you listen to on podcasts? - Top 10
Sample Size: 469 (47% of Respondents)
Note: Respondents could select multiple options
13. What topics do you listen to on podcasts?
Option Rank Response
%
Entertainment 1 39%
News 2 27%
Sports 3 26%
Cooking 4 23%
Movies 5 23%
Exercising 6 22%
Television 7 21%
Hobbies 8 21%
Books 9 19%
Personal Improvement 10 18%
Sample Size: 469 (47% of Respondents)
Note: Respondents could select multiple options
Option Rank Response
%
How To 11 15%
Fashion 12 15%
Arts & Crafts 13 13%
Career Advancement 14 13%
Blogging 15 13%
Shopping 16 12%
Vacationing 17 10%
Religion 18 10%
Other 19 12%
14. What topics do you listen to on podcasts?
Which of the following groups describes your current age?
18-24 25-34 35-44 45-54 55-64 65+
(%) (%) (%) (%) (%) (%)
Arts & Crafts 10 15 ⇑ 27 8 ⇓ 3 ⇓ 4
Blogging 7 16 ⇑ 21 14 8 ⇓ 2
Books 16 21 ⇑ 34 17 11 ⇓ 8
Career Advancement 15 16 ⇑ 24 11 5 8
Cooking ⇓ 13 21 ⇑ 35 24 14 18
Entertainment ⇑ 52 ⇑ 50 44 30 ⇓ 8 ⇓ 16
Exercising 15 25 27 19 22 14
Fashion 12 17 ⇑ 30 11 5 ⇓ 0
Hobbies 19 ⇑ 28 24 21 ⇓ 5 12
How To 9 14 18 19 5 22
Movies 16 24 ⇑ 30 25 11 12
News ⇓ 9 24 31 33 ⇑ 49 35
Personal Improvement 28 22 19 19 14 12
Religion 9 7 15 10 19 8
Shopping 10 12 ⇑ 21 8 5 4
Sports 24 30 29 25 14 24
Television 12 ⇑ 27 24 17 14 ⇓ 8
Vacationing 9 7 12 3 8 16
Other 13 12 ⇓ 8 11 19 ⇑ 22
Base n=67 n=122 n=131 n=63 n=37 n=49
15. What topics do you listen to on podcasts?
Do you have any children 25 or younger living in your household?
Yes No
(%) (%)
Arts & Crafts ⇑ 23 ⇓ 5
Blogging ⇑ 21 ⇓ 5
Books ⇑ 29 ⇓ 12
Career Advancement ⇑ 20 ⇓ 11
Cooking ⇑ 34 ⇓ 12
Entertainment 43 35
Exercising ⇑ 29 ⇓ 14
Fashion ⇑ 27 ⇓ 5
Hobbies ⇑ 26 ⇓ 15
How To 17 13
Movies ⇑ 27 ⇓ 17
News 28 29
Personal Improvement 21 18
Religion ⇑ 13 ⇓ 8
Shopping ⇑ 18 ⇓ 6
Sports 27 25
Television ⇑ 24 ⇓ 15
Vacationing 10 8
Other ⇓ 8 ⇑ 18
Base n=252 n=217
16. What topics do you listen to on podcasts?
How many podcasts do you subscribe to?
None 1-2 3-5 6-9 10+
(%) (%) (%) (%) (%)
Arts & Crafts ⇓ 3 ⇓ 10 ⇑ 21 ⇑ 36 37
Blogging ⇓ 4 ⇓ 8 ⇑ 21 ⇑ 26 44
Books ⇓ 10 ⇓ 14 ⇑ 38 33 22
Career Advancement ⇓ 7 ⇓ 8 ⇑ 25 ⇑ 28 41
Cooking ⇓ 11 ⇓ 18 ⇑ 35 ⇑ 41 33
Entertainment ⇓ 26 ⇓ 33 ⇑ 53 ⇑ 59 44
Exercising 16 ⇓ 17 ⇑ 29 31 41
Fashion ⇓ 9 ⇓ 11 22 ⇑ 38 30
Hobbies ⇓ 9 17 ⇑ 31 31 41
How To 12 15 17 15 26
Movies ⇓ 12 18 28 ⇑ 46 37
News 26 26 29 33 41
Personal Improvement ⇓ 12 18 22 31 44
Religion 9 10 12 13 22
Shopping 9 10 14 21 22
Sports 21 ⇓ 21 29 ⇑ 51 33
Sample Size: 469 (47% of Respondents)
17. Where do you learn about new podcasts? - Top 10
Sample Size: 469 (47% of Respondents)
Note: Respondents could select multiple options
18. Where do you learn about new podcasts?
Option Rank Response
%
Friends and family 1 40%
Social media 2 35%
Internet searches 3 28%
Email marketing 4 18%
TV 5 17%
Influencers 6 16%
Magazines 7 14%
Radio 8 14%
Other podcasts 9 14%
Blogs 10 13%
Sample Size: 469 (47% of Respondents)
Note: Respondents could select multiple options
Option Rank Response
%
News feeds 11 12%
Banner ads 12 12%
News articles 13 12%
Events, conferences, and
tradeshows
14 12%
Newsletters 15 6%
Newspapers 16 4%
Webinars 17 3%
Other 18 1%
None of the above 19 7%
19. Where do you learn about new podcasts?
Do you have any children 25 or younger living in your household?
Yes No
(%) (%)
Banner ads ⇑ 18 ⇓ 7
Blogs ⇑ 21 ⇓ 7
Email marketing ⇑ 25 ⇓ 12
Events, conferences, and tradeshows ⇑ 19 ⇓ 6
Friends and family ⇑ 48 ⇓ 35
Influencers ⇑ 23 ⇓ 12
Internet searches 32 27
Magazines ⇑ 22 ⇓ 7
News articles ⇑ 19 ⇓ 11
News feeds 15 10
Newsletters ⇑ 10 ⇓ 4
Newspapers 5 4
Other podcasts 13 18
Radio ⇑ 17 ⇓ 10
Social media 33 37
TV ⇑ 19 ⇓ 12
Webinars 5 2
Other ⇓ <1 ⇑ 3
None of the above ⇓ 4 ⇑ 10
Base n=252 n=217
21. Where do you learn about new podcasts?
How many podcasts do you subscribe to?
None 1-2 3-5 6-9 10+
(%) (%) (%) (%) (%)
Banner ads ⇓ 6 ⇓ 8 17 ⇑ 36 22
Blogs ⇓ 6 ⇓ 10 ⇑ 24 21 37
Email marketing ⇓ 10 15 23 31 44
Events, conferences, and
tradeshows
⇓ 4 ⇓ 8 ⇑ 22 21 26
Friends and family 36 40 48 44 48
Influencers ⇓ 5 14 ⇑ 25 ⇑ 41 30
Internet searches 24 27 32 ⇑ 46 30
Magazines ⇓ 9 12 ⇑ 22 18 26
News articles 14 ⇓ 7 ⇑ 21 ⇑ 31 26
News feeds 8 ⇓ 8 16 ⇑ 28 22
Newsletters 6 ⇓ 4 10 8 15
Newspapers 5 ⇓ 1 6 5 19
Other podcasts ⇓ 8 11 18 ⇑ 31 41
Radio 11 13 14 18 26
Social media 28 39 32 38 52
Sample Size: 469 (47% of Respondents)
22. Response Information
This online survey had 1,000 respondents. It was fielded from February 18 to 19, 2019.
The results presented in this report were weighted to be representative of the overall
population by the following variables:
• What is your gender?
• Which of the following groups describes your current age?
• Are you of Hispanic, Spanish or Latino descent?
• Which of the following best describes your ethnicity?
• What is the highest degree or level of school you have completed?
• Region
23. Crosstab Methodology
Crosstab Table Notes:
• Rather than compare subgroups to other subgroups individually, we compare each
subgroup to the aggregate of all other subgroups.
• This is easier to present and visualize than column comparisons and
differentiates at the low end as well as the high end.
• Since this approach uses the entire sample, rather than a subsample
consisting of two subgroups, it provides greater statistical power and reduces
the chance that differences are false discoveries.
• A statistically significant difference is one that cannot be attributed to chance at a
95% confidence level: 19 times out of 20 the differences would exist in the target
population.
• If the difference is higher at a statistically significant level, the cell is marked
with the up-arrow symbol ⇑. If it is lower, the down-arrow symbol ⇓ is used.
• Columns with fewer than 30 responses (i.e. degrees of freedom) are ignored
for statistical significance comparisons.
• Crosstabs show only unweighted results.
• To fit onto a single slide, some crosstabs have had columns without differences
omitted. See the spreadsheet for the full crosstabs.
24. Researchscape International
Researchscape International is a market-research consultancy
specializing in custom surveys. For questions about this or other
research, please contact us at +1-888-983-1675 x1 or visit our
website, http://www.researchscape.com/.