

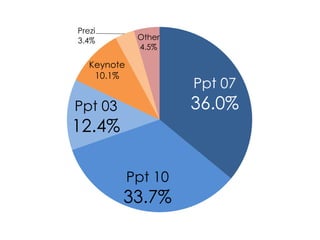

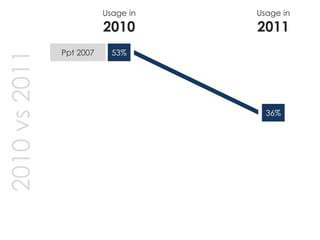
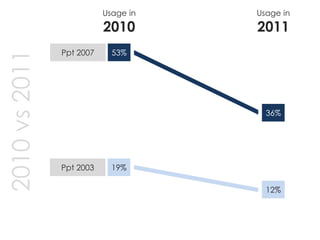
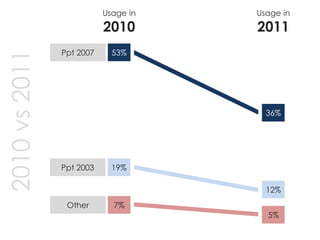
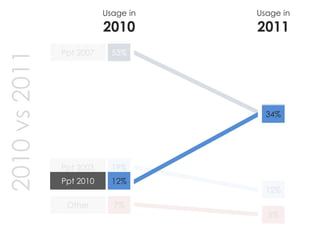
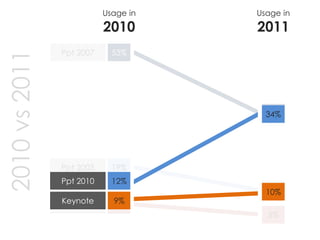
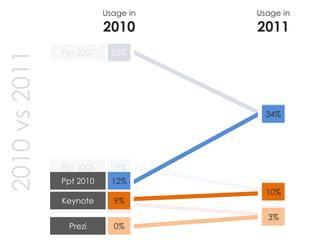


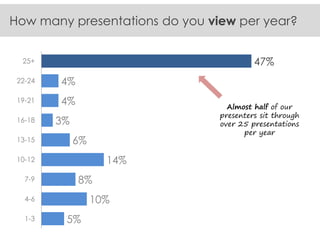
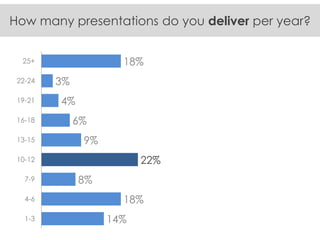


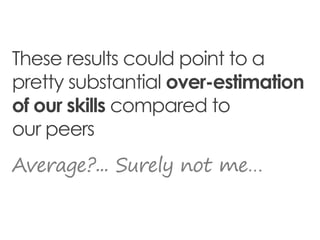

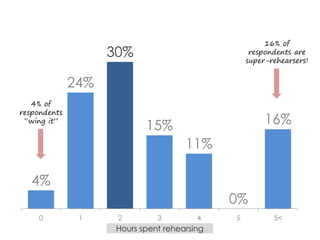


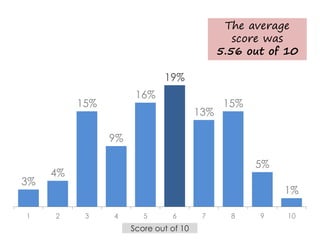


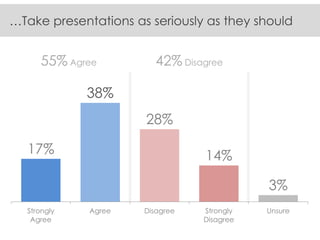


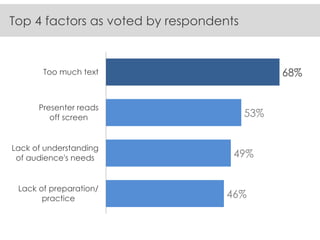


This document summarizes the results of a survey about presentation skills and habits. Some key findings include: - PowerPoint 2007 was the most commonly used presentation software, used by 36% of respondents. - Nearly half of respondents deliver or view over 25 presentations per year. However, only 30% rehearse for more than 2 hours and 16% rehearse 5 or more hours. - Respondents rated the average presentation in their organizations a mediocre 5.56 out of 10. - The top factors cited for what goes wrong in presentations were lack of preparation, not understanding the audience, presenting by reading slides, and using too much text.


![[CXL Live 16] Opening Keynote by Peep Laja](https://cdn.slidesharecdn.com/ss_thumbnails/01peeplaja-openingkeynote-160401004912-thumbnail.jpg?width=640&height=640&fit=bounds)


![[CXL Live 16] How To Present Your Testing Results to Get Results by Lea Pica](https://cdn.slidesharecdn.com/ss_thumbnails/wphkhkx1t36ntigrqts4-signature-42db88fde2139044dd6963018b134da7e709739587431e34ce8d4285185c8547-poli-160403200011-thumbnail.jpg?width=640&height=640&fit=bounds)


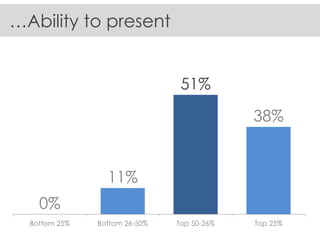
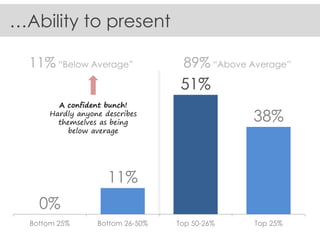
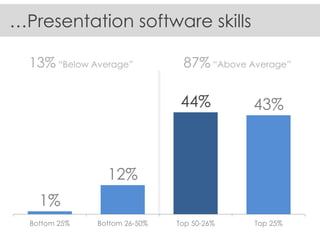
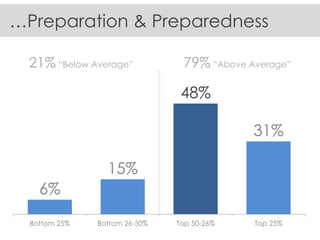
![74676371-Coagulation-and-Flocculation[1].ppt](https://cdn.slidesharecdn.com/ss_thumbnails/74676371-coagulation-and-flocculation1-260116154109-a3cbf55e-thumbnail.jpg?width=640&height=640&fit=bounds)
