Over one in five American adults (23%) with online access have played a tabletop role-playing game (TTRPG) such as Dungeons & Dragons (D&D), Pathfinder, or GURPs. While 45% of men under 45 years old have played, less than 10% of men over 55 have played; 39% of women under 25 have played, compared to 25% of women 25 to 34, and 10% of women 55-64.
This document summarizes the iterative design process for a game called ColorShoot. It describes three usability studies conducted with paper and digital prototypes to test explanations, gameplay, and difficulty. The final study compared two versions—Colored Parachute and Colored Word—with 29 children aged 10-11. Results found that children enjoyed the game and there was no significant difference in response times between the two versions. The iterative testing process improved the game's introduction, interaction, and difficulty over multiple rounds of user feedback.
The document discusses why games are an effective medium for education according to a survey of over 1,100 teens. It finds that 97% of teens play games and at least half play daily, with little gender difference. It lists five reasons why games are good for education: 1) Teens enjoy games 2) Games can teach any subject 3) Games are still evolving 4) Games can be profitable 5) Games replace TV time. It then outlines an education game development plan focusing on annual themes and working with UK indie developers to target an "interesting" price range. A number of completed and upcoming games are listed along with evaluation metrics.
The document is a survey asking for feedback on poster design concepts for video games by Tale of Tales from the 1970s style. It explains that simple sketches have been generated for ideas and is seeking assistance in deciding on final designs to be redrawn and digitally rendered. The survey then asks questions about demographics, experience with Tale of Tales games, preferences between poster concepts, and font choice to gather market research for the project.
The document discusses creating 70s-inspired posters for video games by Tale of Tales. It provides context that the creator has generated initial poster concepts through sketches and is now seeking feedback to help decide on final designs. The feedback received will aid in refining the posters and conducting market research, so all responses are valuable. It then asks a series of questions to gather respondent demographics and preferences regarding the game titles and poster designs.
Update 12/18/13: Please e-mail me at LanoraTM@gmail.com if you would like to download these slides or have questions. Thank you for viewing! (Update: Nana has changed rating as of 2013 from Teen 16 to Mature)
The document summarizes the results of two questionnaires about gaming preferences. It finds that most respondents were male aged 11-16 or older. The most popular game was GTA V, while RPG was the most popular genre. Most would spend £40-£50 on a game and favored the PlayStation console. Rockstar was the most liked company, while Ubisoft was the least, and most respondents did not rent games.
This survey was completed by 30 students to understand preferences around horror movies. Key findings include:
- 80% of respondents were male and most were between 16-18 years old.
- The most popular horror subgenres were slasher (40%) and gothic (23%).
- Lord of the Rings and Harry Potter were among the most popular non-horror films.
- While over 50% sometimes see horror films at the cinema, most first saw one around ages 15-16.
- The ages 17-20+ are most likely for viewing horror.
- 60% expressed interest in watching a horror film produced by students.
This survey was completed by 30 students to understand preferences around horror movies. Key findings include:
- 80% of respondents were male and most were between 16-18 years old.
- The most popular horror subgenres were slasher (40%) and gothic (23%). Lord of the Rings was the most commonly cited favorite film overall (21%).
- While over half only sometimes see horror films at the cinema, most had their first viewing around ages 15-16.
- The ages 17-20+ were deemed most likely for viewing horror now.
- 60% expressed interest in a student-produced horror film, with 30% responding "maybe".
Amanda Lenhart's presentation to the Game Developers Conference in San Francisco on Friday, March 27 2009. The talk covers demographic data on teen and adult gamers and data on the games teens play, parents and their attitudes and behaviors towards games as well as the potential for games to teach teens about citizenship and civic engagement.
This presentation follows the structure of a Gender Stereotypes lesson found on GLSEN.org. It is not in itself a lesson, it just provides a flow to the lesson. The full lesson plan is here: https://www.glsen.org/activity/thats-gender-stereotype
The document summarizes the results of a questionnaire about gaming preferences. It found that most respondents were male (91%) between ages 17-older (50%) and their favorite genre was RPG (36.36%). The most popular amount spent on games was £40-£50 (54.55%) and most planned to buy a PS4 (58.33%) this year. Rockstar was the most strongly agreed with game company.
The questionnaire results showed that 91% of respondents were male, with most being ages 17 or older. RPG was the most popular game genre at 36.36% of responses. The majority of respondents, 54.55%, spend £40-£50 on games. PS4 was the preferred next-gen console at 58.33% compared to 41.67% for Xbox One. Rockstar was rated the highest among game companies.
The document summarizes several classic Japanese role-playing games including Crono Trigger, Octopath Traveler, and Earthbound. It discusses the gameplay mechanics, story elements, characters, and development teams of each game. Common features among the games include turn-based combat systems, exploration of unique time periods and locations, and memorable soundtracks.
Bridging the Boomer/Gamer Knowledge Gap in the LibraryKarl Kapp
This presentation was given to a group of librarians. The purpose of the presentation is to describe the boomer/gamer knowledge gap and explore ways in which librarians can help to bridge that gap. The questions within the presentation were for an audience response software TurninPoint.
Tell Me Stories - Discovery challenge implementationErennio Iannotta
An iOS application that let children learn while playing. It has been made using the Challenge Based Learning Pattern (CBL) during the iOS Developer Academy in 2017. In collaboration with Alberto Volpe.
The document summarizes findings from a survey about American teens' video game playing habits and the potential relationship between gaming and civic engagement. Some key findings include: nearly all teens play games, especially games involving racing, puzzles and sports; games are highly social activities for many teens; having frequent civic gaming experiences where players help others or discuss social issues relates to greater civic participation offline; and parental monitoring of games does not reduce playing of mature-rated games or exposure to anti-social behavior.
Not Another Leaderboard! Or How I Learned to Love GamificationKineoPacific
“Leaderboards, badges, agency” – these words are meaningless on their own. This presentation aims to give the “why” and “how” of using behavioural game theory in education, while avoiding psych jargon like “behavioural game theory”. By the end you’ll understand that humans make strange decisions. You’ll also walk away with a toolbox of questions and techniques to apply during design to improve what most learning wants to do anyway: change learner behaviour.
www.kineo.com
Presented at Meaningful Play 2018, East Lansing, Michigan. Please note, the website for the game (http://aberrantry.com/) is in development at this time. The game code is in GitHub, & a download link is available at the website.
Most respondents to the gaming survey were male (77.27%), between ages 11-17 or older (91.09%), and their favorite game was GTA V. The most popular game genre was RPG (36.36%), and most respondents would spend around £45 per month on games. For upcoming consoles, the PS4 was preferred (58.33%). The average playing time on a game console reported was 3-4 hours. The survey provided insight into gamers' preferences regarding gender, age, favorite games, spending habits, console preferences, and typical play time.
A survey of 52 people found that:
- Males aged 18-24 preferred shooters and sports games, while females aged 35-44 preferred mobile games like Candy Crush.
- Younger age groups aged 12-17 played popular games like FIFA and GTA, while those aged 18-24 were interested in discussing their game preferences.
- Around 3/4 of respondents played games with in-game purchases, and those in occupation groups D and E reported making purchases to upgrade games.
- The most popular consoles were PS4, Xbox One, and mobile devices, showing the influence of media advertising on consumers.
The document analyzes primary research data from a questionnaire about thriller films. It contains several charts and graphs summarizing the responses. The key findings are:
- Most respondents were female, between 16-18 years old, with varying household incomes
- The majority enjoyed action thrillers and would like to see a female protagonist and antagonist
- Settings like abandoned buildings, forests, and dark alleyways were most associated with the thriller genre
Surveys have a lot of tradition and norms behind them. And a lot of templates. Many of these templates were written many years ago when formal language made a lot more sense. Today, people expect casual and friendly language everywhere including from brands and companies. This presentation shows what happens to data quality and survey results when real language, not Charles Dickens language, is used.
Pillow Talk Caribbean is rolling out a selection of board games focused on intimacy and sexuality. The games range in price from $35-$95 and include Twister-inspired body contact games, fill-in-the-blank dirty questions, and choose your own adventure scenarios. The descriptions provide details on gameplay and suggest the games could help initiate new intimacy or restart a slowing sex life for couples. Customer service contact info is provided at the end.
The document summarizes the results of a survey about thrillers. It shows that the majority of respondents were male aged 16-25. Dark, gray colors and city settings were preferred. Top thriller titles included The Dark Knight and Se7en. Respondents indicated thrillers should include both smart and casual clothing. Common feelings elicited were nervousness, tension and shock. The document concludes the thriller should appeal to young males and use conventions to define the genre.
The document summarizes the results of an online survey about personal finances and student debt. Key findings include:
- Over half of respondents had credit card or car loan debt at some point, while nearly half currently have credit card debt.
- Thirteen percent have over $50,000 in outstanding student loans, and 43% have paid off almost none of their student loans.
- Most respondents feel college degrees are not affordable, especially among older age groups, and see a college degree as important for attaining a middle-class lifestyle.
The document is an executive summary of survey results about postgraduate education. It provides data on respondents' likelihood of obtaining a postgraduate degree, current enrollment status, planned enrollment timelines, and reasons for considering further education. Key findings include that 17% of respondents already have a postgraduate degree or are currently enrolled in one. 31% plan to enroll within the next 2 years. The most common reasons for considering further education are career advancement and higher pay.
More Related Content
Similar to TTRPG, Gamebook, and Interactive Fiction Survey
This survey was completed by 30 students to understand preferences around horror movies. Key findings include:
- 80% of respondents were male and most were between 16-18 years old.
- The most popular horror subgenres were slasher (40%) and gothic (23%). Lord of the Rings was the most commonly cited favorite film overall (21%).
- While over half only sometimes see horror films at the cinema, most had their first viewing around ages 15-16.
- The ages 17-20+ were deemed most likely for viewing horror now.
- 60% expressed interest in a student-produced horror film, with 30% responding "maybe".
Amanda Lenhart's presentation to the Game Developers Conference in San Francisco on Friday, March 27 2009. The talk covers demographic data on teen and adult gamers and data on the games teens play, parents and their attitudes and behaviors towards games as well as the potential for games to teach teens about citizenship and civic engagement.
This presentation follows the structure of a Gender Stereotypes lesson found on GLSEN.org. It is not in itself a lesson, it just provides a flow to the lesson. The full lesson plan is here: https://www.glsen.org/activity/thats-gender-stereotype
The document summarizes the results of a questionnaire about gaming preferences. It found that most respondents were male (91%) between ages 17-older (50%) and their favorite genre was RPG (36.36%). The most popular amount spent on games was £40-£50 (54.55%) and most planned to buy a PS4 (58.33%) this year. Rockstar was the most strongly agreed with game company.
The questionnaire results showed that 91% of respondents were male, with most being ages 17 or older. RPG was the most popular game genre at 36.36% of responses. The majority of respondents, 54.55%, spend £40-£50 on games. PS4 was the preferred next-gen console at 58.33% compared to 41.67% for Xbox One. Rockstar was rated the highest among game companies.
The document summarizes several classic Japanese role-playing games including Crono Trigger, Octopath Traveler, and Earthbound. It discusses the gameplay mechanics, story elements, characters, and development teams of each game. Common features among the games include turn-based combat systems, exploration of unique time periods and locations, and memorable soundtracks.
Bridging the Boomer/Gamer Knowledge Gap in the LibraryKarl Kapp
This presentation was given to a group of librarians. The purpose of the presentation is to describe the boomer/gamer knowledge gap and explore ways in which librarians can help to bridge that gap. The questions within the presentation were for an audience response software TurninPoint.
Tell Me Stories - Discovery challenge implementationErennio Iannotta
An iOS application that let children learn while playing. It has been made using the Challenge Based Learning Pattern (CBL) during the iOS Developer Academy in 2017. In collaboration with Alberto Volpe.
The document summarizes findings from a survey about American teens' video game playing habits and the potential relationship between gaming and civic engagement. Some key findings include: nearly all teens play games, especially games involving racing, puzzles and sports; games are highly social activities for many teens; having frequent civic gaming experiences where players help others or discuss social issues relates to greater civic participation offline; and parental monitoring of games does not reduce playing of mature-rated games or exposure to anti-social behavior.
Not Another Leaderboard! Or How I Learned to Love GamificationKineoPacific
“Leaderboards, badges, agency” – these words are meaningless on their own. This presentation aims to give the “why” and “how” of using behavioural game theory in education, while avoiding psych jargon like “behavioural game theory”. By the end you’ll understand that humans make strange decisions. You’ll also walk away with a toolbox of questions and techniques to apply during design to improve what most learning wants to do anyway: change learner behaviour.
www.kineo.com
Presented at Meaningful Play 2018, East Lansing, Michigan. Please note, the website for the game (http://aberrantry.com/) is in development at this time. The game code is in GitHub, & a download link is available at the website.
Most respondents to the gaming survey were male (77.27%), between ages 11-17 or older (91.09%), and their favorite game was GTA V. The most popular game genre was RPG (36.36%), and most respondents would spend around £45 per month on games. For upcoming consoles, the PS4 was preferred (58.33%). The average playing time on a game console reported was 3-4 hours. The survey provided insight into gamers' preferences regarding gender, age, favorite games, spending habits, console preferences, and typical play time.
A survey of 52 people found that:
- Males aged 18-24 preferred shooters and sports games, while females aged 35-44 preferred mobile games like Candy Crush.
- Younger age groups aged 12-17 played popular games like FIFA and GTA, while those aged 18-24 were interested in discussing their game preferences.
- Around 3/4 of respondents played games with in-game purchases, and those in occupation groups D and E reported making purchases to upgrade games.
- The most popular consoles were PS4, Xbox One, and mobile devices, showing the influence of media advertising on consumers.
The document analyzes primary research data from a questionnaire about thriller films. It contains several charts and graphs summarizing the responses. The key findings are:
- Most respondents were female, between 16-18 years old, with varying household incomes
- The majority enjoyed action thrillers and would like to see a female protagonist and antagonist
- Settings like abandoned buildings, forests, and dark alleyways were most associated with the thriller genre
Surveys have a lot of tradition and norms behind them. And a lot of templates. Many of these templates were written many years ago when formal language made a lot more sense. Today, people expect casual and friendly language everywhere including from brands and companies. This presentation shows what happens to data quality and survey results when real language, not Charles Dickens language, is used.
Pillow Talk Caribbean is rolling out a selection of board games focused on intimacy and sexuality. The games range in price from $35-$95 and include Twister-inspired body contact games, fill-in-the-blank dirty questions, and choose your own adventure scenarios. The descriptions provide details on gameplay and suggest the games could help initiate new intimacy or restart a slowing sex life for couples. Customer service contact info is provided at the end.
The document summarizes the results of a survey about thrillers. It shows that the majority of respondents were male aged 16-25. Dark, gray colors and city settings were preferred. Top thriller titles included The Dark Knight and Se7en. Respondents indicated thrillers should include both smart and casual clothing. Common feelings elicited were nervousness, tension and shock. The document concludes the thriller should appeal to young males and use conventions to define the genre.
Similar to TTRPG, Gamebook, and Interactive Fiction Survey (20)
The document summarizes the results of an online survey about personal finances and student debt. Key findings include:
- Over half of respondents had credit card or car loan debt at some point, while nearly half currently have credit card debt.
- Thirteen percent have over $50,000 in outstanding student loans, and 43% have paid off almost none of their student loans.
- Most respondents feel college degrees are not affordable, especially among older age groups, and see a college degree as important for attaining a middle-class lifestyle.
The document is an executive summary of survey results about postgraduate education. It provides data on respondents' likelihood of obtaining a postgraduate degree, current enrollment status, planned enrollment timelines, and reasons for considering further education. Key findings include that 17% of respondents already have a postgraduate degree or are currently enrolled in one. 31% plan to enroll within the next 2 years. The most common reasons for considering further education are career advancement and higher pay.
The document provides survey results from 1,000 respondents on transportation habits, learning styles, media consumption, and podcast listening behaviors. Key findings include:
- Most respondents spend 30-59 minutes driving per weekday, while fewer spend over 2 hours. Time spent as a passenger is lower.
- Visual and physical learning are most common. Watching online videos is more common than listening.
- Entertainment, news, and sports are the most listened to podcast topics. Friends/family and social media are main ways to discover new podcasts.
- Podcast subscriptions increase with age and income. Parents are more likely to listen to certain topics like arts/crafts and cooking.
So in summary,
We all need to eat and, for a majority of consumers, that involves the chore of grocery shopping, but how and when do most consumers go about it? A survey of 1,000 U.S. adults.
Six out of ten Americans are taking vacation this summer, with plans driven by economics and marital status. Seven out of ten (71%) married adults will vacation, compared to just half of divorced adults (49%). While only 46% of those making under $25,000 a year in household income will vacation this summer, 81% of those making $100,000 to $149,999 will, and 91% of those making $150,000 to $199,999 will.
The document appears to be a survey report about pet ownership and dog walking habits. Some key findings:
- 51% of respondents own dogs, 38% own cats, and 32% do not own pets. Of dog owners, 63% own 1 dog and 25% own 2 dogs.
- 72% of dog owners feel they walk their dogs the right amount, while 26% feel it is too little. Walking habits vary - 18% walk dogs multiple times a day while 14% never walk their dogs.
- Neighborhoods are the most common walking location at 88%. Employment status and region impact walking locations and frequency of driving for walks.
- Neighborhoods, towns, and counties are
The document discusses survey results about how social media impacts democracy. 50% of respondents believe the internet helps democracy, while 32% believe it has no impact and 18% believe it hurts democracy. For social media sites like Facebook and Twitter, more respondents believe they help (38%) rather than hurt (30%) democracy. The top reasons cited for why social media helps democracy are that it allows spread of ideas and information, and connects like-minded people. Reasons cited for why it hurts include spreading of misinformation and fake news, as well as promoting one-sided views.
Tom Cruise Daughter: An Insight into the Life of Suri Cruisegreendigital
Tom Cruise is a name that resonates with global audiences for his iconic roles in blockbuster films and his dynamic presence in Hollywood. But, beyond his illustrious career, Tom Cruise's personal life. especially his relationship with his daughter has been a subject of public fascination and media scrutiny. This article delves deep into the life of Tom Cruise daughter, Suri Cruise. Exploring her upbringing, the influence of her parents, and her current life.
Follow us on: Pinterest
Introduction: The Fame Surrounding Tom Cruise Daughter
Suri Cruise, the daughter of Tom Cruise and Katie Holmes, has been in the public eye since her birth on April 18, 2006. Thanks to the media's relentless coverage, the world watched her grow up. As the daughter of one of Hollywood's most renowned actors. Suri has had a unique upbringing marked by privilege and scrutiny. This article aims to provide a comprehensive overview of Suri Cruise's life. Her relationship with her parents, and her journey so far.
Early Life of Tom Cruise Daughter
Birth and Immediate Fame
Suri Cruise was born in Santa Monica, California. and from the moment she came into the world, she was thrust into the limelight. Her parents, Tom Cruise and Katie Holmes. Were one of Hollywood's most talked-about couples at the time. The birth of their daughter was a anticipated event. and Suri's first public appearance in Vanity Fair magazine set the tone for her life in the public eye.
The Impact of Celebrity Parents
Having celebrity parents like Tom Cruise and Katie Holmes comes with its own set of challenges and privileges. Suri Cruise's early life marked by a whirlwind of media attention. paparazzi, and public interest. Despite the constant spotlight. Her parents tried to provide her with an upbringing that was as normal as possible.
The Influence of Tom Cruise and Katie Holmes
Tom Cruise's Parenting Style
Tom Cruise known for his dedication and passion in both his professional and personal life. As a father, Cruise has described as loving and protective. His involvement in the Church of Scientology, but, has been a point of contention and has influenced his relationship with Suri. Cruise's commitment to Scientology has reported to be a significant factor in his and Holmes' divorce and his limited public interactions with Suri.
Katie Holmes' Role in Suri's Life
Katie Holmes has been Suri's primary caregiver since her separation from Tom Cruise in 2012. Holmes has provided a stable and grounded environment for her daughter. She moved to New York City with Suri to start a new chapter in their lives away from the intense scrutiny of Hollywood.
Suri Cruise: Growing Up in the Spotlight
Media Attention and Public Interest
From stylish outfits to everyday activities. Suri Cruise has been a favorite subject for tabloids and entertainment news. The constant media attention has shaped her childhood. Despite this, Suri has managed to maintain a level of normalcy, thanks to her mother's efforts.
Taylor Swift: Conquering Fame, Feuds, and Unmatched Success | CIO Women MagazineCIOWomenMagazine
From country star to global phenomenon, delve into Taylor Swift's incredible journey. Explore chart-topping hits, feuds, & her rise to billionaire status!
Party Photo Booth Prop Trends to Unleash Your Inner StyleBirthday Galore
Are you planning an unforgettable event and looking for the best photo booth props to make it a memorable night? Party photo booth props have become essential to any celebration, allowing guests to capture priceless memories and express their personalities. Here, we'll explore the hottest party photo booth prop trends that will unleash your inner style and create a buzz-worthy experience with Birthday Galore!
For more details visit - birthdaygalore.com
The cats, Sunny and Rishi, are brothers who live with their sister, Jessica, and their grandmother, Susie. They work as cleaners but wish to seek other kinds of employment that are better than their current jobs. New career adventures await Sunny and Rishi!
Enhance Your Viewing Experience with Gold IPTV- Tips and Tricks for 2024.pdfXtreame HDTV
In the ever-evolving landscape of digital entertainment, IPTV (Internet Protocol Television) has emerged as a popular alternative to traditional cable and satellite TV services. Offering unparalleled flexibility, a vast selection of channels, and affordability, IPTV services like Gold IPTV have revolutionized the way we consume television content. This comprehensive guide will delve into everything you need to know about Gold IPTV, its features, benefits, setup process, and how it can enhance your viewing experience.
Jason Kozup is a versatile figure whose impact spans numerous sectors. From the realms of entertainment and security, he has thrived as a producer, actor, stuntman, model, and aerospace defense contractor, showcasing excellence across the board.
The Evolution and Impact of Tom Cruise Long Hairgreendigital
Tom Cruise is one of Hollywood's most iconic figures, known for his versatility, charisma, and dedication to his craft. Over the decades, his appearance has been almost as dynamic as his filmography, with one aspect often drawing significant attention: his hair. In particular, Tom Cruise long hair has become a defining feature in various phases of his career. symbolizing different roles and adding layers to his on-screen characters. This article delves into the evolution of Tom Cruise long hair, its impact on his roles. and its influence on popular culture.
Follow us on: Pinterest
Introduction
Tom Cruise long hair has often been more than a style choice. it has been a significant element of his persona both on and off the screen. From the tousled locks of the rebellious Maverick in "Top Gun" to the sleek, sophisticated mane in "Mission: Impossible II." Cruise's hair has played a pivotal role in shaping his image and the characters he portrays. This article explores the various stages of Tom Cruise long hair. Examining how this iconic look has evolved and influenced his career and broader fashion trends.
Early Days: The Emergence of a Style Icon
The 1980s: The Birth of a Star
In the early stages of his career during the 1980s, Tom Cruise sported a range of hairstyles. but in "Top Gun" (1986), his hair began to gain significant attention. Though not long by later standards, his hair in this film was longer than the military crew cuts associated with fighter pilots. adding a rebellious edge to his character, Pete "Maverick" Mitchell.
Risky Business: The Transition Begins
In "Risky Business" (1983). Tom Cruise's hair was short but longer than the clean-cut styles dominant at the time. This look complemented his role as a high school student stepping into adulthood. embodying a sense of youthful freedom and experimentation. It was a precursor to the more dramatic hair transformations in his career.
The 1990s: Experimentation and Iconic Roles
Far and Away: Embracing Length
One of the first films in which Tom Cruise embraced long hair was "Far and Away" (1992). Playing the role of Joseph. an Irish immigrant in 1890s America, Cruise's long, hair added authenticity to his character's rugged and determined persona. This look was a stark departure from his earlier. more polished styles and marked the beginning of a more adventurous phase in his hairstyle choices.
Interview with the Vampire: Gothic Elegance
In "Interview with the Vampire" (1994). Tom Cruise long hair reached new lengths of sophistication and elegance. Portraying the vampire Lestat. Cruise's flowing blonde locks were integral to the character's ethereal and timeless allure. This hairstyle not only suited the gothic aesthetic of the film but also showcased Cruise's ability to transform his appearance for a role.
Mission: Impossible II: The Pinnacle of Long Hair
One of the most memorable instances of Tom Cruise long hair came in "Mission: Impossible II" (2000). His character, Ethan
HD Video Player All Format - 4k & live streamHD Video Player
Discover the best video playback experience with HD Video Player. Our powerful, user-friendly app supports all popular video formats and codecs, ensuring seamless playback of your favorite videos in stunning HD and 4K quality. Whether you're watching movies, TV shows, or personal videos, HD Video Player provides the ultimate viewing experience on your device. 🚀
You know you're an adult when every check-up gets you down. View What Going to the Doctor is Like as an Adult and more funny posts on salty vixen stories & more-saltyvixenstories.com
The Midnight Sculptor.pdf writer by Ali alsiadali345alghlay
The city of Ravens burg was known for its gothic architecture, fog-covered streets, and an eerie silence that seemed to hang over the town like a shroud.
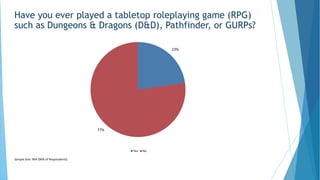
1. 23%
77%
Yes No
Sample Size: 964 (96% of Respondents)
Have you ever played a tabletop roleplaying game (RPG)
such as Dungeons & Dragons (D&D), Pathfinder, or GURPs?
2. Have you ever played a tabletop roleplaying game (RPG)
such as Dungeons & Dragons (D&D), Pathfinder, or GURPs?
Which of the following groups describes your current age?
18-24 25-34 35-44 45-54 55-64 65+
(%) (%) (%) (%) (%) (%)
Yes ⇑ 41 ⇑ 36 ⇑ 32 23 ⇓ 9 ⇓ 4
No ⇓ 59 ⇓ 64 ⇓ 68 77 ⇑ 91 ⇑ 96
Base n=111 n=180 n=206 n=181 n=127 n=159
Sample Size: 964 (96% of Respondents)
Nested Gender and Age
Male
18-24
Male
25-34
Male
35-44
Male
45-54
Male
55-64
Male
65+
Female
18-24
Female
25-34
Female
35-44
Female
45-54
Female
55-64
Female
65+
(%) (%) (%) (%) (%) (%) (%) (%) (%) (%) (%) (%)
Yes ⇑ 44 ⇑ 46 ⇑ 44 28 ⇓ 9 ⇓ 7 ⇑ 39 25 19 18 ⇓ 10 ⇓ 0
No ⇓ 56 ⇓ 54 ⇓ 56 72 ⇑ 91 ⇑ 93 ⇓ 61 75 81 82 ⇑ 90 ⇑ 100
Base n=55 n=91 n=104 n=90 n=64 n=81 n=56 n=89 n=102 n=91 n=63 n=78
3. Which tabletop roleplaying games have you played? - Top 10
62%
25%
23%
18%
17%
16%
15%
15%
13%
12%
0% 25% 50% 75% 100%
Dungeons & Dragons
Star Wars RPG
Dragon Age
Advanced Fighting Fantasy
Star Trek Adventures
Dungeon World
Blades in the Dark
Pathfinder
Bubblegumshoe
Beyond the Wall
Sample Size: 234 (23% of Respondents)
Note: Respondents could select multiple options
4. 40%
32%
32%
26%
25%
24%
20%
20%
19%
9%
0% 25% 50% 75% 100%
Dungeons & Dragons, 5th Edition
Original Dungeons & Dragons
Dungeons & Dragons, 4th Edition
Advanced Dungeons & Dragons, 2nd Edition
Basic Dungeons & Dragons
Advanced Dungeons & Dragons
Dungeons & Dragons, v. 3.5
Dungeons & Dragons, 3rd Edition
Basic/Expert Set Dungeons & Dragons
Don't recall
Other
None of the above
Sample Size: 144 (14% of Respondents)
Note: Respondents could select multiple options
Which editions of Dungeons & Dragons have you ever
played?
6. Which editions of Dungeons & Dragons have you ever
played?
Do you have any children 25 or younger living in your
household?
Yes No
(%) (%)
Original Dungeons & Dragons 36 30
Basic Dungeons & Dragons 28 22
Advanced Dungeons & Dragons 28 21
Basic/Expert Set Dungeons & Dragons 27 17
Advanced Dungeons & Dragons, 2nd Edition 30 23
Dungeons & Dragons, 3rd Edition ⇑ 33 ⇓ 10
Dungeons & Dragons, v. 3.5 ⇑ 34 ⇓ 12
Dungeons & Dragons, 4th Edition ⇑ 46 ⇓ 19
Dungeons & Dragons, 5th Edition ⇑ 48 ⇓ 31
Don't recall ⇓ 3 ⇑ 14
Base n=67 n=77
Sample Size: 144 (14% of Respondents)
7. 2%
7%
58%
18%
6%
3%
5%
0% 25% 50% 75% 100%
1 - 4
5 - 9
10 - 19
20 - 29
30 - 39
40 - 49
50 - 99
Sample Size: 144 (14% of Respondents)
How old were you when you first played Dungeons &
Dragons?
8. When was the last time you played Dungeons & Dragons?
6%
33%
16%
14%
7%
24%
0% 25% 50% 75% 100%
Today
In the past week
In the past month
In the past year
1-5 years ago
6 or more years ago
Sample Size: 144 (14% of Respondents)
10. What is preventing you from trying Dungeons & Dragons, 5th
edition?
Word Frequency Example Quote
Play 22 "I haven't played it since I had my kids. I was still in college the last
time I played and would have to learn a lot to start playing again. I just
don't have the amount of time that it takes to play."
Time 14 "I don't really like the game, I just went along with it for a boyfriend at
the time, back in late 1980s."
Interest 8 "I found other games that I am more interested in playing."
To play with 8 "I don't have anyone to play with and the rules seem to be too involved
as well as the material being too expensive."
Nothing 7 "Nothing don't have much time to play work too much."
One 7 "I like playing other kinds of games more as opposed to this one which
is more time consuming."
Game 6 "I just need to buy the game."
Money 4 "I don't have enough money for it."
Just 4 "I just haven’t been able to look into it or research."
Friends 4 "All my friends that played have had families and don't have time."
11. 20%
80%
Yes No
Sample Size: 964 (96% of Respondents)
Have you ever read any gamebooks, such as Choose Your
Own Adventure, Fighting Fantasy, Lone Wolf, or solitaire
RPG adventures such as the Tunnels & Trolls series?
12. Have you ever read any gamebooks, such as Choose Your
Own Adventure, Fighting Fantasy, Lone Wolf, or solitaire
RPG adventures such as the Tunnels & Trolls series?
Which of the following groups describes your current age?
18-24 25-34 35-44 45-54 55-64 65+
(%) (%) (%) (%) (%) (%)
Yes ⇑ 30 ⇑ 34 ⇑ 39 18 ⇓ 4 ⇓ 3
No ⇓ 70 ⇓ 66 ⇓ 61 82 ⇑ 96 ⇑ 97
Base n=114 n=179 n=204 n=181 n=128 n=158
Sample Size: 964 (96% of Respondents)
Have you ever played a tabletop roleplaying game (RPG) such as Dungeons & Dragons (D&D),
Pathfinder, or GURPs?
Yes No
(%) (%)
Yes ⇑ 56 ⇓ 12
No ⇓ 44 ⇑ 88
Base n=227 n=720
13. 20%
80%
Yes No
Sample Size: 942 (94% of Respondents)
Have you ever played any text adventures or interactive
fiction games on a computer, tablet or smartphone, such as
Choice of Games, Infocom, or Twine games?
14. Have you ever played any text adventures or interactive
fiction games on a computer, tablet or smartphone, such as
Choice of Games, Infocom, or Twine games?
Which of the following groups describes your current age?
18-24 25-34 35-44 45-54 55-64 65+
(%) (%) (%) (%) (%) (%)
Yes ⇑ 45 ⇑ 36 26 ⇓ 12 ⇓ 8 ⇓ 3
No ⇓ 55 ⇓ 64 74 ⇑ 88 ⇑ 92 ⇑ 97
Base n=110 n=179 n=204 n=174 n=126 n=149
Sample Size: 942 (94% of Respondents)
Have you ever played a tabletop roleplaying game (RPG) such as Dungeons & Dragons (D&D),
Pathfinder, or GURPs?
Yes No
(%) (%)
Yes ⇑ 62 ⇓ 9
No ⇓ 38 ⇑ 91
Base n=226 n=698
15. We welcome any comments about RPGs, gamebooks, or
interactive fiction.
16. We welcome any comments about RPGs, gamebooks, or
interactive fiction.
Word Frequency Example Quote
None 85 "I have none as i'm not familiar with them."
Game 32 "I think they are super fun for people that love games that push your imagination further."
Play 31 "I played Douglas Adam's Hitchhiker's Guide to the Galaxy and The Hobbit on Commodore 64
as text based adventures. I preferred the Hobbit because the NPCs were not bound to a story
line and would interact in an open world manner."
Fun 29 "I've always wanted to play tabletop games and RPGs like Dungeons and Dragons, they seem
like they'd be really fun, but I don't know anyone who plays and I also have no idea how to get
started with RPGs."
Good 27 "My biggest selling point for a good RPG is the feeling that my decisions have tangible impact
on the game world."
Love 26 "My favorite gamebooks have been the ones in the Goosebumps series, namely Escape From
Horrorland, and I read all of the interactive fiction entries on a great old website called I-
Mockery. I love books and games like that."
Interest 24 "I have never taken part of anything of this sort, but I would be very interested in doing all of
these things listed."
Comment 22 "I've never played them so I don't really have any comments about them."
Like 16 "I feel like they are a great way to escape normal life and honestly it can be a great way to
bond, they can be really fun and you can either kinda goof off and play or play seriously."
17. Methodology
This online survey had 1,000 respondents. It was fielded from April 22 to April 23, 2019.
The results presented in this report were weighted by the following variables:
• What is your gender?
• Which of the following groups describes your current age?
• Are you of Hispanic, Spanish or Latino descent?
• Which of the following best describes your ethnicity?
• What is the highest degree or level of school you have completed?
18. Crosstab Methodology
Crosstab Table Notes:
• Only crosstab tables with significant differences of at least 10 percentage points are
included here.
• If the difference is higher at a statistically significant level, the cell is marked with
the up - arrow symbol ⇑. If it is lower, the down-arrow symbol ⇓ is used.
• Columns with fewer than 30 responses (i.e. degrees of freedom) are ignored for
statistical significance comparisons.
• Crosstabs with no significant difference greater than 10 percentage points are not
presented.
• To fit onto a single slide, some crosstabs have had columns without differences
omitted. See the spreadsheet for the full crosstabs.
• Crosstabs show only unweighted results.
• See the accompanying spreadsheet for all tables.
19. Researchscape International
Researchscape International is a market-research consultancy
specializing in custom surveys. For questions about this or other
research, please contact us at +1-888-983-1675 x1 or visit our
website, http://www.researchscape.com/.