Download to read offline
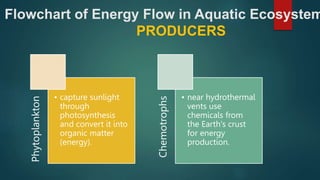
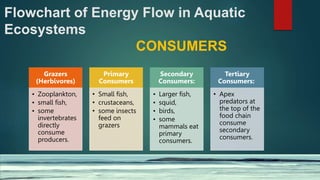
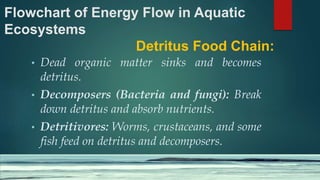
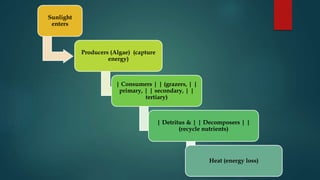

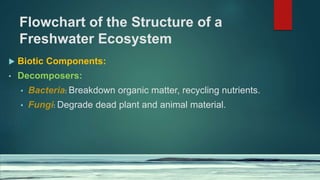
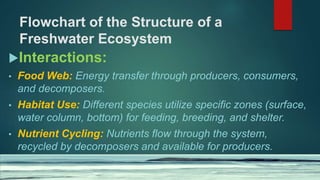
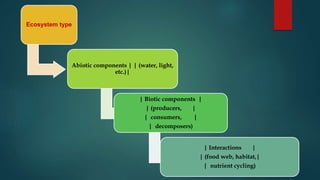
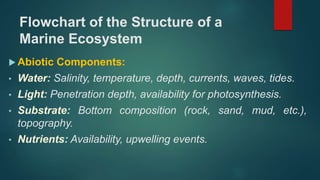
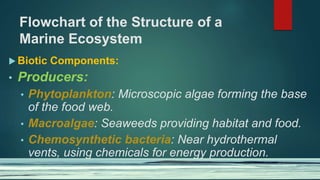
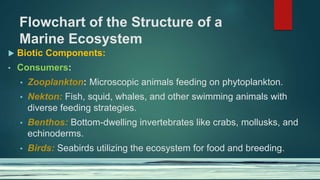
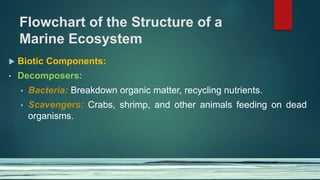
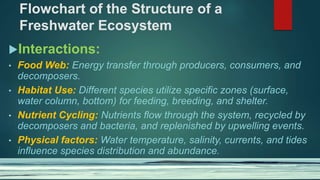


The document describes the structure and energy flow of aquatic ecosystems. It outlines the key abiotic components, biotic components including producers, consumers and decomposers, and interactions such as food webs, habitat use, and nutrient cycling. Specifically, it provides flowcharts and explanations of the components and flow of energy in both freshwater and marine ecosystems.


![Ecosystem and it's characters [Recovered] 12.pptx](https://cdn.slidesharecdn.com/ss_thumbnails/ecosystemrecovered12-241213040441-dc7a3f7a-thumbnail.jpg?width=640&height=640&fit=bounds)


