Download to read offline


![International Research Journal of Engineering and Technology (IRJET) e-ISSN: 2395-0056
Volume: 05 Issue: 11 | Nov 2018 www.irjet.net p-ISSN: 2395-0072
© 2018, IRJET | Impact Factor value: 7.211 | ISO 9001:2008 Certified Journal | Page 992
through the specimen to reach the output bar most of the
incident energy is reflected back into the input bar. EAR
decreases as the incident wave energy Wi increasing in a
negative power relation approach. In the initial phase EAR
decreases in a fast rate, then becomes constant after
reaching a certain point. Anotherscatterdiagramisdrawnin
a similar way with striker velocity on x-axis and EAR on the
y-axis as shown in chat 13 b). EAR decreases as the striker
velocity v increases.
a)
b)
Chart-13: Curve of EAR vs Wi
3.8 Shrinkage Deformation in CLC
A I Kudyakov and A B Steshenko (2015). The primary cause
of shrinkage deformation of foam concrete of natural
hardening are cracks occurring in concrete’s interporous
partition walls during the technological processing of raw
materials and hardening of the cement stone. The energy of
any loaded volume is converted into crack and leads to the
destruction of the material.
Raj Vardhan Singh Chandel, Rashmi Sakale (2016 ) Due to
the intensive percolation of wall pores it causes the pores to
combine to form larger pores which increases the shrinkage
and causes the deterioration of its operational properties. A
significant decrease in the values of shrinkage strain of the
foam concrete during the natural hardening can predict a
reduced level of stresses formation in the structure of foam
concrete. Shrinkage deformation of CLCoccursduetocracks
occurring in concrete’s interporous partition walls.
4. CONCLUSIONS
The shape of the backbone curve depended significantly on
effective normal stress. The maximum shear modulus
increased with a decrease in unit weight of the CLC material
and an increase in the effective normal stress. Reduction in
the shear modulus with the shear strain also depends on the
effective normal stress. The damping ratio which decreases
with increasing shear strain for shear strains less than
0.25% to 0.35%. On the other hand, for shear strainsgreater
than 0.25% to 0.35%, the damping ratio increases with an
increase in the shear strain.
The reflected wave energy Wr as from SHPB test is in same
order of magnitude with incident wave energy WI and their
values are almost the same. Energy absorption rate EAR of
CLC decreases with incident wave energy Wi. There is also a
similar relation between Energy absorption rate EAR and
striker velocity v. The whole processofuniaxial compression
of foam concrete is divided into three stages, namely the
material’s elastic and plastic stage, the platform stage, and
the material densification stage.
REFERENCES
[1] Binod Tiwari, Beena Ajmera, Diego Villegas (2018):
Dynamic properties of lightweight cellular concrete for
geotechnical applications. ASCE journal of materials in
civil engineering Vol 30 (2)
[2] Changchun Shi, Xinghai Song, Chengjie Wang (2017):
study on Quasi static and Dynamic mechanical
properties of chemical foaming concrete. Chemical
engineering transactions Vol 6.
[3] Er-Lei bai, Jin-Yu Xu, Song Lu, Ke-Xin Lin and Yi-Ming
Zhang (2018); Comparative study on the dynamic
properties of lightweight porous concrete. The Royal
Society of Chemistry (26).
[4] Raj Vardhan Singh Chandel, Rashmi Sakale (2016);
study of cellular lightweight concrete. International
Journal for scientific research & development Vol 4,
(07).
[5] Yuan Pu, Ma Qinyong, Zhang Haidong (2014); Energy
Dissipation Analyses on Lightweight Foam Concrete
under Impact Loads. Electronic Journal of Geotechnical
Engineering Vol 19.
[6] A I Kudyakov and A B Steshenko (2015), ʻʻShrinkage
deformation of cement foam concrete’’. Proceedings of
IOP Conf. Series: Materials Science and Engineering 71
in Tomsk, Russia.](https://image.slidesharecdn.com/irjet-v5i11189-181205061101/75/IRJET-Dynamic-Properties-of-Cellular-Lightweight-Concrete-5-2048.jpg)

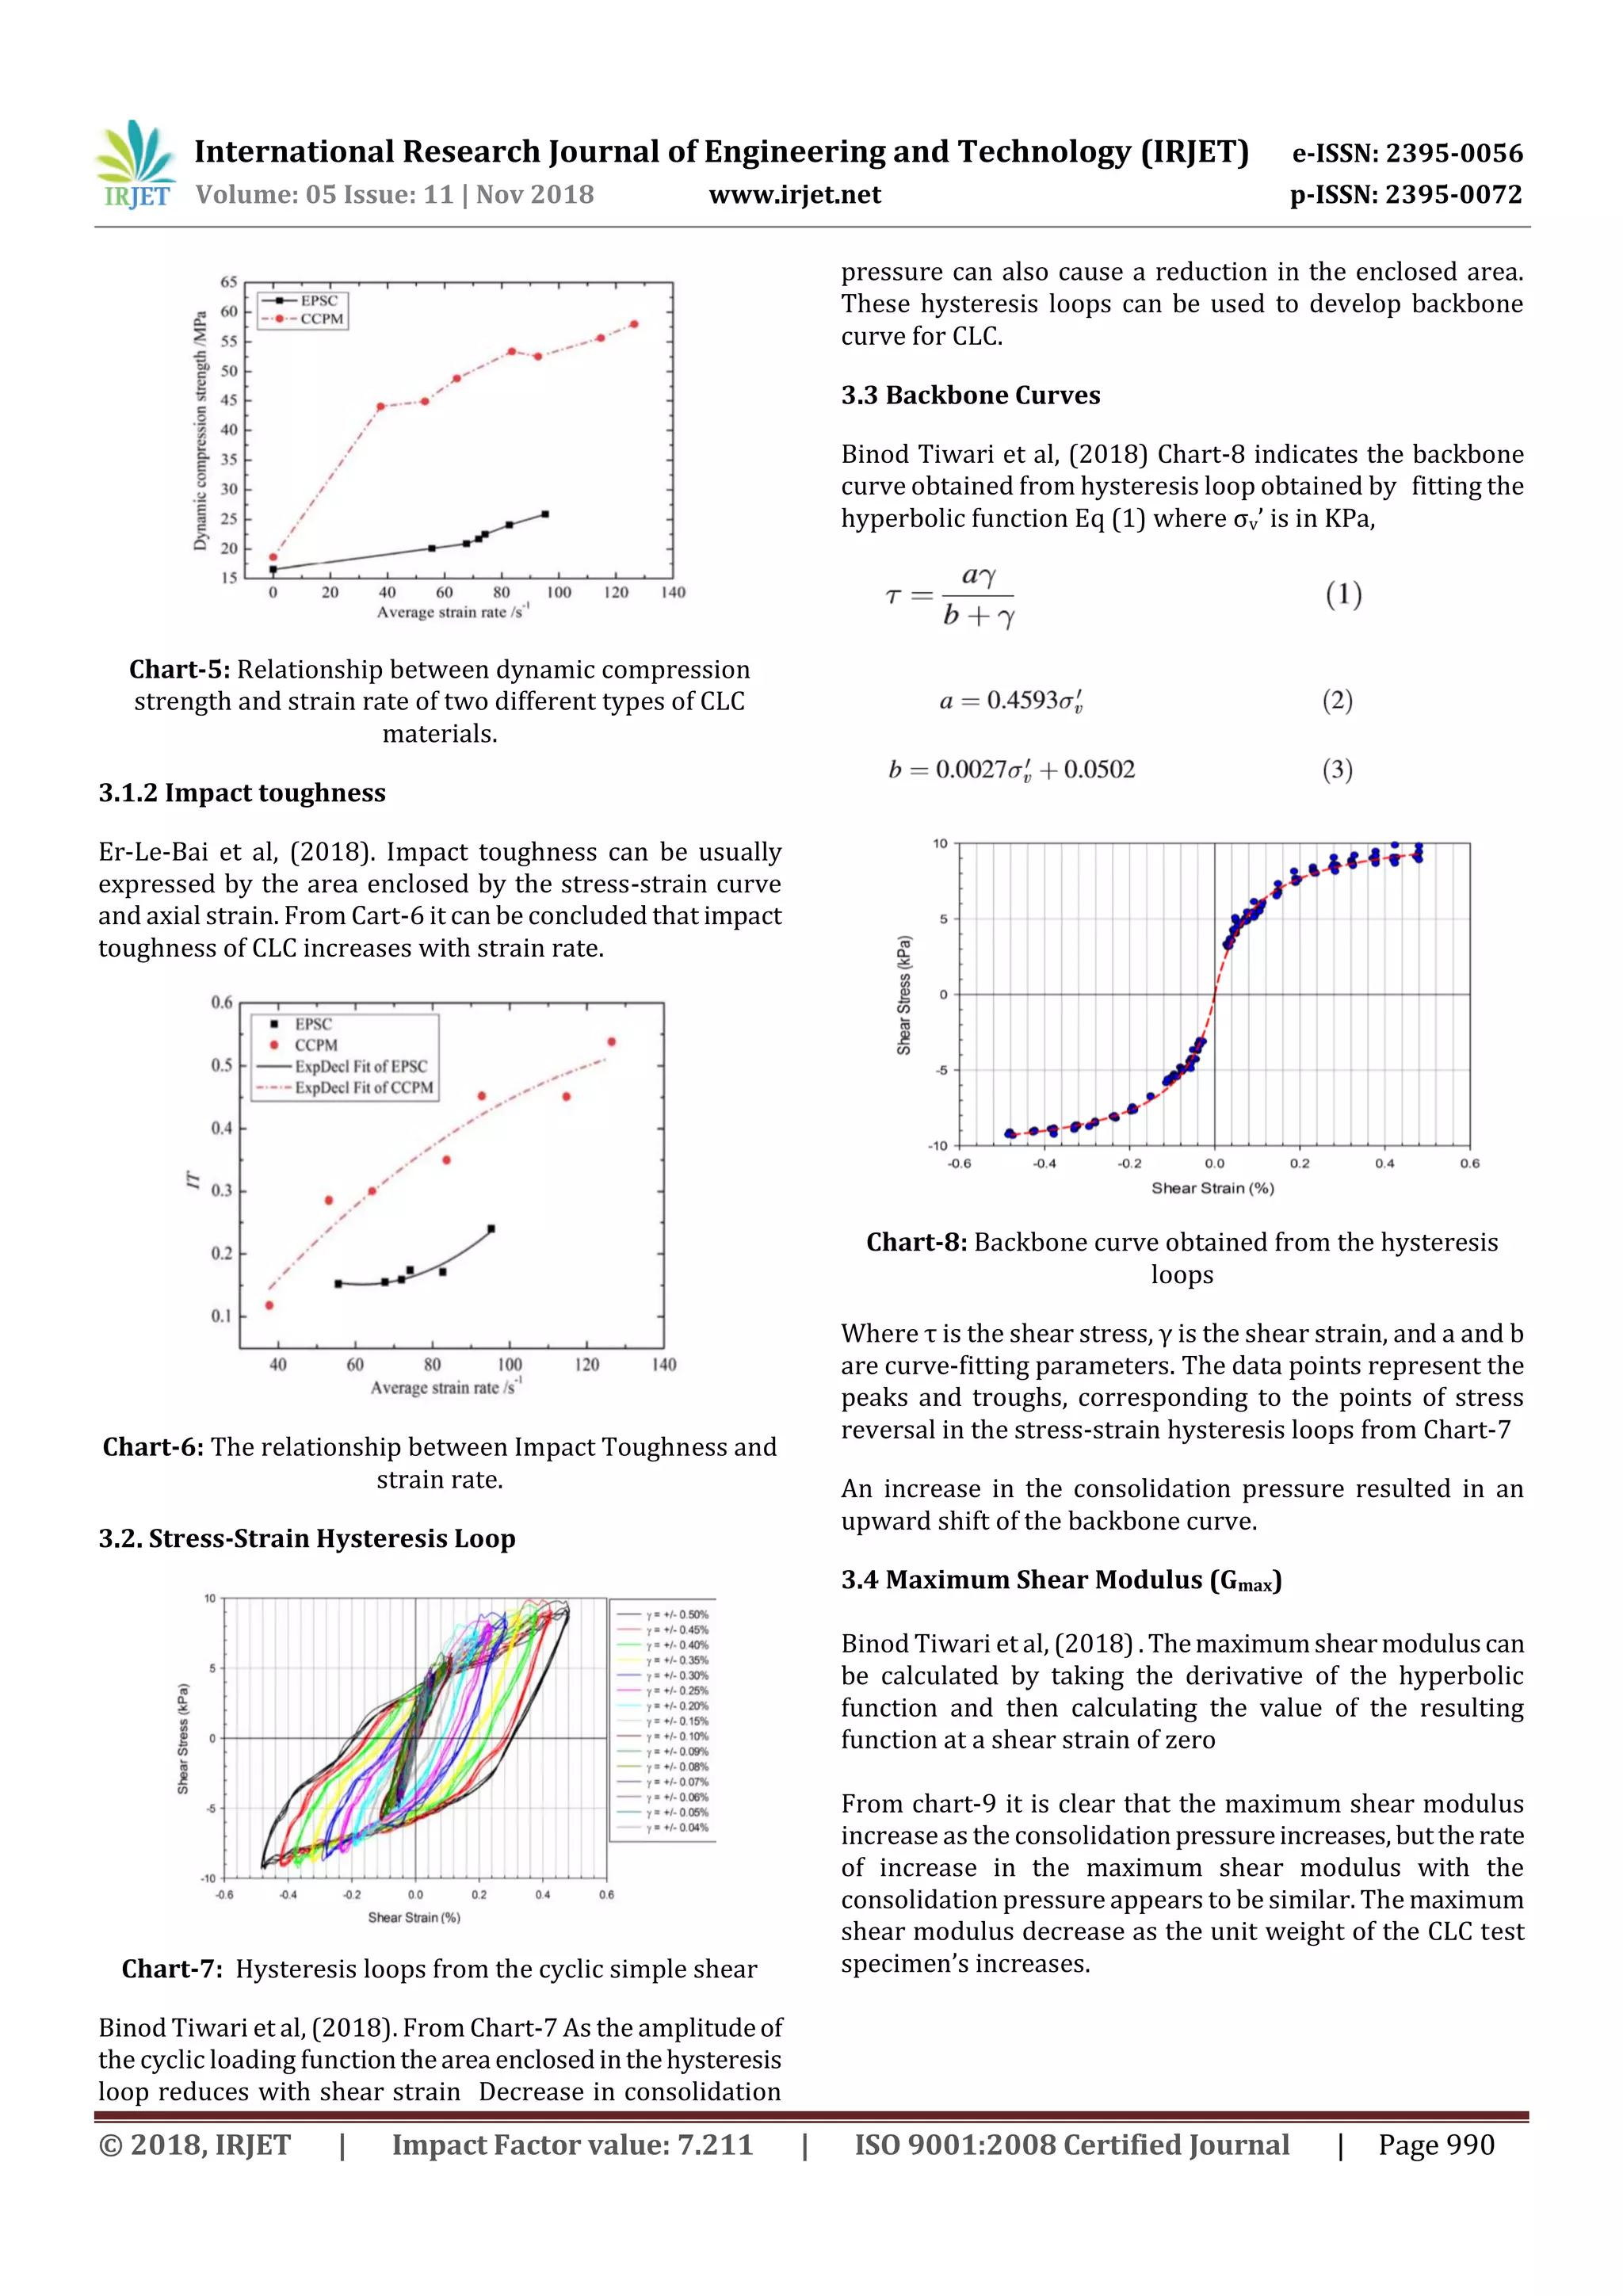
The document discusses the dynamic properties of cellular lightweight concrete (CLC), as studied through various tests. It summarizes the results from split Hopkinson pressure bar (SHPB) tests, cyclic simple shear tests, and impact tests. Key findings include: 1) Dynamic compressive strength and impact toughness of CLC increases with strain rate. Stress-strain curves from SHPB tests show three stages: elastic, plateau, and densification. 2) Cyclic shear tests show stress-strain hysteresis loops decrease in area with increasing shear strain. Backbone curves were obtained by fitting a hyperbolic function to the loops. 3) Maximum shear modulus increases with consolidation pressure but decreases with CLC unit weight.


