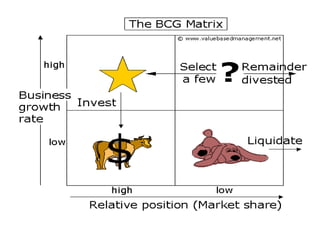
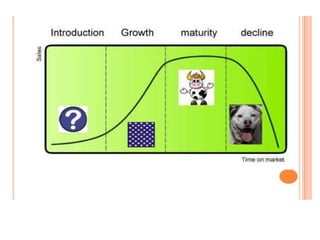
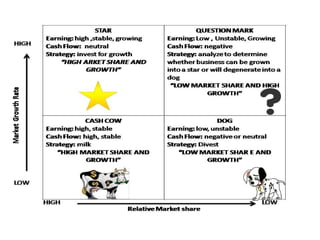
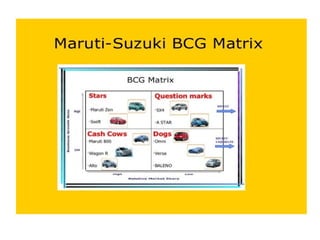
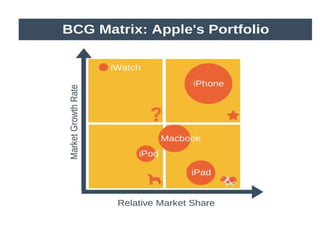
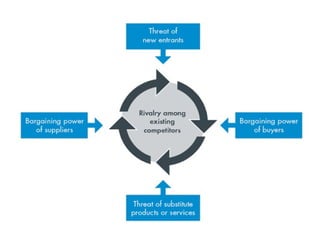
BCG Matrix
• The growth–share matrix is a chart that was
created by Bruce D. Henderson for the
Boston Consulting Group in 1970 to help
corporations to analyze their business units,
that is, their product lines. This helps the
company allocate resources and is used as an
analytical tool in brand marketing,
product management, strategic management,
and portfolio analysis.
• The Boston Consulting Group (BGC) growth
share matrix is a planning tool that uses
graphical representations of a company's
products and services in an effort to help the
company decide what it should keep, sell or
invest more in. ... It was developed by BCG in
1970
Purpose
According to this techniques products or
business are classified as low or high performers
depending upon the Relative market share and
Market growth
Market Share
Market share is the percentage of the total
Market that is served by your company either in
terms of revenue ,units or volume.
RMS= Business Unit Sales this year
Leading rival sales this year
The higher your market share the higher
proportion of the market you control.
Market Growth
It is used as a measure of a market
attractiveness
MGR= Individual Sales this year- Individual sales
last year
Cash cows(low growth, high market share)
• They are foundation of the company and often
the stars of yesterday
• They generate more cash than required
• They are existing in an industry where the
product is reached maturity and not growing
or declining
Dogs(low growth, low market share)
• They are the cash traps
• Dogs do not have potential to bring good for
the company
• High costs and low quality
• Product/business is in declining stage
Question marks(High growth, low market
share)
• They will absorb great amount of cash if the
market share remains unchanged(low)
• They have great potential to become stars and
evenly cash cows but can also become dogs
• There should be proper and high investments
Stars(high market growth, high market share)
• They are leaders in business
• They also require heavy investments to
maintain its large market share
• It leads to high amount of cash consumption
and cash generation
• Attempts should be made to hold the market
share otherwise the star will become cash cow
Why BCG
To assess
• Profile of product/business
• Cash demands of product
• To under the development cycle of products
• To know the resource allocation and
investment decision
Benefits
• It is simple and easy to understand
• It helps to quickly and simple screen the
opportunities open to you and help you to
think about how you can make the most of
them
• It is used to identify how corporate cash
resources can best be used to maximize
company future growth and profitability
Limitations
• BCG matrix uses only two dimensions –
market share and market growth rate
• Problem of getting data on market share and
market growth is difficult
• High market share does not mean profit all the
time
• Business with market share can be profitable
in long run
GE Nine Cell
It is a corporate portfolio analysis technique
based on the pioneering efforts of the General
Electric(GE) of the US supported by the
consulting firm of Mckinsey & Co.
Factors under Market Attractiveness and
Competitive Strength
Factors Effecting Market/Industry Attractiveness
• Market Size
• Market Growth
• Market Profitability
• Pricing Trends
• Competitive Intensity/rivalry
• Overall risk of retune in the industry
• Opportunity to differentiate products
and services
• Entry barriers
• Segmentation
• Distribution Structure(Eg: retail
direct , whole sale)
• Technology development
Competitive/Business Strength
• Strength of assets and competenties
• Relative brand strength
• Market Share
• Customers loyality
• Relative Cost position
• Distribution strength
• Record of technology and other
innovation
• Quality
• Access to financial and other
investment resources
• Manufacturing strength
Hofer’s Product/ Market Evolution Matrix
• It is 15 cell matrix . The stages of
development of the product or market and
the competitive position of different
businesses in a companies corporate portfolio
is considered
Directional Policy Matrix
It was developed by Shell Chemicals- UK
Immediate Market
Withdrawal
Strategy(Divestme
nt)
Phased- Market
Withdrawal
Strategy
Upgrade
Strategy(Cash
generation)
Withdrawal
Strategy(Merger)
Sustain Current
Strategy(Stability
Strategy)
Capability
Enhancement
Strategy(Expansion)
Resource
Withdrawal
Strategy(Cash
generation)
Market Expansion
Strategy(Growth or
Expansion)
Leadership
Retention
Strategy(Innovation
)
C
o
m
p
a
ni
e
s
C
o
m
p
e
ti
ti
v
e
Business Sector Prospects
Unattractive Attractive
Average
Weak
Average
Strong
Product Life Cycle
A new product progresses through a sequence
of stages from introduction to growth,
maturity, and decline. This sequence is known
as the product life cycle and is associated with
changes in the marketing situation, thus
impacting the marketing strategy and the
marketing mix.
• Introduction – when the product is introduced and
struggles to gain brand recognition
• Growth – advertising and word of mouth helps the
product to increase sales. As sales growth, more
firms are willing to stock the product which helps the
product to grow even further.
• Maturity – When the product reaches peak market
penetration.
• Decline – the product gets eclipsed by new products
Example of the Product Life Cycle 2018
• Introduction – Self-driving cars. Self-driving cars are still at the testing
stage, but firms hope to be able to sell to early adopters relatively soon.
• Growth – Electric cars. For example the Tesla Model S is in its growth
phase. Electric cars still need to convince people that it will work and be
practical. As there are more electric charging points and more people
adopt, it becomes easier to sell to those who are more sceptical of new
technology like electric cars.
• Maturity – Ford Focus. The Ford Focus is a well-established car. It has a
good brand reputation and has reached its peak level of market
penetration. It would be difficult to gain a significantly greater market
share. The product life cycle of the Ford Focus has been extended by
constant upgrades and redesigns to keep the car on top of the market.
• Decline – Diesel cars. Since governments have expressed concern at the
level of pollution from diesel cars. Some cities have threatened to ban
diesel cars within a few years. Sales have fallen considerably and the
market for diesel cars may be in terminal decline.
Experience Curve
The concept behind the Experience Curve is that
the more experience a business has in
producing a particular product, the lower its
costs. ... The “experience effect” of lower unit
costs is likely to be particularly strong for
large, successful businesses (market leaders)
Porters Five Force Model
• What is it?Framework/theory
• Porter's Five Forces of Competitive Position Analysis were developed in
1979 by Michael E Porter of Harvard Business School as a simple
framework for assessing and evaluating the competitive strength and
position of a business organisation.
• This theory is based on the concept that there are five forces that
determine the competitive intensity and attractiveness of a market.
Porter’s five forces help to identify where power lies in a business
situation. This is useful both in understanding the strength of an
organisation’s current competitive position, and the strength of a
position that an organisation may look to move into.
• Strategic analysts often use Porter’s five forces to understand whether
new products or services are potentially profitable. By understanding
where power lies, the theory can also be used to identify areas of
strength, to improve weaknesses and to avoid mistakes.
The five forces are:
1. Supplier power. An assessment of how easy it is for suppliers to drive up prices. This is
driven by the: number of suppliers of each essential input; uniqueness of their
product or service; relative size and strength of the supplier; and cost of switching
from one supplier to another.
2. Buyer power. An assessment of how easy it is for buyers to drive prices down. This is
driven by the: number of buyers in the market; importance of each individual buyer
to the organisation; and cost to the buyer of switching from one supplier to another.
If a business has just a few powerful buyers, they are often able to dictate terms.
3. Competitive rivalry. The main driver is the number and capability of competitors in
the market. Many competitors, offering undifferentiated products and services, will
reduce market attractiveness.
4. Threat of substitution. Where close substitute products exist in a market, it increases
the likelihood of customers switching to alternatives in response to price increases.
This reduces both the power of suppliers and the attractiveness of the market.
5. Threat of new entry. Profitable markets attract new entrants, which erodes
profitability. Unless incumbents have strong and durable barriers to entry, for
example, patents, economies of scale, capital requirements or government policies,
then profitability will decline to a competitive rate.
What benefits does Porter’s Five Forces analysis provide?
Five forces analysis helps organisations to understand the factors affecting
profitability in a specific industry, and can help to inform decisions
relating to: whether to enter a specific industry; whether to increase
capacity in a specific industry; and developing competitive strategies.
Actions to take / Do’sActions
• Use this model where there are at least three competitors in the
market
• Consider the impact that government has or may have on the industry
• Consider the industry lifecycle stage – earlier stages will be more
turbulent
• Consider the dynamic/changing characteristics of the industry
To Avoid / Don'ts
• Avoid using the model for an individual firm; it is designed for use on
an industry b

BCGIt's lesson from quality control.pptx

  • 1.
  • 2.
    • The growth–sharematrix is a chart that was created by Bruce D. Henderson for the Boston Consulting Group in 1970 to help corporations to analyze their business units, that is, their product lines. This helps the company allocate resources and is used as an analytical tool in brand marketing, product management, strategic management, and portfolio analysis.
  • 3.
    • The BostonConsulting Group (BGC) growth share matrix is a planning tool that uses graphical representations of a company's products and services in an effort to help the company decide what it should keep, sell or invest more in. ... It was developed by BCG in 1970
  • 4.
    Purpose According to thistechniques products or business are classified as low or high performers depending upon the Relative market share and Market growth
  • 5.
    Market Share Market shareis the percentage of the total Market that is served by your company either in terms of revenue ,units or volume. RMS= Business Unit Sales this year Leading rival sales this year The higher your market share the higher proportion of the market you control.
  • 6.
    Market Growth It isused as a measure of a market attractiveness MGR= Individual Sales this year- Individual sales last year
  • 10.
    Cash cows(low growth,high market share) • They are foundation of the company and often the stars of yesterday • They generate more cash than required • They are existing in an industry where the product is reached maturity and not growing or declining
  • 11.
    Dogs(low growth, lowmarket share) • They are the cash traps • Dogs do not have potential to bring good for the company • High costs and low quality • Product/business is in declining stage
  • 12.
    Question marks(High growth,low market share) • They will absorb great amount of cash if the market share remains unchanged(low) • They have great potential to become stars and evenly cash cows but can also become dogs • There should be proper and high investments
  • 13.
    Stars(high market growth,high market share) • They are leaders in business • They also require heavy investments to maintain its large market share • It leads to high amount of cash consumption and cash generation • Attempts should be made to hold the market share otherwise the star will become cash cow
  • 14.
    Why BCG To assess •Profile of product/business • Cash demands of product • To under the development cycle of products • To know the resource allocation and investment decision
  • 15.
    Benefits • It issimple and easy to understand • It helps to quickly and simple screen the opportunities open to you and help you to think about how you can make the most of them • It is used to identify how corporate cash resources can best be used to maximize company future growth and profitability
  • 16.
    Limitations • BCG matrixuses only two dimensions – market share and market growth rate • Problem of getting data on market share and market growth is difficult • High market share does not mean profit all the time • Business with market share can be profitable in long run
  • 19.
    GE Nine Cell Itis a corporate portfolio analysis technique based on the pioneering efforts of the General Electric(GE) of the US supported by the consulting firm of Mckinsey & Co.
  • 20.
    Factors under MarketAttractiveness and Competitive Strength Factors Effecting Market/Industry Attractiveness • Market Size • Market Growth • Market Profitability • Pricing Trends • Competitive Intensity/rivalry • Overall risk of retune in the industry • Opportunity to differentiate products and services • Entry barriers • Segmentation • Distribution Structure(Eg: retail direct , whole sale) • Technology development Competitive/Business Strength • Strength of assets and competenties • Relative brand strength • Market Share • Customers loyality • Relative Cost position • Distribution strength • Record of technology and other innovation • Quality • Access to financial and other investment resources • Manufacturing strength
  • 22.
    Hofer’s Product/ MarketEvolution Matrix • It is 15 cell matrix . The stages of development of the product or market and the competitive position of different businesses in a companies corporate portfolio is considered
  • 24.
    Directional Policy Matrix Itwas developed by Shell Chemicals- UK Immediate Market Withdrawal Strategy(Divestme nt) Phased- Market Withdrawal Strategy Upgrade Strategy(Cash generation) Withdrawal Strategy(Merger) Sustain Current Strategy(Stability Strategy) Capability Enhancement Strategy(Expansion) Resource Withdrawal Strategy(Cash generation) Market Expansion Strategy(Growth or Expansion) Leadership Retention Strategy(Innovation ) C o m p a ni e s C o m p e ti ti v e Business Sector Prospects Unattractive Attractive Average Weak Average Strong
  • 25.
    Product Life Cycle Anew product progresses through a sequence of stages from introduction to growth, maturity, and decline. This sequence is known as the product life cycle and is associated with changes in the marketing situation, thus impacting the marketing strategy and the marketing mix.
  • 27.
    • Introduction –when the product is introduced and struggles to gain brand recognition • Growth – advertising and word of mouth helps the product to increase sales. As sales growth, more firms are willing to stock the product which helps the product to grow even further. • Maturity – When the product reaches peak market penetration. • Decline – the product gets eclipsed by new products
  • 28.
    Example of theProduct Life Cycle 2018 • Introduction – Self-driving cars. Self-driving cars are still at the testing stage, but firms hope to be able to sell to early adopters relatively soon. • Growth – Electric cars. For example the Tesla Model S is in its growth phase. Electric cars still need to convince people that it will work and be practical. As there are more electric charging points and more people adopt, it becomes easier to sell to those who are more sceptical of new technology like electric cars. • Maturity – Ford Focus. The Ford Focus is a well-established car. It has a good brand reputation and has reached its peak level of market penetration. It would be difficult to gain a significantly greater market share. The product life cycle of the Ford Focus has been extended by constant upgrades and redesigns to keep the car on top of the market. • Decline – Diesel cars. Since governments have expressed concern at the level of pollution from diesel cars. Some cities have threatened to ban diesel cars within a few years. Sales have fallen considerably and the market for diesel cars may be in terminal decline.
  • 29.
    Experience Curve The conceptbehind the Experience Curve is that the more experience a business has in producing a particular product, the lower its costs. ... The “experience effect” of lower unit costs is likely to be particularly strong for large, successful businesses (market leaders)
  • 31.
    Porters Five ForceModel • What is it?Framework/theory • Porter's Five Forces of Competitive Position Analysis were developed in 1979 by Michael E Porter of Harvard Business School as a simple framework for assessing and evaluating the competitive strength and position of a business organisation. • This theory is based on the concept that there are five forces that determine the competitive intensity and attractiveness of a market. Porter’s five forces help to identify where power lies in a business situation. This is useful both in understanding the strength of an organisation’s current competitive position, and the strength of a position that an organisation may look to move into. • Strategic analysts often use Porter’s five forces to understand whether new products or services are potentially profitable. By understanding where power lies, the theory can also be used to identify areas of strength, to improve weaknesses and to avoid mistakes.
  • 33.
    The five forcesare: 1. Supplier power. An assessment of how easy it is for suppliers to drive up prices. This is driven by the: number of suppliers of each essential input; uniqueness of their product or service; relative size and strength of the supplier; and cost of switching from one supplier to another. 2. Buyer power. An assessment of how easy it is for buyers to drive prices down. This is driven by the: number of buyers in the market; importance of each individual buyer to the organisation; and cost to the buyer of switching from one supplier to another. If a business has just a few powerful buyers, they are often able to dictate terms. 3. Competitive rivalry. The main driver is the number and capability of competitors in the market. Many competitors, offering undifferentiated products and services, will reduce market attractiveness. 4. Threat of substitution. Where close substitute products exist in a market, it increases the likelihood of customers switching to alternatives in response to price increases. This reduces both the power of suppliers and the attractiveness of the market. 5. Threat of new entry. Profitable markets attract new entrants, which erodes profitability. Unless incumbents have strong and durable barriers to entry, for example, patents, economies of scale, capital requirements or government policies, then profitability will decline to a competitive rate.
  • 34.
    What benefits doesPorter’s Five Forces analysis provide? Five forces analysis helps organisations to understand the factors affecting profitability in a specific industry, and can help to inform decisions relating to: whether to enter a specific industry; whether to increase capacity in a specific industry; and developing competitive strategies. Actions to take / Do’sActions • Use this model where there are at least three competitors in the market • Consider the impact that government has or may have on the industry • Consider the industry lifecycle stage – earlier stages will be more turbulent • Consider the dynamic/changing characteristics of the industry To Avoid / Don'ts • Avoid using the model for an individual firm; it is designed for use on an industry b