Download to read offline


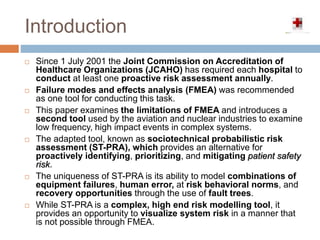
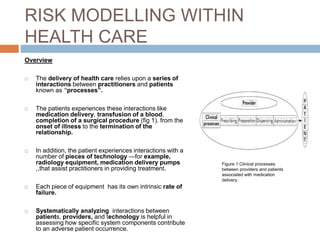
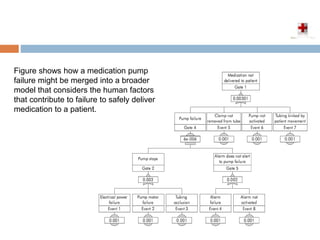
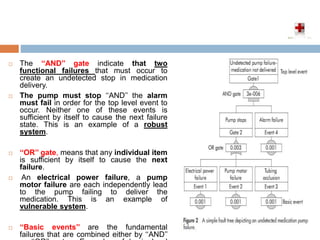
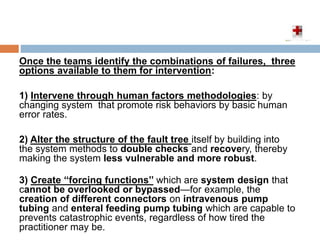
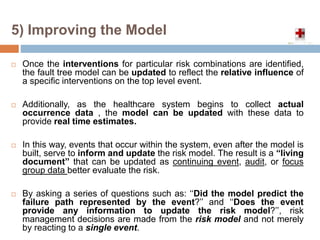
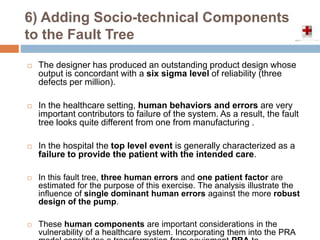

This document introduces sociotechnical probabilistic risk assessment (ST-PRA) as an alternative tool to failure mode and effects analysis (FMEA) for proactively assessing patient safety risks in healthcare. ST-PRA models combinations of equipment failures, human errors, behaviors, and recovery opportunities using fault trees. It was adapted from risk assessment tools used in aviation and nuclear power industries. The document outlines the 6-step ST-PRA process: 1) identifying the outcome of interest, 2) assembling fault trees, 3) developing the model, 4) adding probability estimates, 5) improving the model, and 6) adding sociotechnical components to consider human factors.


