The document describes how a new intelligence solution called the Readmission Prevention Solution was developed and implemented at Advocate Health Care using DMAIC (Define, Measure, Analyze, Improve, Control) principles. It details how the previous manual process for assessing readmission risk was time-consuming and inefficient. A new algorithm called the All-Cause Readmission Risk Algorithm was developed to automatically predict individual patient readmission risk based on data from their electronic health records. The new solution improved the workflow for care managers and provided additional features to help proactively mitigate readmission risk.

![Vol. 6, No. 12 December 2015 ISSN 2079-8407
Journal of Emerging Trends in Computing and Information Sciences
©2009-2015 CIS Journal. All rights reserved.
http://www.cisjournal.org
728
user training, the sites are supported by IT for the week of
go-live. After the first week of go-live, users are supported
by the IT Help Desk.
2.4 “Just in Time Training”
A team from ACC implemented two training
methods for the Version 1 pilot. One site requested “Train
the Trainer” while the second site was trained by ACC
Clinical Process Designers (CPD). The CPDs were heavily
involved in design and testing of the solution, so the
argument was training the end users would be not be a
difficult task. At both sites, support was provided by CPDs
and Cerner representatives during and after the period of
go-live.
A rolling “just in time training” methodology was
implemented at the non-pilot sites then implementation of
the solution. CMs were able to keep their training fresh in
their mind, which helped when they first used the new
solution. User guides, and other reference materials were
also available for use by the CMs.
2.5 Intelligence Training
The ACC team trained the CMs not only on the
features of the worklist, but also the new intelligence built
in to the solution. CPDs taught the importance of the new
intelligence, and to trust an algorithm that was still a
mystery to many CMs. There were numerous questions
about the new readmission risk score, and why it should be
trusted over how they were currently doing their job. CMs
eventually understood the features of the solution, and how
it improved their workflow.
2.6 User Feedback to Drive Change
Feedback was instantaneous because CPDs were
directly accessible by end-users.Furthermore, CPDs held
one-on-one sessions with CMs to help CMs understand the
new workflow, if the new workflow enhanced what they
did, and encourage direct feedback about the solution.
During these sessions, CPDs found that while waste was
removed by eliminating the manual risk score, there were
limitations of the solution.
One of the important concerns of the CMs was
speed to work through the solution. Since the worklist was
icon driven, there were computations that had to run in the
background for the page to load. At times users
experienced wait times of up to thirty seconds per page
load. This was far in excess of the time limited suggested
by a New York Times article [4] which contends that users
will abandon a website if it does not load within three
seconds.
Users stated that the icons were at times visually
overwhelming. Although they provided a visual cue, the
icons took over the entire page. Users complained that the
icons strained their eyes, and it was difficult at times to
differentiate the icons between individuals. The delays and
overall look of the worklist made using the solutionvery
frustrating, and some CMs stopped using the solution all
together. The processing of data in the background also
caused near monthly downtimes ranging from a day up to
one week. Feedback was given directly to Cerner, and the
Readmission team worked together to solve the issues of
Version 1 of the worklist.
In order to increase create a competitive
environment among users, rewards were given to CMs
who ordered all education and completed all chronic
illness perception forms. Creation of a competitive
environment among CMs spurred them to be ranked as the
top user at their site. A 75% compliance rate is the goal of
the solution.
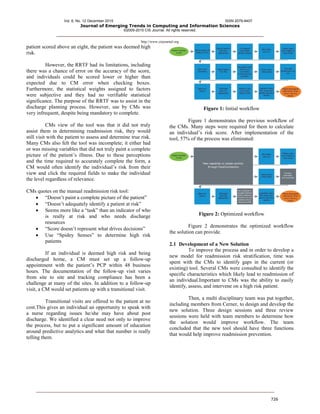
Figure 5: Workflow comparison
2.7 Readmission Risk Solution Version 2
Because of feedback from users on what could
improve the solution, Cerner released Version 2 of the
worklist to AHC in October 2014. The redesigned worklist
removed background operations, which resulted in faster
load times. This also changed the perception of the CMs
about the process. For instance, during training many of
the CMs stated that the new version was a substantial
improvement over Version 1.
Version 2 contained a number of important
improvements over the previous version. For example, the
overall look of the worklist changed, with icons being
replaced by cards, and the worklist was more streamlined.
Tabs within the list held items such as consults,
documentation, and follow-up visit information. Load
times of the new version ranged from 3-5 seconds; a great
difference from the 30 second load times from the previous
version.
Because go-live of Version 2 contained numerous
enhancements, , a rolling go-live as done in with Version 1
was not possible. However, to help CMs understand and
work with the new solution, CPDs split time at all 8 sites,
with one covering the north, and the other covering the](https://image.slidesharecdn.com/9879a013-e636-43a3-9bbc-209a75c0bca9-160219172914/85/vol6no12_11_Rishi-4-320.jpg)
![Vol. 6, No. 12 December 2015 ISSN 2079-8407
Journal of Emerging Trends in Computing and Information Sciences
©2009-2015 CIS Journal. All rights reserved.
http://www.cisjournal.org
729
south. More time was spent at the larger sites; however one
on one time with CMs at all sites was provided.
Results of the new worklist showed greater
compliance of ordering readmission prevention education
and completion of the chronic illness perception form.
Feedback from CMs included such comments as:
“This is nice”
“Much, much faster”
“Oooooo I like it”
“Easier to use”
3. CONCLUSION
The implementation of a new solution to
eliminate waste and improve workflow suggests that a
partnership between a provider and vendor is vital in
driving change. By having CPDs on site, CPDs were able
to analyze the use of the tool, send requests to Cerner
directly, have the modifications made, and re-analyze the
solution faster than a traditional arrangement.
The use of train the trainer vs hands on training
was a good tactic for training CMs, however it would have
been useful to have more super users on site that could
answer questions instead of relying on CPDs. However,
having CPDs on site did allow for faster communication to
the development team for bug fixes and improvements.
3.1 Value to the End User
- Decreased “double documentation”
- Provided more effective time-management
- Focused on moderate/high risk patients
- Provided a visual aid for all disciplines
- Summary screen
- Promoted communication between disciplines
- Promoted continuity of care
Analysis is ongoing to measure success of the
tool. Improvements have been seen in the use of the
solution as time progresses.
REFERENCES
[1] Robert Wood Johnson Foundation, “The Revolving
Door: A Report on US Hospital Readmissions.
February 2013.
[2] R. Holden, B. Karsh, “The Technology Acceptance
Model: Its Past and its future in health care”,
Journal of Biomedical Informatics 43, 2010.
[3] R. Wears, M. Berg, “Computer Technology and
Clinical Work: Still Waiting for Godot”, Editorial,
JAMA, Vol 293, No 10, March 2005.
[4] S. Lohr, "For Impatient Web Users, an Eye Blink Is
Just Too Long to Wait." The New York Times.
February 29, 2012.
[5] R. Bush, I. Philibert, "Making Sense: Duty Hours,
Work Flow, and Waste in Graduate Medical
Education." Journal of Graduate Medical Education,
December, 2009.
[6] C. Kim, D. Spahlinger, J. Kin, J. Billi,"Lean Health
Care: What Can Hospitals Learn from a World-
Class Automaker?" Society of Hospital Medicine.
2006.
[7] K. O’Leary, D. Liebovitz, D. Baker, “How
Hospitalists Spend Their Time: Insights on
Efficiency and Safety.” Society of Hospital
Medicine. 2006.
[8] J. Donze, D. Aujesky, D. Williams, J. Schnipper,
“Potentially Avoidable 30-Day Hospital
Readmissions in Medical Patients.” JAMA Internal
Med. March 25, 2013.
[9] C. Ham, R. Kipping, H. McLeod, “Redesigning
Work Processes in Health Care: Lessons from the
National Health Service.” The Milbank Quarterly.
Vol. 81, No. 3, 2003.
[10] M. Godfrey, B. Andersson - Gare, E. Nelson, M.
Nilsson, G. Ahlstrom, “Coaching Inter professional
Health Care Improvement Teams: The Coachee,
The Coach, and the Leader Perspectives.” Journal of
Nursing Management. January 18, 2013.
AUTHOR PROFILES
Samir N Rishi received the degree in health care
administration from Saint Louis University, in 2005.
Currently, he is a Clinical Process Designer with Advocate
Health Care.
Kennith G Hunter received a doctorate in public
administration fromthe University of Oklahoma, in 1993.
Currently, he is a Clinical Intelligence Consultant with
Advocate Health Care.](https://image.slidesharecdn.com/9879a013-e636-43a3-9bbc-209a75c0bca9-160219172914/85/vol6no12_11_Rishi-5-320.jpg)


